Article

Investigating Population Genetic Diversity and Rhizosphere Microbiota of Central Apennines’ Artemisia eriantha

1
Dipartimento di Scienze Agrarie, Alimentari ed Ambientali, Università degli Studi di Perugia, 06123 Perugia, Italy
2
Department of Life, Health and Environmental Sciences, University of L’Aquila, Via Vetoio, Coppito, 67100 L’Aquila, Italy
*
Authors to whom correspondence should be addressed.
Sustainability 2022, 14(18), 11405; https://doi.org/10.3390/su141811405
Submission received: 7 July 2022 / Revised: 7 September 2022 / Accepted: 8 September 2022 / Published: 11 September 2022
(This article belongs to the Special Issue Biodiversity 2021: Agriculture, Environment and Wellbeing)

Abstract

:
The present study aimed to characterize the genetic structure of Artemisia eriantha Ten. and the diversity of the rhizosphere microbiota. Plant leaves and rhizosphere soils were sampled from three areas of Central Italy, namely Monte Corvo, Monte Portella (both from the Gran Sasso massif), and Monte Focalone (Majella massif). The plant samples were subjected to genetic structure analysis by amplified fragment length polymorphism (AFLP) markers. The microbiota from the rhizosphere soils was investigated by 16S rRNA gene metabarcoding. The within and among population variability was typical of outbreeding species. The AFLP polymorphisms revealed a marked closeness among plant populations collected in Monte Focalone and Monte Corvo, despite the geographical proximity of the latter with Monte Portella, a result confirmed by cluster, STRUCTURE, and discriminant analyses. 16S rRNA gene metabarcoding showed higher values of diversity for Monte Corvo (H, 5.7; Chao1, 445) and Monte Focalone (H′, 5.57; Chao1, 446) than Monte Portella (H′, 5.3; Chao1, 275). At the phylum level, the communities were mainly represented by Proteobacteria, Actinobacteria, and Acidobacteria (>10%). At the genus level, the Monte Focalone and Monte Corvo microbiotas were closer than Monte Portella, thus confirming the results from the plant communities. The findings provided evidence for the first time of an association between the Artemisia eriantha plant and microbiota communities. The relevance of the results in terms of biodiversity and the conservation strategies of plant and microbiota communities in the Central Apennines are discussed.

1. Introduction

The genus Artemisia is a member of the Asteraceae (Compositae) family comprising around 500 specific and subspecific taxa. The origin of the genus is still controversial; according to Ling [1] and Wang [2], fossil and palaeogeographical data suggest that Artemisia L. could have originated in the mid-Tertiary from the arid or subarid area of temperate Asia, in the mountain regions of north-western Asia near the Ural Mountains. Graham [3] dated the earliest Artemisia pollen fossil to the late Oligocene in Central Europe, early Miocene in western North America, and the middle Miocene in eastern North America. Finally, according to Miao et al. [4], the Artemisia genus could have originated in the late Eocene in the arid–semiarid middle latitudes of Asia and spread west and eastward in the Oligocene. Moreover, the same authors claim that since the Pliocene the diversification and worldwide expansion of Artemisia maintained a distribution similar to that of the present. At any rate, Central Asia is considered the primary center of speciation and diversification, and the temperate and cold temperate regions of Eurasia and North America are the secondary centers of diversification.
Plant speciation and diversification are closely related to variations in genome size, ploidy level, and chromosome number [5,6,7]. In the genus Artemisia, ploidy played a remarkable role in the process of speciation. It is estimated that about 43% of the species are exclusively diploid, 29.7% are exclusively polyploid, and 26.8% are both diploid and polyploid [8]. In this regard, an example is given by Artemisia eriantha Ten. (A. umbelliformis Ten. ssp. eriantha) (2n = 18) and A. umbelliformis Lam. ssp. umbelliformis (2n = 36 and 2n = 34). In the latter, the chromosome number can range from 2n = 18 to 2n = 36 or from 2n = 16 to 2n = 32, suggesting an allotetraploid origin, with A. eriantha as one of the progenitors [9,10]. This high percentage of polyploidy could be the key to the success of this genus, which can colonize and adapt to different habitats and ecosystems. For these reasons, Artemisia karyotypes have been well studied and, so far, 42 different chromosome numbers have been reported; the genus has two basic chromosome numbers, x = 9 (in 85.6% of the species) and x = 8 (9.7%), with ploidy levels ranging from diploid to dodecaploid in the former group and from diploid to hexaploid in the latter [11,12,13].
Among the numerous species of the genus Artemisia of particular interest, Artemisia eriantha (synonyms: Artemisia genipi Weber ex Stechm. subsp. eriantha (Ten.) P. Fourn.; Artemisia petrosa (Baumg.) Jan; Artemisia petrosa (Baumg.) Jan subsp. eriantha (Ten.) Giacom. and Pignatti; and Artemisia umbelliformis Lam. subsp. eriantha (Ten.) Vallès-Xirau and Oliva Brañas) is one of the most important officinal plants of Italian heritage [14]. This rare species is a Central and European alpine glacial relict found in small, fragmented populations: from the Pyrenees across the south-western Alps and the Apennines to the Carpathians and the Balkan Peninsula [14]. In Italy, A. eriantha is found in the Maritime Alps (Piedmont and Liguria) and the Apennines of Central Italy, with a discontinuous distribution in a few stations on the Gran Sasso and Majella massifs [15]. A. eriantha is an aromatic perennial plant living above 2200 m in limestone ravines facing north. Many specimens of A. eriantha are present in the Gran Sasso and Majella natural stations. As a response to the severe mountain environment, coping with temperatures below 0 °C for a long period of the year, drought, intense UV radiation, wind, and snow covers, the Apennines’ genepì populations have evolved adaptive traits. A dense hair is present on the aerial organs to reduce transpiration and resist the intensity of UV radiation; new buds are protected by dried leaves avoiding frost damage; and the roots are stout taproots with stolons [15].
This species is characterized by a significant amount of thujones, about 60% of total volatiles, and a characteristic abundance of α-thujone isomer [16]. Besides thujones, the distinctive presence of salvene can also be found in Alpine’s genepì [17]. The presence of these metabolites makes this plant interesting for officinal preparations. The bioactive compounds of the Artemisia species have been widely described for their antioxidant properties [18,19]. Additionally, antihypertensive [20], antitumoral [21], anti-inflammatory [22], hepatoprotective [23], hypoglycaemic [24], and hypolipidemic [25] activities have been reported. As a result of indiscriminate picking, in Germany this species is considered “Rare” and in Switzerland and Italy of “Least Concern” [26,27] and harvesting is forbidden. In France, plants are collected but regulated by regional laws. Nevertheless, it is widely (and illegally) harvested in all alpine areas because of its aromatic properties; the aerial parts are used for preparing infusions for the respiratory system and alcoholic preparations used as digestives, thus significantly reducing extent and abundance in natural areas [28,29].
Despite protection measures, if the population density further decreases, there will be a need to include it in a higher threat category. Consequently, mapping and monitoring the natural populations will be fundamental to conserving the species. The conservation of natural habitats and their fauna and flora represents a primary goal of the European Community, which identified A. eriantha as a species of EU interest (directive Habitat 92/43). The knowledge of the existing genetic diversity is a must step in defining an appropriate conservation strategy. The genetic diversity of natural plant populations is influenced by spatial and temporal environmental heterogeneity [30]. Biodiversity conservation techniques are mainly based on spatial factors (i.e., areas, ecosystems, ecological communities, and species). However, the assessment of genetic diversity is the key tool to pursue in conservation actions [31]. Among PCR-based markers for diversity and phylogeny investigations, AFLP explores differences in the whole genome and provides reproducible and simultaneous identification of multilocus polymorphisms [32]. Moreover, the power of AFLP analysis derives from its ability to quickly generate large numbers of marker fragments for any organism without prior knowledge of genomic sequences [32]. These features are particularly useful for the genetic characterization of rare or endangered species whose genomes are unknown and where it is often difficult to collect large samples of individuals [33].
The microbiota of the rhizosphere is one of the key drivers of plant health [34]. The selective pressures of plants on the rhizosphere microbiota have been demonstrated to be functional for plant fitness and growth [35]. Rhizosphere bacteria also interfere with plant–plant interactions [36]. Microbiota effects on plant–plant interactions drive the introduction of invasive plant species, communication between plant roots, parasitic plant/host plant relationships, and signal flow between roots [37,38]. The addition of beneficial bacteria to A. eriantha germplasm has already showed positive effects on plant acclimatization and ex vitro growth [26]. The knowledge of the structure of both microbiota and plant populations growing in a natural habitat could give insights into existing diversity, adaptation, and conservation strategies.
Based on the heterogeneity of the natural stations of Central Apennines in terms of altitude, climate, and soils, we hypothesized that A. eriantha populations and microbiota genetic diversities would present differences mainly based on spatial factors. We aimed to characterize the A. eriantha populations and microbiota genetic diversity for the first time. Plant diversity sampled at Gran Sasso and Majella massifs was assessed by AFLP molecular markers. Microbiota of rhizosphere soils were investigated by 16S rRNA gene metabarcoding.

2. Materials and Methods

2.1. Plant Material

The study was carried out in two protected geographical areas in the Central Apennines, namely in Parco Nazionale del Gran Sasso e Monti della Laga and in Parco Nazionale della Majella. Leaf samples of 38 randomly chosen wild plants were collected in Monte Portella (MP-2268 m asl, 42°26′59″ N 13°31′59″ E), and 41 in Monte Corvo (MC-2469 m asl, 42°23′35″ N 13°29′45″ E); both locations are from the Gran Sasso massif, geographically close to each other but orographically well separated. Leaf samples of 39 individuals were collected in Monte Focalone (MF-2676 m asl, 42°04′56″ N 14°05′34″ E) from the Majella massif. Leaf and rhizosphere soil samples were collected in July and stored at −20 °C before DNA extraction.

2.2. Population Genetic Diversity

Genomic DNA was isolated from young leaves using the GenElute Plant Genomic DNA Miniprep Kit (Sigma-Aldrich, St. Louis, MO, USA) according to the supplier’s specifications. DNA were qualitatively evaluated by electrophoresis on agarose gels and the concentration was estimated using a NanoDrop spectrophotometer (Thermo Fisher, Waltham, MA, USA). AFLP analysis was carried out according to the original technique of Vos et al. [39] as modified by Cnops et al. [40]. Three hundred nanograms of DNA derived from single plants was analyzed by six primer combinations (Table 1). Firstly, genomic DNA were subjected to restriction-ligation for 4 h at 37 °C with 2.5 units of EcoRI and MseI restriction enzymes (New England Biolabs, Ipswich, MA, USA), 1 unit of T4 DNA ligase (Thermo Fisher, Waltham, MA, USA), 10 mM of ATP, 50 μM of Mse-adaptor, 5 μM of Eco-adaptor, 1X RL Buffer in a final volume of 50 μL. Then, restricted-ligated templates were diluted 10 times in ultrapure water and pre-amplification was performed using 5.0 μL of diluted DNA, 2 μL of dNTPs (5 mM), 0.2 μL of DreamTaq (5 U/μL; Thermo Fisher, Waltham, MA, USA), 1.5 μL of each adapter (50 ng/μL; Eco+C and Mse+A), and 5 μL of PCR-Buffer in a final volume of 50 μL. Each pre-amplified reaction was diluted 1:10 in ultrapure water and 5 μL was used for selective amplification step with 1 unit of DreamTaq DNA polymerase (Thermo Fisher, Waltham, MA, USA), 1X PCR Buffer, 50 ng of EcoRI+3, and Mse+3 oligos in a final volume of 20 μL. The PCR profiles for pre-amplification and selective amplification were performed as described in Vos et al. [39].
A total of 1 μL of selective amplified sample was added to 0.5 μL of size standard (Genescan ROX 500, Applied Biosystems, Waltham, MA, USA) and to 10 μL of formamide, and then the mix was denaturated at 94 °C for 5 min before fragment separation in ABI 3130xl Genetic Analyzer sequencer (Applied Biosystems, Waltham, MA, USA).
Data peaks in electropherogram files were analyzed by using GeneMapper 4.0 software (Applied Biosystems, Waltham, MA, USA) and reported as presence (1) absence (0) score limiting the analysis to fragments between 50 and 500 bp in size and allowing a resolution of ±1 bp.

2.3. Microbiota 16S rRNA Gene Metabarcoding

Rhizosphere samples of vegetal entities belonging to the same station were bulked. DNA extraction was carried out in triplicate with a NucleoSpin® Soil kit following manufacturer’s instructions (Macherey Nagel, Germany). A Nanodrop spectrophotometer (Thermo ScientificTM, Waltham, MA, USA) and a Qubit fluorometer (Thermo ScientificTM, Waltham, MA, USA) were used to test DNA concentration and purity and to combine replicates in an equimolar mixture. 16S rRNA gene metabarcoding was carried out on the V3 and V4 regions [41] as previously described [42] (paired-end sequencing on Mi-Seq Illumina platform by Bio-Fab Research, Italy.) A filtering quality check and counting were performed on reads. Assemblage of ASVs (Amplicon Sequence Variants) was obtained with the DADA2 plugin using QIIME2 (qiime2-2020.2 version) [43]. The SILVA 138 database (https://www.arb-silva.de/ accessed on 1 September 2022) was used for classifier training via the fit-classifier-naive-bayes plugin. A 97% similitude for the taxonomic assignment was used.

2.4. Statistical Analysis

AFLP fragments were scored as dominant markers, 1 for presence and 0 for absence. The binary data were inspected for polymorphisms and specific fragments within and between populations. The genetic distances of all individuals were calculated using GenAlEx 6.503 [44], which implements the method of Huff et al. [45] in which comparisons with the same state (0 vs. 0 or 1 vs. 1) yield a value of 0, while comparisons of different states (0 vs. 1 or 1 vs. 0) yield a value of 1. Calculated across multiple loci for a given pair of samples, the method is equivalent to the tally of differences between two genetic profiles. The matrix of distances was used for clustering using Ward’s algorithm. Cluster analysis was validated by bootstrap (1000). GenAlEx was also used to perform AMOVA (Analysis of MOlecular VAriance) for all loci and with 999 permutations. Clustering and bootstrap were performed by PAST [46]. AFLP fragments were also used in a classification technique through a stepwise discriminant procedure (to look for the most important predictor variables) followed by a canonical discriminant procedure (to find all possible discriminant functions) and, lastly, by nonparametric methods of discriminant analysis due to the binary-type of data that are not multivariate normally distributed [47,48]. The group-specific density was estimated using the kernel and k-nearest-neighbor nonparametric methods. Discriminant analysis was performed by SAS software (Cary, NC, USA) [49].
Population structure was inspected using STRUCTURE v. 2.3.4 software [50] with a non-hierarchical clustering method based on a Bayesian approach. To classify the data with the optimum and realistic number of clusters (K), an admixture model and correlated allele frequencies with a burn-in period of 100,000 and 250,000 MCMC (Markov Chain Monte Carlo) simulations were assumed. The number of clusters tested ranged from 1 to 10, with 10 iterations for each K tested. ∆K was calculated as described in Evanno et al. [51] using Structure Harvester v0.6.94 [52], selecting the best K value, the one corresponding to the largest ∆K. Individuals were assigned to the K groups with a threshold value of PqI ≥ 0.80.
ASVs were analyzed for alpha-diversity metrics (i.e., Simpson, Shannon, and Chao1 indexes) and processed for taxonomy barplots and heatmap visualizations using Primer 7 and PAST 4.03. Data visualization was obtained after 1% cut-off data filtering. Heatmap was realized based on resemblance matrix (analyzed between variables, measuring the index of association) and hierarchical cluster analysis (group average cluster mode).

3. Results

3.1. Genetic Characterization

A total of 816 AFLP amplicons were scored; of these, 49 were monomorphic and as many as 767 (94%) were polymorphic (Table 1).
The MseI+AGA/EcoRI+CAG combination was the most informative, with 143 unambiguous fragments. The data matrix was used to detect the amount of molecular variance (AMOVA) among (21%) and within (79%) populations, whose sizes are typical of an outbreeder species. The dendrogram of the cluster analysis graphically represents the genetic relations among individuals belonging to the three populations (Figure 1). The robustness of the dendrogram was based on a bootstrap analysis, but only the first node was found to be statistically significant (100%). As a result, the dendrogram clearly identified two main groups: the upper one (C1) is made up of samples collected at Monte Corvo and Monte Focalone sites, and the lower group (C2) was basically made up of samples collected at Monte Portella. The homogeneity of C1 was very high, as all individuals were from MC and MF sites, except two from Monte Portella (namely MP04 and 09), whereas in C2 the homogeneity was lower, with nine samples from Monte Focalone (namely MF01, 21, 04, 12, 08, 16, 30, 28, and 37) and two from Monte Corvo (MC06 and 25). The bootstrap values of subclusters C1 and C2 were as low as 2%, indicating that the arrangements of individual genotypes within each of them was of no importance.
These results were confirmed by Nei’s genetic distance (Supplementary Table S1) where MC and MF were the two closest populations (D = 0.0192) while both of them were more distant from MP (D = 0.0491 and D = 0.0505, respectively).

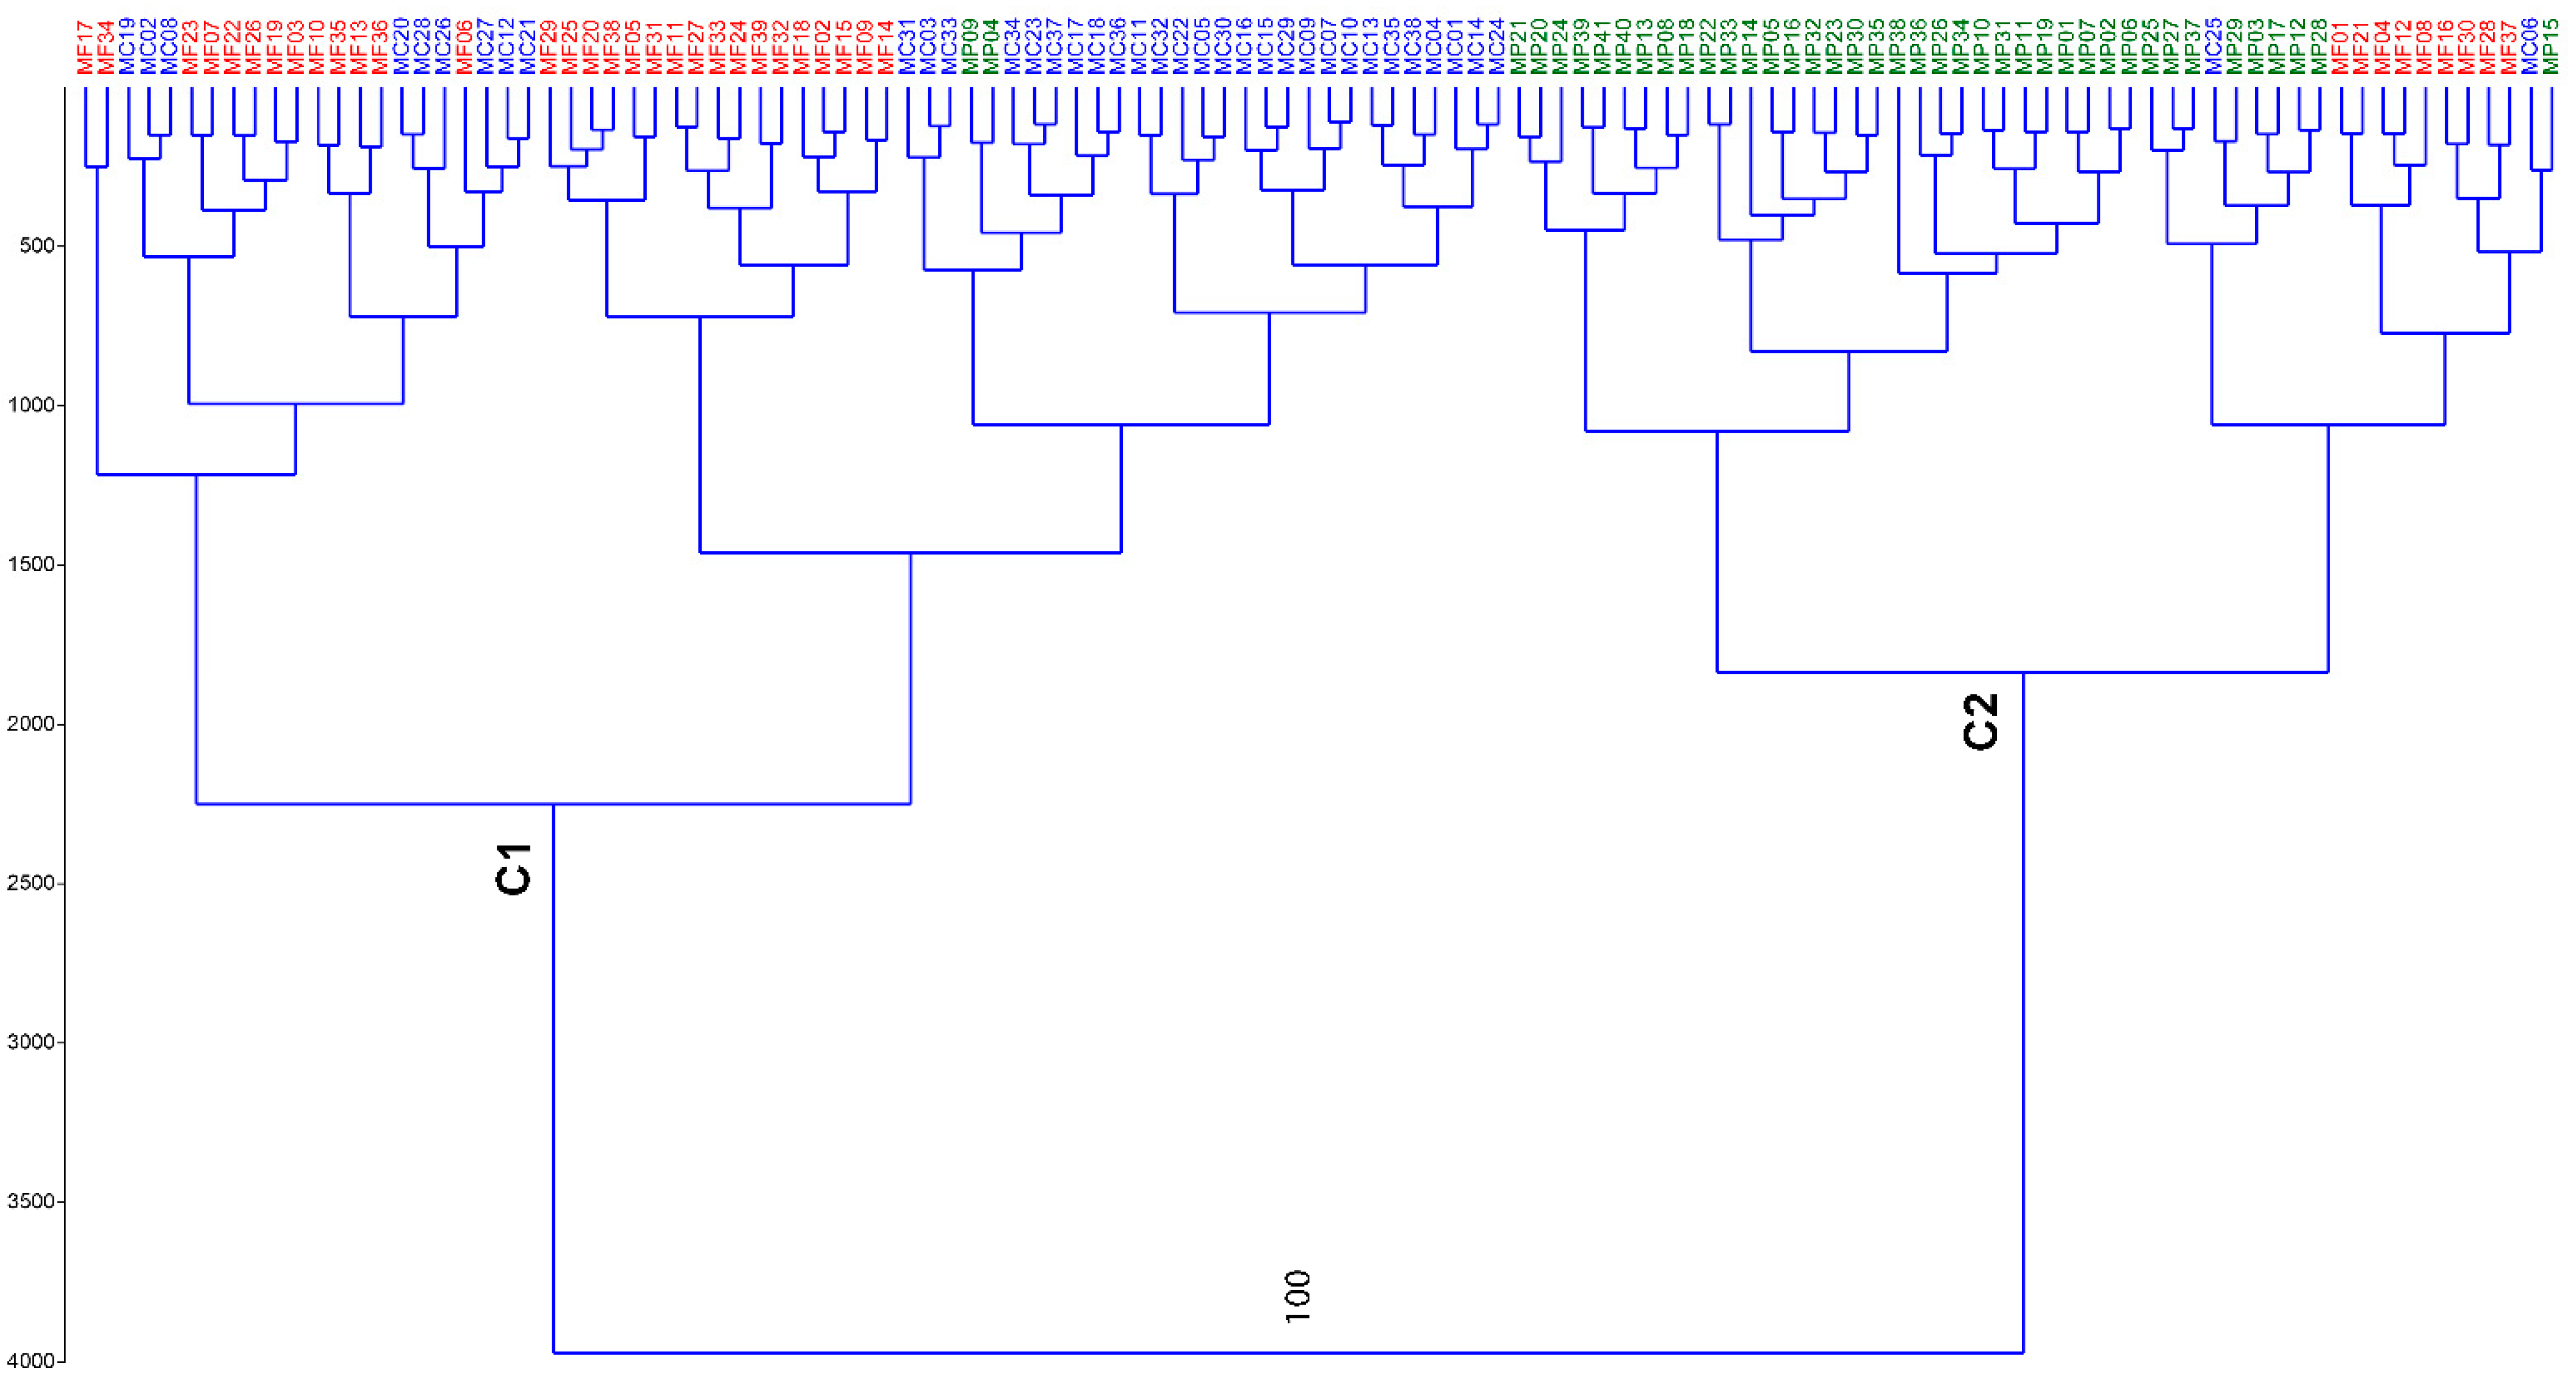
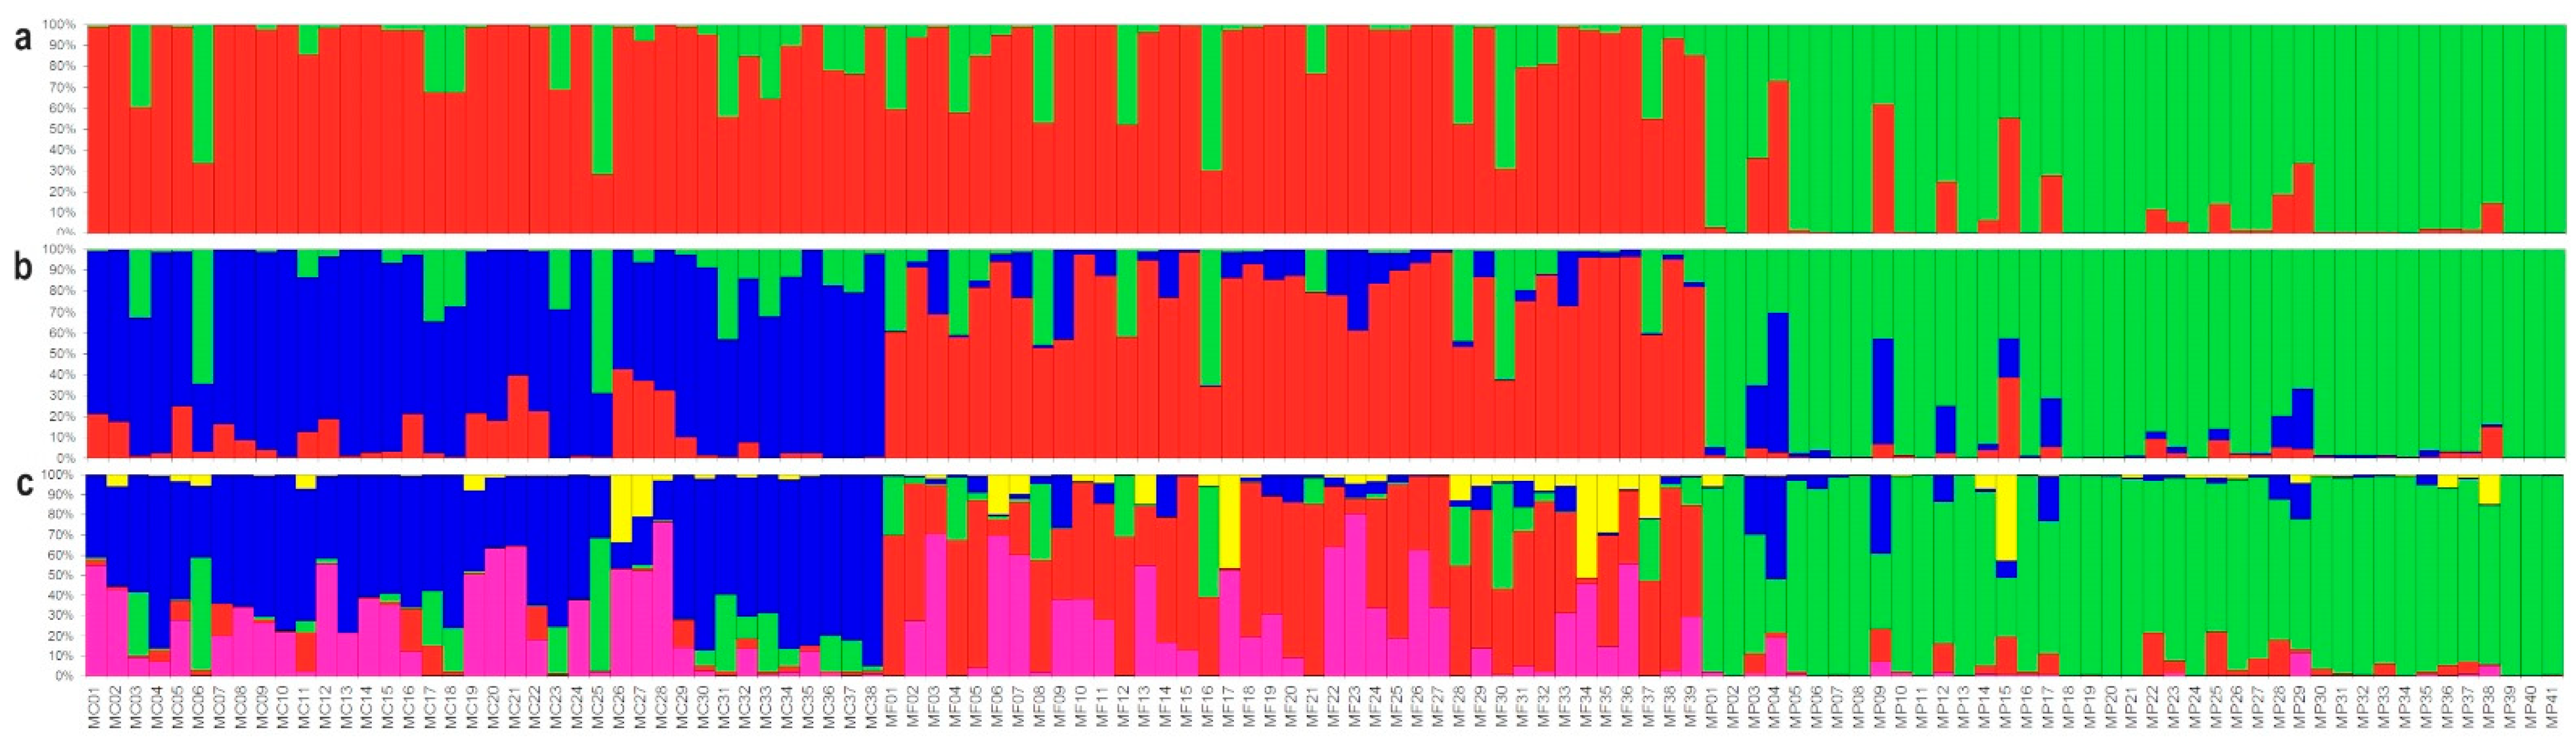
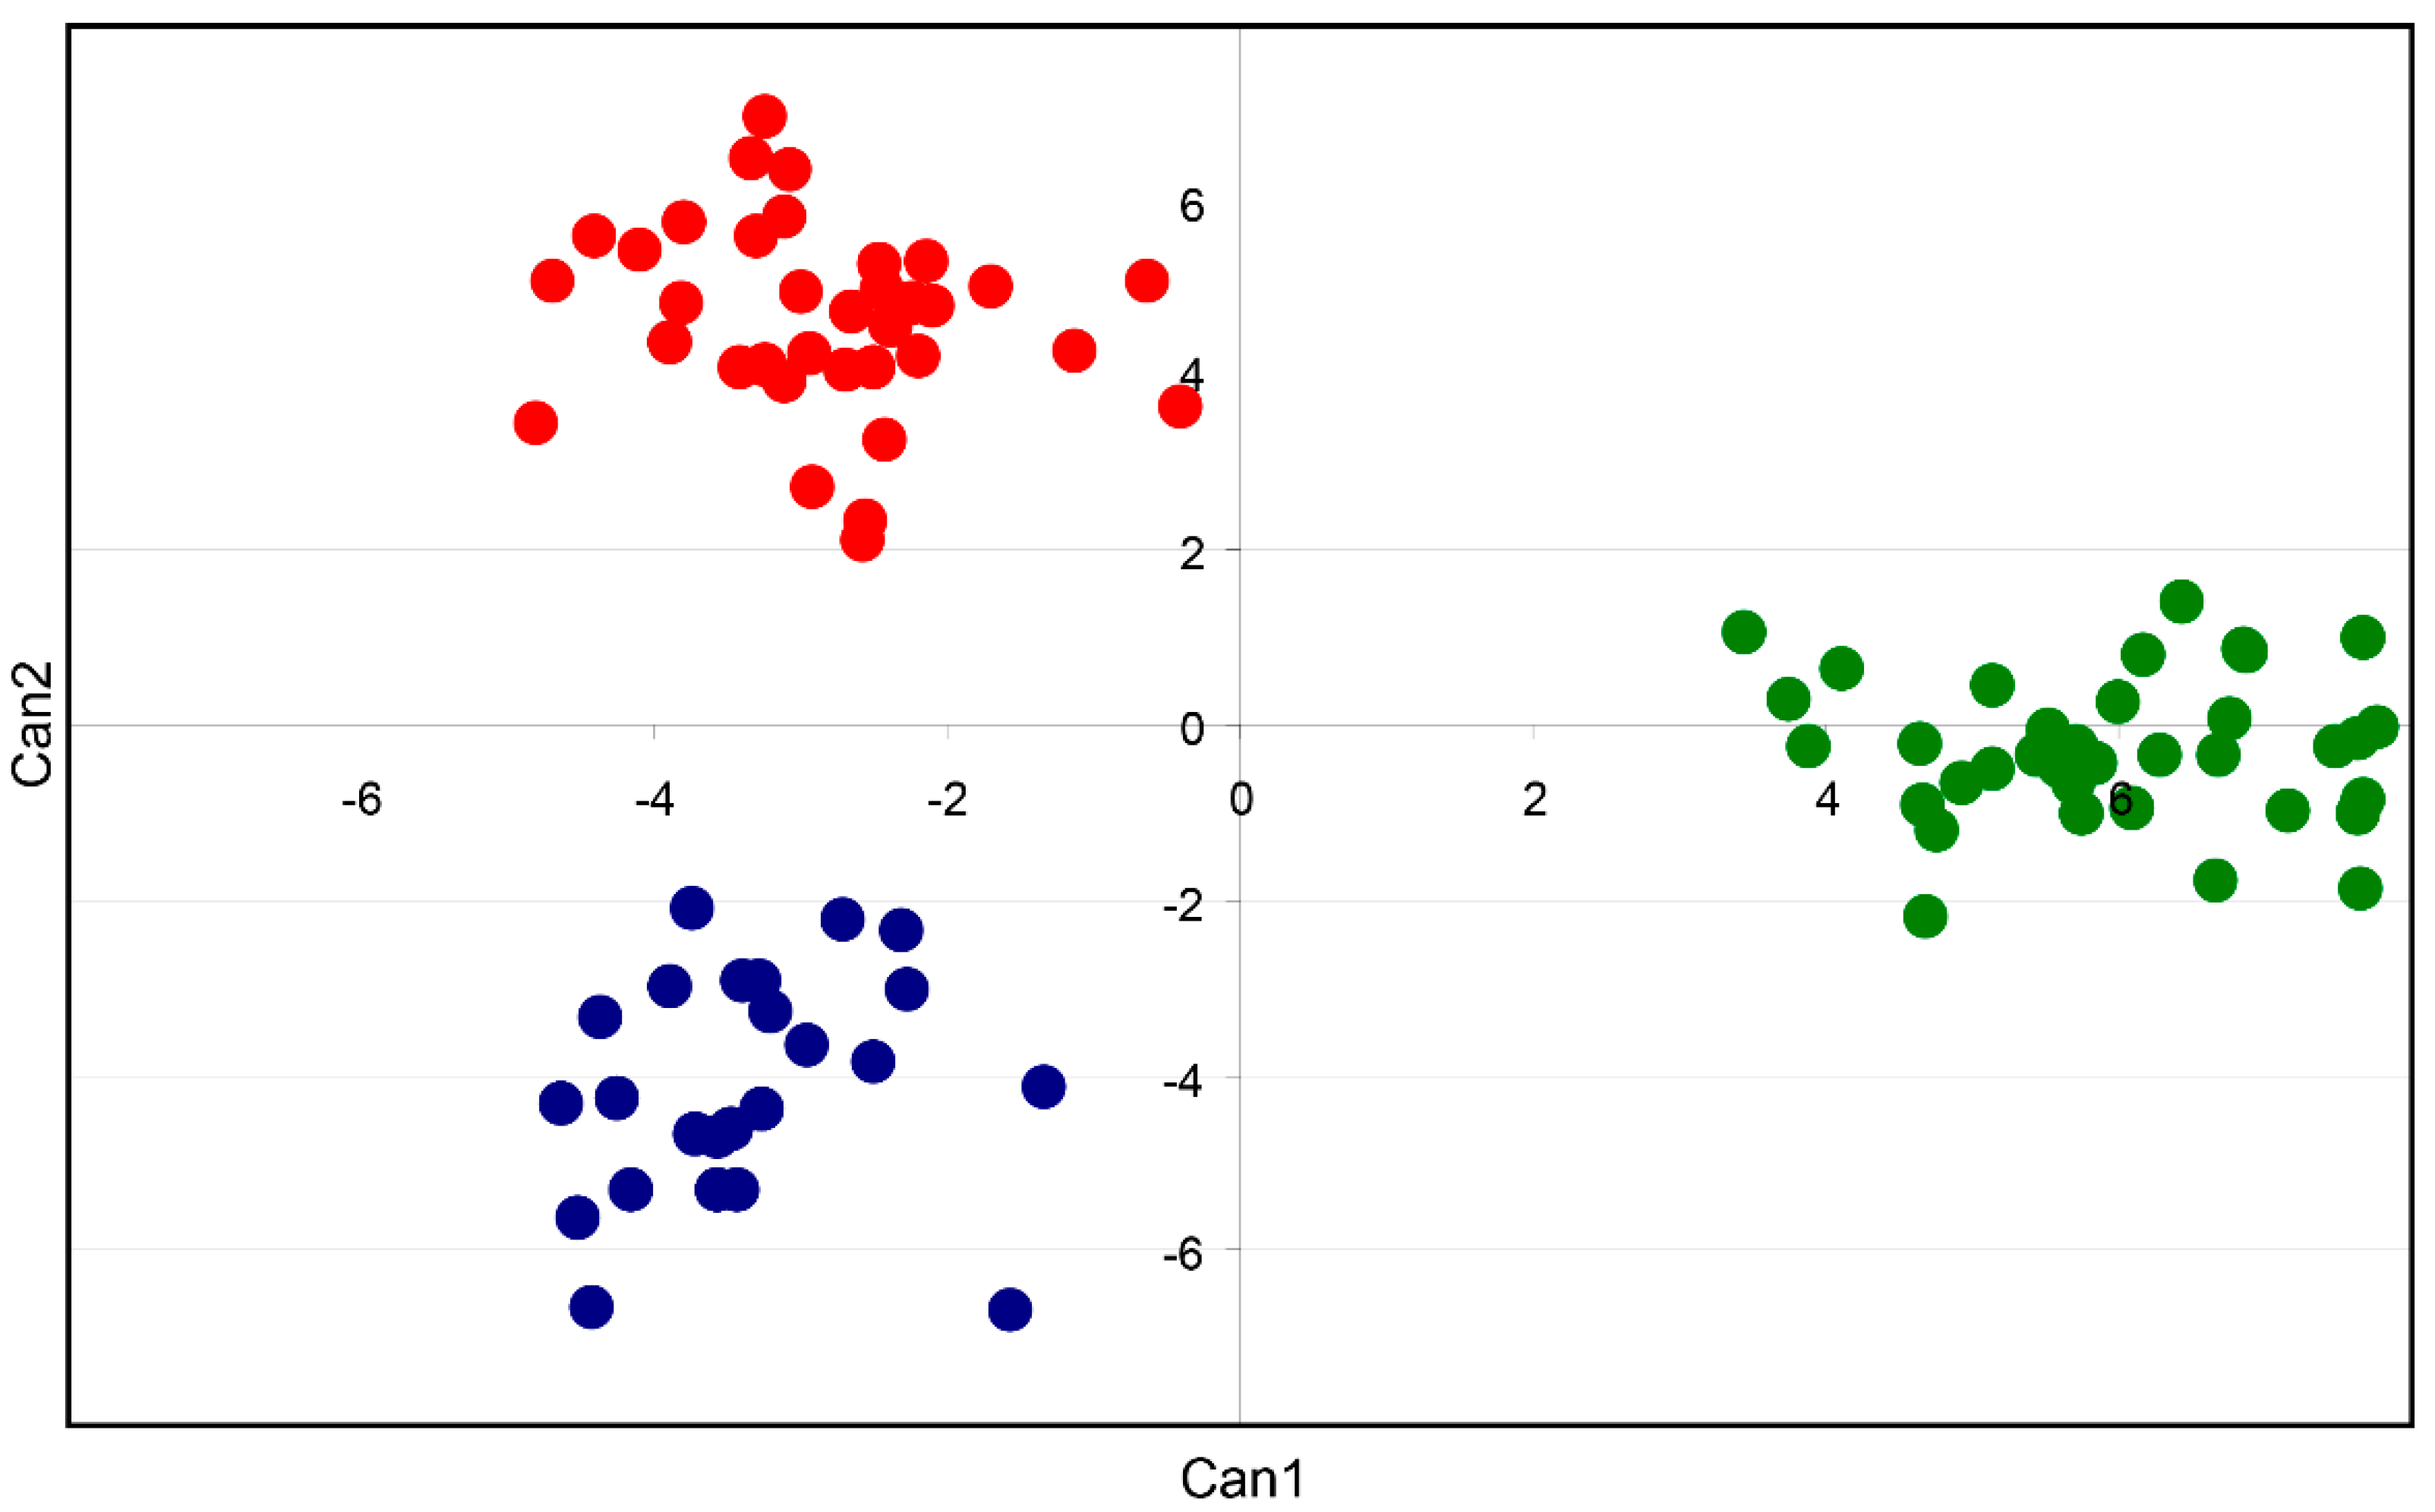
3.2. Genetic Structure

The genetic structure of the whole dataset was investigated by STRUCTURE. The plot of the average log-likelihood values for Ks ranging from one to ten and the distribution of ΔK values [51] according to K-values are shown in the Supplementary Figure S1. Three peaks were found, the first corresponding to K = 2, the second to K = 3, and a third to K = 5. With the threshold of PqI ≥ 0.80, the highest value of ΔK also showed the highest number of correctly assigned individuals in the two groups. At K = 2 (Figure 2a), as many as 91 individuals were correctly classified in the two groups (77%), the rest were considered admixture (23%). At K = 3, STRUCTURE was able to split the first group into two parts (Figure 2b), basically dividing MC and MF and leaving MP unchanged, but increasing the quota of admixures (39%). At K = 5, the three groups were maintained (Figure 2c), but the number of admixtures dramatically increased by up to 52%.
The stepwise discriminant procedure reduced the number of predictor variables from 816 to 23 only (2.8%), and these were used to find the two discriminant canonical functions, which were both highly significant (p < 0.001). The Wilks’ lambda of the first function was 0.00333100 (F = 66.02, p < 0.001), explaining 58.3% of the among-population variation. However, after removing the first function, a strong association still existed between populations and marker predictors (Wilks’ lambda = 0.0689, F = 57.8, p < 0.001), with the second function explaining 40.7% of the total variation. The first discriminant function clearly separated individuals of MP from the other two populations, whereas the second canonical function separated MF from MC (with MP in between) (Figure 3). The non-parametric procedures of discriminant functions were able to correctly reclassify all individuals belonging to the three populations (Supplementary Table S2).

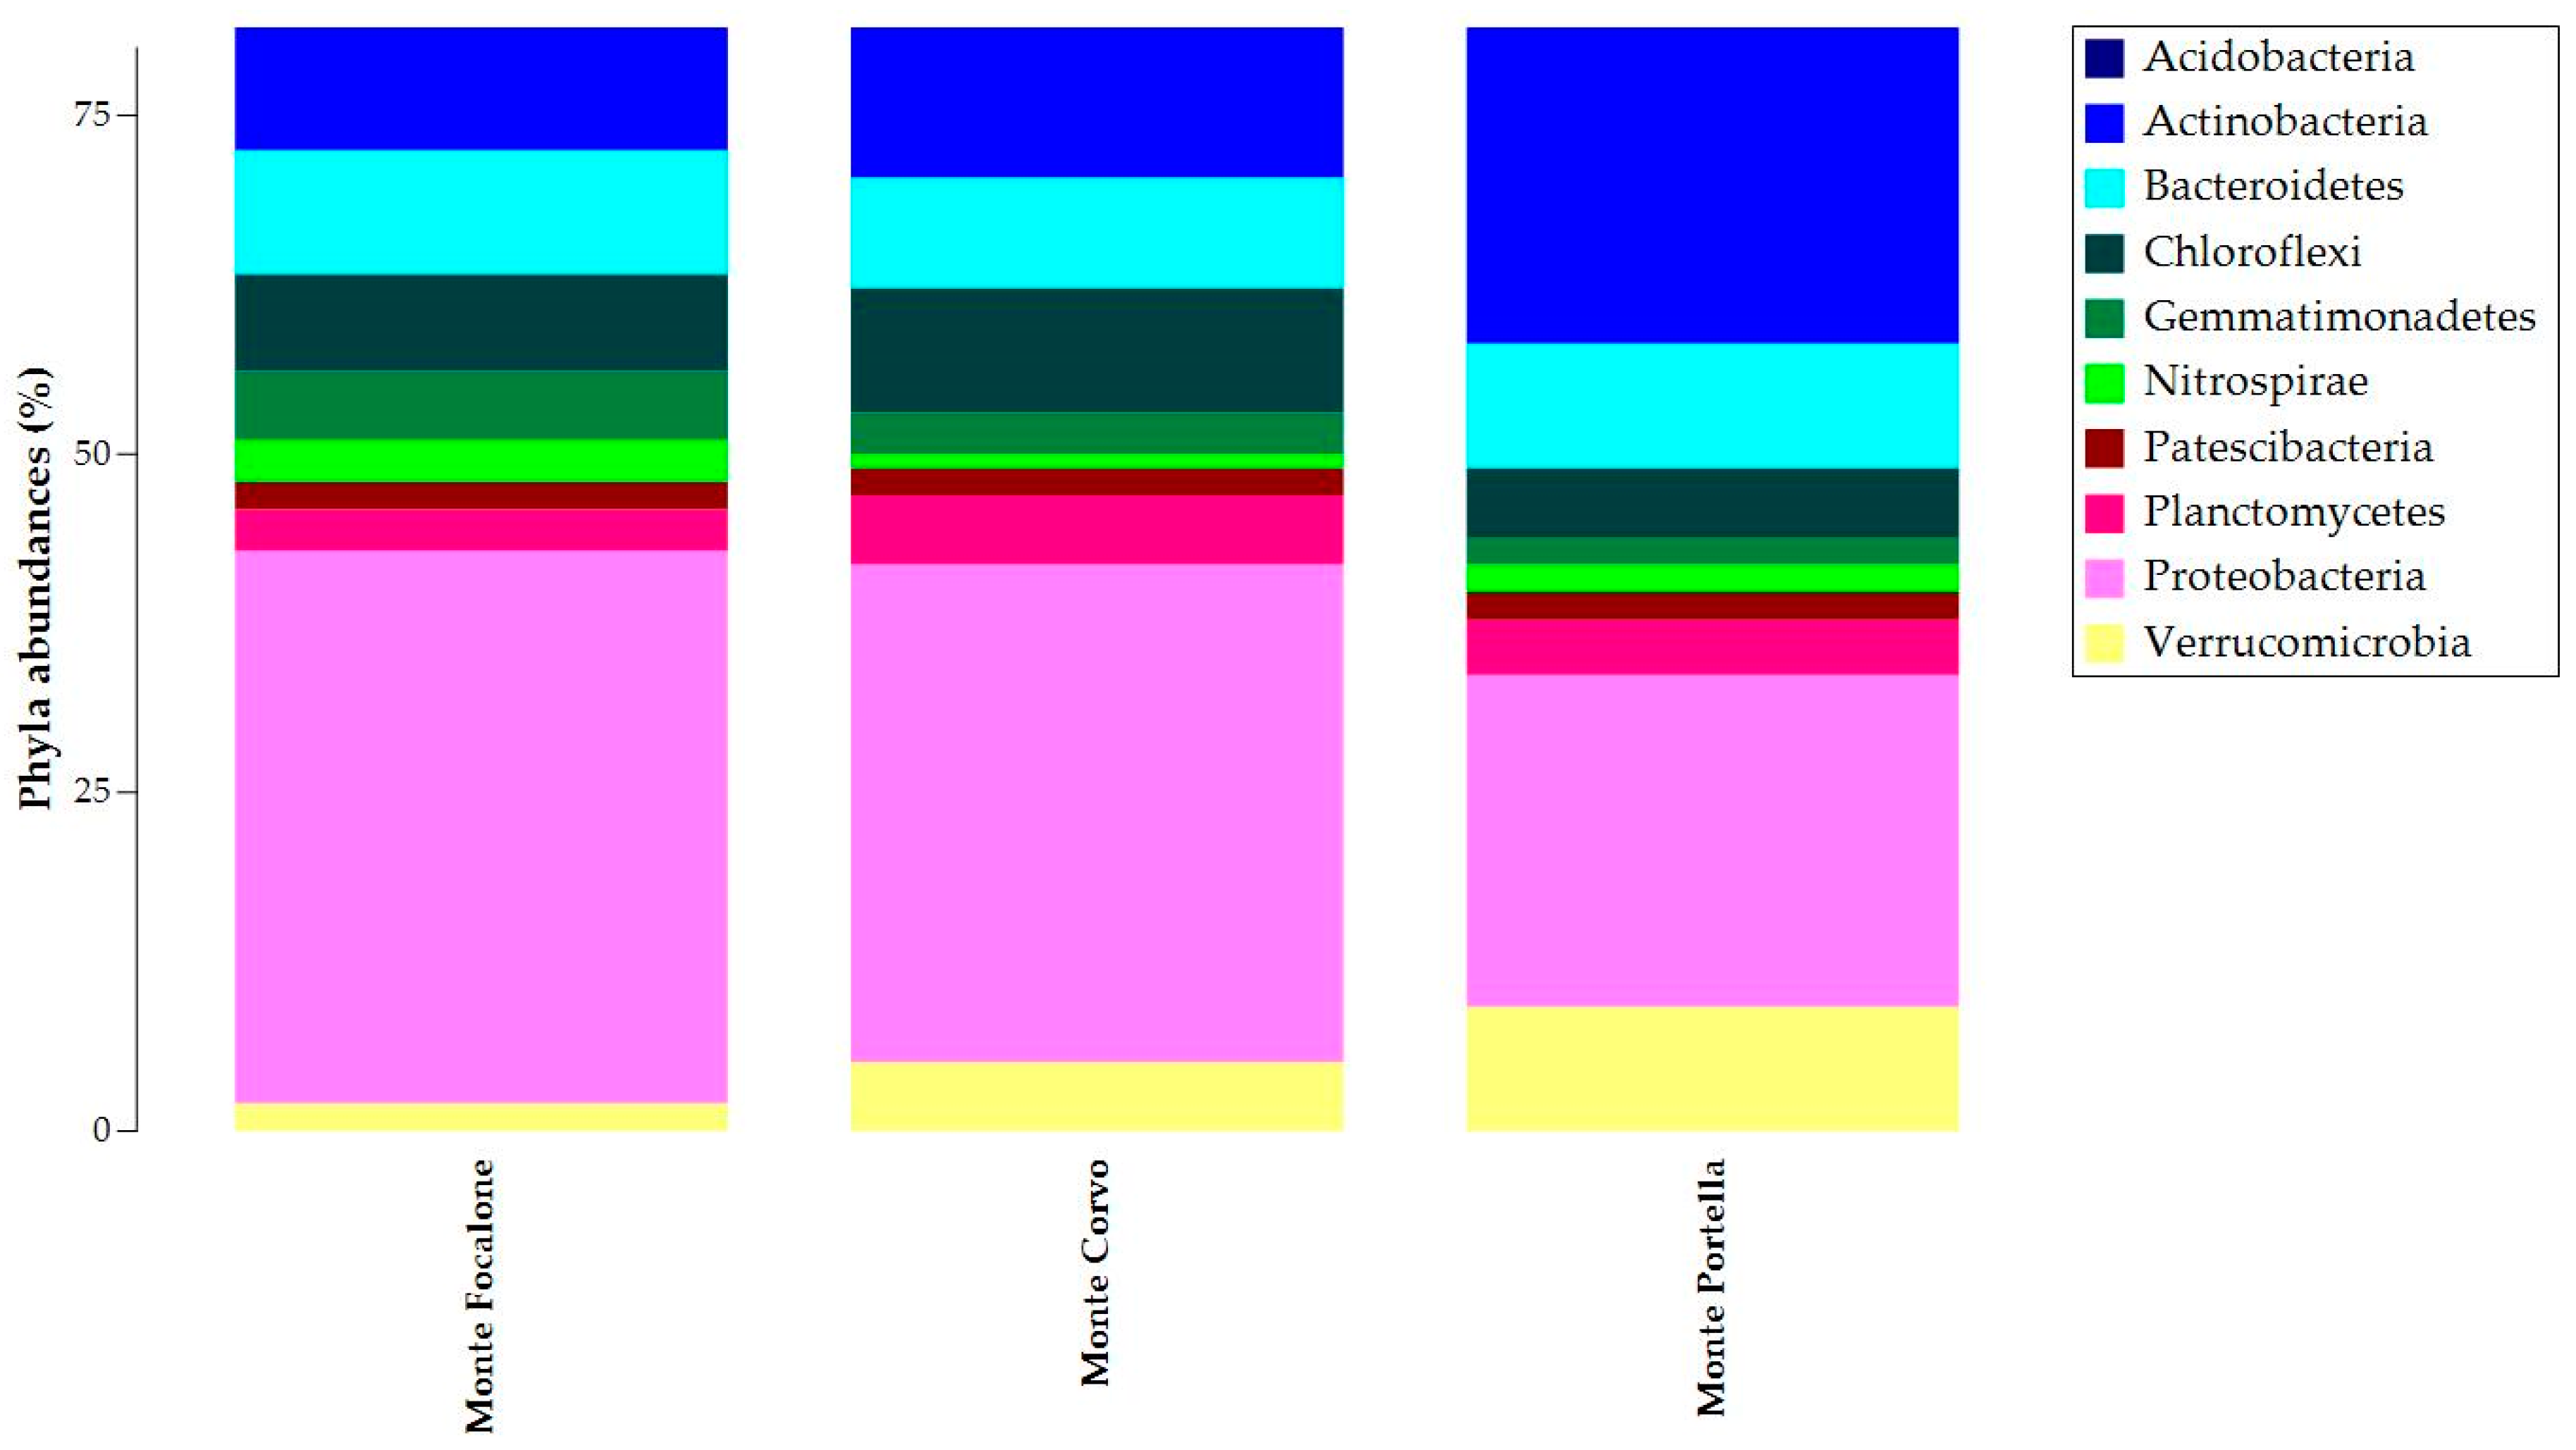
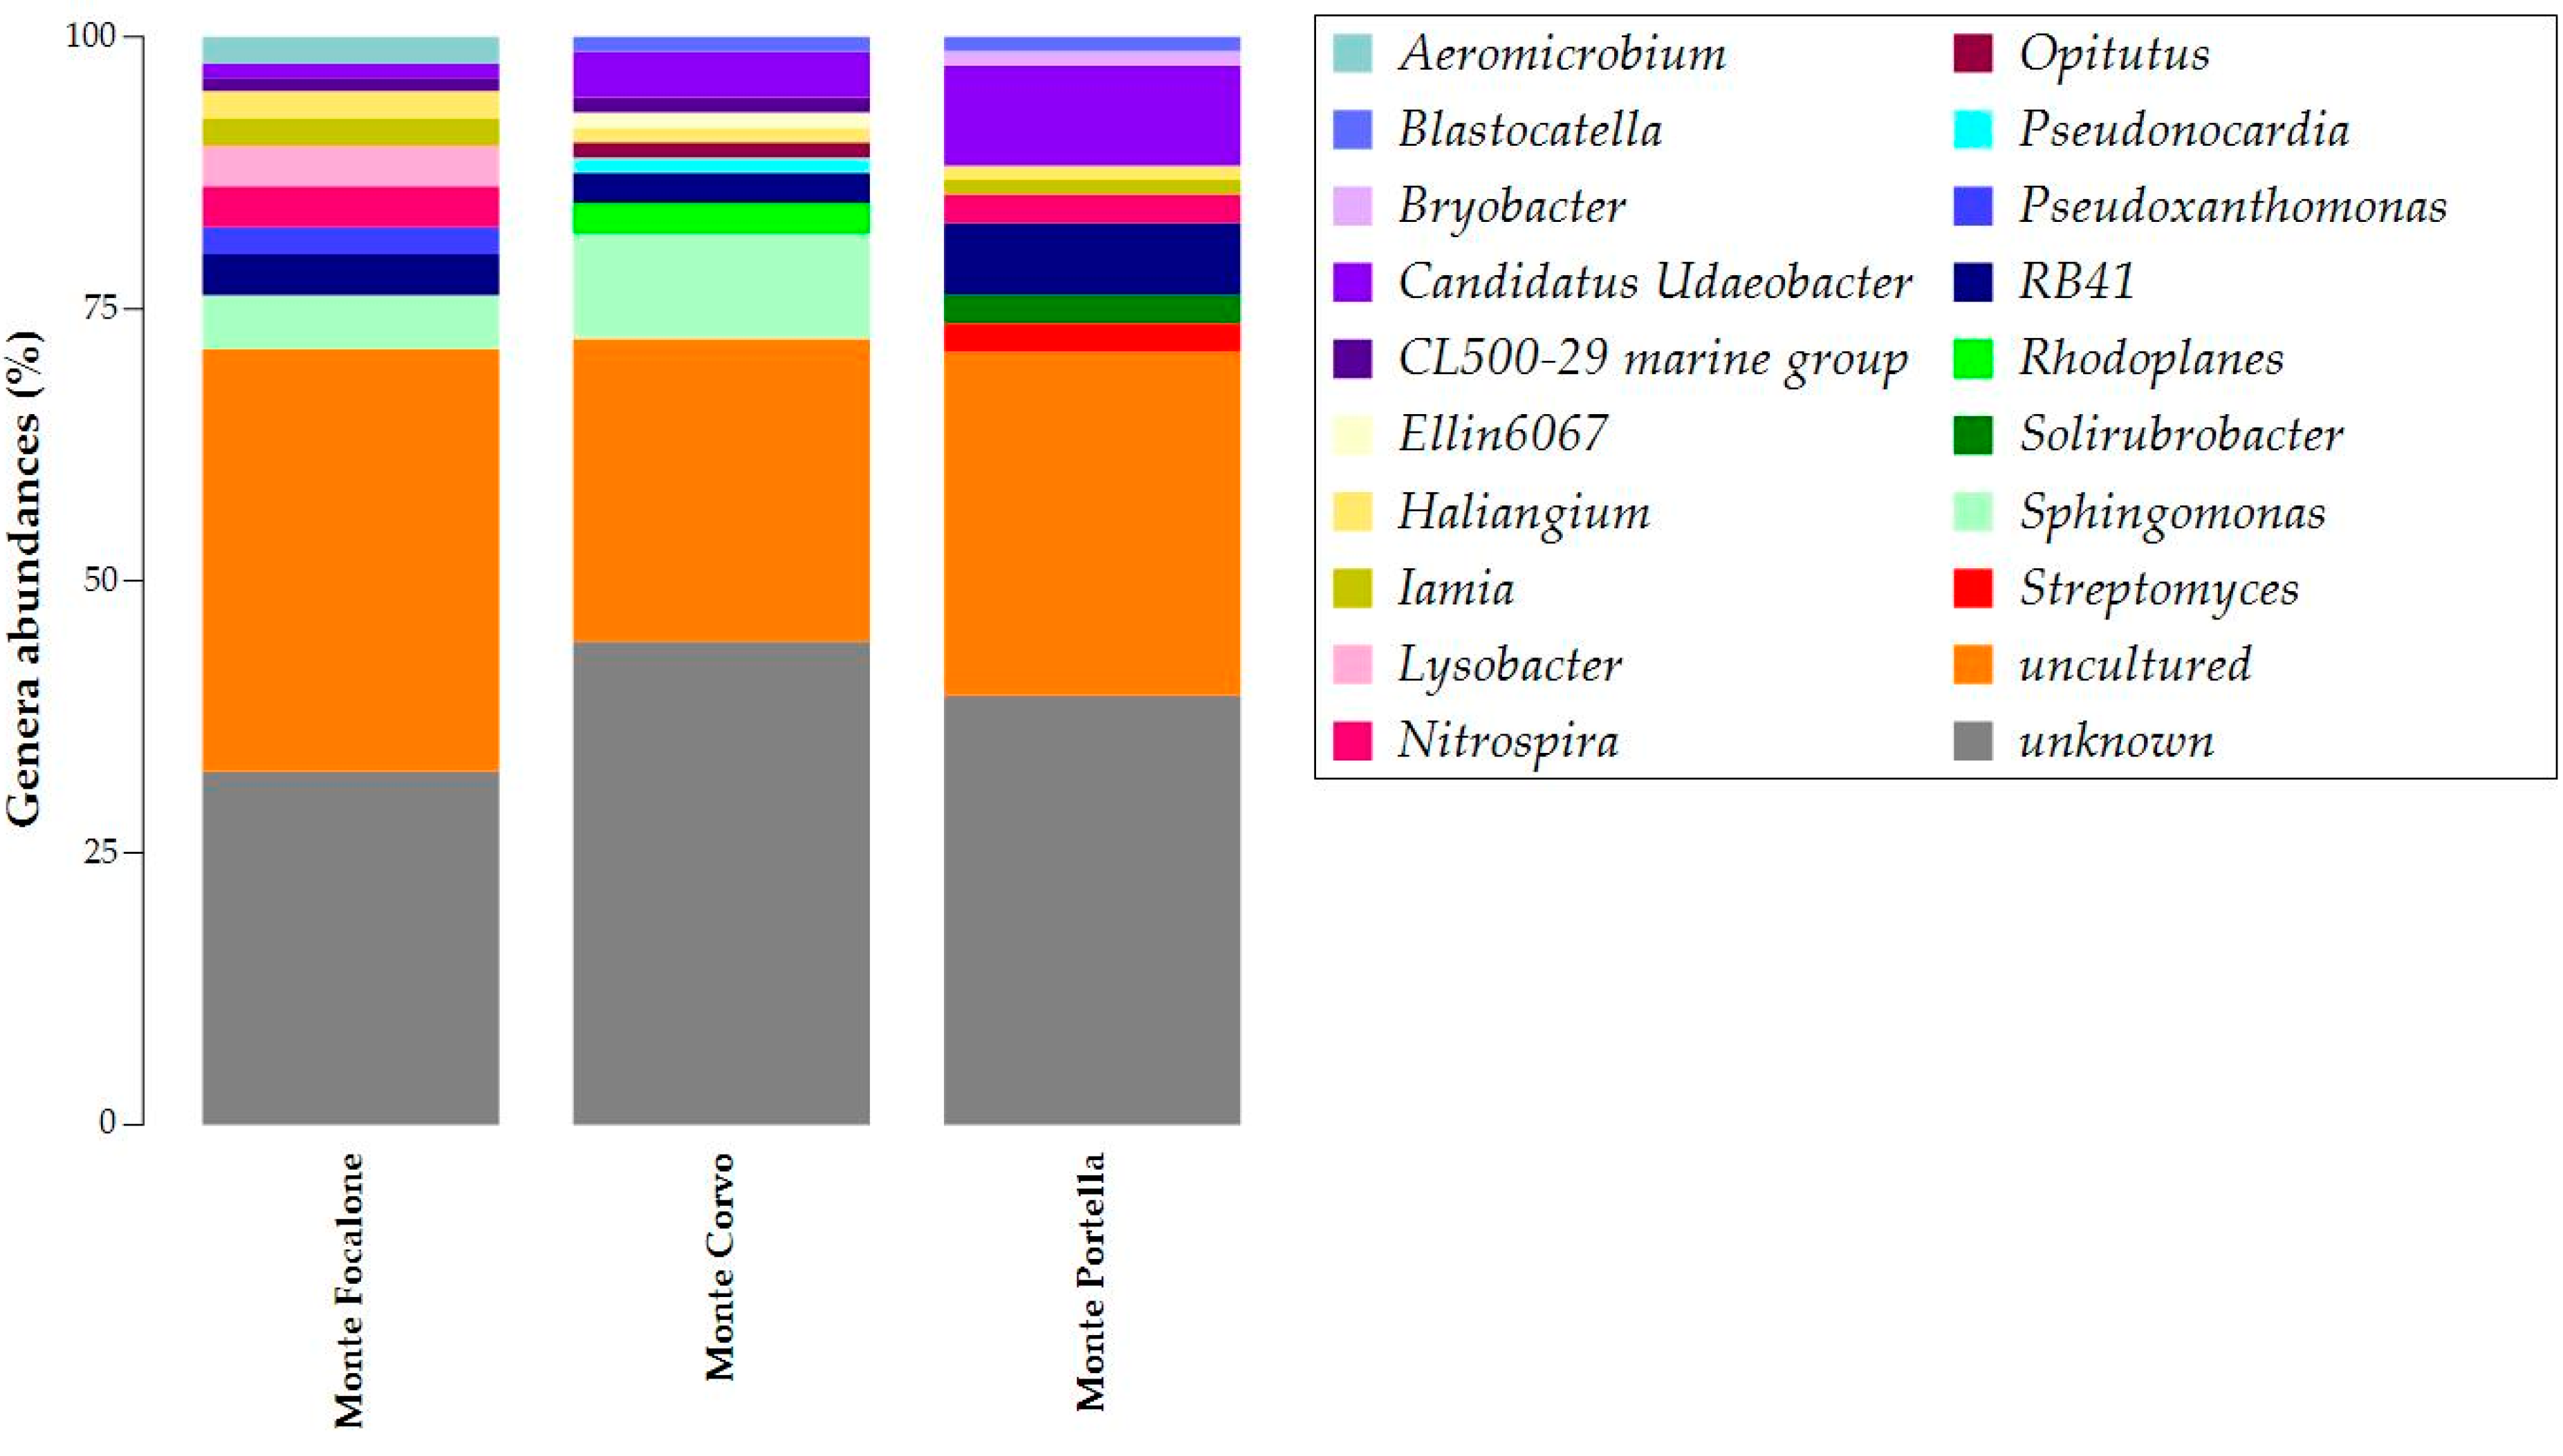
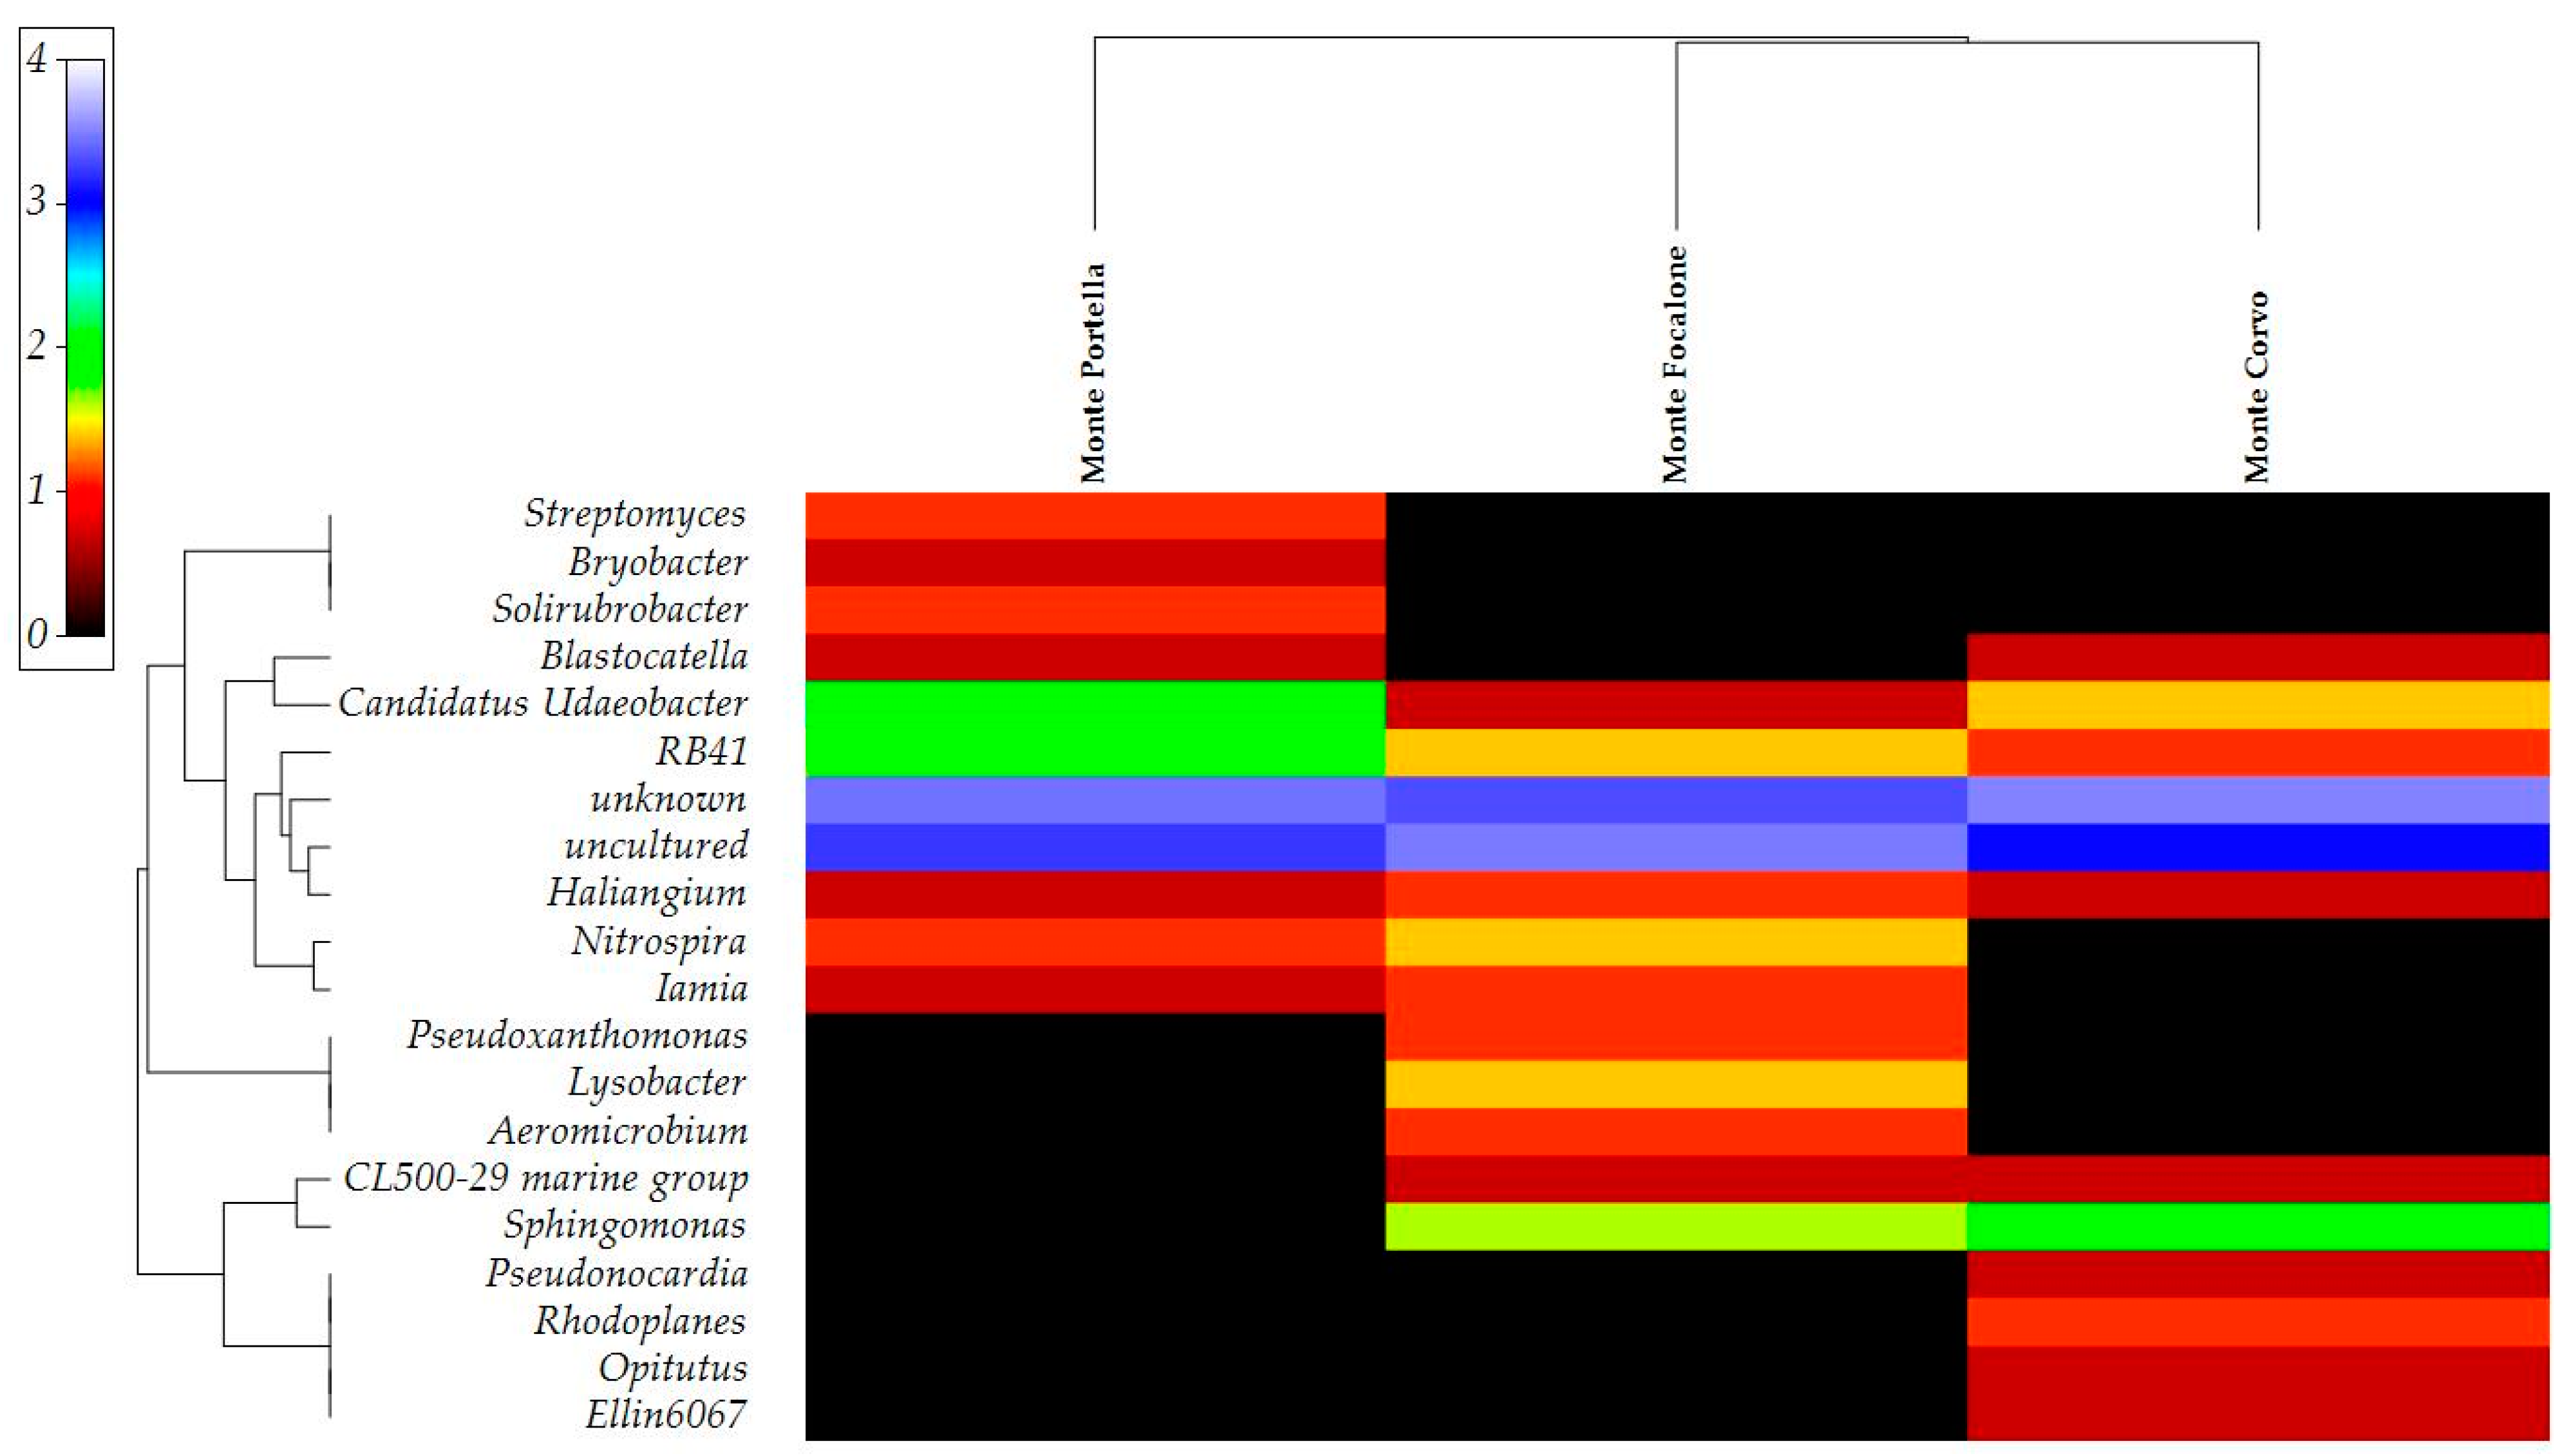
3.3. Microbiota 16S rRNA Gene Metabarcoding

DNA extraction and 16S rRNA gene metabarcoding were performed to observe differences in microbial communities across the three collection sites. The results were analyzed to investigate alpha diversity and richness by ecological indices (Table 2). All the samples showed high diversity, as revealed by Shannon H′, Chao-1, and Evenness e^H/S indices. The lowest diversity values were found in the Monte Portella sample. The Monte Focalone and Monte Corvo samples showed higher richness than did those from Monte Portella.
To analyze the contribution of the principle ASVs at several taxonomic levels (phylum and genus), we filtered data (1% cut-off) and described them with taxonomy barplots. At the phylum level (Figure 4), Proteobacteria was the most common phylum in all samples but with different abundances. The samples from Monte Focalone and Monte Corvo showed higher abundances than those from Monte Portella, with 40% and 36%, respectively, compared to the 24% of the latter. Actinobacteria and Acidobacteria showed similar abundances in all samples, being greater than 10%. Finally, Bacteroidetes, Chloroflexi, Gammatimonadetes, Nitrospirae, Patescibacteria, Planctomycetes, and Verrucomicrobia also showed comparable abundance in all samples but with percentages less than 10%.
Figure 5 depicts the ASV abundances at the genus level. The uncultured and unknown ASVs emerged in the abundance of all the samples, with percentages over 30%. Candidatus Udaeobacter, Haliangium, and RB41 were present in all samples, with higher abundance in those from Monte Portella. Monte Focalone and Monte Corvo shared the CL500-29 marine group and Sphingomonas. Iamia and Nitrospira were common in Monte Focalone and Monte Portella. Blastocatella was present in Monte Corvo and Monte Portella. Moreover, the results also showed the presence of unique genera in each sample. Aeromicrobium, Lysobacter, and Pseudoxanthomonas were present exclusively in Monte Focalone. Ellin6067, Opitutus, Pseudonocardia, and Rhodoplanes occurred only in Monte Corvo, while Bryobacter, Solirubrobacter, and Streptomyces were solely found in Monte Portella.
The heatmap based on the main relevant genera for presence/absence and abundances to highlight different correlations between the samples is reported in Figure 6. The output described the clusterization of two different groups. One cluster was formed by Monte Focalone and Monte Corvo samples and one by the Monte Portella sample. This grouping can be explained due to the stronger correlation of the microbial communities found in the Monte Focalone and Monte Corvo samples according to Sphingomonas and CL500-29 marine group abundances. Still, the higher correlation of unique genera found in Monte Portella (particularly Streptomyces and Solirubrobacter) led to this location being grouped separately from the other two. Moreover, the relevant abundances of uncultured and unknown genera contributed to decreasing the differences between samples as showed by a reduced distance in the clusters.

4. Discussion

Genetic differences influence how individuals interact with the environment and other species and how they function within ecosystems. Therefore, the use of multidisciplinary approaches to characterize genetic resources is crucial to the choice of optimal conservation strategies and applications. In recent years, research has highlighted how genotype–microbiota relationships crucially influence human and animal health. Through the knowledge of host–microbiota interactions, it is possible to personalize treatments and improve their effectiveness [53,54,55]. A similar approach might be applied to plants, in which plant–microbiota interactions could be even closer. Human activity has strongly influenced natural ecosystems by changing equilibria achieved over long periods of time [56]. Moreover, in the case of crop plants, a personalized approach could be facilitated by the genetic uniformity of the host genotype, and it could also help in cropping wild species that are difficult to reproduce ex situ [57]. In this study, we investigated for the first time the genetic structure and rhizosphere microbiota of A. eriantha populations in Central Italy. Despite the proximity in the spatial distribution of Monte Corvo and Monte Portella, findings revealed a more marked closeness between Monte Focalone and Monte Corvo populations.
The genetic composition of a population depends on the history, phylogeny, and biogeography of a species. The number of population oscillations also plays a significant role in accumulating genetic diversity [58]. Populations separated by geographic distance may diverge due to diminished gene flow and population connectivity (isolation by geographical distance) under natural selection and random genetic drift [59]. However, population divergence might occur due to ecologically based divergent selection in distinct habitats (isolation by environment) [60].
Habitats are characterized by different environmental conditions that shape the genetic diversity of plants [61]. A high altitude induces the adaptation to lower temperatures, facilitating seed germination and increasing genetic diversity [62]. Based on these aspects, we can speculate about the effect of altitude on accumulating genetic diversity among the two groups. The environmental conditions caused by the altitude at Monte Portella (~2300 m asl) on one side and Monte Corvo and Monte Focalone (~2600 m asl) on the other could have contributed to their differentiation. These findings are in line with previous studies on Artemisia spp. by Elmeer and Elkhgkheg [63], who found differences among Artemisia herba-alba (Asso.) populations in the Libyan Green Mountain. The authors described two main groups, the first at 675 m asl and the second at altitudes ranging from 35 to 480 m asl. Artemisia capillaris showed high genetic heterogeneity across samples collected in the State of Pahang (Malaysia) according to local environmental factors, type of propagation, and pollination [64]. Geographic and local ecological changes associated with the altitude of sampling locations in Saudi Arabia played a role in the genetic diversity of Artemisia judaica, A. monosperma, and A. herba-alba populations [65]. However, similar communities can be found across different geographical distributions [34].
The 16S rRNA gene metabarcoding of the bacterial communities showed a similar trend as described for the plant samples. Richness, diversity, and the composition of the microbiota at the genus level showed interesting results. Monte Falcone and Monte Portella, despite belonging to two different geographical areas, showed similar microbial compositions, while Monte Corvo had a distinct bacterial community. The interpretation of these results is not simple in light of the existing literature. Our understanding of the role of the microbiota and its interactions with plant ecology, physiology, and genetics is still far from being complete. Nevertheless, it is well known that many biotic and abiotic factors influence and shape rhizosphere microbial communities. Root exudates have a primary role in microbe recruitment from the soil [66]. Plants generally entice microbes with functional features required for their fitness [34], excluding potentially pathogenic ones [67]. As a result, genotypes can form unique rhizobacterial communities, [68] as in the exclusive presence of Streptomyces and Solirubrobacter in Monte Portella.
Many studies also described the influence of pedoclimatic conditions on microbiota shaping rather than genotype (e.g., soil physic-chemical characteristics and environmental conditions) [69,70,71,72,73]. Moreover, some lineages can be found common due to soil characteristics rather than geographical distribution, especially at the phylum level [74]. In our case, most of the ASVs were associated with Proteobacteria. The bacteria of this phylum are adapted to soil rhizosphere characteristics (i.e., high metabolic activity, fast growth, and rapid reproduction). Thus, this taxon is usually shared and similar among the rhizosphere microbiota of several vegetal species [34].
Isolation strategies of the microbiome could be directed towards common (Haliangium) and uncommon genera (Streptomyces and Solirubrobacter) to improve plant fitness. Haliangium (Pseudomonadota phylum) is an interesting source of plant growth-promoting rhizobacteria (PGPR). Strains belonging to this taxon were isolated from extreme environments [75] and are described as PGPR associated with the quality of soil and tobacco plants [76] and produce antifungal compounds [77]. Streptomyces is a source of novel bioactive molecules (i.e., antimicrobials and enzymes) and is common in the rhizosphere of plants. Many members of this genus also are rhizoplane and inner tissue plant colonizers [78]. Biostimulants (e.g., phytohormones production and nutrient acquisition enhancement) and the biocontrol traits of Streptomyces promote plant growth and development [78]. Solirubrobacter occurs in the rhizosphere and endosphere of Leontopodium nivale subsp. alpinum [79] and as root endophytes of Phytolacca acinose Roxb. [80]. Both these genera belong to the Actinobacteria phylum and have spore-forming abilities and the capability of surviving different extreme conditions [81]. Given these traits, all these genera are good sources of PGPR strains potentially useful in the conservation of A. eriantha populations.
A. eriantha already showed good association capabilities with common PGPR strains and improved plant in vitro regeneration and ex vitro rooting [26]. The latter ability, usually enhanced when the bacteria are isolated from the same plant, gives promising perspectives on future research on PGPR isolation and use for species conservation strategies. PGPR are good biofertilizers and biocontrol agents against several phytopathogens. Nevertheless, their ability to induce abiotic stress tolerance can help plants to survive and thrive in harsh environmental conditions [82]. PGPR induce plant abiotic stress tolerance by phytohormone modulation. For example, bacterial enzyme 1-aminocyclopropane-1-carboxylate (ACC) deaminase converts ACC to ammonia and α-ketobutyrate, reducing stress ethylene levels in plants. PGPR also accumulate cellular metabolites and other molecules to prevent stress-related membrane damage and leakages [83].
The high abundance of unknown ASVs found in the rhizospheres of the three populations underlines the limited knowledge of the soil microbial communities of this valuable high-altitude plant species. This aspect paves the road for future studies using culturing approaches. Such approaches are relevant to understanding how bacteria could be exploited in plant conservation strategies.

5. Conclusions

For the first time, the present study investigated the diversity of A. eriantha through a multidisciplinary approach. The results showed that the involvement of multiple disciplinary areas is necessary to the development of appropriate conservation strategies. The results regarding population genetic diversity highlighted a need to carry out repopulation strategies targeting stations and not ranges. The results regarding the bacterial component of the rhizosphere paved the way for future studies on the selection of common bacteria across stations to improve the restocking of new A. eriantha plants in natural environments. Therefore, these results demonstrated how the study of genetic diversity is useful not only as an ecological and geographic approach, but also as an application for the protection of plant species of interest.

Supplementary Materials

The following supporting information can be downloaded at: https://www.mdpi.com/article/10.3390/su141811405/s1, Figure S1: DeltaK values over 10 runs for increasing K-values, from 2 to 10. The highest peaks of DeltaK are at K = 2, K = 3 and K = 5.; Table S1: Nei’s Genetic Identity (above diagonal) and Genetic Distance (below diagonal) values among the three population of A. eriantha ((MF = Monte Focalone; MC = Monte Corvo; MP = Monte Portella); Table S2: Number of observations (in bold) and percent (in italics) of correctly classified individuals.

Author Contributions

Conceptualization, L.P. and L.R.; methodology, M.P. and G.M.; software, L.R. and G.M.; validation, M.P. and N.F.; formal analysis, B.F. and L.R.; investigation, B.F. and M.P.; resources, L.P. and L.R.; data curation, M.P. and G.M.; writing—original draft preparation, B.F., M.P. and N.F.; writing—review and editing, L.P. and L.R.; visualization, B.F. and G.M.; supervision, L.P. and L.R. All authors have read and agreed to the published version of the manuscript.

Funding

This research was funded by the University of Perugia and University of L’Aquila.

Institutional Review Board Statement

Not applicable.

Informed Consent Statement

Not applicable.

Data Availability Statement

The datasets generated during and/or analyzed during the current study are available from the corresponding author on reasonable request.

Acknowledgments

We thank Gran Sasso and Monti della Laga National Park, Majella National Park, and Reparto Carabinieri Biodiversità of L’Aquila for sampling permissions and the provision of samples.

Conflicts of Interest

The authors declare no conflict of interest.

References

  1. Ling, Y.R. On the System of the Genus Artemisia L. and the Relationship with Its Allies. Bull. Bot. Res. 1982, 2, 1–60. [Google Scholar]
  2. Wang, W.-M. On the Origin and Development of Artemisia (Asteraceae) in the Geological Past. Bot. J. Linn. Soc. 2004, 145, 331–336. [Google Scholar] [CrossRef]
  3. Graham, A. A Contribution to the Geological History of the Compositae. In Proceedings of the Kew International Compositae Conference 1994; Hind, D., Beentje, H., Eds.; Royal Botanic Gardens, Kew: London, UK, 1996; pp. 123–140. [Google Scholar]
  4. Yunfa, M.; Qingquan, M.; Xiaomin, F.; Xiaoli, Y.; Fuli, W.; Chunhui, S. Origin and Development of Artemisia (Asteraceae) in Asia and Its Implications for the Uplift History of the Tibetan Plateau: A Review. Quat. Int. 2011, 236, 3–12. [Google Scholar] [CrossRef]
  5. Weiss-Schneeweiss, H.; Emadzade, K.; Jang, T.-S.; Schneeweiss, G.M. Evolutionary Consequences, Constraints and Potential of Polyploidy in Plants. Cytogenet. Genome Res. 2013, 140, 137–150. [Google Scholar] [CrossRef] [PubMed]
  6. Otto, S.P.; Whitton, J. Polyploid Incidence and Evolution. Annu. Rev. Genet. 2000, 34, 401–437. [Google Scholar] [CrossRef] [PubMed]
  7. de Storme, N.; Mason, A. Plant Speciation through Chromosome Instability and Ploidy Change: Cellular Mechanisms, Molecular Factors and Evolutionary Relevance. Curr. Plant Biol. 2014, 1, 10–33. [Google Scholar] [CrossRef]
  8. Pellicer, J.; Garcia, S.; Canela, M.Á.; Garnatje, T.; Korobkov, A.A.; Twibell, J.D.; Vallès, J. Genome Size Dynamics in Artemisia L. (Asteraceae): Following the Track of Polyploidy. Plant Biol. 2010, 12, 820–830. [Google Scholar] [CrossRef]
  9. Brañas, M.O.; Xirau, J.V. Karyological Studies in Some Taxa of the Genus Artemisia (Asteraceae). Can. J. Bot. 1994, 72, 1126–1135. [Google Scholar] [CrossRef]
  10. Vallès, J.; McArthur, E.D. Artemisia Systematics and Phylogeny: Cytogenetic and Molecular Insights. In Shrubland Ecosystem Genetics and Biodiversity: Proceedings; McArthur, E.D., Fairbanks, D.J., Eds.; Department of Agriculture, Forest Service, Rocky Mountain Research Station: Ogden, UT, USA, 2001; pp. 67–74. [Google Scholar]
  11. Vallès, J.; Garnatje, T.; Garcia, S.; Sanz, M.; Korobkov, A.A. Chromosome Numbers in the Tribes Anthemideae and Inuleae (Asteraceae). Bot. J. Linn. Soc. 2005, 148, 77–85. [Google Scholar] [CrossRef]
  12. McArthur, E.D.; Sanderson, S.C. Cytogeography and Chromosome Evolution of Subgenus Tridentatae of Artemisia (Asteraceae). Am. J. Bot. 1999, 86, 1754–1775. [Google Scholar] [CrossRef]
  13. Xirau, J.V.; Siljak-Yakovlev, S. Cytogenetic Studies in the Genus Artemisia L. (Asteraceae): Fluorochrome-Banded Karyotypes of Five Taxa, Including the Iberian Endemic Species Artemisia Barrelieri Besser. Can. J. Bot. 1997, 75, 595–606. [Google Scholar] [CrossRef]
  14. Sanz, M.; Schönswetter, P.; Vallès, J.; Schneeweiss, G.M.; Vilatersana, R. Southern Isolation and Northern Long-Distance Dispersal Shaped the Phylogeography of the Widespread, but Highly Disjunct, European High Mountain Plant Artemisia Eriantha (Asteraceae). Bot. J. Linn. Soc. 2014, 174, 214–226. [Google Scholar] [CrossRef]
  15. Pace, L.; Pellegrini, M.; Pannunzio, G.; Pirone, G. First Report of Fasciation Symptom in Artemisia Eriantha (Asteraceae), a Typical Orophyte of High-Altitude Cliffs, in Central Apennines (Italy). Plant Sociol. 2020, 57, 23–28. [Google Scholar] [CrossRef]
  16. Mucciarelli, M.; Maffei, M. Artemisia. In troduction to the Genus. In Artemisia; Wright, C.W., Ed.; Taylor & Francis: London, UK; New York, NY, USA, 2002; pp. 1–50. [Google Scholar]
  17. Reale, S.; Pace, L.; D’Archivio, A.A.; de Angelis, F.; Marcozzi, G. Volatiles Fingerprint of Artemisia Umbelliformis Subsp. Eriantha by Headspace-Solid Phase Microextraction GC–MS. Nat. Prod. Res. 2014, 28, 61–66. [Google Scholar] [CrossRef]
  18. Skowyra, M.; Gallego, M.; Segovia, F.; Almajano, M. Antioxidant Properties of Artemisia Annua Extracts in Model Food Emulsions. Antioxidants 2014, 3, 116–128. [Google Scholar] [CrossRef]
  19. Melguizo-Melguizo, D.; Diaz-de-Cerio, E.; Quirantes-Piné, R.; Švarc-Gajić, J.; Segura-Carretero, A. The Potential of Artemisia Vulgaris Leaves as a Source of Antioxidant Phenolic Compounds. J. Funct. Foods 2014, 10, 192–200. [Google Scholar] [CrossRef]
  20. Nguyen, H.T.T.; Nguyen, H.T.; Islam, M.Z.; Obi, T.; Pothinuch, P.; Zar, P.P.K.; Hou, D.X.; Van Nguyen, T.; Nguyen, T.M.; Van Dao, C.; et al. Pharmacological Characteristics of Artemisia Vulgaris L. in Isolated Porcine Basilar Artery. J. Ethnopharmacol. 2016, 182, 16–26. [Google Scholar] [CrossRef]
  21. Martins, A.; Mignon, R.; Bastos, M.; Batista, D.; Neng, N.R.; Nogueira, J.M.F.; Vizetto-Duarte, C.; Custódio, L.; Varela, J.; Rauter, A.P. In Vitro Antitumoral Activity of Compounds Isolated from Artemisia Gorgonum Webb. Phytother. Res. 2014, 28, 1329–1334. [Google Scholar] [CrossRef]
  22. Afsar, S.K.; Rajesh Kumar, K.; Venu Gopal, J.; Raveesha, P. Assessment of Anti-Inflammatory Activity of Artemisia Vulgaris Leaves by Cotton Pellet Granuloma Method in Wistar Albino Rats. J. Pharm. Res. 2013, 7, 463–467. [Google Scholar] [CrossRef]
  23. Corrêa-Ferreira, M.L.; Verdan, M.H.; dos Reis Lívero, F.A.; Galuppo, L.F.; Telles, J.E.Q.; Alves Stefanello, M.É.; Acco, A.; de Oliveira Petkowicz, C.L. Inulin-Type Fructan and Infusion of Artemisia Vulgaris Protect the Liver against Carbon Tetrachloride-Induced Liver Injury. Phytomedicine 2017, 24, 68–76. [Google Scholar] [CrossRef]
  24. Sefi, M.; Fetoui, H.; Makni, M.; Zeghal, N. Mitigating Effects of Antioxidant Properties of Artemisia Campestris Leaf Extract on Hyperlipidemia, Advanced Glycation End Products and Oxidative Stress in Alloxan-Induced Diabetic Rats. Food Chem. Toxicol. 2010, 48, 1986–1993. [Google Scholar] [CrossRef]
  25. El-Tantawy, W.H. Biochemical Effects, Hypolipidemic and Anti-Inflammatory Activities of Artemisia Vulgaris Extract in Hypercholesterolemic Rats. J. Clin. Biochem. Nutr. 2015, 57, 33–38. [Google Scholar] [CrossRef]
  26. Pace, L.; Pellegrini, M.; Palmieri, S.; Rocchi, R.; Lippa, L.; del Gallo, M. Plant Growth-Promoting Rhizobacteria for in Vitro and Ex Vitro Performance Enhancement of Apennines’ Genepì (Artemisia Umbelliformis Subsp. Eriantha), an Endangered Phytotherapeutic Plant. Vitr. Cell. Dev. Biol.-Plant 2020, 56, 134–142. [Google Scholar] [CrossRef]
  27. Khela, S. Artemisia Umbelliformis. IUCN Red List. Threat. Species 2013, 2013, e.T202935A2758111. [Google Scholar]
  28. Adorni, M.; Ansaldi, M.; Ardenghi, N.M.G.; Armiraglio, S.; Bacchetta, G.; Bagella, S.; Bedini, G.; Bertani, G.; Bona, E.; Bonali, F. Schede per Una Lista Rossa Della Flora Vascolare e Crittogamica Italiana. Inf. Bot. Ital. 2013, 45, 115–193. [Google Scholar]
  29. Pieroni, A.; Giusti, M.E. Alpine Ethnobotany in Italy: Traditional Knowledge of Gastronomic and Medicinal Plants among the Occitans of the Upper Varaita Valley, Piedmont. J. Ethnobiol. Ethnomed. 2009, 5, 32. [Google Scholar] [CrossRef]
  30. Wu, W.-D.; Liu, W.-H.; Sun, M.; Zhou, J.-Q.; Liu, W.; Zhang, C.-L.; Zhang, X.-Q.; Peng, Y.; Huang, L.-K.; Ma, X. Genetic Diversity and Structure of Elymus Tangutorum Accessions from Western China as Unraveled by AFLP Markers. Hereditas 2019, 156, 8. [Google Scholar] [CrossRef]
  31. Coates, D.J.; Byrne, M.; Moritz, C. Genetic Diversity and Conservation Units: Dealing with the Species-Population Continuum in the Age of Genomics. Front. Ecol. Evol. 2018, 6, 165. [Google Scholar] [CrossRef]
  32. Garrido-Cardenas, J.A.; Mesa-Valle, C.; Manzano-Agugliaro, F. Trends in Plant Research Using Molecular Markers. Planta 2018, 247, 543–557. [Google Scholar] [CrossRef]
  33. Paun, O.; Schönswetter, P. Amplified Fragment Length Polymorphism: An Invaluable Fingerprinting Technique for Genomic, Transcriptomic, and Epigenetic Studies. Methods Mol. Biol. 2012, 862, 75–87. [Google Scholar] [CrossRef]
  34. Ling, N.; Wang, T.; Kuzyakov, Y. Rhizosphere Bacteriome Structure and Functions. Nat. Commun. 2022, 13, 836. [Google Scholar] [CrossRef] [PubMed]
  35. Xun, W.; Shao, J.; Shen, Q.; Zhang, R. Rhizosphere Microbiome: Functional Compensatory Assembly for Plant Fitness. Comput. Struct. Biotechnol. J. 2021, 19, 5487–5493. [Google Scholar] [CrossRef] [PubMed]
  36. Ortiz, A.; Sansinenea, E. The Role of Beneficial Microorganisms in Soil Quality and Plant Health. Sustainability 2022, 14, 5358. [Google Scholar] [CrossRef]
  37. Sanon, A.; Andrianjaka, Z.N.; Prin, Y.; Bally, R.; Thioulouse, J.; Comte, G.; Duponnois, R. Rhizosphere Microbiota Interfers with Plant-Plant Interactions. Plant Soil 2009, 321, 259–278. [Google Scholar] [CrossRef]
  38. Basu, A.; Prasad, P.; Das, S.N.; Kalam, S.; Sayyed, R.Z.; Reddy, M.S.; el Enshasy, H. Plant Growth Promoting Rhizobacteria (PGPR) as Green Bioinoculants: Recent Developments, Constraints, and Prospects. Sustainability 2021, 13, 1140. [Google Scholar] [CrossRef]
  39. Vos, P.; Hogers, R.; Bleeker, M.; Reijans, M.; Van De Lee, T.; Hornes, M.; Friters, A.; Pot, J.; Paleman, J.; Kuiper, M.; et al. AFLP: A New Technique for DNA Fingerprinting. Nucleic Acids Res. 1995, 23, 4407–4414. [Google Scholar] [CrossRef]
  40. Cnops, G.; den Boer, B.; Gerats, A.; van Montagu, M.; Lijsebettens, M. van Chromosome Landing at the Arabidopsis TORNADO1 Locus Using an AFLP-Based Strategy. Mol. Gen. Genet. 1996, 253, 32–41. [Google Scholar] [CrossRef]
  41. Mizrahi-Man, O.; Davenport, E.R.; Gilad, Y. Taxonomic Classification of Bacterial 16S RRNA Genes Using Short Sequencing Reads: Evaluation of Effective Study Designs. PLoS ONE 2013, 8, e53608. [Google Scholar] [CrossRef]
  42. Vaccarelli, I.; Matteucci, F.; Pellegrini, M.; Bellatreccia, F.; del Gallo, M. Exploring Microbial Biosignatures in Mn-Deposits of Deep Biosphere: A Preliminary Cross-Disciplinary Approach to Investigate Geomicrobiological Interactions in a Cave in Central Italy. Front. Earth Sci. 2021, 9, 590257. [Google Scholar] [CrossRef]
  43. Bolyen, E.; Rideout, J.R.; Dillon, M.R.; Bokulich, N.A.; Abnet, C.C.; Al-Ghalith, G.A.; Alexander, H.; Alm, E.J.; Arumugam, M.; Asnicar, F.; et al. Reproducible, Interactive, Scalable and Extensible Microbiome Data Science Using QIIME 2. Nat. Biotechnol. 2019, 37, 852–857. [Google Scholar] [CrossRef]
  44. Peakall, R.; Smouse, P.E. GenAlEx 6.5: Genetic Analysis in Excel. Population Genetic Software for Teaching and Research—An Update. Bioinformatics 2012, 28, 2537–2539. [Google Scholar] [CrossRef] [PubMed]
  45. Huff, D.R.; Peakall, R.; Smouse, P.E. RAPD Variation within and among Natural Populations of Outcrossing Buffalograss [Buchloë Dactyloides (Nutt.) Engelm.]. Theor. Appl. Genet. 1993, 86, 927–934. [Google Scholar] [CrossRef] [PubMed]
  46. Hammer, Ø.; Harper, D.A.T.; Ryan, P.D. PAST: Paleontological Statistics Software Package for Education and Data Analysis. Palaeontol. Electron. 2001, 4, 9. [Google Scholar]
  47. Rosenblatt, M. Remarks on Some Nonparametric Estimates of a Density Function. Ann. Math. Stat. 1956, 27, 832–837. [Google Scholar] [CrossRef]
  48. Parzen, E. On Estimation of a Probability Density Function and Mode. Ann. Math. Stat. 1962, 33, 1065–1076. [Google Scholar] [CrossRef]
  49. SAS Institute. SAS/STAT User’s Guide, Version 8; SAS Institute Inc.: Cary, NC, USA, 1999. [Google Scholar]
  50. Pritchard, J.K.; Stephens, M.; Donnelly, P. Inference of Population Structure Using Multilocus Genotype Data. Genetics 2000, 155, 945–959. [Google Scholar] [CrossRef]
  51. Evanno, G.; Regnaut, S.; Goudet, J. Detecting the Number of Clusters of Individuals Using the Software Structure: A Simulation Study. Mol. Ecol. 2005, 14, 2611–2620. [Google Scholar] [CrossRef]
  52. Earl, D.A.; VonHoldt, B.M. STRUCTURE HARVESTER: A Website and Program for Visualizing STRUCTURE Output and Implementing the Evanno Method. Conserv. Genet. Resour. 2012, 4, 359–361. [Google Scholar] [CrossRef]
  53. Bahrndorff, S.; Alemu, T.; Alemneh, T.; Lund Nielsen, J. The Microbiome of Animals: Implications for Conservation Biology. Int. J. Genom. 2016, 2016, 1–7. [Google Scholar] [CrossRef]
  54. Blekhman, R.; Goodrich, J.K.; Huang, K.; Sun, Q.; Bukowski, R.; Bell, J.T.; Spector, T.D.; Keinan, A.; Ley, R.E.; Gevers, D.; et al. Host Genetic Variation Impacts Microbiome Composition across Human Body Sites. Genome Biol. 2015, 16, 191. [Google Scholar] [CrossRef]
  55. Kinross, J.M.; Darzi, A.W.; Nicholson, J.K. Gut Microbiome-Host Interactions in Health and Disease. Genome Med. 2011, 3, 14. [Google Scholar] [CrossRef] [PubMed]
  56. Western, D. Human-Modified Ecosystems and Future Evolution. Proc. Natl. Acad. Sci. USA 2001, 98, 5458–5465. [Google Scholar] [CrossRef] [PubMed]
  57. Sergaki, C.; Lagunas, B.; Lidbury, I.; Gifford, M.L.; Schäfer, P. Challenges and Approaches in Microbiome Research: From Fundamental to Applied. Front. Plant Sci. 2018, 9, 1205. [Google Scholar] [CrossRef] [PubMed]
  58. Saeed, S. A Review on Genetic Diversity of Wild Plants by Using Different Genetic Markers. Pure Appl. Biol. 2012, 1, 68–71. [Google Scholar] [CrossRef]
  59. Rundle, H.D.; Nosil, P. Ecological Speciation. Ecol. Lett. 2005, 8, 336–352. [Google Scholar] [CrossRef]
  60. Wang, I.J.; Bradburd, G.S. Isolation by Environment. Mol. Ecol. 2014, 23, 5649–5662. [Google Scholar] [CrossRef]
  61. de Kort, H.; Prunier, J.G.; Ducatez, S.; Honnay, O.; Baguette, M.; Stevens, V.M.; Blanchet, S. Life History, Climate and Biogeography Interactively Affect Worldwide Genetic Diversity of Plant and Animal Populations. Nat. Commun. 2021, 12, 516. [Google Scholar] [CrossRef]
  62. Hu, Y.; Wang, L.; Xie, X.; Yang, J.; Li, Y.; Zhang, H. Genetic Diversity of Wild Populations of Rheum Tanguticum Endemic to China as Revealed by ISSR Analysis. Biochem. Syst. Ecol. 2010, 38, 264–274. [Google Scholar] [CrossRef]
  63. Elmeer, K.; Elkhgkheg, A. Genetic Diversity of Artemisia Herba-Alba in Libyan Green Mountain. Iran. J. Sci. Technol. Trans. A Sci. 2019, 43, 1507–1512. [Google Scholar] [CrossRef]
  64. Shafie, M.S.B.; Hasan, S.M.Z.; Shah, R.M. Study of Genetic Variability of Wormwood Capillary (Artemisia Capillaris) Using Inter Simple Sequence Repeat (ISSR) in Pahang Region, Malaysia. Plant Omics 2009, 2, 127. [Google Scholar]
  65. Badr, A.; El-Shazly, H.H.; Helail, N.S.; Ghanim, W. el Genetic Diversity of Artemisia Populations in Central and North Saudi Arabia Based on Morphological Variation and RAPD Polymorphism. Plant Syst. Evol. 2012, 298, 871–886. [Google Scholar] [CrossRef]
  66. Baetz, U.; Martinoia, E. Root Exudates: The Hidden Part of Plant Defense. Trends Plant Sci. 2014, 19, 90–98. [Google Scholar] [CrossRef] [PubMed]
  67. Glick, B.R.; Gamalero, E. Recent Developments in the Study of Plant Microbiomes. Microorganisms 2021, 9, 1533. [Google Scholar] [CrossRef] [PubMed]
  68. Bulgarelli, D.; Schlaeppi, K.; Spaepen, S.; van Themaat, E.V.L.; Schulze-Lefert, P. Structure and Functions of the Bacterial Microbiota of Plants. Annu. Rev. Plant Biol. 2013, 64, 807–838. [Google Scholar] [CrossRef] [PubMed]
  69. Peiffer, J.A.; Spor, A.; Koren, O.; Jin, Z.; Tringe, S.G.; Dangl, J.L.; Buckler, E.S.; Ley, R.E. Diversity and Heritability of the Maize Rhizosphere Microbiome under Field Conditions. Proc. Natl. Acad. Sci. USA 2013, 110, 6548–6553. [Google Scholar] [CrossRef] [Green Version]
  70. Bouffaud, M.-L.; Poirier, M.-A.; Muller, D.; Moënne-Loccoz, Y. Root Microbiome Relates to Plant Host Evolution in Maize and Other Poaceae. Environ. Microbiol. 2014, 16, 2804–2814. [Google Scholar] [CrossRef]
  71. Szoboszlay, M.; Lambers, J.; Chappell, J.; Kupper, J.V.; Moe, L.A.; McNear, D.H. Comparison of Root System Architecture and Rhizosphere Microbial Communities of Balsas Teosinte and Domesticated Corn Cultivars. Soil Biol. Biochem. 2015, 80, 34–44. [Google Scholar] [CrossRef]
  72. Lundberg, D.S.; Lebeis, S.L.; Paredes, S.H.; Yourstone, S.; Gehring, J.; Malfatti, S.; Tremblay, J.; Engelbrektson, A.; Kunin, V.; del Rio, T.G.; et al. Defining the Core Arabidopsis Thaliana Root Microbiome. Nature 2012, 488, 86–90. [Google Scholar] [CrossRef]
  73. Bulgarelli, D.; Rott, M.; Schlaeppi, K.; ver Loren van Themaat, E.; Ahmadinejad, N.; Assenza, F.; Rauf, P.; Huettel, B.; Reinhardt, R.; Schmelzer, E.; et al. Revealing Structure and Assembly Cues for Arabidopsis Root-Inhabiting Bacterial Microbiota. Nature 2012, 488, 91–95. [Google Scholar] [CrossRef]
  74. Fierer, N.; Jackson, R.B. The Diversity and Biogeography of Soil Bacterial Communities. Proc. Natl. Acad. Sci. USA 2006, 103, 626–631. [Google Scholar] [CrossRef]
  75. Fudou, R.; Jojima, Y.; Iizuka, T.; Yamanaka, S. Haliangium Ochraceum Gen. Nov., Sp. Nov. and Haliangium Tepidum Sp. Nov.: Novel Moderately Halophilic Myxobacteria Isolated from Coastal Saline Environments. J. Gen. Appl. Microbiol. 2002, 48, 109–115. [Google Scholar] [CrossRef] [PubMed]
  76. Yan, S.; Zhao, J.; Ren, T.; Liu, G. Correlation between Soil Microbial Communities and Tobacco Aroma in the Presence of Different Fertilizers. Ind. Crops Prod. 2020, 151, 112454. [Google Scholar] [CrossRef]
  77. Qiu, M.; Zhang, R.; Xue, C.; Zhang, S.; Li, S.; Zhang, N.; Shen, Q. Application of Bio-Organic Fertilizer Can Control Fusarium Wilt of Cucumber Plants by Regulating Microbial Community of Rhizosphere Soil. Biol. Fertil. Soils 2012, 48, 807–816. [Google Scholar] [CrossRef]
  78. Olanrewaju, O.S.; Babalola, O.O. Streptomyces: Implications and Interactions in Plant Growth Promotion. Appl. Microbiol. Biotechnol. 2019, 103, 1179–1188. [Google Scholar] [CrossRef] [PubMed]
  79. Oberhofer, M.; Hess, J.; Leutgeb, M.; Gössnitzer, F.; Rattei, T.; Wawrosch, C.; Zotchev, S.B. Exploring Actinobacteria Associated With Rhizosphere and Endosphere of the Native Alpine Medicinal Plant Leontopodium Nivale Subspecies Alpinum. Front. Microbiol. 2019, 10, 2531. [Google Scholar] [CrossRef]
  80. Wei, L.; Ouyang, S.; Wang, Y.; Shen, X.; Zhang, L. Solirubrobacter Phytolaccae Sp. Nov., an Endophytic Bacterium Isolated from Roots of Phytolacca Acinosa Roxb. Int. J. Syst. Evol. Microbiol. 2014, 64, 858–862. [Google Scholar] [CrossRef]
  81. Farda, B.; Djebaili, R.; Vaccarelli, I.; del Gallo, M.; Pellegrini, M. Actinomycetes from Caves: An Overview of Their Diversity, Biotechnological Properties, and Insights for Their Use in Soil Environments. Microorganisms 2022, 10, 453. [Google Scholar] [CrossRef]
  82. Dutta, S.; Na, C.S.; Lee, Y.H. Features of Bacterial Microbiota in the Wild Habitat of Pulsatilla Tongkangensis, the Endangered “Long-Sepal Donggang Pasque-Flower Plant,” Endemic to Karst Topography of Korea. Front. Microbiol. 2021, 12, 656105. [Google Scholar] [CrossRef]
  83. Backer, R.; Rokem, J.S.; Ilangumaran, G.; Lamont, J.; Praslickova, D.; Ricci, E.; Subramanian, S.; Smith, D.L. Plant Growth-Promoting Rhizobacteria: Context, Mechanisms of Action, and Roadmap to Commercialization of Biostimulants for Sustainable Agriculture. Front. Plant Sci. 2018, 9, 1473. [Google Scholar] [CrossRef] [Green Version]
Figure 1. Dendrogram of Ward’s clustering method of the three populations (MF = Monte Focalone in red color; MC = Monte Corvo in blue; and MP = Monte Portella in green).
Sustainability 14 11405 g001
Figure 2. STRUCTURE classification at K = 2 (a), K = 3 (b), and K = 5 (c) of the 118 plant samples of A. eriantha from Monte Corvo (MC), Monte Focalone (MF), and Monte Portella (MP). The different colors in each bar are consistent with those of Figure 1.
Sustainability 14 11405 g002
Figure 3. Scores of 118 individuals of A. eriantha from Monte Corvo (blue), Monte Focalone (red), and Monte Portella (green) obtained after the canonical discriminant analysis (Can1 = canonical function 1, 59%; Can2 = canonical function 2, 4%).
Sustainability 14 11405 g003
Figure 4. Taxonomy barplot of ASVs at the phylum level. The relative abundance of ASV samples at the phylum level is given in the stacked column. The legend of colors is provided in the box on the right.
Sustainability 14 11405 g004
Figure 5. Taxonomy barplot of ASVs at the genus level. The relative abundance of ASV samples at the phylum level is given in the stacked column. The legend of colors is provided in the box on the right.
Sustainability 14 11405 g005
Figure 6. Heatmap of the main genera found in the samples. The upper clusterization shows the sample distribution according to taxa presence/absence and abundances. The heatmap was realized based on a resemblance matrix (analysis between variables and measure of the index of association) and hierarchical cluster analysis (group average cluster mode). Color (spectrum shading from black to white) and depth of shading (0–4) indicates the genera abundances transformed in Log(X+1) to display the contribution of each taxon in the analysis.
Sustainability 14 11405 g006
Table 1. AFLP primer combinations used in assessing the genetic variability of A. eriantha.
Primer Combination *Total FragmentsPolymorphic Fragments
M+AGC/E+CCA139128
M+AAC/E+CCA126119
M+AGA/E+CAG143137
M+ACG/E+CAC138132
M+AGA/E+CTG128119
M+ACG/E+CAA142132
Total816767
* M+3/E+3: 5′-GACGATGAGTCCTGAGTAG+NNN-3′/5′-AGACTGCGTACCAATTC+NNN-3′.
Table 2. Diversity indices calculated on 16S rRNA gene metabarcoding results through PAST.
Richness (ASV Level)Shannon H′Eveness e^H/SChao-1
Monte Focalone77135.570.59446.4
Monte Corvo64865.750.70445
Monte Portella36715.320.74275
Publisher’s Note: MDPI stays neutral with regard to jurisdictional claims in published maps and institutional affiliations.

