Article

The Impact of High-Speed Railway Opening on Regional Economic Growth: The Case of the Wuhan–Guangzhou High-Speed Railway Line

1
School of Advanced Manufacturing, Fuzhou University, Jinjiang 362251, China
2
School of Economics and Management, Tongji University, Shanghai 200092, China
3
North-China Company, Sinopec Chemical Commercial Holding Company Limited, Beijing 100029, China
*
Authors to whom correspondence should be addressed.
Sustainability 2022, 14(18), 11390; https://doi.org/10.3390/su141811390
Submission received: 30 July 2022 / Revised: 3 September 2022 / Accepted: 7 September 2022 / Published: 10 September 2022

Abstract

:
With the advent of the “ear of high-speed railways”, the space–time distance between cities has drastically decreased. The opening of high-speed railways has not only increased the factor-flow speed across regions, but has also reduced the cost of factor movement. However, there is some controversy about whether high-speed railways can be used to promote regional economic growth. The Wuhan–Guangzhou high-speed railway is the earliest section of the Beijing–Guangzhou high-speed railway, and it was the first high-speed railway in China with a real speed of 350 km per hour. The Wuhan–Guangzhou high-speed railway opening spawned a three-hour economic circle in the south of China, injected new vitality into the economic and social development along the line, and had an important impact on accelerating regional economic interoperability and integration. Taking this into account, this paper took the Wuhan–Guangzhou high-speed railway as the case study. Firstly, this paper used the theory of system dynamics to analyze the mechanism of the impact of high-speed railway opening on regional economic growth. Secondly, the accessibility model was used to analyze the impact of the high-speed railway opening on the accessibility of cities along the line, and a difference-in-differences model (DID) was used to explore the impact of the high-speed railway opening on regional economic growth. Finally, on the basis of the analysis of the previous mechanism, the mechanism of the impact of the high-speed railway on regional economic growth is discussed. The results of this study show the following: (1) Since the opening of the high-speed railway, the accessibility of cities along the line has grown by more than 60%. (2) The opening of the high-speed railway has promoted regional economic growth, mainly through the influence mechanism of “increasing the total cargo volume”. This study not only scientifically and quantitatively analyzed the impact of the opening of high-speed rail on regional economic growth, taking the Wuhan–Guangzhou high-speed railway as an example for empirical analysis, but also further summarized the high-speed railway construction achievements in China and provides reference experience for planning the opening of high-speed railways.

1. Introduction

As a foundation for national economic development, every change in transportation infrastructure contributes significantly to economic growth [1]. Before the birth of high-speed rail (hereinafter referred to as HSR), the four major transportation systems, including waterway transportation, air transportation, railway transportation, and road transportation, had a clear division of labor and complementary advantages. Additionally, since the birth of HSR, it has become an important long-distance transport tool because of its security, comfort, efficiency, and applicability. Moreover, compared to traditional roads and railways, HSR is more energy-efficient and respectful of the environment. The results from Lin et al. showed that the expansion of China’s HSR network between 2008 and 2016 reduced annual greenhouse gas emissions by 14.758 million tons of carbon dioxide [2]. In 2003, China officially opened the first dedicated passenger line, the Qinhuangdao–Shenyang railway, which allowed China to gradually enter the “high-speed railway era”. In 2008, China officially opened the first HSR with full intellectual property rights and a speed of 350 km per hour, the Beijing–Tianjin HSR, which was the first HSR in the real sense of China. Since then, China’s HSR construction has entered an accelerated period [3]. By the end of 2021, the total mileage of China’s high-speed railway operations exceeded 40,000 km, exceeding two-thirds of the world’s total HSR mileage [4]. The opening of HSR has had an impact on the cities along the line, promoting the formation of a higher-quality economic geography pattern. Specifically, HSR runs at two to three times the speed of traditional railroads, which greatly reduces people’s travel time and has an important impact on the regional economy. Therefore, the opening of HSR will have an impact on the accessibility of cities along the line and the regional economy, regardless of whether this impact is positive or negative. Academics have paid a great deal of attention to the above issues and have conducted research on various aspects. Ahlfeldt and Feddersen argued that the opening of HSR has brought economic activities closer together and effectively improved accessibility between regions [5]. Kim analyzed the impact of the opening of HSR on regional economic inequalities in Korea. The results showed that the new HSR connections from less developed regions to the capital region with pre-developed HSR lines have led to regional economic development inequalities. However, regional differences may decrease due to increased inter-regional mobility of labor and capital [6]. Cascetta studied the impact of HSR on accessibility and regional economic growth in Italy. The results of the study showed that the opening of HSR has increased accessibility by 32% and has contributed to regional economic growth [7]. The above studies provide a better research basis and insight for examining the impact of the opening of HSR on regional economic growth.
The Wuhan–Guangzhou Passenger Dedicated Line is referred to as the Wuhan–Guangzhou HSR. In the early years of China’s HSR network, the Wuhan–Guangzhou HSR was one of the “four columns”. On 26 December 2009, the Wuhan–Guangzhou HSR officially opened for operation. The Wuhan–Guangzhou HSR opening marks the point when China’s HSR was put into operation, and China’s HSR construction has since entered a new era. The Wuhan–Guangzhou HSR starts in Wuhan and ends in Guangzhou, with a total length of 1069 km and 15 stations. The Wuhan–Guangzhou HSR line passes through the Wuhan city circle, the Chang Zhu Tan city circle, and the Pearl River Delta city cluster. In terms of fares, compared to air passenger transport, Wuhan–Guangzhou HSR fares only cost 50% of daily airfares. At the same time, with the increasing disposable income of the residents, most of them can afford the fare of the Wuhan–Guangzhou HSR [8]. This has allowed the opening of the Wuhan–Guangzhou HSR to accelerate the flow of talents and other factors between cities, strengthen the connections between cities, and promote further economic development [9]. In 2021, according to the relevant statistics of the National Bureau of Statistics, the regional GDP of the Wuhan city circle was approximately 441.369 billion USD, the regional GDP of the Chang Zhu Tan city circle was approximately 282.1 billion USD, and the regional GDP of the Pearl River Delta city cluster exceeded approximately 1.46 trillion USD. Based on this, the Wuhan–Guangzhou HSR has an important representative value for studying the impact of the opening of HSR on regional economic growth. At present, a few scholars have taken the Wuhan–Guangzhou HSR as an example to study the impact of the opening of the HSR on regional economic growth. For example, Lai used the Granger causality test model to analyze the causal relationship between the opening of HSR and the regional economic aggregate, and on this basis, he explored the impact of the opening of HSR on industrial structure and three industries, taking the Wuhan–Guangzhou HSR as an example for empirical testing [10]. Yu et al. used a synthetic control method to analyze the impact of the HSR on the economic growth of county-level regions with different economic bases, and the research results showed that the Wuhan–Guangzhou HSR opening has had a significant effect on the economic growth of Chibi City, which has a good economic foundation [11]. Based on the above background, on the basis of the existing research, this paper chose the Wuhan–Guangzhou HSR as an example to discuss the impact of the opening of HSR on regional economic growth. The marginal contribution of this paper lies in three main aspects: Firstly, in terms of the research content, this paper explored the impact of the opening of HSR on regional economic growth and used the Wuhan–Guangzhou HSR as an example for empirical testing. This not only enriches the existing research on the impact of the opening of HSR on regional economic growth and better summarizes the Wuhan–Guangzhou HSR construction results, but also provides a relevant theoretical basis for promoting the coordinated development of the opening of HSR and regional economic growth. Secondly, in terms of the research methodology, system-dynamics-related research theories were used to study the influence mechanism of the opening of the HSR on regional economic growth, and Vensim software was used to draw a causality diagram, which is better able to reflect the relationship between variables more intuitively and provides a good theoretical basis for the following research hypothesis. In addition, a DID model was chosen for the empirical study, which can effectively overcome the endogeneity problem caused by omitted variables and bring the policy treatment effect closer to reality. Finally, in terms of the measurement tools, this paper selected Stata13 combined with GIS to conduct the measurement analysis, which can more effectively reflect the impact of the opening of the HSR on regional economic growth.

2. Literature Review and Hypothesis Formulation

2.1. The Impact of the Opening of HSR on Regional Economic Growth

The impact of the opening of HSR on regional economic growth is mainly manifested in two aspects: the impact of the opening of HSR on regional economic growth, and the impact of the opening of HSR on regional economic growth imbalance.
There are currently different arguments on whether the impact of the opening of HSR on regional economic growth is positive or negative. Most research findings are optimistic about the impact of the opening of HSR on regional economic growth. The opening of HSR has improved regional accessibility and brought economic agents closer together due to improved transportation [5], which in turn has promoted regional economic growth. For example, Kim conducted research on HSR in Japan and Europe. The results showed that the opening of HSR has improved regional accessibility and changed residents’ living and travel patterns to a certain extent, thus, promoting economic growth [12]. The opening of HSR has expanded the “point-axis” spatial consumption pattern into a “grid” pattern, created new consumption corridors along high-speed railway lines, and thus promoted economic growth [13]. The opening of HSR promotes GDP growth and enhances employment levels, industrial development, etc., which in turn promotes regional economic growth [14,15,16]. The opening of HSR accelerates the movement of labor factors and brings with it production factors, such as knowledge and technology. This further promotes the high-quality development of enterprises, which brings more economic benefits to them and, to some extent, promotes regional economic development [17]. The opening of HSR facilitates the flow of innovation factors in cities along the line, which in turn helps to increase green innovation [18], which contributes to sustainable development and enhances awareness of environmental protection, thereby boosting regional economic growth [19]. Conversely, some studies believe that the opening of HSR has had a negative impact on regional economic growth. Gao et al. used county-level panel data from the Yangtze River Delta in China to study the impact of the opening of HSR on the local economy, and the results showed that the opening of HSR has caused the population to shift from the peripheral areas to the core areas, along with related industries. This is detrimental to the development of the peripheral regions and has brought negative effects to the regional economic growth in general [20]. Qin took 957 counties in China as the study objects and assessed the impact of the opening of HSR on economic growth in 2004 and 2007 [21]. The research results showed that the opening of HSR led to an average reduction of 3–5% in the GDP and per capita GDP. The main reason is that the opening of HSR reduced transportation costs, which in turn has caused more economic activities to transfer to core areas. Roger studied the relationship between the opening of HSR and regional economic growth. The results showed that the opening of HSR had an adverse effect on capital input, industrial output, labor productivity, and labor mobility in peripheral cities, which made the development differences between regions widen, and thus had a negative effect on economic growth in general [22]. There is also no consensus on the impact of the opening of HSR on regional economic growth imbalances. Vickerman argued that the opening of HSR has created new locational advantages for cities and regions along the line, bringing more jobs to the core area, as well as boosting consumption in the core area, thus, increasing the income of the core area. However, at the same time, it caused the economic growth rate of peripheral cities to decrease, and the regional economic development, in general, shows an unbalanced trend [23]. Hall also pointed out that the opening of HSR has caused production, labor, and other factors to move to core regions, especially to the central cities in core regions, rendering labor and other factors in the peripheral areas insufficient, which has a negative impact on the peripheral areas and may even have a polarization effect [24]. There are also scholars who hold a different view. They argue that the opening of HSR has not only accelerated the trend towards colocation within urban agglomerations, but also promoted economic linkages between major urban agglomerations, allowing the regional economy to develop in a balanced direction [25,26].
Established studies have used different approaches to study the impact of the opening of HSR on regional economic growth. Wang et al. [27] used the “presence or absence method” to empirically analyze the impact of the Shanghai–Hangzhou HSR opening on regional economic growth. Ke et al. used a new regression control method proposed by Hsiao, Ching, and Wan (HCW) to assess the impact of the opening of HSR on urban economic growth [28]. Liang et al. used the National Polar-orbiting Partnership-Visible Infrared Imaging Radiometer Suite (NPP-VIIRS) remote sensing data from 2012 to 2017 to represent the economic growth level of regions along the line, and the propensity score matching method coupled with the difference-in-differences (PSM-DID) method was used to quantify the impact of the opening of HSR on economic growth [29]. Zou developed a general equilibrium trade model using a “market access” approach to measure the impact of the opening of HSR on the economic growth of 110 major prefecture-level cities in China [30]. It is estimated that before 2014, 70% of the literature on the impact of HSR on regional economic growth was analyzed under the assumption of both with and without HSR, but this “with or without comparison method” lacks a factual basis. Starting in 2014, some scholars began to use the difference-in-differences method to study the impact of the opening of HSR on regional economic growth. Jia et al. used the DID model to study the impact of HSR on regional economic growth, and the results showed that the HSR construction in China has had a positive effect on economic growth [31]. Li et al. used the DID model to study the impact and heterogeneity of the opening of HSR on the economic growth of cities along the Silk Road Economic Belt, and the results showed that the impact of the opening of HSR on regional economic growth exhibited significant heterogeneity [32]. It is estimated that 60% of domestic and foreign research scholars have chosen this method. The difference-in-differences method effectively combines “before and after comparison” and “with or without comparison”. Compared with the “with or without comparison method”, it has provided great progress in identifying the causal effects of estimated policies.

2.2. The Impact Mechanism of the Opening of HSR on Regional Economic Growth

The impact of the opening of HSR on regional economic growth is complex. The influencing elements provide feedback to each other and constitute a complex nonlinear dynamic feedback system. System dynamics (SD) abstracts the intrinsic connections and structures of phenomena from the complex real world by exploring the feedback between elements within the system boundaries. Additionally, it clarifies the interaction between elements and the mechanisms of mutual influence, which can better deal with the nonlinearity, feedback, and dynamic integration of economic and social management issues. This feature is suitable for an in-depth investigation of the mechanism of the impact of HSR on regional economic growth. Based on this, this paper used theoretical knowledge related to system dynamics. With the help of Vensim software, the causal relationship between the opening of HSR and regional economic growth was drawn, as shown in Figure 1 below. Additionally, on this basis, an analysis of the impact mechanism was carried out.
As seen in the figure above, the causality diagram contains four main causal feedback loops as follows.
First feedback loop: regional economy → + transportation infrastructure → + HSR opening → + regional accessibility → + transportation speed → + total cargo volume → + regional GDP. Second feedback loop: regional economy → + transportation infrastructure → + HSR opening → + regional accessibility → − transportation cost → + total cargo volume → + regional economy. The first and second feedback loops suggest that the opening of HSR improves regional development conditions, facilitating the clustering of economic factors and the spatial reconfiguration of diffusion, which in turn enhances the accessibility of regional space. The increase in accessibility in turn increases the freight transport speed and decreases transport costs, which in turn increases the total cargo volume [33]. The increase in demand for total cargo volume drives the development of employment, industry, and other aspects of the entire region, creating favorable conditions for the sound development of the regional economy, which in turn promotes regional economic growth.
Third feedback loop: regional economy → + transportation infrastructure → + HSR opening → + fixed asset investment → + employed population → + regional economy. The fourth feedback loop: regional economy → + transportation infrastructure → + HSR opening → + fixed asset investment → + national income → + regional economy. The third and fourth feedback loops indicate that the initial opening of HSR requires the consumption of high-quality steel, electronic equipment, and machinery and equipment, which will prompt an increase in fixed asset investment. The opening of HSR is a project with a large investment scale and a long construction cycle. This puts the fixed asset investments in the initial stage of the opening of HSR in a state that is not yet saturated. Additionally, Koczewska used the net present value model to observe the post-investment economic change performance and marginal investment multiplier; his findings indicated that when investment is still in an unsaturated state, there is still a certain degree of investment capacity, and at this time, continuing to increase investments will increase the related income [34]. Therefore, in the initial opening of HSR, fixed asset investments will continue to increase, and the investment after a period of time will boost the national income through the investment multiplier [35], which in turn will promote regional economic development.
Fifth feedback loop: regional economy → + transportation infrastructure → + high-speed railway opening → + foreign direct investment → + employed population → + regional economy. This shows that the opening of HSR shortens the space–time distance between countries and promotes the enhancement of foreign direct investment. The enhancement of foreign direct investment accelerates the process of knowledge spillover and promotes the flow of talents between countries, which is beneficial to the acquisition of workers’ knowledge and the introduction of advanced technology in enterprises between countries [36]. At the same time, the appropriate supporting facilities of HSR stations will also attract a large number of foreign-funded enterprises and modern manufacturing industries, laying the foundation for fostering a good entrepreneurial and employment environment, and thus achieving rapid regional economic growth.
Sixth feedback loop: regional economy → + transportation infrastructure → + HSR opening → + speed of goods circulation → + convenience of consumption → + consumption index → + regional economy. It is shown that the opening of HSR drives the inflow of various resource factors, such as regional businesses, logistics, and information flows, and production and living factors are optimized. This improves the living conditions of consumers [12]. At the same time, the opening of HSR speeds up the circulation of goods between regional cities, enhances the convenience of residents’ consumption, and promotes the improvement in residents’ consumption level, which in turn promotes the rapid growth of the regional economy.
Based on the analysis of the impact mechanism, combined with the relevant literature, such as Jiang et al., who established a convergence model to study the mechanism of the effect of the opening of HSR on regional economic growth [37], the following hypotheses are proposed:
H1. 
The opening of HSR will boost regional economic growth.
H2a. 
The opening of HSR promotes higher freight volumes, which in turn boosts regional economic growth.
H2b. 
The opening of HSR promotes increased investment in fixed assets, which in turn promotes regional economic growth.
H2c. 
The opening of HSR promotes increased foreign-direct investment, which in turn promotes regional economic growth.
H2d. 
The opening of HSR promotes the consumer index, which in turn boosts regional economic growth.

3. Model and Data

3.1. Model Construction

DID is often used to assess the impact of an event or policy [38]. To some extent, DID controls for the influence of factors other than the intervention factor [39]. Therefore, this paper chose the DID method to construct the model, taking “HSR cities” as the experimental group and “non-HSR cities” as the control group. The basic hypothetical model is shown in Equation (1):
Y i t = β 0 + β 1 c i t y i t + β 2 y e a r i t + β 3 y e a r i t × c i t y i t + α i + ε i t
where Y i t is the policy implementation outcome for city i in period t , that is, the explanatory variable; c i t y i t is a policy dummy variable for whether city i opens a high-speed railway in period t (it takes the value of one if an HSR is opened, and zero otherwise); y e a r i t is the policy period time dummy variable, that is, after the year of HSR completion (it takes the value of one if the HSR is completed, and zero otherwise); the interaction term ( y e a r i t × c i t y i t ) represents the city dummy variable after the opening of the HSR; the coefficient β 3 measures the impact of the opening of the HSR on regional economic growth, that is, the HSR effect, which is the focus of this paper; α i is the individual fixed effect; and εit is the residual.
Model (1) explains the difference between the experimental group and the control group in terms of the presence or absence of the opening of an HSR, assuming that all else is equal. However, there are all kinds of obvious differences between regions, and these differences should not be ignored. Therefore, on the basis of Model (1), this paper added other control variables to more comprehensively consider the factors affecting regional economic growth. In this paper, we used X i t to denote a set of control variables. The model equation is as follows:
Y i t = β 0 + β 1 c i t y i t + β 2 y e a r i t + β 3 y e a r i t × c i t y i t + γ X i t + α i + ε i t
The specific model is shown below:
Y i t g d p = β 0 + β 1 c i t y i t + β 2 y e a r i t + β 3 y e a r i t × c i t y i t + γ X i t + α i ε i t
Y i t s p e e d = β 0 + β 1 c i t y i t + β 2 y e a r i t + β 3 y e a r i t × c i t y i t + γ X i t + α i + ε i t
where the regional gross national product ( Y i t g d p ) and regional economic growth speed ( Y i t s p e e d ) are used as explanatory variables; the specific meaning is basically the same as in Model (1).

3.2. Variable Selection

We referred to the approach of Dai and Hotako [40] in studying the impact of Shinkansen on the regional economy in Japan for the selection of variables, and the specific variables are shown in Table 1. For the selection of control variables, according to the input–output model, the amount of labor and social and human capital were selected as the variables for consideration. Referring to the “troika” that affects economic growth, foreign direct investment and total retail consumption were selected as control variables. In addition, the total amount of freight transported as a transport-derived demand and the industry structure of the regional economic growth quality were also variables considered in this paper.
In terms of capital, the total social fixed asset investments in each prefecture-level city were selected as the research variables. In terms of labor force, it is expressed by the total labor force statistics of the city at the end of the year. In terms of industrial structure, it uses the sum of the ratio of secondary industry and the ratio of tertiary industry to represent the industry structure. In terms of human capital, the ratio of education expenditure to total financial expenditure was selected to measure the level of regional human resources. This paper used the sum of rail freight, road freight, water freight, and air freight to measure the total cargo volume. The total amount of actual foreign investment used in the year was calculated based on the annual average exchange rate, which was used as the total amount of foreign direct investment. The consumption index is the wind vane of economic growth. In this paper, the total consumption of social retail goods was chosen to measure the consumption index.

3.3. Data Description

In view of the current situation of China’s HSR development and the Wuhan–Guangzhou HSR construction history, we considered that the commercial operation of HSR construction in China started in 2008. Additionally, there was no new HSR along the Wuhan–Guangzhou HSR before 2015, and the overall sample was relatively stable.
The data were selected for the time period 2005–2017, and all data were obtained from the China City Statistical Yearbook for 2005–2017. The experimental group was selected from ten prefecture-level cities along the Wuhan–Guangzhou HSR. The selection process of the control group was as follows: ① In order to avoid confusion in the assessment of the HSR effect, and the time lag of the effect after the opening of the HSR in different periods, except for the cities that the Wuhan–Guangzhou HSR passes through, cities that opened HSR between 2005 and 2017 were excluded. ② To ensure that the regions were as similar as possible, priority was given to the selection of “non-HSR cities” that are geographically close to the HSR cities. Based on this, 17 prefecture-level cities were selected as the control group, and the regional distribution of the sample cities using the difference-in-differences method is shown in Figure 2.
Considering that the Wuhan–Guangzhou HSR was only opened at the end of 2009, the experimental period was defined as 2010, and the impact of the Wuhan–Guangzhou HSR on the economic growth of cities along the line was evaluated. Variable descriptive statistics are shown in Table 2 below.

4. Empirical Results and Analysis

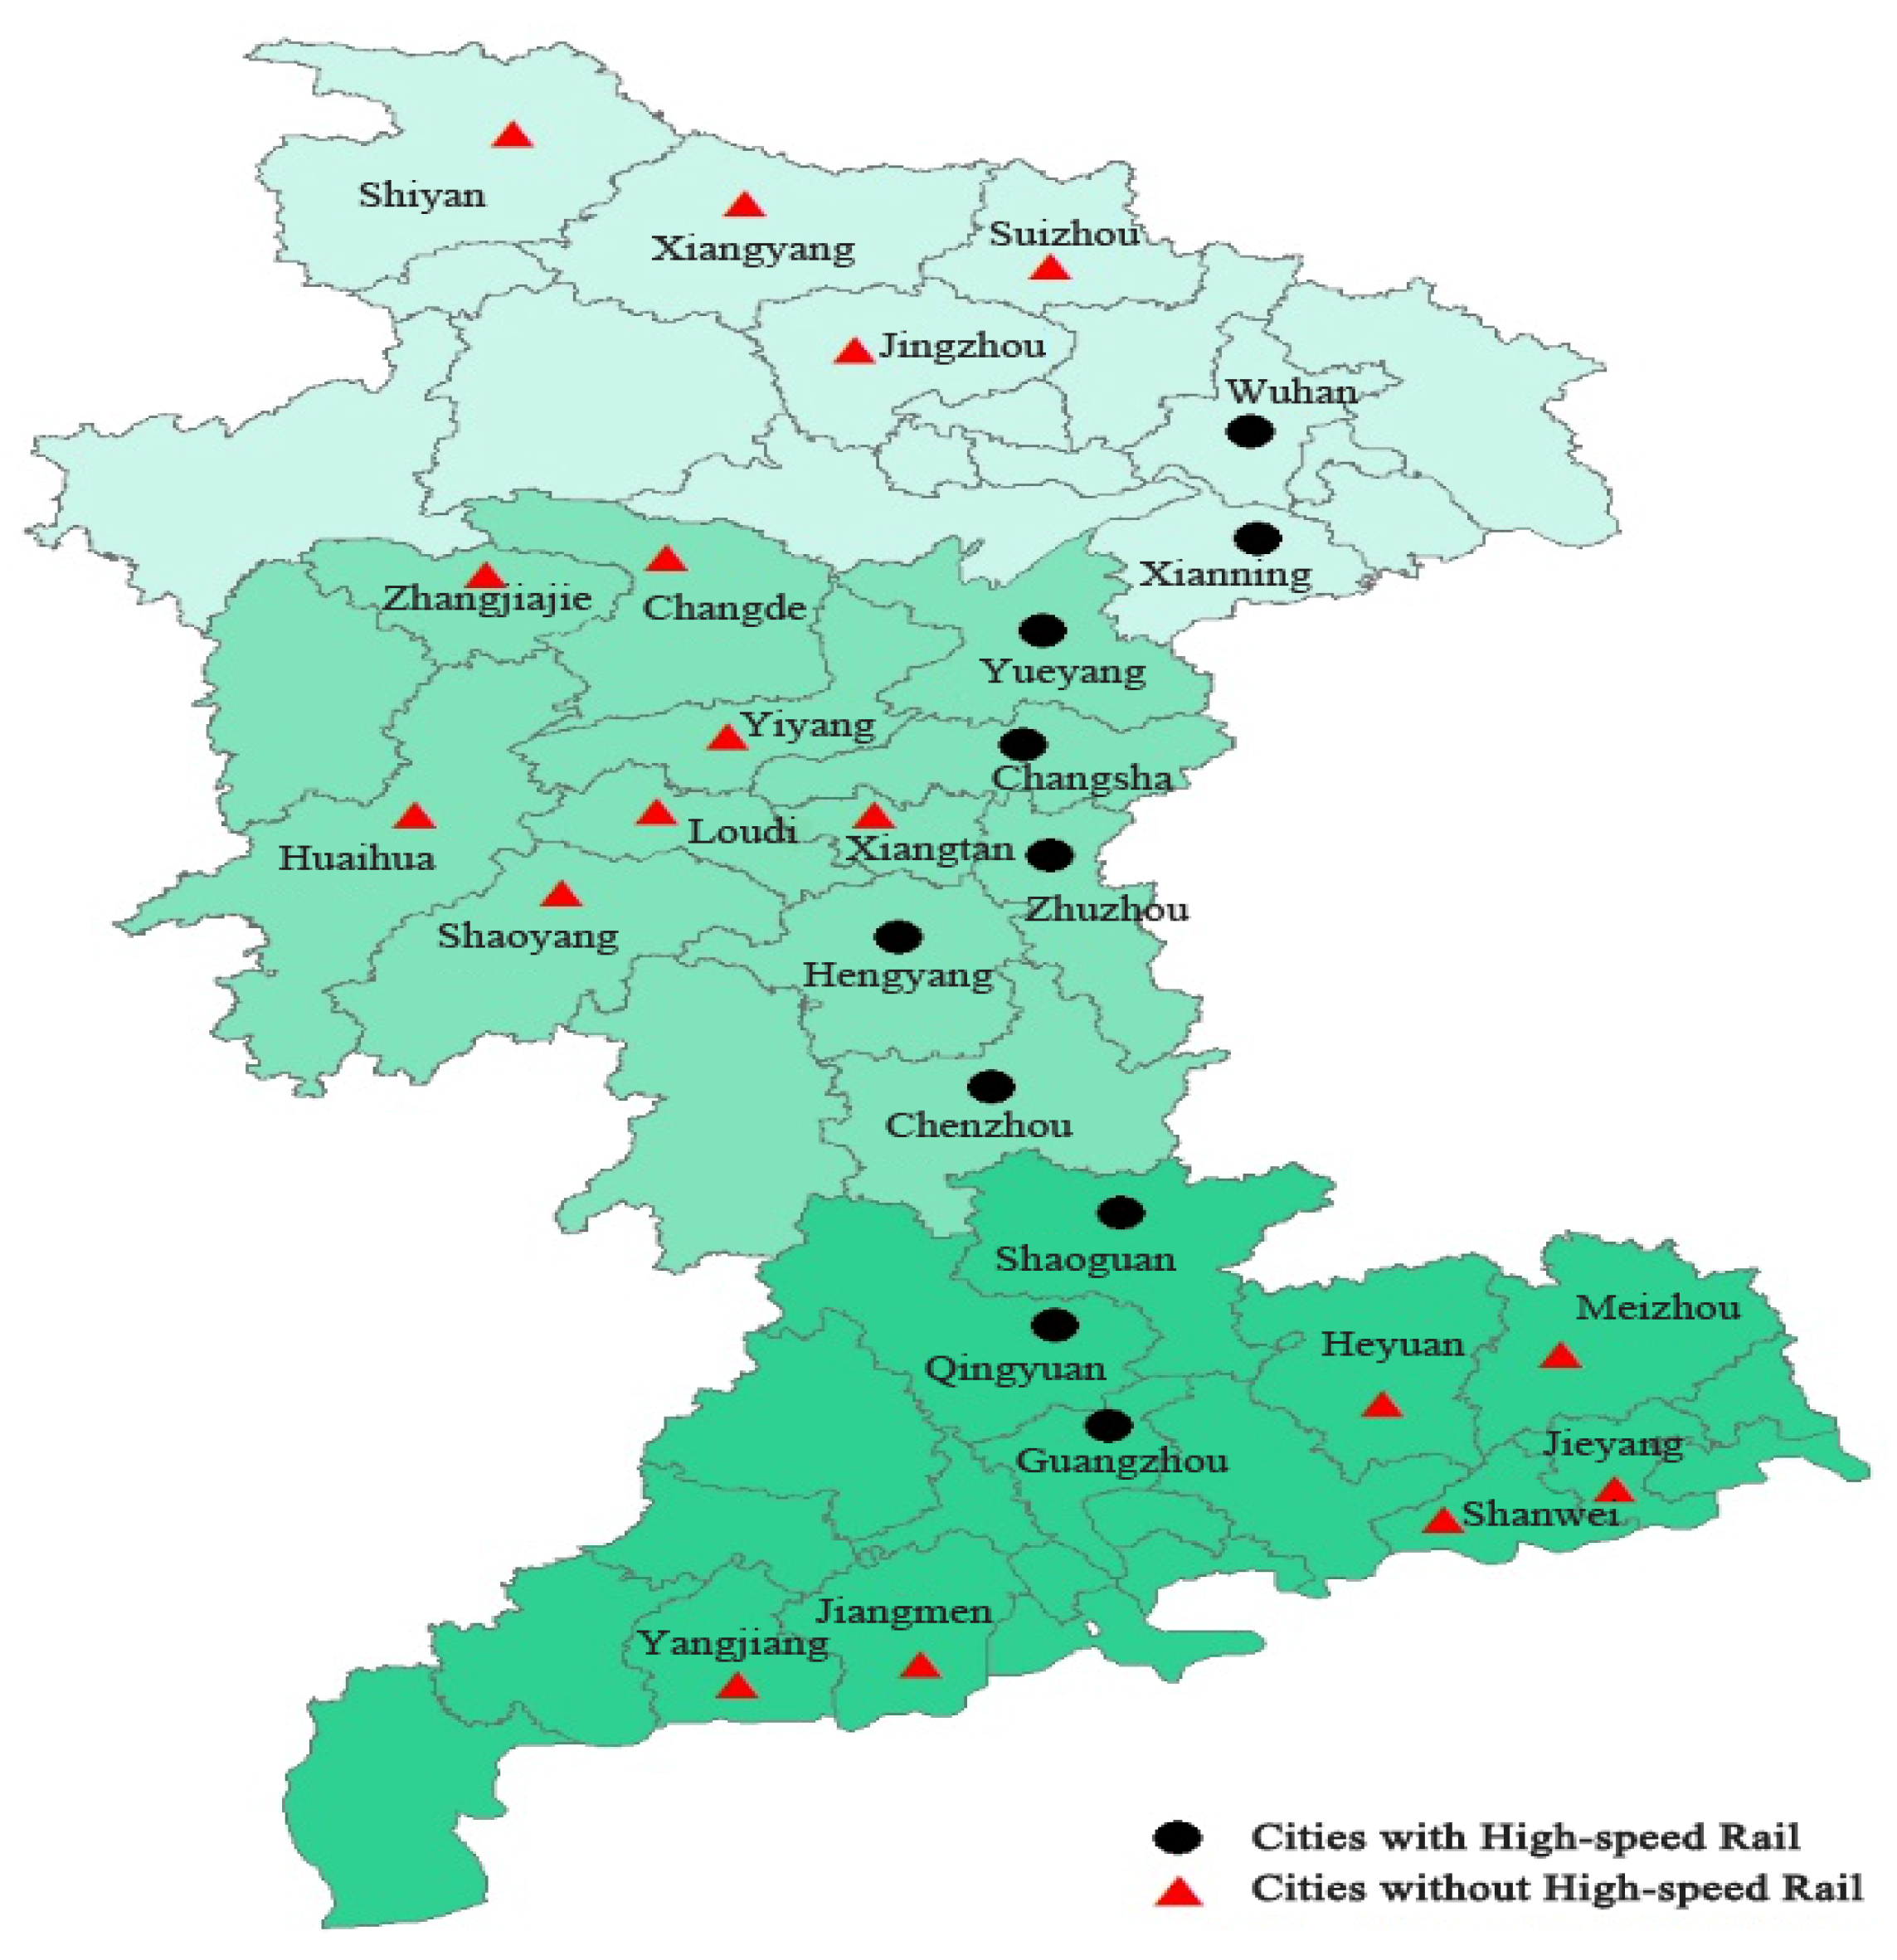
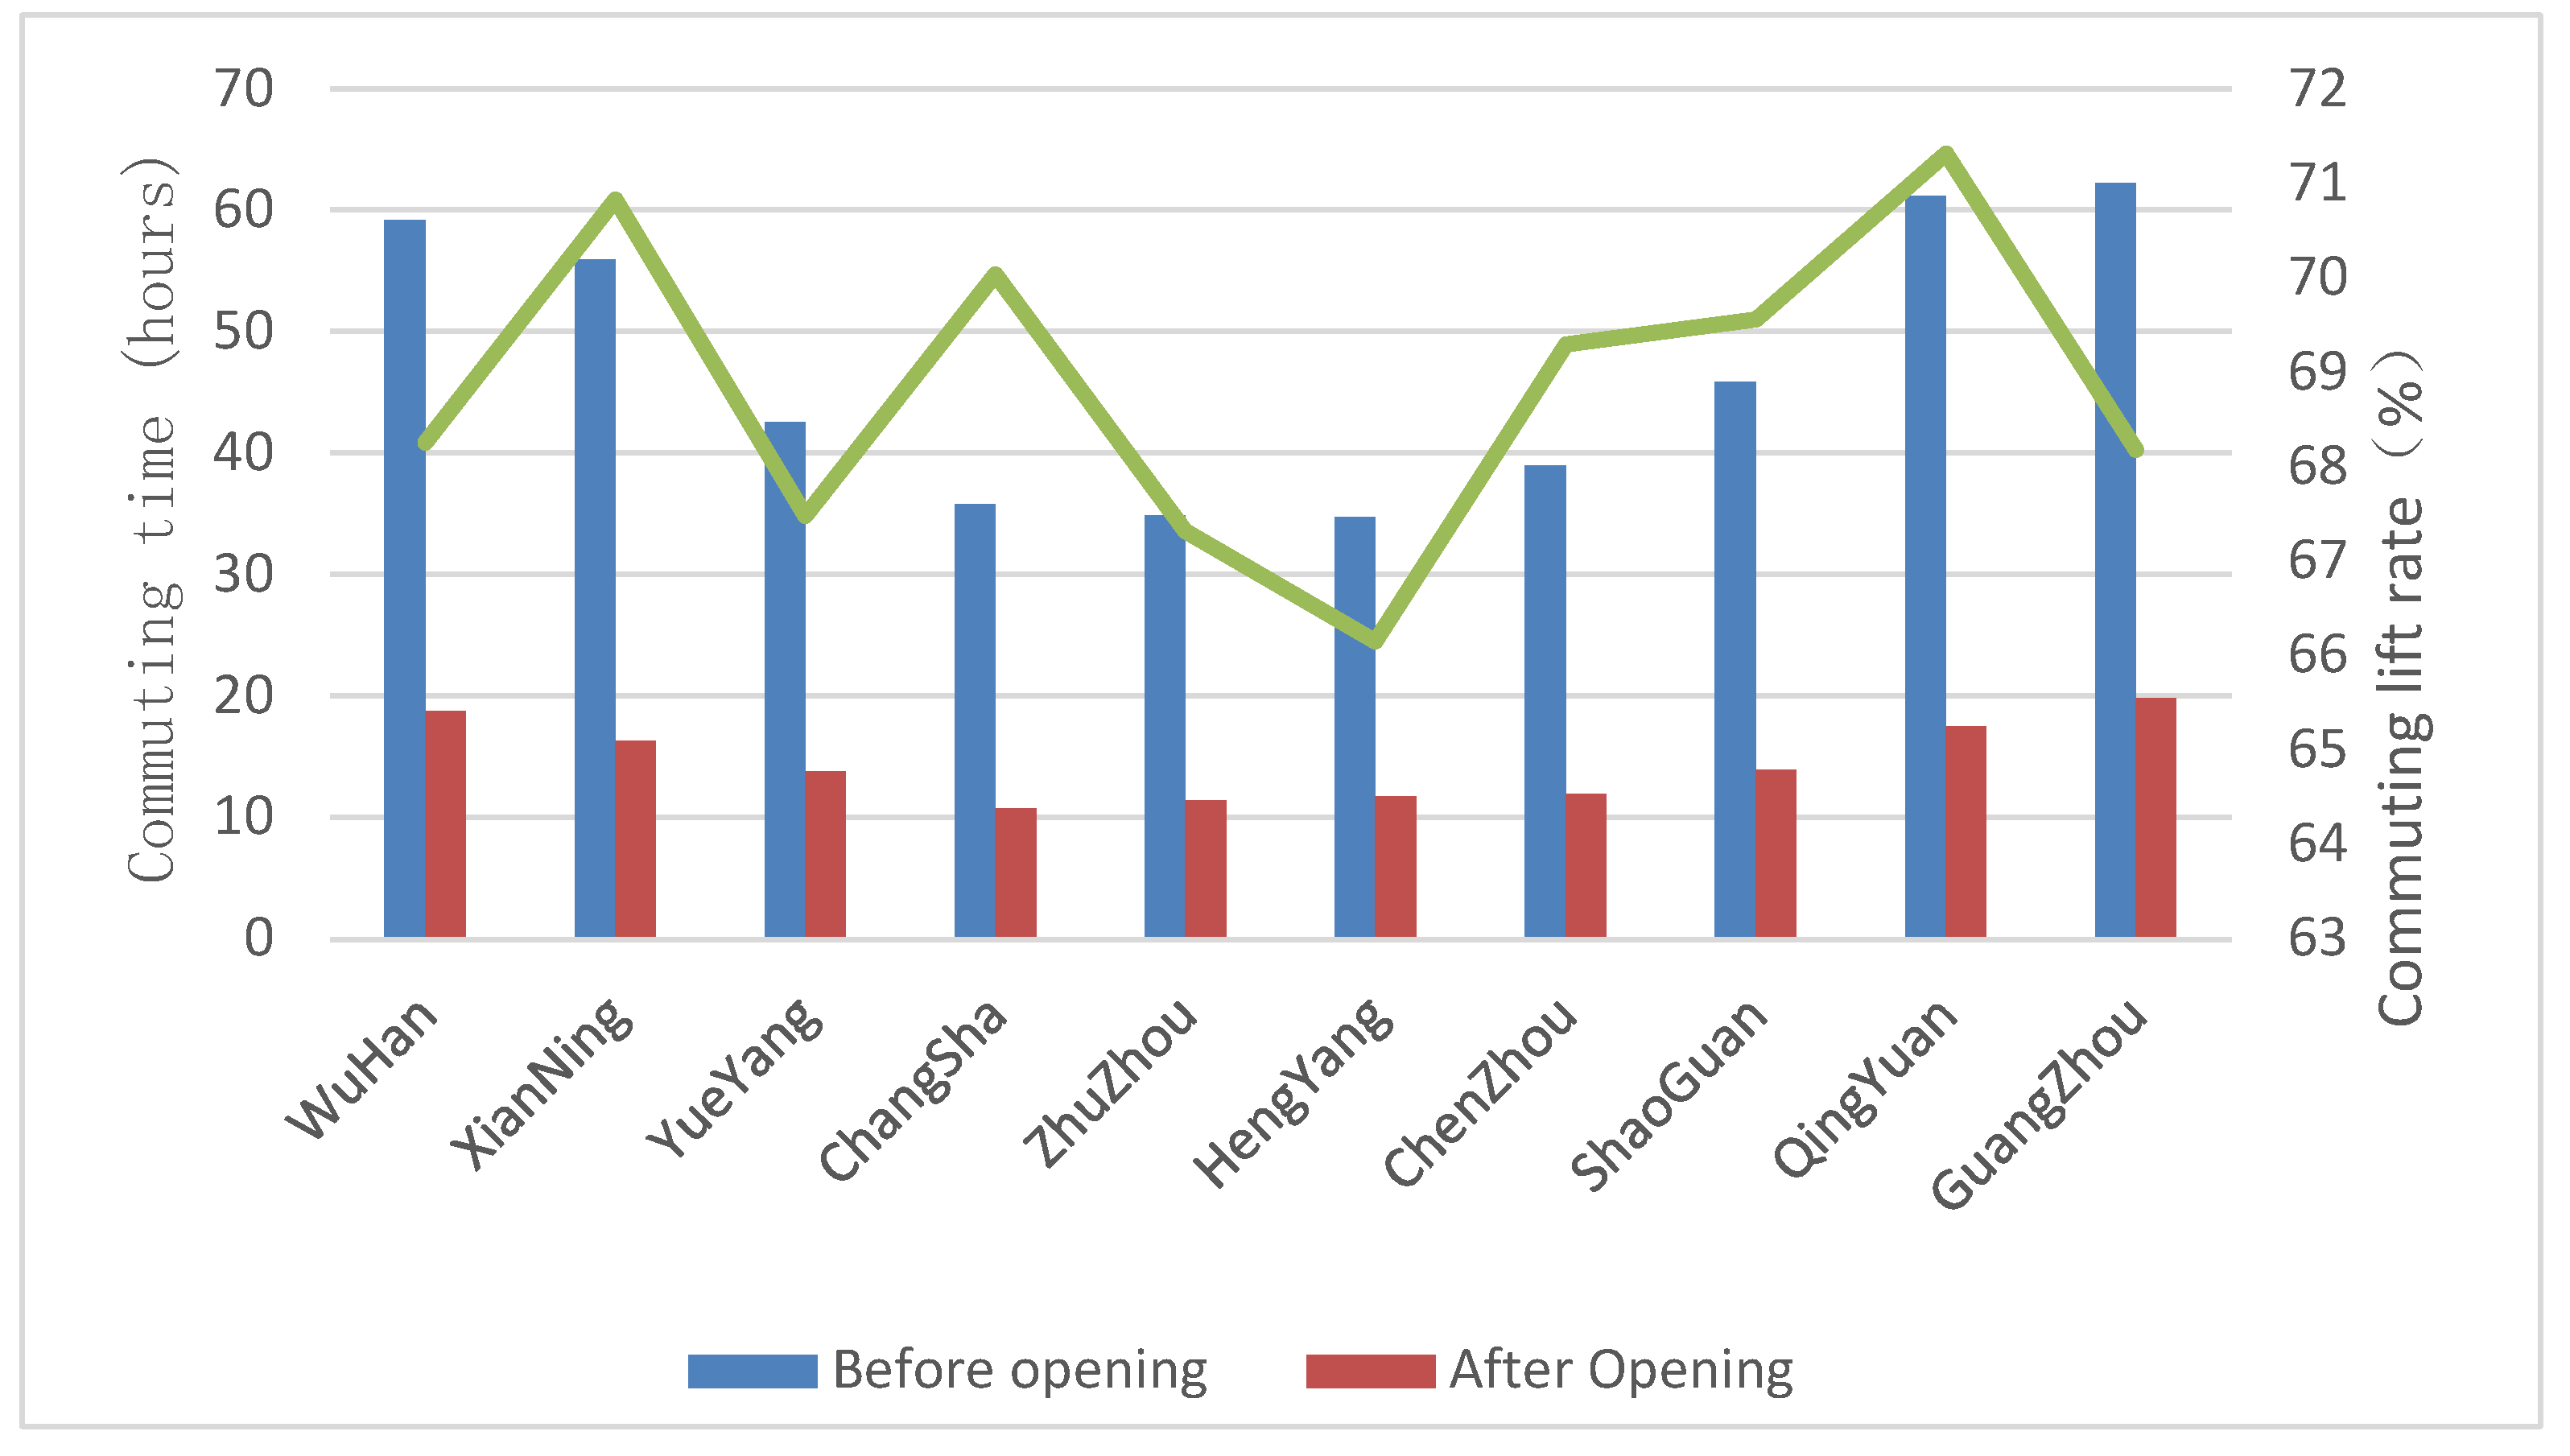
4.1. The Impact of the Wuhan–Guangzhou HSR on the Accessibility of Cities along the Line

Accessibility can be considered as the basis for other impacts of transportation facilities. HSR significantly reduces the time and space distance between different regions and promotes economic growth by reducing time and travel costs. Considering the advantages of the HSR transportation mode, the distance attenuation factor can be considered next. Instead, the differences between cities in the line of each site should be looked at more. Therefore, this paper chose the weighted average travel time to calculate the accessibility index of cities along the Wuhan–Guangzhou HSR line, which can better reflect the economic quality differences among cities along the line and the connection between stations.
Referring to Fang [41], Zou et al. [42], and Diao et al. [43], the weighted average travel time is calculated as follows:
A i t = j n ( T i j t × M j t ) / j n M j t
where A i t denotes the accessibility of node i in year t in the region; T i j t denotes the shortest commuting time spent by some mode of transport to reach node j from node i; and M j t is the weight value, which measures the attractiveness of node j, such as the total regional economic growth, job opportunities, and market potential. When performing the weighted average travel time calculation, the heterogeneity between regions is taken into account, and the weight M j t is introduced to differentiate the calculation. For the calculation of the weights, we referred to Jiao et al. [44], Wang [45], and Wu [46] because the gross regional product and population are generally considered to reflect the differences in the attractiveness of regions. The specific calculation method is as follows:
M j t = ( G D P j t × P O P j t ) 1 / 2
where G D P j t is the gross regional product of city j in year t, and P O P j t is the total city-wide year-end population of city j in year t.
This paper took samples of 10 cities passed by the Wuhan–Guangzhou HSR as the measurement object and obtained the accessibility index corresponding to each city. In terms of the travel time measurement, this paper obtained the shortest travel commuting time between cities before (Table 3) and after (Table 4) the opening of the HSR according to the railway train operation schedule.
In order to observe the impact on the total commuting time between cities along the line before and after the Wuhan–Guangzhou HSR opening, the comparison of the total commuting time between cities along the line before and after the Wuhan–Guangzhou HSR opening was calculated (Figure 3). The total commuting time between cities along the Wuhan–Guangzhou HSR line has dropped from approximately 60 h before the opening to less than 20 h after the opening, with the improvement rate generally being greater than 60%. Among them, Qingyuan, Xianning, and Changsha have particularly obvious improvement rates, at more than 70%. From the data, we can see that the Wuhan–Guangzhou HSR opening has greatly reduced the commuting time between cities along the line. The cities along the Wuhan–Guangzhou HSR have more obvious enhancement effects due to their advantages in terms of geographical distance.
In calculating the weighted average travel time weights, the total GDP in 2008 before the opening of the HSR, the total GDP in 2010 after the opening of the HSR, and the corresponding population in each year were selected for each city (Table 5).
Meanwhile, in order to better compare the changes in the total GDP and total population before and after the opening of the HSR, this paper added the total GDP and population of cities along the Wuhan–Guangzhou HSR in 2009 to the table.
In order to better understand the impact of the Wuhan–Guangzhou HSR opening on the GDP and total population of cities along the line, they were compared with the GDP and total population of cities not on the line of the Wuhan–Guangzhou HSR. The GDP and total population of cities not on the line of the Wuhan–Guangzhou HSR are shown in the Table 6.
By comparing Table 5 and Table 6, it can be seen that after the Wuhan–Guangzhou HSR opening, the average growth rate of the total population of the cities along the line was higher than the average growth rate of the total population of the cities not on the line. However, the average growth rate of the GDP in cities along the line was not much different from the average growth rate of the GDP in cities not on the line. This may be due to the fact that the Wuhan–Guangzhou HSR only began officially operating at the end of 2009, meaning that its impact on regional economic growth was somewhat lagging.
The average travel time, total GDP, and total population were introduced into the accessibility index model to produce a weighted average travel time for each city (Table 7).
As can be seen from the above table, the accessibility of cities along the line has been significantly improved since the Wuhan–Guangzhou HSR opening. Among them, Qingyuan had the largest change in its accessibility index, reaching 71.53%. This was followed by Xianning, Changsha, and Chenzhou, whose accessibility indices improved by 71.16%, 70.38%, and 70.14%, respectively. While Wuhan and Guangzhou are important hubs of transportation in China, the true accessibility of these two cities is not accurately reflected when considering the accessibility on only one line. Therefore, from this perspective, the accessibility index ranking of Wuhan and Guangzhou before and after the opening of the Wuhan–Guangzhou high-speed railway is not outstanding. However, the opening of the Wuhan–Guangzhou high-speed railway has improved their accessibility by more than 60%.

4.2. The Impact of the Wuhan–Guangzhou HSR on Regional Economic Growth

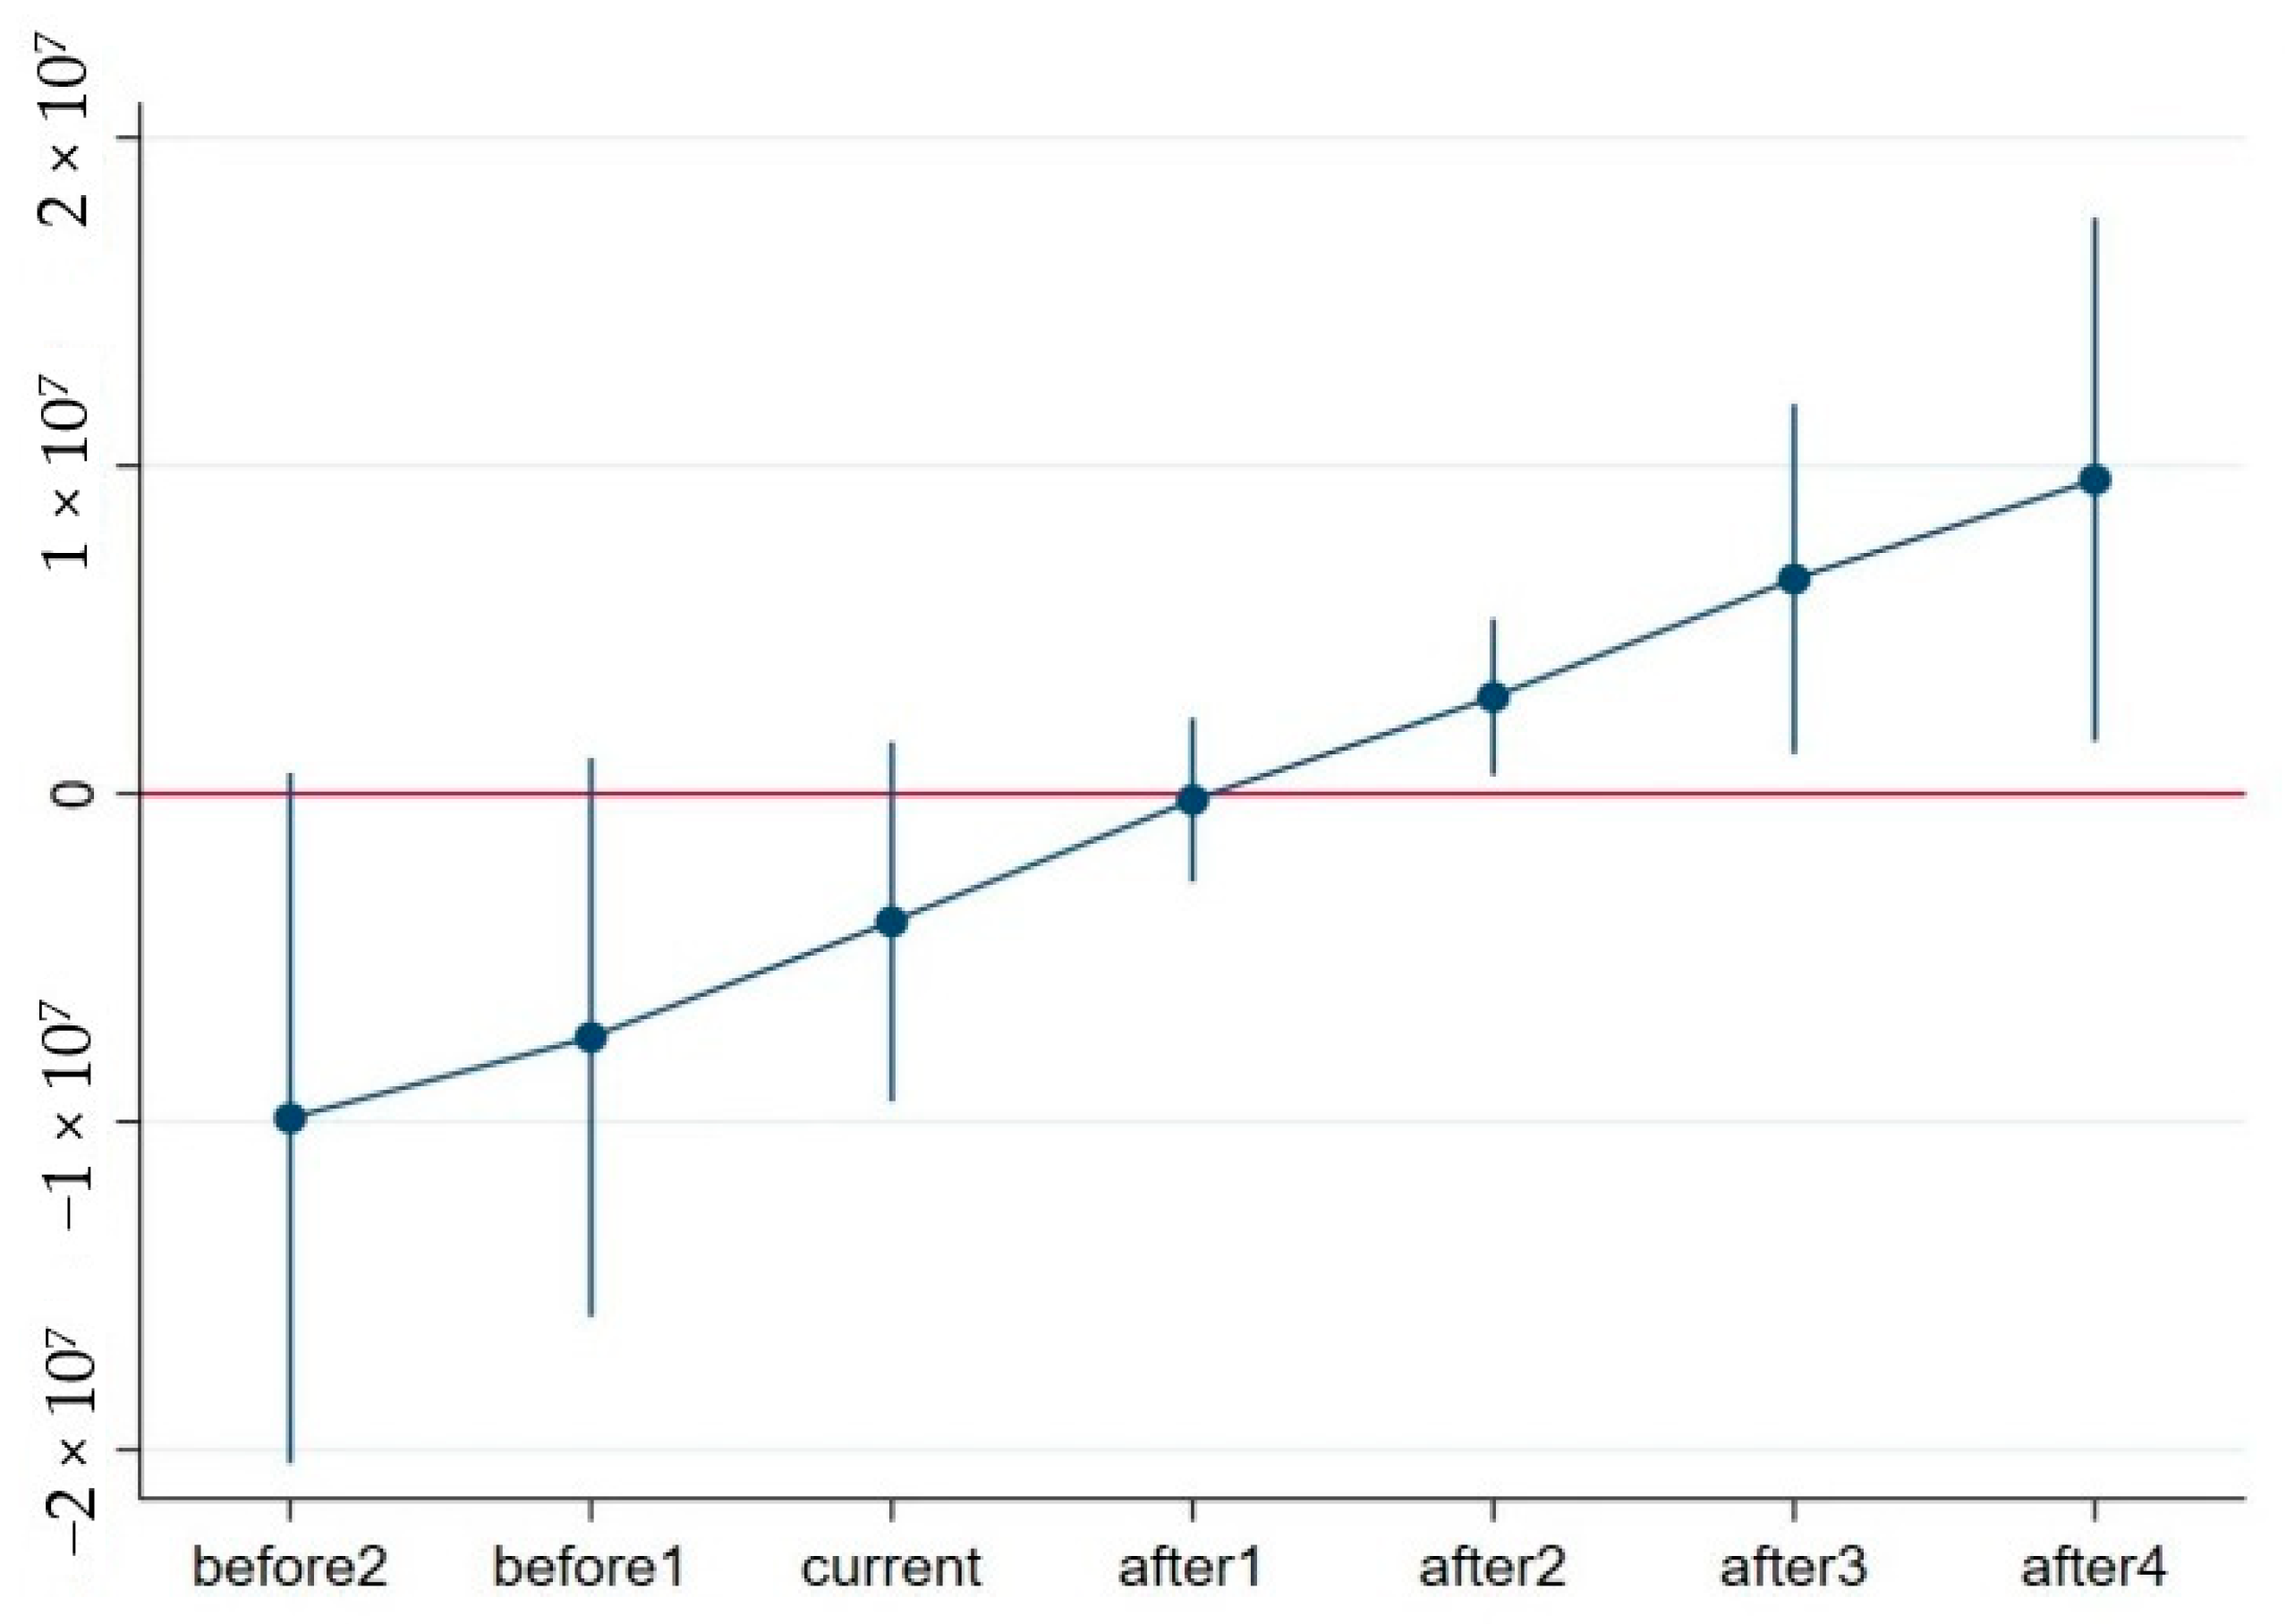
4.2.1. Parallel Trend Test

Before using the DID model, a parallel trend test is needed. Referring to Beck [47], this paper conducted a dynamic event test by constructing the multiplication term of the dummy variable and the experimental group quasi-variable for the years before and after the policy implementation. The following model was constructed for the parallel trend test:
Y i t = β + k = 2 4 β K × y e a r t 0 + k × c i t y i t + α i + ε i t
where t 0 denotes the first year when city i opened the Wuhan–Guangzhou HSR (that is, 2010), and K denotes the K th year before and after the Wuhan–Guangzhou HSR opening. For example, K = −2 denotes the first two years before the Wuhan–Guangzhou HSR opening, and K = 1 denotes the year after the Wuhan–Guangzhou HSR opening. In this model, the key coefficient is β K , which indicates whether there is a significant difference in regional economic growth between the experimental and control groups in year K before and after the Wuhan–Guangzhou HSR opening. If the coefficient β K is not significant during K < 0, this indicates that the experimental group has a parallel trend with the control group. Conversely, if the coefficient β K is significant during K < 0, this indicates that there was a significant difference before the Wuhan–Guangzhou HSR opening. The results of the parallel trend test are shown in Figure 4 below.
As can be seen in Figure 4, in the first two years before the opening of the Wuhan–Guangzhou HSR, coefficients β 2 and β 1 were not significant. In the year when the Wuhan–Guangzhou HSR was opened, the coefficients were negative. This may be because the policy effect only gradually appears two years after the implementation of a policy [10]. Two years after the opening of the Wuhan–Guangzhou HSR, the coefficient β 2 was significantly positive. This proves that the DID model constructed in this paper passes the parallel trend test.

4.2.2. The Impact of the Wuhan–Guangzhou HSR on Regional GDP along the Line

Model (1)–(8) are the regression results with the GDP as the explanatory variable, as shown in Table 8.
From the perspective of the HSR factor, as shown in Model (1), without adding any control variables, the HSR factor was significantly positive. After gradually adding control variables, as shown in Model (2)–(8), the HSR factor remained positive and significant, but the coefficient value decreased. The results show that after the Wuhan–Guangzhou HSR opening, the GDP of the cities along the line increased after 2010. That is, the Wuhan–Guangzhou HSR opening has had a significant positive effect on the GDP of regional cities along the line [48]. This may be due to the fact that the time distances between all levels of cities have been drastically reduced since the opening of the HSR. Traditional travel lines are no longer the only choice for people, and more small and medium-sized cities have become hot spots for people to travel to and consume in. This has contributed to the increase in the urban GDP along the line, which in turn has contributed to regional economic growth.
The regression results from the other control variables are generally in line with the expectations of this paper. The fixed asset investment (cap) factor had a significantly positive effect on the GDP at the 1% level. This indicates that an increase in fixed asset investment has a positive effect on the growth of the GDP per capita. This is mainly because the increase in fixed asset investment in cities has promoted the consumption of people in urban areas and provided new employment opportunities for citizens. In addition, the increase in fixed asset investment also increases local tourism, which in turn can improve regional economic growth, which is consistent with Givoni et al. findings [49]. The effect of the total cargo volume (cargo) factor input on the GDP per capita was positive. This may be due to the fact that when the total cargo volume increases in the regional cities along the line, it speeds up the flow of goods between the regional cities and raises the consumption level of people between the regional cities, which in turn contributes to the increase in the GDP per capita [50]. Control variables, such as foreign direct investment (infdi), consumption index (intrc), and labor force (inlab) all had a significant positive impact on the GDP. This may be due to the fact that foreign direct investment can lead to the improvement of local fixed assets and the creation of more employment opportunities, thereby driving the increase in the local per capita GDP [51]. The input of the consumption index factor represents the improvement in the consumption level, which promotes the increase in demand and then drives local economic growth [52]. The labor factor plays a key role in the impact of the GDP per capita, so the input of the labor factor directly increases the GDP per capita [53]. Overall, from the measurement results, the GDP has been significantly affected by the opening of the Wuhan–Guangzhou HSR.

4.2.3. The Impact of the Wuhan–Guangzhou HSR on the Regional Economic Growth Rate along the Line

Model (1)–(8) are the regression results with the GDP growth rate as the explanatory variable, as shown in Table 9.
From the HSR factor, as shown in Model (1), without adding other control variables, the HSR factor was significant at the 1% level, and the significance coefficient was negative. Further, as shown in Model (2)–(8), when control variables were added successively, the HSR factor was still significant at the 1% level, and all the coefficients were still negative, but the coefficients tended to shrink gradually. The results show that the Wuhan–Guangzhou HSR opening has had a negative impact on the regional economic growth rate along the line, which is basically consistent with the conclusions of Vickerman [23].
Possible explanations for the above results are as follows: The Wuhan–Guangzhou HSR opening has produced an urban agglomeration effect in cities. Additionally, this agglomeration effect may cause an excessive concentration of production factors, and the scale of cities exceeds the actual objective operating capacity. In turn, this may cause an increase in production costs and environmental pollution, which may reduce the economic effect of agglomeration and even have a negative effect on the regional economic growth rate. In addition, due to the high cost and long payback period of HSR, the Wuhan–Guangzhou HSR opening may cause the government to miss the opportunity to develop other industries and overlook the future development potential of the region. The existence of this negative effect indicates that the opening of the HSR will gradually make the economic growth rate of the experimental group and control group the same. This is conducive to narrowing the gap between the economic growth rates of regions on and off the Wuhan–Guangzhou HSR line, and promoting coordinated regional economic development.
Overall, control variables, such as fixed asset investment (cap), total cargo volume (cargo), human capital (hc), industry structure (industry), labor force (lab), and foreign direct investment (FDI), did not play a significant role in the regional economic growth rate, which is similar to the results obtained by Benson and Durham [54]. To some extent, fixed asset investment (cap) can promote regional economic growth. However, under the combined effects of other factors that are not conducive to regional economic growth, the impact of fixed asset investment on the regional economic growth rate was not significant. The effect of the total cargo volume (cargo) and industry structure (industry) on the regional economic growth rate was not significant. There is a certain lag in the impact of these two control variables on regional economic growth [10]. The insignificant effect of human capital and labor force on the regional economic growth rate may be due to the fact that the opening of the Wuhan–Guangzhou HSR has accelerated the flow of human capital and labor force to the areas along the HSR, which speeds up the economic growth rate of cities along the line, while the economic growth of cities not on the line is less dynamic. Thus, the impact on the regional economic growth rate was not significant from the overall perspective [54]. Cities along the Wuhan–Guangzhou HSR are able to attract more FDI, but this also puts nonline cities at a disadvantage in terms of FDI. Overall, the impact of FDI on the regional economic growth rate was not significant [12]. The consumption index (trc) was significant at the 10% level, and the significance coefficient was positive. This indicates that the Wuhan–Guangzhou HSR opening has promoted the consumption level of people along the line and boosted the regional economic growth rate, which is also similar to Kim’s conclusions [12].
Considering the large amounts of investment in HSR projects, the long payback period, and the lag in the economic effects generated by infrastructure construction, the effect of HSR may not be fully visible in the short term. Therefore, in this paper, the experimental period of the Wuhan–Guangzhou HSR opening was delayed by one year to observe the effects, and the specific measurement results are shown in Table 10.
From the measurement results with a lag of one year in the experimental period, as shown in Model (1)–(8), first, in terms of the time factor, the time utility of the HSR increased in significance and was significantly negative at the 1% level, but the coefficient tended to become progressively larger. This shows that the negative growth effect of economic growth over time has slowed down. Secondly, from the spatial factor, the spatial utility significance coefficients were all significantly positive at the 10% level, but the coefficients decreased. This shows that, although the Wuhan–Guangzhou HSR opening increased the economic growth rate of the regions passed by the HSR compared to those of the regions that were not passed by the HSR in the short term, the difference was reduced in the long run. Finally, in terms of the HSR effect, after a lag of one period in the experimental period, the HSR effect was significantly negative at the 10% level with or without the inclusion of other control variables, but the negative effect gradually slowed down.

5. Robustness Analysis

5.1. Robustness Tests
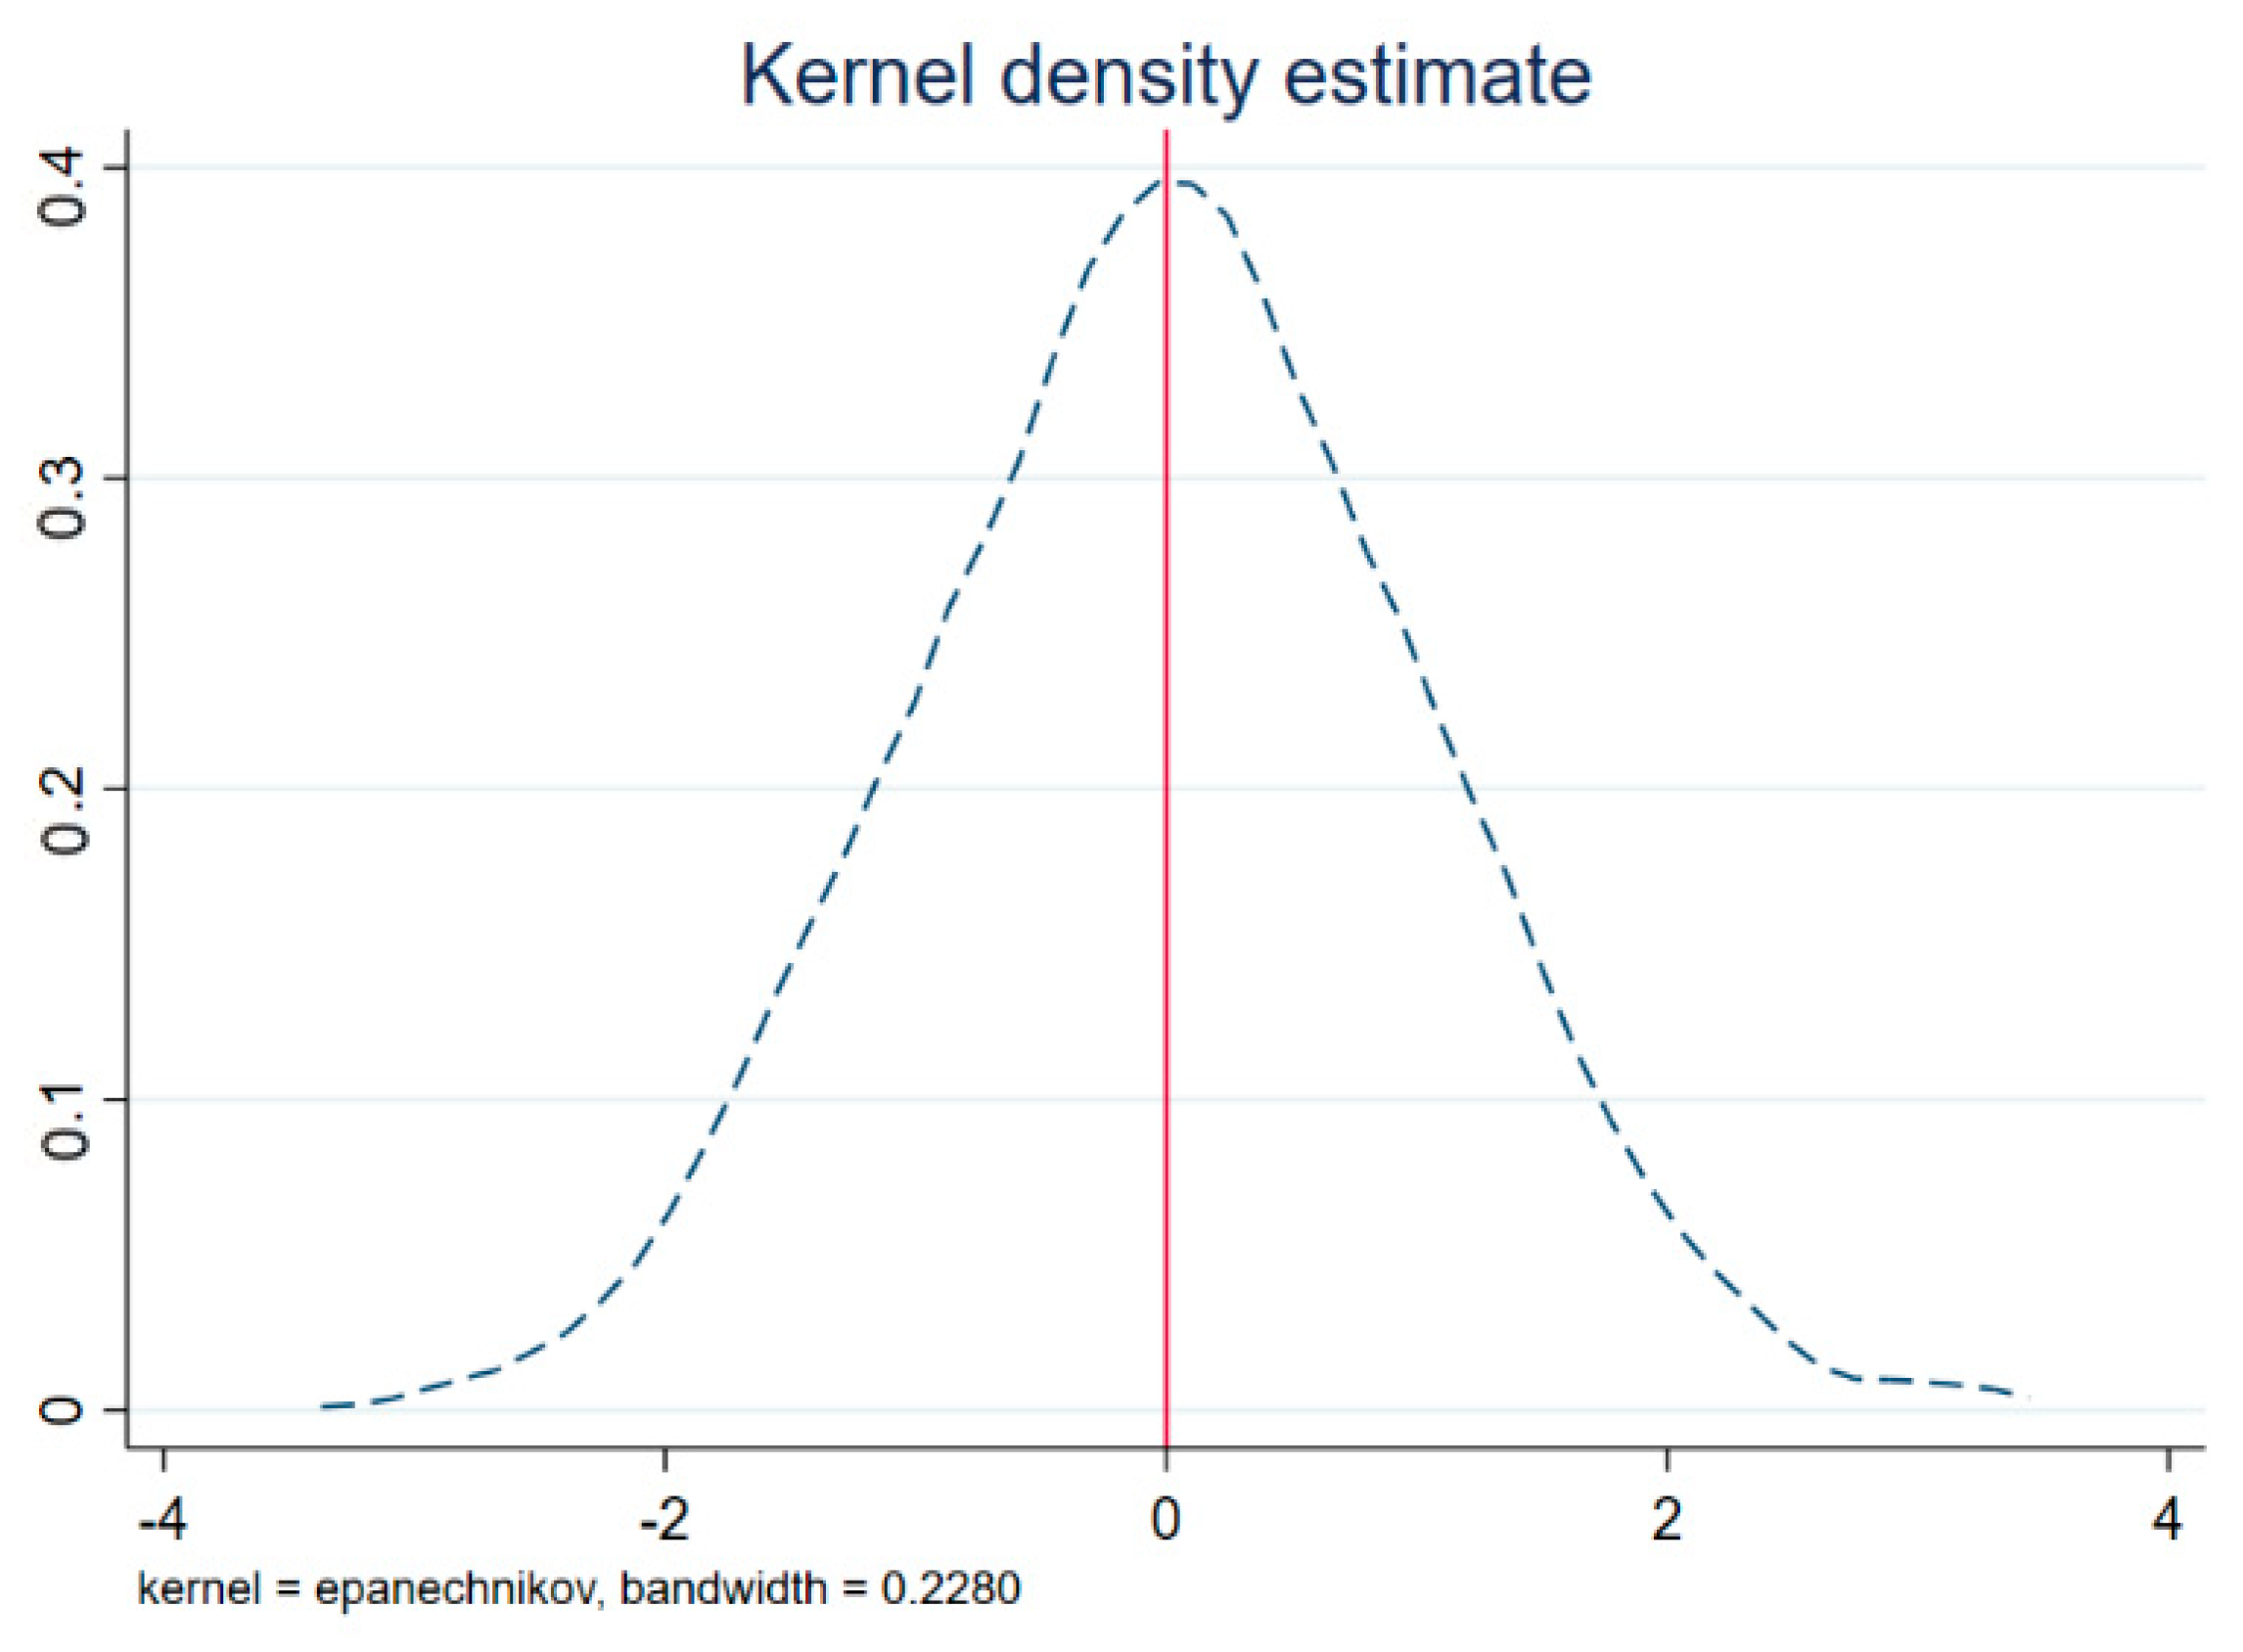
To test the robustness of the previous regression results, this paper followed Cheng et al.’s practice and used the following three methods for robustness testing [55]. Firstly, considering that the opening of the HSR may not have an immediate impact, the core variable of the HSR factor was treated with a one-period lag. Meanwhile, all control variables were also lagged by one period to avoid simultaneous equation bias. If the results obtained remain significant, then the previous empirical results are proven to be robust. The results are presented in column (1) of Table 11. Secondly, the opening period of the Wuhan–Guangzhou HSR was preceded by one year, defined as 2009, and returned. If the regression results are not significant, then this proves that the opening of the HSR has had a catalytic effect on regional economic growth. The results are shown in column (2) of Table 11. Thirdly, the highest and lowest 2% of the samples of the explanatory and control variables were subjected to the tailing method to exclude outliers. The reliability of the conclusions of this paper is further demonstrated if the results after the tailoring are still significant and the significance increases. The results are shown in column (3) of Table 11.
As shown in the table, the policy variable in Model (1) was significantly negative at the 10% level of significance after one period of lagging, indicating that the empirical results in the previous section were robust. In Model (2), the regression results after one year before the opening period were no longer significant, which further shows that the opening of the HSR has had a significant impact on regional economic growth. The results of the reduced tail in Model (3) were significant at the 5% level, and the significance coefficient was negative, which proves the reliability of the conclusions of this paper. In summary, the regression results of the robustness test again support the conclusions of this paper.

5.2. Placebo Test

For the DID model constructed in this paper, although most of the HSR characteristic variables were controlled in the assessment of the HSR opening effect, there may still be other unobservable HSR characteristics. Therefore, referring to the practice of Zhou et al. [56], this paper used the regional GDP ( Y i t g d p ) and regional economic growth rate speed ( Y i t s p e e d ) as the explanatory variables. The following method was adopted for the placebo test to observe whether the omission feature had an effect on the results. First, expressions for the Y i t g d p and Y i t s p e e d coefficients were derived based on Equations (3) and (4).
β 1 r = β 1 + δ × c o v ( c i t y i t , ϑ c t | D ) v a r ( c i t y i t , D )
If a variable can be found that can substitute for the opening of the HSR and this variable does not theoretically affect the corresponding Y i t g d p and Y i t s p e e d (that is, β 1 = 0), after estimating β 1 r = 0, it can be proved that δ = 0, indicating that the omitted features do not affect the estimation results. Therefore, this paper regressed the shock of the opening of the HSR after it became random and repeated this random regression process 1000 times so that Y i t g d p and Y i t s p e e d would not be affected. The results are shown in Figure 5 below.
From the above results, it can be seen that the distribution of β 1 r r a n d o m in the 1000 random processes was always approximately x = 0 and normally distributed. This indicates that unobservable HSR characteristics did not affect the estimation results, thus, confirming the robustness of the baseline regression results.

6. Mechanism Testing

This paper referred to the practice of Chen et al. [57] and Zhang [58] and used a combination of model regression and the literature to test the mechanism. In the first step, based on Equations (3) and (4), the effect of the core explanatory variables on the explanatory variables was verified. In the second part, based on Equations (3) and (4), Equation (9) was constructed to test whether the core explanatory variables had a significant effect on the mechanism variables. In the third step, if the coefficients of the core explanatory variables were all significant, a logical analysis was conducted with the help of literature analysis to explore whether the mechanism test was passed.
z j i t = β 0 + β 1 c i t y i t + β 2 y e a r i t + β 3 y e a r i t × c i t y i t + α i + ε i t
This study introduced four mechanism variables to examine the mechanism of the impact of the opening of HSR on regional economic growth: fixed asset investment, total cargo volume, foreign direct investment, and consumption index. The four variables were sequentially included in Equation (9) for regression, and the regression results are shown in Table 12 below.
The results from the above table show that, among others, the regression coefficient of the policy effect in column (1) was −0.0033, but it was not significant. It may be that fixed asset investment is related to the government’s fiscal status, and cities in the nonlateral regions are unable to make significant fixed asset investments in a short period of time due to their general government’s fiscal status [59]. Therefore, in general, the opening of HSR cannot significantly contribute to the improvement of fixed asset investment. The regression coefficient of the policy effect in column (2) was 0.2521 and was significantly positive at the 1% level. This shows that the opening of the HSR has effectively contributed to the growth of the total cargo volume, which is similar to the result of Masson et al. [50]. The regression coefficient of the policy effect in column (3) was 0.0453, but it was not significant. This suggests that the opening of the HSR did not significantly contribute to the increase in FDI, possibly because FDI is also influenced by external factors, such as the human capital situation and financial market conditions [60]. The regression coefficient of the policy effect in column (4) was −0.0134 but insignificant, which indicates that the opening of the HSR has not significantly raised the consumption index. The possible reason is that the opening of an HSR mainly drives up the consumption level of residents along the line but may exacerbate the imbalance of regional development, affecting the convenience of residents’ consumption in areas not on the HSR line, and thus making it insignificant in general [24].
Therefore, the mechanism analysis showed that the opening of the HSR has promoted regional economic growth mainly by increasing the total cargo volume, which verifies the hypothesis H2a of the previous theory.

7. Conclusions

Assessing the impact of the opening of HSR on regional economic growth not only offers an analysis of past HSR construction results but also provides experience for future HSR planning, so that the construction of HSR can maximize its economic benefits and promote regional economic growth along the HSR line. This paper used system dynamics theory to analyze the impact mechanism of the opening of an HSR on regional economic growth and then used the accessibility model and the DID model to analyze it, taking the Wuhan–Guangzhou HSR as an example for empirical analysis. Through theoretical and empirical analysis, the following conclusions were drawn:
Firstly, the opening of the HSR has had a positive impact on regional economic growth. The opening of the HSR has not only boosted the demand for related production materials, but also increased employment opportunities. At the same time, companies that use transportation as a production variable can improve their efficiency and save opportunity costs through the transportation of the HSR.
Secondly, the HSR has had a dampening effect on the regional economic growth rate, and this dampening effect has stage differences. In the early days following the opening of the HSR, the siphon effect generated by the HSR was obvious. However, as time moves on, this siphon effect will gradually weaken.
Thirdly, the impact of the opening of the HSR on regional economic growth has had a significant lag. The HSR opening had a significant dampening effect on regional economic growth during the initial period. However, over time, this negative effect has gradually slowed down.
Finally, the opening of the HSR promoted regional economic growth mainly through the impact mechanism of an “increased total cargo volume”.

8. Limitations and Future Research

This study used DID to construct an econometric model to study the impact of the opening of an HSR on regional economic growth, using the Wuhan–Guangzhou HSR as an example for empirical analysis. This model can be used to better plan the opening of HSR, providing the opening of the HSR and the realization of coordinated development of the region along the route as important references. However, there are still some gaps in this study, and further research needs to be carried out in the future, mainly in the following two areas:
Firstly, in the theoretical mechanism portion of the analysis, the impact of the opening of HSR on regional economic growth reflects many aspects. In this paper, only some of the more important aspects of the regional GDP and economic growth rate were selected for analysis, and the comprehensiveness of the analysis needs to be strengthened. Second, the overall analysis of the impact mechanism of the opening of the HSR on regional economic growth was presented. However, considering the differences in the frequency of opening an HSR in different cities, a particular HSR can be taken as the research object in future studies to explore its impact mechanism on regional economic growth.
Secondly, in terms of empirical analysis, the impact of the Wuhan–Guangzhou HSR on regional economic growth was mainly studied. Although there was some descriptive analysis of regional differences, quantitative comparisons were not performed in terms of spatial heterogeneity. The economic and geographic space are not balanced, and the impact of the opening of HSR on regional economic growth will be different due to the impact of spatial heterogeneity. This part of the content needs to be further studied in the future.
Finally, in the model design, this paper applied logarithms to eliminate the effect of the population. Future studies should consider expressing the GDP as per capita (not logarithms) and adding the population or population changes as an explanatory factor. In addition, the model designed in this paper did not examine the inclusion of temporal and spatial variables. In upcoming studies, the inclusion of temporal and spatial variables can be seen in the design of the model.

Author Contributions

Conceptualization and methodology, Y.Z.; software, Z.Z.; validation and formal analysis, Y.Z.; investigation and resources, S.L. and Z.Z.; data curation, Z.Z.; writing—original draft preparation, Y.Z.; writing—review and editing, C.Y.; visualization, C.Y.; supervision, C.Y.; project administration, S.L.; funding acquisition, C.Y. All authors have read and agreed to the published version of the manuscript.

Funding

This research was funded by “the National Social Science Foundation of China”, grant number (19FJYB043) and “the Fujian Soft Science Research Program”, grant number (2021R0019).

Institutional Review Board Statement

Not applicable.

Informed Consent Statement

Not applicable.

Data Availability Statement

The processed data required to reproduce these findings cannot be shared at this time as the data also forms part of an ongoing study.

Conflicts of Interest

The authors declare no conflict of interest.

References

  1. Aschauer, D.A. Is Public Expenditure Productive? J. Monet. Econ. 1989, 23, 177–200. [Google Scholar] [CrossRef]
  2. Lin, Y.; Qin, Y.; Wu, J.; Xu, M. Impact of high-speed rail on road traffic and greenhouse gas emissions. Nat. Clim. Chang. 2021, 11, 952–957. [Google Scholar] [CrossRef]
  3. Chen, C.-L.; Vickerman, R. Can transport infrastructure change region’s economic fortunes? Some evidence from Europe and China. Reg. Stud. 2017, 15, 144–160. [Google Scholar] [CrossRef]
  4. Wen, J.H.; Cai, X.P.; Chen, X.W. What transportation development brings to the talent gathering in small and medium-sized cities—Analysis of the research on the impact of transportation development on talent gathering in small and medium-sized cities. Chin. Tal. 2022, 4, 9–13. [Google Scholar]
  5. Ahlfeldt, G.M.; Feddersen, A. From periphery to core: Economic adjustments to high-speed railway. IEB Work. Pap. 2010, 38, 20–23. [Google Scholar]
  6. Kim, E.; Yi, Y. Impact analysis of high-speed rail investment on regional economic inequality: A hybrid approach using a transportation network-CGE model. J. Transp. Econ. Policy 2019, 53, 238–257. [Google Scholar]
  7. Cascetta, E.; Carteni, A.; Henke, I.; Pagliara, F. Economic growth, transport accessibility and regional impacts of high-speed railways in Italy: Ten years expost evaluation and future perspectives. Transp. Res. 2020, 139, 412–428. [Google Scholar] [CrossRef]
  8. Wang, H.J. Analysis and forecast of the affordability of China’s residents’ transportation expenditure. Railw. Econ. Res. 2014, 6, 8–12. [Google Scholar]
  9. Chandra, S.; Vadali, S. Evaluating accessibility impacts of the proposed America 2050 high-speed rail corridor for the Appalachian Region. J. Transp. Geogr. 2014, 37, 28–46. [Google Scholar] [CrossRef]
  10. Lai, F.B.; Liu, C.M.; Rong, Z. The effect of HSR on regional economic development and empirical test. Econ. Res. J. 2016, 37, 120–127. [Google Scholar] [CrossRef]
  11. Yu, J.B.; Zhou, Y.H.; Huang, Q.; Li, X.M.; Hou, Y.; Wang, X. Analysis of the impact of high-speed railway on county economic development based on the synthetic control method: The Hubei province in China. Math. Probl. Eng. 2021, 201, 1–16. [Google Scholar] [CrossRef]
  12. Kim, K.S. High-speed rail developments and spatial restructuring: A case study of the capital region in South Korea. Cities 2000, 17, 251–262. [Google Scholar] [CrossRef]
  13. Delaplace, A.; Pagliara, F.; Perrin, J.; Mermet, S. Can High Speed Rail foster the choice of destination for tourism purpose? Procedia-Soc. Behav. Sci. 2014, 111, 166–175. [Google Scholar] [CrossRef]
  14. Seitz, H. A dual economic analysis of the benefits of the public road networks. Ann. Reg. Sci. 1997, 27, 223–239. [Google Scholar] [CrossRef]
  15. Shirely, C.; Winston, C. Firm inventory behavior and the returns from highway infrastructure investments. J. Urban Econ. 2004, 55, 398–415. [Google Scholar] [CrossRef]
  16. Ouattara, B.; Zhang, Y. Infrastructure and long-run economic growth: Evidence from Chinese provinces. Empir. Econ. 2019, 57, 263–284. [Google Scholar] [CrossRef]
  17. Murakami, J.; Cervero, R. High-Speed Railway and Economic Development: Business Agglomerations and Policy Implication; University of California Transportation Center: Berkeley, CA, USA, 2012; Volume 6, pp. 35–45. [Google Scholar]
  18. Huang, Y.; Wang, Y.B. How does high-speed railway affect green innovation efficiency? A perspective of innovation factor mobility. J. Clean. Prod. 2019, 265, 121623–121635. [Google Scholar] [CrossRef]
  19. Eaton, D. Technology and innovation for a green economic. Rev. Eur. Comp. Int. Environ. Law 2013, 22, 62–67. [Google Scholar] [CrossRef]
  20. Gao, Y.Y.; Song, S.F.; Sun, J.; Zang, L.Z. Does high-speed rail connection really promote local economic? Evidence from China’s Yangtze River Delta. Rev. Dev. Econ. 2020, 24, 316–338. [Google Scholar] [CrossRef]
  21. Qin, Y. ‘No county left behind?’ the distributional impact of high-speed railway upgrades in China. J. Econ. Geogr. 2017, 17, 489–520. [Google Scholar]
  22. Vickerman, R. High-speed rail and regional development: The case of intermediate stations. J. Transp. Geogr. 2015, 42, 157–165. [Google Scholar] [CrossRef]
  23. Vickerman, R. High-speed rail in Europe: Experience and issues for future development. Ann. Reg. Sci. 1997, 31, 21–38. [Google Scholar] [CrossRef]
  24. Hall, P. Magic carpets and seamless webs: Opportunities and constraints for high-speed trains in Europe. Built Environ. 2009, 35, 59–69. [Google Scholar] [CrossRef]
  25. Faber, B. Trade integration, market size, and industrialization: Evidence from China’s National Trunk Highway System. Rev. Econ. Stud. 2014, 9, 1046–1070. [Google Scholar] [CrossRef]
  26. Ortega, E.; Lopez, E.; Monzon, A. Territorial cohesion impacts of high-speed rail at different planning levels. J. Transp. Geogr. 2012, 24, 130–141. [Google Scholar] [CrossRef]
  27. Wang, J.F.; Li, Z.G. Empirical evidence on the impact of Shanghai-Hangzhou High-speed rail on regional economic development along the route. Inq. Into Econ. Issues 2014, 9, 74–77. [Google Scholar]
  28. Ke, X.; Chen, H.; Hong, Y. Do China’s high-speed-rail projects promote local economic?—New evidence from a panel data approach. Chi. Eco. Revi. 2017, 44, 203–226. [Google Scholar] [CrossRef]
  29. Liang, Y.T.; Zhou, K.Y.; Lin, X.; Zhou, Z.K.; Sun, W.; Zeng, J.Q. Effectiveness of high-speed railway on regional economic growth for less developed areas. J. Trans. Geogr. 2020, 82, 102621. [Google Scholar] [CrossRef]
  30. Zou, W.; Chen, L.H.; Xiong, J.K. High-speed railway, market access and economic growth. Int. Rev. Econ. Financ. 2021, 76, 1282–1304. [Google Scholar] [CrossRef]
  31. Jia, S.M.; Zhou, C.Y.; Qin, C.L. No difference in effect of high-speed rail on regional economic growth based on match effect perspective. Transp. Res. Part A Policy Pract. 2017, 106, 144–157. [Google Scholar] [CrossRef]
  32. Li, F.; Su, Y.; Xie, J.P.; Zhu, W.J.; Wang, Y.H. The impact of high-speed rail opening on city economics along the silk road economic belt. Sustainability 2020, 12, 3176. [Google Scholar] [CrossRef]
  33. Wang, J.; Ding, J. High speed rail and its impacts on the urban spatial structure of China. Urban Plan. Int. 2011, 26, 49–54. [Google Scholar]
  34. Kopczewska, K. Efficiency of regional public investment: An NPV-based spatial econometric approach. Spat. Econ. Anal. 2016, 11, 413–431. [Google Scholar] [CrossRef]
  35. Gao, H.Y. Western Economics; People’s University of China Press: Beijing, China, 2014; pp. 589–595. [Google Scholar]
  36. Hess, D.B.; Almeida, T.M. Impact of proximity to light rail rapid transit on station-area property values in Buffalo, New York. Urban Stud. 2007, 44, 1041–1068. [Google Scholar] [CrossRef]
  37. Jiang, M.; Kim, E. Impact of high-speed railroad on regional income inequalities in China and Korea. Int. J. Urban Sci. 2016, 20, 393–406. [Google Scholar] [CrossRef]
  38. Clair, T.S.; Cook, T.D. Difference-in-differences methods in public finance. Natl. Tax J. 2015, 68, 319–338. [Google Scholar] [CrossRef]
  39. Ashenfelter, O.; Card, D. Using the longitudinal structure of earnings to estimate effect of training progress. Natl. Bur. Econ. Res. 1985, 67, 648–660. [Google Scholar] [CrossRef]
  40. Dai, N.; Hatoko, M. Reevaluation of Japanese high-speed rail construction: Recent situation of the north corridor Shinkansen and its way to completion. Transp. Policy 2007, 14, 150–164. [Google Scholar] [CrossRef]
  41. Fang, D.C. Mechanism and Measurement of Regional Spatial Structure Reconfiguration in the Era of High-Speed Rail; Economic Science Press: Beijing, China, 2017; pp. 106–136. [Google Scholar]
  42. Zou, M.Z.; Li, C.Y.; Xiong, Y.N. Analysis of Coupling Coordination Relationship between the Accessibility and Economic Linkage of a High-Speed Railway Network Case Study in Hunan, China. Sustainability 2022, 14, 7550. [Google Scholar] [CrossRef]
  43. Diao, M. Does growth follow the rail? The potential impact of high-speed rail on the economic geography of China. Transp. Res. Part A Policy Pract. 2019, 113, 279–290. [Google Scholar] [CrossRef]
  44. Jiao, J.; Wang, J.; Jin, F.; Dunford, M. Impacts on accessibility of China’s present and future HSR network. J. Transp. Geogr. 2014, 40, 123–132. [Google Scholar] [CrossRef]
  45. Wang, Z.B.; Xu, G.; Bao, C.; Xu, J.B.; Sun, F.H. Spatial and economic effects of the Bohai Strait Cross-Sea Channel on the transportation accessibility in China. Appl. Geogr. 2017, 83, 86–99. [Google Scholar] [CrossRef]
  46. Wu, Q.T.; Fan, J.; Zhang, H.G.; Ye, Y.Y. The spatial impacts model of trans-strait fixed links: A case study of the Pearl River Delta, China. J. Transp. Geogr. 2017, 63, 30–39. [Google Scholar] [CrossRef]
  47. Beck, T.; Levine, R.; Levkov, A. Big bad banks? The winners and losers from bank deregulation in the United States. J. Financ. 2010, 65, 637–1667. [Google Scholar] [CrossRef]
  48. Sasaki, K.; Ohashi, T.; Ando, A. High-speed rail transit impact on regional system: Does the Shinkansen contribute to dispersion? Ann. Reg. Sci. 1998, 31, 77–98. [Google Scholar] [CrossRef]
  49. Givoni, M. Development and impact of the modern high-speed train: A Review. Transp. Rev. 2006, 26, 593–611. [Google Scholar] [CrossRef]
  50. Masson, S.; Petiot, R. Can the high speed rail reinforce tourism attractiveness? The case of the high speed rail between Perpignan (France) and Barcelona (Spain). Technovation 2009, 29, 611–617. [Google Scholar] [CrossRef]
  51. Baliamoune-Lutz, M. Does FDI contribute to economic growth? Bus. Econ. 2004, 39, 49–57. [Google Scholar]
  52. Murayama, Y.J. The impact of railways on accessibility in the Japanese urban system. J. Transp. Geogr. 1994, 2, 87–100. [Google Scholar] [CrossRef]
  53. Jajri, I.; Ismail, R. Impact of labor quality on labor productivity and economic growth. Afr. J. Bus. Manag. 2010, 4, 486–495. [Google Scholar]
  54. Benson Durham, J. Absorptive capacity and the effects of foreign direct investment and equity foreign portfolio investment on economic growth. Eur. Econ. Rev. 2004, 4, 285–306. [Google Scholar] [CrossRef]
  55. Cheng, J.; Yi, J.; Dai, S.; Xiong, Y. Can low-carbon city construction facilitate green Growth? Evidence from China’s pilot low-carbon city initiative. J. Clean. Prod. 2019, 231, 1158–1170. [Google Scholar] [CrossRef]
  56. Zhou, M.; Lu, Y.; Du, Y.; Yao, X. Development zone establishment and regional manufacturing upgrading. China Ind. Econ. 2018, 3, 62–79. [Google Scholar] [CrossRef]
  57. Chen, Y.; Fan, Z.; Gu, X.; Zhou, L.-A. Arrival of young talent: The send-down movement and rural education in China. Am. Econ. Rev. 2020, 110, 3393–3430. [Google Scholar] [CrossRef]
  58. Zhang, H. Can low carbon city pilot policies reduce carbon emissions?—Evidence from a quasi-natural experiment. Econ. Manag. 2020, 42, 25–41. [Google Scholar]
  59. Hernandez, A.; Jimenez, J.L. Does high-speed rail generate spillovers on local budgets? Transp. Policy 2014, 35, 211–219. [Google Scholar] [CrossRef]
  60. Alfaro, L.; Chanda, A.; Kalemli-Ozcan, S.; Sayek, S. FDI and economic growth: The role of local financial markets. J. Int. Econ. 2014, 64, 89–99. [Google Scholar] [CrossRef]
Figure 1. Causal relationship between the opening of HSR and regional economic growth. Data source: self-organized by the author.
Sustainability 14 11390 g001
Figure 2. Regional distribution of DID sample cities.
Sustainability 14 11390 g002
Figure 3. Comparison of the total commuting time between cities along the line before and after the Wuhan–Guangzhou HSR opening.
Sustainability 14 11390 g003
Figure 4. Parallel trend test.
Sustainability 14 11390 g004
Figure 5. Placebo test.
Sustainability 14 11390 g005
Table 1. Description of variables.
Variable CategoryVariable RepresentationMeaning of Variables
Time dummy
variables
y e a r i t Takes the value of 1 when the HSR is completed, and 0 otherwise.
Spatial dummy
variables
c i t y i t Takes the value of 1 when the HSR is opened, and 0 otherwise.
HSR utility variables y e a r i t × c i t y i t Time and space dummy variable interaction terms
Relevant control
variables
c a p i t a l i t Capital
l a b o u r i t Labor force
i n d u s t r y i t Industry structure
p o p c a p i t a l i t Human capital
c a r g o i t Total cargo volume
f d i i t Foreign direct investment
t r c i t Consumption index
Table 2. Variable descriptive statistics.
Variable NameSymbolsUnitObservationAverage ValueStandard DeviationMaximum ValueMinimum Value
Time factor y e a r i t -3380.50.50110
Spatial factor c i t y i t -3380.3700.48410
High-speed railway factor y e a r i t × c i t y i t -3380.1850.38910
Capital c a p i t a l i t Billion 33815.5590.95018.12213.359
Workforce l a b o u r i t Million people3383.5430.7405.7971.977
Industrial structure i n d u s t r y i t Percentage33898.4872.28010086.720
Human capital p o p c a p i t a l i t 3380.0120.0140.1630.001
Cargo volume c a r g o i t Million tons 3388.8900.76411.4227.024
Foreign direct
investment
f d i i t Billion USD3383.0331.3246.880
Consumption index t r c i t -33815.2681.00318.35912.601
Data source: calculated and compiled from the 2005–2017 China Urban Statistical Yearbook (http://www.stas.gov.cn/tjsj/ndsj/, accessed on 29 July 2022), where variables, such as capital and labor force were indexed in order to keep the data on the same benchmark for comparison.
Table 3. Minimum travel time between cities along the Wuhan–Guangzhou railway before the opening of the HSR (unit: hours).
CityWuhanXianningYueyangChangshaZhuzhouHengyangChenzhouShaoguanQingyuanGuangzhou
Wuhan0.000.782.253.754.625.877.659.4012.6012.25
Xianning0.880.001.633.174.035.557.589.5011.3512.23
Yueyang2.281.500.001.432.273.555.357.109.229.78
Changsha3.873.001.380.000.632.003.775.507.628.00
Zhuzhou4.803.832.170.630.001.383.174.876.607.38
Hengyang6.355.403.532.001.400.001.673.375.075.88
Chenzhou8.207.385.533.823.231.730.001.633.284.10
Shaoguan10.009.407.235.534.853.351.620.001.532.32
Qingyuan12.8811.929.888.007.055.323.471.620.001.00
Guangzhou12.4511.989.758.007.275.724.002.300.750.00
Data source: the data came from the 12,306-train schedule and the authors’ own calculation and collation.
Table 4. The shortest travel time between cities along the Wuhan–Guangzhou HSR after the opening of the HSR (unit: hours).
CityWuhanXianningYueyangChangshaZhuzhouHengyangChenzhouShaoguanQingyuanGuangzhou
Wuhan0.000.400.821.301.601.972.473.003.553.68
Xianning0.400.000.501.001.321.652.132.783.123.42
Yueyang0.830.500.000.550.871.221.732.272.803.05
Changsha1.280.970.550.000.250.621.081.582.072.32
Zhuzhou1.751.450.920.280.000.450.921.472.002.15
Hengyang2.122.671.270.650.450.000.530.971.421.67
Chenzhou2.552.381.851.150.920.550.000.520.951.08
Shaoguan3.102.772.321.631.470.980.520.000.520.65
Qingyuan3.723.522.882.252.031.430.970.530.000.20
Guangzhou3.683.653.172.782.231.751.280.850.400.00
Data source: the data came from the 12,306-train schedule and the authors’ own calculation and collation.
Table 5. Total GDP and population of cities along the Wuhan–Guangzhou HSR line.
City2008 20092010200820092010
Wuhan4064.624741.695458.35833.24835.55836.73
Xianning369.88419.29522.83288.21290.62290.96
Yueyang1073.011249.411447.47551.51548.34565.62
Changsha3000.983744.764547.06645.14646.84652.4
Zhuzhou909.571024.891275.48383.04383.8390.27
Hengyang1000.091168.011420.34731.14739.8791.62
Chenzhou734.06843.231081.76471.00473.86502.07
Shaoguan545.87578.75683.1323.09325.54328.1
Qingyuan746.62861.591088.18405.8408.82413.47
Guangzhou8215.89146.7410,748.3784.14794.62806.14
Data source: the 2008–2010 statistical yearbook of each city. http://www.stas.gov.cn/tjsj/ndsj/, accessed on 29 July 2022.
Table 6. Total GDP and population of cities not on the Wuhan–Guangzhou HSR line.
City200820092010200820092010
Shiyan487.94551.94734.43351353.22353.19
Xiangyang1002.461201.011538.27584.4588.88592.38
Suizhou310.2341.91401.66256.11257.77257.12
Changsha636.76729.46865.91653.1657.12664.07
Jingzhou183.98203.1242.48163.95164.27164.75
Zhangjiajie1049.71239.231491.57614.16616.69623.11
Changde503.79559.48674.92504.63508.88509.72
Huaihua511.28591.62712.27467.66470.55476.36
Yiyang528.4568.31678.71418.4420.5432.99
Loudi627.75707.16870.85283.99289.1289.98
Xiangtan549.43600.69727.29754.09764.14793.97
Shaoyang394.13405.5475.14346.64348.98358.39
Heyuan477.88519.29612.85505.28507.36514.75
Meizhou725.03816.091009.51641.24649.11661.79
Jieyang350.23390.04465.08335.99340.61344.98
Shanwei483.84527.27639.84273.29275.67282.81
Yangjiang1280.591340.881570.42389.93391.52392.28
Jiangem487.94551.94734.43351353.22353.19
Data source: the 2008–2010 statistical yearbook of each city. http://www.stas.gov.cn/tjsj/ndsj/, accessed on 29 July 2022.
Table 7. Results of accessibility index measurements of the Wuhan–Guangzhou HSR line.
CityBefore OpeningAfter OpeningAccessibility Change Rate
Wuhan6.241.9468.96%
Xianning6.111.7671.16%
Yueyang4.771.5367.94%
Changsha4.081.2170.38%
Zhuzhou4.061.2968.24%
Hengyang4.041.2768.62%
Chenzhou4.381.3170.14%
Shaoguan4.871.4869.57%
Qingyuan6.091.7471.53%
Guangzhou5.901.8868.14%
Data source: calculated by the author.
Table 8. Results of the impact of the Wuhan–Guangzhou HSR on the regional GDP along the line.
Model(1)(2)(3)(4)(5)(6)(7)(8)
Variablelngdplngdplngdplngdplngdplngdplngdplngdp
HSR0.0653 **0.0702 **0.0672 **0.2315 ***0.2244
***
0.2209
***
0.1511
***
0.0884 *
(2.11)(2.24)(2.15)(3.79)(3.66)(3.68)(2.65)(1.72)
lncap 0.0634 **0.0641 **0.5551
***
0.5376
***
0.5305
***
0.3357 ***0.2340
***
(2.48)(2.51)(19.44)(16.51)(16.63)(8.06)(5.99)
lncargo 0.02820.1051 ***0.1049 ***0.0845 **0.1292 ***0.1626
***
(1.19)(2.63)(2.63)(2.13)(3.43)(4.79)
hc 2.8934 *2.8434 *2.7549 *1.38790.7888
(1.84)(1.81)(1.79)(0.96)(0.61)
industry 0.01410.01780.01860.0174 *
(1.12)(1.44)(1.61)(1.68)
lnfdi 0.1964 ***0.1633 ***0.2079 ***
(3.66)(3.24)(4.59)
lntrc 0.2857 ***0.1740 ***
(6.69)(4.32)
lnlab 1.0641 ***
(8.69)
_cons15.2738 ***14.3829 ***14.1272 ***6.6759 ***5.5547 ***4.8892 ***3.1404 ***2.3190 **
(578.97)(39.68)(33.54)(12.43)(4.90)(4.35)(2.90)(2.39)
N338338338338338338338338
Data source: obtained by collating the results from the model estimation. In the table, values in parentheses are standard deviations; *, **, and *** indicate significance at the 10%, 5%, and 1% statistical levels, respectively. The above results were calculated using Stata13.1.
Table 9. Measurement results of the impact of the Wuhan–Guangzhou HSR on regional economic growth along the line.
(1)(2)(3)(4)(5)(6)(7)(8)
gdpzzlgdpzzlgdpzzlgdpzzlgdpzzlgdpzzlgdpzzlgdpzzl
high-speed railway−1.7165 ***−1.5948 ***−1.6057 ***−1.6226 ***−1.6498 ***−1.6569 ***−1.6259 ***−1.6268 ***
(−2.86)(−2.79)(−2.79)(−2.78)(−2.82)(−2.83)(−2.77)(−2.78)
lncap 0.09250.09130.09290.01370.00860.05530.0180
(0.19)(0.19)(0.19)(0.03)(0.02)(0.11)(0.04)
lnhuoyun 0.09470.08940.09250.12000.19650.2162
(0.21)(0.20)(0.20)(0.25)(0.41)(0.45)
hc 2.90052.64172.46652.42622.2257
(0.19)(0.18)(0.16)(0.16)(0.15)
industry 0.09510.09780.10030.1494
(0.83)(0.85)(0.87)(1.26)
lnlab 0.35790.50090.8951
(0.22)(0.30)(0.53)
lnfdi −0.1189−0.2643
(−0.21)(−0.47)
lntrc 1.1940 *
(1.67)
_cons12.7115 ***11.3922 *10.584010.60022.45690.8318−0.7535−23.2088
(25.53)(1.68)(1.36)(1.36)(0.20)(0.06)(−0.05)(−1.13)
N338338338338338338338338
R20.51750.53850.53860.53870.53990.53990.54170.5466
Data source: obtained by collating the results from the model estimation. In the table, values in parentheses are standard deviations; *, and *** indicate significance at the 10%, 5%, and 1% statistical levels, respectively.
Table 10. Impact of the Wuhan–Guangzhou HSR opening on regional economic growth along the line (2011).
Explanatory Variable: GDP Growth Rate (2011)
Model Variables(1)(2)(3)(4)(5)(6)(7)(8)
time1−0.041 ***
(0.011)
−0.040 ***
(0.012)
−0.040 ***
(0.013)
−0.039 ***
(0.013)
−0.037 ***
(0.013)
−0.036 ***
(0.013)
−0.036 ***
(0.014)
−0.035 **
(0.014)
treat10.022 *
(0.012)
0.023 *
(0.014)
0.023 *
(0.014)
0.024 *
(0.014)
0.022
(0.014)
0.024 *
(0.014)
0.024 *
(0.014)
0.023
(0.014)
high-speed railway1−0.032 *
(0.018)
−0.032 *
(0.018)
−0.033 *
(0.018)
−0.033 *
(0.018)
−0.032 *
(0.017)
−0.031 *
(0.017)
−0.031 *
(0.017)
−0.030 *
(0.017)
lncapital −0.0007
(0.006)
−0.0019
(0.008)
0.0008
(0.009)
0.003
(0.008)
−0.001
(0.0087)
−0.0014
(0.010)
0.002
(0.010)
lnlabour 0.002
(0.009)
0.004
(0.010)
0.0008
(0.009)
0.007
(0.0113)
0.0067
(0.0119)
0.013
(0.0135)
industry −0.106
(0.087)
−0.0825
(0.0859)
−0.1059
(0.0873)
−0.109
(0.094)
−0.112
(0.0942)
popcapital −0.298 **
(0.118)
−0.321 ***
(0.124)
−0.323 **
(0.126)
−0.305 **
(0.129)
lnhuoyun −0.008
(0.0085)
−0.008
(0.0085)
−0.0079
(0.0086)
lnfdi 0.0006
(0.0078)
0.0027
(0.0083)
lntrc −0.012
(0.0124)
City FEYesYesYesYesYesYesYesYes
Time FEYesYesYesYesYesYesYesYes
cons0.184 ***
(0.007)
0.194 **
(0.083)
0.206 **
(0.099)
0.245 **
(0.104)
0.351***
(0.112)
0.395 ***
(0.123)
0.397 ***
(0.128)
0.466 ***
(0.145)
Observations338338338338338338338338
R20.1690.1690.1690.1730.2020.2050.2050.208
Data source: in the table, values in parentheses are standard deviations; *, **, and *** indicate significance at the 10%, 5%, and 1% statistical levels, respectively; the above results were calculated using Stata13.1 (College Station, TX, USA).
Table 11. Robustness test regression results.
Explanatory Variable: GDP Growth Rate
(1)(2)(3)
All explanatory variables
lagged by one period
−1.318 *
(−2.05)
High-speed railway factor −1.553
(−0.97)
−1.55 **
(−2.62)
Control variableYesYesYes
City FEYesYesYes
Time FEYesYesYes
0.4230.5440.543
Note: values in parentheses are t-values; * and ** indicate 10%, 5%, and 1% significance levels, respectively.
Table 12. Mechanism test regression results.
(1)(2)(3)(4)
Variablelncaplnhuoyunlnfdilntrc
HSR−0.00330.2521 ***0.0453−0.0134
(−0.05)(3.47)(0.84)(−0.28)
City FEYesYesYesYes
Time FEYesYesYesYes
ControlYesYesYesYes
_cons14.1283 ***8.8302 ***3.0223 ***14.3421 ***
(236.12)(317.07)(146.63)(351.25)
N338338338338
R20.79560.03730.00230.8881
Note: *** indicate 10%, 5%, and 1% significance levels, respectively.
Publisher’s Note: MDPI stays neutral with regard to jurisdictional claims in published maps and institutional affiliations.

