1. Introduction
Modern production life generates a large amount of sewage and wastewater, and aerators are essential equipment used for water treatment, so it is of great significance to study the performance of aerators. The operational characteristics of deep-shaft aerators [
1] were discussed as early as 1979 and the oxygen transfer rate per unit of power consumption was proposed as a measure.
Petrilli [
2] compared different models of aerators under the same operating conditions and used oxygen transfer efficiency as a measure. Shukla [
3,
4] studied jet aerators with different jet lengths, a different number of openings and outlet areas and measured the penetration depth, oxygen transfer factor, and oxygenation efficiency for different jet lengths; corresponding to each zone and discharge, the oxygen transfer efficiency increased with increasing discharge in air and jet length. At low flow rates, aerators with a smaller number of openings exhibited higher oxygen transfer efficiency, while at high flow rates, aerators with a larger number of openings produced higher oxygenation efficiency. Bılek [
5] optimized the design of flow channels under multiple angles of inclination for submersible aerators and designed a flow channel with a better flow effect by numerical simulation.
The more studied aerator is the inverted umbrella-type aerator. Scholars have used numerical simulations, experiments, and other methods to explore its flow performance in two-phase and three-phase flow. A comparison of the capabilities of various turbulence models predicted [
6,
7] for oxidation ditches was made to analyze the simulation results of the aerator’s flow field, streamline distribution, velocity distribution, free surface deformation, and turbulent kinetic energy in the operation. Dong [
8] found that different operating depths affect the oxygenation capacity of inverted umbrella aerators, the intensity of turbulence generated by the impeller gradually decreases with depth, and at a certain immersion depth, the standard oxygen transfer coefficient increases with the increase in rotational speed, and increases and then decreases with the decrease in immersion depth at a constant rotational speed.
Patil [
9] studied the working environment, the tank diameter, the ratio of impeller diameter to tank diameter, and the clearance between the impeller and the bottom of the tank, which have an effect when aeration is performed in the tank. Hu [
10] set up a sewage area in the numerical simulation, and the aerator needs to work in a sludge-doped environment, but its performance usually decreases with the increase of sludge concentration, and the sludge concentration in the shallow-water area varies a lot and the sludge distribution in deep-water areas is extensive. Zhang and Liu [
11,
12,
13] used the bubble characteristic, which is often considered in the study of centrifugal pumps, to reveal the intrinsic relationship between the bubble characteristic and the aeration performance. This characteristic was used to study the aeration machine and it was found that, under the same operating conditions, as the inlet air volume increases, the oxygen transfer coefficient increases, and, at the same time, the number of tiny bubbles in the water also increases, and the increase in the number of bubbles also implies an increase in the oxygenation capacity. After accumulating many research results on the characteristics of aerators, scholars conducted studies on optimizing aerator components [
14,
15,
16,
17] and compared them in an attempt to find an efficient form of oxygenation.
Previous scholars have done a lot of research on jet aerators and inverted umbrella aerators, mainly on the working depth and oxygenation components of the aerators. However, there are relatively few studies on centrifugal aerators. Therefore, this paper intends to study the effects of the working depth and the construction of the mixing chamber on the aeration and oxygenation performance of centrifugal aerators through a combination of numerical simulation and experiments. First, the reliability of the numerical simulation was verified by experiments, and then the flow rate, outlet flow, gas volume fraction, and standard oxygenation capacity of the aeration tank were compared to provide a reference for the efficient oxygenation and manufacture of centrifugal aerators.
2. Materials and Methods
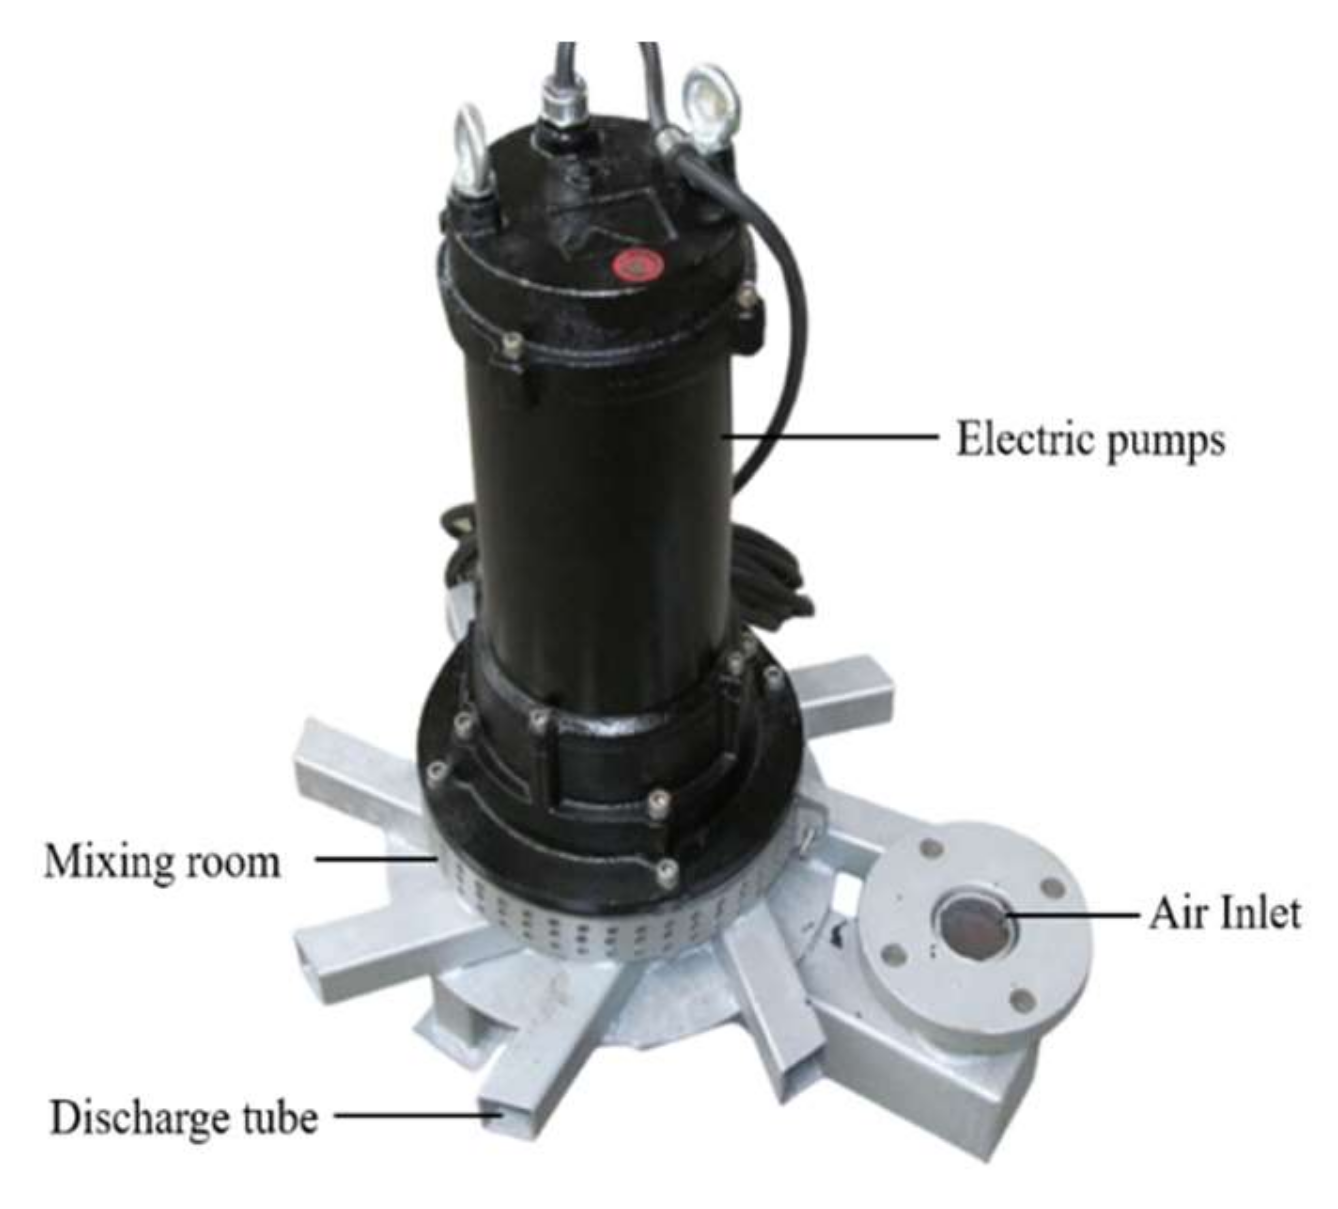
In this paper, a centrifugal aerator developed by a company in Jiangsu, China, is used as the research object, and its structural schematic is shown in
Figure 1. The main structural components of this centrifugal aerator include an electric pump, impeller, air inlet pipe, and mixing chamber.
The centrifugal submersible aerators are of direct-connected construction, simple and compact, capable of withstanding large loads on bearings, with oil-bath rotary shaft seals and air drawn into the impeller chamber to prevent water from coming into contact with the seals during operation, which ensures that they do not need to consider the risk of cavitation and cavitation [
18,
19,
20]. The rotating impeller generates a centrifugal force in the water, through which a negative pressure zone is formed around the impeller, and the air is drawn in through the inlet pipe. The drawn-in air and water are mixed in the mixing chamber and, subsequently, this good and uniform mixture is automatically discharged from the discharge outlet, thus achieving the effect of aeration and oxygenation. This process includes the following aspects: the air in the mixing chamber mixes with water to produce a gas–liquid mixing effect, and the gas–liquid mixture discharged from the outlet forms a circulation and convection; the high-speed movement of oxygen in a large number of air molecules obtains an extremely high oxygen absorption efficiency.
The operation of a centrifugal aerator involves two-phase gas–liquid flow, so a generalized form of the two-phase gas–liquid turbulence model is used. That is, the k–ε turbulence model is introduced in the gas and liquid separately. Assuming that the liquid phase is an incompressible fluid, and the gas phase is an incompressible ideal gas, the continuity equation is as follows.
The momentum equation is as follows
where
is the volume force, N;
is the number of mixing phases;
is the pressure, Pa;
is the temperature, k;
is the mass-averaged flow velocity, m/s;
is the mixing density, kg/m
3;
is the mixing viscosity coefficient, Pa·s;
is the volume fraction of the kth phase;
is the density of the kth phase, kg/m
3; and
is the drift velocity of the kth phase, m/s.
3. Results and Discussion
3.1. Numerical Simulation Accuracy Verification
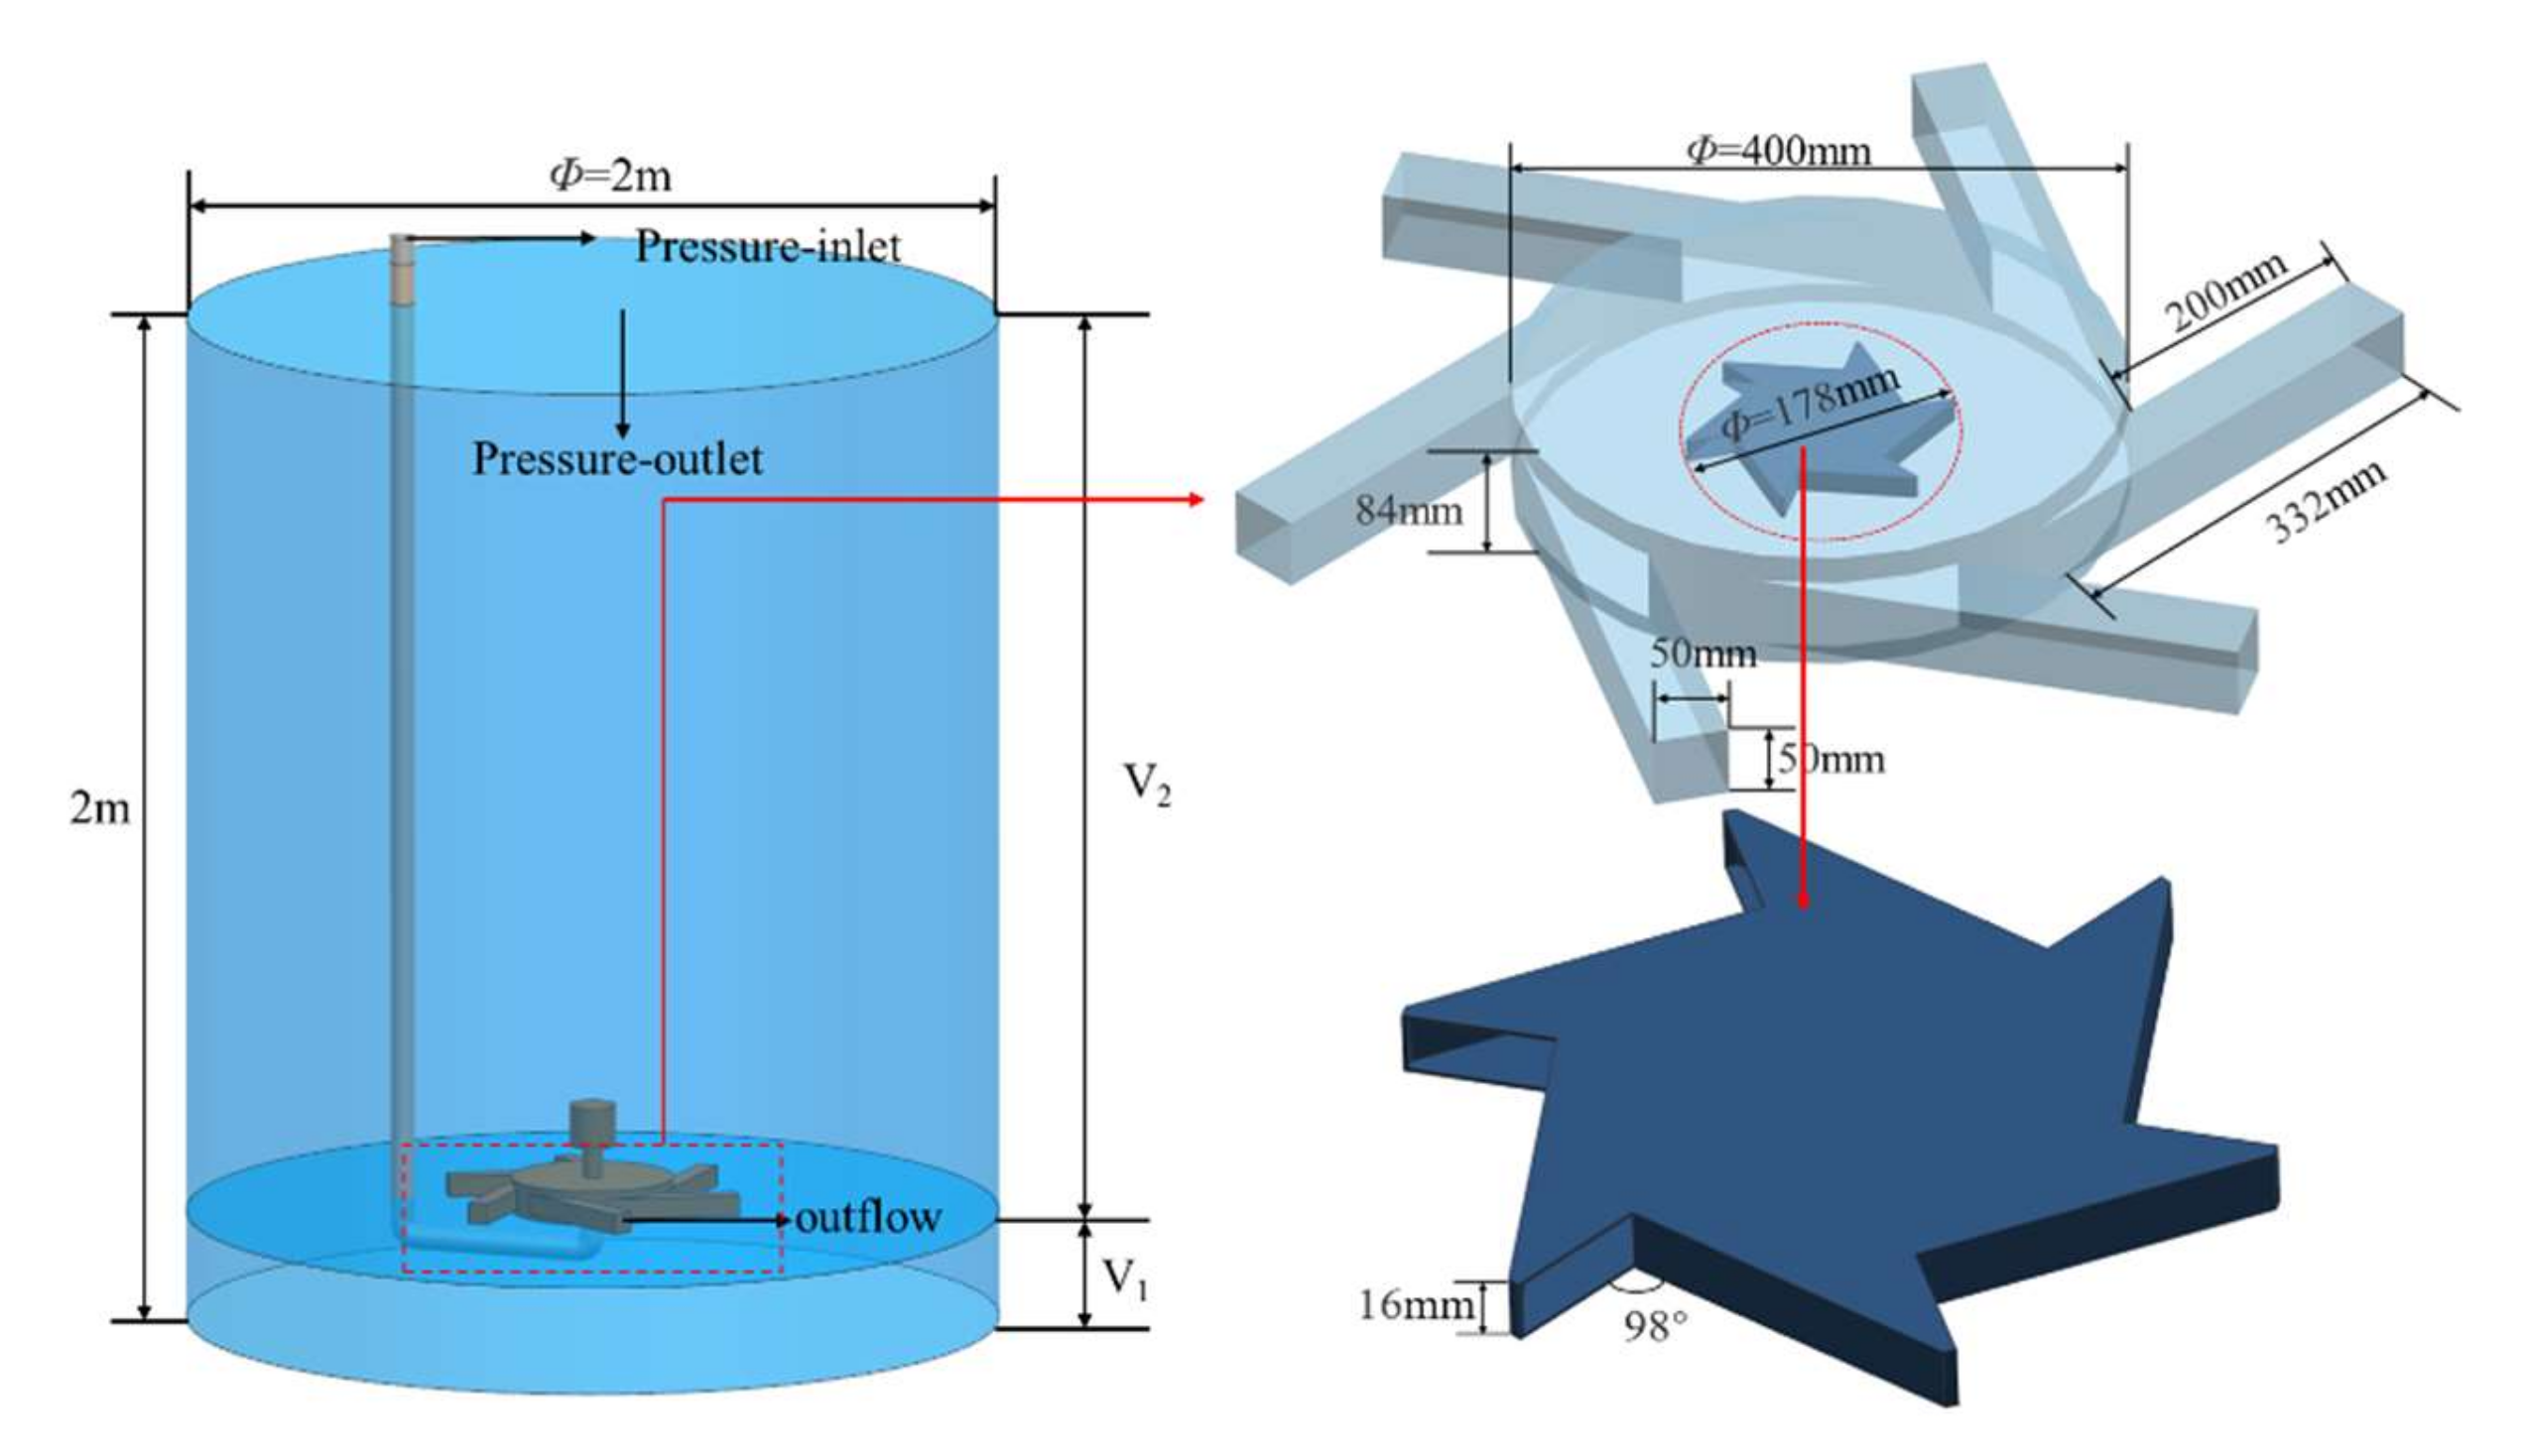
The centrifugal aerator working model and boundary conditions are shown in
Figure 2; the aeration tank is a cylindrical aeration tank with a diameter of 2 m and a depth of 2 m. The centrifugal aerator mixing chamber has a diameter of 400 mm, thickness of 84 mm, discharge outlet area of 50 mm × 50 mm, and, for the discharge tube set, the outer edge length is 332 mm; the inner edge length of 200 mm is used for the six discharge type. The rotor is an open structure with a diameter of 178 mm and a blade thickness of 16 mm. Six blades are arranged and the angle of the two adjacent blades is 98°. Since the rotor blades are placed in the mixing chamber, and the air and water are induced at the same time and need to play a mixing role, it is designed as an open type.
Numerical simulations were performed on the FLUENT software platform. To accurately simulate the turbulent flow state in the rotor area and capture the flow characteristics within the mixing chamber, the aeration process was set up with the corresponding centrifugal aerator operating environment. Including gravitational acceleration, pool surface atmospheric pressure blades, a rotation axis set to Z-axis, and a speed of 1470 rpm, the two-phase flow model selected the VOF model; the standard k–ε turbulence calculation model was selected; inlet pipe was set to the pressure inlet, the discharge port was set to the outflow, and, since gas escapes from the top of the aeration tank, it was set to the pressure outlet. The SIMPLE algorithm is used for the coupled velocity–pressure solution. The boundary of the calculation area consists of the solid boundary and the surface of the mixing chamber; all walls, shafts, aerator blades, and aerator surfaces are used with no-slip wall boundary conditions.
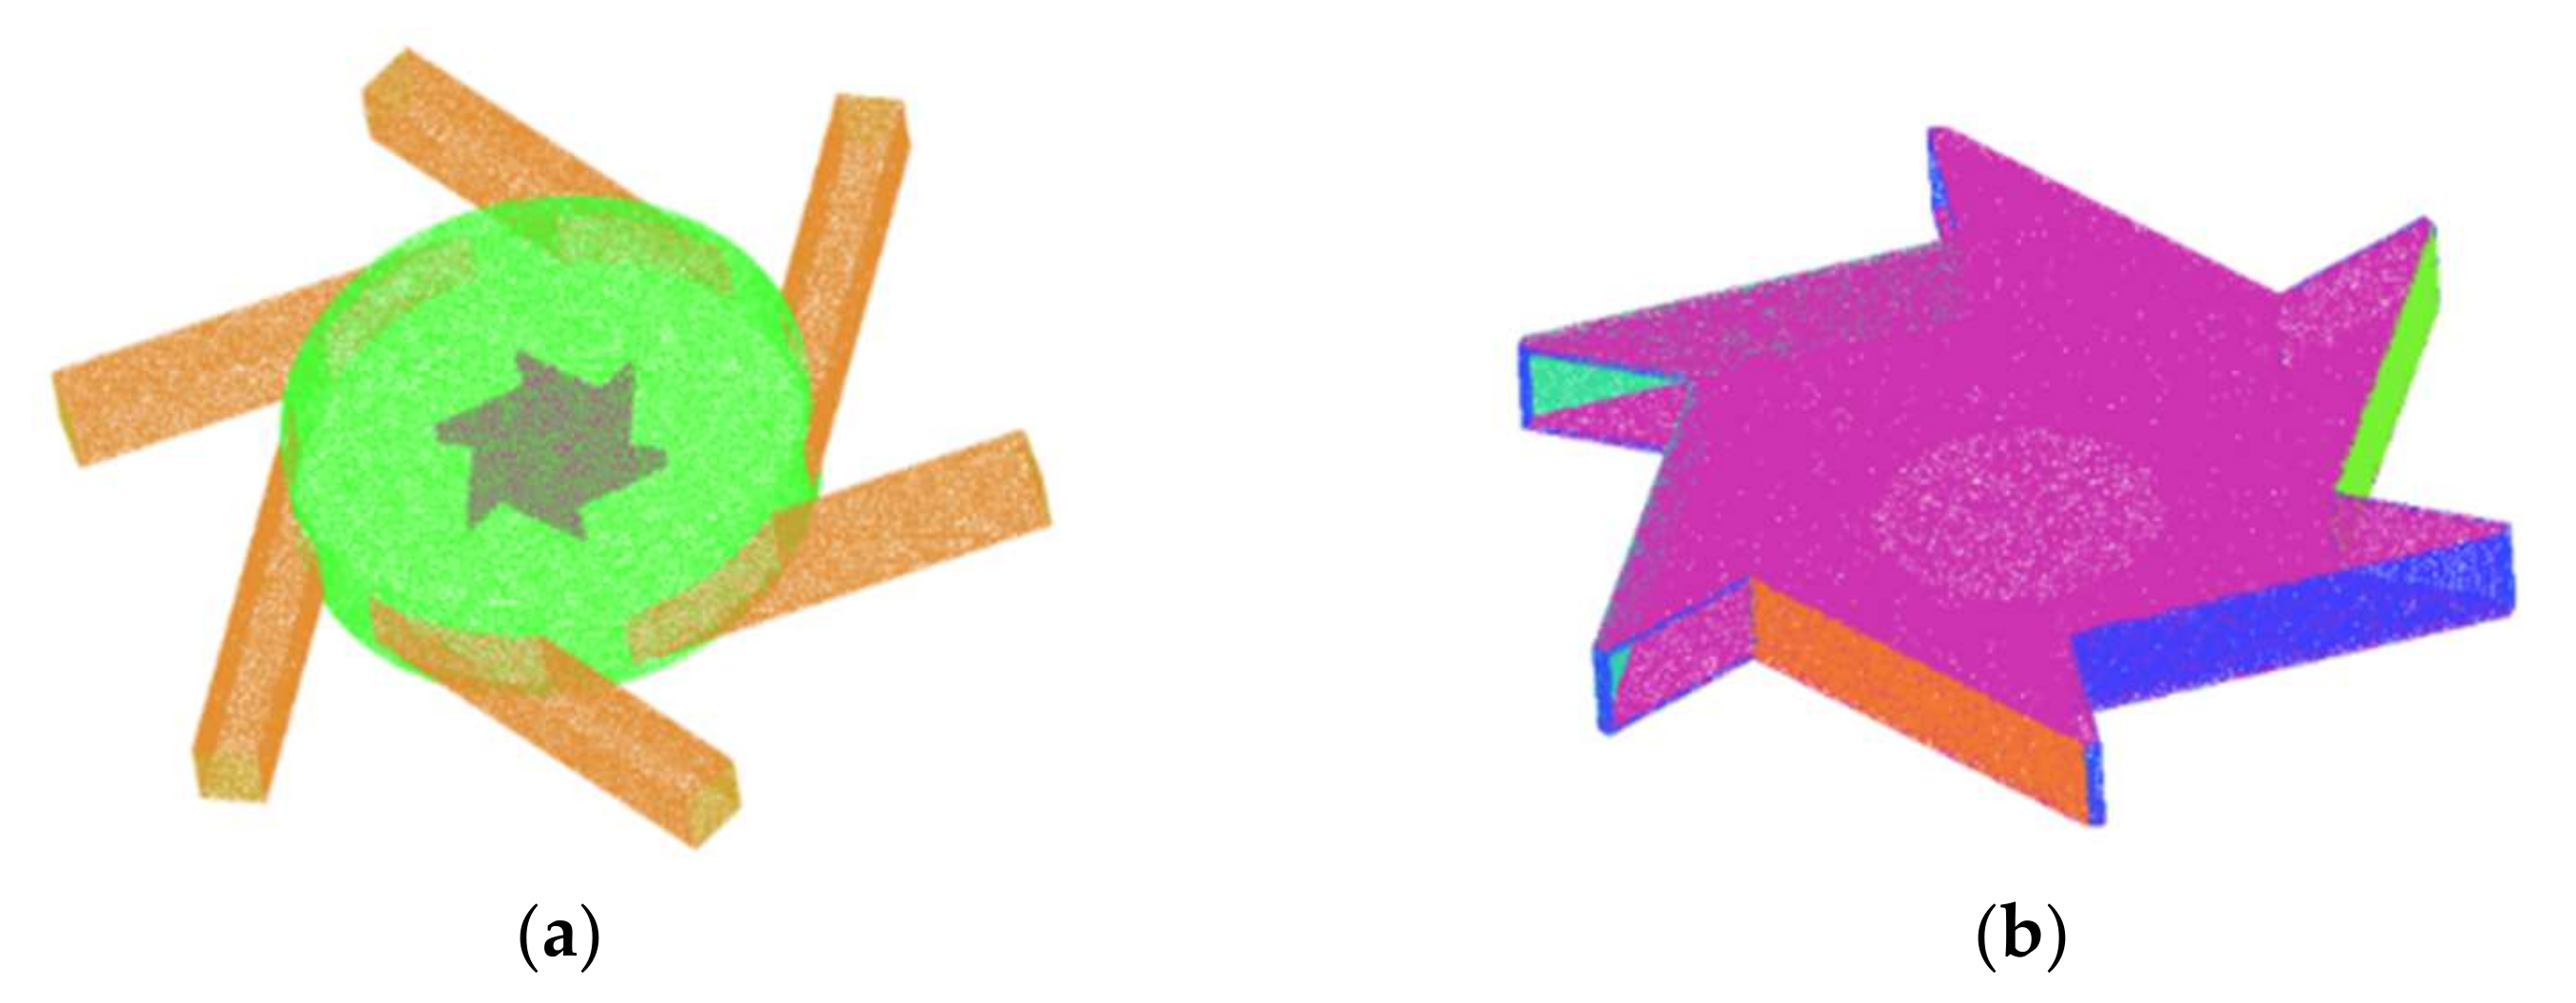
The numerical simulation uses ICEM software to mesh the fluid calculation area. The mesh partitioning is applied to computational fluid dynamics principles to realize the area discretization, and the quality of the mesh has an impact on the calculation time and the accuracy of the calculation results. For the centrifugal aerator in this simulation, a well-adapted unstructured mesh is used to form the topology of the rotating region within the mixing chamber, as shown in
Figure 3, and a mesh-independent analysis is performed.
The k–ω turbulence model is used because it is consistent with flow separation and overall performance. An implicit unsteady state approach is used to solve the discrete Navier–Stokes equations. For the convective term, we chose a second-order upwind scheme. The coupled algorithm for solving the pressure and velocity is the SIMPLE algorithm. The convective term is used for the second-order upwind algorithm, while the time discretization is used for the second-order central difference scheme. Using the Eulerian multiphase flow model, the volume fraction method (VOF) is used to track the free surface in real time during the calculation. The time step was set to 0.040816 s, which corresponds to one rotation of the impeller.
The grid needs to be dense enough to obtain accurate and detailed information; meanwhile, the computational cost has to be reasonably reduced. To strike a balance, five rotating domain grid resolutions with 1.21 million initial cells in the rotating domain, but with a growth rate of 1.3, were used to perform grid correlation verification of the inlet velocity of the centrifugal aerator.
Table 1 compares these grid data. As shown in the table, compared to the experimentally measured inlet velocity V = 5.646 m/s, the error is not significant when the number of grids in the rotating domain exceeds 2.05 million cells.
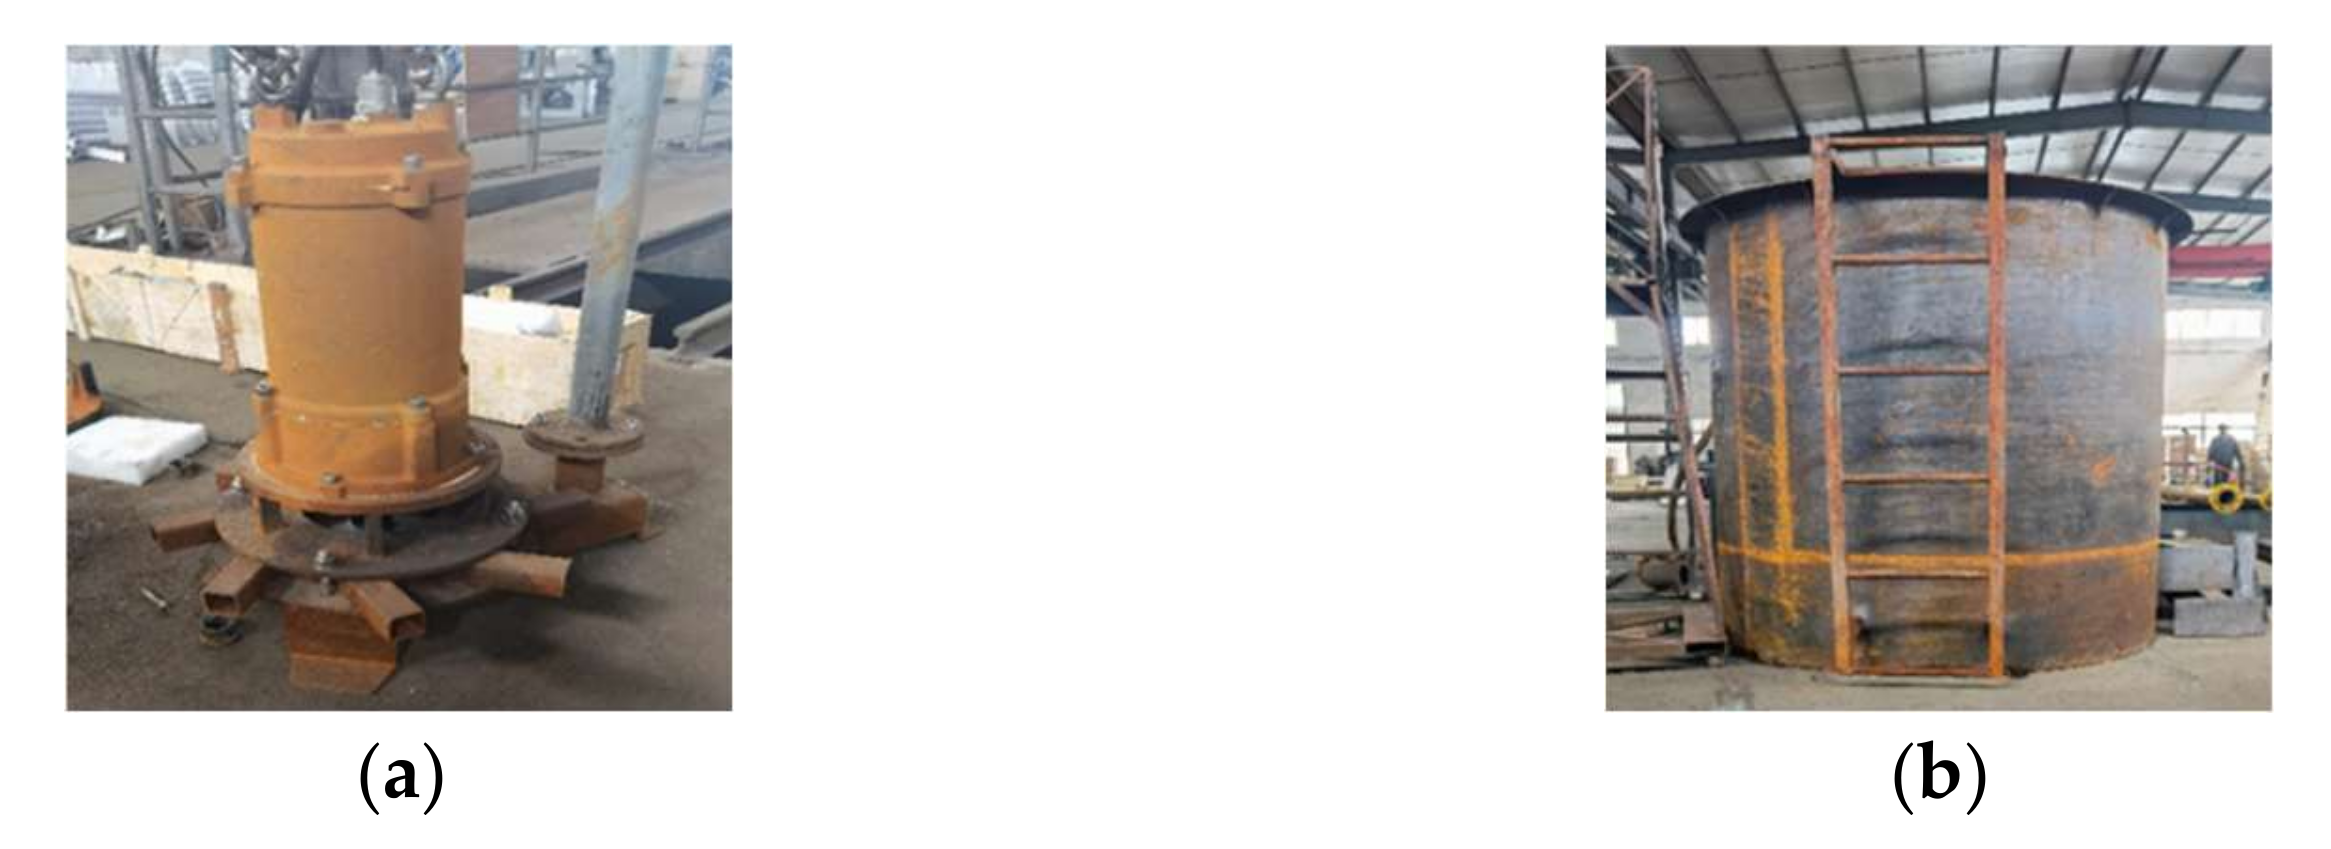
The test object includes a 1.5 kw centrifugal aerator and an aeration tank, as shown in
Figure 4, and this simulated aeration tank is a cylindrical aeration tank with a diameter of 2 m and a depth of 2 m. As can be seen in
Figure 2, the number of the centrifugal aerator discharge tube is six, with each discharge tube outlet having a size of 5 cm × 5 cm, an aeration pool with a diameter of 2 m, and a drum depth of 2 m. The test apparatus and reagents are shown in
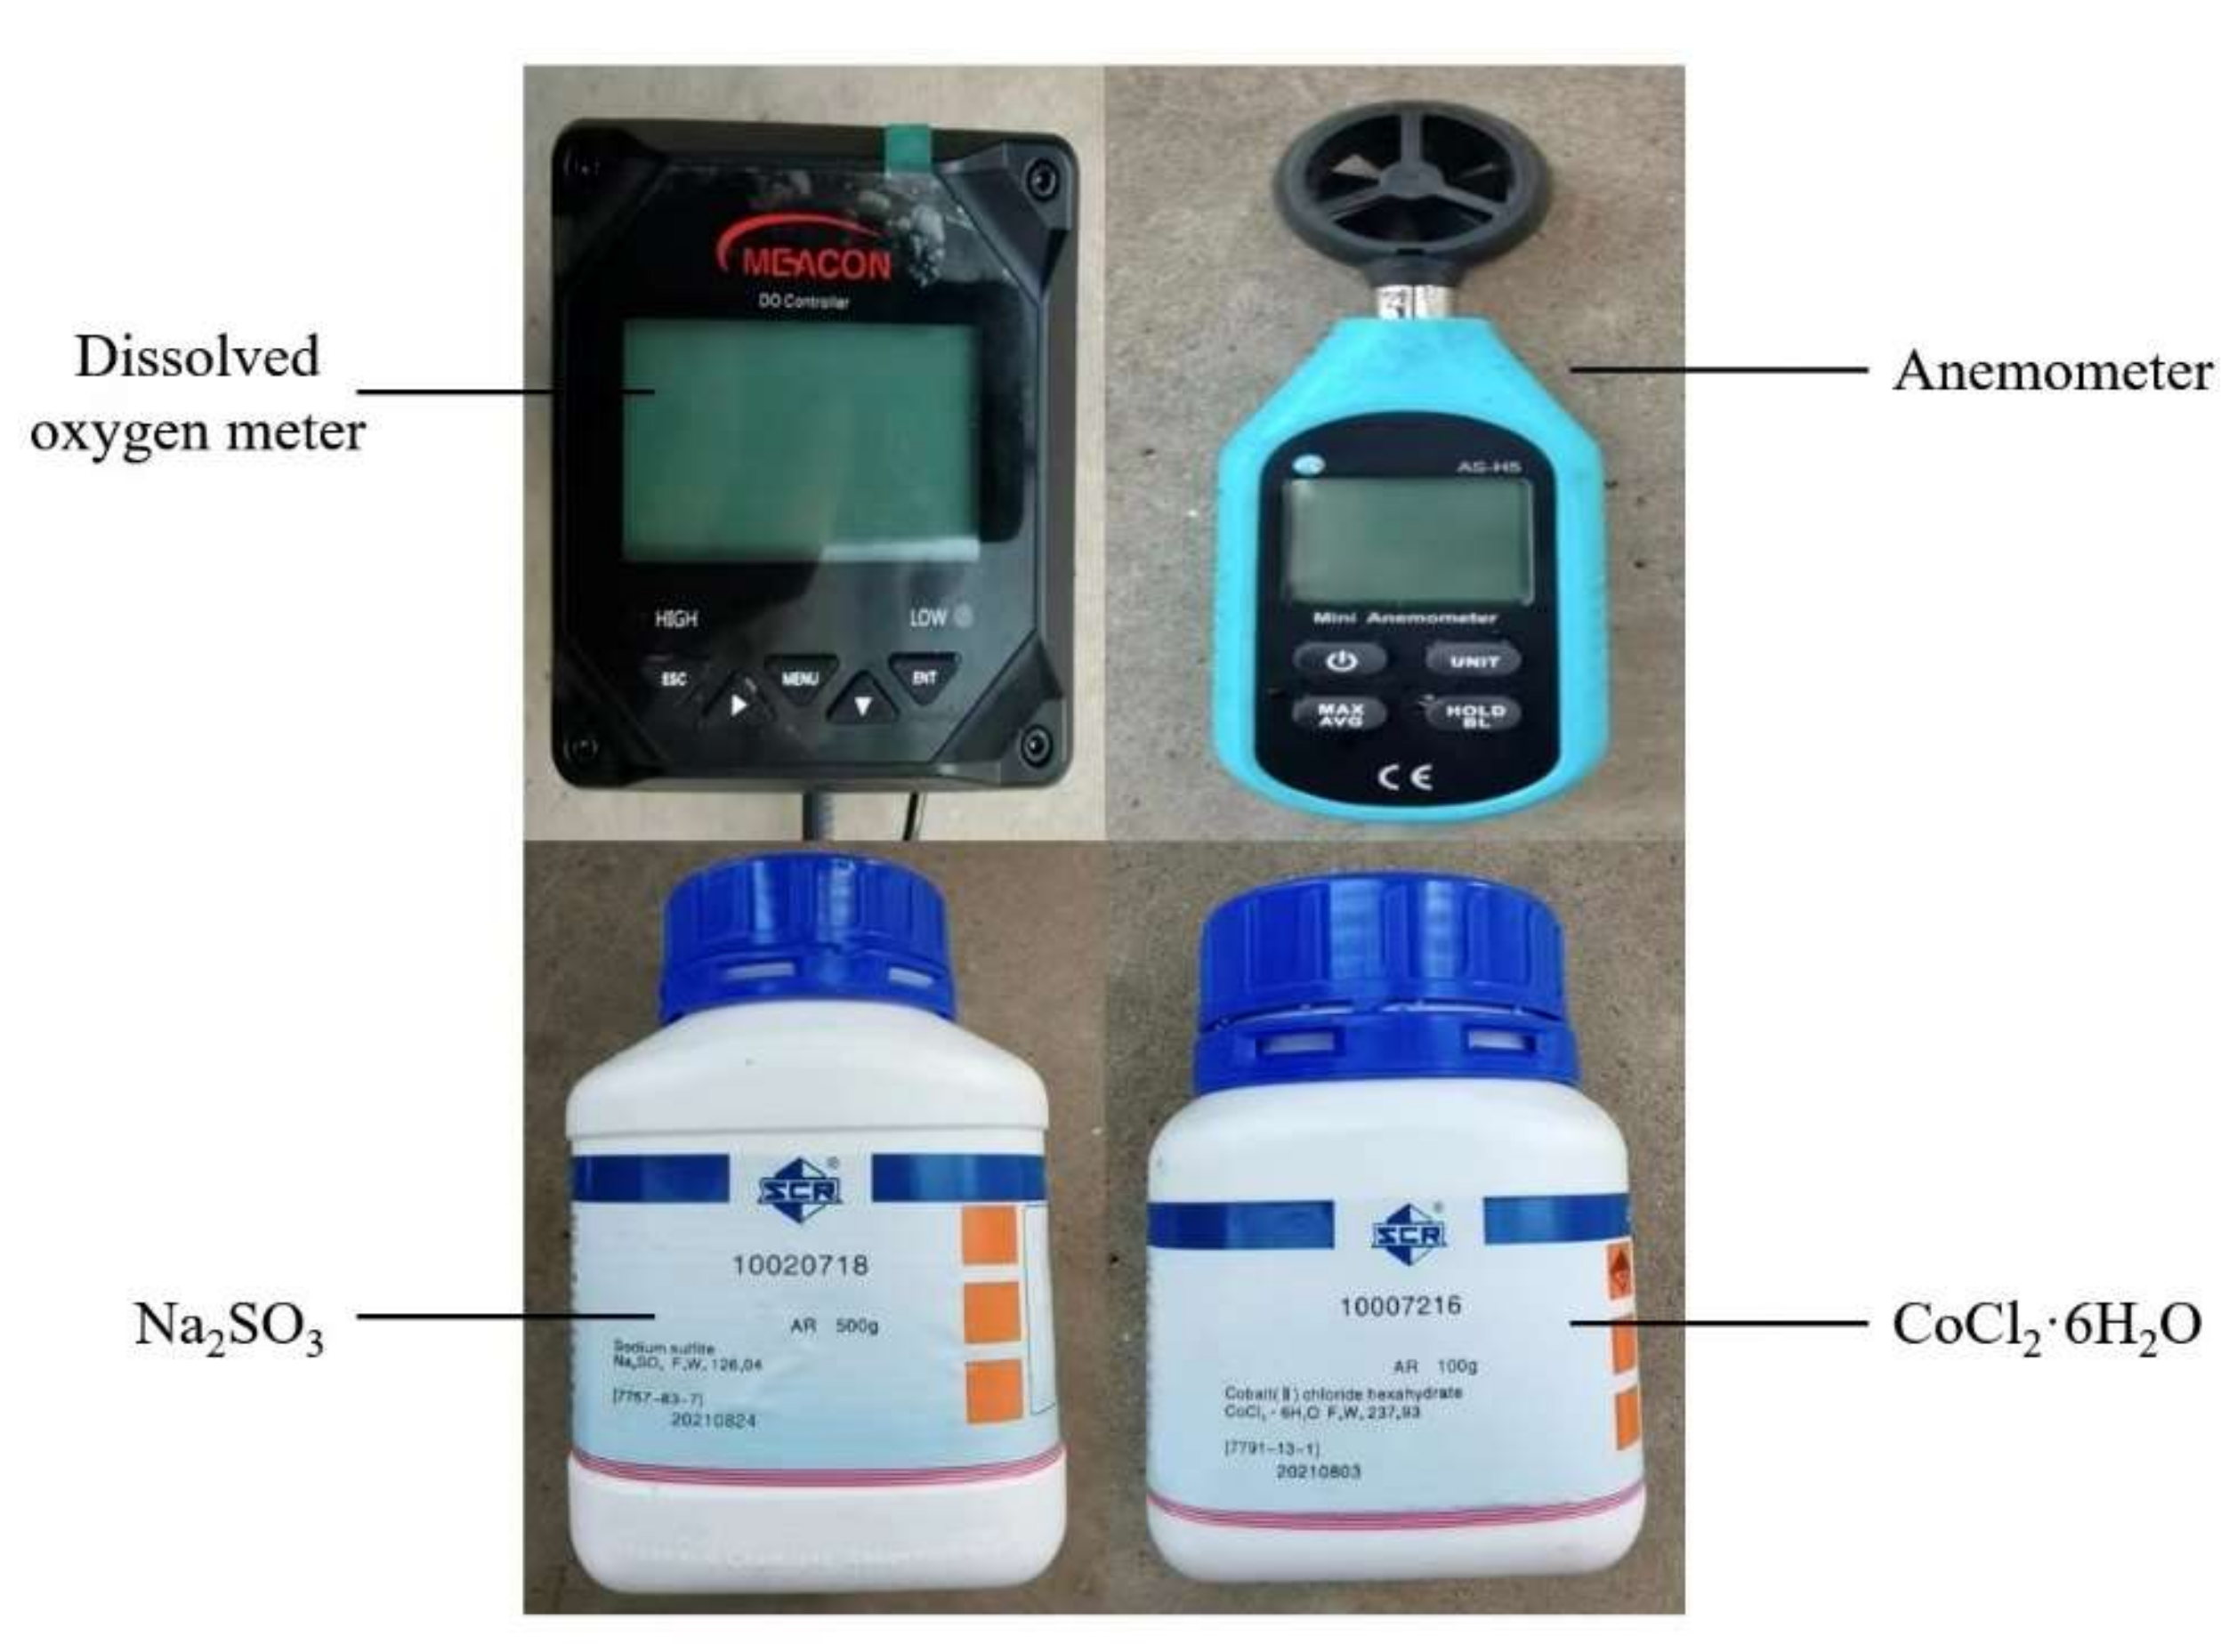
Figure 5, including a centrifugal anemometer, dissolved oxygen meter (with temperature measurement function), anhydrous sodium sulfite, cobalt chloride hexahydrate, and other components.
The dissolved oxygen meter was selected from Hangzhou MIK-DM3000 to measure the temperature and dissolved oxygen concentration in the aeration tank, with a temperature measurement range of 0~40 °C and a basic error of ±0.5 °C. The dissolved oxygen concentration was measured from 0~20 mg/L with a basic error of ±0.2 mg/L. The anemometer was selected from Wuhan Servcorp AS-H5, with a wind speed range of 0–30 m/s and a basic error of ±0.5 m/s. The deoxidizer and catalyst used in the test were CoCl
2–6H
2O hexahydrate and Na
2SO
3 anhydrous. The specific parameters of the instruments and reagents used in the centrifugal aerator test are shown in
Table 2 and
Table 3.
The centrifugal aerator, motor, dissolved oxygen meter, and anemometer are connected and placed in the center of the aeration pool, and the centrifugal aerator is 0.3 m from the bottom of the pool. The experimental steps are as follows.
- (1)
Add water to the aeration pool to record the height, H.
- (2)
Turn on the dissolved oxygen meter and calibrate it; place the probe of the dissolved oxygen meter at 0.3 m from the liquid surface.
- (3)
Put anhydrous sodium sulfite and cobalt chloride hexahydrate into the aeration tank to exclude dissolved oxygen in the water, observe the dissolved oxygen meter until the reading no longer drops, and record the value.
- (4)
Start the centrifugal aerator.
- (5)
Record the dissolved oxygen concentration, and thereafter record the data every 30 s; when the reading no longer changes, the dissolved oxygen in the water is considered to have reached saturation, therefore stop the experiment.
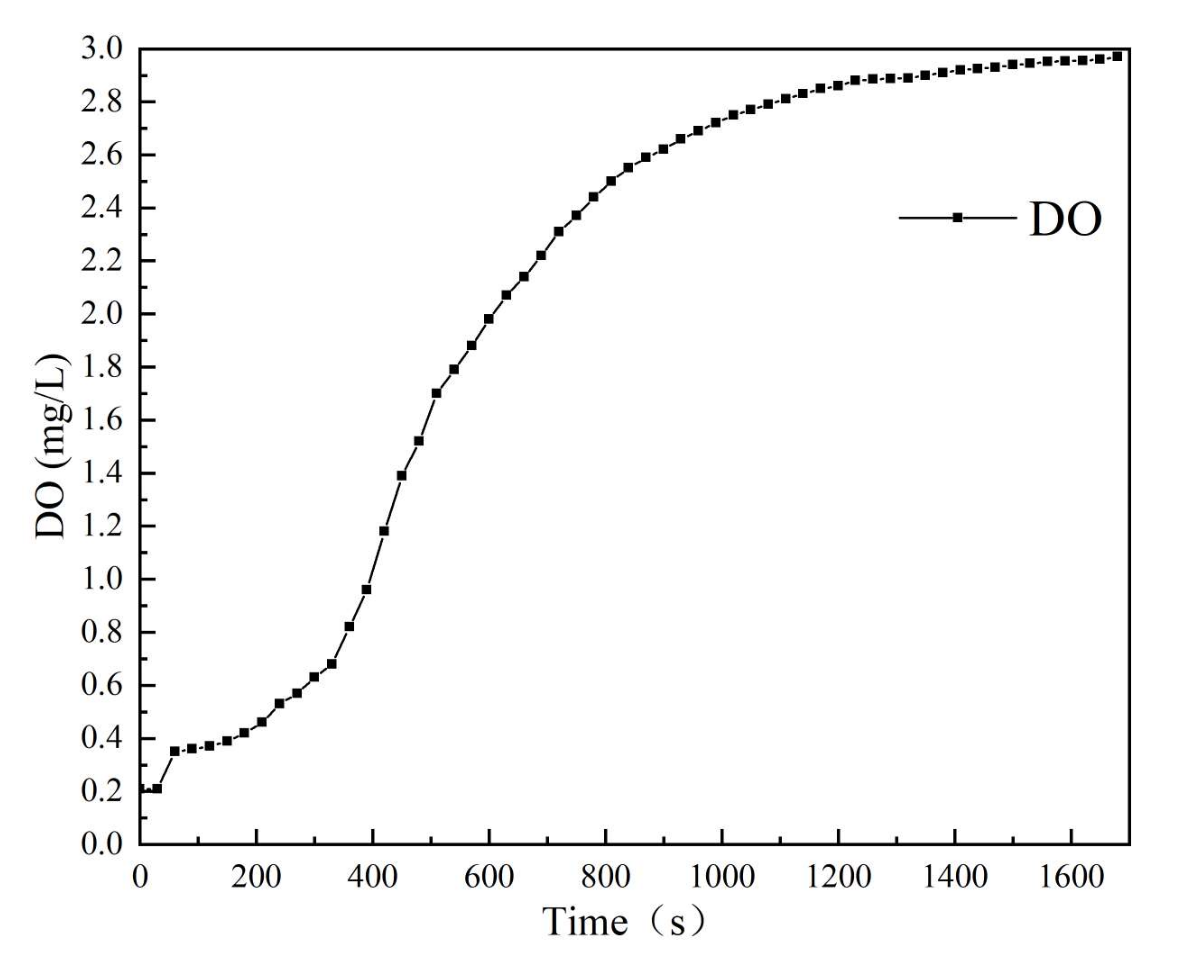
As can be seen from the experimental results in
Figure 6, the dissolved oxygen in the aeration tank reached saturation after 25 min. In the first 7 min, the dissolved oxygen amount increased more; after 7 min, with the increase in time, the dissolved oxygen concentration increased more slowly.
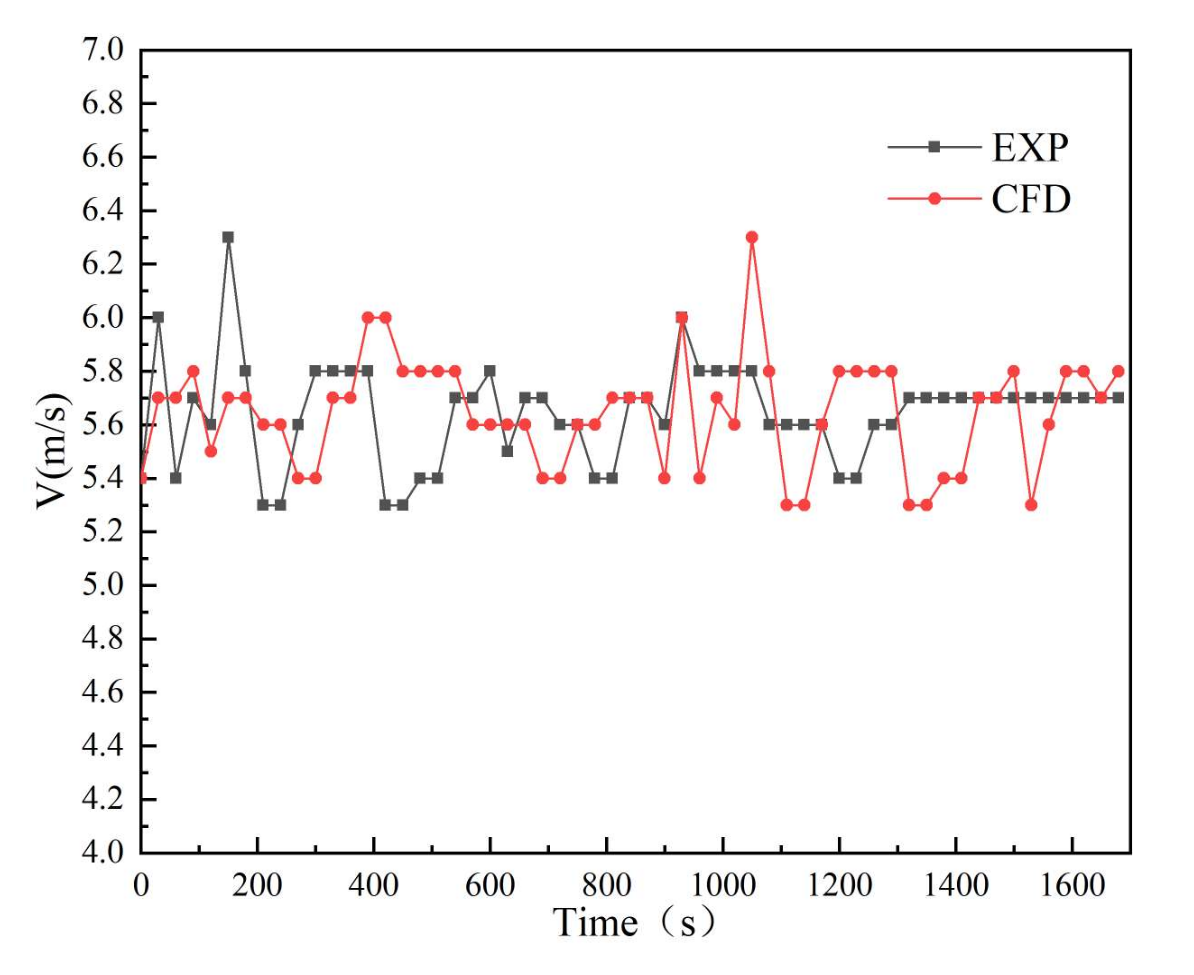
As the diameter of the inlet duct is 40 mm, the air speed measured by the anemometer ranges from 5.3 to 6.3 m/s, and the inlet volume can be obtained from 23.97 to 28.50 m
3/h. The simulated gas flow velocity at the inlet port monitored by the numerical model with time changes is compared with the experimentally measured wind velocity, as shown in
Figure 7, and the relative error of the numerical simulation is compared with the experimentally measured average wind velocity V = 5.646 m/s. The relative error is 2.28%.
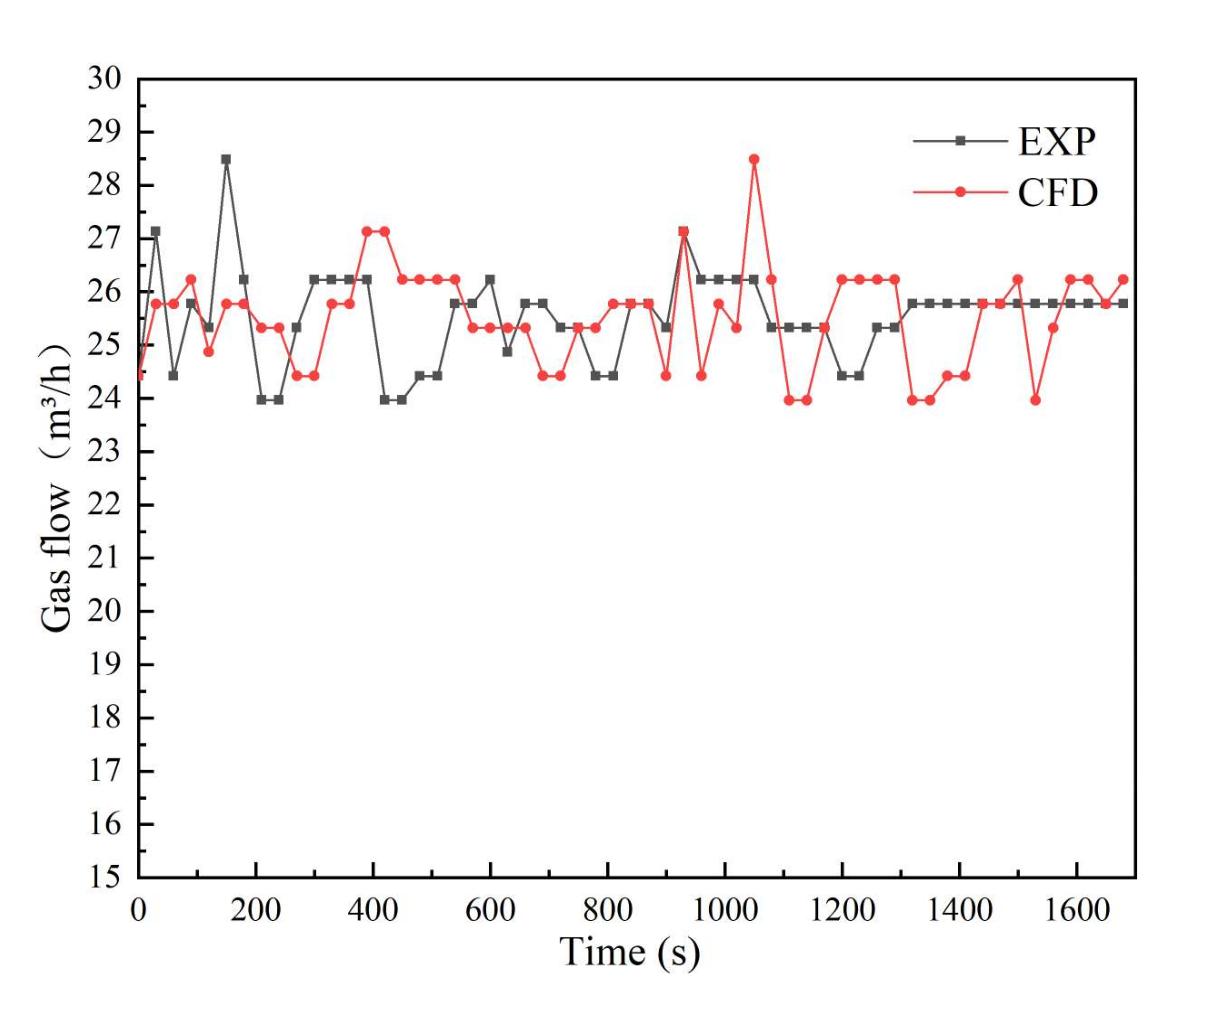
The variation of the inlet air flow rate with time for the experimental and numerical models is shown in
Figure 8. When the motor is just turned on, the experimentally measured inlet air flow rate is slightly lower than the results obtained from numerical simulation, which is due to the unstable voltage when the motor is just turned on, resulting in the speed not reaching the rated speed, leading to a slightly lower inlet air volume; when the voltage is stable, the inlet air flow rate floats insignificantly, and the average inlet air flow rate obtained from numerical simulation has only a 2.23% relative error compared to the average measured value Q = 25.527 m
3/h obtained from the experimental test. Therefore, the numerical simulation shows good accuracy, and the results reflect the real aeration and oxygenation capacity of the centrifugal aerator.
3.2. Verification of the Necessity of the Discharge Tube
The mixing chamber of a centrifugal aerator used for wastewater treatment is available in two forms, with and without a discharge tube, and the model is shown in
Figure 9. Therefore, the necessity of the discharge tube is first investigated by numerical simulation.
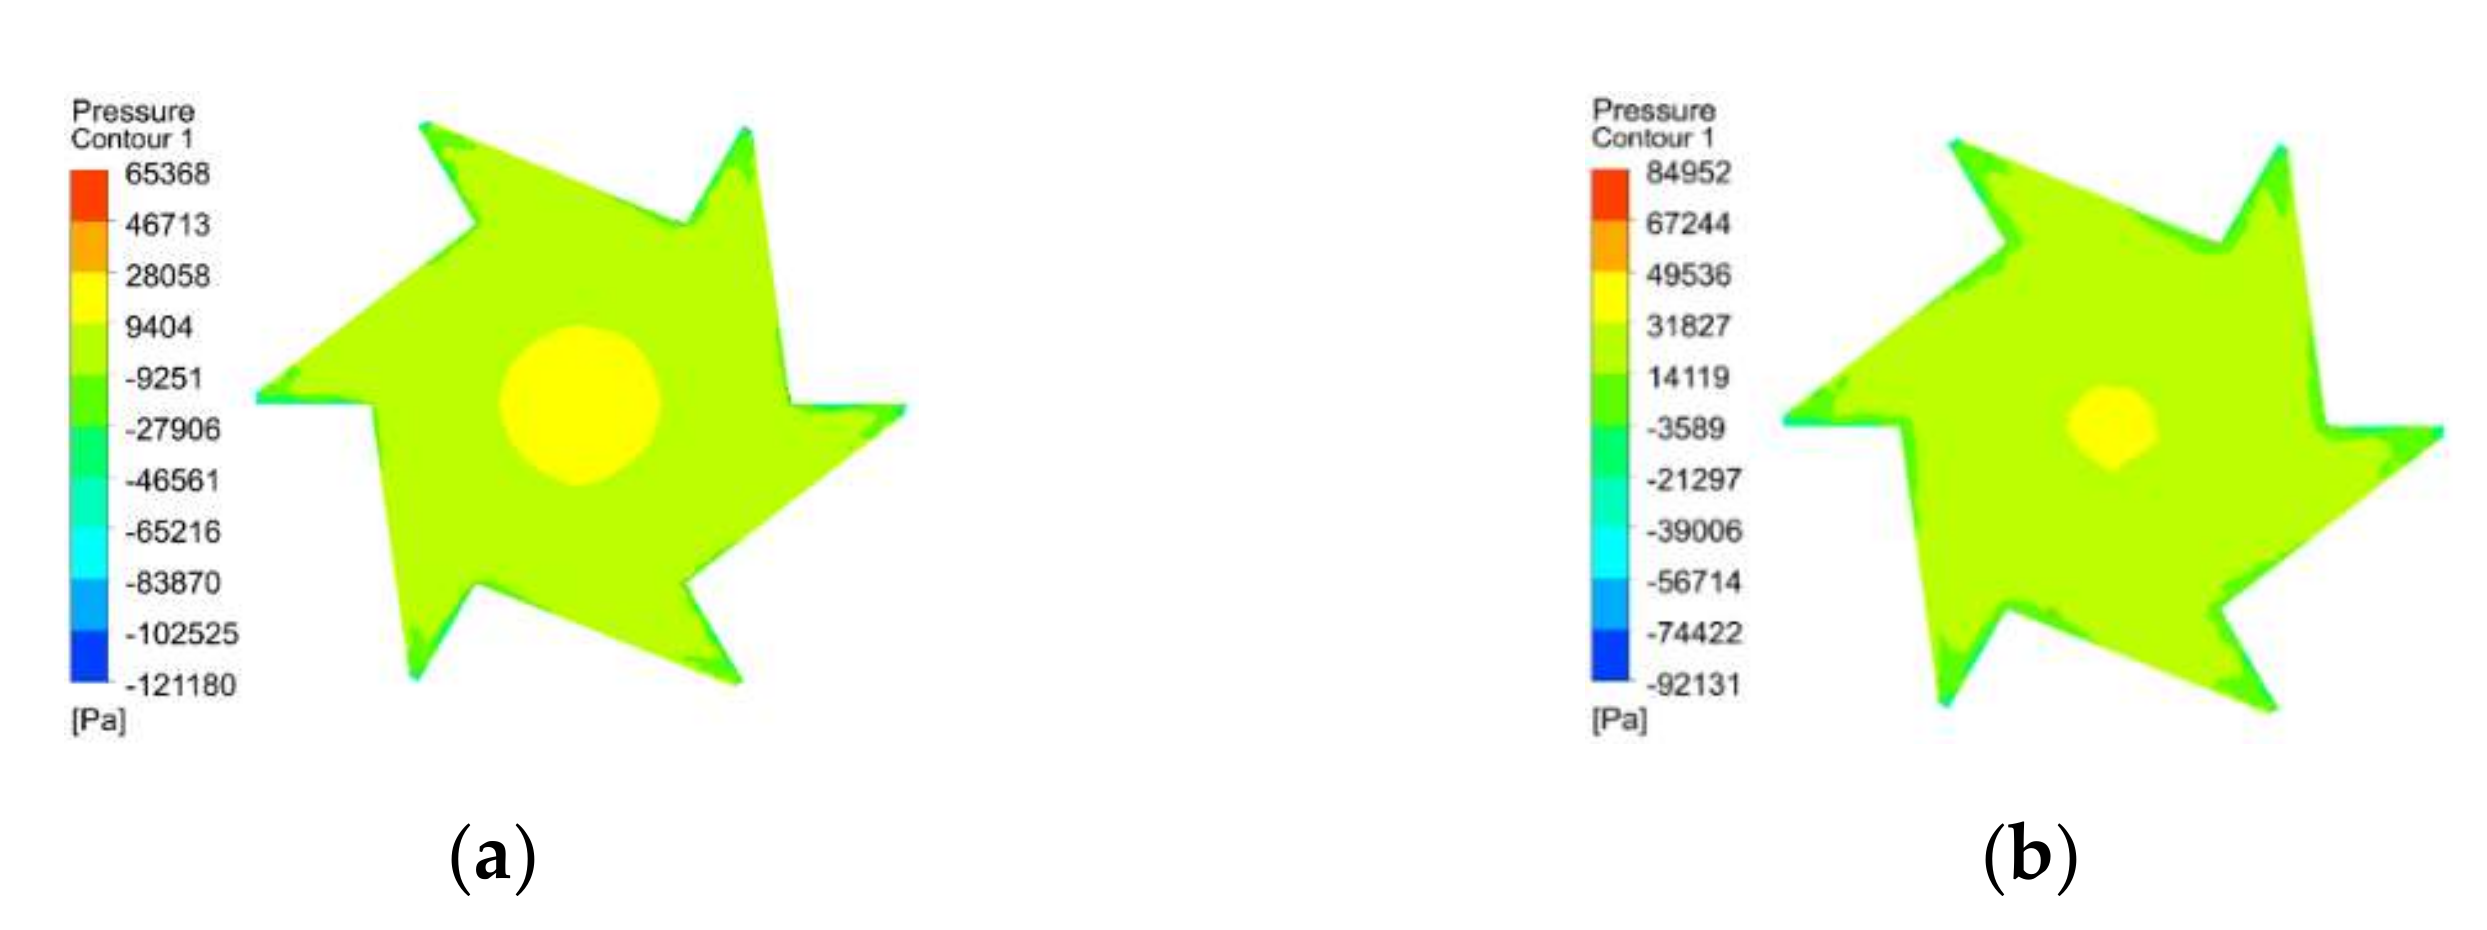
Figure 10a,b are the pressure clouds of the rotor blades without and with a discharge tube, respectively; from the figure, it can be seen that, without a discharge tube, the maximum pressure on the working surface is 65,368 Pa, the minimum pressure is −121,180 Pa, and the maximum pressure difference is 186,548 Pa. When the discharge tube is arranged, the maximum pressure on the working surface is 84,952 Pa, the minimum pressure is −92,131 Pa, and the maximum pressure difference is 177,083 Pa. According to Bernoulli’s principle and its corollary, in water flow or airflow, if the pressure is smaller, the velocity is larger. Therefore, when there is no discharge tube, its ability to attract air is stronger. It can be seen that, when there is no discharge tube, the centrifugal aerator without a discharge tube has better air attraction than the one with a discharge tube; although this situation introduces more gas, less gas is discharged into the pool. This proves that the centrifugal aerator with the discharge pipe installed has a better gas transfer capability.
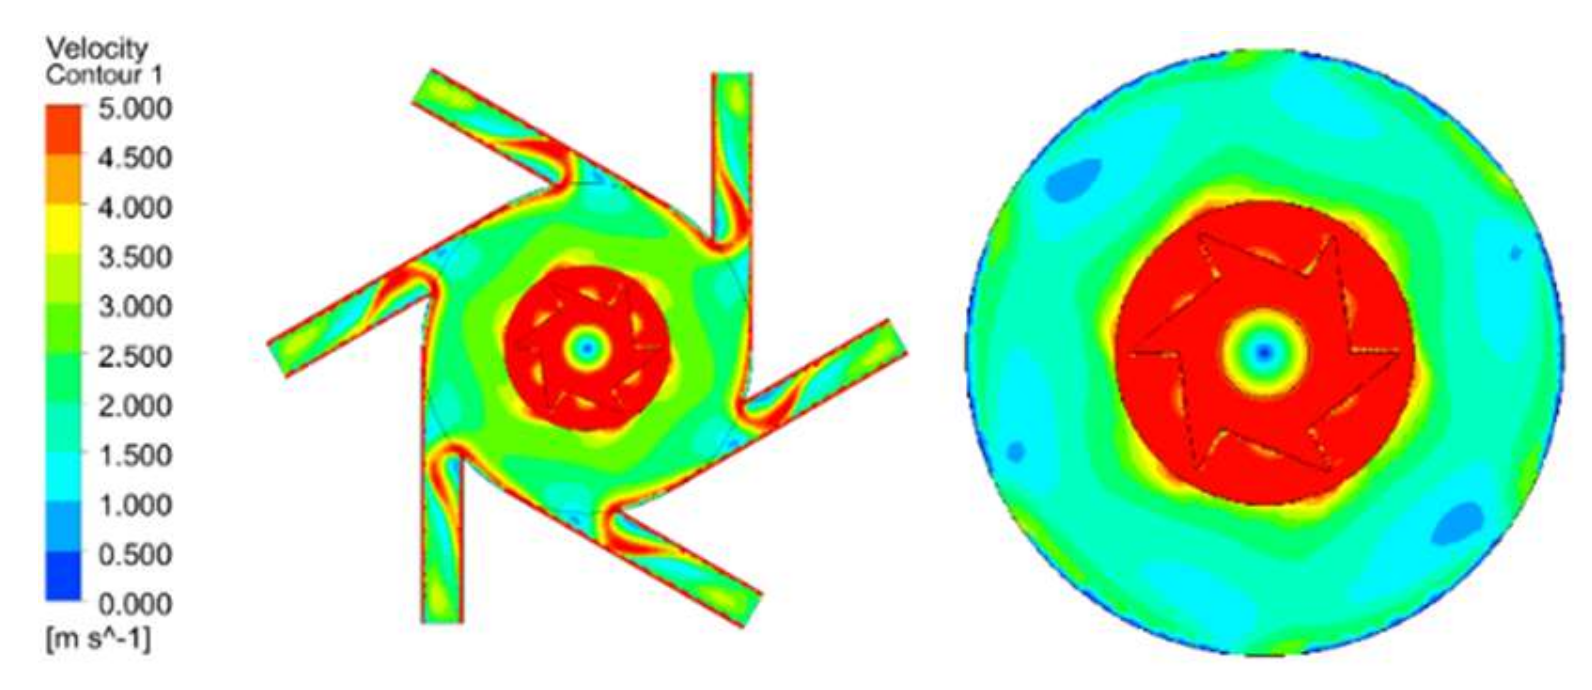
Figure 11 shows the velocity cloud inside the mixing chamber. It is obvious from the figure that the flow velocity inside the mixing chamber without the discharge tube is low, only reaching about 1.8 m/s, the distribution is more uniform from the rotor outlet to the mixing chamber outlet, and the flow velocity loss is larger at the edge of the mixing chamber. The exit velocity is close to the maximum, which means that the gas–liquid mixture can be better discharged after the mixing chamber stirring and mixing after the discharge tube is placed.
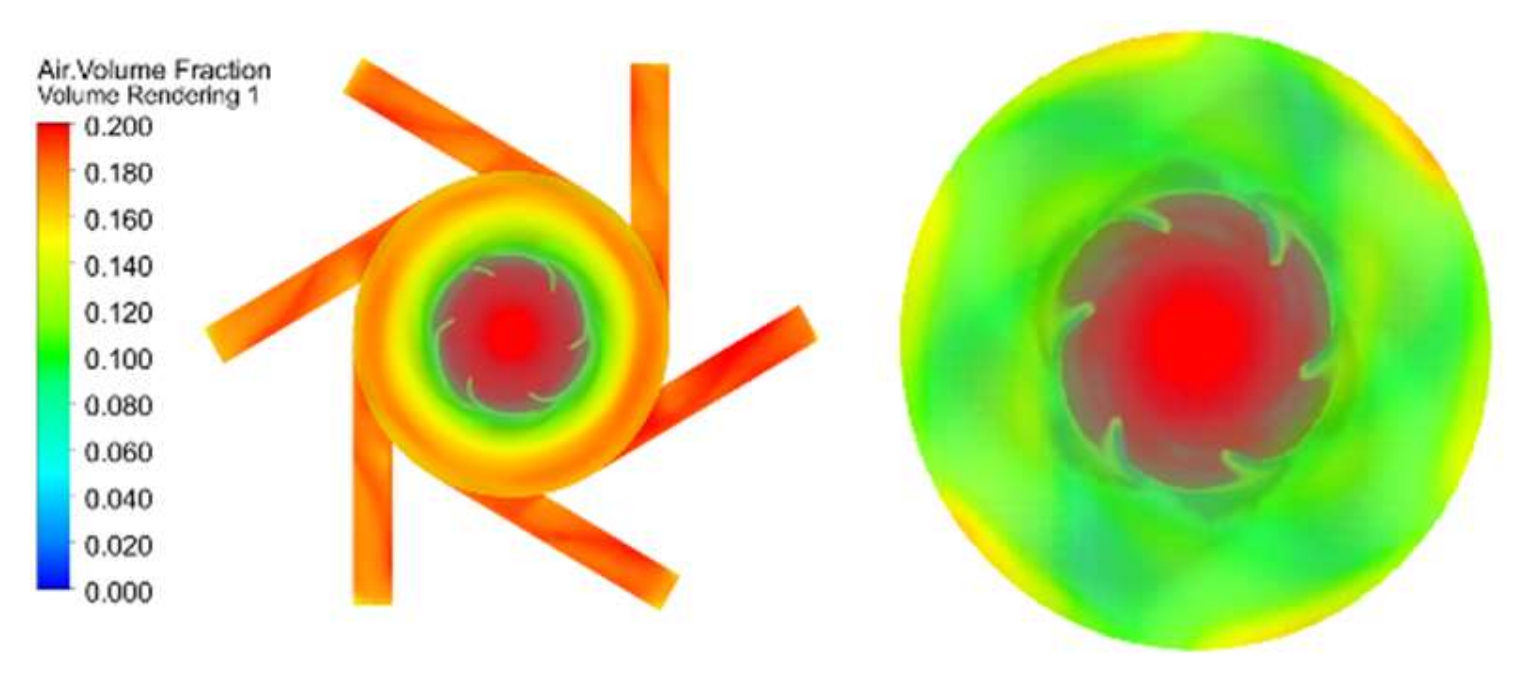
In
Figure 12, the volume fraction of gas in the mixing chamber is shown, respectively, and the gas content in the mixing chamber is greater when the discharge tube is arranged. In the discharge position, the volume fraction of gas at the outlet is higher without the discharge tube, while the discharge tube and its outlet have more gas content when the discharge tube is arranged, indicating that the gas–liquid mixture in the mixing chamber can be better discharged and dissolved in the aeration tank after mixing with this arrangement. Without the discharge tube, the average gas volume fraction in the mixing chamber was 13.4%, while with the discharge tube arrangement, the average gas volume fraction in the mixing chamber was 19.7%, an increase of 47% compared to that without the discharge tube.
The reason for the above phenomenon can be summarized as the rotation of the impeller in the mixing chamber, which drives the flow of the gas–iquid mixture, and its motion can be seen as the circular motion rotating around the rotating axis and the relative motion with respect to the rotor blades. Therefore, the gas–liquid mixture in the discharge tube has the velocity component in the circumferential direction, and the increase of the discharge tube can better export the gas–liquid mixture to the mixing chamber smoothly and reduce the energy loss at the same time.
Through the analysis of the rotor blade pressure, the mixing fluid flow rate in the mixing chamber, and the gas content in the mixing chamber of the centrifugal aerator with or without the discharge tube, we find that the working surface of the rotor without the discharge tube is even higher than that with the discharge tube, so its suction capacity is better than the latter. When working under the same air inlet conditions, this difference is more obvious. Therefore, it is necessary to arrange the discharge tube.
3.3. Variation of Relative Area Ratio (ð)
The numerical simulation above verifies the necessity of setting the discharge tube of the mixing chamber, and further considers how to arrange the discharge tube to make the aeration performance better. The power of this aerator is 1.5 kw and the air intake is 22 m
3/h. According to the working experience of most domestic companies manufacturing centrifugal aerators of this power, the use of 4, 6, and 8 discharge tubes is a more common and efficient form. To explore a more suitable number of discharge tubes, 4, 6, and 8 discharge tubes were selected for numerical optimization simulations. Since the structural dimensions of centrifugal aerators with different power vary, to analyze the selection of a more suitable size of discharge tube to achieve a good aeration effect under different mixing chamber dimensions, a dimensionless parameter mixing chamber relative area ratio (
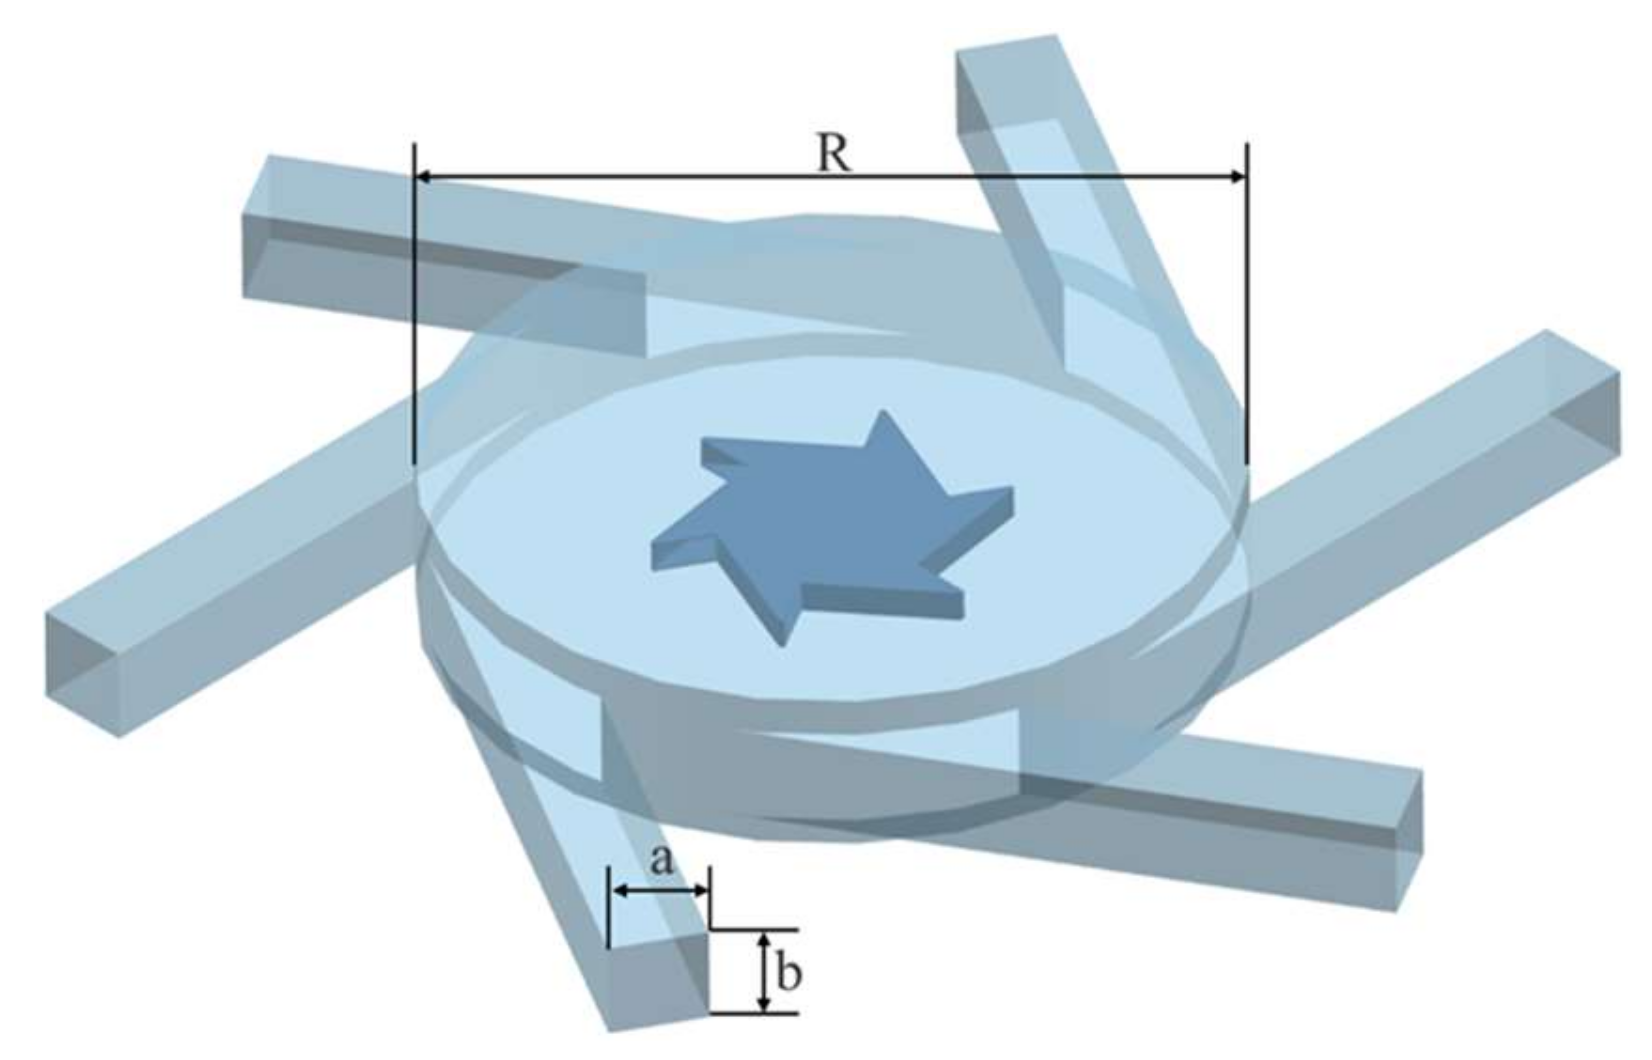
ð) is defined to express the dimensional characteristics of the mixing chamber of centrifugal aerators; combined with
Figure 13,
ð is defined as follows:
where
ab is the length and width of the discharge tube, m, respectively;
R is the diameter of the mixing chamber, m; and
k is the number of discharge tubes.
As shown in
Figure 14, the mixing chamber uses four discharge types (a), six discharge types (b), and eight discharge types (c). In the three schemes, a single discharge tube has an area of 2500 mm
2 in each mixing chamber, execpt the number of the discharge tubes is different, so the total discharge area of the mixing chamber is also different. The three schemes under the mixing chamber area and the discharge area are shown in
Table 4.
Figure 15a–c are the pressure diagrams of the runner blades of the centrifugal aerator with four, six, and eight discharge tubes, respectively. When the number of discharge tubes is four and six, the pressure distribution is better than that of eight; when the number of discharge tubes is four, the maximum pressure on the working surface is 87,709 Pa, the minimum pressure is −89,895 Pa, and the maximum pressure difference is 17,7604 Pa; when the number of discharge tubes is six, the maximum pressure on the working surface is 84,952 Pa, the minimum pressure is −92,131 Pa, and the maximum pressure difference is 177,083 Pa; and when the number of discharge tubes is eight, the maximum pressure on the working surface is 34,460 Pa, the minimum pressure is −3547 Pa and the maximum pressure difference is 38,007 Pa. Since the greater the pressure difference between the rotor blades, the stronger the centrifugal force generated by the rotor and the more air is sucked in, when the number of discharge tubes is eight, the aeration performance is significantly weaker than the other two cases.
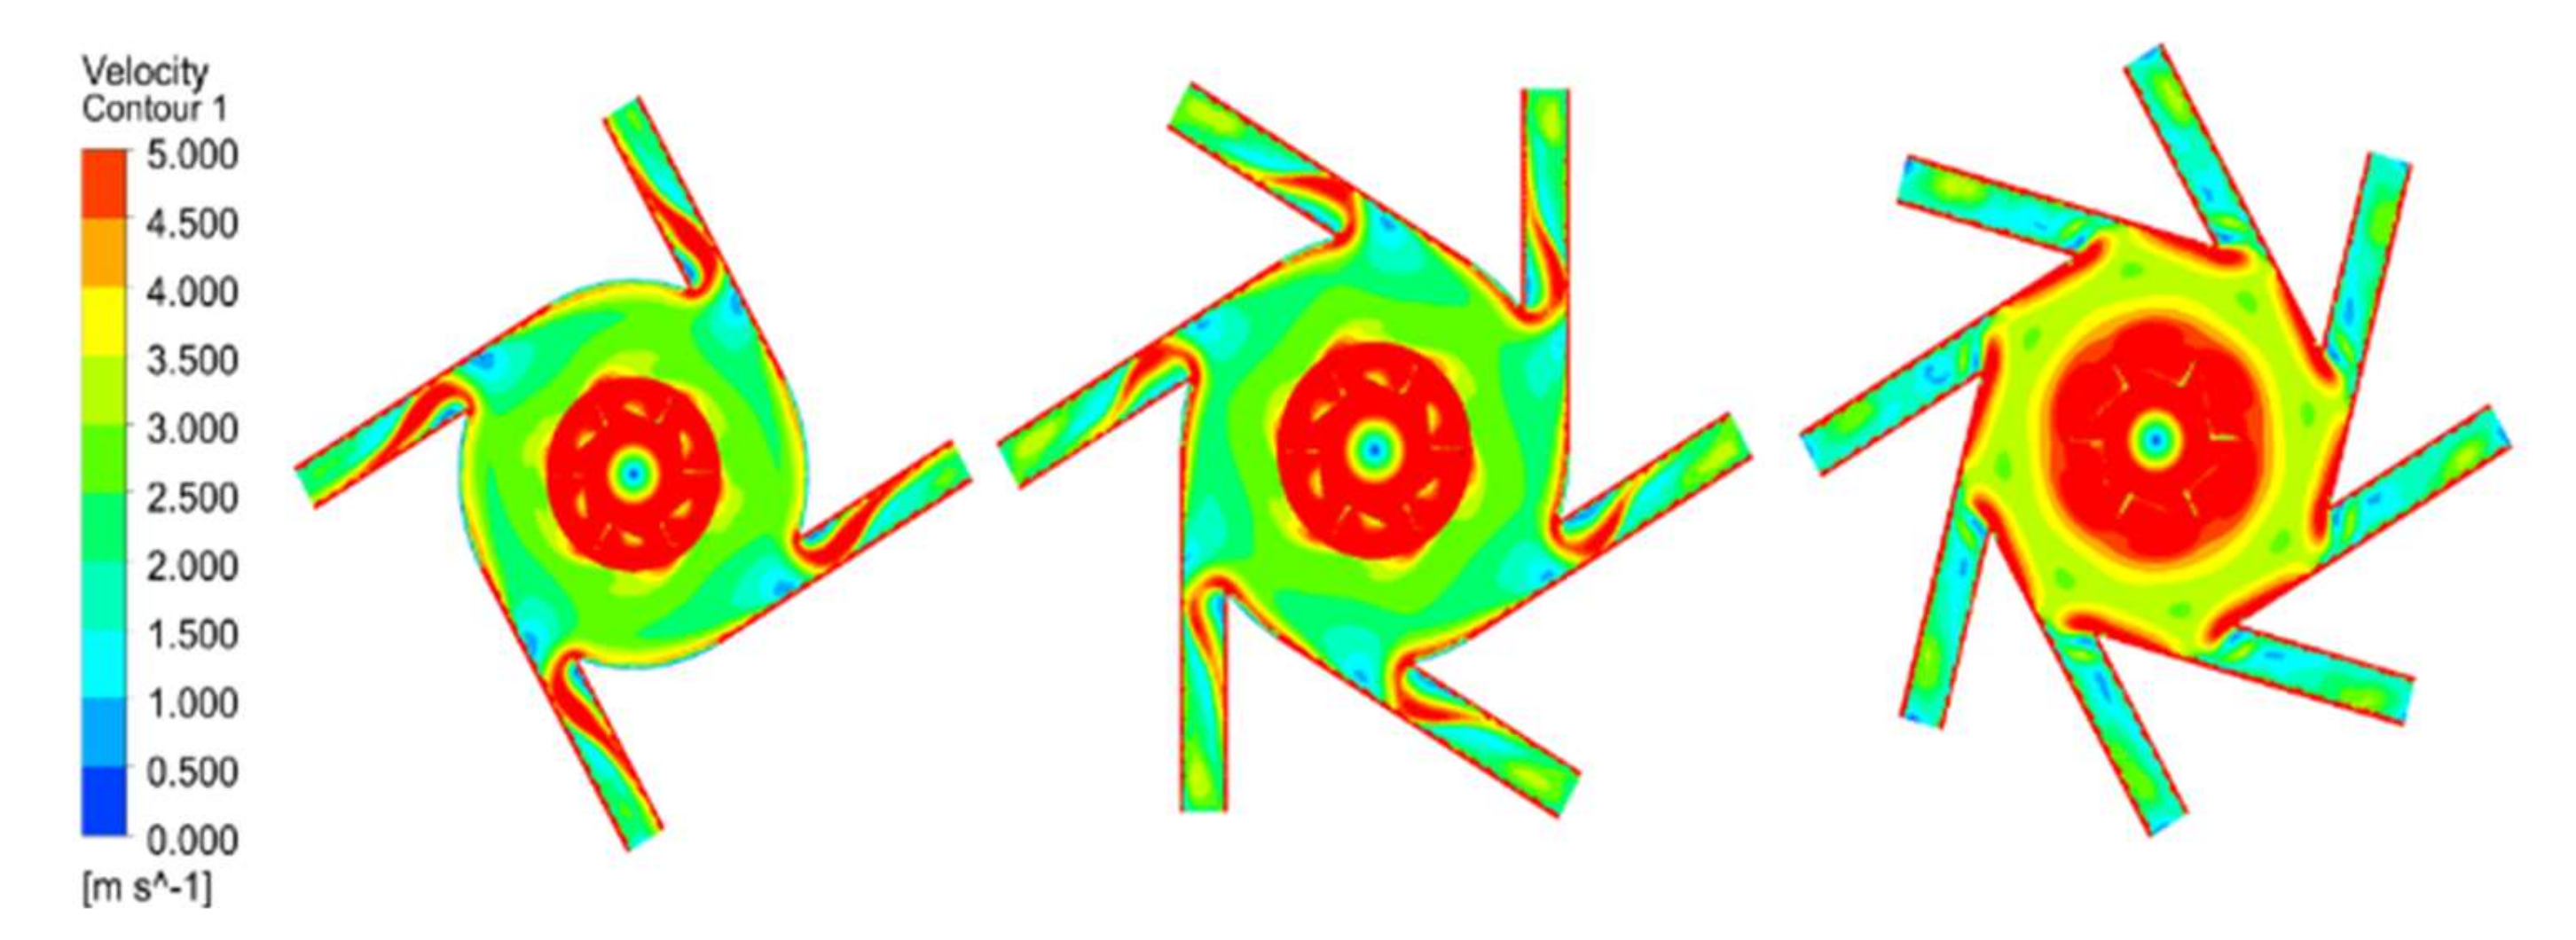
Figure 16 shows the velocity cloud of the mixture in the mixing chamber under different numbers of discharge tubes. From the figure, it can be seen that when the number of discharge tubes is eight, the high-speed flow area of the mixture is mainly concentrated in the interface between the discharge tubes and the mixing chamber, while the flow velocity at the discharge tubes is at a low speed. It can be seen that when the number of discharge tubes reaches eight, it is not conducive to the discharge of the gas–liquid mixture, thus affecting the aeration performance. On the contrary, when the number of discharge tubes is four and six, the flow rate of the gas–liquid mixture at the edge of the rotor blades and the discharge tube is the same, which reflects that, in these two cases, the kinetic energy loss of the gas–liquid mixture is less during the whole process of gas and water entering in the mixing chamber and then discharging from the discharge tube through the agitation of the rotor blades, which can better transport the air to the aeration tank and thus achieve a better aeration effect. The data obtained through CFD-POST post-processing showed that, when the number of discharge tubes was four, the average flow velocity in the mixing chamber was 3.068 m/s and the discharge exit velocity was 2.88 m/s, with a velocity loss of 8%. When the number of discharge tubes is eight, the average flow velocity inside the mixing chamber is 3.288 m/s and the exit velocity of the discharge tube is 1.255 m/s, with a velocity loss of 61%. When the number of discharge tubes is eight (
ð = 6.28), the flow velocity loss from the mixing chamber to the discharge tube is the largest.
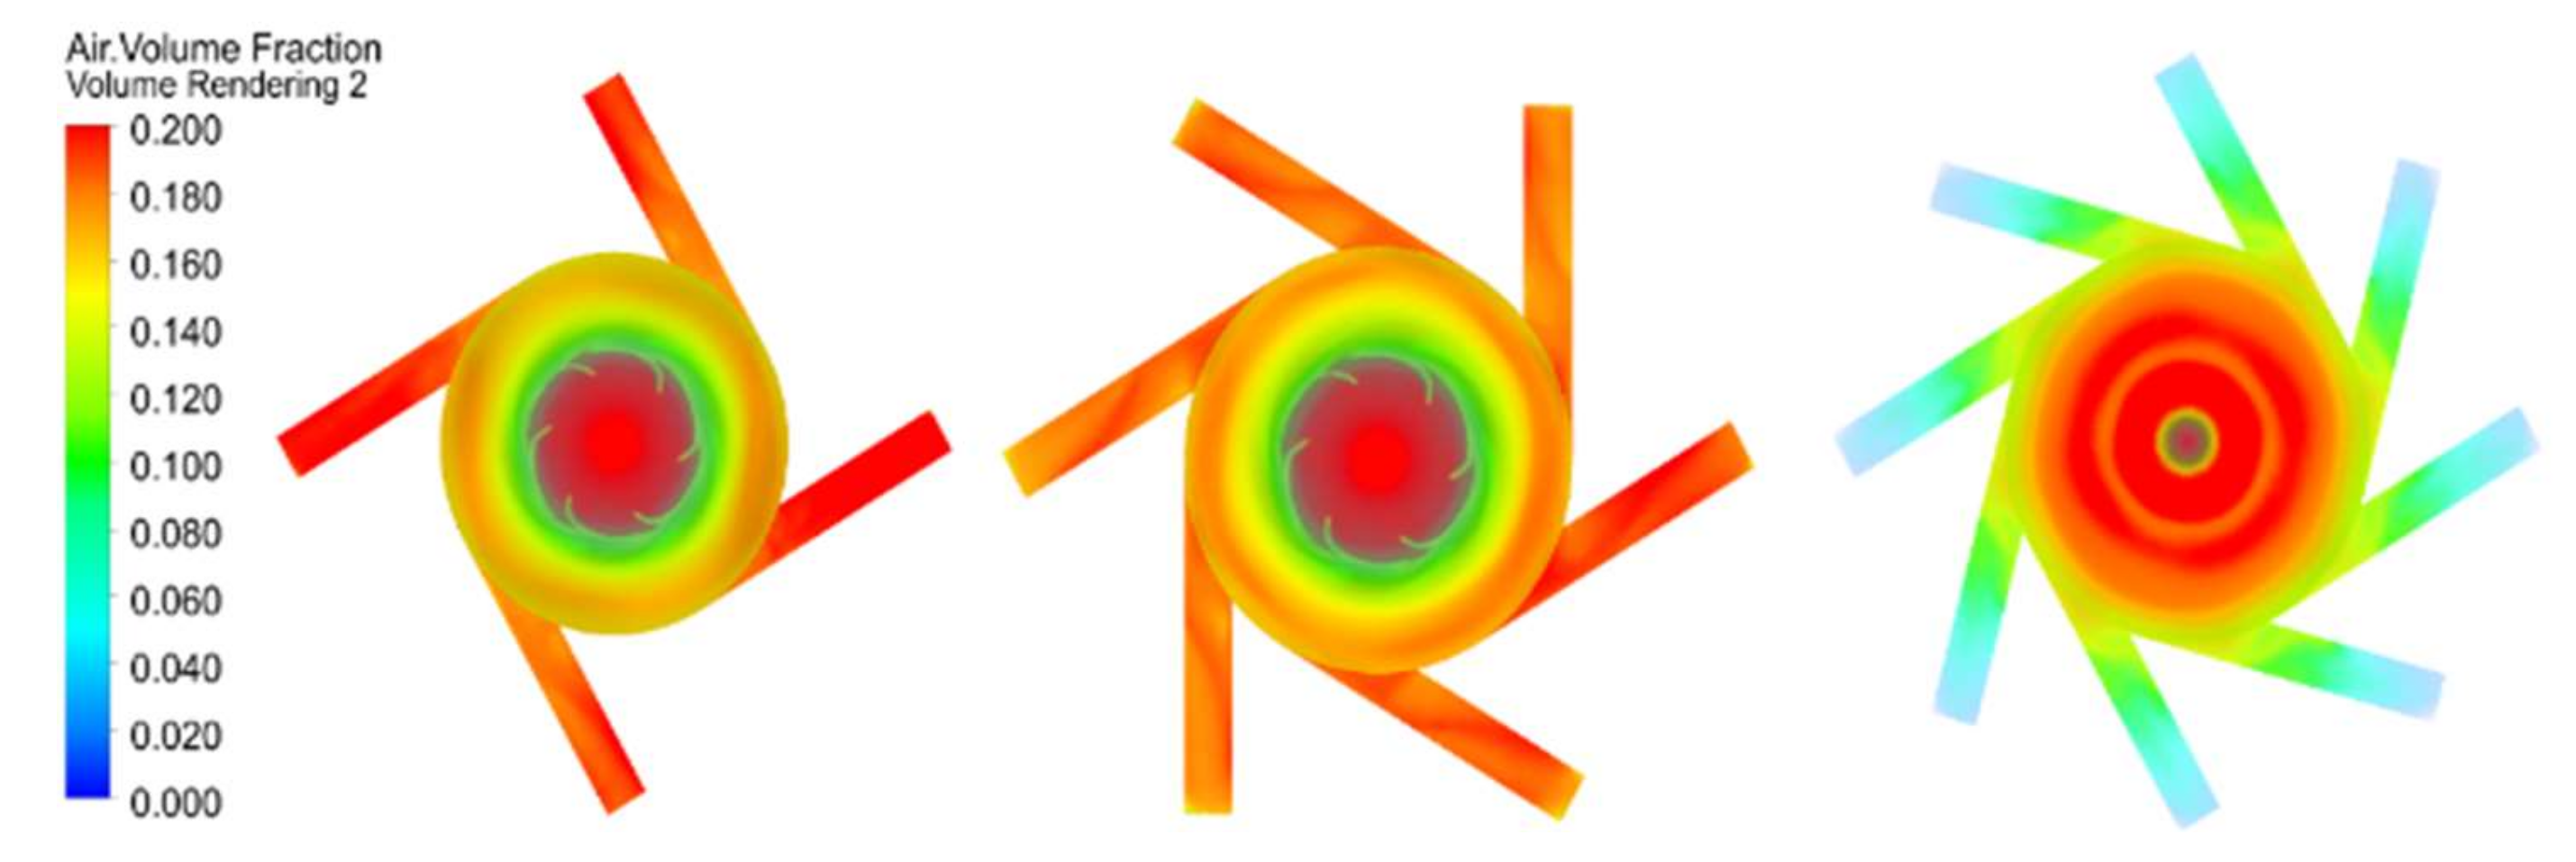
The average gas volume fraction in the mixing chamber was 19.89%, 19.7%, and 0.134 when
ð was 12.57, 8.38, and 6.28, respectively. From
Figure 17, it can be seen that, when
ð = 6.28, the gas content at the discharge tube was low, only about 5%, and the gas was all collected in the mixing chamber, which was difficult to discharge. The data obtained by CFD-POST post-processing showed that the flow rates at the outlet were 16.155 kg/s, 16.617 kg/s, and 5.713 kg/s, respectively; as shown in
Table 5, the maximum outlet flow rate was obtained when
ð = 8.38, and the outlet gas flow rate was increased by 51.98% compared to the other two cases.
When ð = 6.28, the gas volume fraction is lower than in both cases ð = 12.57 and ð = 8.38, and it is difficult for the gas to be discharged from the discharge tube. In combination with the discharge volume of the gas–liquid mixture at the outlet, and taking into account the effect of oxygenating the aeration tank after the gas has been introduced into the aeration tank, the gas is better dissolved in the aeration tank when the number of discharge tubes is six.
3.4. Variation of Submergence Depth
The above results show that when ð = 8.38, it is a better structural design for the centrifugal aerator. Next, the aeration and oxygenation performance of the centrifugal aerator is investigated by the depth of submergence during its operation.
According to the current working experience of the centrifugal aerator, the centrifugal aerator is generally placed at the bottom of the pool, and the real working submergence depth is determined by the height of its bottom bracket, but there is no basis for reference on how to select a better submergence depth. Analyzing the centrifugal aerator in different working environments can achieve a good aeration effect. Combined with
Figure 3, we now define a dimensionless parameter-dive coefficient (
β) to characterize the specific dive of the centrifugal aerator; combined with
Figure 2,
β is defined as follows:
where
V1 is the volume of water below the level of the centrifugal aerator discharge tube;
V2 is the volume of water above the level of the centrifugal aerator discharge tube. That is, when the greater the dive coefficient, the closer the working position of the aerator is to the top of the aeration pool; when the smaller the dive coefficient, the closer the working position of the aerator is to the bottom of the aeration pool. For example, when the aeration machine is in the aeration pool in the middle of the vertical direction,
β = 0.5, and is located at the bottom of the aeration pool when
β = 1.
The model aeration tank is a cylindrical aeration tank with a diameter of 2 m and a depth of 2 m. Simulations of two-phase gas–liquid flow were performed for several operating conditions with centrifugal aerator down-dip coefficients, β, of 0.35, 0.25, 0.15, and 0.05. To facilitate the study of centrifugal aerator performance with different dip coefficients, the middle-height liquid level of the aeration tank was chosen to better capture the state of the gas–water mixture as it rises, and is defined as the A–A cross-section.
A comparison of the velocities in the A–A cross-section is shown in
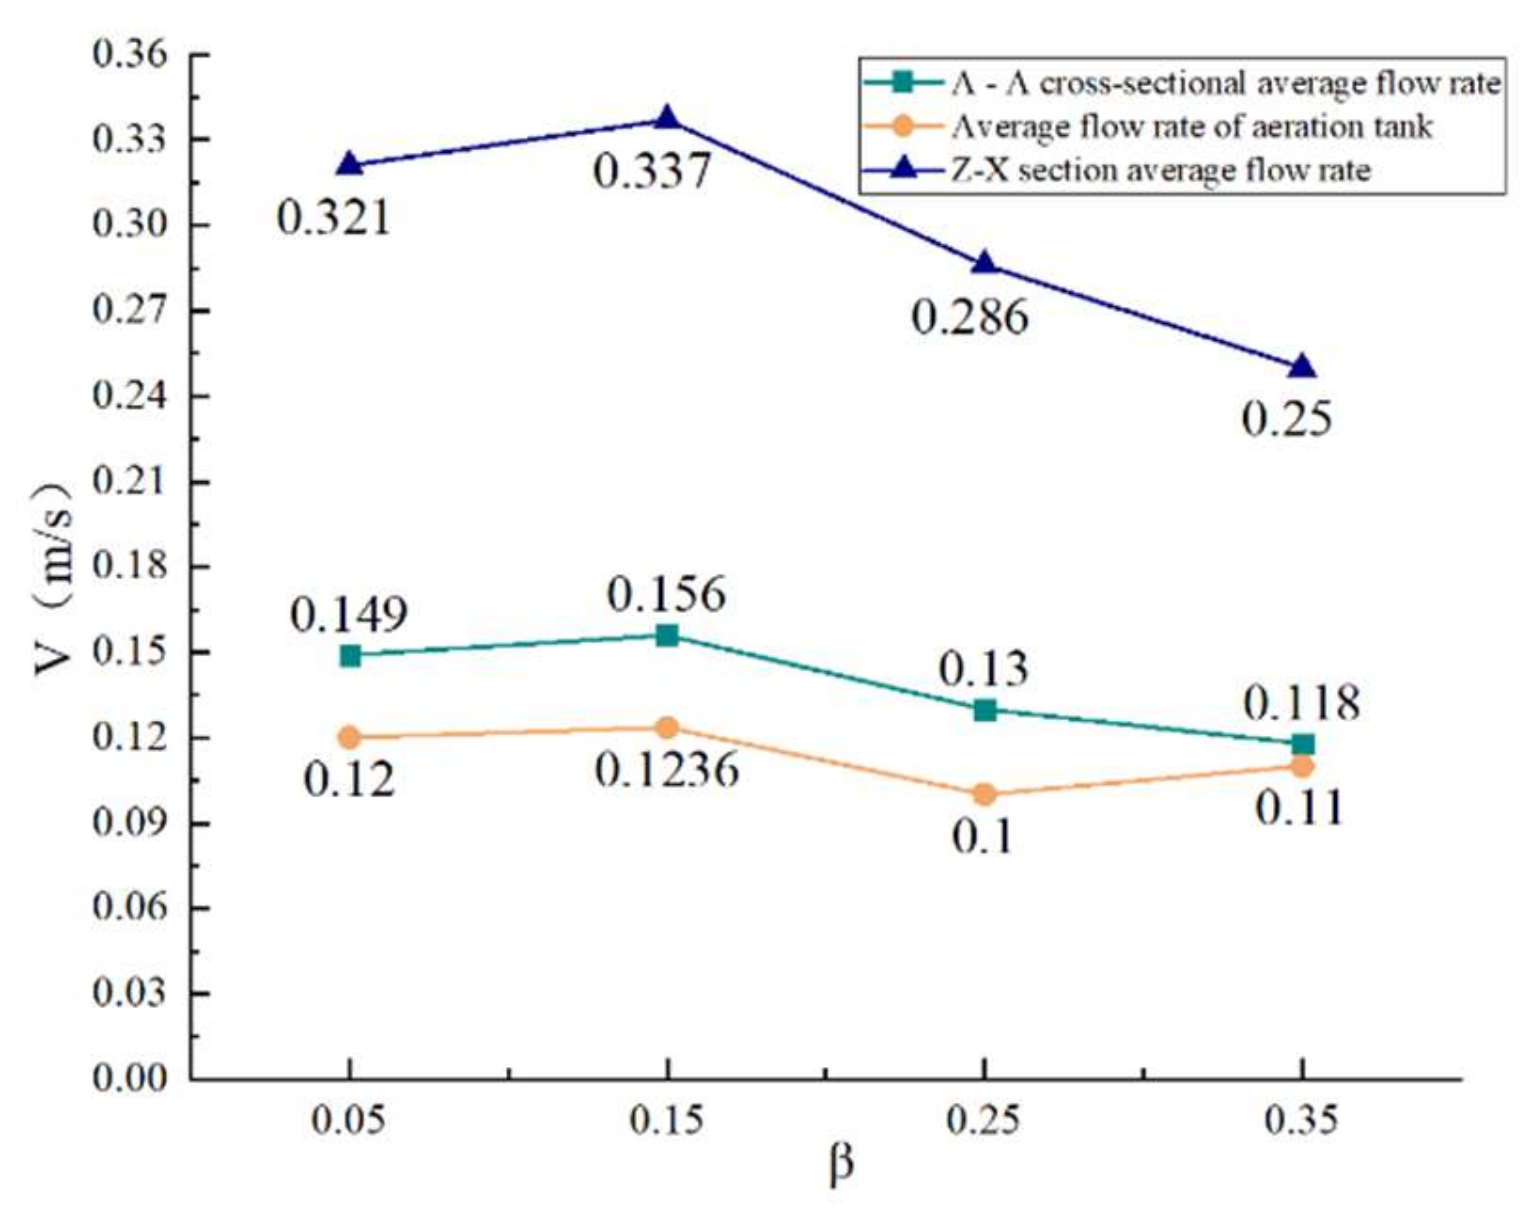
Figure 18, where the average flow velocities at the A–A cross-section are 0.110, 0.100, 0.1236, and 0.120 m/s when the dip coefficients,
β, are 0.35, 0.25, 0.15, and 0.05, respectively. At the edge of the aeration tank, multiple discharge tubes discharge the gas–liquid mixture at the same time, creating a superposition of energy and therefore a higher flow velocity at the edge. As the A–A section is located in the middle of the aeration tank, the centrifugal aerator is closest to this section at a dip coefficient of 0.35, but the flow velocity at this dip coefficient condition is relatively low; conversely, the flow velocity at this section is higher at a deeper submergence depth and a distance from the A–A section at dip coefficients of 0.15 and 0.05.
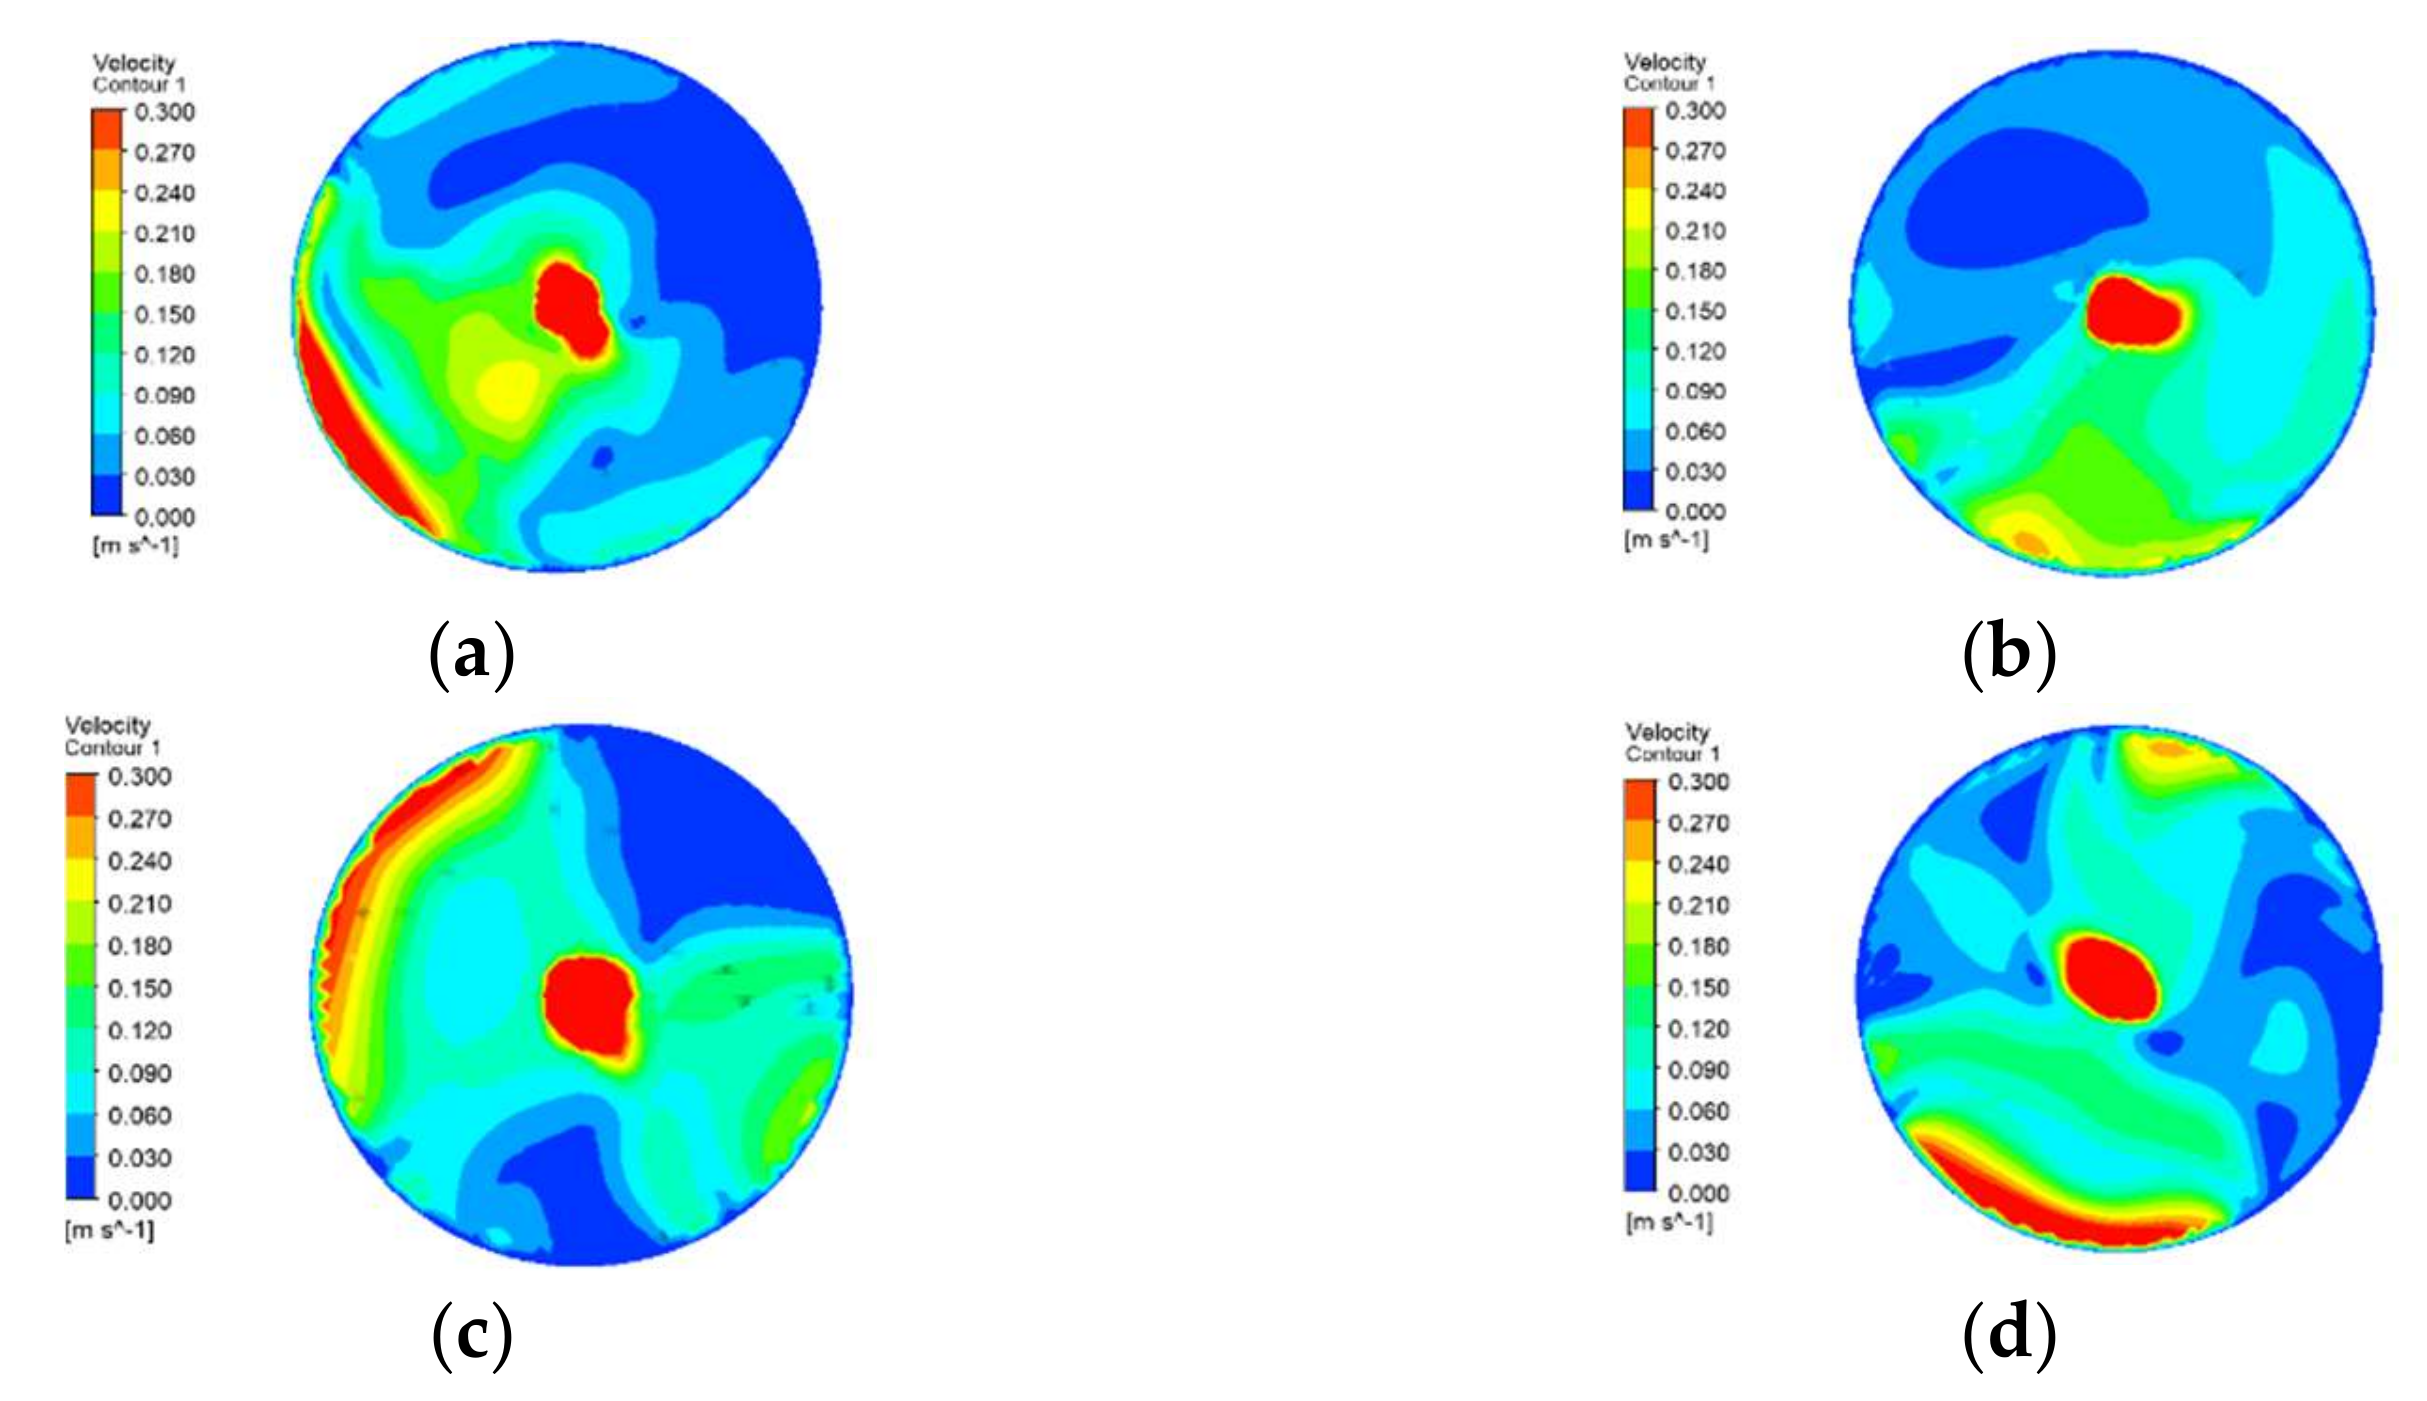
The fluid velocity cloud in the aeration tank is shown in
Figure 19. Since the centrifugal aerator also has to take into account the stirring and mixing effect, the better flowability allows the gas to be better dissolved in the aeration tank. The comparison shows that when the dip coefficient,
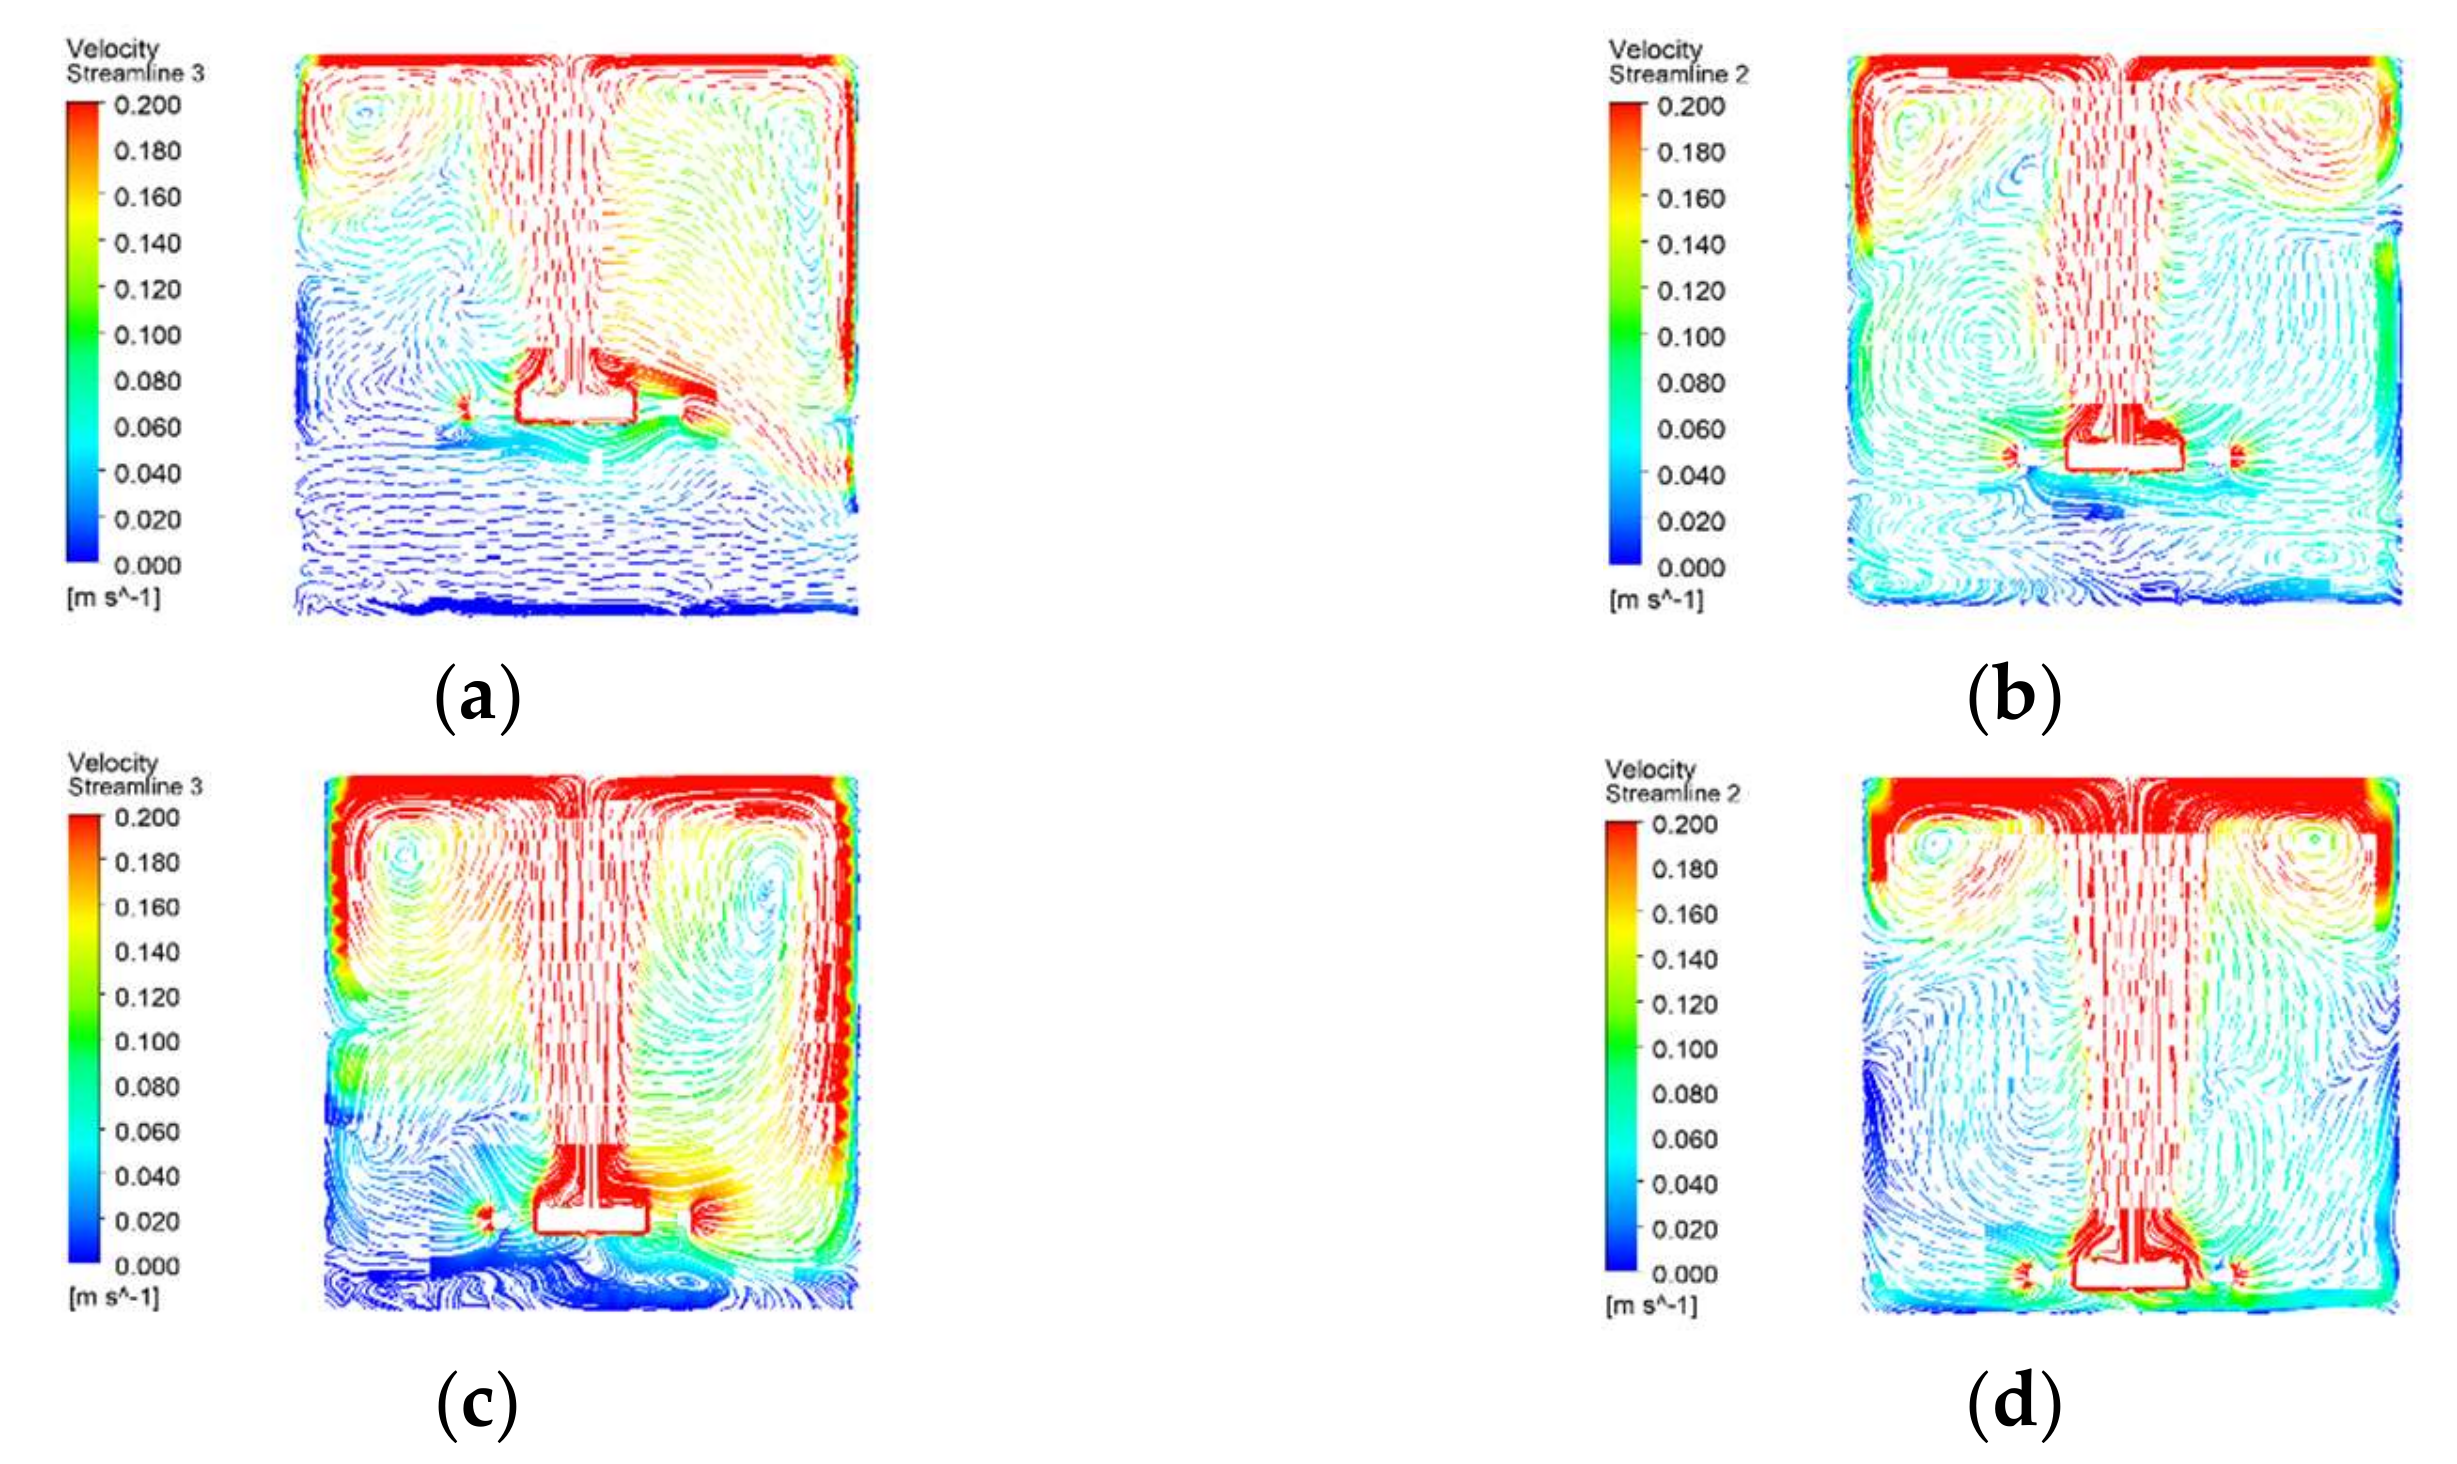
β, is 0.35, 0.25, 0.15, and 0.05, the average flow velocities of the gas–water mixture in the whole aeration tank are 0.118, 0.130, 0.149, and 0.156 m/s. Similar to the flow velocity patterns obtained above for the depth of submergence and the A–A cross-section, being near the middle part of the aeration tank does not raise the flow velocity in the whole working area, but the two submergence depths near the bottom of the pool give better flow velocities throughout the flow field.
Figure 20 shows the flow velocities at different dive coefficients. From the above figure, we can find that both in the A–A section and from the whole aeration tank, when the submergence depth is near the middle height of the aeration tank, the flow velocity is lower than in the two working cases with a deeper submergence depth.
Centrifugal aerators play the role of aeration and oxygenation, as well as mixing, so it is also necessary to study the laws of motion in the flow field.
Figure 21 shows the Z–X section of the central part of the aeration tank and analyzes the flow field flow lines at different dip coefficients. It can be seen that when the down-dip coefficient is 0.35 and 0.25, the whole aeration pool flow velocity highlight area is small, the centrifugal aerator working water level below the flow velocity is low, the whole aeration pool in the fluid flow is poor, and it is difficult to dissolve oxygen in the water; for the down-dip coefficients of 0.15 and 0.05, its flow velocity highlight area is higher than the first two working conditions and there is more vortex in the aeration pool. This ensures that the oxygen stays in the aeration tank for a longer period. At a dip coefficient of 0.15, there is also good fluid flow at the edge of the aeration tank, so not only is the oxygen better dissolved in the water in the working area at this condition, but good mixing and stirring can also be taken into account. The average flow rate at the Z–X section in the center of the aeration tank for different dip coefficients is shown in
Figure 20.
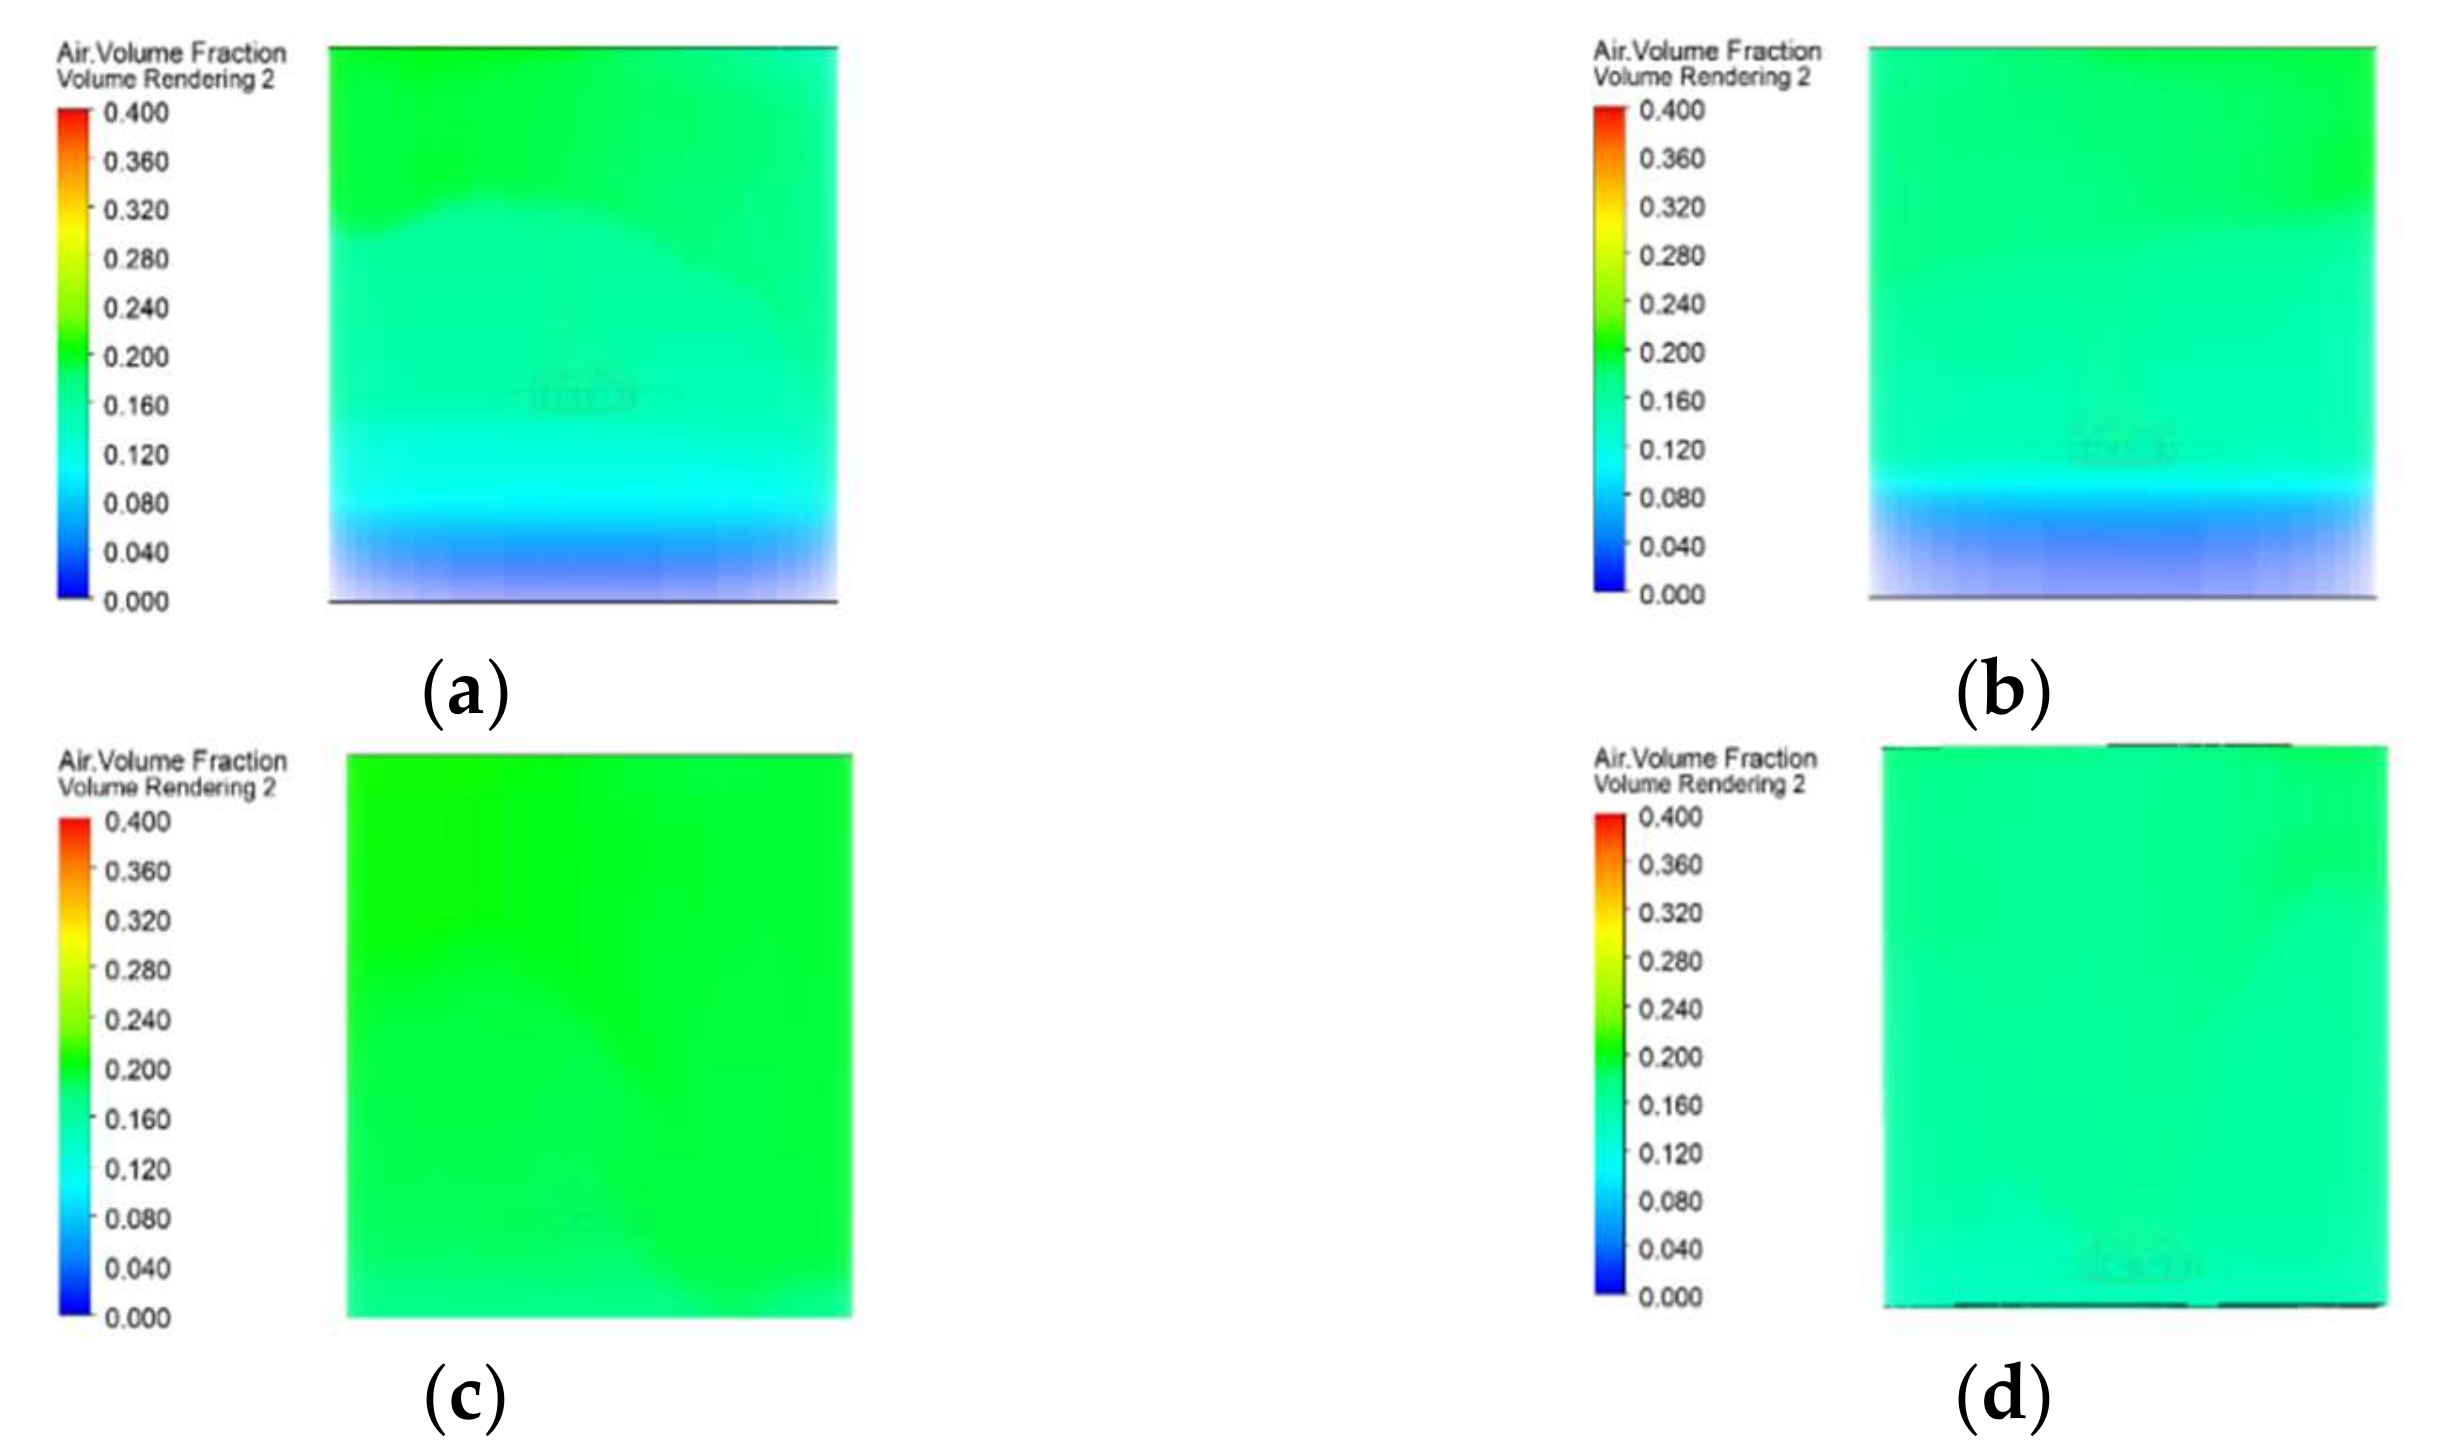
The gas volume distribution of the aeration tank is shown in
Figure 22. When the down-dip coefficient is 0.35 and 0.25, the gas content distribution is more similar, and the pattern presented is that the gas volume at the bottom is less, and the gas content rate increases from the bottom to the top of the aeration tank, with the highest gas content rate of the whole aeration tank being about 16%. When the dip coefficient is 0.05, the gas distribution is more uniform, but compared to the dip coefficient of 0.15, the color of the gas volume fraction graph is lighter, and the content is lower than the working condition when the dip coefficient is 0.15.
To further investigate the distribution of gas content in the aeration tank, CFD-POST was used to obtain the outlet gas flow rates of 11.95, 11.35, 15.54, and 12.25 m
3/h for dip coefficients of 0.35, 0.25, 0.15, and 0.05. The gas flow rate pattern at the outlet is consistent with the pattern presented in the gas volume fraction diagram above for the entire aeration tank, which also better the reason for the different gas contents in the aeration tank. The flow rates at the outlet of the mixing chamber and the distribution of the gas phase throughout the aeration tank for different dive coefficients are presented in
Table 6. After aeration and oxygenation, the most important performance indicator in the oxidation ditch is the dissolved oxygen rate, and more gas is delivered into the aeration tank to allow more oxygen to dissolve in the water. At the same air intake, the gas volume fraction increases by an average of 31.29% compared to the other three cases when the dip coefficient is 0.15, providing the most gas to the working aeration tank, and thus allowing more gas to be dissolved in the aeration tank.
4. Relationship between Oxygenation Capacity and Submersion Depth
The centrifugal aerator at different submergence depths was tested using this test equipment, DO was measured with time, and standard oxygen transfer coefficients, SOTR and SAE were derived. The specific calculation method is as follows:
- (1)
Standard oxygen total transfer coefficient (Kla (20)):
where
is the oxygen saturation concentration at room temperature, mg/L, and
are the dissolved oxygen concentrations at
t1 and
t2, mg/L, respectively.
Then the temperature correction is performed:
where
T is the experimental water temperature, °C;
is the total transfer coefficient at moment
t, min
−1; and 1.024 is the correction factor.
- (2)
Standard Oxygen Transfer Rate (SOTR)
where:
SOTR is the amount of oxygen transferred to water per unit time under standard conditions, mg/min, and
scale is the oxygen saturation concentration under standard conditions, mg/L.
- (3)
Standard Aerator Efficiency (SAE)
where
SAE is the amount of oxygen transferred to water at a certain electric energy consumption under standard conditions, mg/(min·W), and
P is the power consumption, W.
It can be seen from
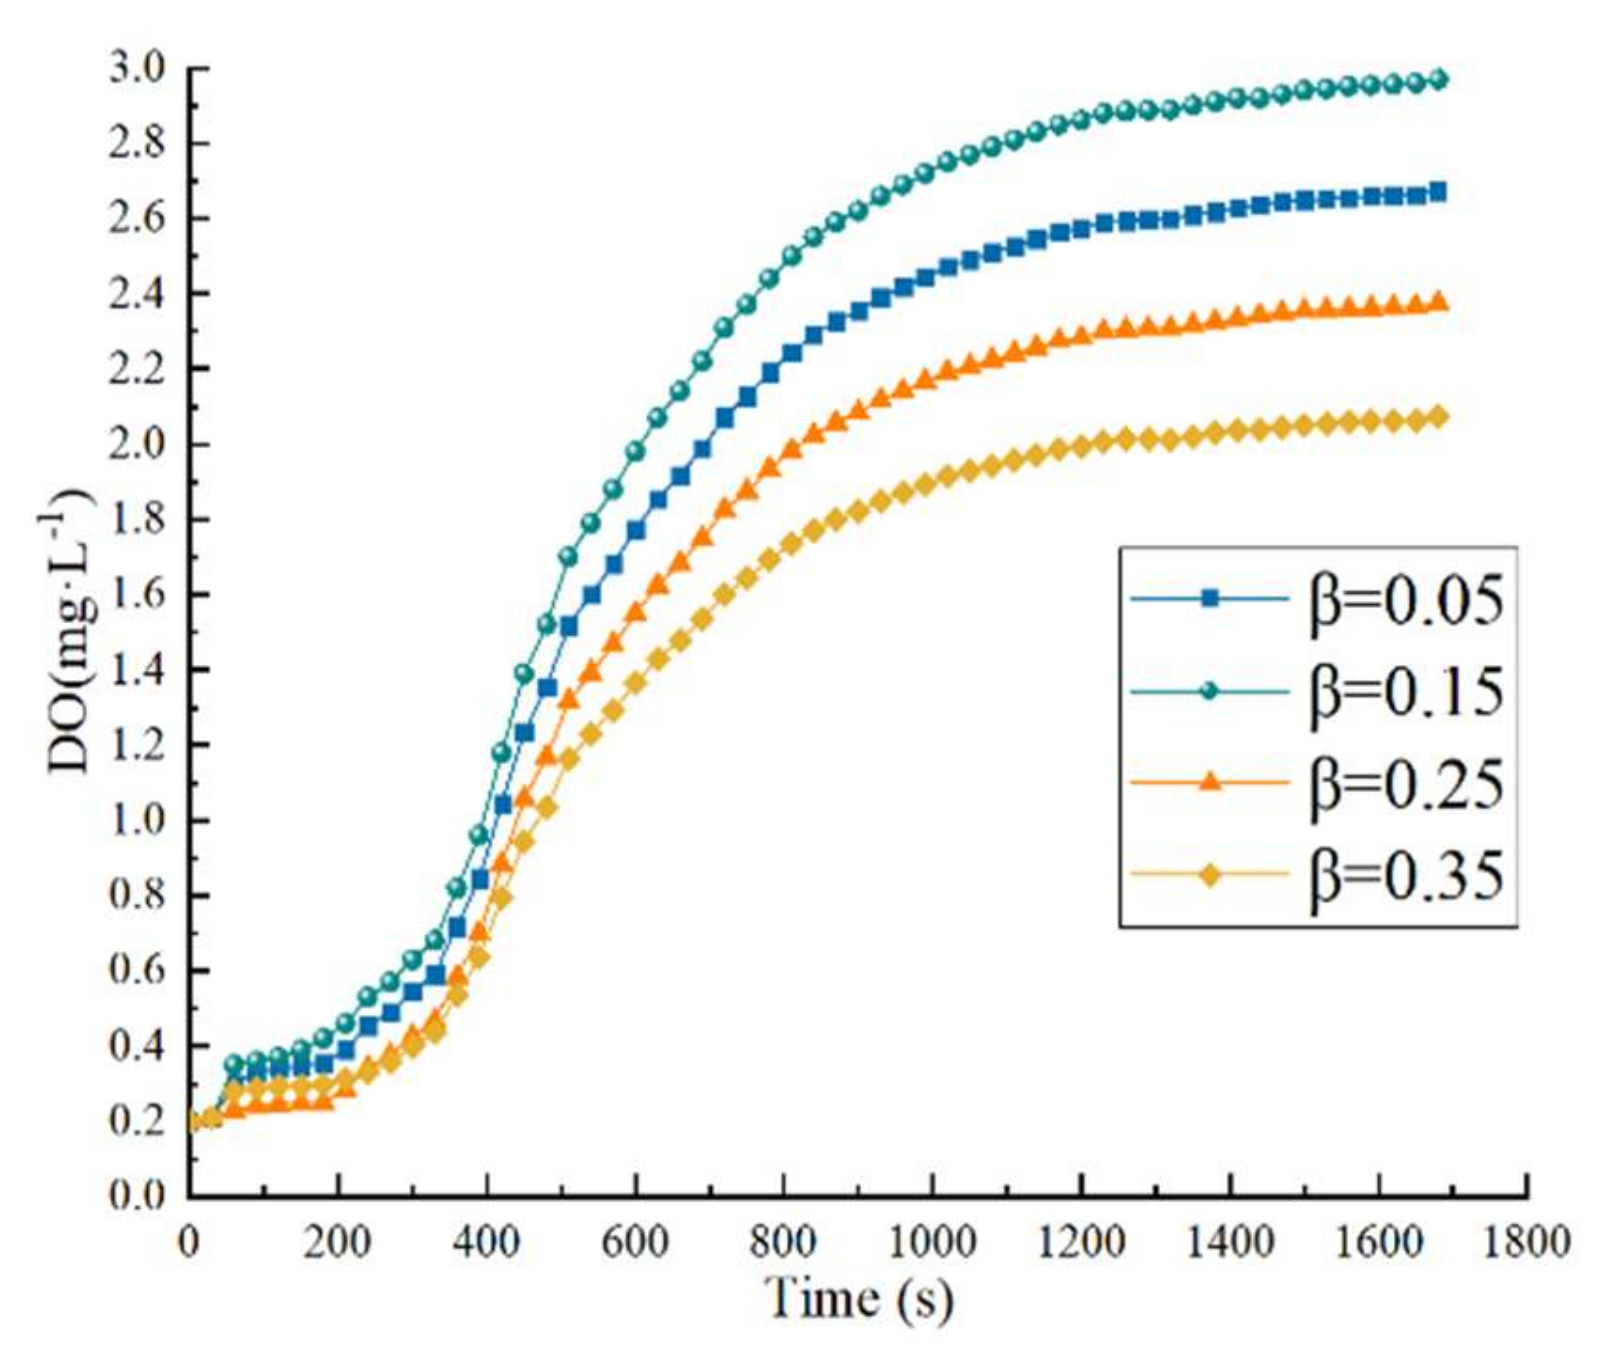
Figure 23 that the dissolved oxygen content increases and then decreases as the submersion depth increases, i.e., the dip coefficient
β decreases during the experiment. The maximum dissolved oxygen concentration was 2.97 mg/L when the dip coefficient
β = 0.15, and 2.673, 2.375, and 2.071 when the dip coefficient
β = 0.05, 0.25, and 0.35, respectively. The maximum dissolved oxygen concentration increased by 25.16% when the dip factor
β = 0.15 compared to the other three conditions. All four conditions show a positive increase. However, the magnitude of the increase tends to decrease, as the dissolved oxygen content of the effluent gradually increases over time and the difference with the saturation dissolved oxygen concentration decreases. According to Fick’s first law, in any concentration gradient-driven diffusion system, the material diffuses in the direction of the negative gradient determined by its concentration field, and its diffusion flow size is proportional to the concentration gradient as the operating time increases; while the oxygen concentration gradient decreases, the diffusion rate decreases and the oxygen transfer rate decreases.
As can be seen in
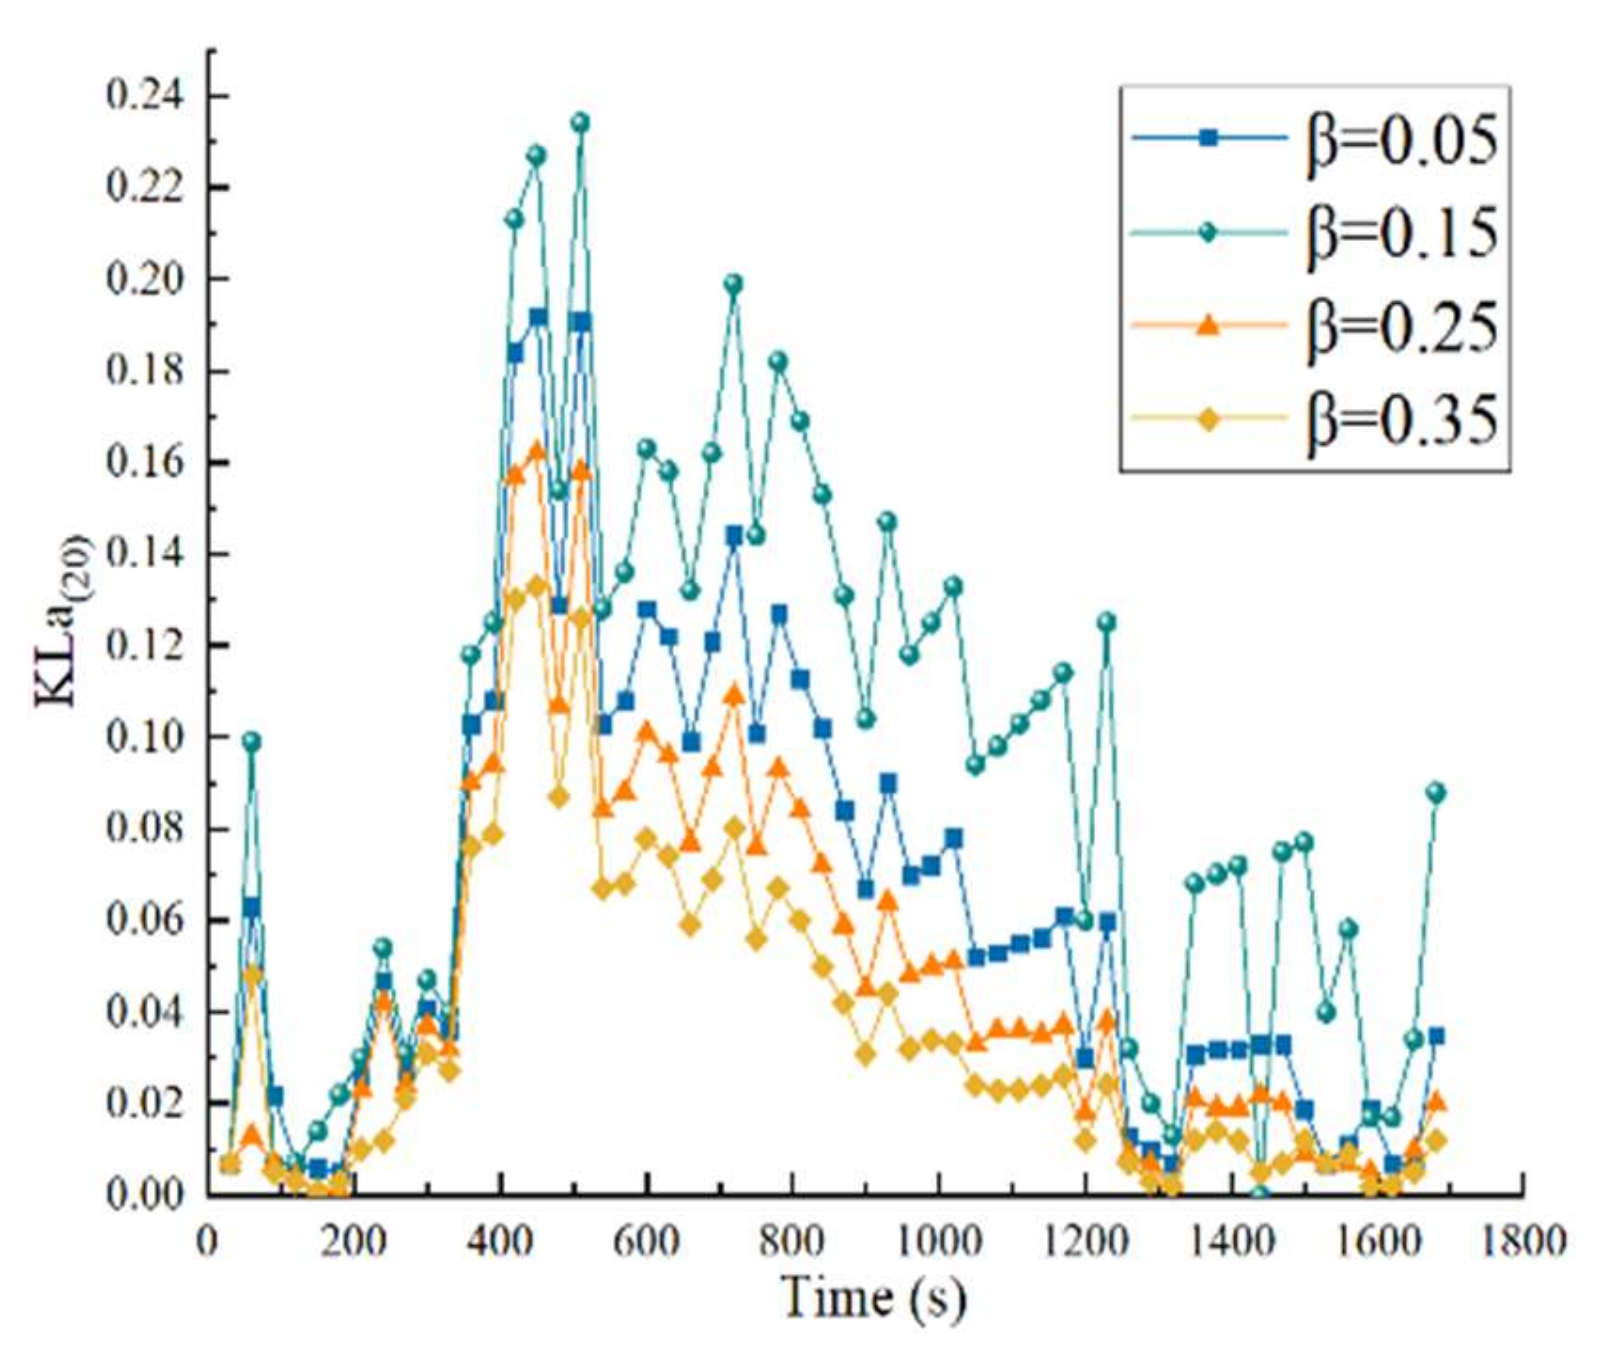
Figure 24, the values of the standard oxygen transfer coefficient varied erratically during the experiment, due to the inconsistent magnitude of the change in dissolved oxygen content with time, and the cause of the magnitude of the change in dissolved oxygen content was due to the influence of Fick’s first law.
The maximum value of the standard oxygen transfer coefficient Kla(20) can reach 0.234 with a mean value of 0.095 when the dip coefficient β = 0.15. The maximum values of the standard oxygen transfer coefficient Kla(20) are 0.035, 0.162, and 0.133 kg/h when the dip coefficient β = 0.05, 0.25, and 0.35, respectively, with mean values of 0.064, 0.048, and 0.048, respectively. The maximum value of the standard oxygen transfer coefficient was found to increase by a factor of 1.13 on average for the other three conditions and by a factor of almost one on average for the whole experiment when the dip coefficient β = 0.15.
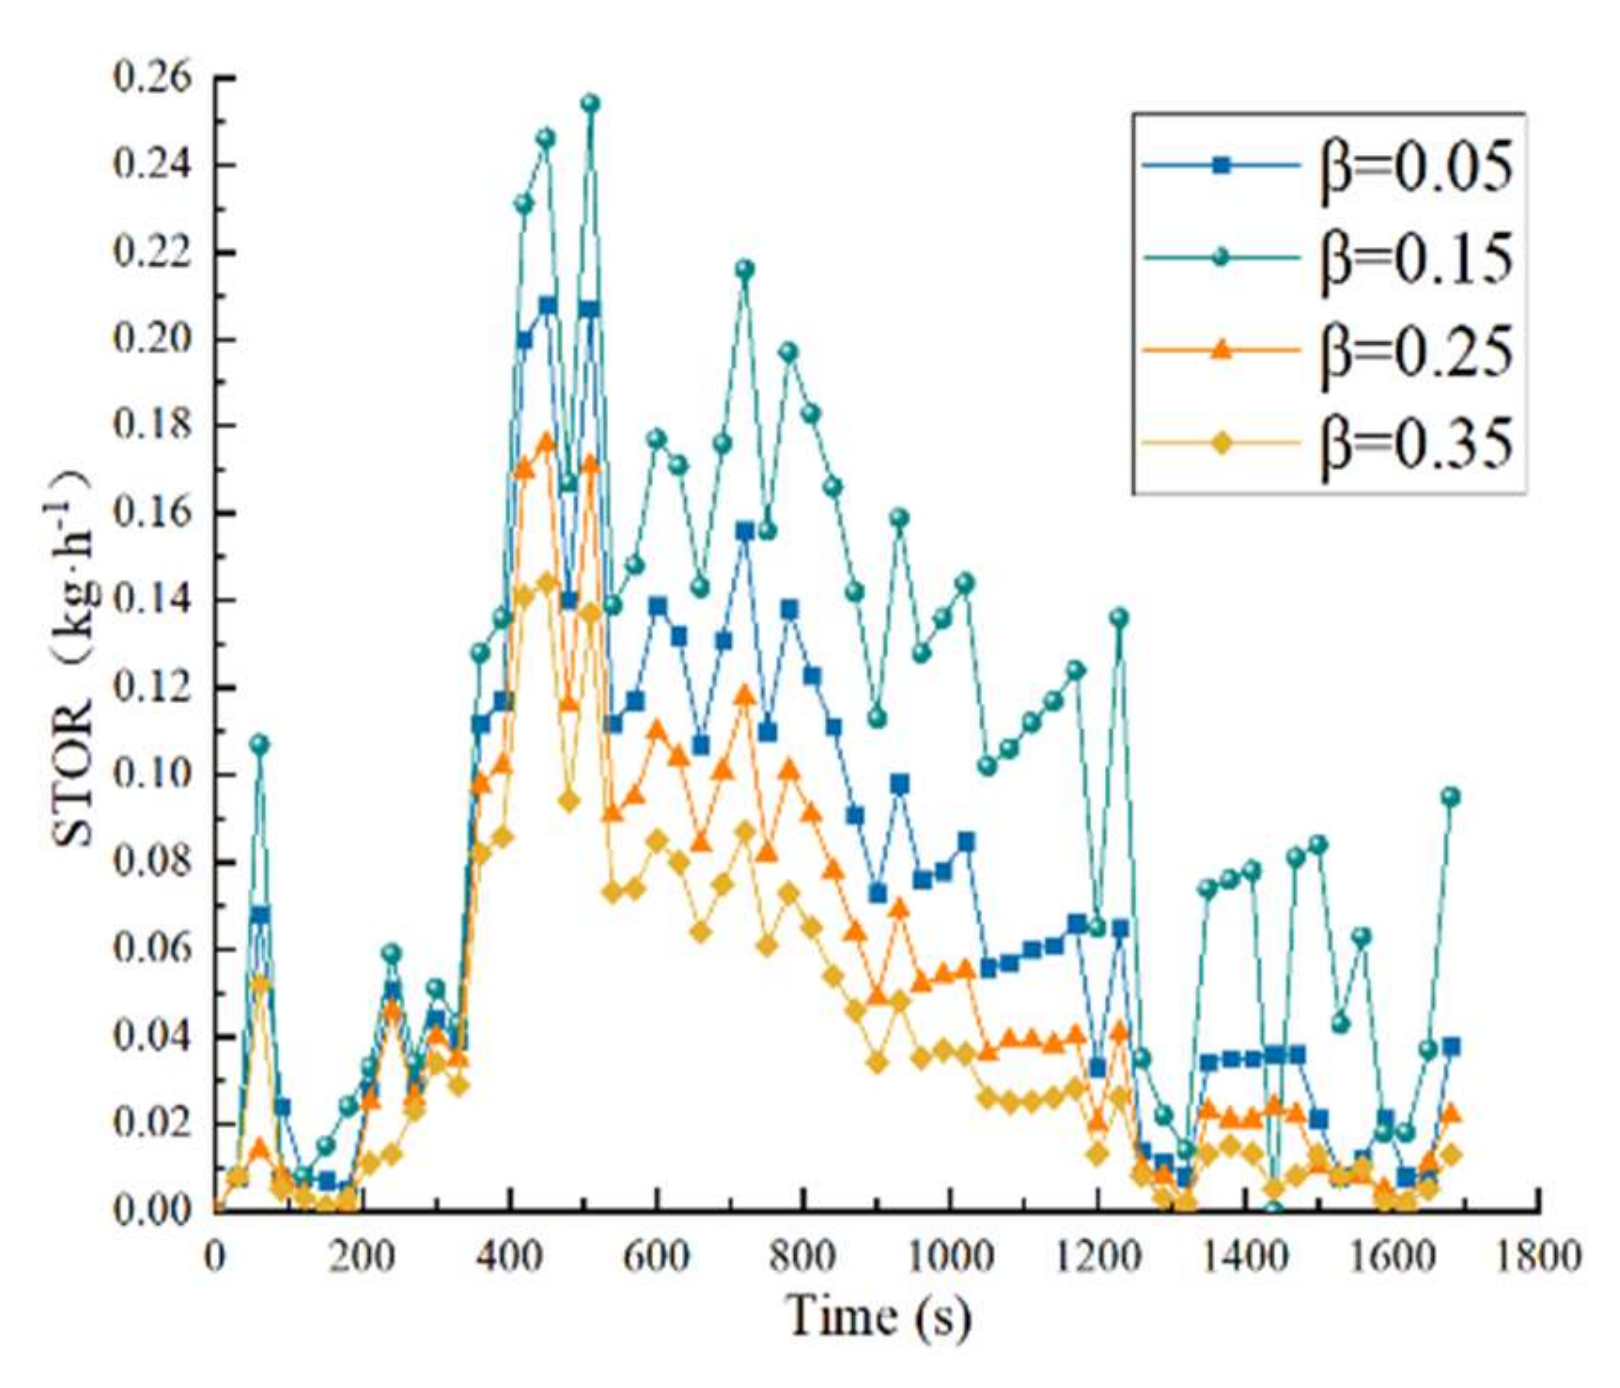
Since the magnitude of the standard oxygen transfer rate (SOTR) is positively correlated with the standard oxygen transfer coefficient, the value magnitude of the standard oxygen transfer rate, SOTR, varies erratically during the experiment, as shown in
Figure 25. When the dip coefficient
β = 0.05, the maximum value of standard oxygen transfer rate (SOTR) can reach 0.254 kg/h, and the average value is 0.103 kg/h. When the dip coefficient
β = 0.05, 0.25, and 0.35, the maximum values of the standard oxygen transfer rate (SOTR) are 0.208, 0.176, and 0.226 kg/h, respectively. It can be found that when the dip coefficient
β = 0.15, the maximum and average values of SOTR increase by 25% and 56.6% on average compared with the other three operating conditions.
As the dip coefficient β decreases, the air is injected into the aeration tank to oxygenate a larger range of action, and the longer it stays in the aeration tank, the more time the air has to dissolve in the water, and the standard oxygenation capacity increases. When the submerged depth continues to increase, the discharge tube and aeration pool bottom gap are reduced, and the introduction of air in the mixed discharge easily reaches the edge of the aeration pool; as this part of the air is difficult to dissolve in the water, the standard oxygenation capacity decreases. However, the standard oxygen transfer rate, SOTR, does not show a similar law of change, as the dissolved oxygen concentration increases first and then decreases, but is affected by the change in concentration gradient with time. However, from the above results, we see that when the dive coefficient β = 0.15, the centrifugal aerator can simultaneously take into account greater degree of contact mixing between the air and aeration pool water and avoid the discharge of air ejected to the edge of the aeration pool, when the standard oxygenation capacity is higher.
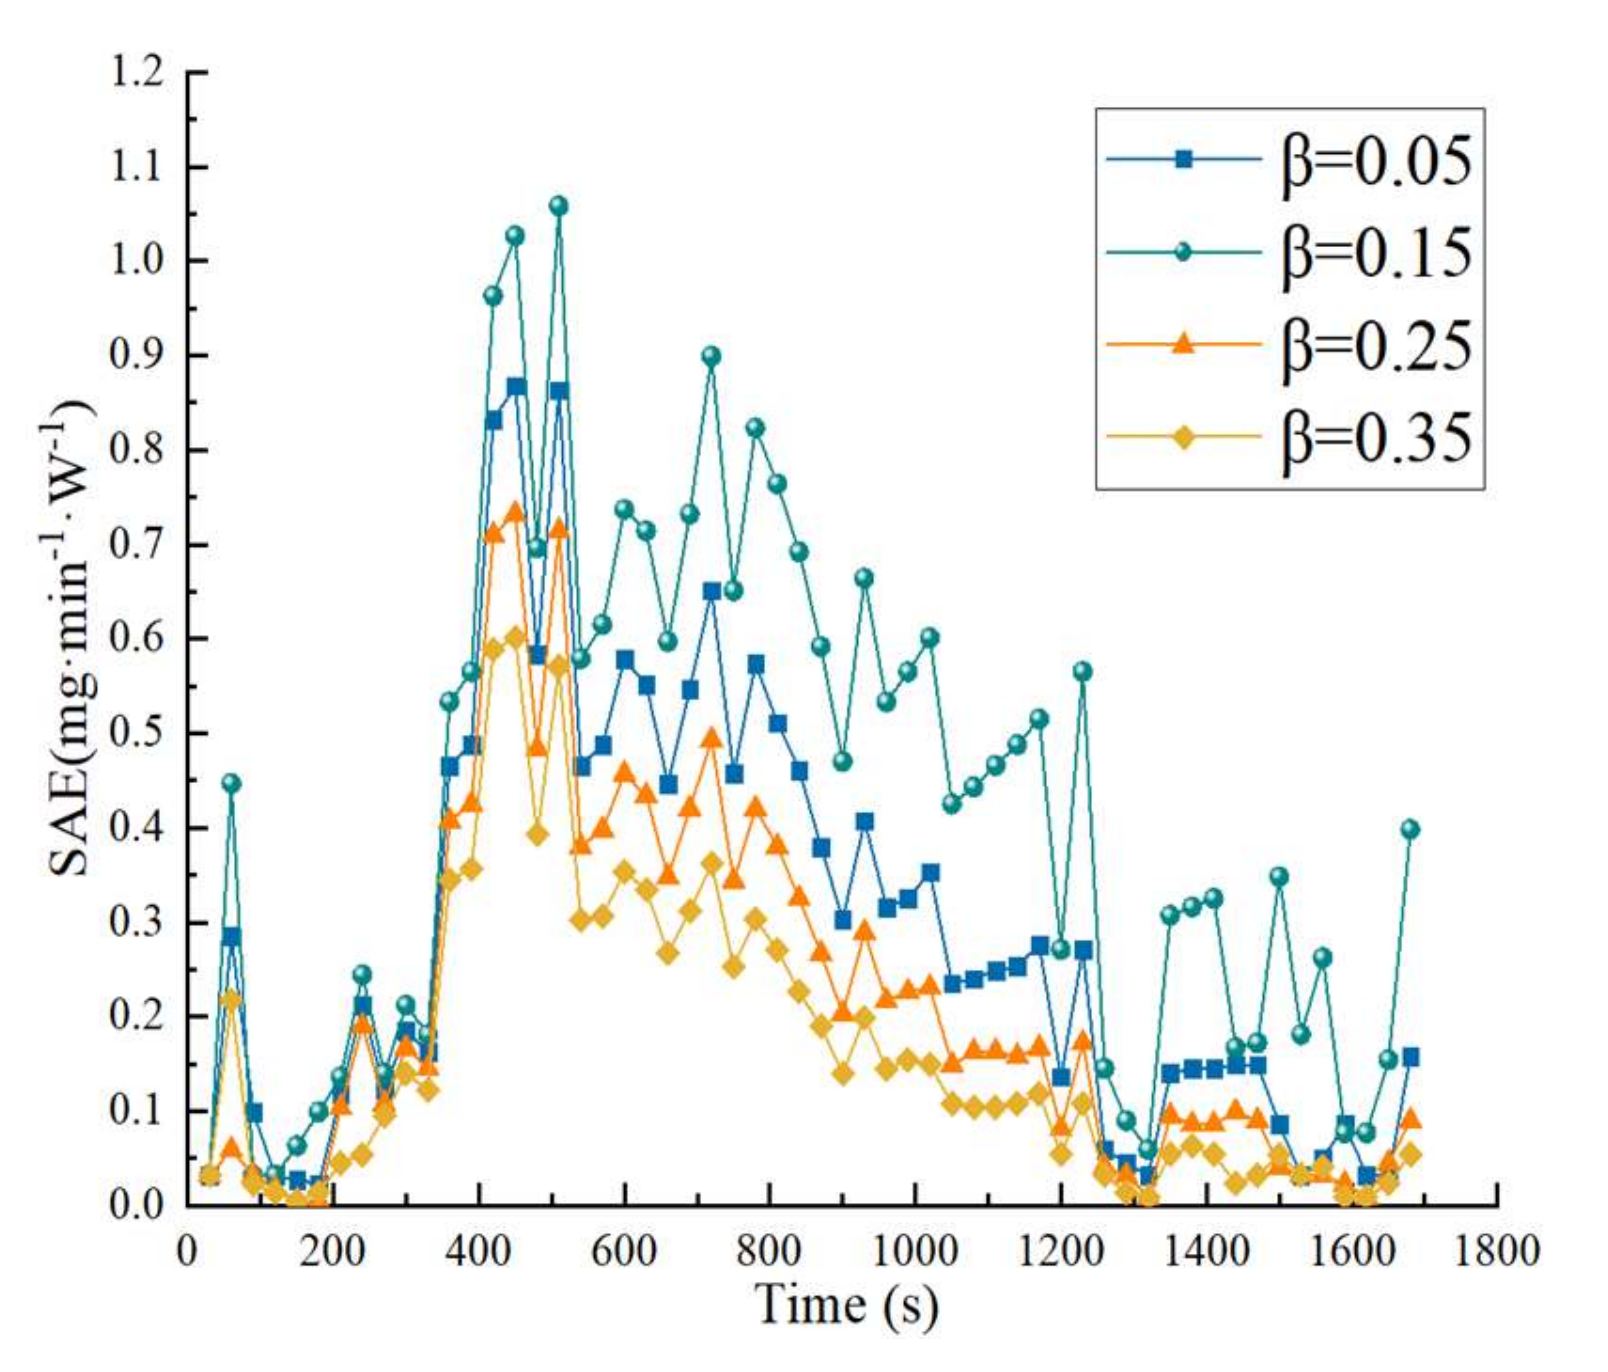
The standard power efficiency, SAE, is obtained from the ratio of standard oxygenation capacity to power, so its trend is consistent, and it can be seen from
Figure 26 that the maximum value of standard aerator efficiency (SAE) can reach 1.058 mg/(min·W) when the dip coefficient
β = 0.05 and the average value is 0.427 mg/(min·W). When the dip coefficient
β = 0.05, 0.25, and 0.35, the maximum values of standard aerator efficiency (SAE) are 0.868, 0.732, and 0.601 mg/(min·W); the average values are 0.290, 0.215, and 0.162 mg/(min·W). It can be seen that, when the dip coefficient
β = 0.15, the maximum value of its standard aerator efficiency, SAE, is increased by nearly one time on average relative to the other three operating conditions, and the average value is increased by 44.2%; this increase in SAE shows a different increase with the change of power.
