1. Introduction
Today more than ever, the application of SEO techniques and technologies to websites, regardless of their industry, is imperative. The rising usage of the web, the new habits of web searchers, the growth of competition, the great need to get organic traffic without paid ads, and the changes in search engine algorithms are just the beginning for a website to survive in the current COVID-19 conditions.
There are countless sources for a website to increase its traffic. The most important, as presented in the Google Analytics App, are: Organic Search, Social, Direct, Referral, and Paid traffic [
1,
2]. Organic traffic is the traffic that comes from users who use search engines to find (free of charge) what they are looking for. The results presented after each keyword search consist of a list of available websites that use the keyword searched [
3]. Thus, the traffic of a website depends on its ranking in search engines and its organic traffic. Since ranking in organic results cannot be paid, a high organic search ranking is, in most cases, hard to achieve [
1]. In order for a website to achieve high rankings in web searches, it has to meet certain specifications—ranking factors as they are described in the guidelines that are regularly published by the companies that own the search engines [
2]. These factors are known, but their impact on search ranking has not been fully reported, since search engines neither make public their ranking algorithms nor disclose information regarding the factors used in the ranking [
4]. However, the dominant SEO techniques and their impact on organic traffic can be found in several studies [
5,
6].
Through our study, we analyze a large sample, i.e., 243, of airlines websites. Each website is stress tested against several SEO techniques and technologies in order to find out how airlines define their SEO strategy and what specific SEO techniques are used to impose themselves against the competition. Through a fuzzy cognitive map, we determine the relationships between SEO techniques and their contribution to the corresponding traffic. Finally, our descriptive analysis attempts to correlate the contribution of SEO and the corresponding sustainability of the airline industry, by using research hypotheses and problem formulation techniques.
To achieve the above results, we created a php-based software tool, which undertakes to check for the SEO techniques used in the source code of each website and create the corresponding reports used in our descriptive analysis that follows. To deal with access problems from the websites’ firewalls, we used proxy servers and desktop User-Agents.
Our study provides a handful of time-accurate insights for both existing and potential future marketeers regarding SEO strategies that airlines follow and which specific SEO techniques they apply to their websites to overtake their competition in search results.
2. Significance of the Study and Related Work
From the very first “document-based” Web 1.0 founded in 1990, proceeding to the “social and mobile” Web 2.0 founded in 1999 and shifting to the “semantic” Web 3.0, the Web has rapidly grown in only three decades [
6].
In the past, the number of websites was limited, so web users knew in advance the URL of the website they wanted to visit. On the current Web, with almost up to 2 billion live websites [
6], users search keyword phrases to search engines in order to find the information they are looking for. Search engines act as an intermediate between websites and web users and could be considered as a bookmark that points to specific pages depending on the query.
Under these circumstances, the need to optimize websites according to search engine guidelines was produced with the ultimate goal of a better position in the search results.
Past related research articles manage to identify what SEO techniques exist and how important they are to achieving better positions in search results. However, none of these publications suggest exactly which SEO techniques a website owner should use and in what order to optimize SEO results.
Our research came to fill this gap by examining which SEO techniques will produce better results. To achieve that outcome, a main hypothesis is presented, which states that airlines, as billion-dollar companies, employing large marketing teams, have discovered which SEO techniques are most effective and the combination of SEO techniques that can produce higher results against competition.
Taking a large sample of 243 airline firms from IATA’s website, conducting various data analysis tests, our research came to the conclusion of exactly which SEO techniques the airlines use and with what adoption score.
Our research identifies which SEO techniques are the most widely used among airlines, concluding that if they are applied in a specific order, from those with the highest adoption score to the lowest, they can bring results not only for large airlines but also for smaller websites.
Search engine optimization (SEO) is the process used by SEO experts to improve both the quality and quantity of traffic to a website from search engines [
1]. Web users search words or phrases, called keywords, in search engines. After each search query, users expect search engines to answer their query. The answer comes in the form of a list of websites related to the keyword and can provide the user with the answer he/she is waiting for. The results that appear after each search are called Search Engine Results Pages (SERPs). Some of the results are related to paid advertisements and some others appear strictly algorithmically without advertising payments, called organic search results. Paid results appear higher in searches and they are marked with an “Ad” badge. On the contrary, organic results are displayed below the ads. As a consequence, some website owners pay per click (PPC) to appear higher in the search results—paid results—and some others are ranking organically below the ads without any payment—organic results.
According to Google’s search engine, there are over 200 factors that artificial intelligence (AI) algorithms take into consideration to rank websites in each search query in the organic results area [
2,
3]. Search engines do not publicly reveal their algorithmic methods for ranking websites [
7]; as a consequence, SEO experts have to follow every available rule, making changes to the website source code and uncover its effectiveness. SEO experts have introduced SEO techniques intended to improve the ranking of a website in the search results for given target keywords that assist website owners achieve the standards of each ranking factor [
4].
SEO techniques and technologies are grouped into two main categories, on-page SEO and off-page SEO, respectively. On-page SEO techniques concern the changes and additions that the website must apply to its source code in order to achieve each ranking factor. On the contrary, off-page SEO techniques concern tasks that must be carried out on third web sources that will give credibility to the website [
7].
In this article, we focus on on-page SEO techniques from a technical point of view.
2.1. On-Page SEO Techniques and Technologies
As mentioned above, on-page SEO techniques are related to the modifications that must be implemented to the website’s source code to fulfill each ranking factor’s requirements. Below, we will focus on 15 on-page SEO techniques and technologies recommended by Webmaster guidelines in the Google Search Central documentation [
2].
2.1.1. Descriptive Title Elements
According to the World Wide Web Consortium (W3C), the title tag is a fundamental part of a website. The title consists of a combination of words and phrases that represent the content of the web page [
8]. As long as the title is descriptive and concise, it is used by search engines to add the website to the search results [
2]. Its relevance to the search query gives the searchers a quick insight into the content as far as they decide which of the results to click.
The title tag should have a specific length size to positively affect both web users’ experience and search engines. The recommended title length should be neither less than 6 nor more than 78 characters [
9]. There are many cases where the title tag is misleading for ranking purposes, including keyword stuffing techniques. In the corresponding cases, search engines replace the search result title with a tag considered more relevant to the content of the web page [
2]. As reported by Moz’s testing and experience, keywords closer to the beginning of the title tag may have more impact on search rankings [
10].
2.1.2. URL Structure
URL (RESTful URLs or search-friendly URLs or user-friendly URLs) is a human-readable text that defines the structure of files within a web server. Each URL has three distinct parts, i.e., the access protocol, the domain name, and the path [
11].
The URL of a website is an important ranking factor that search engines use to understand the website’s content and link it, or not, to a search query [
5,
6]. A well-structured URL provides both search engines and visitors a straightforward way to understand the content of the page, even before visiting it [
12]. SEO-friendly URLs should be concise, short, and easily readable. They should consist of words, hyphens, and slashes [
2,
7]. On the contrary, non-SEO-friendly URLs consist of ampersand symbols, numbers, words, and question marks [
13].
According to the Moz SEO learning center, the URL length must be shorter than 2083 characters to be correctly rendered in all browsers and to be visible to searchers in the search results [
14].
2.1.3. Image Optimization and Alternative Tags
An essential factor for the load time of a website is certainly the file size of the integrated images. An image that exceeds 100 kb file size is often difficult to access for users, despite the improvement in Internet speeds in recent years [
6]. Several image compression formats are already used and Google provides a modern image format, i.e., WebP, which provides up to 26% more and lossless compression to the original image [
15].
In addition to the file size, a key role in SEO regards alternative tags (ALT tags). Although search engines use computer vision and machine learning algorithms to determine image content, there are several cases that fall down [
16]. An Alt tag is a text that describes an image and can improve accessibility to either visually impaired people or search engines bots [
2]. By including images in the content and adding targeted keywords in the Alt tag, we can improve the SEO score of the website [
7,
17].
Furthermore, image file names play a vital role in SEO. The same methodology used to create URL structure can be employed to create SEO-friendly image file names.
2.1.4. HREF Alternative Title Tags
Each page contains Internal and External Linking. When a user notices a Link on a page, they usually puts their mouse over this Link before clicking. Before accessing this Link, they would likely want to know where that Link points to. Likewise, search engines also prefer to know about the content of the landing page where the link points to [
18]. As a result, the title tag is necessary for both users and search engines to understand the website’s internal or external linking and structure.
2.1.5. Descriptive Meta Tags
The meta description tag follows the title tag in the head container [
8]. By searching and following one of the results, we initially see the title of the page, then the URL, and finally the meta description. The meta description tag can be used by search engines as an abstract for the page, containing real sentences related to the page’s content [
4]. Meta description gives information on what users are about to find on this page [
7]. SEO experts are optimizing meta descriptions to make sure that the listing seems interesting and whether it is also consistent with the content of the website [
18]. It must be at least 51 characters long and should not be longer than 350 characters [
6]. It can also improve SEO results if the target keyword is inserted into the meta description [
16]. The results have shown that pages containing metadata rank higher than pages without them [
1]. However, many times, although the web page contains a meta description tag, the description of a search result is not the same as the meta description. Search engines, mostly Google, usually characterize the meta description as a non-representative factor, because it is often misleading.
2.1.6. Heading Tags
According to w3c web standards, HTML defines six levels of heading tags. The heading elements are H1, H2, H3, H4, H5, and H6, with H1 being the highest (or most important) level and H6 the least [
19]. The Google Central Blog urges webmasters to use heading tags to emphasize the important parts of a text [
2]. Heading labels are practically the highlights of a site. Heading names are given more worth by means of web indexes than ordinary body copywriting [
8]. It can also be a great pathway used by screen readers for people with visual disabilities. In addition, H1 and H2 tags are important when a web crawler examines a website. For SEO purposes, the main keyword should appear in both H1 headings and H2 subheadings and the length should be between 10 and 13 words [
12]. In SERPs, the title tag could be ignored by the search engines and, in these cases, it is replaced by the H1 one.
2.1.7. Minify Resources (HTML, CSS, and JavaScript)
Minification refers to the process of removing unnecessary data without affecting how the resource is processed by the browser, for example, removing code comments, formatting, shorter variables, and function names [
2]. Apart from images, which have to be optimized to load quickly, as described in
Section 2.1.3, all the other files on a website should be as lightweight as possible to enhance page load time and user experience (UX) [
6]. Javascript (.js), Cascading Style Sheets (.css), and HyperText Markup Language (.html) files can be minified in order to improve a website’s load time and SEO results. Performance evaluation studies have shown that minification can supply up to a 16% decrease in load time and up to 70% smaller files’ total size [
20]. Along with improving website speed, minification can increase the security of a website. During the minification process, variable and function names in JS code are replaced by short and meaningless names, thus, making the code extremely unreadable and human unfriendly [
21].
2.1.8. Sitemaps and RSS Feed
A sitemap is a file, in which the webmaster provides information about websites’ pages and their interrelations [
2]. The sitemap informs the search engines of the website’s most important pages, how often they are updated, and if there are any alternate language versions of the page [
18]. Sitemaps are critical for large websites containing over 500 pages, helping web crawlers know, in advance, their backbones [
2,
18]. Search engines, primarily Google, support various formats regarding the sitemaps, such as XML, RSS, and plain text and XML is the predominant format. Finally, webmasters are encouraged by search engines to submit their website’s sitemap to their sitemap submission tools, so that the website can be indexed faster [
3].
The RSS feed is also a decisive factor in order to improve the visibility of a website by search engines [
5]. Typically, the RSS feed is created to inform visitors about the new content added to a website [
22]. RSS feed is also used by search bots to easily find the new content added to the website and provides a more dynamic representation of the website’s internal linking than the static XML one [
2].
2.1.9. Robots.txt
The robot exclusion protocol, i.e., a robots.txt file, indicates a list of website URLs, which should not be accessible by search engine crawlers [
2]. For example, the admin panels in websites developed with Content Management Systems as well as several other pages of a website should not be accessed by web crawlers. By creating a list of URLs in the robots.txt file, we indicate that either the web access to this list or its indexing in the search results is not allowed. However, several search engine indexers are used to violate the robots.txt protocol [
23].
2.1.10. Mobile Friendliness
About 50 percent of web users use mobile devices for search process, while two out of three of them are finally coming to a purchase [
23]. In many countries, the number of smartphones has surpassed the number of personal computers [
2]. Along with the increase in mobile users, having a mobile-friendly website has become a critical part of having an online presence [
2]. Aligned with this, Google has created the mobile-friendly test tool, which checks all the building blocks of a website in order to characterize it as mobile friendly or not [
24]. Responsive design CSS frameworks, such as Bootstrap, Materialize, Bulma, UIKIT, etc., provide numerous ready-made design templates suitable for all devices [
13].
2.1.11. Website Speed
Webpage loading speed is an important factor for search engine ranking and plays a vital role in achieving better results in the SERPs [
25]. Search engines consider page speed as one of the key elements a website should have. There are plenty of tools around that allow website owners and visitors to conduct tests on websites, such as Google Lighthouse, Pingdom, GTMetrix, and SiteAnalyzer [
26].
Lighthouse and PageSpeed Insights tools, both developed by Google, help webmasters to control and improve website performance. They both collect data from a website and produce a performance score and estimated savings opportunities. The main difference between these tools is that the former only uses lab data to determine website performance on a single device and fixed set of network conditions, while the latter uses both lab and field data to determine website performance on a variety of devices and real-world conditions. Depending on the performance score, the webmaster can proceed to recommended changes in order to achieve better performance on his website [
27]. The Pingdom tool applies similar techniques [
28].
2.1.12. Add Security with HTTPS
HTTPS (Hypertext Transfer Protocol Secure) is an internet communication protocol that protects the integrity and confidentiality of data exchanged between end-user’s computer and the website. Users expect a secure and private online experience when using a website [
2]. Search engines rank higher in the SERPs websites with an SSL certificate for security reasons [
26]. To emphasize the importance of SSL certificates, Google Chrome Browser warns users while navigating whether a website provides an SSL certificate (secure) or not (not secure) [
29].
2.1.13. Accelerated Mobile Pages (AMP)
Over the last decade, the number of mobile users has grown rapidly, surpassing 7.7 billion by late 2017 [
30]. Accelerated Mobile Project (AMP) is a recent effort started by Google with a similar goal of improving the mobile browsing experience [
31]. Google identifies what pages follow the AMP standards and keeps a cached copy of their source code on Google’s web servers [
32]. When a mobile user clicks on an AMP result in the SERPs, it automatically receives the cached copy from Google’s web server on its browser [
2]. As a result, mobile users immediately receive the information they are looking for without any further network delay. Web pages that follow the AMP standards rank higher in mobile SERPs [
31]. Although AMP technology is effective for both search engine rankings and web page performance, achieving the AMP standards is a demanding task [
30,
33].
2.1.14. Structured Data and Rich Snippets
Schema.org is a collaborative community that creates, maintains, and promotes schemas for structured data on the Internet, on web pages, in email messages, and beyond [
34,
35]. Structured data are a standardized format for providing information about a page and classifying the page content [
2]. Schema.org vocabulary can be used with many different encodings, including RDFa, Microdata, and JSON-LD [
13]. Schema markups can be added to the HTML source code of a website through semantic annotations that can be processed by search engines to understand the meaning of the content fragments and provide users with enriched information in the search results [
36]. The use of markup formats is an emerging trend in the semantic web, in particular, because of the support of the main search engines [
37]. Google rewards the use of structured data by displaying rich results—rich snippets in SERPs, such as the price and the availability of a product [
6].
2.1.15. Open Graph Protocol (OGP)
OGP is also a form of structured data developed by Facebook to enable the integration of external content into the social networking platform [
37]. The OGP enables any web page to become a rich object in a social graph. For instance, OGP is used on Facebook to allow any web page to have the same functionality as any other object on Facebook [
38]. Once a website’s URL is shared on social media, social media bots visit the website trying to find three key elements of the web page, such as title, image, and short description.
With the integration of OGP, webmasters pre-markup these elements and make it easier for social media bots to display the result they are looking for. The use of OGP, like any other structured data format, provides richer results to search engines and social media end-users and is a crucial factor for a user to decide whether to click on and visit the corresponding website or not [
13].
2.2. Off-Page SEO Techniques
Off-page factors are the ranking factors that are not related to the content of a web page and depend on various external impacts [
1,
26]. Off-page optimization strategy entails building backlinks on other well-reputed websites and, thus, boosting domain-level and page-level authority [
3]. The biggest off-page SEO factor is the number and quality of backlinks to the owner’s website example, such as creating awesome content that people want to link because it is valuable [
7]. Search engines treat links as up-votes, assuming that web pages with more links are more important and should, therefore, be positioned higher in search results [
1]. There are over 12 types of off-page techniques that can affect website recognition and rank position in SERPs. Some of the most important techniques are guest posts, profile backlinks, Q and As, and comment backlinks [
7]. According to Google’s founders in their publication in 1998, anchored links are links to a website containing the target keyword of the destination website. Anchors often provide more accurate descriptions of Web pages than the pages themselves [
39]. To appear higher in SERPs, the website has to include the target keyword in both on-page and off-page factors [
1]. While using off-page SEO techniques is beneficial for website ranking, search engines warn webmasters that any attempt to influence search engine rankings by creating links may be a criterion for degrading or removing the website from the SERPs [
6].
3. Materials and Methods
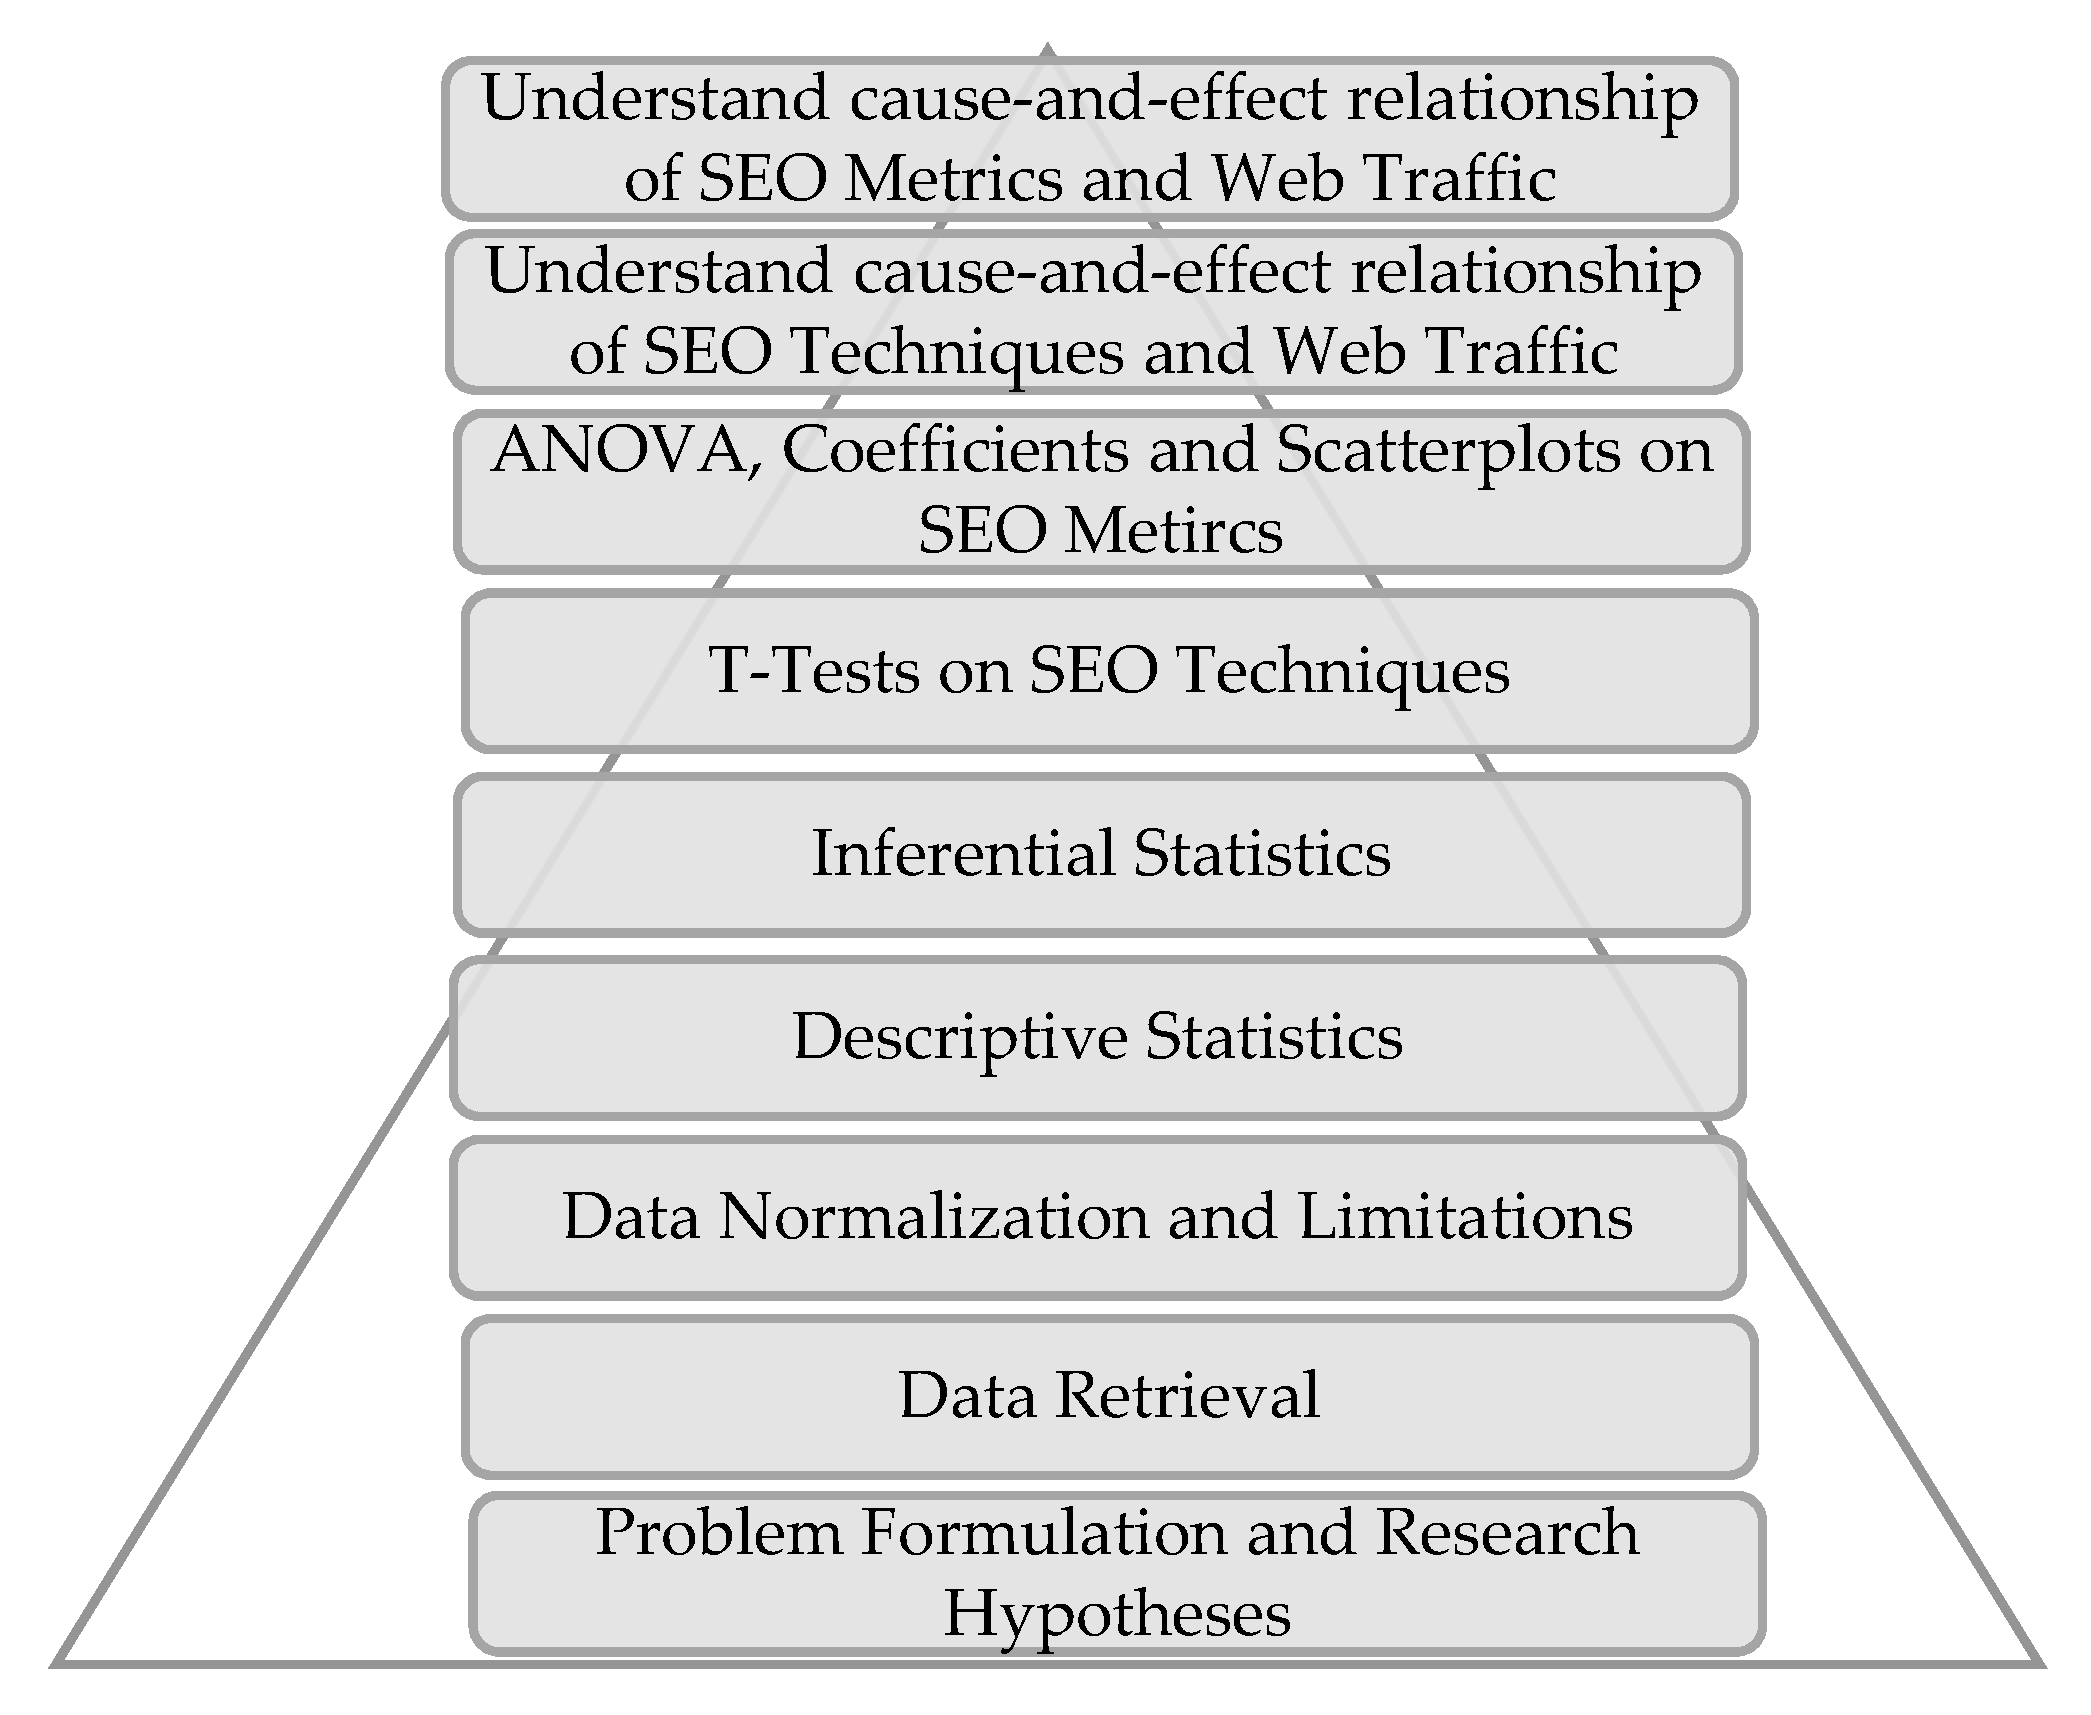
The purpose of this paper is the proposal of an innovative methodology for deploying an efficient framework for understanding the strong connection between search engine optimization and web traffic, providing valuable insights for airline firms’ websites. To reach the desired results, we follow nine research stages, presented in
Figure 1.
3.1. Websites’ Traffic Sources and Key Performance Indicators
Airlines’ online presence, as well as their bookings, are directly affected by various factors, which should be analyzed and taken into consideration over our estimation. To obtain a more specific vision of the airlines’ online presence, we use the organic web traffic source, which indicates the main source of websites’ traffic. Organic traffic, as mentioned in
Section 1, is the traffic coming from users who use search engines (e.g., Google, Yahoo, etc.). It is an unpaid form of web traffic, whose role in business success is vast. The majority of websites rely on organic traffic results, since it represents over 60% of a website’s total traffic [
40]. Organic traffic, as an unpaid source of traffic, has many benefits for businesses, such as relatively small investment in contrast with PPC campaigns, long-lasting results enhanced year by year with the appropriate effort, and major increase in brand awareness [
41].
Four more factors that search engines take into consideration while evaluating a website, before ranking it in the SERPs, are the organic keywords, the backlinks, the website speed, and the domain authority (DA) [
42,
43]. Organic keywords are the keywords for which websites are ranked in the organic SERPs of search engines [
44]. Backlinks are links from third pages to the target page that act as an up-vote on that page [
1]. Website speed is the time in seconds it takes for a web page to be fully downloaded and loaded from the webserver to the user’s browser. Domain authority (DA) is a search engine ranking score developed by Moz that predicts the strength of a website in terms of its ability to rank in SERPs. Domain authority score ranges from 1 to 100, with higher scores corresponding to greater likelihood of ranking [
45]. Domain authority as a metric is not visible to search engines. It tries to simulate how search engines rank web pages. In most cases, the domain authority score is representative. DA is important to compare websites with each other. Websites with a higher DA are more likely to appear higher in SERPs than others with a lower DA, respectively.
The web traffic metrics proposed as KPIs in this paper are presented in
Table 1.
A performance indicator or key performance indicator (KPI) is a type of performance measurement that evaluates a business’ success in certain activities that it takes over [
46,
47]. KPIs examined for the purposes of this paper alongside the web metrics are included in
Table 1. It is valuable to examine website traffic on a monthly basis to export more accurate results concerning traffic and ranking performance.
The main objective of our KPIs is to achieve higher results in organic traffic as well as higher positions in search results. In our research, we have five key performance indicators, i.e., Organic Traffic, Domain Authority, Website Speed, Organic Keywords, and Backlinks. Each one should be accomplished to gain higher organic traffic and potential customers.
Table 1.
Description of the examined web analytics metrics and suggested KPIs and performance measurements.
Table 1.
Description of the examined web analytics metrics and suggested KPIs and performance measurements.
| KPIs (Unit) | Description |
|---|
Organic Traffic/month
(number of visitors per month) | Organic search refers to the non-paid search results from a search engine. These results can’t be bought or influenced by advertisers, so they are the ones the search engine considers most relevant to the user’s search query [48]. |
| Domain Authority—DA (score in the range (0–100) integer) | DA score can be used when comparing websites or tracking the “ranking strength” of a website over time [45]. Websites with higher DA are more likely to rank higher in SERPs than those with lower DA. |
| Website Speed (seconds) | Website speed refers to how quickly a browser can load fully functional web pages from a given website. |
| Organic Keywords (number of keywords) | Organic keywords are keywords used in SEO to attract “free” traffic. When a user types a keyword on the search engines gets as a result websites which rank for this specific keyword [44]. |
| Backlinks (number of backlinks) | Backlinks are the number of external pages that show the target page with a link. Backlinks help secure a higher SERP ranking [23]. Backlinks affect mostly the position of a website followed by relevant content [5]. |
3.2. Sample Selection and Data Retrieval
For the purpose of this paper, we retrieved data from the International Air Transport Association (IATA), which supports aviation with global standards for airline safety, security, efficiency, and sustainability [
49]. The sample is based on 243 IATA members. Some of the most well-known airlines in our sample are Air Canada, Air France, American Airlines, British Airways, China Airlines, and Emirates. For the above airline firms, data were collected concerning their websites’ organic, direct, and referral traffic, as well as their websites’ session duration and the bounce rate. The sample was considered representative, providing knowledge about the search engine optimization applied by airlines as well as how this translated into traffic. Data were collected on a monthly basis from the airlines’ websites, for more accurate examination and comprehension of web metrics’ variance. The testing period extended to 12 months, which is limited to specific dates from December 2020 to December 2021. Since this period coincides with the COVID-19 transportation restrictions, the results will provide a clear view of the decline in bookings during this period.
To collect the sample, we created a PHP-based web crawler tool, which undertook to extract information, such as legal name, ICAO code, region, and website from each airline listed as a member in IATA’s website [
49,
50]. After the data extraction, we stored the entire dataset in a MySQL database, which we used to conduct the SEO checks as a next step [
50].
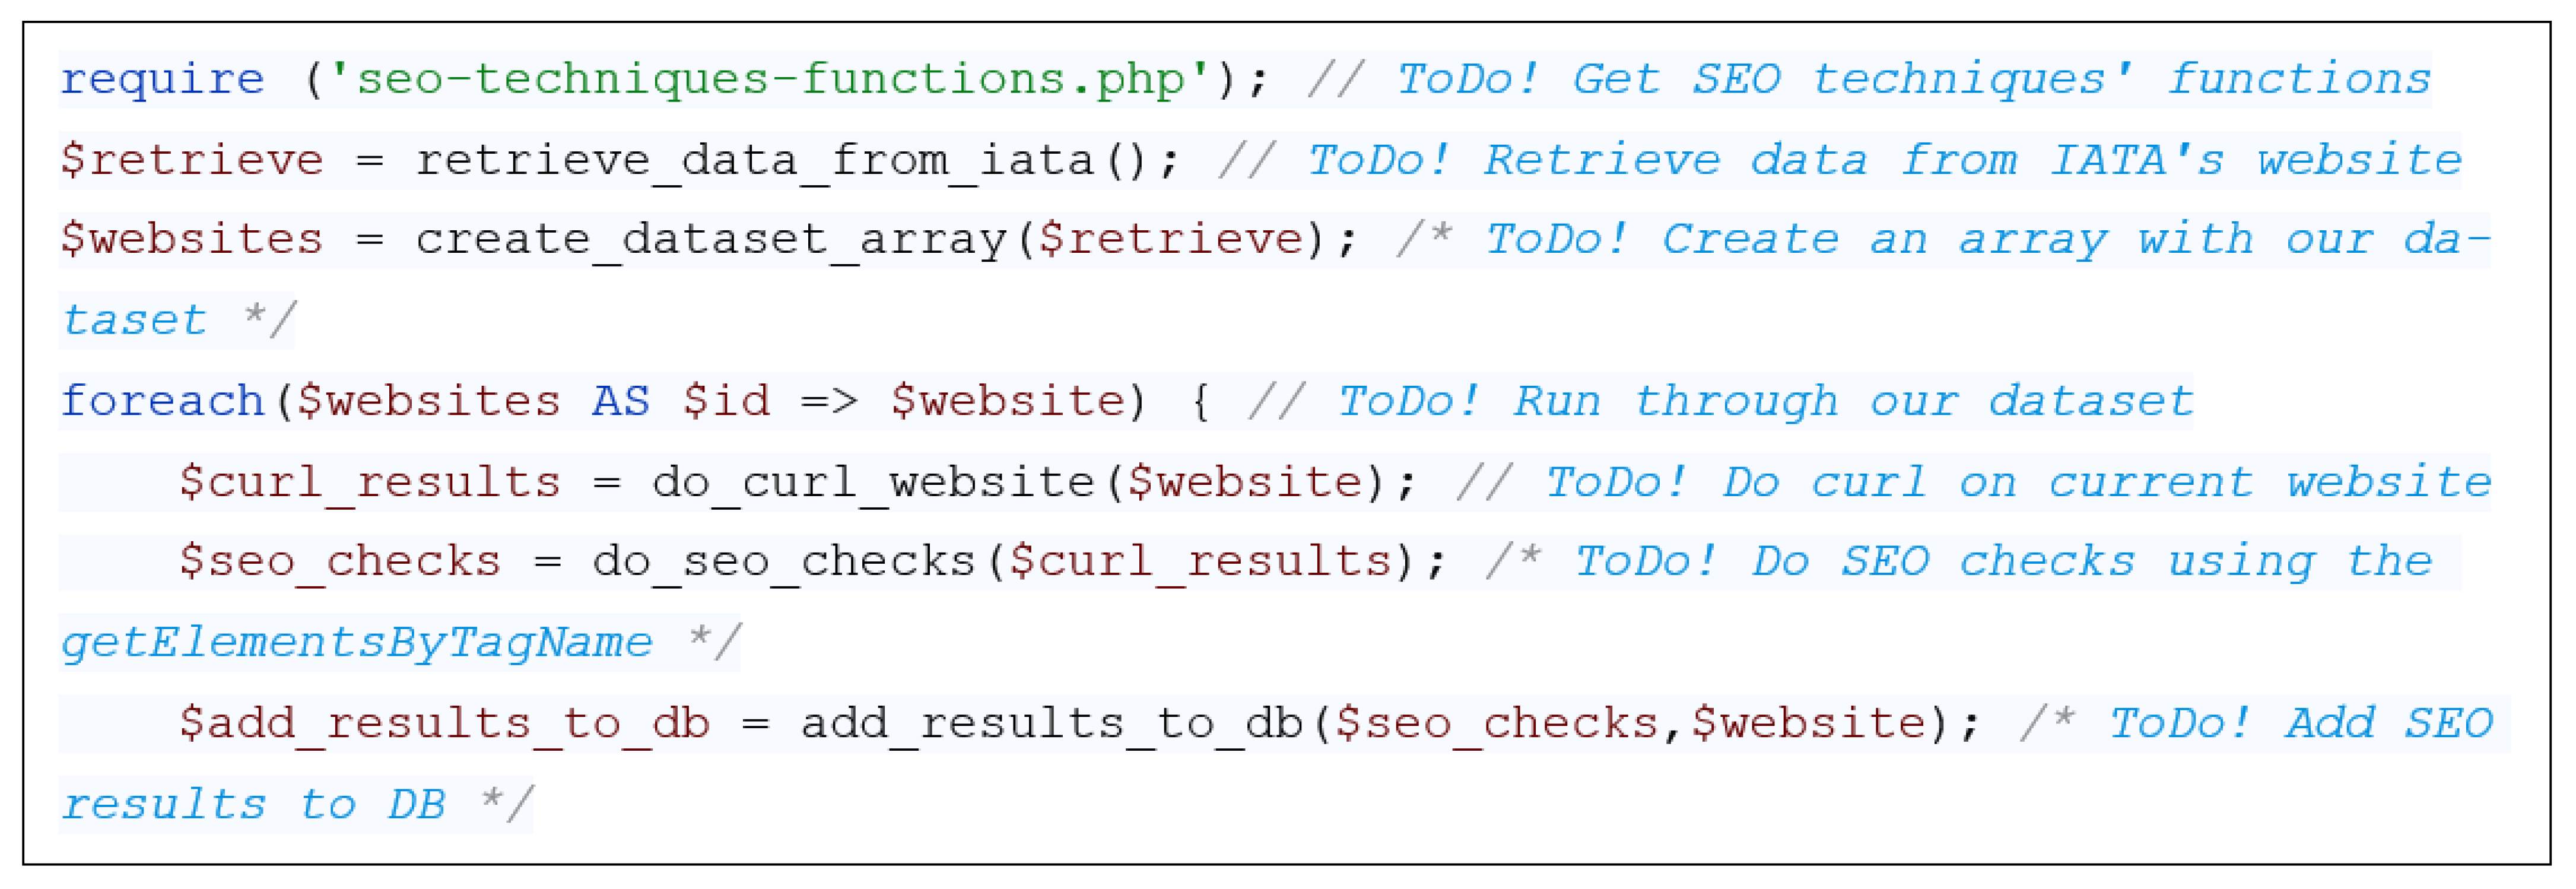
The software tool created for the purpose of this article draws the dataset from IATA’s website and stores each result in a MySQL database. It then runs through the dataset and extracts the source code from each airline’s website via cURL. CURL is a computer software project providing a library (libcurl) and a command-line tool (curl) for transferring data using various network protocols [
51]. For each of the 15 SEO techniques presented in
Section 2, a separate function was created, which searches the source code of the targeted website to find out if the SEO technique has been applied. Finally, the results from the checks are stored back in the database. A comprehensive example of the generated code and its main functions is shown in
Figure 2.
To expand our research and extend our results, four third-party API tools were used, i.e., Mobile-Friendly Test Tool API, PageSpeed Insights API, Mozscape API, and Ubersuggest Traffic Analytic tool. Each of these tools obtains the website’s URL and returns results based on its own measurements.
Mobile-Friendly Test Tool API, created by Google, checks the given URL against responsive techniques and returns a list of any mobile-usability issues that can affect a user that visits the page on a mobile device [
52].
PageSpeed Insights API, created by Google, measures the performance of a web page returning suggestions on how to improve the page’s performance, such as page speed, accessibility, and SEO [
53].
Mozscape API, created by MOZ, takes as an input the website’s URL returning accurate metrics such as Domain Authority [
45].
Ubersuggest, created by Neil Patel, obtains and returns a 360° overview of any website’s metric and its sources [
54].
After conducting SEO evaluations on 243 airline websites, the exported results imported to IBM SPSS 27 (IBM, Armonk, NY, USA). Organizations use IBM SPSS Statistics to understand data, analyze trends, forecast and plan to validate assumptions, and drive accurate conclusions [
55]. Descriptive analysis in different correlations was conducted, confirming the research hypotheses that follow. Finally, a fuzzy cognitive map (FCM) was created to graphically represent the relationship between SEO techniques, traffic, and backlinks, showing the direct correlation of SEO techniques with traffic and, consequently, the bookings and sustainability of airlines.
3.3. Problem Formulation and Research Hypotheses
The rising competition, the COVID-19 era, and travel restrictions around the world tend to increase companies’ efforts for efficiency in digital marketing campaigns. Airlines use every available tool at their disposal, from copywriting, email marketing, social media marketing to search engine optimization to reach their potential customers through numerous methods. By understanding the consumer habits of their audience, airlines develop marketing strategies to target this audience more effectively.
Airline websites are the main source of bookings and companies dedicate resources to organize and maximize their website’s efficiency and effectiveness. Their position in search engine results (SERPs) plays a crucial role in gaining organic visitors. The web page title, the meta description, and even the rich results must be applied with attention to detail to win the coveted click. Content, user interface, and website speed will pique the visitor’s interest converting him/her to a loyal client. Knowing that traffic and conversion to client is the main point of airlines, we define five hypotheses on which we base our research, attempting to confirm them, aiming to extend the practical knowledge over the significance and impact of search engine optimization to airline website traffic.
Hypothesis 1 (H1). SEO techniques impact airlines’ website traffic.
The main goal of this paper is to acknowledge whether search engine optimization impacts airlines’ website traffic. By knowing which SEO techniques airlines implement on their websites, comparing the findings with the results in traffic provides us with valuable information and potential benefits from using SEO techniques. As mentioned in
Section 3.2, a dataset was collected from the IATA website [
49], consisting of 243 airline firms’ websites. Scanning and performing SEO tests on each website source code, using our own developed software [
50], we gather information regarding the SEO techniques each website has implemented. Using third-party software tools described in
Section 3.2, we scan each website gathering information concerning their domain authority, website speed, organic keywords, organic traffic, and backlinks. All data collected are stored in an excel sheet. Using the IBM SPSS 27 software descriptive analysis was conducted in order to find connections/patterns between SEO techniques used by websites and their organic traffic. The ultimate goal of this research is to uncover which SEO techniques used by the most well-known airlines are more effective in organic traffic, assuming that the websites with the highest organic traffic applied the appropriate SEO techniques in their source code.
Hypothesis 2 (H2). On-page SEO techniques impact airlines’ website ranking.
Hypothesis 2 is a segment of Hypothesis 1, targeting the on-page SEO techniques. Our second hypothesis is based on on-page SEO techniques and how they affect website ranking. Targeting multiple keywords, as well as the implementation of on-page SEO techniques, is assumed to offer an increase in organic results.
Hypothesis 3 (H3). Off-page SEO techniques—backlinks impact airlines’ website ranking.
Hypothesis 3 is a segment of Hypothesis 1, targeting off-page SEO techniques. Hypothesis 3 focuses on the implementation of off-page SEO techniques and how they affect the traffic of airlines’ websites. We assume that the creation of backlinks to third-party websites will lead to strengthening website’s domain authority and consequently will lead to higher positions in the SERPs.
Hypothesis 4 (H4). Airlines’ organic keywords impact airlines’ website ranking.
In Hypothesis 4 we assume that organic keywords are valuable for airlines’ website leading to higher rankings on SERPs and increased Web traffic.
Hypothesis 5 (H5). Airlines’ backlinks impact the airlines’ domain authority.
In Hypothesis 5 we assume that the backlinks are integrally linked with domain authority.
4. Results
4.1. Data Normalization
In this section, we examine the collected data. As mentioned in
Section 3.2, our tool performed SEO checks on 243 websites. The results were stored in excel so that we can use them in further data analysis [
56].
Collected data are separated into three groups.
Group 1: Metrics are checks performed by third-party tools and are not SEO techniques. The contents of the Group Metrics are as follows: DA (integer 0 to 100), speed_test (decimal), number of keywords (integer), and number of backlinks (integer).
Group 2: SEO techniques are checks performed by our tool regarding the existence (or not) of SEO techniques on each website in the dataset. All metrics returned 1 if the SEO technique was applied to the website and 0 otherwise. The contents of the Group SEO techniques are as follows: images_alt, links_title, rss, sitemap, robots, heading1, heading2, web_ssl, meta_description, opengraph, url_seo_friendly, amp, minified_css, minified_js, title, structured_data, and responsive_test.
Group 3: Web Traffic (organic traffic) is the monthly statistical data collected for each website. All web traffic data are integers and refer to website data for the last twelve months. The contents of the Group Web Traffic are as follows: traffic_1, traffic_2, traffic_3, traffic_4, traffic_5, traffic_6, traffic_7, traffic_8, traffic_9, traffic_10, traffic_11, and traffic_12.
4.2. Limitations
During the examination, the responsive_test technique found that the Mobile-Friendly Test Tool API created by Google considers non-responsive pages that have even one non-responsive element. Manual checks revealed that these specific websites partially adopt responsive techniques and have several elements in their source code that are non-responsive. These pages are marked with the number 0, which means that they do not follow that specific SEO technique. Further, in 17 out of the 243 websites, the speed measurements were performed manually with the Pingdom website speed test by Solar Winds, because the PageSpeed Insights API by Google could not operate a speed test on these pages.
The AMP and Sitemap SEO technique tests found that none of the websites applied these techniques, although they are suggested by Google on Webmaster Guidelines [
2]. Consequently,
t-test cannot be performed on these techniques, excluding them from our final results.
We collected the monthly organic traffic for 12 months to have a more representative view of the website traffic. For the data analysis that follows, we calculated the mean value of 12 months of organic traffic for each website and saved it in a new column, called Web Traffic. All the following comparisons regarding web traffic refer to the mean value of organic traffic for each website.
Raw data collected from multiple websites do not convey any significant trends or the behavior of the individuals before the corresponding analysis. Data analysis refers to the process of converting raw data into meaningful information, using mathematical, statistical, or computational algorithms for better comprehension [
57]. For the quantitative data analysis, some major steps need to be considered to firmly execute the assessment and generate the intended results. The procedure consists of two major steps: (1) reviewing the data by descriptive analysis and (2) conducting inferential and descriptive statistics to answer the research questions [
58]. Τhe study is presented in the following sections of the chapter and each section is intended to answer the research questions, as the analysis must be aligned with the research objectives.
4.3. Descriptive Statistics
Descriptive analysis helps to describe, demonstrate, or summarize the collected data in a constructive manner so that the trends and patterns can be easily observed and analyzed [
59]. Mean, median, mode, standard deviation, skewness, and kurtosis are some of the important measures.
Table 2 indicates that the maximum domain authority, speed test, keywords, and backlinks in this study are 39,833,333.33, 88, 17.67, 2,272,818, and 117,837,438, respectively. According to Tabachnick, Fidell, and Ullman 2017, the values of skewness or kurtosis within −1.5 and +1.5 is considered right-skewed distribution of the data [
60].
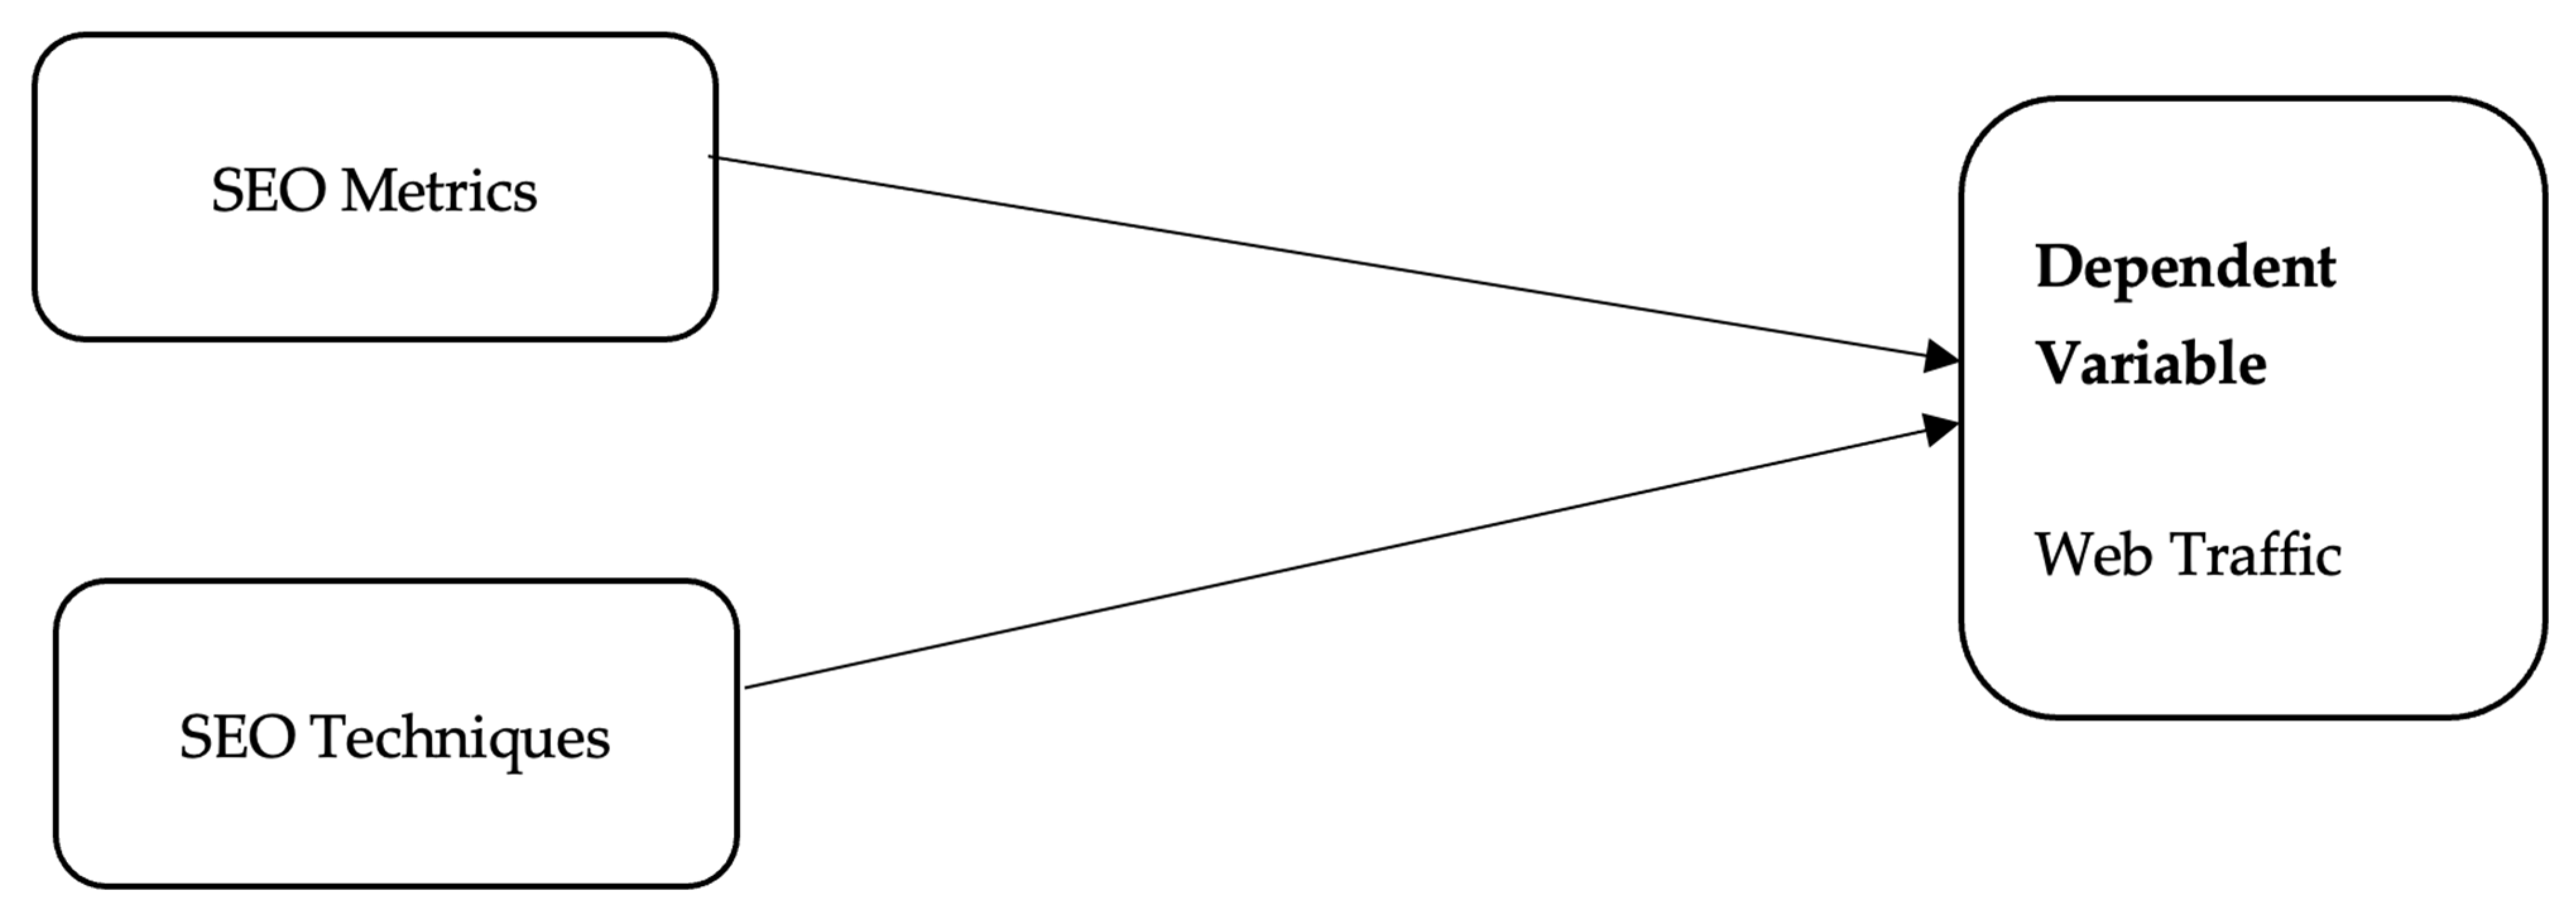
4.4. Inferential Statistics
Inferential statistics refers to the procedure of using data analysis to infer attributes of an underlying distribution of probability. Inferential statistics deals with the information acquired from the sample of the population to draw conclusive statements about the entire population [
61]. Inferential statistics make use of statistical models to compare the sample data to that of earlier studies. It varies from descriptive statistics in that it allows one to draw conclusions based on extrapolations rather than merely reporting the data that have been seen, like descriptive statistics does [
62]. The theoretical framework of this study is given in
Figure 3.
4.4.1. Impact of Group: SEO Techniques on Web Traffic
At this point, 15 different
t-tests were performed for each of the 15 SEO techniques: Group 2 using SPSS 27 by IBM software. After, the
t-test mean values were observed. The mean value is equal to the sum of all the values in the dataset divided by the total number of values. The “YES” mean reflects the average web traffic from the websites that applied the technique. The “NO” mean reflects the average web traffic from the websites that did not apply the technique. If the “YES” mean is greater than the “NO” mean, the websites that implemented this technique in their source code have greater traffic and the technique is valuable for the website. Another component to consider when comparing Yes or No is the
p-value. In statistics, the
p-value is the probability of obtaining results at least as extreme as the observed results of a statistical hypothesis test, assuming that the null hypothesis is correct. The
p-value is used as an alternative to rejection points to provide the smallest level of significance at which the null hypothesis would be rejected. A smaller
p-value means that there is stronger evidence in favor of the alternative hypothesis [
63]. A
p-value less than 0.05 (typically ≤ 0.05) is statistically significant. A
p-value higher than 0.05 (>0.05) is not statistically significant and indicates strong evidence for the null hypothesis [
64]. The results from 2 of 15
t-tests are presented in detail below and the rest are presented briefly in
Table 3 for the sake of brevity.
Impact of meta description technique on the web traffic
H0: There is no difference in website traffic due to the meta description technique (null hypothesis).
H1: There is a difference in website traffic due to the meta description technique.
In this study, independent samples
t-test is applied to make a comparison of the mean web traffic between websites that implement the meta description technique (
n = 169) and websites that do not implement the meta description technique (
n = 74). The
t-test was statistically significant, as the mean web traffic of meta-description-technique-implemented websites (M = 1,268,843, SD = 4,712,815) was higher than the meta description technique non-implemented websites (M = 559,083, SD = 1,682,786), t = −0.260,
p < 0.05, two-tailed. Therefore, the null hypothesis H0 that there is no difference in website traffic due to the meta description technique can be rejected. Consequently, it can be concluded that websites that implement a meta description technique have greater traffic and, by extension, this technique is valuable for the websites (
Table 3).
Impact of image alt technique on web traffic
H0: There is no difference in website traffic due to the image alt technique (null hypothesis).
H1: There is a difference in website traffic due to the image alt technique.
In this study, independent samples
t-test is applied to make a comparison of the mean web traffic between websites that implement image alt technique (
n = 56) and websites that did not implement the image alt technique (
n = 187). The
t-test was not statistically significant since the
p-value is higher than 0.05 and the mean web traffic of image-alt-technique-implemented websites (M = 1,156,760, SD = 4,532,209) was not significantly lower than the image alt technique non-implemented websites (M = 705,223, SD = 1,564,573), t = 0.732,
p > 0.05, two-tailed. Therefore, the null hypothesis H0 that there is no difference in website traffic due to the image alt technique cannot be rejected (
Table 4).
Table 5 presents the 15
t-tests performed for the 15 corresponding SEO techniques. In the last column of
Table 5, SEO techniques that resulted in a positive impact on the traffic are marked as 1, while the techniques that did not have a significant contribution to the traffic are marked as 0.
4.4.2. Impact of Group: SEO Metrics on the Web Traffic
Regression is a statistical technique to formulate the model and analyze the relationship between the dependent and independent variables. It aims to study the degree of relationship between two or more variables. This is achieved with the help of hypothesis testing.
In this part of our research, three different tests (one-way analysis of variance (ANOVA), coefficients, and scatterplots) were performed for each of the four metrics: Group 1 using the SPSS 27 by IBM software. The analysis is intended to determine the relationship between metrics and web traffic.
The one-way ANOVA is used to determine whether there are any statistically significant differences between the means of two or more independent (unrelated) groups or not. Unstandardized coefficients indicate how much the dependent variable varies with an independent variable when all other independent variables are held constant. A simple scatterplot can be used to (a) determine whether a relationship is linear, (b) detect outliers, and (c) graphically present a relationship between two continuous variables [
65].
The null and alternate hypotheses remain the same as the techniques.
The model summary table reports the strength of the relationship between the model and the dependent variable (
Table 6).
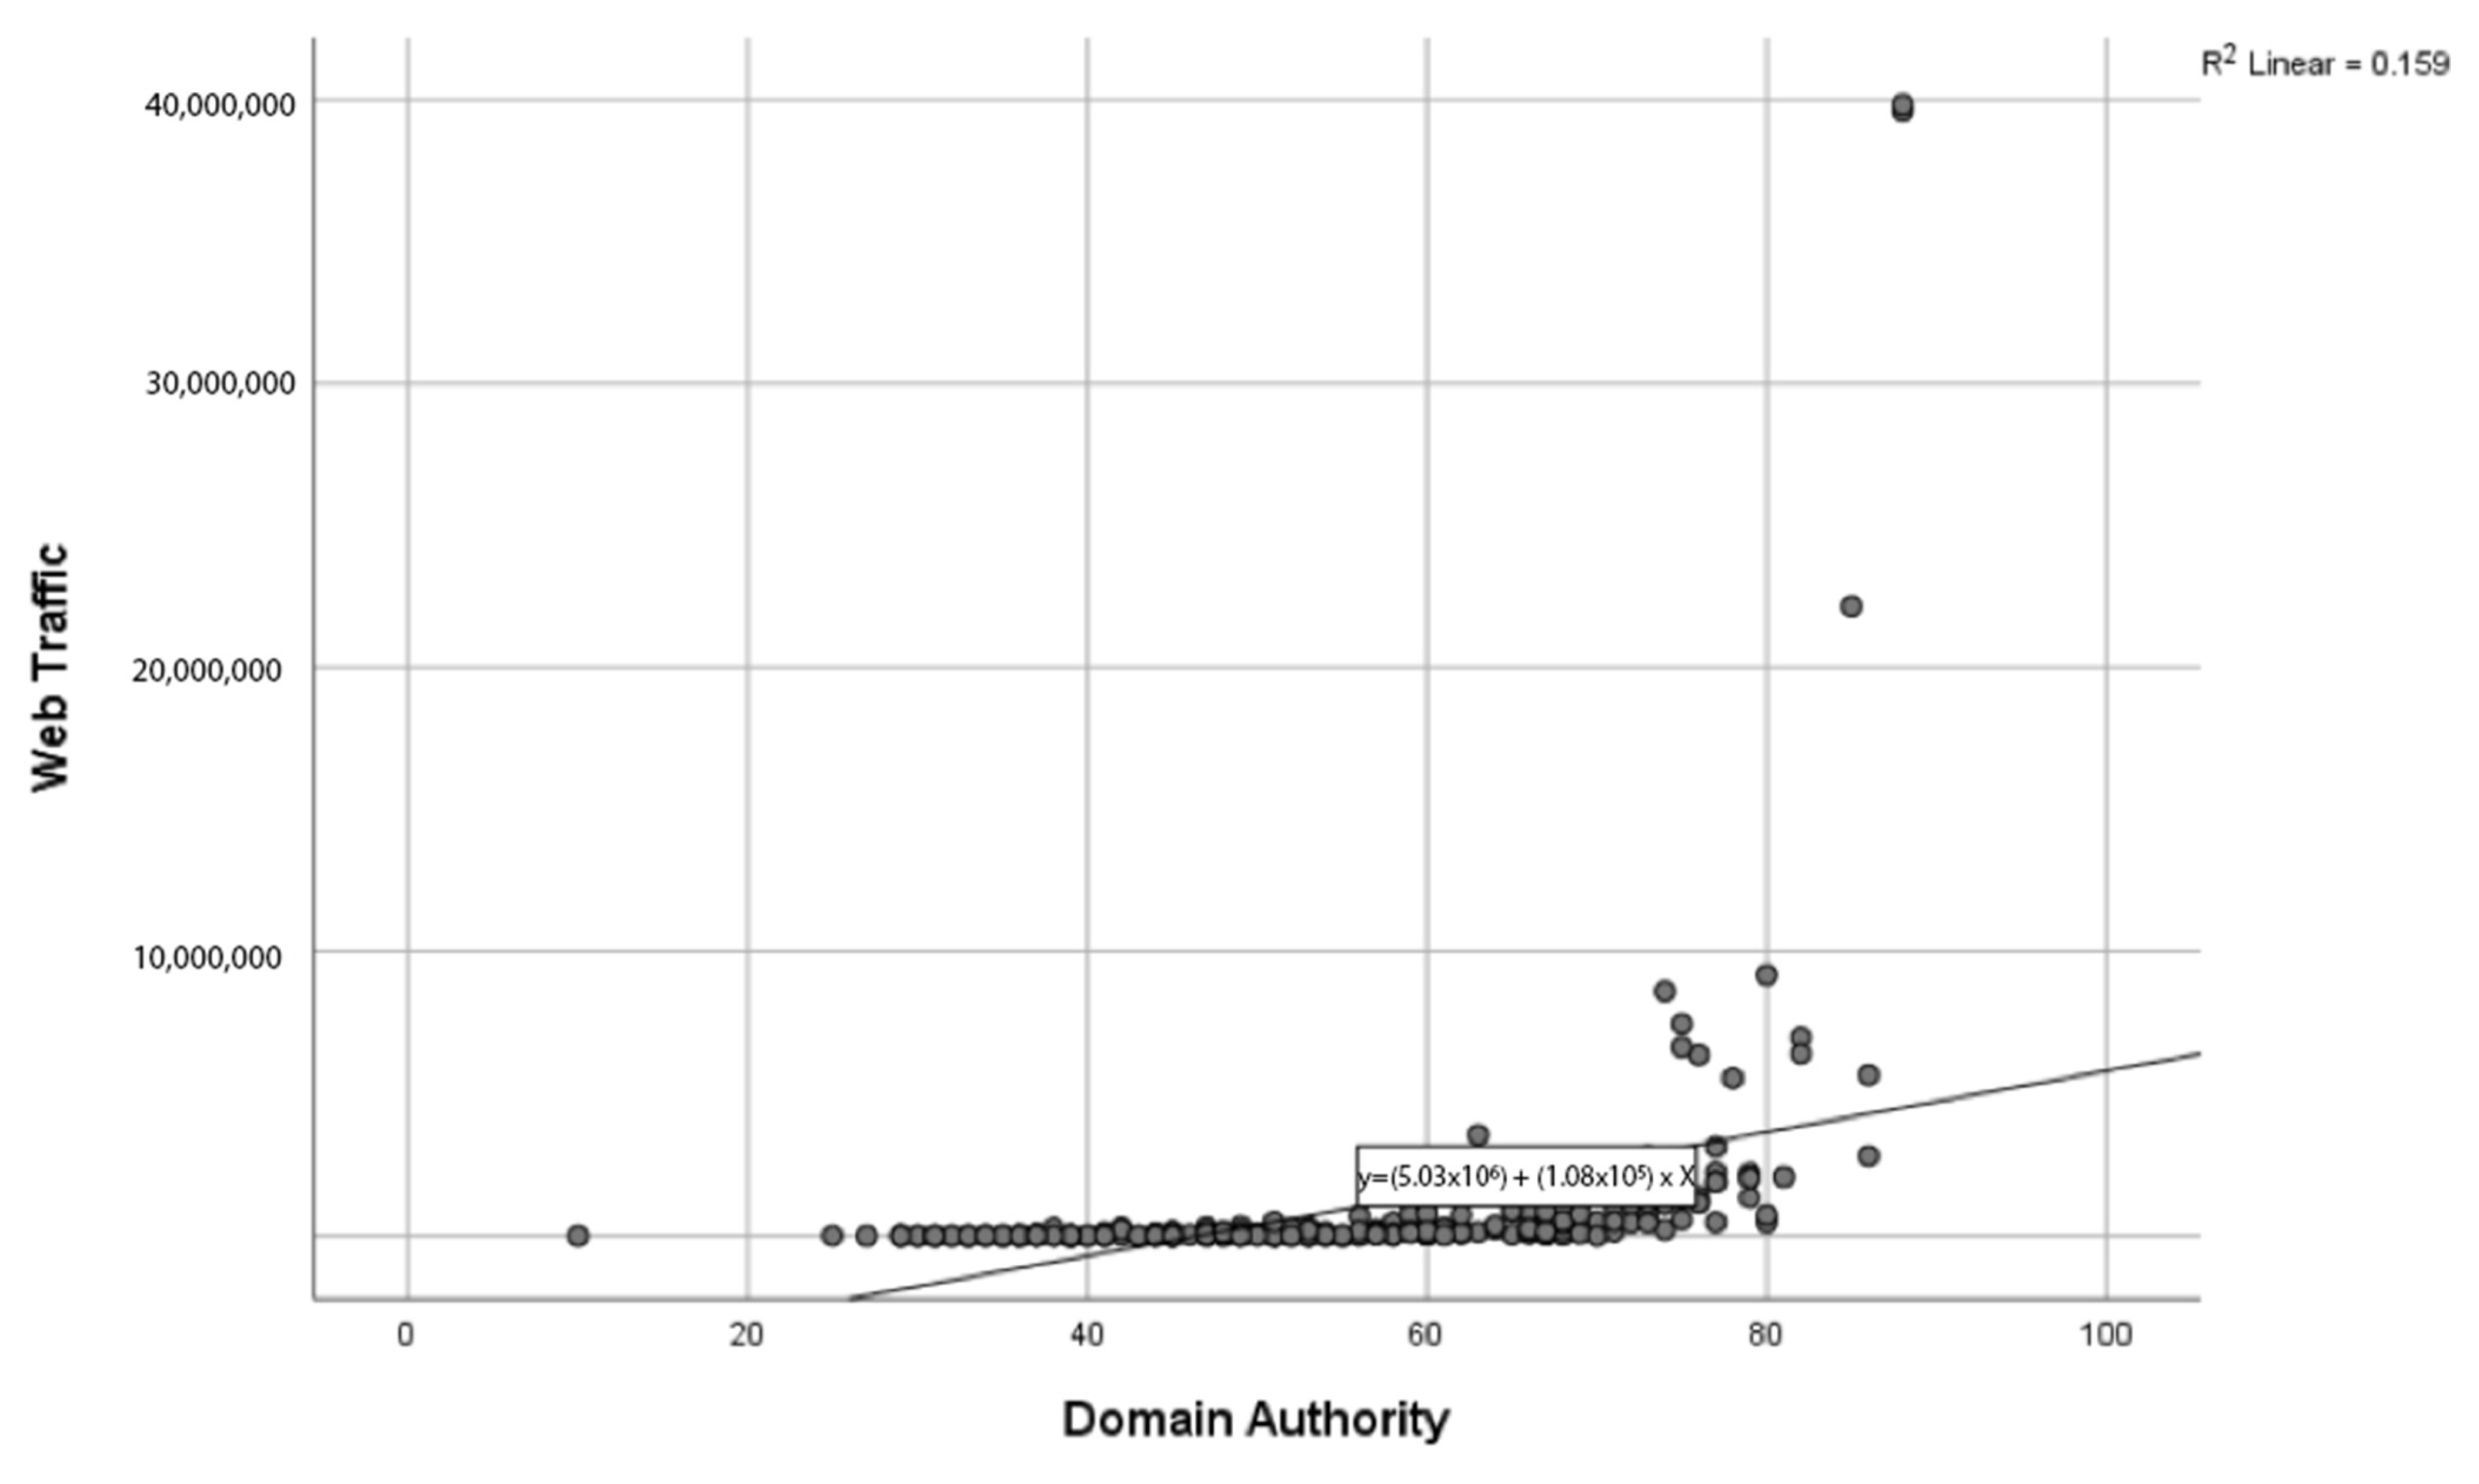
Domain Authority: The regression model summary is explained by 15.9% variability in the web traffic, R2 = 0.159, adjusted R2 = 0.155.
Keywords: The regression model summary is explained by 65.2% variability in the web traffic, R2 = 0.652, adjusted R2 = 0.650.
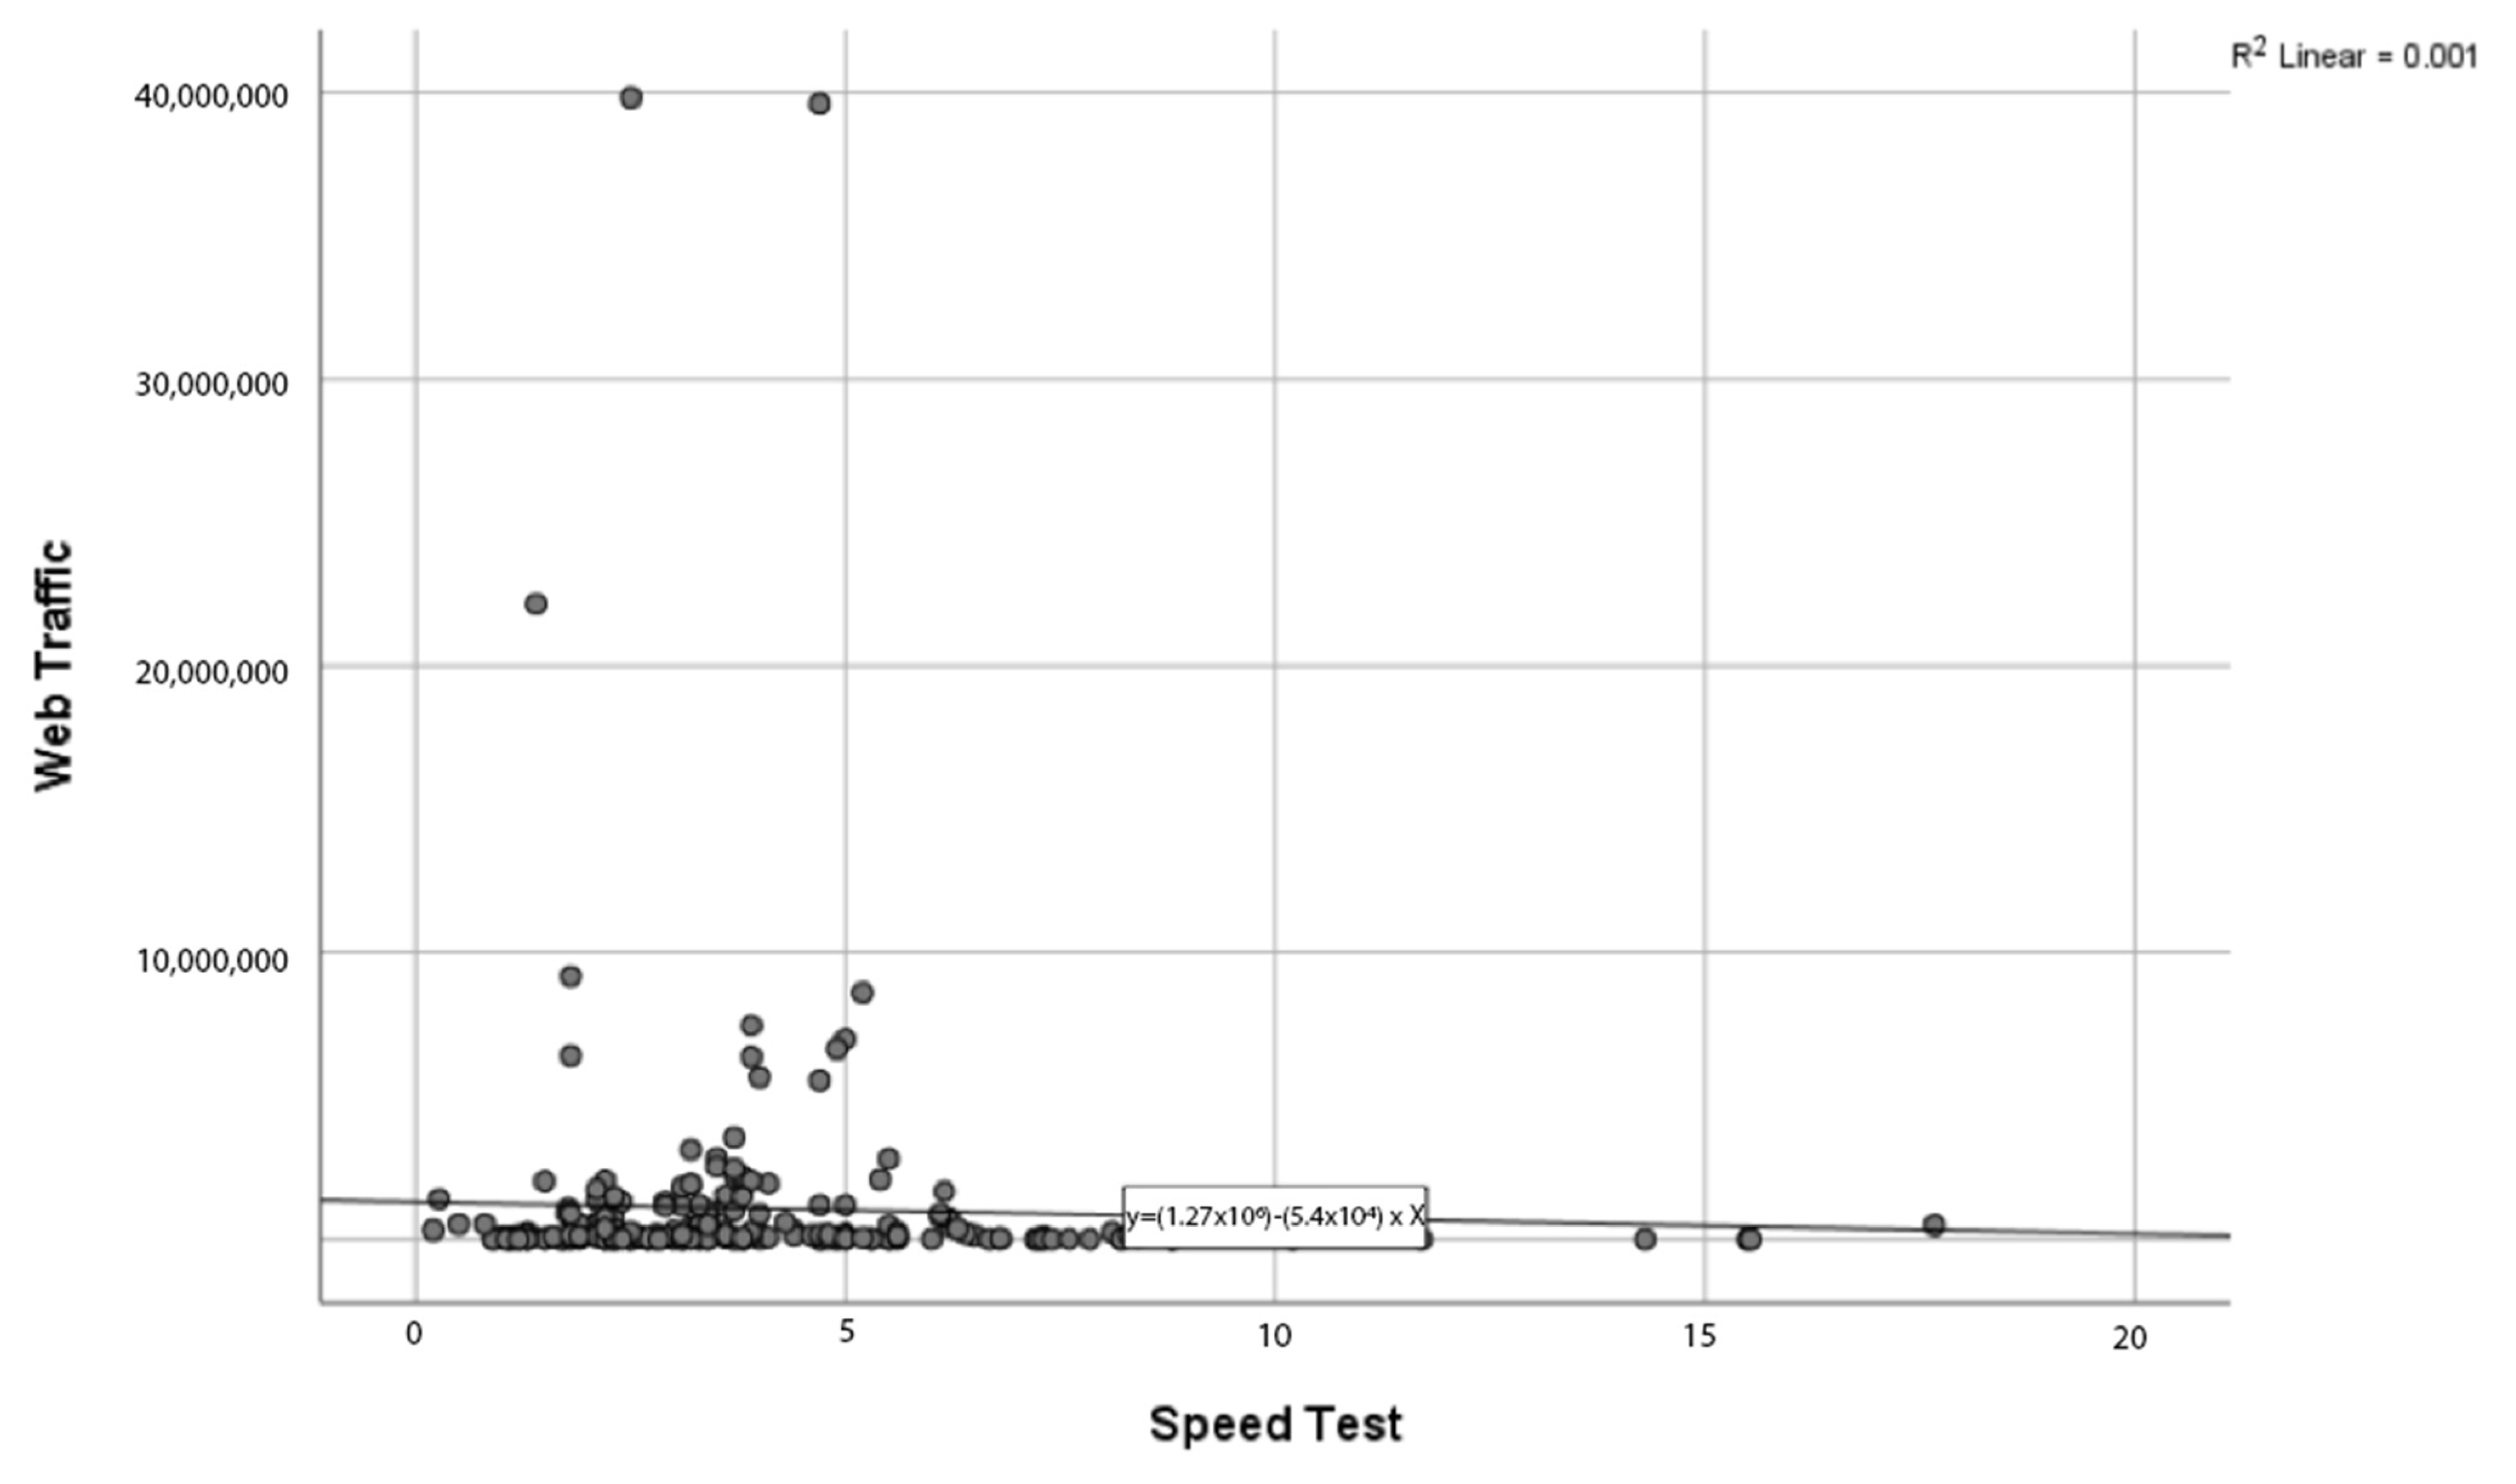
Website Speed: The regression model summary is explained by only 0.1% variability in the web traffic, R2 = 0.001, adjusted R2 = −0.003.
Backlinks: The regression model summary is explained by 86.9% variability in the web traffic, R2 = 0.869, adjusted R2 = 0.869.
The ANOVA table represents the overall significance of the model, which is determined by the web traffic (
Table 7). The F ratio is the ratio of two mean square values. Degrees of freedom (df) of error was calculated by total sample (
n = 243)—2 = 241 and total degrees of freedom (df) was calculated by total sample (
n = 243)—1 = 242.
Domain Authority: The result shows F (1, 241) = 45.524, p < 0.05, which suggests the model is highly significant. Therefore, the independent variable in this model is related to the dependent variable.
Keywords: The result shows F (1, 241) = 450.989, p < 0.05, which suggests the model is highly significant. Therefore, the independent variable in this is related to the dependent variable.
Website Speed: The result shows F (1, 239) = 0.277, p > 0.05, which suggests the model is not statistically significant. Therefore, the independent variable in this is not related to the dependent variable.
Backlinks: The result shows F (1, 241) = 1604.989, p < 0.05, which suggests the model is highly significant. Therefore, the independent variable in this model is related to the dependent variable.
The coefficient table represents how much the dependent variable is expected to increase when that independent variable increases by one, holding all the other independent variables constant [
66] (
Table 8). When interpreting the coefficient table, the B variable is important, representing the increase in the dependent variable as soon as the independent increases by one unit. On the other hand, the Beta variable compares the strength of the effect of each individual independent variable to the dependent variable. The higher the value of the beta coefficient, the stronger the effect, based on absolute numbers [
67].
Domain authority: When the beta value of domain authority is increased by one unit, web traffic will have increased by 108,135 visitors per month. Therefore, domain authority does not have a positive impact on the web traffic; thus, the null hypothesis is rejected. It can be concluded that the domain authority scores have a significant positive effect on the web traffic.
Keywords: When the beta value of keywords is increased by one unit, the web traffic will have increased by 10.24 visitors per month. Therefore, keywords do not have a positive impact on the web traffic; thus, the null hypothesis is rejected. It can be concluded that the keywords have a significant positive effect on the web traffic.
Website speed: Since the p value of the following table is greater than 0.05, the impact of speed is not statistically significant. Therefore, the null hypothesis that speed test does not have positive impact on the web traffic is rejected.
Backlinks: When the beta value of backlinks is increased by one unit, the web traffic will have increased by 0.399 visitors per month. Therefore, backlinks do not have a positive impact on the web traffic; thus, the null hypothesis is rejected. It can be concluded that the backlinks have a significant positive effect on the web traffic.
Scatterplots are essential for identifying trends and patterns. In a scatterplot, each observation (or point) has two coordinates [
68]. The strength of the link between the variables is determined by calculating the correlation coefficient. The plot shows the first variable’s value on the
x-axis and the second variable’s value on the
y-axis for each data point [
69]. The relationship between two quantitative variables is shown in a scatter plot (
Figure 4,
Figure 5,
Figure 6 and
Figure 7).
Domain Authority: The following graph indicates the coordinates of domain authority and web traffic. The web traffic has been gradually increased because of the increase in DA scores, indicating a linear relationship between domain authority and the web traffic.
Keywords: The following graph indicates that the more keywords used on a website, the more traffic it will get. Therefore, there is a strong positive linear relationship between keywords and web traffic.
Website speed: The following shows the relationship between speed test and web traffic. It shows that an increase in speed test does not result in a proportional increase or decrease in web traffic. Therefore, there is a constant and nonlinear relationship between these two variables.
Backlinks: Like keywords, the following graph indicates that the more backlinks used on a website, the more traffic it will get. Therefore, it can be concluded that there is a strong positive linear relationship between keywords and web traffic.
We used exactly the same data analysis methodology as the SEO metrics to identify the correlation between backlinks and domain authority. The findings of the regression model found that backlinks have a strong connection with domain authority. When the beta value of backlinks is increased by one unit, on average, the domain authority will have increased by 6.004 units.
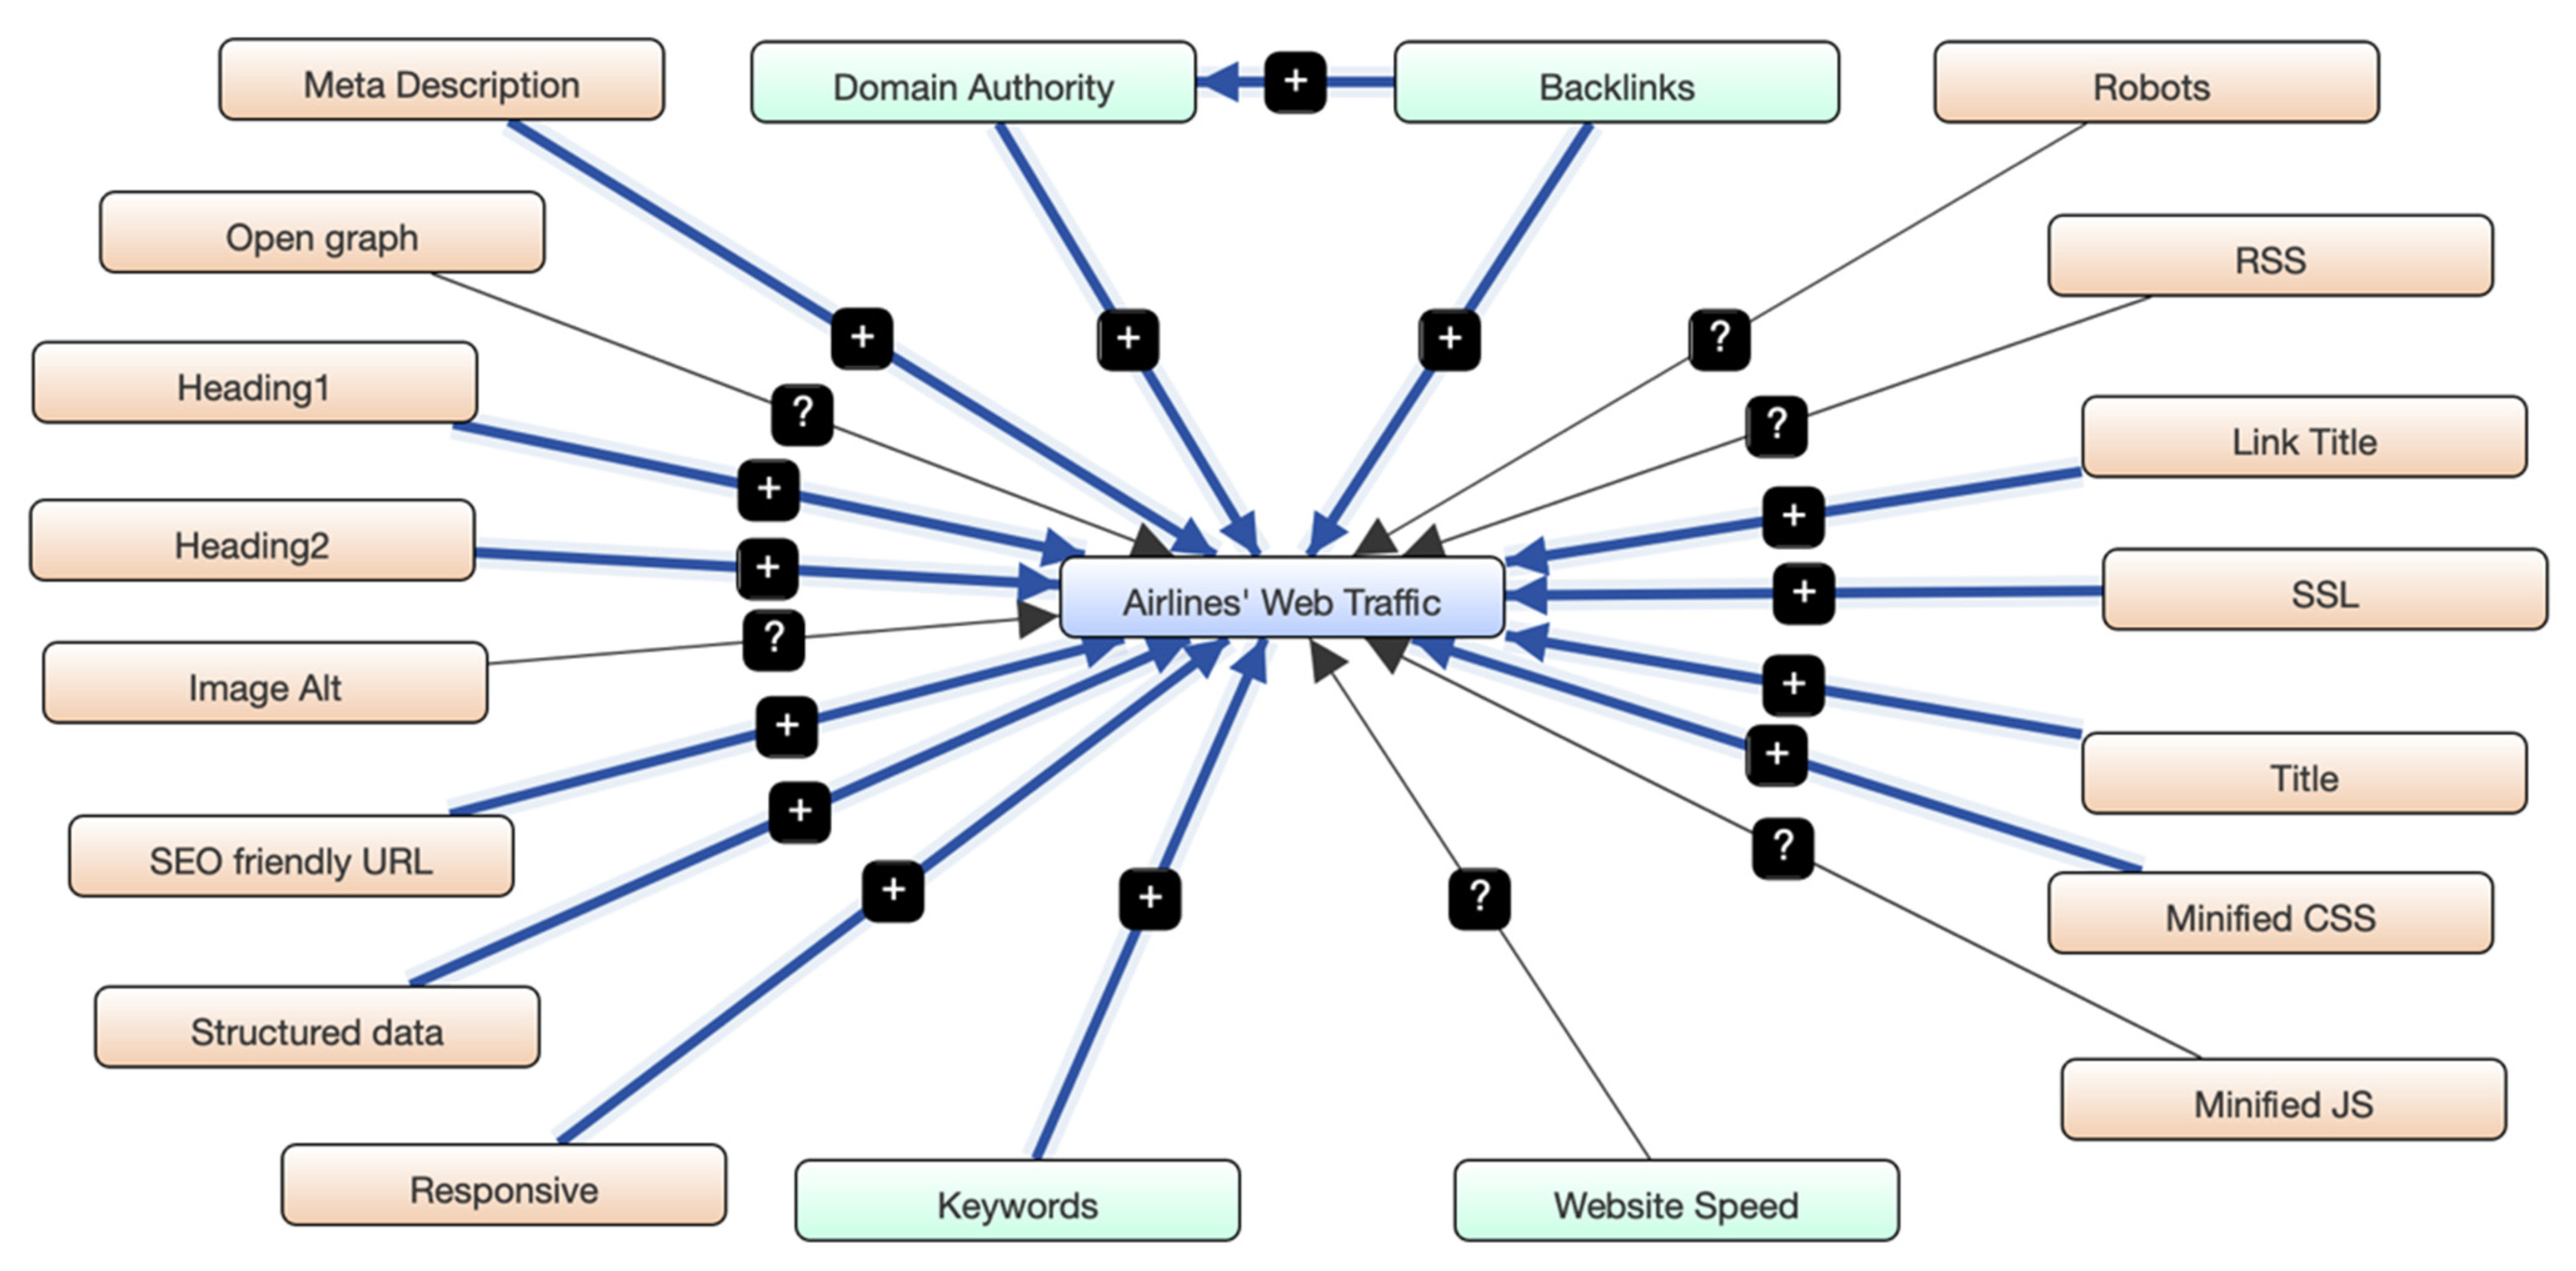
4.5. Diagnostic Exploratory Model Development
Results of the
t-tests on SEO techniques and ANOVA, coefficients, and scatterplots on SEO metrics present significant relationships with the Web traffic. Thus, we aim to provide additional insights to marketing strategists over the impact of SEO techniques and metrics usage on airline websites, in favor of their digital marketing strategy. Therefore, we deployed fuzzy cognitive mapping (FCM), which will implement selected web metrics from both SEO techniques and metrics depicting the relationships to Web metrics, so as to obtain a more adaptive model for process assessment. Fuzzy cognitive mapping deploys a descriptive and consolidated stochastic classification methodology, mainly used to represent the correlations between airlines’ web metrics [
70]. We use the orange color to mark the SEO techniques, green color to mark the SEO metrics, and blue color to mark the airlines’ Web traffic. Blue arrows in
Figure 8 illustrate variables with positive relations with Web traffic and black arrows illustrate variables with neutral relations with Web traffic. Development of the FCM was conducted via the Mental Modeler cloud-based application [
71].
Fuzzy cognitive maps are fuzzy graph structures that represent causal reasoning. Exploratory modelling implementation is vital when digital marketing agencies need to make a decision or a digital marketing plan [
72].
As we notice in
Figure 8, most of the SEO techniques and metrics positively affect Web traffic. Some of them have a relationship with each other, such as Backlinks and DA.
5. Discussion
The main focus of this paper is the development of a precise methodology, containing pioneering context, aiming to provide useful insights concerning search engine optimization usage and its contribution to the development of airlines’ web traffic as well as airlines’ sustainability. Using our own-developed tool, we retrieve airlines’ data from IATA’s website. For each airline website (243 in total), we performed SEO checks evaluating SEO techniques implemented on their source code. At the same time, we used four SEO third-party APIs to collect data for each airline’s website, such as 12-month web traffic, domain authority, website’s speed, and organic keywords. The average domain authority of the airlines’ websites in our dataset is 56, the average loading speed is 10.5 s, and the average web traffic is 1,052,702 users per month.
We analyzed our data through descriptive analysis and t-tests to find out the contribution of each technique and metric to airlines’ web traffic.
Figure 9 presents the SEO techniques and airlines’ website adoption scores. It was noticed that the majority of the airlines’ websites implemented SEO techniques, such as SEO-friendly URLs by 99.59%, SSL certificates by 97.53%, title tag by 84.36%, and meta description by 69.55%. As mentioned earlier, the AMP and Sitemap SEO technique tests showed that none of the airlines’ websites applied these techniques, although they are suggested by Google on Webmaster Guidelines [
2].
Conducting descriptive regression analysis and
t-tests accordingly in
Section 4, we confirm the research hypotheses listed in
Section 3.3. Our study underlines that on-page SEO impacts airlines’ website traffic on a great scale. The same applies to off-page SEO, where we confirm that backlinks influence airlines’ web traffic. More specifically, when the beta value of backlinks increases by one unit, the web traffic will be increased by 0.399 units. From the organic keywords point of view, when the beta value of keywords increases by one unit, the airlines’ web traffic will be increased by 10.24 units, respectively. On the contrary, website speed seems not to have any impact on airlines’ web traffic, although mentioned as an important SEO factor in
Section 2.1.11. In addition, through our analysis, it was found that there is a strong connection between backlinks and domain authority.
Although each individual SEO technique cannot influence the rankings on its own, the appropriate combination of SEO techniques can lead to greater search results. Expanding this research, future research could focus on how the combination of specific SEO techniques, creating potential groups, can affect the corresponding ranking in search results.
6. Conclusions
COVID-19-era travel restrictions have led airline firms to adopt new digital marketing strategies to survive against their rising competition. Most airlines invested in search engine optimization to increase their websites’ rankings on SERPs and, by extension, increase their organic traffic. This study undertakes to uncover the SEO strategies airline websites follow. Using our own-developed tool, we scan each website’s source code, mining the corresponding SEO techniques used by airlines. At the same time, we use four third-party APIs to collect valuable time-accurate data, such as domain authority, organic keywords, backlinks, and 12-month period web traffic. Meanwhile, through our data analysis, we end up with the most-adopted SEO techniques and how each one of them can affect airlines’ websites’ traffic. We conclude that SEO techniques and metrics have a great correlation with web traffic, which, in turn, increase airlines’ conversions and bookings. Our research identifies the SEO techniques that are most widely used, assuming that to be applied by large companies, such as airlines, they can also deliver results on smaller websites.


