Article

Optimal Reconfiguration of Distribution Network Considering Stochastic Wind Energy and Load Variation Using Hybrid SAMPSO Optimization Method

1
Department of Electrical Engineering, National Engineering School of Sfax, University of Sfax, Sfax 3036, Tunisia
2
Department of Electrical Engineering, College of Engineering, University of Ha’il, Ha’il 2240, Saudi Arabia
*
Author to whom correspondence should be addressed.
Sustainability 2022, 14(18), 11208; https://doi.org/10.3390/su141811208
Submission received: 31 July 2022 / Revised: 2 September 2022 / Accepted: 2 September 2022 / Published: 7 September 2022

Abstract

:
Due to the stochastic characteristics of wind power generation and following varying demands for load consumption over a planning period, the optimal reconfiguration (OR) of the radial distribution network (RDN) represents a complex problem of a combinatorial nature. This paper evaluates two types of optimal reconfiguration searching for an optimal solution and considering time-varying changes. The first one is a static reconfiguration of RDN (SRRDN) made at a fixed load consumption point and during constant generated renewable power integration. The second one is a dynamic reconfiguration of RDN (DRRDN) made following a stochastic integration of wind energy (WTDG) and/or variation in load demand characteristics. In total, five scenarios are investigated in order to evaluate optimal reconfiguration of RDN (ORRDN) with the aim of reducing total active power losses (TAPL), improving the voltage profile (VP), and minimizing switches’ change costs (SCC). To deal with this, a hybrid optimization technique (SAMPSO) combining the simulated annealing algorithm (SA) with a modified particle swarm optimization (MPSO) is undertaken. This hybrid method coupled with the MATPOWER toolbox is tested on the standard IEEE 69-bus RDN through both SRRDN and DRRDN. The results show the effectiveness of this improved reconfiguration procedure for enhancing the test system performance. A comparison between the proposed optimization method and previous findings’ methods is undertaken in this work. The obtained results proved the superiority and effectiveness of the SAMPSO method in solving the SRRDN and DRRDN problems.

1. Introduction

The distribution network (DN) is one of the main components of the electric power delivery chain. The main role of a DN is to distribute electrical energy from high voltage substations to the end customers by adjusting the voltage level if it is necessary [1]. Due to the customers’ requirements, distribution system operators have faced various technical challenges. In fact, to meet power users’ demands, power quality, system stability, reliability level, load balance, and radial DN structure must be guaranteed [1]. Add to that, DNs are usually operated radially to reduce operation costs and facilitate the coordination of protections in a unidirectional power flow (PF) [2,3]. However, most of the real power losses in power networks are caused by current flow in radial DNs [1]. Technically, real power losses could lead to the deterioration of the voltage profile in power networks.
To ameliorate the quality and efficiency of supply, improve the system characteristics, reduce power loss, and improve the voltage profile, numerous tools and procedures have been presented and applied by researchers [4,5]. For instance, a multistage-based tool for distribution system expansion planning addressing the independent distribution system operator and nonutility-owned distributed generation (DG) has been presented in [6]. This planning has been formulated using mixed integer programming and solved using a Benders decomposition-based approach. An analytical approach investigating the optimal placement of renewable DG units in DNs has been developed in [7] where the operating cost and system loss have been considered. In other works, such as [8,9], the optimal reconfiguration of the DN has been adopted for the minimization of operating costs, power losses, and voltage drops.
The incorporation of DGs in electrical systems has demonstrated that is flexible and can be directly injected into the DN. These renewable DG units provide inexhaustible green power extracted from nearby energy sources such as solar cells (PV) or concentrators and wind turbines (WT).
When we look for a low-cost method, we found that the reconfiguration of the DN is the best. This methodology consists of finding a new topology by opening and closing switches, keeping the radiality of DN. The optimal reconfiguration of the radial distribution network (ORRDN) consists of finding the optimal topology of the DN by using optimization techniques proposed in the literature in such a way that the losses are reduced, voltage and current limits are not violated, all loads are connected, and the radial structure is maintained [10,11]. The integration of optimization techniques can give faster convergence characteristics while searching for the optimal solution for the ORRDN problem.
As the wind power and load characteristic of the distribution system varies over time, the optimal configuration of the RDN also changes from one state to another. Indeed, the ORRDN can be divided into a static reconfiguration (SR) and dynamic reconfiguration (DR).
In fact, the static reconfiguration of the radial distributed network (SRRDN) is to optimize the RDN structure at a fixed load consumption point and during constant generated renewable power integration. The optimal topology obtained following the SRRDN presents a sub-optimal solution [12].
Moreover, the dynamic reconfiguration of the radial distributed network (DRRDN) is to optimize the network structures in real-time and during the operation of the RDN. The optimization technique is made following the stochastic integration of renewable energy and/or variation in load demand characteristics.
The research on DR is a more practical approach. It is about the improvement of the optimal algorithm used to make the methodology more efficient and the optimization results more accurate. So, the obtained configuration presents an optimal solution reaching the global optimum.
The problem of the ORRDN has been studied by many other researchers from various aspects, including the reconfiguration techniques, the type of objective function (mono-objective/multi-objective), the optimization algorithms (heuristic/metaheuristic), the type of reconfiguration (static/dynamic), the network characteristics (balanced/unbalanced), and the quality of several integrations (constant/stochastic).
In [13], the authors have proposed a branch exchange methodology to find the optimal configuration of the DN with the aim of reducing loss and improving load balancing. With the same objective of minimizing losses and improving load balancing, the authors in [14] have used the runner root algorithm to overcome the multi-objective OR problem.
In [15], a time interval loss index (TILI) has been proposed to evaluate the TAPL performances of the tested DN after achieving the proposed reconfiguration based on a comprehensive analysis of operation scenarios over a long-term operating period.
With the aim of TAPL reduction and also enhancing the voltage quality following a DN reconfiguration, the authors in [16] applied a chaotic stochastic fractal search algorithm (CSFSA).
In [17], the problem of optimal allocation and sizing of DGs in the DN has been solved by means of an EO algorithm by considering a mono-objective function. This same new promising algorithm has been proposed in [18] for overcoming the problem of the ORRDN but now by considering multi-objective fitness functions such as minimizing TAPL, maintaining bus voltages at expected values, and enhancing some reliability indices.
The main novelty of the approach presented in [19] has been the inclusion of a path relinking phase in order to accelerate the convergence characteristics of the ORRDN problem. In that work, an improved harmony search (IHS) algorithm was implemented to find the optimal topology of the DN.
In [20], the authors applied a matrix shifting and an interval merger based on the DR method on three test RDNs to achieve the optimal solution characterized by the best line loss reduction with an acceptable computational cost.
A moth–flame optimization methodology was mentioned in [21] to solve the ORRDN problem considering power losses and network reliability. With the same aim of reducing power losses, improved selective BPSO and GA-based methods have been proposed, respectively, in [22,23], to overcome the reconfiguration problem of the balanced network.
To take into account the effect of embedding DGs in the DN when applying an ORRDN, an adaptive cuckoo search algorithm, GA, and an improved sine-cosine algorithm have been proposed in [24].
Authors in [25] have proposed a multi-objective reconfiguration procedure of balanced networks with the purpose of minimizing power losses and enhancing reliability considering demand response services.
In [26], a knee-point driven evolutionary algorithm along with the three-point estimation (KnEA-PE) method has been applied to three tested DNs to overcome the ORRDN problem. So, the fitness function of this multi-objective optimization problem consists of minimizing both TAPL and the number of switching operations as well as maximizing the voltage stability margin.
The ORRDN methodology presented in reference [27] was essentially based on a fuzzy multi-criteria approach (FMCA) using a new improved corona-virus herd immunity optimizer algorithm (ICHIOA) and has been tested on an unbalanced DN. This technique has been simulated for both single and multi-objective optimization with a fitness function including TAPL minimization, voltage sag improvement, voltage magnitude, and no supplied energy minimization.
In [28], the authors presented the dynamic reconfiguration of a balanced network as a multi-objective minimization problem where the objective functions were power losses and switching costs.
The authors in [29] used the selective bat algorithm (SBAT) combined with the EPRI-Open DSS software to solve the DNR problem in consideration of balanced and unbalanced networks with different power levels.
In [30], an Ant lion optimizer was suggested to overcome the reconfiguration problem of the unbalanced network with the main goal of improving the power quality of the whole system.
From the literature review, it is found that optimal reconfiguration of RDN was converted into an optimization problem where system losses and/or improvement of the voltage profile have been considered objective functions. The originality of the present work compared with the aforementioned works lies in proposing not only a point-valued reconfiguration procedure, known by researchers as SRRDN, evaluated at a fixed load consumption point but also an interval-valued estimated procedure considering stochastic wind energy and load variation to demonstrate the usefulness of the DRRDN. Moreover, the methodology addressed in this study consists of alternating distribution network switches by evaluating five scenarios of incorporation between a constant integration of DG, a dynamic variation of the load consumption, and a stochastic integration of WTDG.
In the simulation, a metaheuristic optimization technique combining SA optimization with a modified PSO optimization was undertaken with the aim of reducing TAPL, improving VP, and even decreasing the SCC when it is subject to DR. The proposed hybrid method referred to as SAMPSO is coupled with the MATPOWER toolbox, software that is used for power flow calculation. The proposed strategy was tested on the standard IEEE 69-bus RDN where various scenarios are studied. The results found are then discussed to show the effectiveness of the ORRDN procedure when applied for the enhancement of the test system performance.

1.1. Paper Contribution and Motivation

The significant contributions of the proposed study include:
  • The resolution of both static and dynamic reconfiguration problems affecting the RDN by considering various scenarios, which are the SRRDN on a specific point of load consumption with and without DGs integration, the SRRDN over different load levels, the DRRDN following a stochastic variation in daily load consumption curve, and, finally, the DRRDN following the stochastic integration of WTDG and variation in daily load consumption curve.
  • A hybrid SAMPSO optimization method, combining the SA algorithm with the MPSO method, is proposed in this work to find the optimal configuration of the DN (global solution).
  • In order to quickly sort solutions, lead to notable improvements in the systems’ performance, and enhance network profitability, reliability, and feasibility under several conditions, the suggested metaheuristic optimization method is combined with an open-source MATLAB toolbox, called MATPOWER, for power flow calculation.
  • The suggested SAMPSO method is validated on the standard IEEE 69-bus RDN by satisfying technical objectives such as TAPL reduction and voltage profile improvement. The minimization of switching costs is also considered when applying the DRRDN.
  • The superiority of the SAMPSO method is demonstrated by comparing its results with other existing techniques.
  • Broadly speaking, this improved and tested optimization technique can be applied in other future works on the existing offshore ASHTART network of the Company for Study, Research and Exploitation of Petroleum in Tunisia, named SEREPT, with the aim to continue this research direction, to develop this promising remote region, and to apply the proposed technique in the real-world.

1.2. Paper Organization

The remainder of the paper is divided into four sections as follows. The first one, which is Section 2, provides a mathematical formulation of the optimal DN reconfiguration problem. The proposed hybrid SAMPSO optimization method is presented in Section 3. Section 4 reports and illustrates the simulation results obtained from the investigation of the five scenarios. Finally, Section 5 includes some concluding remarks.

2. Problem Formulation

2.1. Reconfiguration Technique

In this study, the ORRDN is based on the branch opening and closing technique with normally closed and normally open switches characterizing the RDN.
During the process of the OR and at each iteration, the verification of the radial structure is a primary task. So, this verification is done by identifying the loops created following the closing of all switches of the DN and by ensuring that only one switchable line segment is still open.
Figure 1 shows an example of the three-loop network [31]. The components of each loop are as follows.
  • Loop 1: {L2 L4 L5}
  • Loop 2: {L1 L3 L4}
  • Loop 3: {L5 L6 L7}

2.2. Objective Function, Premises, and Constraints

The ORRDN can be obtained through the minimization of TAPL and the improvement of VP. In this study, the objective function (OF) used for the optimal reconfiguration problem is expressed by Equation (1) [32].
FObjective = min (TAPL)
where
TAPL = X = 1 n b K X R X   ( P X 2 + Q X 2 V X 2   )
The OF is minimized subject to several constraints [33,34], as follows.
(i)
Voltage constraint:
V m i n V x V m a x
(ii)
The main bus voltage is 1 pu.
(iii)
Load flow constraint:
P x + P D G , x = P l o s s , x + P l o a d , x
(iv)
Network topological constraints which simultaneously take into account the radial structure of the DN and uninterrupted loads [35].
It is worth noting that the radial structure of the DN indicates that no loops are allowed in the networks, whilst uninterrupted loads mean that all loads must be connected to the network, so every bus should be connected via one path to the substation.
In addition to the presentation of the objective function and the various constraints, it is necessary to introduce some premises characterizing the studied problem, such as:
(i)
The load is modeled as a uniform constant power during the SR and as a stochastic power during the DR.
(ii)
The DG unit is connected to represent a PQ-type bus. Hence, it generates only active power and it is considered a negative power injection (same for the WTDG).
(iii)
Wind power injected into the RDN during the insertion of WTDG is produced from a doubly fed asynchronous machine (MADA).
It should be noted that the use of MADA in simulation studies is not arbitrary. Indeed, the choice of MADA is due to its significant advantages, such as better performance at variable wind speeds, easy maintenance, its ability to reduce the converter’s size up to 70%, and its suitable price. Moreover, the proposed ORRDN method is expected to be applied in future work on an existing ASHTART offshore network belonging to the society of study, research, and exploitation of petroleum in Tunisia, called SEREPT, where MADA-based wind turbines are already installed.
where,
X Bus number.
n b Total number of branches.
K X Switch state of outgoing branch of bus X, where 0 means open state and 1 means closed state.
R X Resistance of outgoing branch of bus X .
P X Active power flowing out from bus X .
Q X Reactive power flowing out from bus X .
P D G , x DG’s active and reactive powers into bus X .
P l o s s , x Active power losses in outgoing branch of bus X .
P l o a d , x Active load power in outgoing branch of bus X .
V X Voltage at bus X .
V m i n Minimum allowable voltage of VX    ( V m i n = 0.9   p u ) .
V m a x Maximum allowable voltage of VX ( V m a x = 1.05   p u ) .
I X Current of outgoing branch of bus X
I X m a x Maximum allowable current of I X .

2.3. Power Flow Calculation Procedure

The calculation of the power flow (PF), also called the calculation of the distribution of the load flow (LF), is one of the most used tools for the analysis, operation, and planning of the DN for a given state (static or dynamic state).
In this study, PF is calculated using the MATPOWER simulation toolbox implemented under MATLAB. MATPOWER was originally developed by Ray Zimmerman and his colleagues at Cornell University, under the direction of Robert Thomas, in 1997. This tool presents a powerful set of programming under MATLAB, ensuring the calculation of the PF and the determination of the optimal power flow (OPF) for a given simulation state. Thus, it can be applied while being combined with metaheuristic optimization tools in terms of validation of the OF of the DN [36]. The MATPOWER process is characterized by its flexibility during use and also when modifying the original code. The use of MATPOWER for solving both PF and OPF problems requires an adequate and correct implementation of the different case information of such a studied network [37]. The process of MATPOWER is presented in three steps, as shown in Figure 2.

3. Proposed Hybrid SAMPSO Optimization Method

3.1. Simulated Annealing Algorithm (SA)

In 1983, Kirkpatrick proposed a simulated annealing (SA) algorithm based on the analogy between annealing solids and the problem of solving a combinatorial optimization problem [38].
The process of SA consists of [39]:
(i)
Starting from a known fundamental state with particles of the solid arranged in a highly structured network with the minimum energy of the system;
(ii)
Heating the solid by increasing its temperature (T) in a heat bath until the solid melts into a liquid and obtains randomly arranged particles;
(iii)
Lowering its temperature slowly.
SA is a random search process characterized by the ability to solve large and complex combinatorial optimization problems.
It is the most popular algorithm for obtaining a single solution during a well-determined time. Indeed, its principle consists of starting from a stochastic initial solution and an iterated algorithm and trying to approach the global minimum of the OF without slipping into the local minima thanks to the acceptance probability function (APF) with approval or rejection of a newly updated solution.
Its resolution process includes [38]:
(i)
Initialization;
(ii)
Cooling rate;
(iii)
Upgrade;
(iv)
Probability of approval of the research procedure.
The major drawback of this optimization is that any configuration leading to an improvement in the OF is accepted. So, the result obtained following a Simulated Annealing optimization cannot be always optimal, and in this situation, we can mention a sub-optimal solution verifying the suggested OF but not leading to the best optimal solution.
Therefore, it is probably also a matter of accepting configurations corresponding to a worse OF with a high APF which decreases with temperature.
To conclude, it can be said that the solution obtained following a SA optimization method corresponds to a local solution instead of a global and optimal solution.

3.2. Modified Particle Swarm Optimization (MPSO)

In 1995, James Kennedy and Russell C. Eberhart invented a new optimization algorithm called the particle swarm optimization (PSO) technique which was mainly based on the simulation of the psychosocial expression of birds and fish [40]. Indeed, the concept of PSO was originally a simulation of a simplified social system and has proven to be robust in solving linear and other non-linear problems [41]. In addition, PSO is the system’s model of the social structure of similar basic creatures that come together to form a group with a common goal, such as foraging.
In this context, it is essential to obtain the best part of the population (optimal solution) for a group with the same activity (OF).
The principle of PSO is very simple; it consists of a group (swarm) of individuals (particles) moving in space and searching for the best solution (global optimum). Its basic concept is to accelerate each particle towards its Pbest and Gbest locations, with a random weighted acceleration at each time step [42,43].
To better reach an optimal solution, a modified PSO (MPSO) methodology is proposed in this study. MPSO offers a new sigmoid function capable of increasing the control of the particle update rate and improving the convergence characteristic. The main advantages of MPSO are:
(i)
The use of the sigmoid function in the control of the rate of variation of the particles to obtain perfect solutions.
(ii)
The exploitation of all the search space to discover the best solution as quickly as possible.
(iii)
The use of a better method to improve the convergence of the population and reduce the number of possible iterations.
To solve the ORRDN by using MPSO optimization, the following equations should be implemented:
w k = w m a x w m a x w m i n k m a x   k
v i j k + 1 = w k v i j k + c 1 r 1 ( P b e s t i x i j k ) + c 2 r 2 ( G b e s t x i j k )
x i j k + 1 = S i j = l o o p ( c e i l ( s i g ( v i j k + 1 ) , j )
s i g ( v i j k + 1 ) = l e n g t h   ( n o n   z e r o ( l o o p j ) ) 1 + e v i j k + 1
where:
w k Inertia weight factor ( w k 0).
KCurrent iteration number.
c 1 , c 2 Acceleration coefficients ( c 1 0   and   c 2 0).
r 1   , r 2 Random numbers within the range [0, 1].
v i j k Velocity of particle in the search space at iteration k.
x i j k Current position of particle i in the search space at iteration k.
w m i n , w m a x Minimum and maximum inertia factor weights.
k m a x Maximum number of iterations.

3.3. A Hybrid SAMPSO Algorithm Combined with the MATPOWER Toolbox

To obtain the most optimal solution for the RDN reconfiguration problem, a hybrid algorithm called SAMPSO is proposed in this work. The suggested methodology is to combine the SA algorithm with the modified PSO optimization for faster, optimal, and better optimization.
Indeed, SAMPSO uses controlled probability in SA to avoid local minima and accepts all solutions found at high temperatures, and audits accepted solutions at low temperatures. This procedure is no longer done in a randomized way, on the contrary, it is organized in a very orderly manner. For this, the use of the sigmoid function to characterize the modified PSO technique is essential.
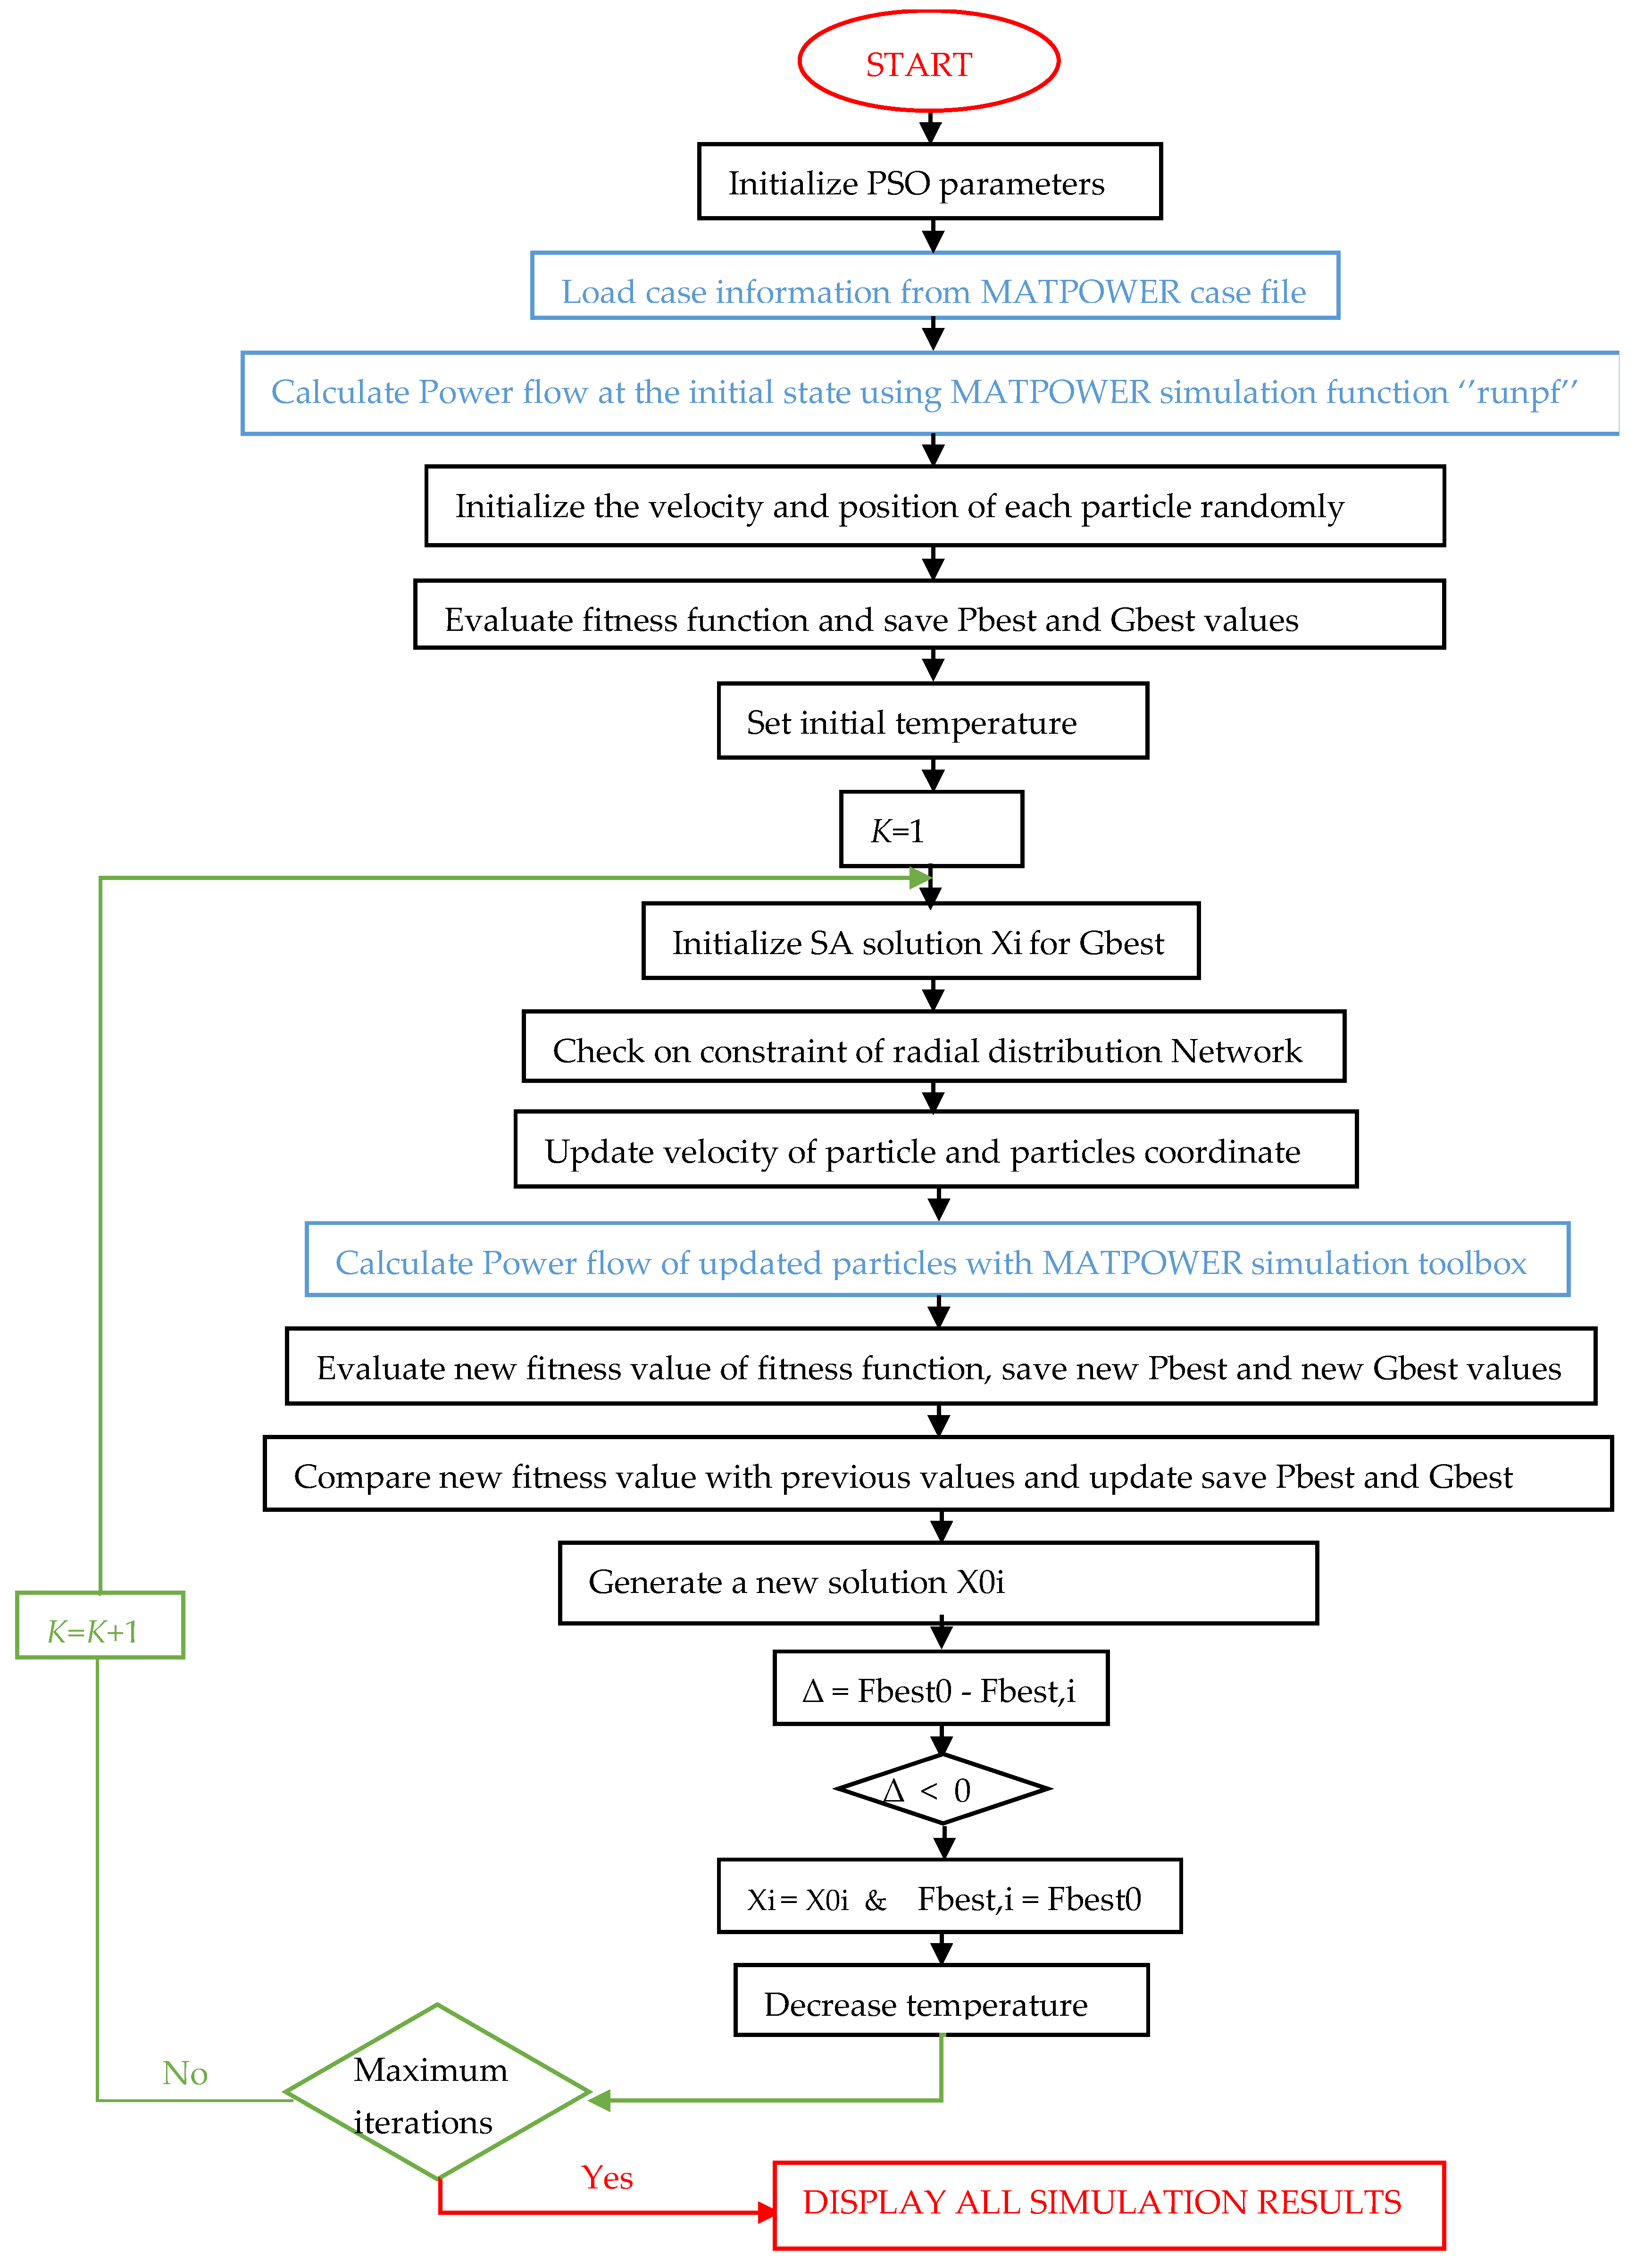
The detailed approach based on the SAMPSO algorithm combined with the MATPOWER toolbox to solve the problem of the ORRDN to achieve the OF of the studied cases is depicted in the following steps.
Step 1.
Load case information: the system data, generator data, bus data, and branch data, are saved in a MATPOWER case file.
Step 2.
Calculate voltages at each node and total power loss in the distribution network at the initial state using the MATPOWER toolbox.
Step 3.
Initialize the temperature parameter Tmax.
Step 4.
Set a temperature change counter n = 0 and a repetition counter K at each temperature value.
Step 5.
Generate a random configuration, Xi, for the search space, S.
Step 6.
Check the radial configuration of the distributed network.
Step 7.
Initialize the Swarm parameters: define the bounds of the velocity, Vbmax and Vbmin, specify the inertial weight, w, and the values of the acceleration coefficients, c1 and c2, and assign the initial position Xi = [xi1, xi2, …, xin] and velocity Vbi = [vbi1, vbi2, …, vbin] randomly.
Step 8.
Compute the fitness function for each particle, f(X0i).
Step 9.
Find fitness value of fitness function, Fbest0=min(f(X0i)).
Step 10.
Update the weight coefficient, velocity, and position of the particle using Equations (5)–(7), respectively.
Step 11.
Calculate PF for an updated particle with the MATPOWER toolbox, check the network’s radiality, and display all results.
Step 12.
Compute the new fitness function for each particle, f(Xi), using updated particle position and velocity.
Step 13.
Find Fbest = min(f(Xi)).
Step 14.
Set the new Pbest,i, and the corresponding new fitness function, Fbest,i.
Step 15.
Update new Pbest and Gbest; if the fitness fuction Fbest,i < Fbest, then update Gbest = Pbest,i and Fbest = Fbest,i.
Step 16.
Calculate ∆= Fbest0Fbest,i.
Step 17.
If ∆ < 0, then X0i = Xi; if random (0,1) < exp(−∆/T), then X0i = Xi.
Step 18.
Repeat the above procedure (K = K + 1 and n = n + 1) starting with step 10 until the stopping criterion and print out the optimal solution to the target problem.
The detailed process of the ORRDN using the SAMPSO algorithm combined with the MATPOWER toolbox is depicted in the flowchart in Figure 3.

4. Simulation Results and Discussion

4.1. Simulation Procedure

To achieve the efficacy of the proposed SAMPSO approach, the established procedure is implemented by MATLAB software and tested on the standard IEEE 69-bus RDN. In the simulation work, there are five scenarios to be investigated.
(i)
Scenario 1: Static reconfiguration of the test system at a normal load level characterized by a specific point of load consumption.
(ii)
Scenario 2: Static reconfiguration of the test system at a normal load level with an optimal integration of DGs. It can be mentioned here that DGs with an optimal size and placement are used based on the results of previous work given in [44].
(iii)
Scenario 3: Static reconfiguration of the test system at different load levels.
(iv)
Scenario 4: Dynamic reconfiguration of the test system following a stochastic variation in the daily load consumption curve.
(v)
Scenario 5: Dynamic reconfiguration of the test system following the stochastic integration of WTDG and variation in the daily load consumption curve.
These different scenarios allow for showing the effects of the static and dynamic reconfiguration on the network parameters, such as voltage profile and real power losses.
It should be stated here that the OPF problem in this study is solved by MATPOWER, whose main aim is to provide a simulation tool within MATLAB that is easier to use and modify [45,46].

4.2. Simulation Results for the Static Reconfiguration of the Standard IEEE 69-Bus RDN

The results of the feeder system in relation to the above-mentioned scenarios based on the static reconfiguration (SR) of the standard IEEE 69-bus RDN are reported in this subsection.

4.2.1. Scenario 1

To begin with, scenario 1 consists of determining the ORRDN using a hybrid SAMPSO methodology and verifying the objective function given by Equation (1). In fact, this simulation procedure is achieved at a specific value of load consumption and without the integration of DGs.
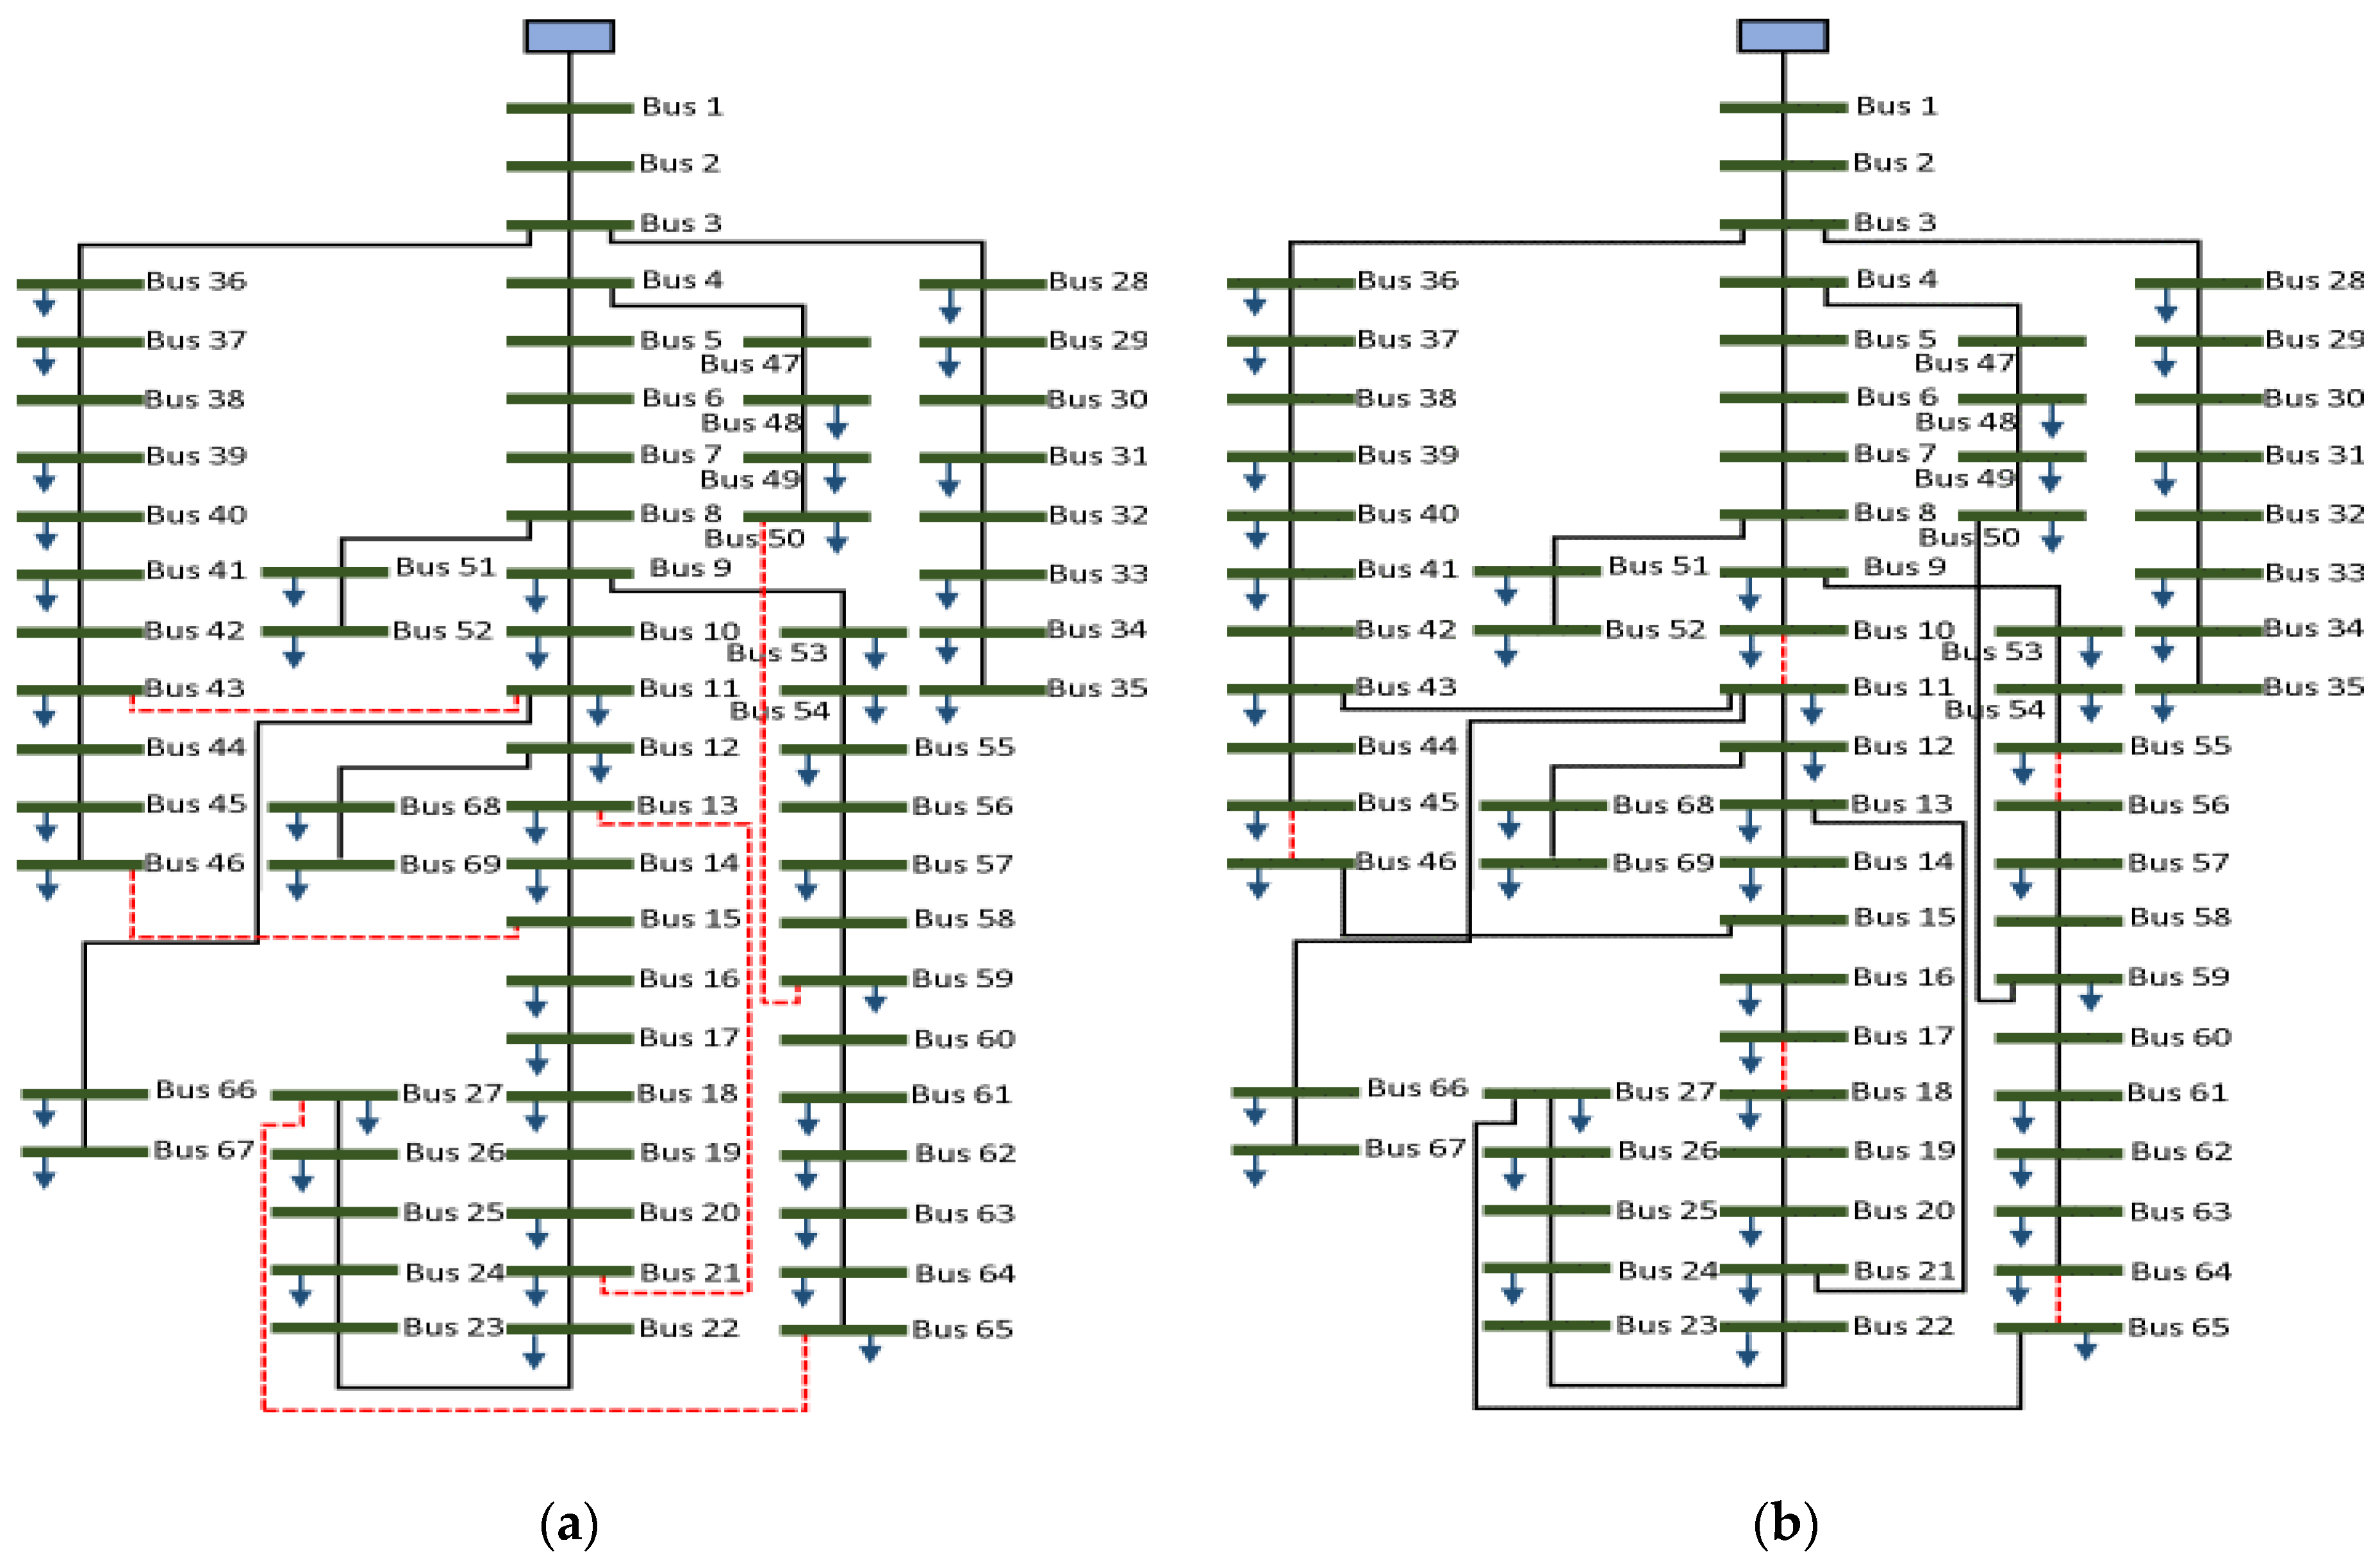
The radial system, shown in Figure 4a, is considered the initial topology of the IEEE 69-bus system before its optimal reconfiguration and without the integration of DG units. It has one main line and seven lateral lines. The system contains 69 buses and 68 branches. In its initial state, this network consists of 68 sectionalizing switches, which are considered normally closed, and 5 tie-switches which are considered normally open. In Figure 4, solid black lines indicate branches in service, dashed red lines represent inactive or out-of-service branches and small arrows in blue color represent loads.
The state vector associated with any system topology is expressed as follows:
X = [S1 S2…..SN] (1 × N)
where:
S1, S2,…SN represent the switches selected to be opened for a new configuration taken from the vectors formed by the loops created by the closing of all the switches, and N is the number of vectors or loops formed by closing the tie-switches.
So, the initial state vector corresponding to the initial topology of IEEE 69-bus RDN is X = [69, 70, 71, 72, 73].
Under initial operating conditions, the system is characterized by a TAPL in the order of 225.0007 KW and a total reactive power loss (TRPL) in the order of 102.1648 KVAR.
At the end of a set of simulations, an ORRDN is obtained and it is characterized by a new configuration of this network with an optimal topology as shown in Figure 4b. This new topology ensures that the network is always radial and that all connected loads are powered. The final state vector following the first scenario is X = [10, 17, 45, 55, 64]. This result is obtained by considering the same evaluation criteria of the optimal solution for all iterations.
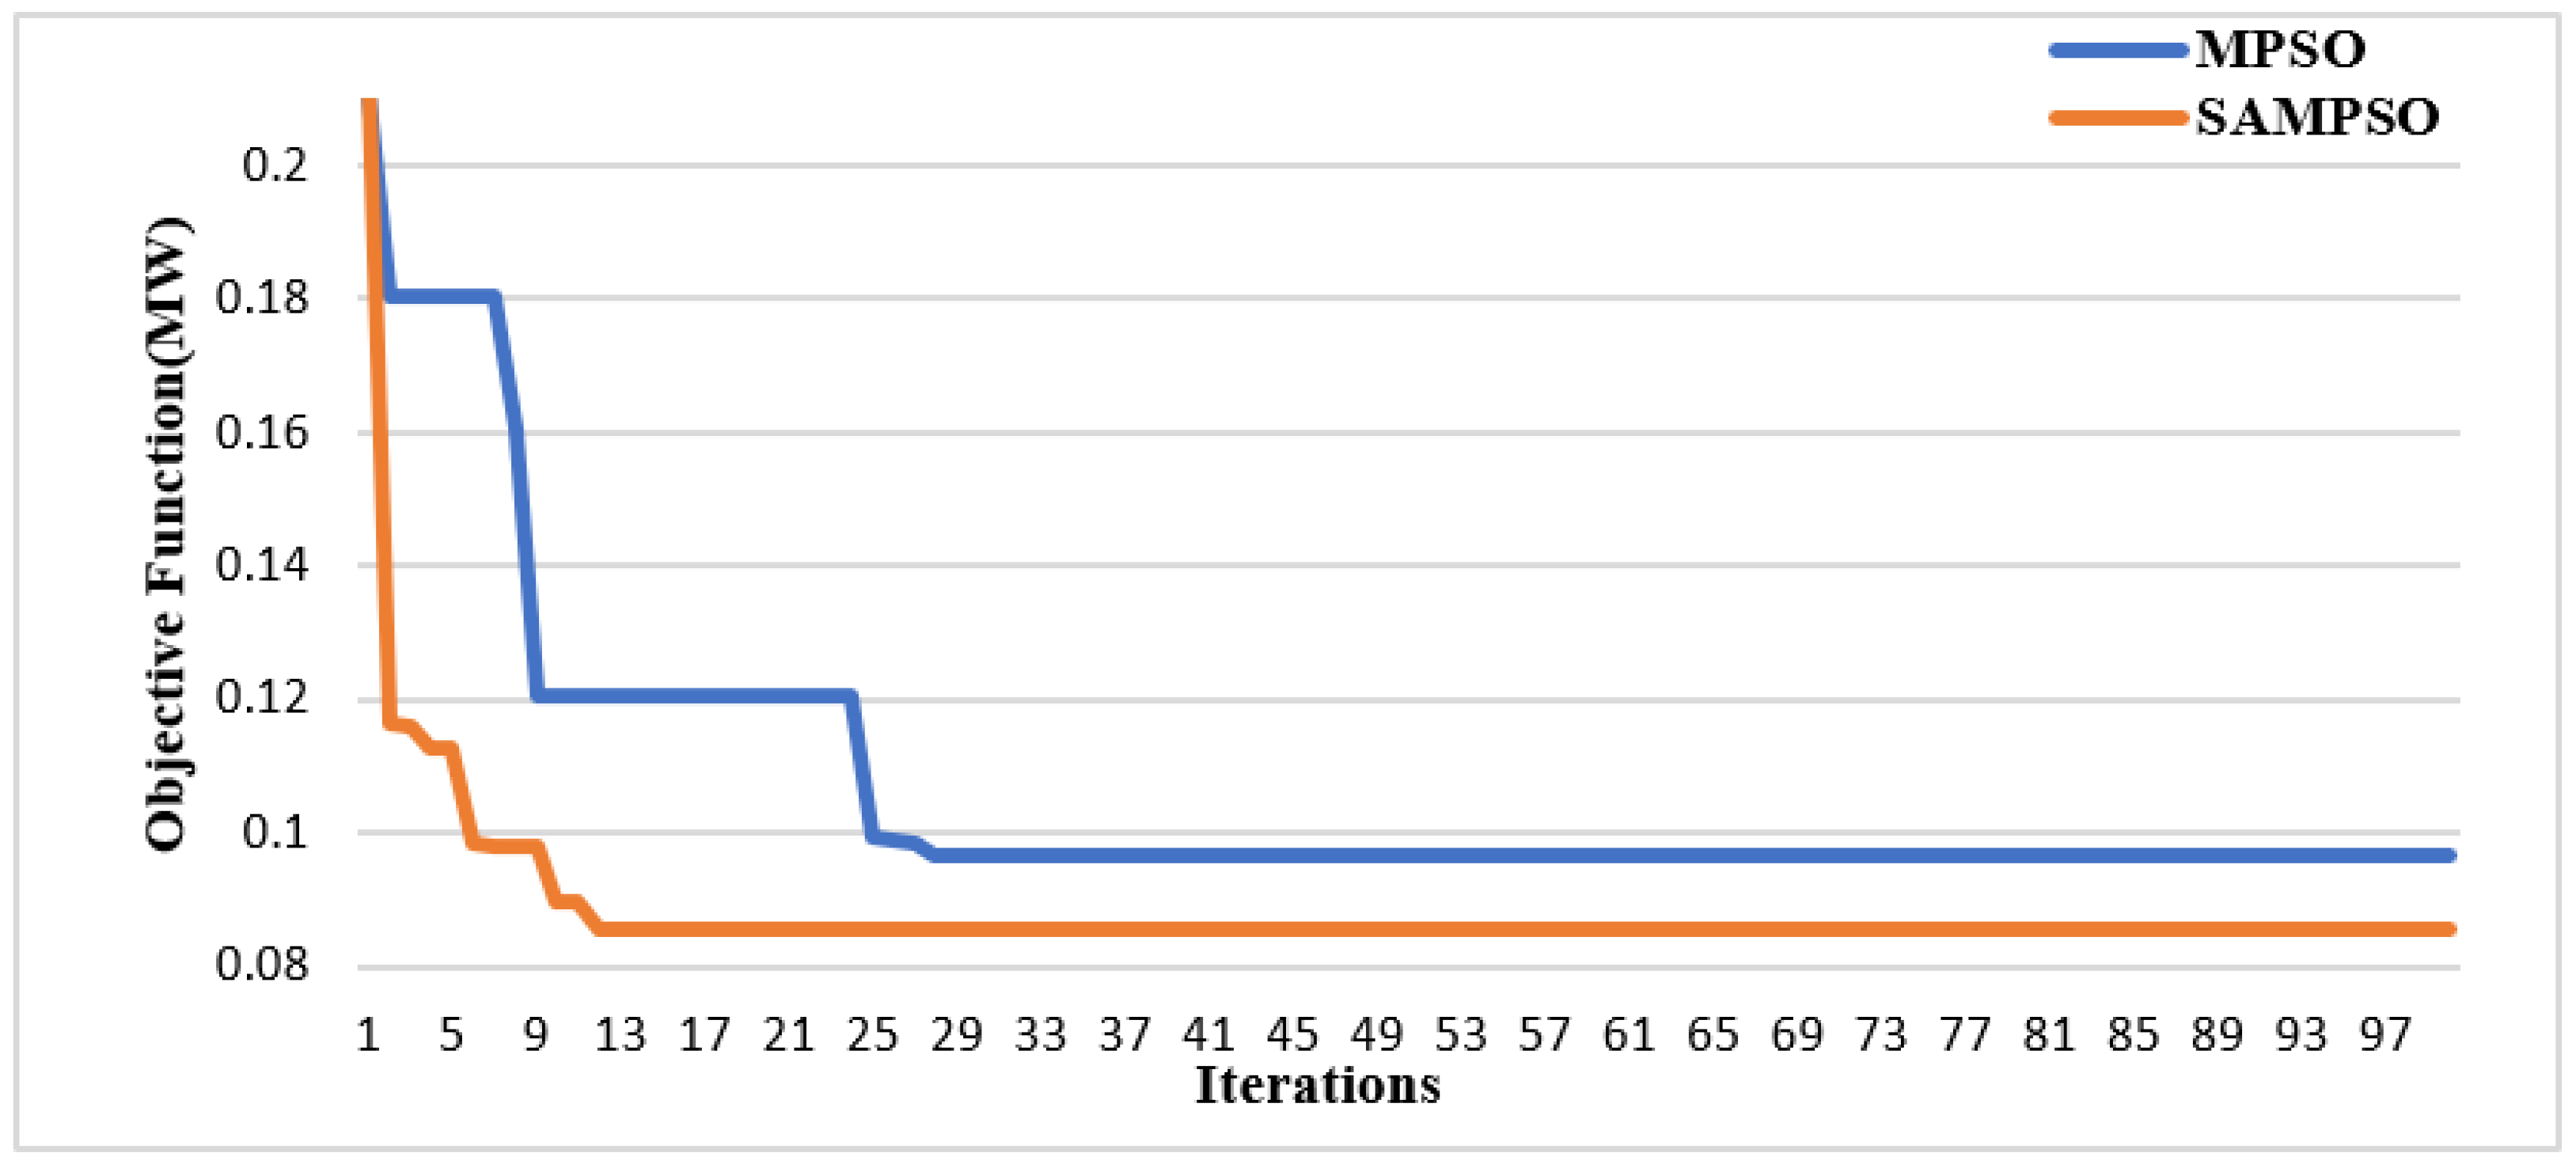
The convergence characteristic of the OF using MPSO and SAMPSO optimization is illustrated in Figure 5. It demonstrates the efficiency and superiority of the proposed hybrid SAMPSO algorithm when it is applied to the standard IEEE 69-bus RDN to find the most optimal configuration.
The impacts of the ORRDN obtained by using the suggested SAMPSO-based procedure and other techniques are presented in Table 1.
It can be seen from Table 1 that the proposed optimization provides the lowest TAPL which is in the order of 85.6837 KW. Therefore, the corresponding TAPL reduction is around 61.91% compared to the initial configuration characterized by a TAPL equal to 225.0007 KW.
Moreover, Table 1 shows that the proposed optimization technique used in this work to find the optimal configuration of the IEEE 69-bus RDN leads to better results compared to the other techniques in terms of the percentage reduction in TAPL and improvement in minimum voltage value (MVV).
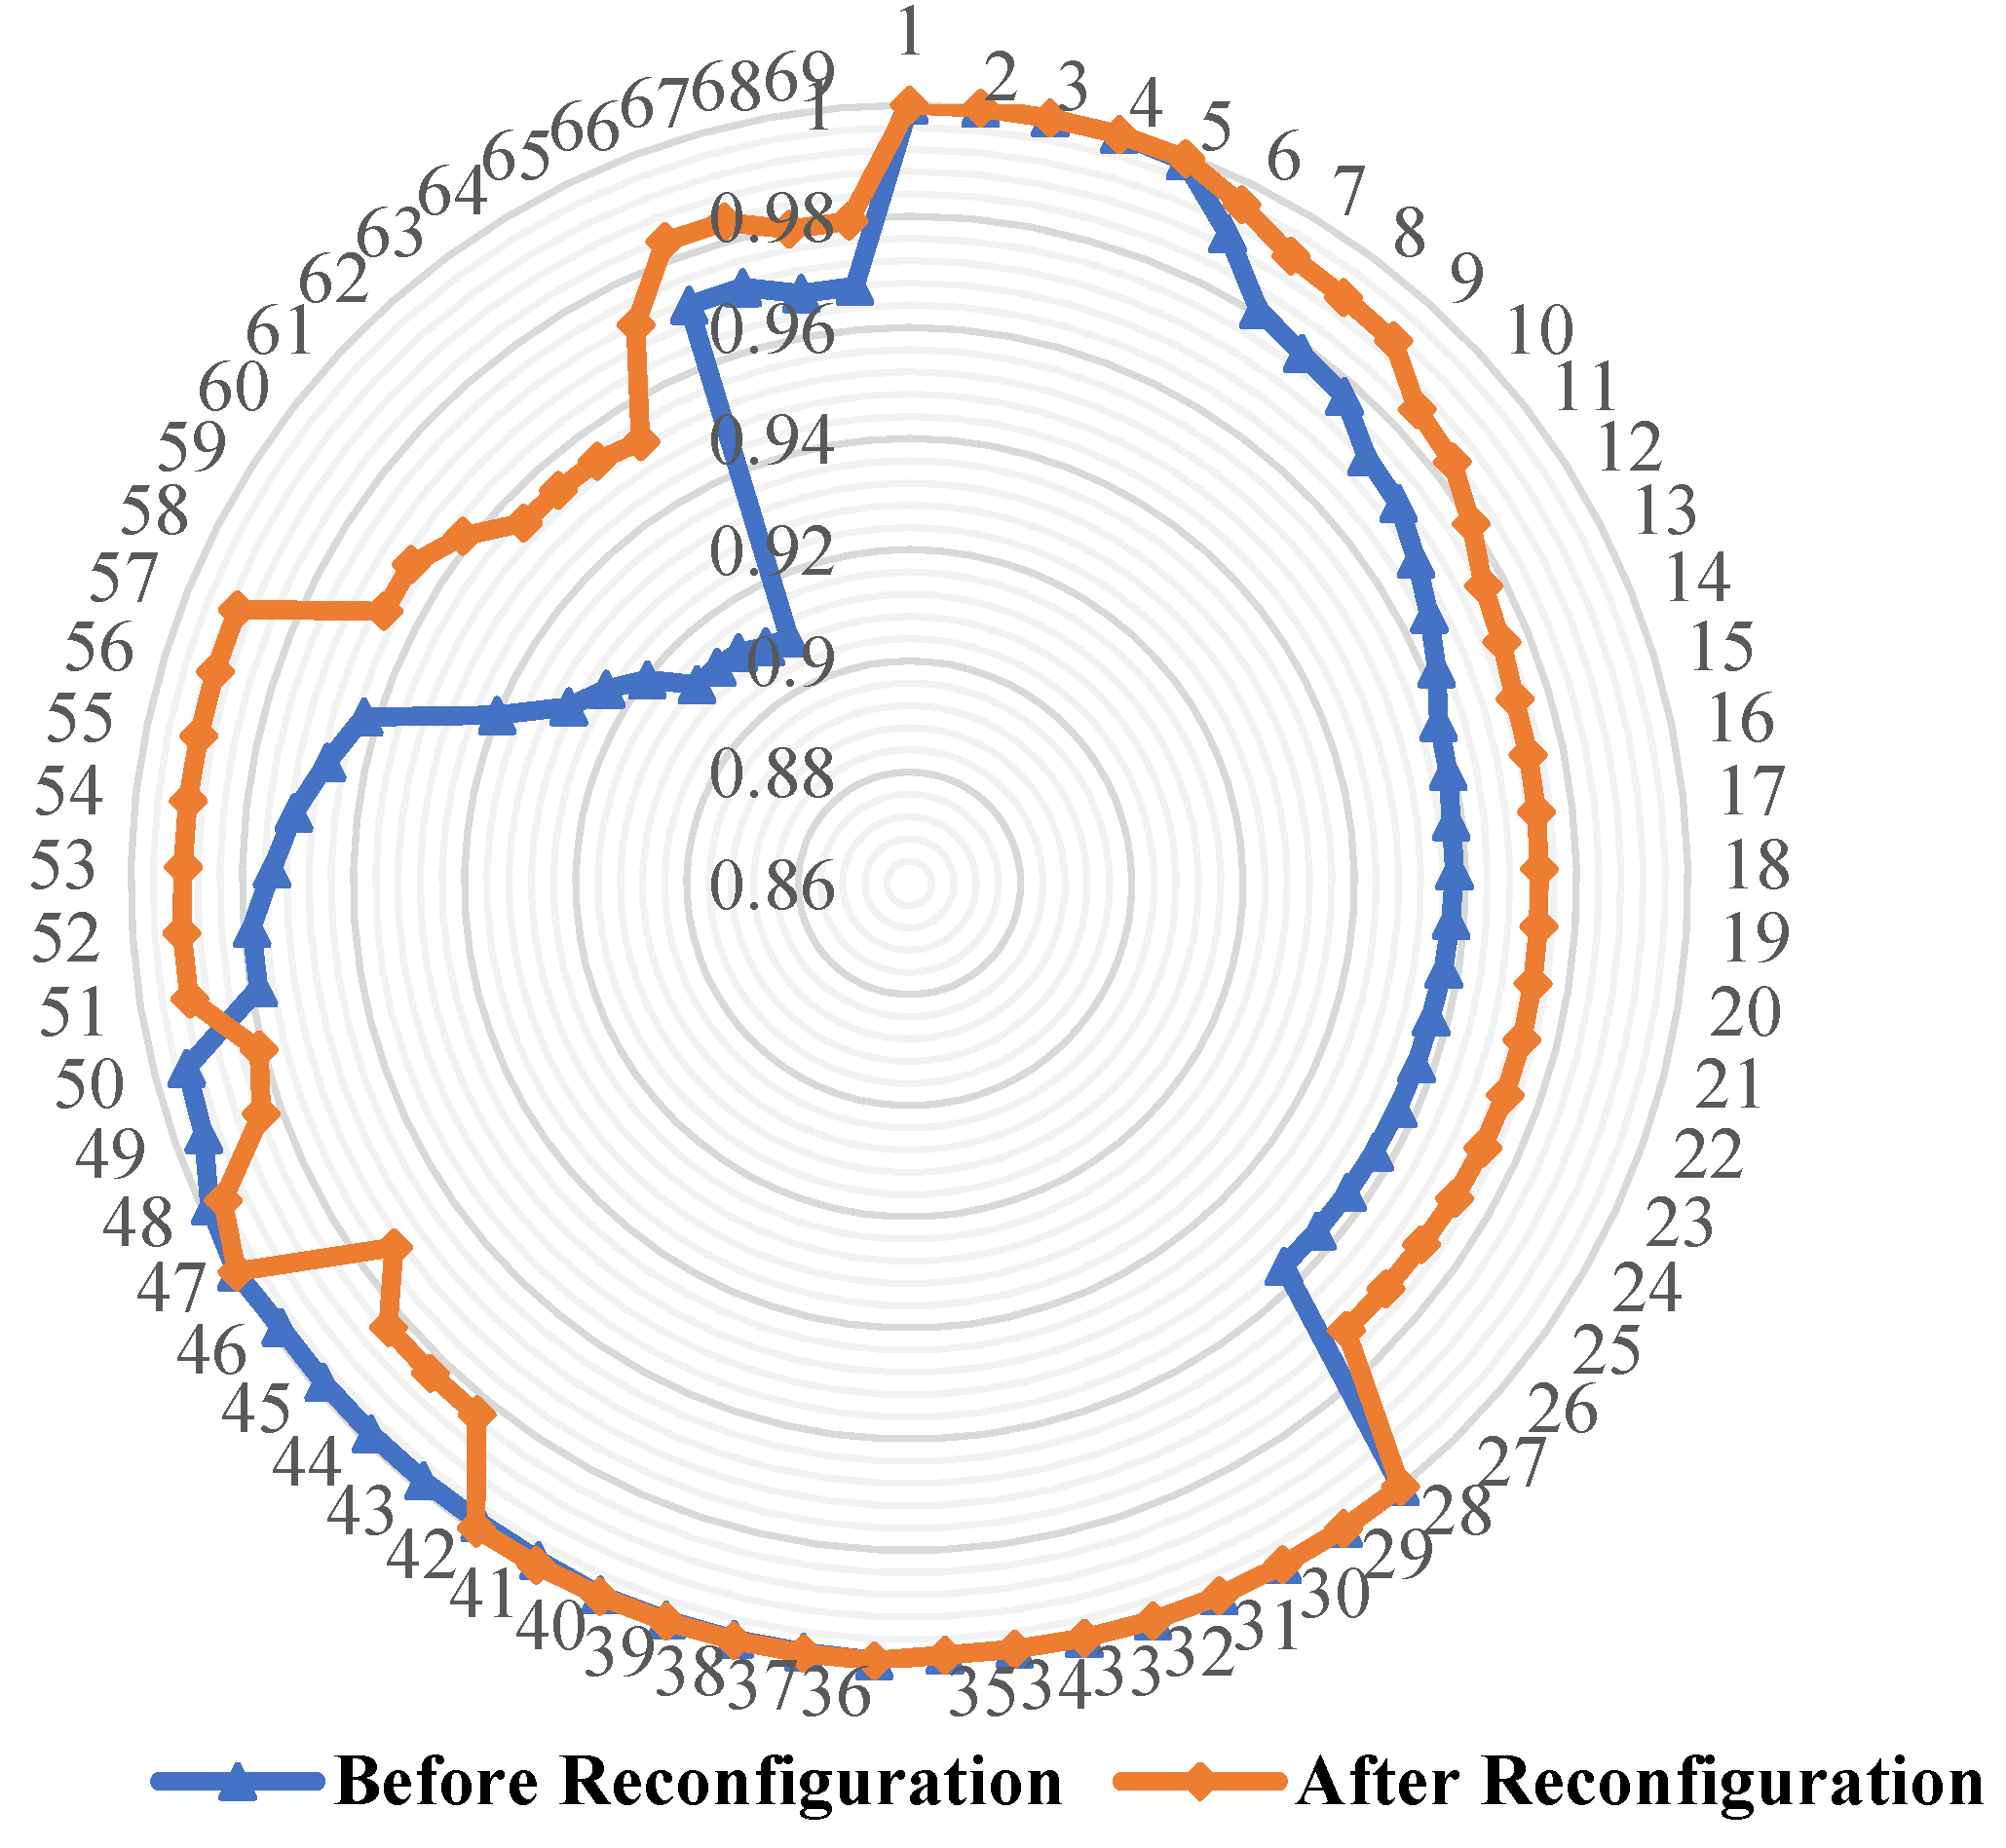
Figure 6 illustrates the VP at all busses and reveals that in the initial state (before the ORRDN), this network has a minimum voltage equal to 0.9091 pu found at bus 65. After achieving the ORRDN, a new VP is established with a minimum value equal to 0.9530 pu at bus 64.
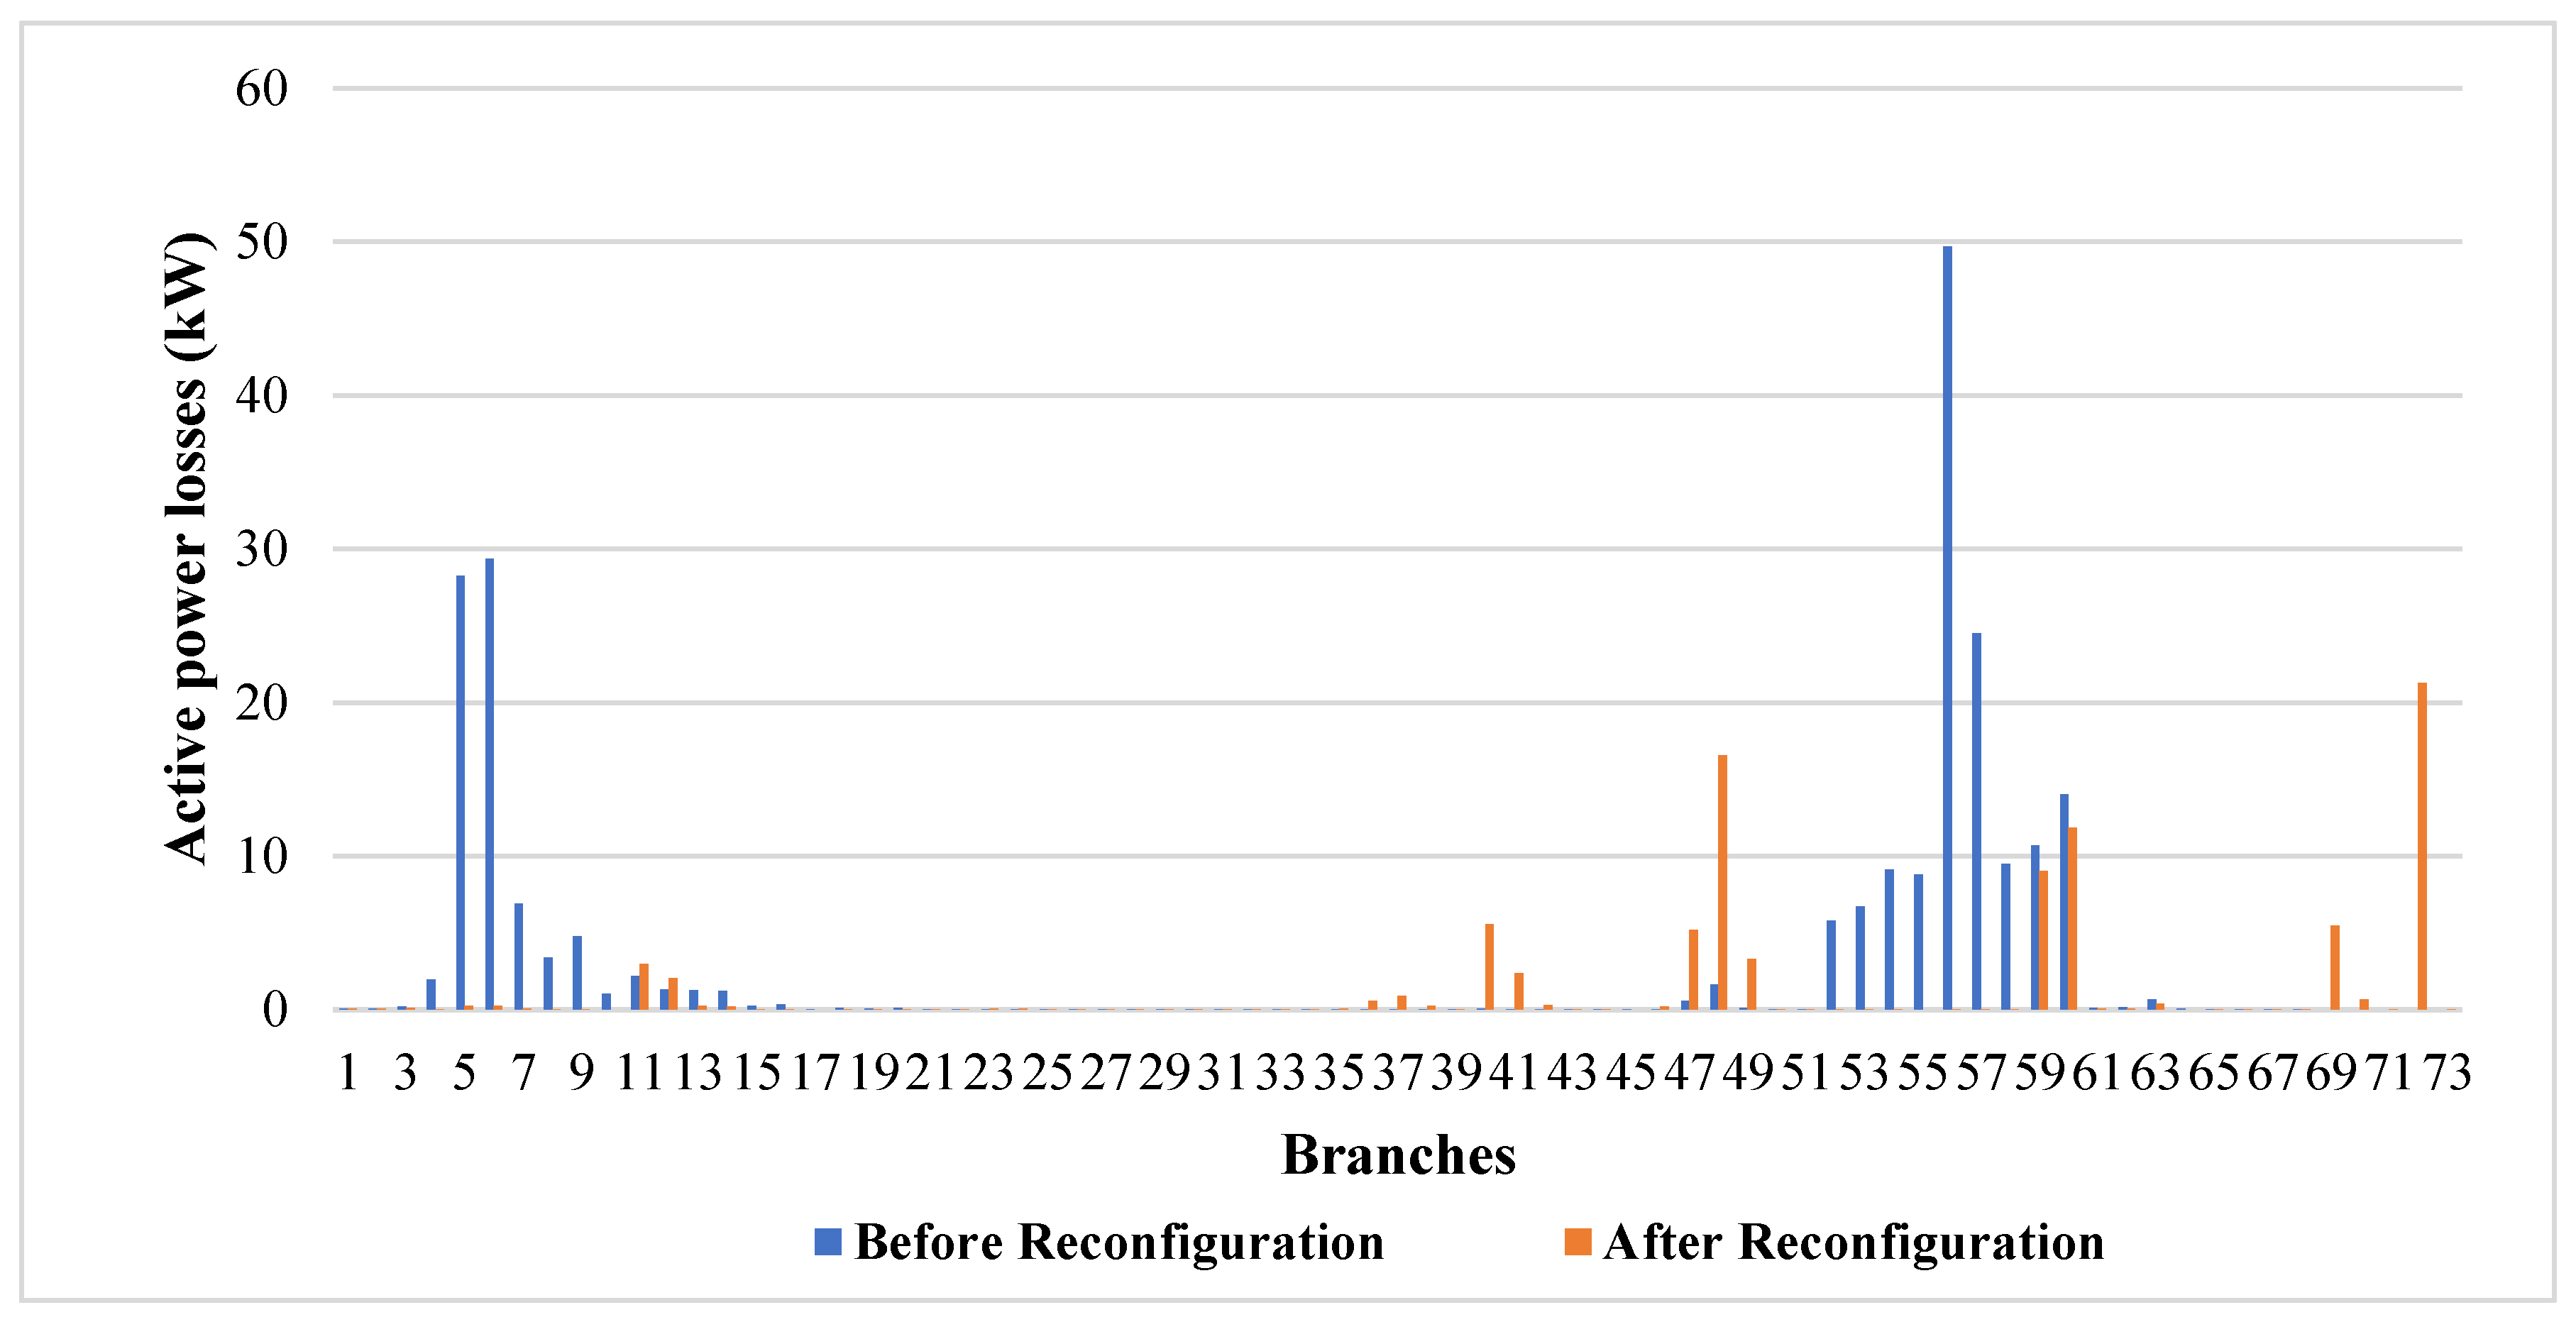
Figure 7 shows the APL at each branch before and after the SAMPSO reconfiguration of the IEEE 69-bus RDN. It is clear that before reconfiguration the highest value of the APL is equal to 49.684 kW, obtained at branch 56. The maximum value of the APL is reduced to 21.255 kW for the new configuration and is obtained at branch 72 of the DN.

4.2.2. Scenario 2

This second scenario consists of the incorporation of SRRDN (in an exact point of load consumption) and the optimal insertion of DGs characterized by a well-defined output power. The study of this scenario will be based on the results of a subsequent work [44] presenting the optimal size and location of DGs in the DN. In fact, two DGs are injected into IEEE 69-bus RDN at both buses 17 and 62 with an optimal size equal to 0.55 MW and 1.53 MW, respectively.
The state vector corresponding to the initial topology of the test network before reconfiguration is X = [69, 70, 71, 72, 73], as shown in Figure 8a.
The OR of the network using the proposed SAMPSO algorithm is completed as soon as the optimal solution is obtained, putting the DN under a new radial topology. Therefore, a new state vector is established having the form X = [10, 11, 13, 57, 64], as presented in Figure 8b. In Figure 8, solid black lines, dashed red lines and small arrows in blue have same significance as in Figure 4.
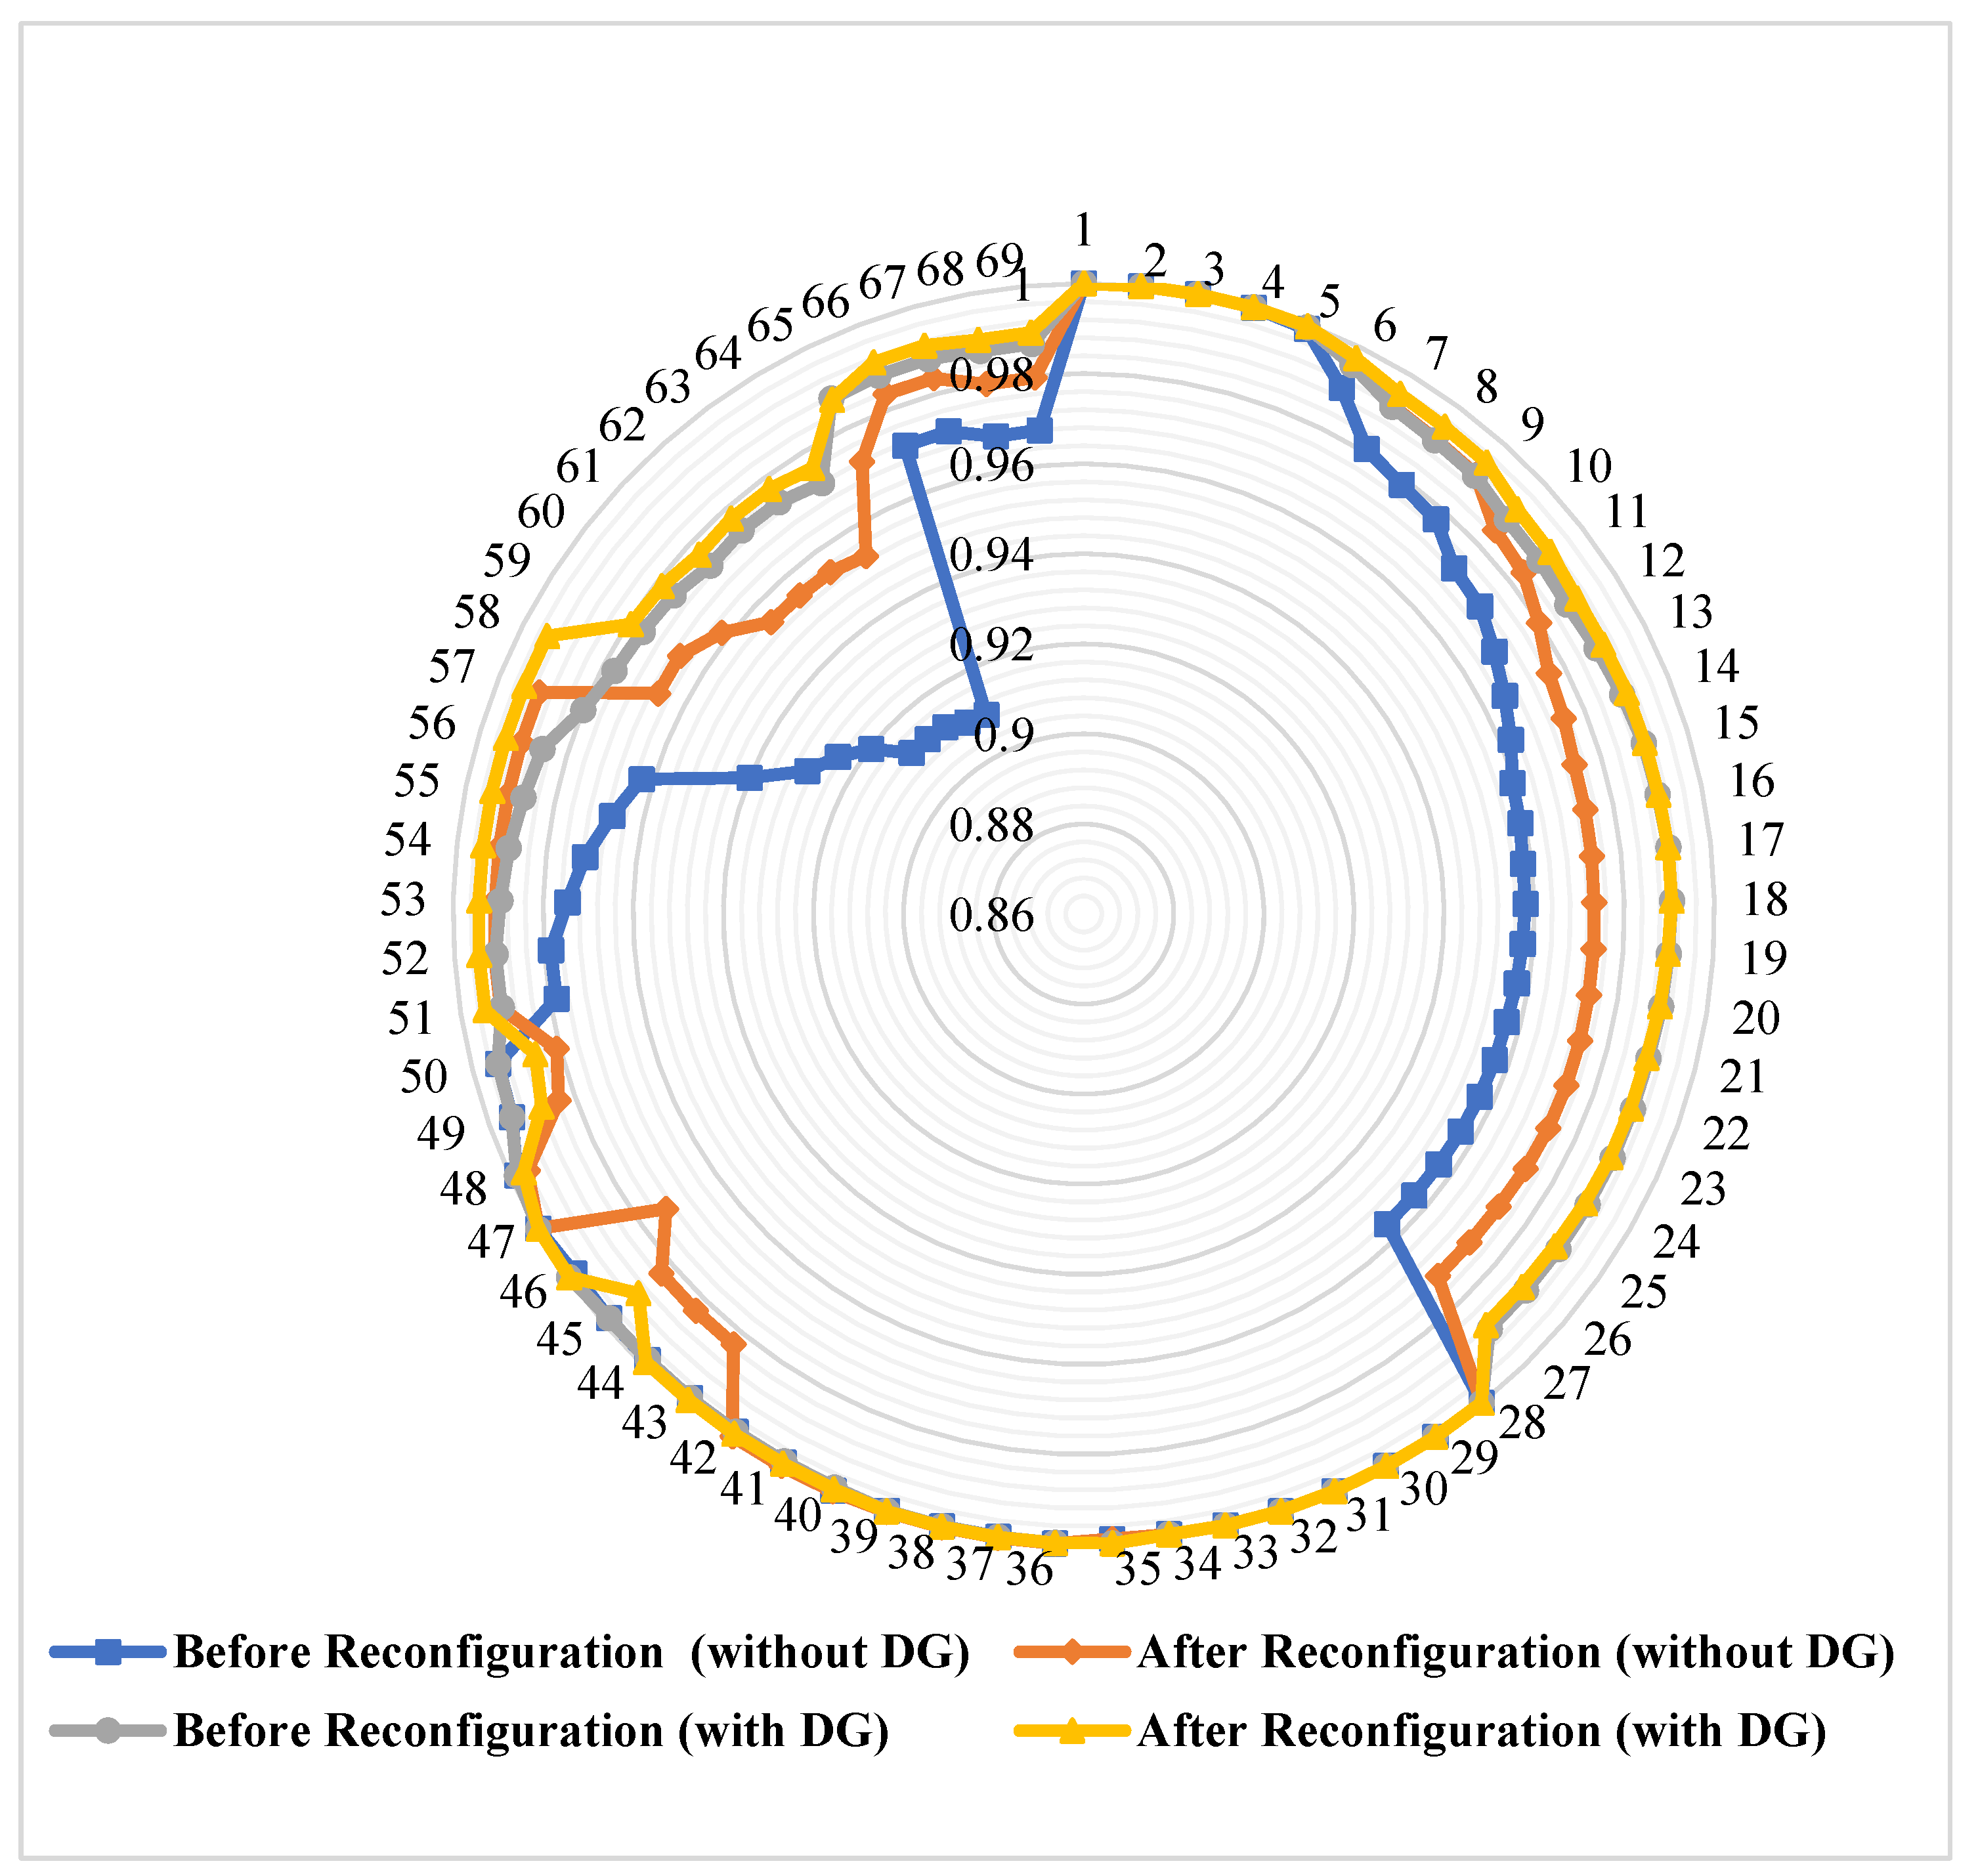
Figure 9 and Table 2 both show that this optimal solution led to a considerable improvement in VP after a comparison with the initial state (scenario 1), which well justifies the importance of the application of this second scenario. It can be added that the improvement in voltage values following the optimal reconfiguration of the RDN IEEE 69-bus with an optimal injection of 2 DGs affected almost all buses. Hence, an improvement in the minimum voltage value from 0.9719 pu to 0.976 pu, is obtained at the same bus 64.
The above table demonstrates a reduction in TAPL from 225 kW at the initial state to an optimal value equal to 30.89 kW in the state with DG units and a TAPL reduction value of around 86.27% which improves the reliability of the whole system.
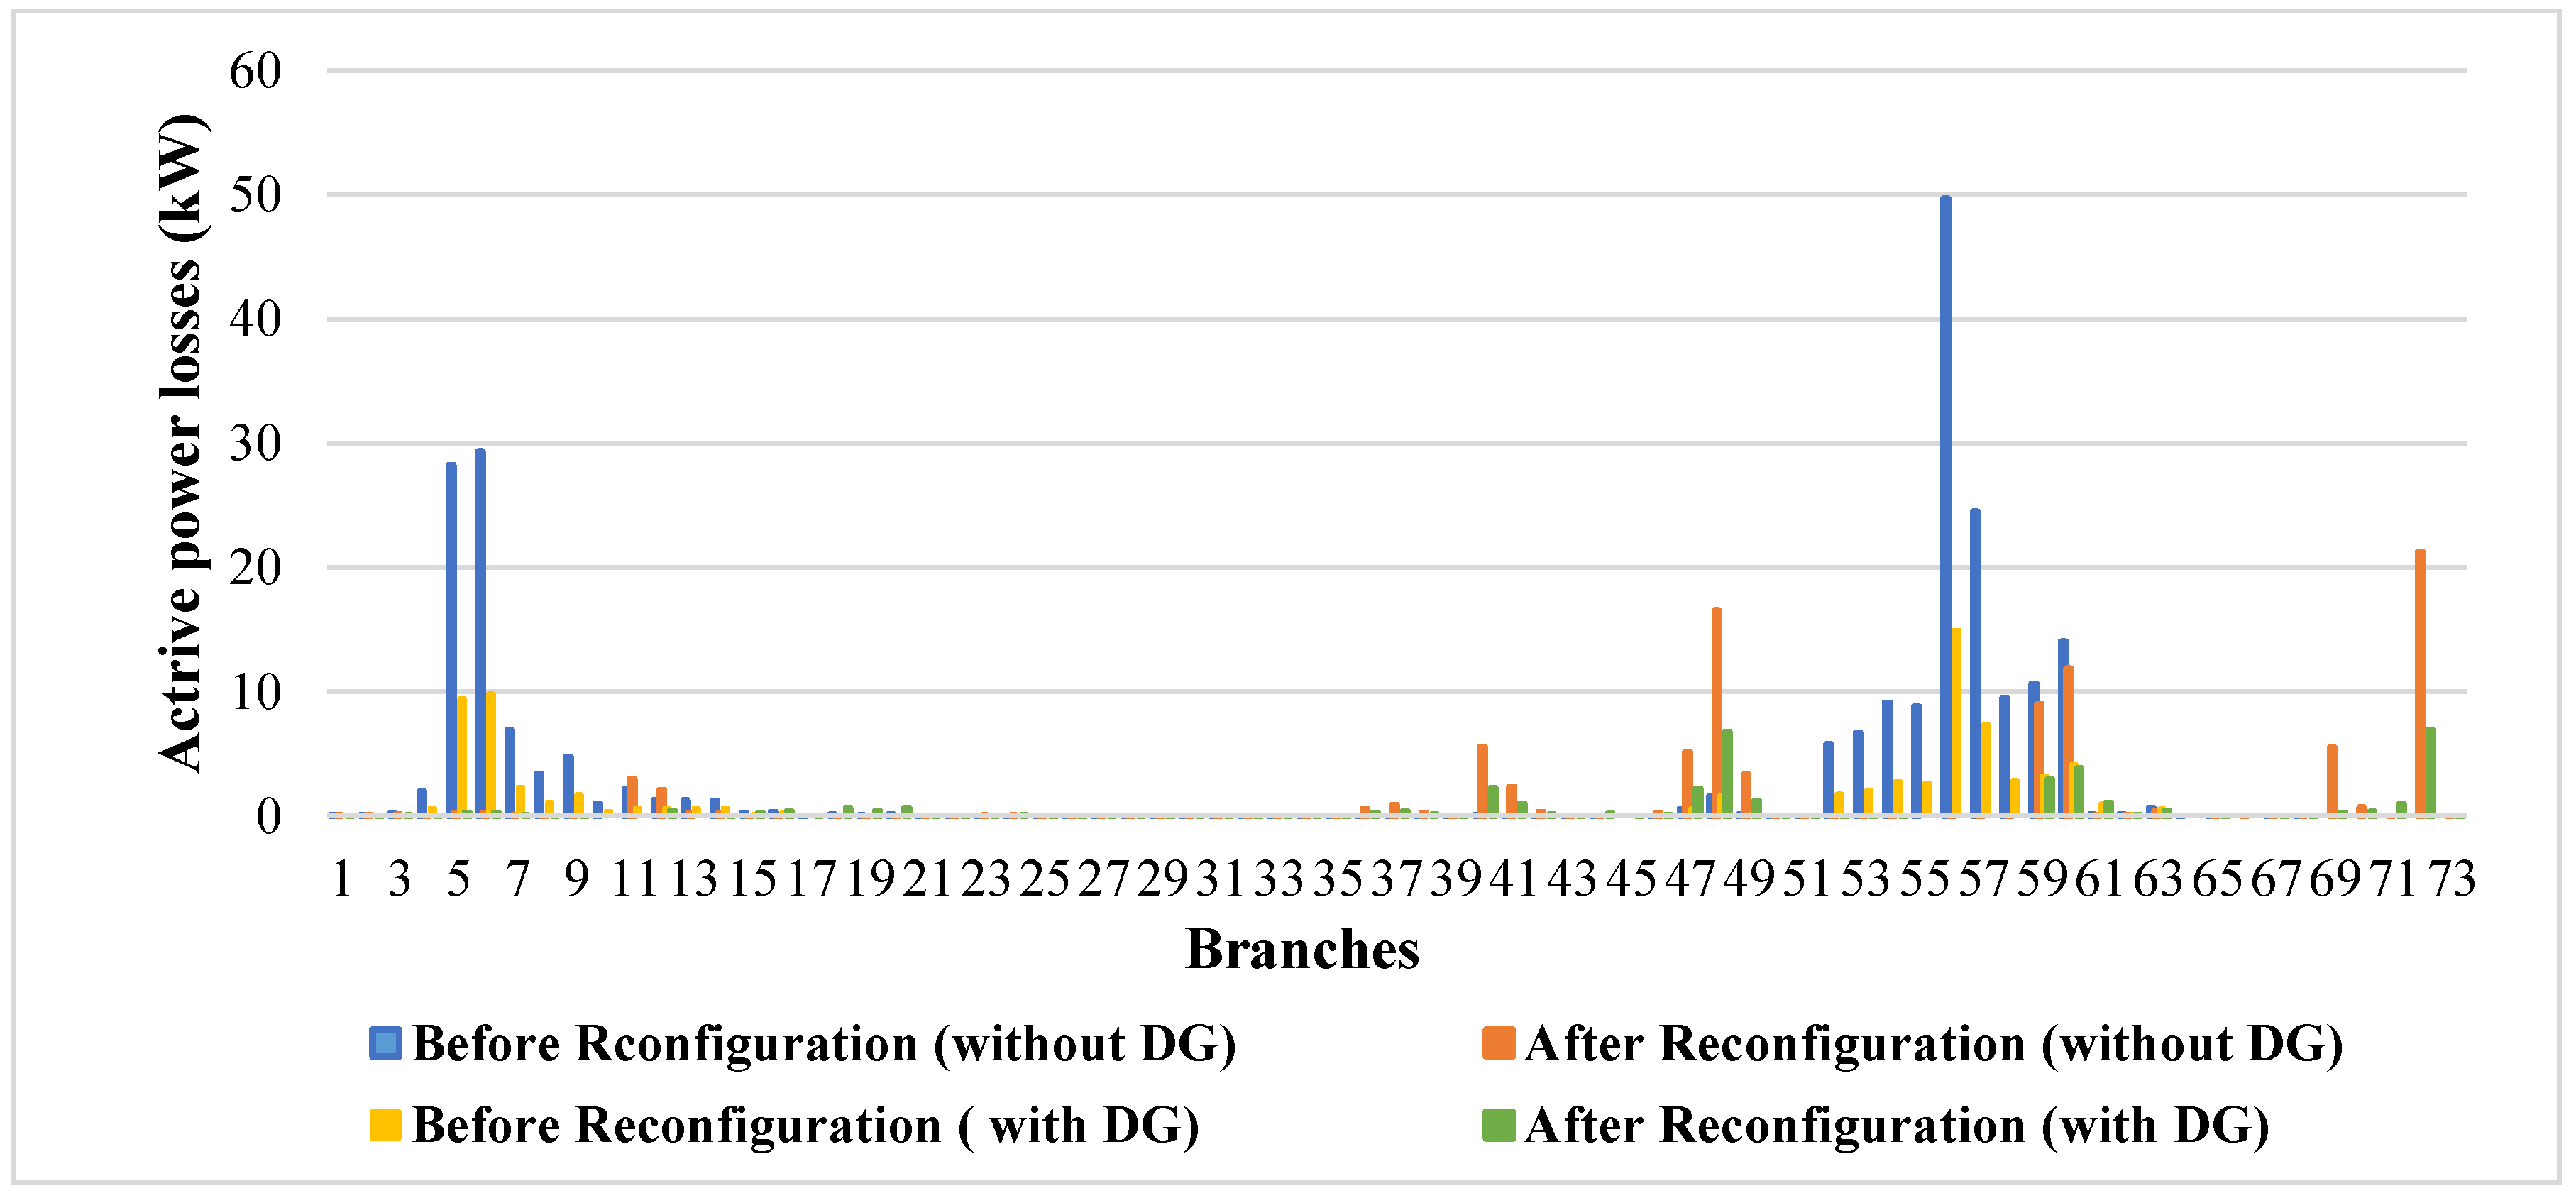
The TAPL of all the branches for all the cases proposed is shown in Figure 10.
By and large, it could be said that all results found after those two scenarios prove that the new optimal configuration obtained during the SRRDN of the DN in the presence of DGs gives better results in terms of TAPL minimization and VP improvement.

4.2.3. Scenario 3

This scenario consists of applying the ORRDN using the suggested SAMPSO method on the same test network with different load levels, ensuring that the new topology best fulfills the objective function mentioned in this work and that the structure of the network always remains radial. The load level is described by the following equation.
P L = μ   P L 0
where P L is the actual load and P L 0 is the initial load.
In this third scenario, three levels of load demand are tested:
(i)
Normal load (NL) for each bus of the RDN (μ = 1),
(ii)
Light load (LL) is obtained when the value of the normal load is reduced by 10% (μ = 0.9),
(iii)
Heavy load (HL) resulting from a 30% increase in the value of the normal load for the RD buses (μ = 1.3).
Figure 11a,b, show the VP before and after the optimal reconfiguration of the RDN for μ = 0.9 and μ = 1.3, respectively. The results mentioned in these two figures, and through Table 3, indicate a significant improvement in voltage magnitudes for most buses after achieving optimal reconfiguration.
It is important here to mention that for the configured state and all load levels, the lowest voltage occurred at bus 64 with amounts of 0.9530 pu for NL, 0.9579 pu for LL, and 0.9381 pu for HL.
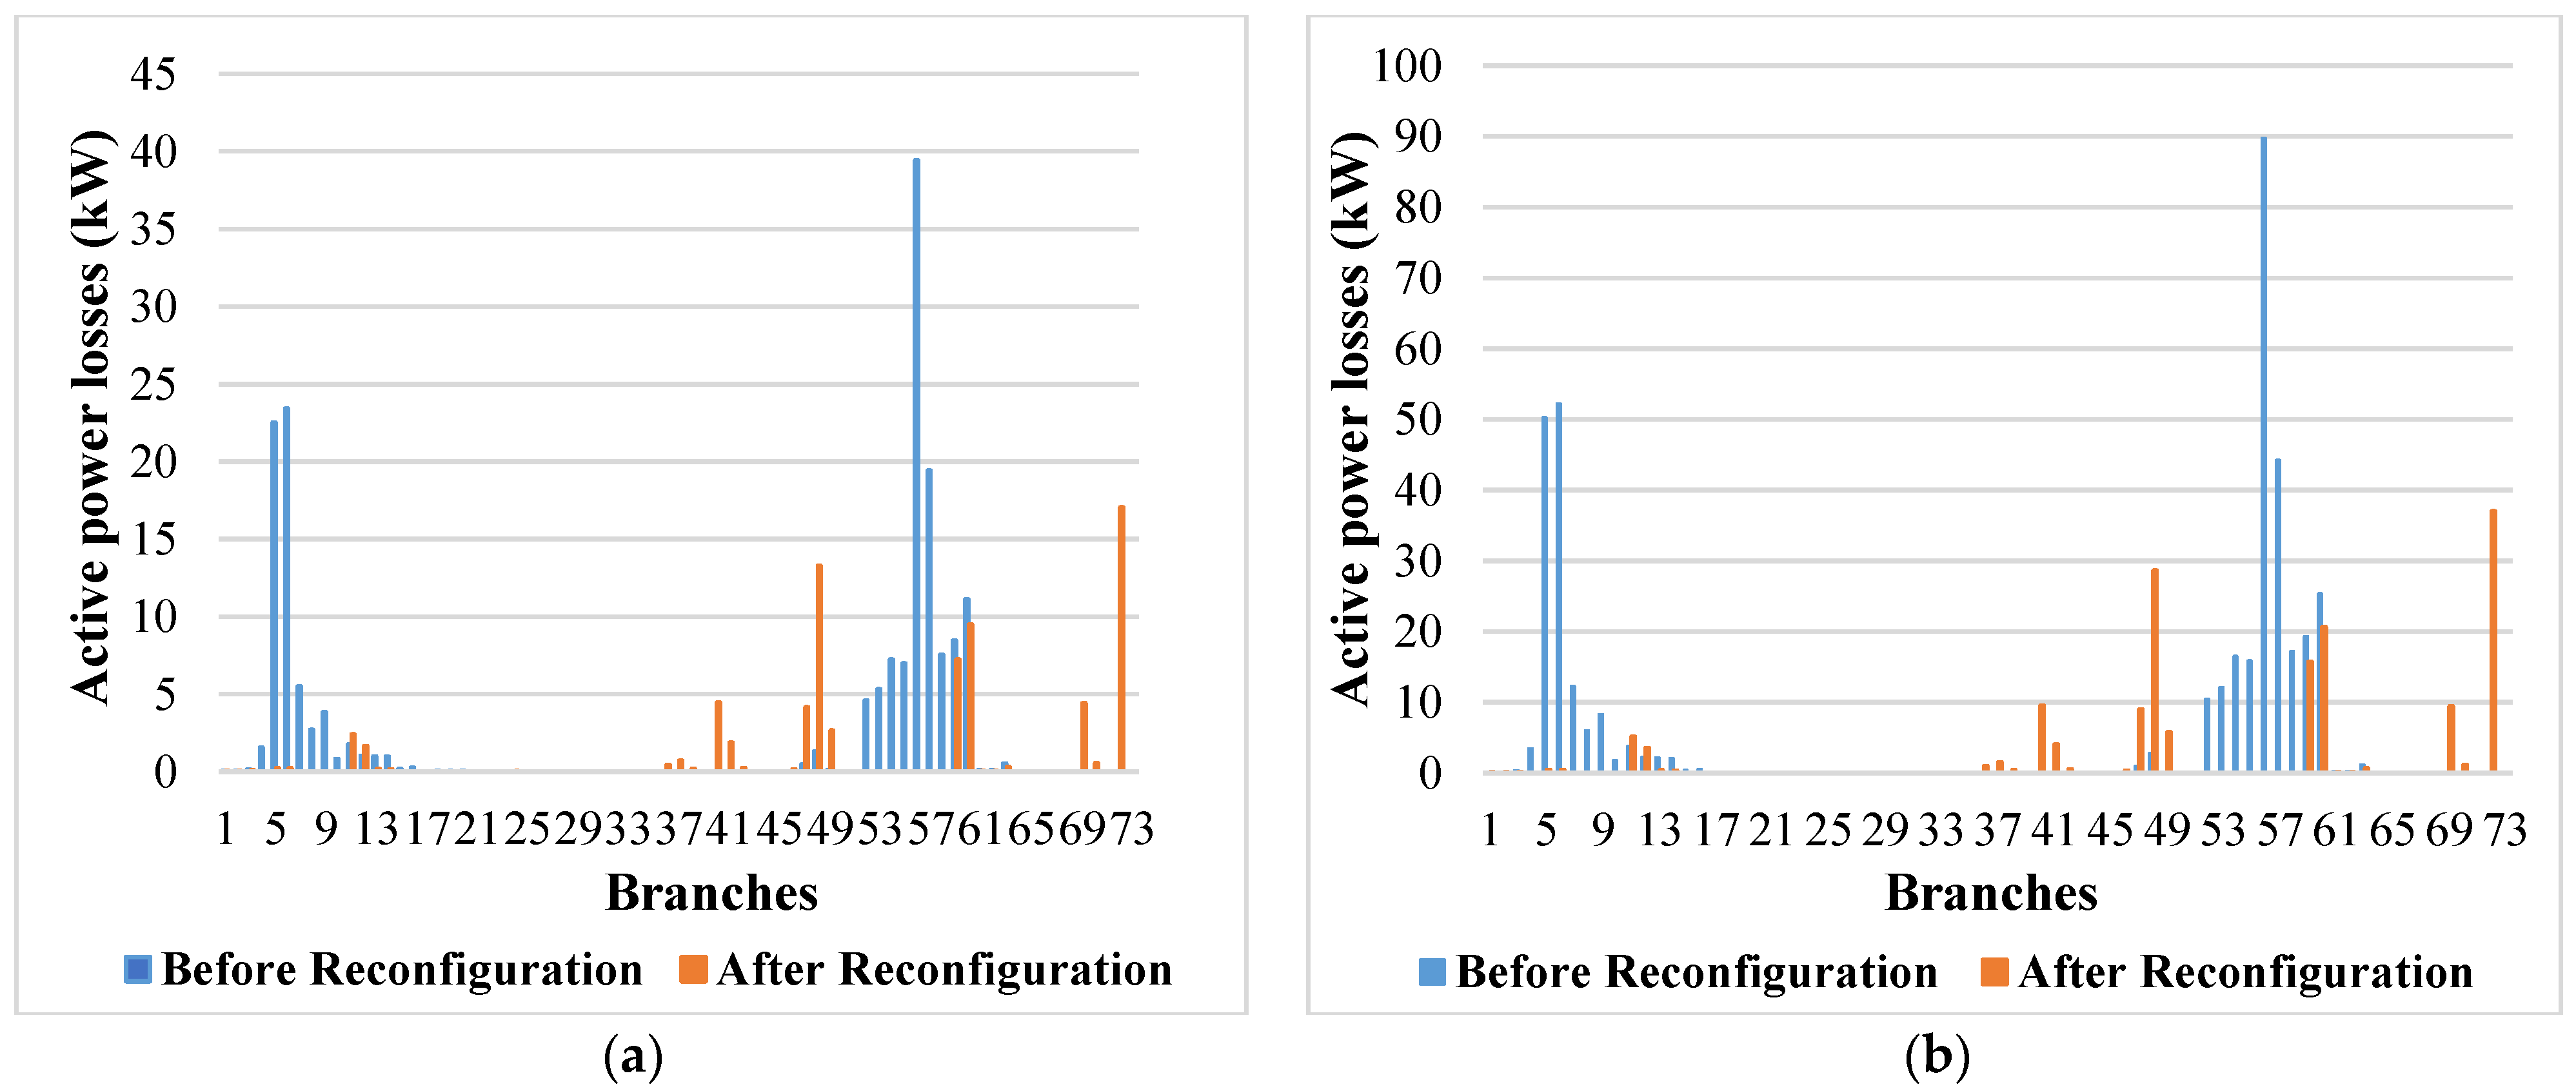
From Table 3, it is obvious that the TAPL for the basic configuration are of the order of 178,9448 KW for μ = 0.9, 225,0007 KW for μ = 1, and 403,2863 KW for μ = 1.3. The OR with the proposed SAMPSO method saves 106 KW in TAPL at LL, 139 KW in TAPL at NL, and 253 KW in TAPL at HL.
In comparing the results mentioned in the last row of Table 3, we notice that the state vector corresponding to the optimal topology of the DN differs from one load level to another. Indeed, the new configuration of the system for μ = 1 admits as final state vector X = [10, 17, 45, 55, 64]. For μ = 0.9, this state vector changes and becomes X = [10, 17, 45, 56, 64], from which another new configuration is established. For μ = 1.3, the state vector corresponding to this optimal solution is X = [10, 17, 45, 58, 64], thus leading to another new optimal topology.
The impact of this third SR on the APL, in each branch of the studied RDN and for each load level (HL and LL), is illustrated in Figure 12.
Overall, scenario 3 clearly shows that the new topology found for all tested load levels is not always the same and changes from one level to another. Hence, it is obvious that an optimal topology at one time may not be so at another. For example, an optimal configuration for peak hours may no longer be optimal for off-peak hours due to the change in load demand behavior of the network during a given day, for which the simulation of scenario 4 becomes essential.

4.3. Simulation Results for the Dynamic Reconfiguration of Standard IEEE 69-Bus RDN

The results of the feeder system in relation to the above-mentioned scenarios in relation to the DR of Standard IEEE 69-bus RDN are reported in this section. Another objective function was added in the evaluation of the DRRDN consisting of minimizing switches’ change costs (SCC).
In reality, changing the switch’s state from one hour to another hour presents a hard and expensive task for network operators. So, minimizing switches’ change cost consists of a simple choice of an optimal topology used for the whole day, avoiding the task of pinpointing switches from one optimal topology to another one during the 24 h of the tested day. In fact, the optimal topology chosen is the best for verifying the OF of our work (minimizing TAPL and improving MVV).

4.3.1. Scenario 4

Since the load consumption characteristic of a DN varies over time, the fourth scenario consists of studying the DR using the suggested SAMPSO optimization technique applied during the SR, over a time horizon divided into 24 h. The optimal reconfiguration problem of the RDN is solved for the stochastic variation of the daily load consumption don4 February 2020, as given in Figure 13.
Results of the DRRDN for IEEE 69-Bus System under scenario 4 are tabulated in Table 4.
From Figure 13, it can be seen that the test day is segmented into 24 h. Therefore, 24 new topologies are obtained after achieving the DR of the IEEE 69-bus system.
Table 4 clearly shows that over the 24 h of the studied day, there are several configurations that have been calculated as being optimal for contiguous hour intervals. For example, the configuration having a final state vector of X = [42, 17, 71, 57, 64] is optimal for the hours 12.00 and 18.00 of the same day. However, switching from one optimal configuration to another during the operating period could be a heavy task for the operation of the RDN and, above all, a waste of time, energy, and especially money. Therefore, the idea is to choose a single optimal configuration that best verifies the objective function of our simulation study (reduction in TAPL, amelioration in MVV, and minimization in SCC) and use it throughout the day.
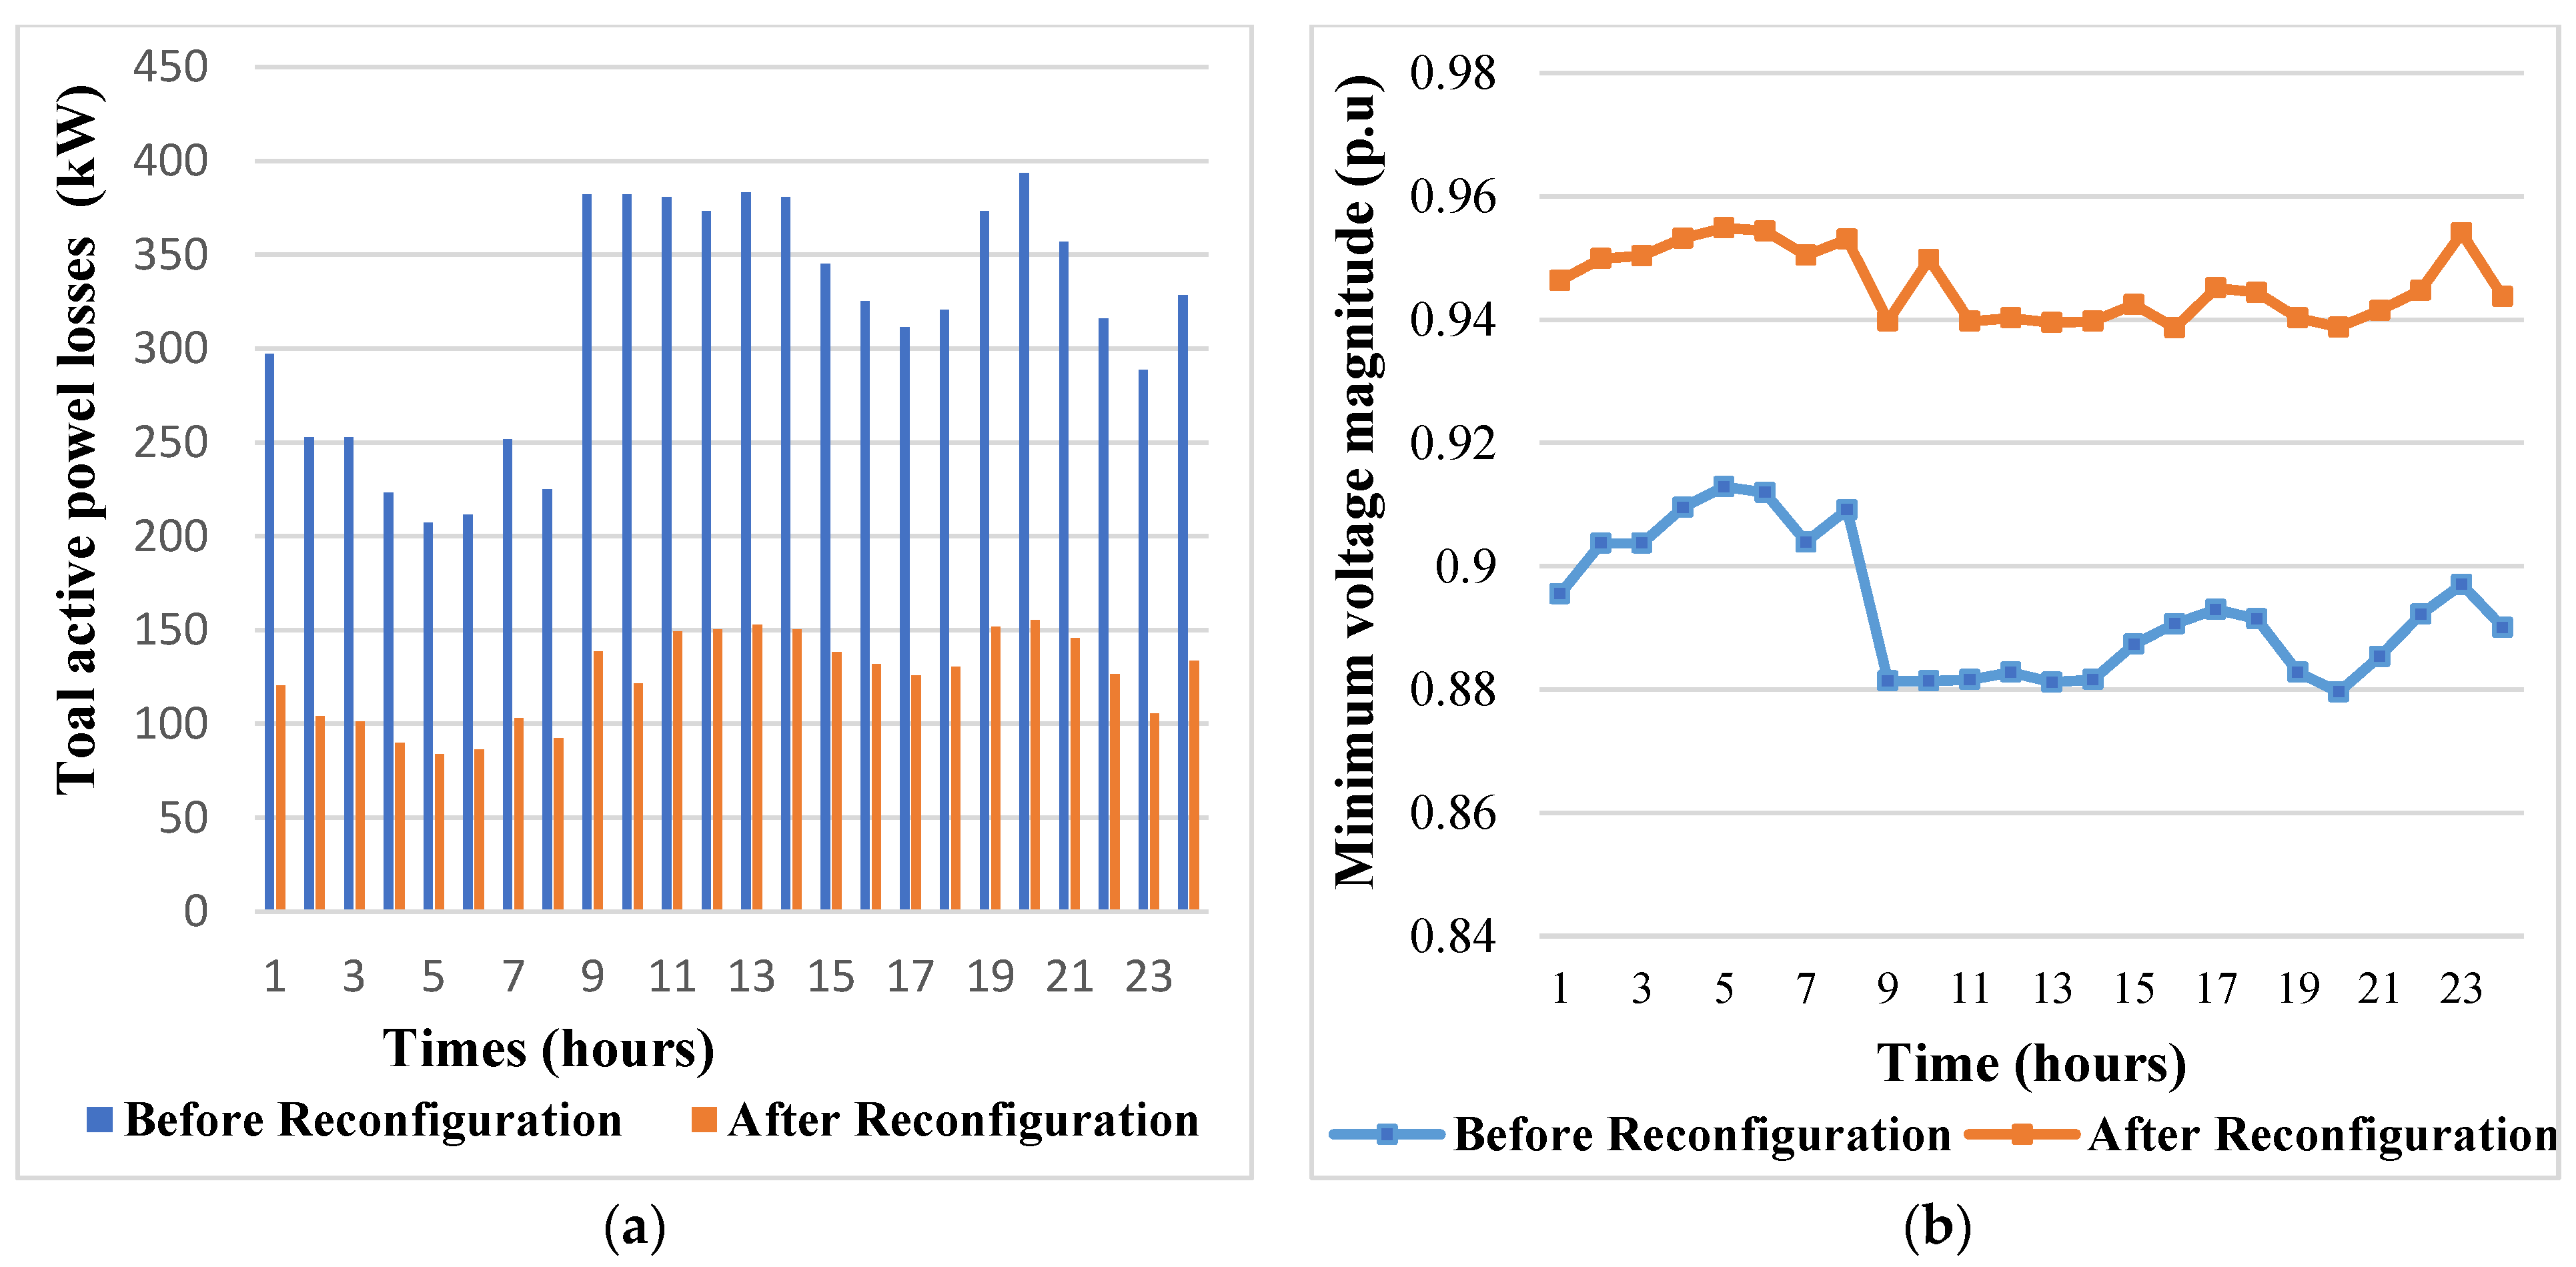
Overall, among all the resulting configurations, the optimal configuration which will be maintained throughout the day is X = [69, 13, 12, 55, 62] obtained at 10 h. The adopted configuration ensures a TAPL reduction equal to 68.19% and an increase in the MVV varying from 0.8813 pu to 0.9497 pu as shown in Figure 14a and Figure 14b, respectively.
The study discussed in scenario 4 highlights that the operation of RDN with the configuration identified as optimal for a specific load consumption point (point corresponding to the NL), studied during the SR, is no longer optimal when switching from one load consumption point to another during the entire day (all the points of the daily load consumption curve) studied during the DR.

4.3.2. Scenario 5

As the wind speed is stochastic and varies over time, the DRRDN with the addition of variable wind power becomes an important application before closing the simulation study. This fifth scenario consists of determining the optimal configuration of the system, always verifying the same objective function of our study, based both on a temporal characteristic of load consumption and on an optimal insertion of WTDG which are characterized by a variable output power.
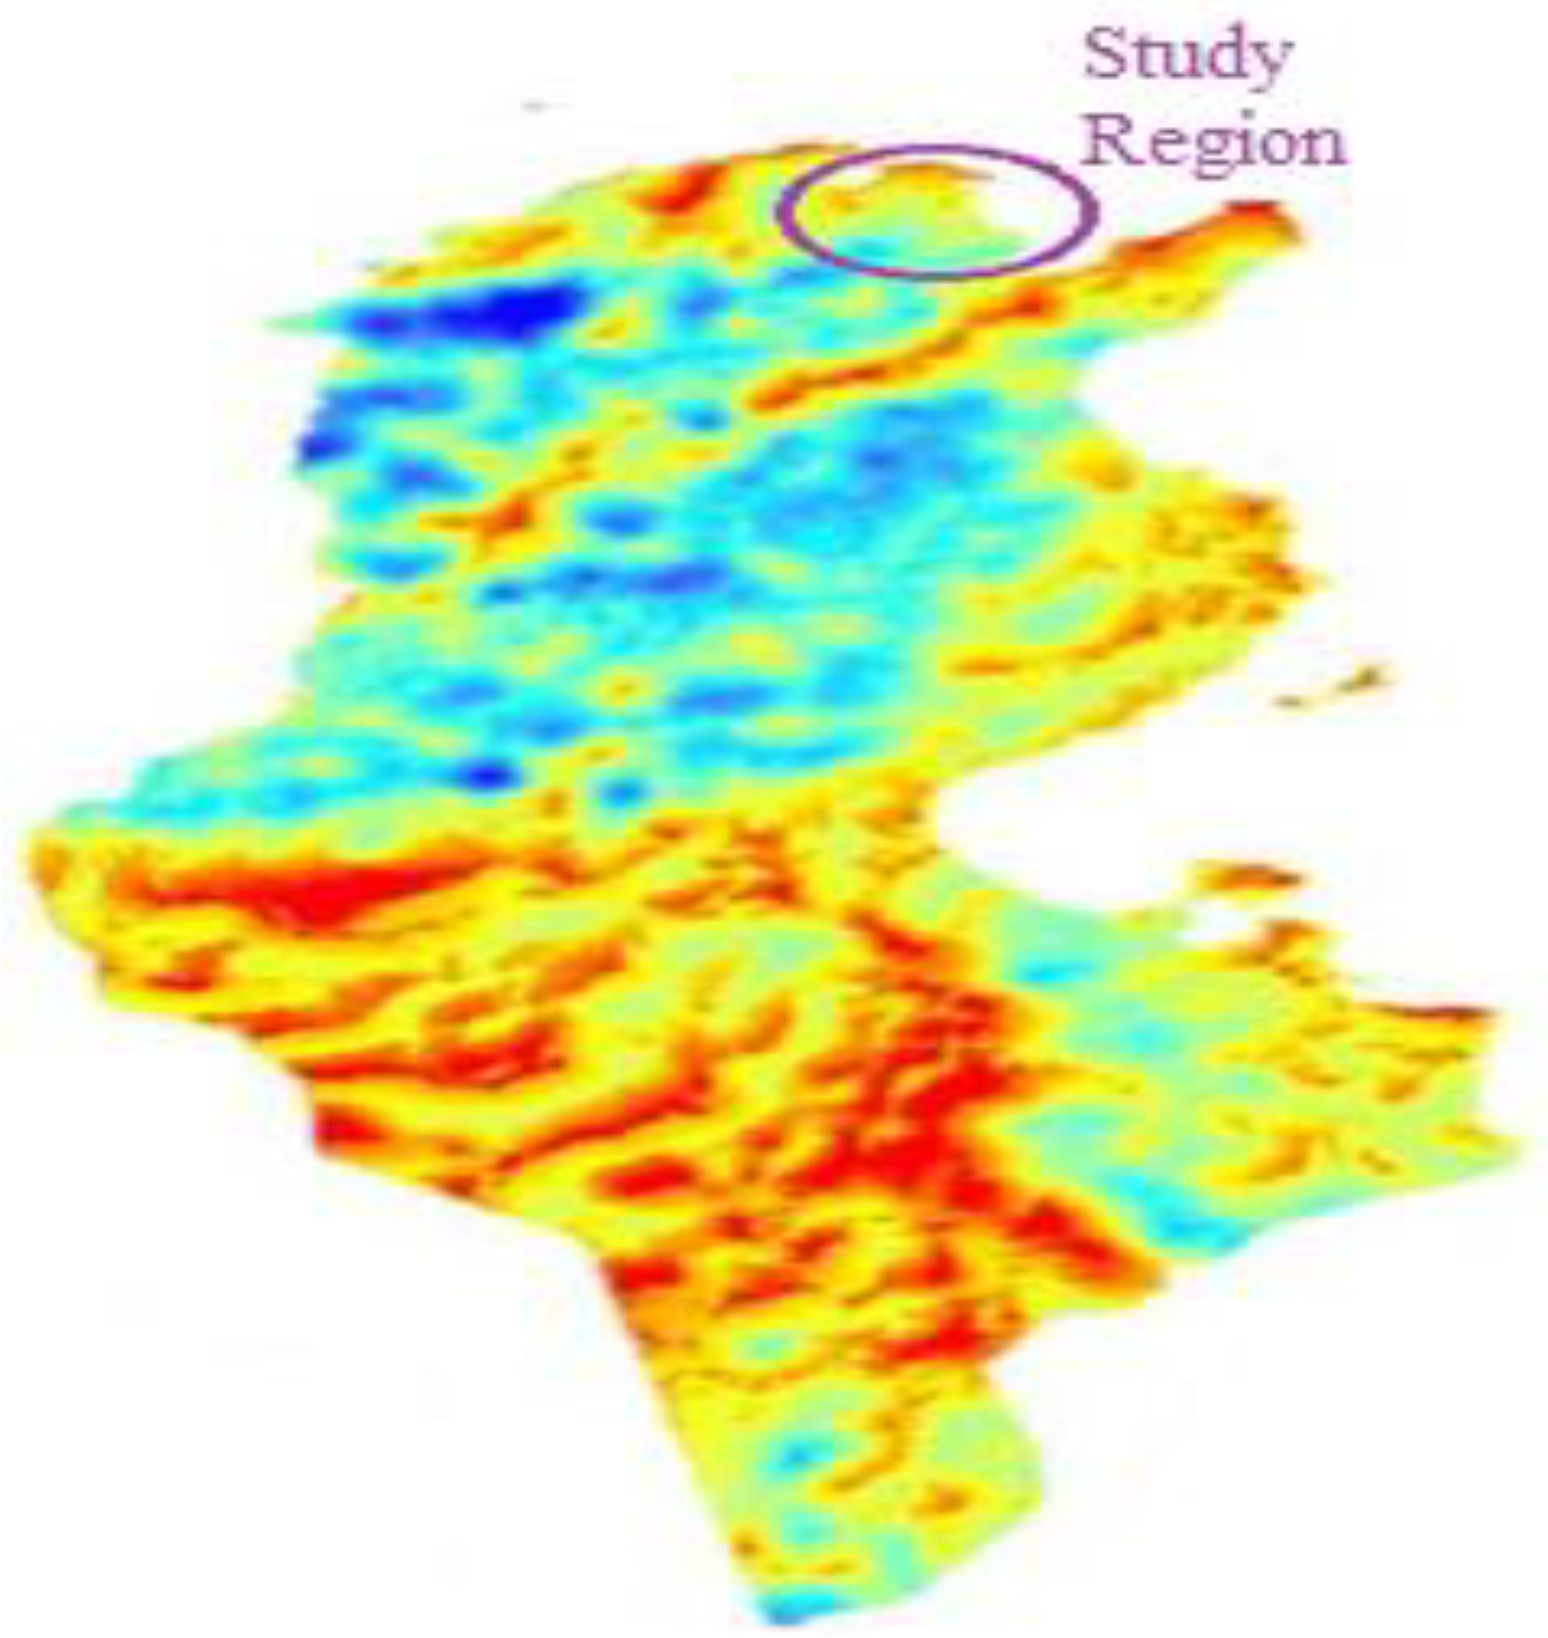
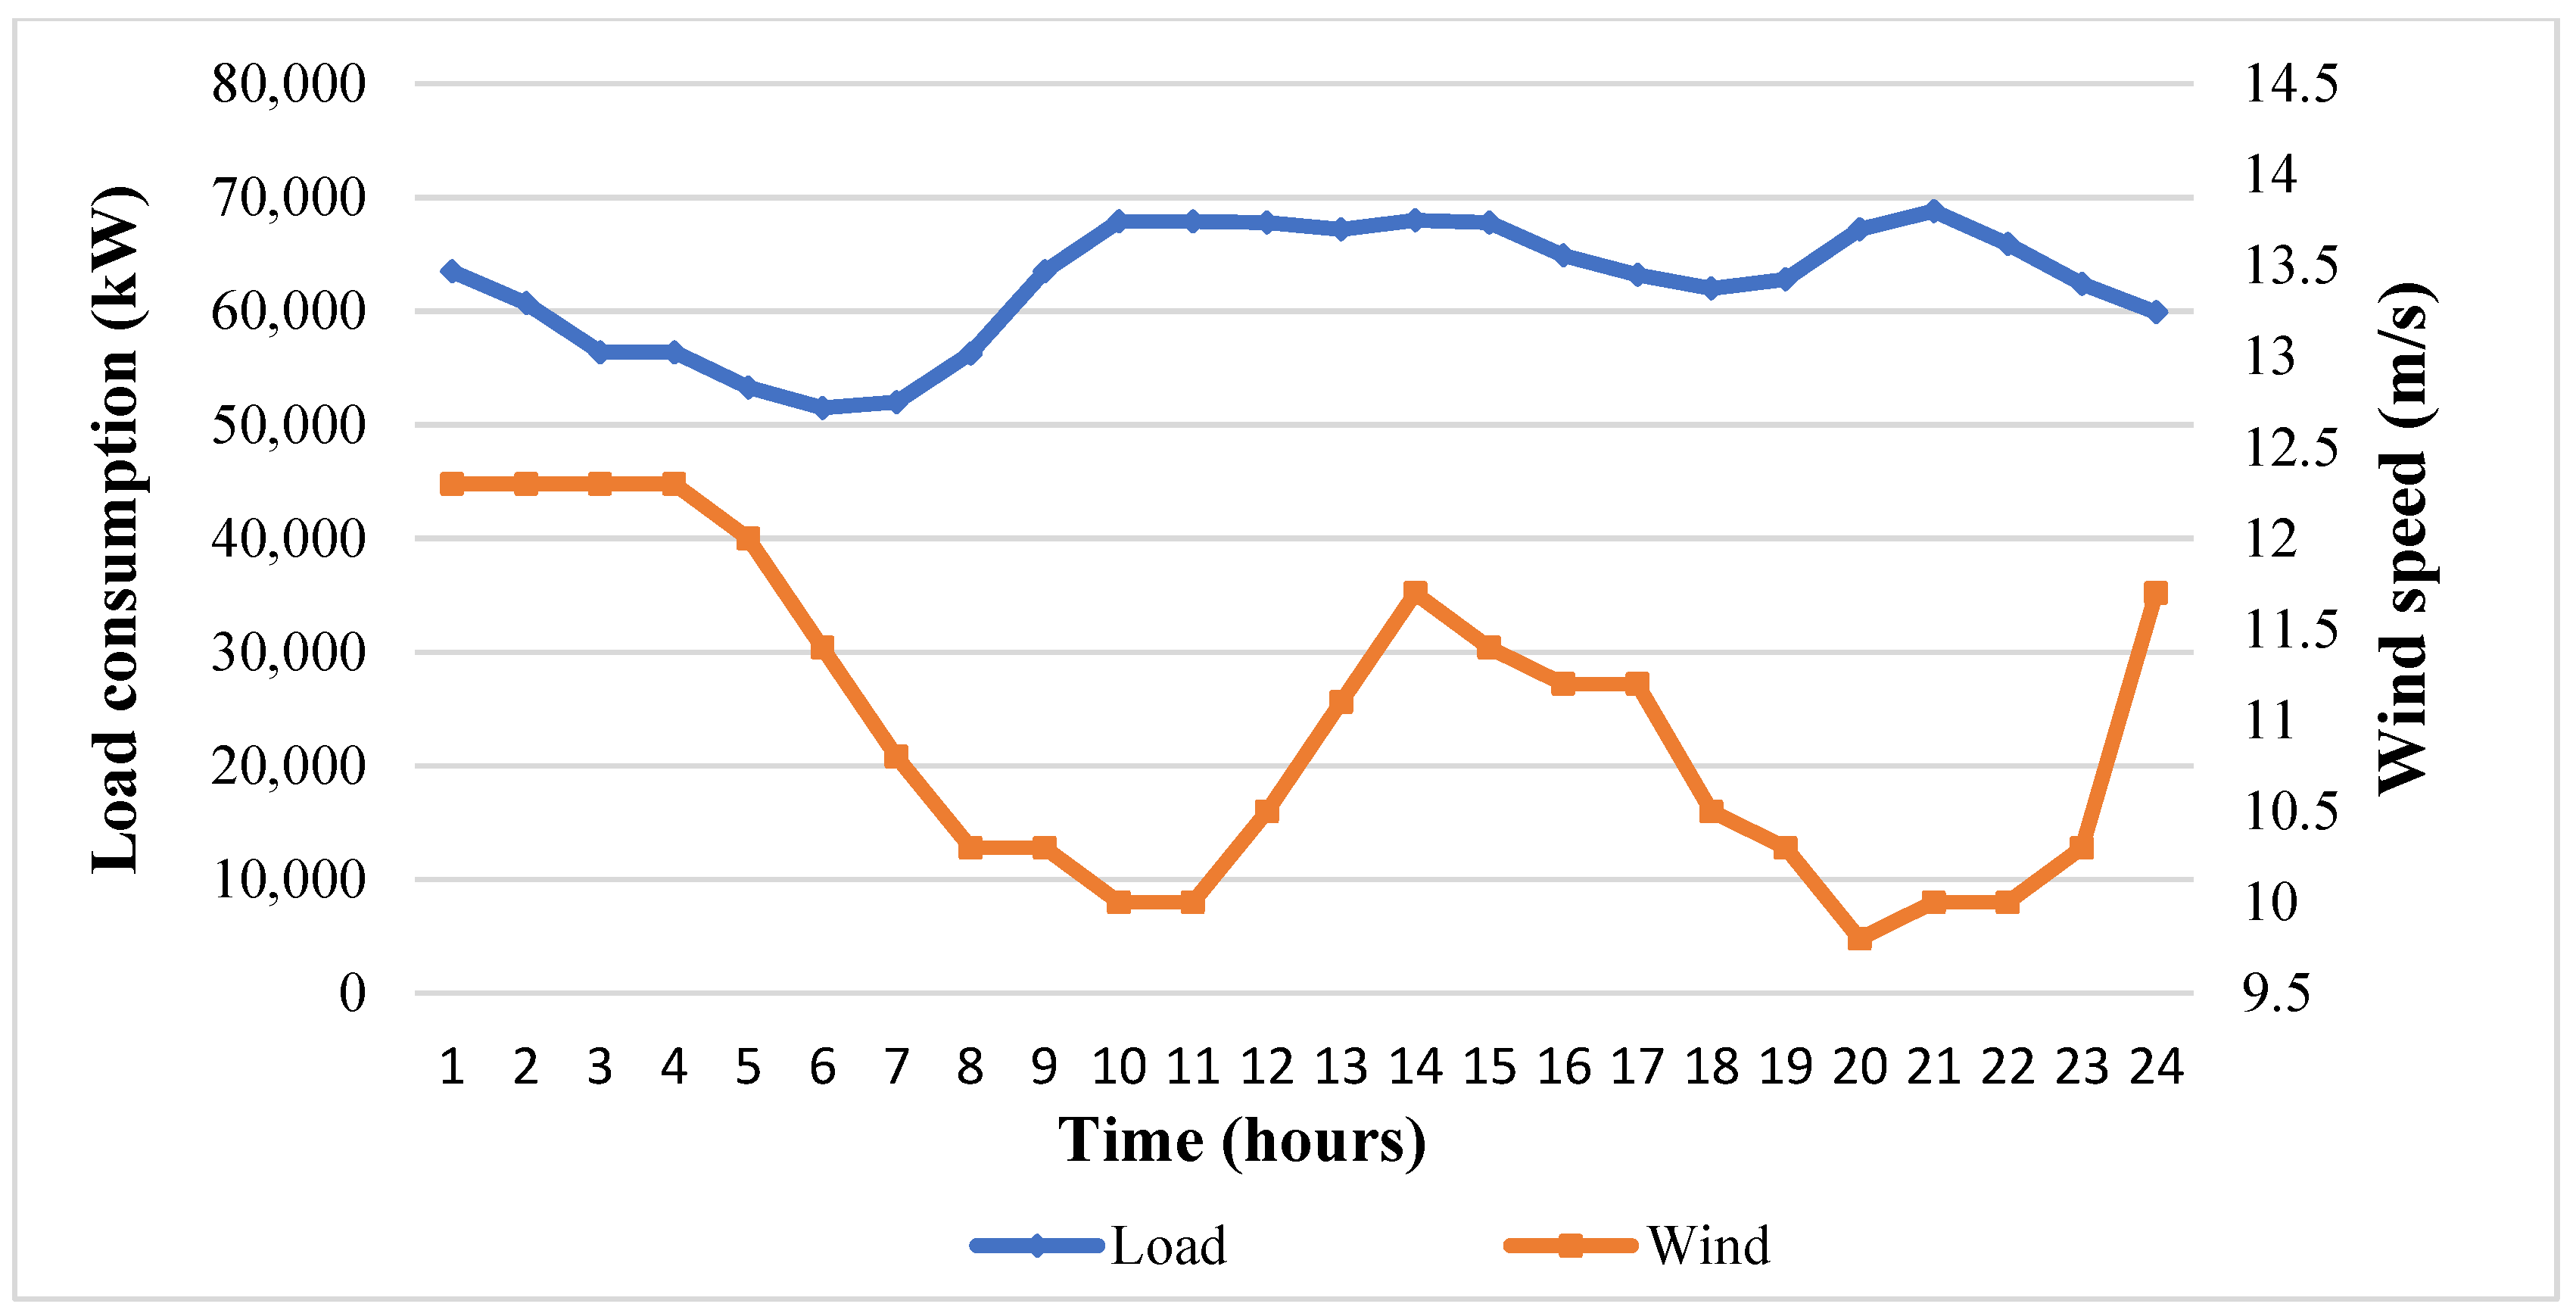
The study at this stage will be based on the results of our previous work made in [52], presenting a temporal estimation of wind power production during the day, as shown in Figure 15. This estimation procedure was made based on the meteorological data from the Metline/Tunisia region (characterized by wind fluctuation as shown in Figure 16) and on the parameters of the chosen wind system (MADA). In fact, the meteorological data are essentially the evolution of the daily load consumption and the variation of the wind speed in this study region collected on 4 February 2020 as mentioned in Figure 17.
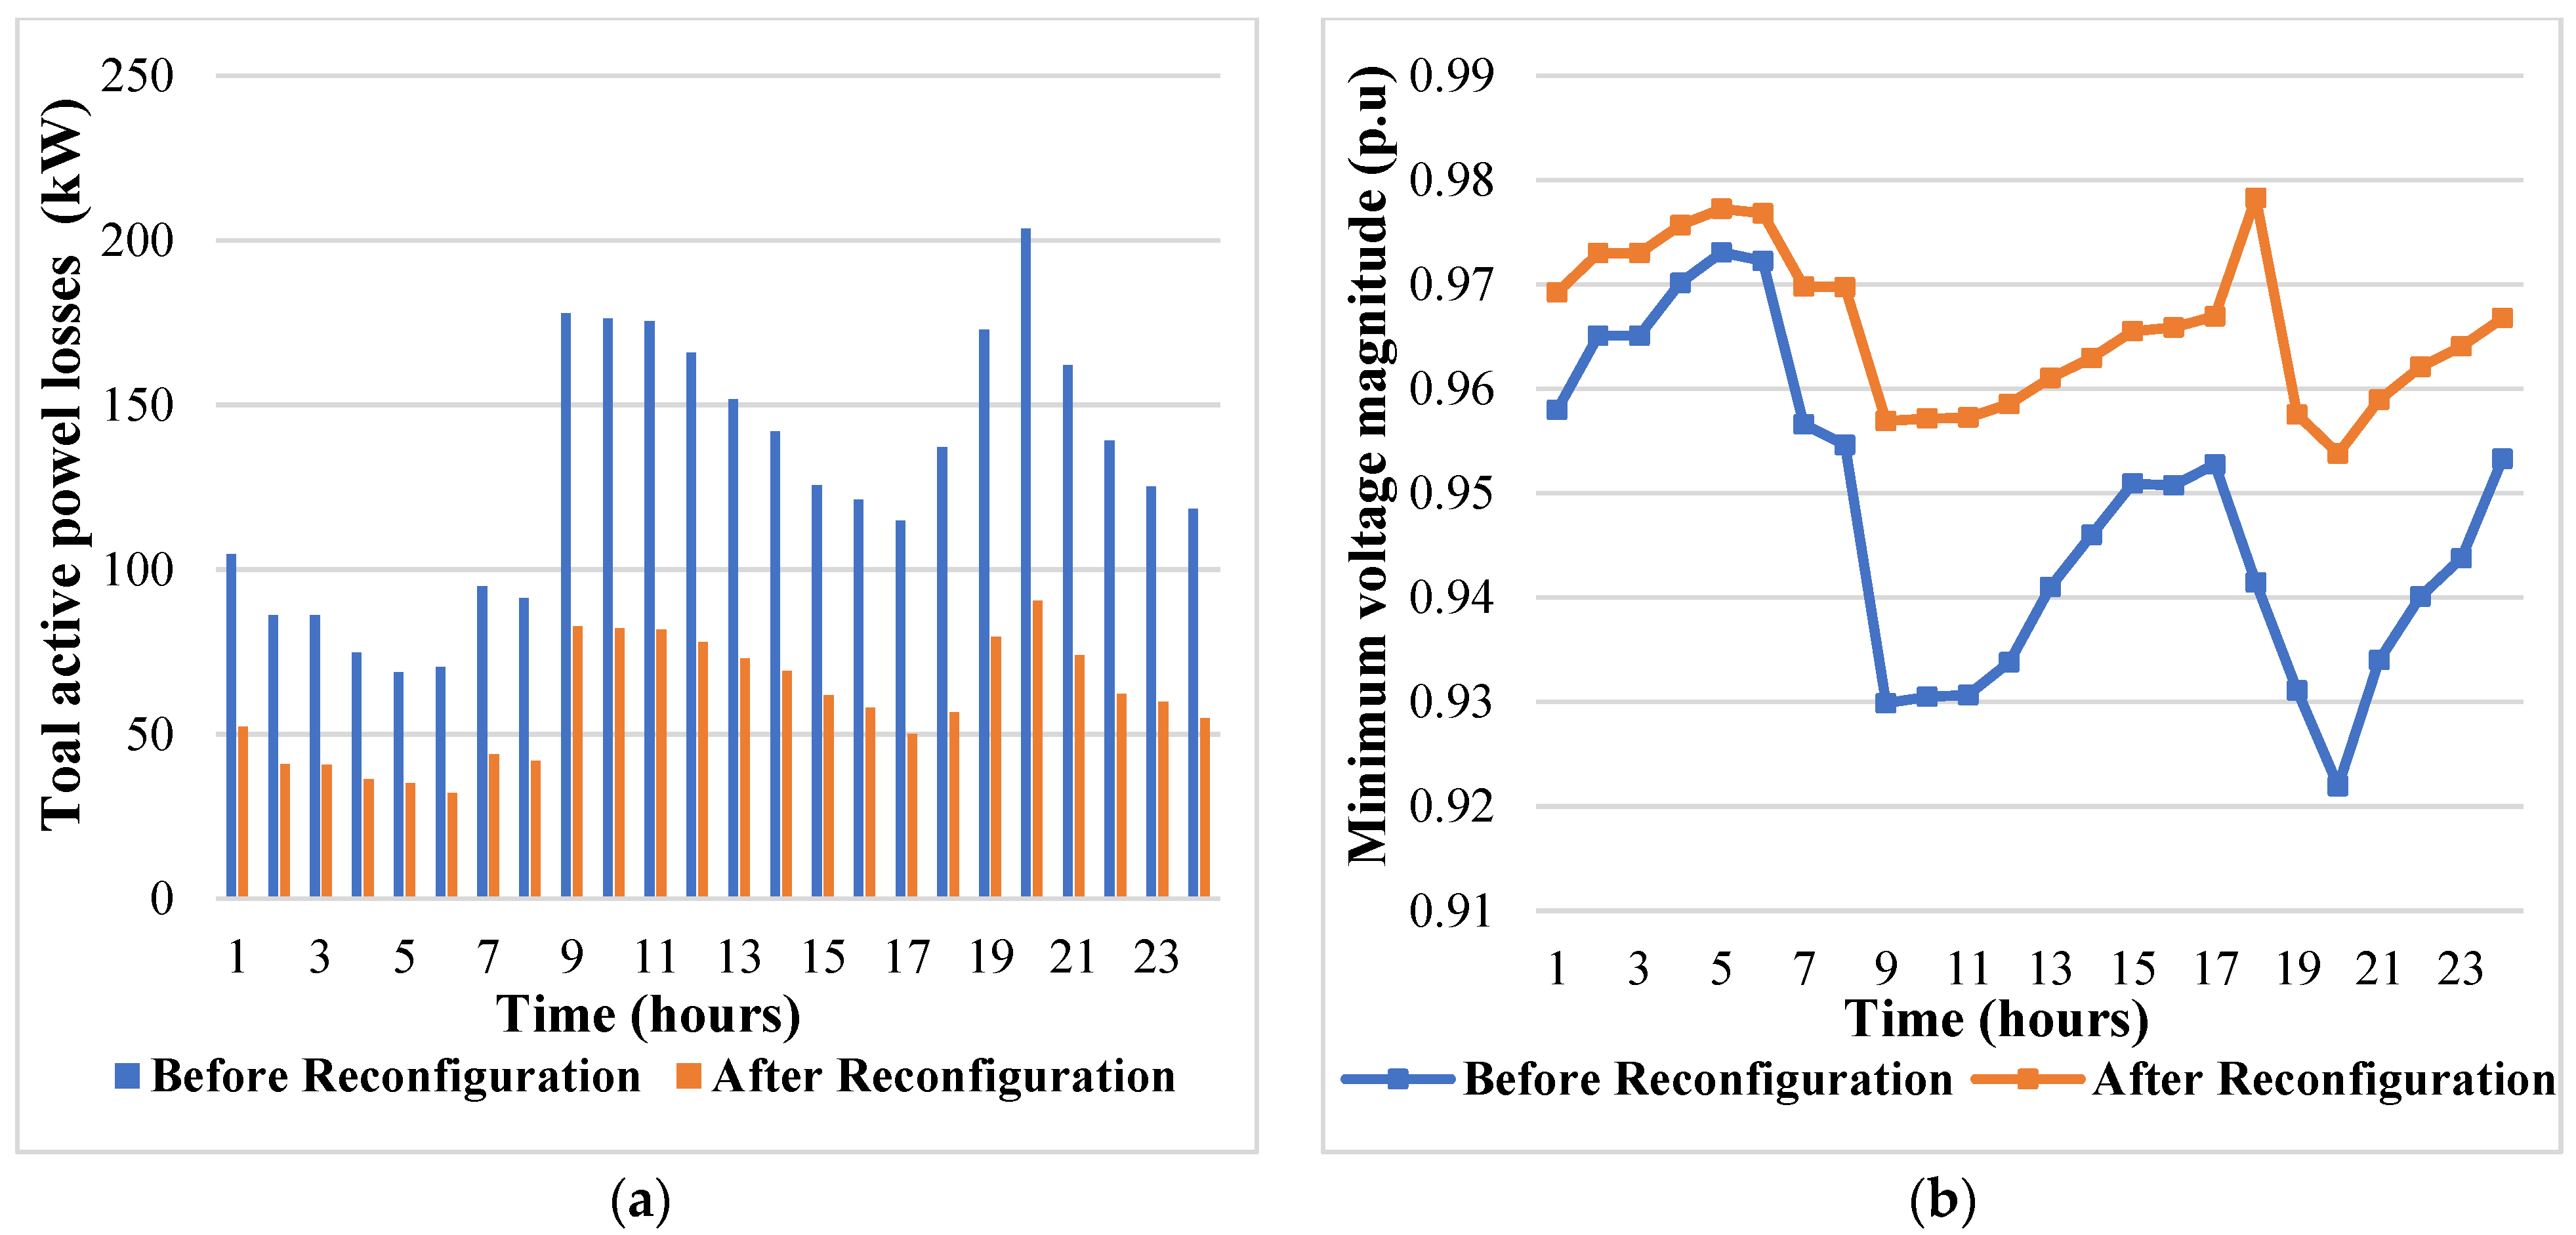
After achieving the simulation of this fifth scenario, all results obtained following this DR are recapitulated in Table 5 and Figure 18.
From Table 5, it can be seen that the best TAPL reduction following the DRRDN for IEEE 69-Bus System with a stochastic integration of WTDG is in the order of 58,69104%, with a clear amelioration of MVV up to 0.9783 pu at 18:00 of the test day. Hence, the optimal topology chosen for this scenario is that of the state vector X= [69, 16, 12, 55, 63]. Figure 18a,b show that the objective functions of TAPL and minimum voltage variation are clearly optimized.
According to this table and by focusing on hour 08.00 of the study day, which is characterized by a constant value of load consumption, we notice that following an optimal insertion of WTDG, and even before the ORRDN, there is a significant decrease in TAPL from an initial value equal to 225 kW to an optimal value equal to 91 kW. There is also an important improvement in the MVV from the value of 0.9092 pu to a better value of 0.9546 pu. This clearly justifies the positive effect of the optimal integration of WTDG on the tested DN performances.
Broadly speaking, to the best of the authors’ knowledge, the DRRDN based on the SAMPSO optimization method used throughout this manuscript remains valid for any other region or day of study. Therefore, for any other meteorological data (daily load consumption curve and/or temporal variation of the wind speed curve taken during the same day and from the same study area), the optimal reconfiguration methodology remains the same and leads to convincing results. In fact, by changing the two curves of Figure 17, it is only necessary to make another estimate of the wind power produced as presented in [52] and to keep the same proposed reconfiguration technique.

5. Conclusions

This paper presented a new approach combining the proposed hybrid SAMPSO method with the MATPOWER calculation toolbox for both SRRDN and DRRDN. The proposed approach was applied to the standard IEEE 69-bus RDN with the aim of improving the VP and reducing TAPL for the SRRDN problem and to reduce TAPL, improving MVV, and also minimizing SCC for the DRRDN. The effectiveness of the suggested SAMPSO technique was verified and validated by comparison with the MPSO method under several operating constraints.
Moreover, by investigating five scenarios, it was demonstrated that the topology identified as optimal for the SR (scenarios I, II, and III), from an economic point of view, is no longer optimal over an entire time interval (scenarios IV and V). So that the dynamic analysis, with the calculation of the DRRDN at each time interval, makes it possible to identify several configurations and to choose the one which leads to the most optimal solution corresponding to the best objective function.
On the basis of the promising findings presented in this study which are encouraging and clearly reflect the quality of this study, work on other remaining issues is continuing and will be presented in future papers.

Author Contributions

Conceptualization, R.S., I.K. and T.G.; methodology, R.S., I.K. and R.N.; software, I.K. and R.S.; validation, T.G., B.M.A. and K.T.; formal analysis, T.G., K.A. and A.S.A.; investigation, B.M.A., A.S.A. and R.N.; resources, R.N.; writing—original draft preparation, R.S., I.K. and T.G.; supervision, R.N.; project administration, T.G.; funding acquisition, T.G. All authors have read and agreed to the published version of the manuscript.

Funding

This research was funded by the Deanship of the Scientific Research of the University of Ha’il, Saudi Arabia (project: RG-20 075).

Institutional Review Board Statement

Not applicable.

Informed Consent Statement

Not applicable.

Data Availability Statement

Not applicable.

Conflicts of Interest

The authors declare no conflict of interest.

References

  1. Ghaeth, F.; Omar, I.F.; Josef, T. Voltage regulation and power losses reduction in a wind farm integrated MV distribution network. J. Electr. Eng. 2018, 69, 85–92. [Google Scholar]
  2. De Jesús, J.S.J.; Jesús, M.L.L. Alternative methodology to calculate the directional characteristic settings of directional overcurrent relays in transmission and distribution networks. Energies 2019, 12, 3779. [Google Scholar]
  3. Danilo, S.Z.S.; María, L.L.J.; Nicolás, M.G. Optimal coordination of overcurrent relays in microgrids considering a non-standard characteristic. Energies 2020, 13, 922. [Google Scholar]
  4. Sushrut, T.H.; Vijay, A.S.; Suryanarayana, E.D. System reconfiguration in microgrids. Sustain. Energy Grids Netw. 2019, 17, 100191. [Google Scholar]
  5. García-Montoya, C.A.; López-Lezama, J.M. Caracterización del Costo de Distribución de Energía Eléctrica Mediante Modelos de Fronteras de Eficiencia considerando un Indicador de Calidad del Servicio. Inf. Tecnológica 2017, 28, 37–46. [Google Scholar] [CrossRef]
  6. Gregorio, M.D.; Javier, C.; José, M.A. Distribution system expansion planning considering non-utility-owned DG and an independent distribution system operator. IEEE Trans. Power Syst. 2019, 34, 2588–2597. [Google Scholar]
  7. Chaorui, Z.H.; Jiayong, L.I.; Jun, Z.H.Y. Optimal location planning of renewable distributed generation units in distribution networks: An analytical approach. IEEE Trans. Power Syst. 2017, 33, 2742–2753. [Google Scholar]
  8. Meisam, M.; Haes, A.L.H.; Nikos, D.H.A. An efficient mathematical model for distribution system reconfiguration using AMPL. IEEE Access 2021, 9, 79961–79993. [Google Scholar]
  9. Meisam, M.; Rubén, R. Reconfiguration of radial distribution systems: An efficient mathematical model. IEEE Lat. Am. Trans. 2021, 19, 1172–1181. [Google Scholar]
  10. Mohamed, A.A.B.; Zeinab, H.O.; Mostafa, E.L. New analytical approach for simultaneous feeder reconfiguration and DG hosting allocation in radial distribution networks. Ain Shams Eng. J. 2021, 12, 1823–1837. [Google Scholar]
  11. El-Ela, A.A.A.; El-Sehiemy, R.A.; Shaheen, A.M. Optimal allocation of DGs with network reconfiguration using improved spotted hyena algorithm. WSEAS Trans. Power Syst. 2020, 15, 60–67. [Google Scholar] [CrossRef]
  12. Mohammad-Hossein, S.H.; Mahmoud-Reza, H.A.; Javad, S. Duration based reconfiguration of electric distribution networks using dynamic programming and harmony search algorithm. Int. J. Electr. Power Energy Syst. 2012, 41, 1–10. [Google Scholar]
  13. Damir, J.; Rade, Č.; Josip, V. Optimal reconfiguration of distribution networks using hybrid heuristic-genetic algorithm. Energies 2020, 13, 1544. [Google Scholar]
  14. Thanh, N.T.; Trung, N.T.; Anh, T. Viet Multi-objective electric distribution network reconfiguration solution using runner-root algorithm. Appl. Soft Comput. 2017, 52, 93–108. [Google Scholar]
  15. Wang, X.; Liu, X.; Jian, S.; Peng, X.; Yuan, H.A. distribution network reconfiguration method based on comprehensive analysis of operation scenarios in the long-term time period. Energy Rep. 2021, 7, 369–379. [Google Scholar] [CrossRef]
  16. Dieu, V.O.; Nguyen, A.T. Distribution network reconfiguration for power loss reduction and voltage profile improvement using chaotic stochastic fractal search algorithm. Complexity 2020. [Google Scholar] [CrossRef]
  17. Shaheen, A.M.; ElsayedbRaga, A.M.; El-Sehiemy, A.; Abdelaziz, A.Y. Equilibrium optimization algorithm for network reconfiguration and distributed generation allocation in power systems. Appl. Soft Comput. 2021, 98, 106867. [Google Scholar] [CrossRef]
  18. Afshin, F.; Mohammad, H.; Brent, S.T. Equilibrium optimizer: A novel optimization algorithm. Knowl. Based Syst. 2020, 191, 105190. [Google Scholar]
  19. Josephy, D.S.; Frederico, M.; Negrete, G.; Paola, L. A Novel Solution Method for the Distribution Network Reconfiguration Problem Based on a Search Mechanism Enhancement of the Improved Harmony Search Algorithm. Energies 2022, 15, 2083. [Google Scholar]
  20. Liu, Q.; Ji, X.; Wang, H. Dynamic reconfiguration of active distribution system based on matrix shifting operation and interval merger. J. Electr. Eng. Technol. 2020, 15, 621–633. [Google Scholar] [CrossRef]
  21. Ali, J.N.; Manoochehr, B.; Saber, A.N. Meta-heuristic matrix moth–flame algorithm for optimal reconfiguration of distribution networks and placement of solar and wind renewable sources considering reliability. Environ. Technol. Innov. 2020, 20, 101118. [Google Scholar]
  22. Amirreza, N.; Zulkurnain, A.M.; Masoud, V. Zahedi Optimal, reliable and cost-effective framework of photovoltaic-wind-battery energy system design considering outage concept using grey wolf optimizer algorithm—Case study for Iran. IEEE Access 2019, 7, 182611–182623. [Google Scholar]
  23. Morad, A. Distribution network reconfiguration using a genetic algorithm with varying population size. Electr. Power Syst. Res. 2017, 142, 9–11. [Google Scholar]
  24. Usharani, R.; Sivkumar, M. An improved sine–cosine algorithm for simultaneous network reconfiguration and DG allocation in power distribution systems. Appl. Soft Comput. 2020, 92, 106293. [Google Scholar]
  25. Raoni, P.; Zocimo, Ñ.; Yuri, M. Radial distribution network reconfiguration for power losses reduction based on improved selective BPSO. Electr. Power Syst. Res. 2019, 169, 206–213. [Google Scholar]
  26. Shukla, J.; Panigrahi, B.K.; Ray, P.K. Stochastic reconfiguration of distribution system considering stability, correlated loads and renewable energy based DGs with varying penetration. Sustain. Energy Grids Netw. 2020, 23, 100366. [Google Scholar] [CrossRef]
  27. Amirreza, N.; Aldrin, A.B.; Hedayati, M.M. An improved corona-virus herd immunity optimizer algorithm for network reconfiguration based on fuzzy multi-criteria approach. Expert Syst. Appl. 2022, 187, 115914. [Google Scholar]
  28. Zhai, H.F.; Yang, M.; Chen, B.; Kang, N. Dynamic reconfiguration of three-phase unbalanced distribution networks. Int. J. Electr. Power Energy Syst. 2018, 99, 1–10. [Google Scholar] [CrossRef]
  29. Gerez, C.; Coelho Marques Costa, E.; Sguarezi Filho, A.J. Distribution Network Reconfiguration Considering Voltage and Current Unbalance Indexes and Variable Demand Solved through a Selective Bio-Inspired Metaheuristic. Energies 2022, 15, 1686. [Google Scholar] [CrossRef]
  30. Hadidian, M.M.J.; Akhtar, K.; Juan, S.H. A new model for reconfiguration and distributed generation allocation in distribution network considering power quality indices and network losses. IEEE Syst. J. 2020, 14, 3530–3538. [Google Scholar]
  31. Ibrahim, A.I.; Hamdy, A.; Nagi, F. Radial distribution network reconfiguration for power losses reduction using a modified particle swarm optimisation. CIRED-Open Access Proc. J. 2017, 1, 2505–2508. [Google Scholar]
  32. Priyesh, K. Network reconfiguration of distribution system using particle swarm optimization. Int. J. Eng. Comput. Sci. 2016, 5, 17369–17374. [Google Scholar]
  33. Latreche, Y.; Bouchekara, H.R.; Kerrour, F. Comprehensive review on the optimal integration of distributed generation in distribution systems. J. Renew. Sustain. Energy 2018, 10, 055303. [Google Scholar] [CrossRef] [Green Version]
  34. Anuj, B.; Kumar, S.H.N.; Raj, S.Y. Optimal location and rating of wind power plants in competitive electricity market. J. Renew. Sustain. Energy 2017, 9, 043306. [Google Scholar]
  35. Raida, S.; Rafik, N.; Tarek, B. Enhancing radial distribution network performance by optimal reconfiguration with PSO algorithm. In Proceedings of the 16th International Multi-Conference on Systems, Signals & Devices (SSD), IEEE, Istanbul, Turkey, 21–24 March 2019; pp. 180–186. [Google Scholar]
  36. Zhu, J.; Zimmerman, R.D.; Murillo-Sanchez, C.E. MATPOWER 5.1 User’s Manual. March 2015, 14, 15–16. [Google Scholar]
  37. Duncan, G.J.; Mulukutla, S.S.; Thomas, O. Power System Analysis & Design, SI Version; Cengage Learning: Stamford, CT, USA, 2012. [Google Scholar]
  38. Jeon, Y.J.; Kim, J.C.; Kim, J.O.; Shin, J.R.; Lee, K.Y. An efficient simulated annealing algorithm for network reconfiguration in large-scale distribution systems. IEEE Trans. Power Deliv. 2002, 17, 1070–1078. [Google Scholar] [CrossRef]
  39. Kirkpatrick, S.; Gelatt, C.D., Jr.; Vecchi, M.P. Optimization by simulated annealing. Science 1983, 220, 671–680. [Google Scholar] [CrossRef] [PubMed]
  40. Eberhar, R.; Kennedy, J. A new optimizer using particle swarm theory. In Proceedings of the MHS’95, Proceedings of the Sixth International Symposium on Micro Machine and Human Science, Nagoya, Japan, 4–6 October 1995; pp. 39–43. [Google Scholar]
  41. Deng, W.; Yao, R.; Zhao, H.; Yang, X.; Li, G. A novel intelligent diagnosis method using optimal LS-SVM with improved PSO algorithm. Soft Comput. 2019, 23, 2445–2462. [Google Scholar] [CrossRef]
  42. Patel, N.K.; Suthar, B.N. Notice of Removal: Optimal reactive power dispatch using particle swarm optimization in deregulated environment. In Proceedings of the 2015 International Conference on Electrical, Electronics, Signals, Communication and Optimization (EESCO), Visakhapatnam, India, 24–25 January 2015; pp. 1–5. [Google Scholar]
  43. Sundaram, P.; Ranjit, R.O.Y. Particle swarm optimization based optimal reactive power dispatch. In Proceedings of the 2015 IEEE International Conference on Electrical, Computer and Communication Technologies (ICECCT), Coimbatore, India, 5–7 March 2015; pp. 1–5. [Google Scholar]
  44. Sellami, R.; Sher, F.; Neji, R. An improved MOPSO algorithm for optimal sizing & placement of distributed generation: A case study of the Tunisian offshore distribution network (ASHTART). Energy Rep. 2022, 8, 6960–6975. [Google Scholar]
  45. Zimmerman, R.D.; Murillo-Sánchez, C.E.; Gan, D. Matpower, PSERC. 1997. Available online: http://www.pserc.cornell.edu/matpower (accessed on 7 March 2022).
  46. Daniel, Z.R.; Edmundo, M.S.C.; John, T.H.R. MATPOWER: Steady-state operations, planning, and analysis tools for power systems research and education. IEEE Trans. Power Syst. 2010, 26, 12–19. [Google Scholar]
  47. TranaKho, T.T.; Truong, H.; Vo, D.N. Stochastic fractal search algorithm for reconfiguration of distribution networks with distributed generations. Ain Shams Eng. J. 2020, 11, 389–407. [Google Scholar]
  48. Vannak, V.; Sievlong, S.; Rathana, L. Optimal reconfiguration in distribution systems with distributed generations based on modified sequential switch opening and exchange. Appl. Sci. 2021, 11, 2146. [Google Scholar]
  49. Sirine, E.S.; Adel, K.H. Optimization of distribution system operation by network reconfiguration and DG integration using MPSO algorithm. Renew. Energy Focus 2020, 34, 37–46. [Google Scholar]
  50. Usharani, R.; Sivkumar, M. An improved Elitist–Jaya algorithm for simultaneous network reconfiguration and DG allocation in power distribution systems. Renew. Energy Focus 2019, 30, 92–106. [Google Scholar]
  51. Hamouda, A.M.; Mohammed, M.E.; Elsaied, O. Optimal Network Reconfiguration Incorporating with Renewable Energy Sources in Radial Distribution Networks. Int. J. Adv. Sci. Technol. 2020, 29, 3114–3133. [Google Scholar]
  52. Raida, S.; Nahla, B.H.; Imen, K.H. Optimal network reconfiguration following hourly variations of load demand and wind generation. J. Electr. Syst. 2020, 16, 146–162. [Google Scholar]
Figure 1. Three-loop network.
Sustainability 14 11208 g001
Figure 2. MATPOWER process.
Sustainability 14 11208 g002
Figure 3. Flowchart of SAMPSO optimal reconfiguration of the RDN.
Sustainability 14 11208 g003
Figure 4. Results of the ORRDN for the IEEE 69-bus system: (a) Initial Topology and (b) Optimal Topology.
Sustainability 14 11208 g004
Figure 5. Convergence characteristics of the OF using MPSO and SAMPSO optimization methods.
Sustainability 14 11208 g005
Figure 6. VP following the SAMPSO reconfiguration of IEEE 69-bus RDN (scenario 1).
Sustainability 14 11208 g006
Figure 7. Active power losses at each branch following the SAMPSO Reconfiguration of IEEE 69-bus RDN (scenario 1).
Sustainability 14 11208 g007
Figure 8. Results of the ORRDN for the IEEE 69-bus system with DGs Integration: (a) Initial Topology and (b) Optimal Topology.
Sustainability 14 11208 g008
Figure 9. The VP following the SAMPSO reconfiguration of IEEE 69-bus RDN with and without DG injection.
Sustainability 14 11208 g009
Figure 10. Active power losses at each branch following the SAMPSO reconfiguration of IEEE 69-bus RDN (scenario 2).
Sustainability 14 11208 g010
Figure 11. The VP following the SAMPSO reconfiguration of IEEE 69-bus RDN (scenario 3): (a) Light Load and (b) Heavy Load.
Sustainability 14 11208 g011
Figure 12. Active power losses at each branch following the SAMPSO reconfiguration of IEEE 69-bus RDN (scenario 3): (a) Light Load and (b) Heavy Load.
Sustainability 14 11208 g012
Figure 13. Stochastic variation of daily load consumption during 04/02/2020 [52].
Sustainability 14 11208 g013
Figure 14. Hourly variation of the objective function for scenario 4: (a) TAPL and (b) Minimum voltage variation.
Sustainability 14 11208 g014
Figure 15. Result of the temporal estimation of wind power production of the WTDG.
Sustainability 14 11208 g015
Figure 16. Tunisian Atlas of the wind at 80 m height according to ANME.
Sustainability 14 11208 g016
Figure 17. Temporal evolution of the daily load consumption and variation of the wind speed in the Metline region.
Sustainability 14 11208 g017
Figure 18. Temporal variation of the objective function following the DRRDN for IEEE 69-Bus System with Stochastic Integration of WTDG (scenario 5): (a) TAPL and (b) Minimum voltage variation.
Sustainability 14 11208 g018
Table 1. Results of the ORRDN for IEEE 69-Bus System (scenario 1).
Optimal ReconfigurationOpen Switches Min. Voltage (pu)TAPL (KW)TAPL Reduction (%)TAPL Saving (KW)
Initial Topology69, 70, 71, 72, 730.9092225.0007--
Optimal TopologyHSA method in [47]14, 55, 61, 65, 700.942899.5955.74125.4107
SSOE method in [48]13, 57, 61, 69, 700.942899.6955.68125.3107
MPSO method in [49]14, 58, 61, 69, 700.952398.8656.062126.14
BSPSO method in [50]14, 56, 61, 69, 700.949598.6056.18126.4007
SA method in [51]12, 19, 56, 63, 690.941096.9756.9128.0307
Proposed SAMPSO10, 17, 46, 56, 650.953085.683761.91139.317
Table 2. Comparative results of the ORRDN for IEEE 69-Bus System.
SAMPSO
Reconfiguration
TAPL (kW)TRPL (kVAR)Min. Voltage TAPL Reduction (%)Tie-Switches
Voltage Value (pu)Bus
Num.
Case without DG IntegrationInitial Topology225,0007102.16470.909265-69, 70, 71, 72, 73
Optimal Topology85.6837113.53060.95306461.9110, 17, 45, 55, 64
Case with DG IntegrationInitial Topology71.740137.44840.97196468.1669, 70, 71, 72, 73
Optimal Topology30.890744.061940.97606486.2710, 11, 13, 57, 64
Table 3. Results of the ORRDN for IEEE 69-Bus System (scenario 3).
SAMPSO ReconfigurationResultsDifferent Load Factors
Light (0.9)Normal (1.0)Heavy (1.3)
Initial TopologyTAPL (kW)178.9448225.0007403.2863
TRPL (kVAR)81.33799102.1648182.5133
Min. volt
« Vmin »
Value (pu)0.91910.90920.8781
Bus Num.656565
Optimal TopologyTAPL (kW)72.851785.6837150.2000
TRPL (kVAR)91.2312113.5306196.6374
Min. volt
« Vmin »
Value (pu)0.95790.95300.9381
Bus Num.646464
TAPL réduction (%)59.288161.9162.7559
Tie Switchers10/17/45/56/6410/17/45/55/6410/17/45/58/64
Table 4. Results of the DRRDN for IEEE 69-Bus System (scenario 4).
HoursBefore ReconfigurationAfter ReconfigurationTAPL Reduction
(%)
Number
of Switches Changes
Tie-SwitchesTAPL
(kW)
Min. Volt
« Vmin »
Tie-SwitchesTAPL
(kW)
Min. Volt
« Vmin »
01.0069, 70, 71, 72, 73297.16390.89551269/17/45/56/64120.35270.94635959.499551
02.00252.60920.90373169/16/45/56/64104.17380.94989358.76088
3
03.00252.60920.90373110/17/45/57/64101.23580.95037459.92393
1
04.00223.18510.90955610/17/45/56/6489.986350.95322759.68085
1
05.00207.04850.91291110/17/45/58/6483.768050.95488159.54182
2
06.00211.47750.91197810/14/45/55/6486.173450.9544259.25173
3
07.00251.60890.90392369/17/45/58/64102.84540.95044459.12491
2
08.00225.00070.90918610/17/45/55/6485.683730.95304561.91864
3
09.00381.97560.88139310/17/12/57/63138.61040.93980463.71223
4
10.00381.97560.88139369/13/12/55/62121.48130.94976468.19659
4
11.00380.68490.88159610/16/45/55/64149.11050.93972860.83100
4
12.00373.13270.88278842/17/71/57/64150.2280.94026359.73872
3
13.00383.20090.88120169/17/45/55/64152.71660.93951260.14712
3
14.00380.68490.88159610/13/45/58/64150.36440.93972860.50161
5
15.00345.01470.88733569/17/71/54/63138.29980.94245859.91482
4
16.00325.09790.89066610/17/45/57/62131.94720.93867559.41309
2
17.00311.44640.89300869/17/45/57/64125.78710.94515159.61195
2
18.00320.50720.89144842/17/71/57/64130.31420.944459.34127
1
19.00373.13270.88278842/17/45/57/64151.64820.94026359.35811
2
20.00393.50860.8795979/17/45/55/64155.18060.93878460.56488
2
21.00357.0080.88537442/17/45/57/64145.52370.94149359.23798
3
22.00316.01720.89221810/13/45/56/64126.27210.94479760.04266
4
23.00288.51650.89705769/13/11/54/62105.42030.95407563.46126
5
24.00328.5520.89008241/19/71/56/64133.54460.94374459.35358
Table 5. Results of the DRRDN for IEEE 69-Bus System (scenario 5).
HoursBefore ReconfigurationAfter ReconfigurationTAPL Reduction
(%)
Number
of Switches Changes
Tie-SwitchesTAPL
(kW)
Min. Volt
« Vmin »
Tie-SwitchesTAPL
(kW)
Min. Volt
« Vmin »
01.0069, 70, 71, 72, 73104.72590.95797541/14/45/58/6452.238690.96922750.118644
02.0086.301660.9650910/16/11/56/6440.931680.97300852.57139
3
03.0086.301660.9650910/13/45/55/6440.847760.975752.66863
2
04.0074.860550.97015210/14/43/55/6436.353320.97724351.43862
4
05.0068.886440.97307542/13/45/57/6435.149140.97682548.97525
4
06.0070.502780.97226110/70/11/56/6432.244920.96980954.26432
3
07.0095.042040.95660410/14/45/55/6444.040.96974753.66261
1
08.0091.437820.95462210/14/45/58/6441.935650.95692754.13752
2
09.00177.8250.92987941/15/45/58/6482.780790.95715453.44816
2
10.00176.16840.93049442/15/45/56/6482.165750.95724553.35954
2
11.00175.4310.93067341/15/45/55/6481.847520.95855353.34489
1
12.00165.82120.93380642/15/45/55/6478.010130.96103752.95527
1
13.00151.7530.94100942/15/45/56/6473.094530.96295651.83322
0
14.00141.88460.94642/15/45/56/6469.303930.96552751.15473
2
15.00125.66440.95092742/14/45/55/6461.92050.96587950.72552
2
16.00121.180.95074769/16/45/57/6458.111020.96695152.04569
2
17.00114.90810.95277769/16/12/58/6450.036630.963856.45507
2
18.00137.08660.94144669/16/12/55/6356.629060.978358.69104
4
19.00172.74070.93111369/17/45/57/6479.709080.95755853.85623
2
20.00203.42570.92194569/14/45/56/6490.589370.95378955.46808
2
21.00161.97980.93401469/15/45/55/6474.05040.95895754.28411
3
22.00139.07310.94008310/13/45/55/6462.30700.96210155.19831
4
23.00125.23720.94378715/42/45/58/6459.80450.9640852.247
5
24.0054.944080.9532910/14/45/56/6454.944080.96678753.5728
Publisher’s Note: MDPI stays neutral with regard to jurisdictional claims in published maps and institutional affiliations.