Article

A Conflict Measures-Based Extreme Value Theory Approach to Predicting Truck Collisions and Identifying High-Risk Scenes on Two-Lane Rural Highways

1
School of Traffic Engineering, Kunming University of Science and Technology, Kunming 650500, China
2
Yunnan Engineering Research Center of Modern Logistics, Kunming University of Science and Technology, Kunming 650504, China
*
Author to whom correspondence should be addressed.
Sustainability 2022, 14(18), 11212; https://doi.org/10.3390/su141811212
Submission received: 24 July 2022 / Revised: 30 August 2022 / Accepted: 3 September 2022 / Published: 7 September 2022
(This article belongs to the Special Issue Sustainable Transportation and Road Safety)

Abstract

:
Collision risk identification and prediction is an effective means to prevent truck accidents. However, most existing studies focus only on highways, not on two-lane rural highways. To predict truck collision probabilities and identify high-risk scenes on two-lane rural highways, this study first calculated time to collision and post-encroachment time using high-precision trajectory data and combined them with extreme value theory to predict the truck collision probability. Subsequently, a traffic feature parameter system was constructed with the driving behavior risk parameter. Furthermore, machine learning algorithms were used to identify critical feature parameters that affect truck collision risk. Eventually, extreme value theory based on time to collision and post-encroachment time incorporated a machine learning algorithm to identify high-risk truck driving scenes. The experiments showed that bivariate extreme value theory integrates the applicability of time to collision and post-encroachment time for different driving trajectories of trucks, resulting in significantly better prediction performances than univariate extreme value theory. Additionally, the horizontal curve radius has the most critical impact on truck collision; when a truck is driving on two-lane rural highways with a horizontal curve radius of 227 m or less, the frequency and probability of collision will be higher, and deceleration devices and central guardrail barriers can be installed to reduce risk. Second is the driving behavior risk: the driving behavior of truck drivers on two-lane rural highways has high-risk, and we recommend the installation of speed cameras on two-lane rural roads to control the driving speed of trucks and thus avoid dangerous driving behaviors. This study extends the evaluation method of truck collisions on two-lane rural highways from univariate to bivariate and provides a basis for the design of two-lane rural highways and the development of real-time dynamic warning systems and enforcement for trucks, which will help prevent and control truck collisions and alleviate safety problems on two-lane rural highways.

1. Introduction

1.1. Background

Two-lane roads constitute a major portion of the rural highway system in most countries. However, limited by the unified design standards, complex terrain conditions, and insufficient construction funds, two-lane rural roads have few safety facilities, low traffic service levels, and other defects, resulting in poor safety performance. Statistically, are approximately 60% of fatal road crashes in Europe take place on two-lane rural highways [1], and traffic crashes on two-lane rural highways account for more than 15% of highways in China [2]. Meanwhile, road characteristics, traffic flow, lighting environment, and other conditions differ between rural and urban highways, and there is a distinct difference in the severity of vehicle crashes on rural and urban highways [3,4]. Champahom et al. [3] found a distinct difference in the severity of vehicle crashes on rural and urban highways. Chen et al. [5] found that collisions caused more fatalities on rural highways than urban highways. According to statistics from China, rural highway fatalities were about two to three times higher than urban highway fatalities between 2006 and 2016 [6]. In Oregon, the total number of crashes in 2015 was 44,523 on urban highways, with 156 fatalities, while the total number of crashes on rural highways was roughly one-fourth (10,633) of that reported on urban highways; however, the fatalities were twice as high (254) as on urban highways [7]. Clearly, collisions on rural highways are more severe and result in more fatalities than collisions on urban highways. Moreover, two-lane rural highways have narrow roads, large longitudinal slopes, small turning radius, and a high proportion of trucks; trucks also have risk factors such as high center of gravity positions, large load capacities, high kinetic energy, and large volume. Chen et al. [5] found that truck participation was the primary cause of serious injuries from collisions. Consequently, the mixing of trucks into the traffic flow poses a major safety hazard on two-lane rural highways [2].

1.2. Literature Review

1.2.1. Truck Traffic Safety

Research into truck traffic safety has a long history. Scholars have primarily explored truck traffic accidents from the perspective of driver physiology and psychology [8], vehicle type [9], road conditions [10], driving environment [11,12], and traffic management measures [13]. For example, Xu et al. [10] analyzed the effect of horizontal curves on truck rollover crashes and found that the worst turning condition of trucks was from the inside to the outside of the curve. Wang et al. [14] found remarkable differences between truck crashes and non-truck crashes when exploring the spatiotemporal stability in truck crashes and non-truck crashes. Recently, there has been an increasing interest in the interaction mechanism between trucks and other vehicles. Hyun et al. [15] analyzed the collision risk during vehicle–truck interactions and found that collisions were more likely to occur in light traffic when non-trucks followed trucks. Meng et al. [9] investigated the role of the presence and prevalence of trucks of various classes on the severity of non-truck-involved crashes and found that different truck types contribute differently to non-truck crash severity. Dhwani et al. [16] analyzed driver avoidance behavior and the effect of trucks on non-truck rear-end risk, and it was found that large trucks obstructed the vision of non-truck drivers and delayed their avoidance actions. The above studies mainly focus on highways or urban roads, while studies on truck safety on two-lane rural highways are relatively rare. Due to the frequency and severity of truck traffic accidents, truck traffic safety on two-lane rural highways has become an urgent problem to be solved. In addition, traffic conflict theory is gradually replacing historical accident data in traffic safety research, as truck crash data are challenging to collect.

1.2.2. Collision Prediction Based on Traffic Conflict Measures

Traffic conflict measures have been widely used as a surrogate safety measure for traffic crashes [17]. Many studies have also found a strong correlation between traffic conflicts and collisions [18,19]. Currently, traffic conflict measures are usually calculated from vehicle trajectory data for collision prediction, e.g., Kyung et al. [15] used time headway as a traffic conflict measure to predict the collision probability of various types of vehicles and trucks, Hu et al. [19] used a time to collision to predict the collision probability between two adjacent vehicles, Yu et al. [20] used the modified time to collision to predict the collision probability of high-risk events between highway vehicles, and Goyani et al. [21] predicted the risk of vehicle collisions at non-signal T-intersections using post-encroachment time. However, although the current study utilizes various traffic conflict measures to capture vehicle trajectories, researchers have not further differentiated trajectories nor adequately considered the impact of different driving trajectories of vehicles on collision prediction. In addition, in the study of collision prediction based on traffic conflicts, despite being an effective tool for active traffic safety prevention and control, the subjectivity in choosing the threshold for identifying traffic conflicts and the lack of ability to consider different levels of conflict severity may cause bias in the prediction results. However, the extreme value theory uses a graphical approach to select traffic conflict thresholds and validate them, and it provides two alternative methods and models to enable the extrapolation from observed traffic conflicts to infrequent crashes. Therefore, the extreme value theory based on traffic conflicts can effectively overcome these problems. Furthermore, the estimated conflict frequency or severity, which indicates the risk level of the investigated behavior and road entities, is used to identify high-risk traffic dynamics and implement appropriate preventive measures. The applications usually take conflict indicators as dependent variables and select traffic feature parameters as independent variables to construct risk prediction models. Yet, such models are only predictions of conflict frequency or severity. They do not establish the relationship between traffic conflict and collision of traffic feature parameters, which cannot directly reflect the collision behavior. This problem was settled in a new framework proposed by Zheng et al. [22] for pre- and post-crash safety assessments based on extreme value theory. Regarding traffic feature parameters selection, traffic flow, occupancy rates, and the mean and standard deviation of speed are the most prevailing variables [23,24,25,26,27]. Sometimes, road conditions [28] and vehicle types [29] are also included in the prediction model. Meanwhile, many studies have found that horizontal bend radius has a critical effect on truck crashes [30,31,32]. However, the driver factor, which has the most significant impact on the collision, is often ignored by researchers [33,34] because the current vehicle trajectory data collection is mainly based on loop detectors [24,35,36,37] and videos taken by various means [19,20,38]. In contrast, information about the driver cannot be directly extracted from these data collection methods. It can be seen that it is necessary to incorporate driver factors into prediction models and to quantify the high-risk scenarios caused by traffic feature parameters.

1.2.3. Collision Prediction Based on Conflict Extremes Value Theory

The study of extreme value theory in traffic safety started relatively late compared to its wide application in the fields of financial economics [39], environmental scientific [40], and structural engineering [41]. Songchitruksa et al. [42] used extreme value theory to establish an extrapolation method for traffic conflict and collision relationships, making extreme value theory increasingly popular for traffic collision prediction and evaluation. Initially, the extreme value theory establishes the relationship between a single traffic conflict measure and collisions through a univariate model. Zheng et al. [22] used time-to-collision-based extreme value theory to predict left-turn collisions at expanded intersections and found a 63.9% reduction in crashes. Ali et al. [43] proposed an extreme value theory approach based on gap time for lane changing using traffic conflict techniques to examine and quantify the risk of mandatory lane-changing collisions in conventional and connected environments and found that the peaks-over-threshold model was more stable than the extreme value model. Zheng et al. [44] considered unobserved heterogeneity in intersection rear-end conflicts, developed a modified time-to-collision-based extreme value theory using a Bayesian hierarchical modeling approach, and found that the model predicted more accurately than without considering heterogeneity. In recent years, scholars have found that a single conflict measure represents only a portion of the severity of a conflict event; therefore, integrating the applicability of different traffic conflict measures can facilitate a more comprehensive prediction and assessment of collisions. Jonasson et al. [45] introduced a bivariate extreme value model combining time to collision and an explanatory variable to explore rear-end collisions with naturalistic driving. Zheng et al. [46] used a bivariate extreme value theory model combining post-encroachment time and length proportion of merging to predict collisions in the highway-entrance merge zone, and a complete modeling framework of univariate and bivariate generalized extreme value distributions and generalized pareto distributions was developed based on time to collision and post-encroachment time, and the bivariate generalized pareto distribution model was found to have the best prediction performance [47]. Arun et al. [48] used a peaks-over-threshold model to jointly model a time to collision, a modified time to collision, and a predicted change in velocity post-collision and found that binary models predicted collision probability more accurately than univariate models did. Cavadas et al. [49] developed a non-stationary bivariate extreme value model using time to collision and time headway to estimate the joint probability of frontal and rear-end collisions during overtaking on two-lane rural highways. Overall, the extreme value theory is mainly used in traffic safety evaluation of intersections and highways, yet it is rarely used for crash prediction on two-lane rural highways, and the prediction of truck crashes is almost blank. In prediction performance, the bivariate extreme value theory model is significantly better than the univariate extreme value theory model.

1.3. Objective

The objective of the study was to address the current status of insufficient research on collision prediction and risk scene assessment of trucks on two-lane rural highways. This study aims to propose a complete modeling framework for truck safety assessment on two-lane rural highways, to predict the probability of truck crashes, and identify different trajectories and high-risk driving scenes of trucks on two-lane rural highways. To achieve the goal, this study uses video trajectory data, actual traffic flow data, historic accident data, and road alignment data from which traffic conflict measures apply to different driving trajectories and traffic feature parameters considering four aspects of driver–vehicle–road–environment are extracted. Combining machine learning algorithms with extreme value theory to construct real-time prediction models of truck risk on two-lane rural highways and selecting the real-time prediction model with the best prediction performance to rank the importance of traffic feature parameters, we are able to eventually predict the probability of a crash using important feature parameters.

2. Materials and Methods

2.1. Study Area

China’s terrain is complex and diverse, with mountainous areas accounting for 69.1% of the country. Rural highways play an irreplaceable role in mountainous areas and are the infrastructure to promote the development of villages and towns. However, due to the limitation of geological and topographical conditions, the geometric route on two-lane rural highways is extremely complicated, and the traffic flow environment is mixed, especially after a truck enters the two-lane rural highway, dramatically increasing the traffic potential safety hazard of the two-lane rural highway. The truck driving environment on the two-lane rural highway is shown in Figure 1.
In this study, a two-lane rural highway located in the north-central plateau of Yunnan Province, China, from Yuanmou County to Shuangbai County, is 162 km in length and 8.5 m in width. The design speed is 60 km/h, while the limit speed is 80 km/h. It is a two-way road with modified asphalt concrete pavement and absence of center dividers. In terms of road design, the minimum radius of the flat curve is 125 m, and the maximum longitudinal slope is 7%. According to the crash data collected by traffic police, there were 4022 traffic crashes on the Yuan-Shuang rural Highway (Yuan-Shuang Highway) from 2013 to 2017, including 615 truck crashes, accounting for 15.29 % of the total crashes. Statistical analysis of truck crashes on Yuan-Shuang Highway showed that 30 people were killed, and 380 people were injured in truck crashes, accounting for 26.78% and 15.56% of the deaths and injuries, respectively.

2.2. Data Acquisition and Measures Selection

2.2.1. Data Acquisition and Extraction

(1) Drone Video Trajectory Data Acquisition
To predict collisions between trucks and conflicting vehicles on two-lane rural highways, we selected three sections with a high mixing rate of trucks on Yuan-Shuang Highway as the research objects, and the truck mixing rates of the three sections reached 12.2%, 14.4%, and 13.7%, respectively. The basic information about each section of the road is shown in Table 1. The DJI Mavic2 drone was used to photograph the study sections in clear daylight, and the photography altitude was maintained at about 200 m. After the drone landed, the data were imported into a computer and saved. Figure 2 shows a video screenshot of the traffic environment in the study sections.
(2) Drone Video Trajectory Data Extraction
First, the drone video was converted from MP4 to AVI format and imported into George2.1 video processing software. Then, when the truck and interactive vehicle were both completely on the video screen in George2.1, the reference points were added to obtain the truck and interactive vehicle IDs and image coordinates, and the image coordinates were transformed to ground coordinates by using the coordinate transformation function of George2.1, and the precision error of coordinate transformation was controlled within ±0.05 m. Next, the vehicle trajectory data were extracted at a frequency of 10 Hz until the truck and interactive vehicle completely drove out of the video screen. Finally, the trajectory data of the truck and the interactive vehicle were obtained, respectively. The attributes of the trajectory data include time, vehicle ID, lateral and vertical coordinate positions of the vehicles, speed, acceleration, etc. The complete video trajectory data of the truck and its interactive vehicle can be obtained by matching the IDs and the time of trajectory extraction of the truck and the interactive vehicle.
(3) Other Data Acquisition and Extraction
While shooting drone video, Metro Count MC5600 equipment (it is produced by Microcom in Perth, Australia) was deployed at critical locations in the study section to collect traffic flow data from the study section. Using the Metro Count MC5600 equipment, the measured data of road traffic flow were extracted, and then, the conflicting data were matched with the measured data of road traffic flow by the time of data collection. Finally, the road traffic flow data of 5 min before the occurrence of traffic conflict were extracted.
We also obtained the road alignment and traffic accident data from local traffic departments. Due to the special conditions of video data collection, we selected the truck accident data from 8:00–20:00 on sunny days, obtained a total of 431, and calculated the accident rate of trucks as 86.2 cases/year.

2.2.2. Traffic Conflict Measures

(1) Traffic Conflict Measures Selection and Calculation
The study has shown that traffic conflict is an excellent surrogate safety measure and has become the leading technology for traffic accident prediction [17]. Time to collision and post-encroachment time are the most widely used traffic conflict measures. However, time to collision and post encroachment time still have limitations: time to collision applies to conflicts on identical trajectories without adequately capturing conflicts on cross-trajectories; post-encroachment time is generally only used for collisions on cross-trajectories, and in car-following situations, if the speed of the rear vehicle is lower than that of the front vehicle, a post-encroachment time value will also be generated, while this situation cannot cause a collision. Combining different traffic conflict measures can avoid the collision prediction error caused by using a single measure; Zheng et al. [50] examined six combinations of four traffic conflict measures and found that the combination of time to collision and post-encroachment time was the most accurate prediction of collisions. Therefore, we used time to collision and post-encroachment time to predict truck collisions on two-lane rural highways. Time to collision (TTC) and post-encroachment time (PET) are calculated by:
T T C i = x i 1 ( t ) x i ( t ) L i 1 V i ( t ) V i 1 ( t )  
P E T i = T i   ( t ) T ( i 1 )   ( t )
where x i 1 ( t ) and x i ( t ) are the positions of the front and rear vehicles at time t , respectively; L i 1 is the length of the vehicle i 1 ; V i 1 ( t ) and V i ( t ) are the instantaneous speeds of the front and rear vehicles at time t , respectively; T i 1   ( t ) is the time when the rear of the front vehicle leaves the conflict line at time t ; T i ( t ) is the time when the front of the vehicle reaches the conflict line after time t .
(2) Traffic Conflict Identification and Data Extraction
The trajectory of vehicle driving, the offset, and the acceleration of each frame can be observed by the trajectory data. Therefore, in a following conflict, if there is a continuous deceleration process of the rear vehicle, the beginning of the traffic conflict depends on the starting point of the rear vehicle’s deceleration, and the completion of the deceleration represents the end of the conflict. In an overtaking conflict, the rear vehicle leaving the centerline marks the beginning of the conflict, while the vehicle returning to its original lane represents the end. The trajectory from the beginning to the end of the conflict is called the conflict trajectory, and traffic flow data for the conflict period is calculated from the conflict trajectory. In addition, this research calls a driving trajectory with a slight cross angle and very similar to an identical trajectory as an offset trajectory to distinguish it from a cross trajectory and identical trajectory. The offset trajectory is a particular cross trajectory with both cross trajectory and identical trajectory characteristics.
The trajectory data were extracted and imported into Excel. Based on Equations (1) and (2) to calculate the time-to-collision values and the post-encroachment time values simultaneously. By the definition of time to collision, we consider that there is no traffic conflict when the speed of the rear vehicle is less than that of the front vehicle, which avoids the problem of producing ineffective PET values. In this study, only vehicle interaction events with a time to collision of less than 20 s or a post-encroachment time less than 4 s were considered to exclude normal interactions between vehicles. To ensure the robustness of traffic conflicts, the ten smallest time-to-collision values and post-encroachment time values in the conflict trajectory were selected, respectively, whose average values were used as traffic conflict values. We extracted 120 conflict data, including 100 following and 20 overtaking conflicts.

2.2.3. Traffic Feature Parameters

(1) Traffic Feature Parameters Selection
It is reasonable to assume that the occurrence of a collision is a complex process caused by the interaction of multiple factors in personal traits, vehicle attributes, roadway conditions, and environmental factors. To predict the collisions between the truck and conflicting vehicle on two-lane rural highways, we constructed a system of traffic feature parameters for truck collision prediction on two-lane rural highways by fully considering the characteristics of drivers, roads, trucks, and traffic flow environment. Drone video trajectory data were used to extract the traffic flow environment at the moment of the conflict and record the length of the truck. The road traffic flow data from the Metro Count MC5600 equipment for 5 min before the traffic conflict were taken. The longitudinal slope and horizontal radius were extracted from the road alignment data. However, the driver factor cannot be extracted directly, and further calculations are required to obtain it. Details of the traffic feature parameters are shown in Table 2.
(2) Driving Behavior Risk
Drone video does not directly observe the impact of individual truck drivers’ behavior differences on driver risk. However, the driver’s driving behavior is primarily reflected in the driver’s acceleration, deceleration, and lane-changing behavior [58]. Therefore, using the truck trajectory data, we extracted a truck lateral acceleration, a truck longitudinal acceleration, and a standard deviation of two vehicles’ speed difference to represent the driving speed risk along with a truck lateral offset to characterize the driving spatial risk. On this basis, the evaluation value was determined according to the cumulative distribution function of each driving behavior risk parameter, and the weight differences of different features were considered. The quantitative evaluation model of the driving behavior risk is established as follows:
S ( x ) = 100 × j n ω j × ( 1 F j ( x j ) )
where S ( x ) is the quantitative scoring of the driving behavior risk, and the scoring range is 0~100 points; the lower the score, the more dangerous the driver’s driving behavior and the higher the driving risk; ω j is the weight of parameter j , and j n ; n is the total number of parameters; F j ( x j ) is the cumulative distribution function of parameter j .
(3) CRITIC Method
To determine the weight, we introduced the CRITIC method, an objective weighting method based on assessing the strength of parameter contrasts and conflicts between parameters. When calculating the weight, it is necessary to clarify the amount of information first, then normalize the amount of information, and finally obtain the weight of each parameter. The weight calculation formula is:
ω j = C j j = 1 n C j
where C j is the information amount of parameter j. The calculation formula of information amount is as follows:
C j = ϕ j R j = ϕ j k 1 n ( 1 r j k )
where ϕ j is the standard deviation of parameter j, that is, the contrast strength of parameter; R j is the conflict between parameter j and other parameters; r j k is the correlation coefficient between parameter j and parameter j. Therefore, utilizing the CRITIC method, we imported the data of the four parameters representing the driving behavior risk into Python to calculate the weights of each parameter. As a result, we obtained that the truck lateral acceleration is 0.26, the truck longitudinal acceleration is 0.25, the standard deviation of the two vehicles’ speed difference is 0.31, and the truck lateral offset is 0.18.

2.3. Methods

By combining traffic conflict technology and extreme value theory, this study establishes univariate and bivariate extreme value models to predict the probability of a truck collision. The classification algorithms in machine learning were used to screen important traffic feature parameters that affect truck collisions, and the extreme value was further combined with machine learning algorithms to identify high-risk driving scenes.

2.3.1. Extreme Value Theory Modeling Approach

Extreme value theory is mainly used to analyze the occurrence probability and statistical distribution of extremely-small-probability events in random processes. It is divided into a block maximum model and a peaks-over-threshold model. This study follows the findings of most previous studies that compared different extreme value theory approaches for traffic safety applications [43,47,48]. These studies suggest that the peaks-over-threshold approach is more reliable than other methods, especially for short observation periods. Therefore, this study used the peaks-over-threshold model to predict truck collisions on two-lane rural highways. The basic idea of using traffic conflict to establish the peaks-over-threshold model is that if the time to collision or post-encroachment time is lower than or equal to 0, meaning that the conflict measure reaches an extreme level, traffic conflict will produce collision behavior. However, the peaks-over-threshold model is concerned with the distribution of extreme values that exceed the threshold, so in this study, it was necessary to take negative mappings for time to collision and post-encroachment time, respectively. In other words, the truck collides with the interacting vehicle when the negative time to collision or negative post-encroachment time is greater than or equal to 0 s.
(1) Univariate Extreme Value Theory
Suppose X 1 , X 2 , ... , X n is an independent random variable with an identically distribution function; it is natural to regard those of X i that exceed some high threshold u as extreme events. Defining Y i = X i u as the threshold exceedance for large enough u , conditional on X i > u , the distribution function of Y approaches a univariate GP distribution:
G ( x ) = 1 ( 1 + ξ x δ ) 1 ξ
where G ( x ) is the generalized pareto distribution expression; σ > 0 is the scale parameter;   <   ξ   <   is the shape parameter.
Since only a tiny fraction of traffic conflicts can cause collisions, this study focuses more on the tail distribution in traffic conflicts, approximated by:
G ^ ( x ) = 1 N u n ( 1 + ξ x u δ ) 1 ξ
where G ^ ( x ) is the tail distribution of generalized pareto; N u is the number higher than u in X 1 , X 2 , ... , X n .
(2) Bivariate Extreme Value Theory
By observing the trajectory data of the drone video, this study found that trucks and vehicles on two-lane rural highways rarely have identical trajectories with large intersection angles. If a single time to collision or post-encroachment time is used to predict truck collisions on two-lane rural highways, there may be a significant bias. Thus, it is essential to combine time to collision and post-encroachment time. The bivariate extreme value theory models the joint distribution of two extreme value variables, which can incorporate time to collision and post encroachment time into a unified road safety evaluation framework.
Suppose ( X m , Y m ) and m = 1 , 2 , ... n are independent realizations of a random vector ( X , Y ) with joint distribution function F ( x , y ) . The bivariate traffic conflict extreme value model approximates the joint distribution F ( x , y ) on regions of the form x   >   u x , y   >   u y for large enough u x and u y . For suitable thresholds u x and u y , each of the two marginal tail distributions of v F ( x , y ) can be approximated in the form of a generalized pareto distribution, with respective parameter sets ( ζ x , δ x , ξ x ) and ( ζ y , δ y , ξ y ) , where ζ x = P r ( X > u x ) , and ζ y = P r ( Y > u y ) . The random variables X and Y are transformed as follows:
X ¯ = { log [ 1 ζ x ( 1 + ξ x x u x δ x ) 1 ξ x ] } 1 , x > u x
Y ¯ = { log [ 1 ζ y ( 1 + ξ y y - u y δ y ) 1 ξ y ] } 1 , y > u y
where X ¯ and Y ¯ are the transformation parameters of X and Y and approximate the standard Fréchet distribution.
Therefore, the joint distribution of F ( x , y ) is approximately a bivariate generalized pareto distribution:
G ( x ¯ , y ¯ ) = exp [ V ( x ¯ , y ¯ ) ]
where x ¯ and y ¯ are parameters that X ¯ and Y ¯ exceed the threshold.
For the logistic type of the bivariate extreme value theory model, there are the following forms:
F ( x ¯ , y ¯ ) = exp [ ( x ¯ 1 α , y ¯ 1 α ) α ]
where α is the unknown parameter in the fitting Logistic type, α ( 0 , 1 ) .
(3) Truck Collision Prediction
Extreme value theory is an effective tool that enables the extrapolation from the distribution of observed levels to unobserved levels, i.e., to predict rare collisions from frequent traffic conflicts. The probability of collision risk is the probability of truck collision when negative time to collision (−TTC) or negative post-encroachment time (−PET) is greater than or equal to 0 s.
The estimation of trucks collision probability of the univariate extreme value theory model and the bivariate extreme value theory model can be expressed as:
R = P r ( Z 0 ) = 1 F ( 0 ) = N u n ( 1 + ξ x u δ ) 1 ξ
R = P r ( T T C 0 P E T 0 ) = 1 F ( 0 , 0 ) = 1 exp [ - ( x ¯ 1 α , y ¯ 1 α ) α ]
where Z is negative time to collision or negative post-encroachment time.
Assuming that the sample data of observation period T can reflect the overall sample characteristics of long time T ^ (usually one year), then the number of truck collisions can be predicted by:
N = T ^ T R
where N is the predicted annual collision rate for trucks.
The form of prediction accuracy ( P A ) is as follows:
P A = N N a * 100 %
where N a is the actual annual collision rate of trucks.

2.3.2. Machine Learning Algorithm for Truck Crash Risk Identification

(1) Theoretical Description of LightGBM
Truck collision identification is a classification prediction problem, and the light gradient-boosting machine (LightGBM) has a good classification recognition performance [59]. LightGBM is an integrated algorithm based on gradient boosting decision trees, which uses the negative gradients of the first-order derivative and the second-order derivative of the loss function to calculate the residuals of the decision tree and uses this result to fit a new tree for the next round. Also, the LightGBM uses a histogram algorithm to optimize the splitting of features and uses a leaf growth strategy with depth restrictions to prevent model overfitting.
The decision tree in LightGBM has to go through several iterations of the training dataset, with each iteration refitting a new decision tree to join the predecessor tree using the gradient information; the LightGBM will integrate all decision trees to obtain the final model as follows:
y ^ c = q Q f q ( x c ) , f q χ
where χ is the space of iterative tree functions; f q ( x c ) is the predicted value of the c t h sample in the q t h tree.
(2) Theoretical Description of XGBoost
The extreme gradient-boosting (XGBoost) is also a powerful sequential integration technique based on gradient-boosting decision trees. It can combine multiple weak classifiers into one robust classifier and utilizes a modular structure for parallel learning. In XGBoost training, each iteration adds a tree to fit the residual between the actual value and the predicted value in the previous iteration and then gradually approximates the true value. When the objective function is minimized, the sample predicted value is closest to the actual value. Meanwhile, XGBoost uses the objective function to control the complexity of the model and avoid model overfitting. The objective optimization function is:
O b j = i = 1 H l ( y i , y ^ i ) + k = 1 K Ω ( f k )
where i = 1 H l ( y i , y ^ i ) is the model’s loss function; k = 1 K Ω ( f k ) is the regularization of leaf node weights and tree depth added to control the model’s complexity; Ω ( f k ) = γ M + 1 2 λ j = 1 M ρ j 2 ; M is the number of leaf nodes on the Kth tree; ρ j is the weight on the jth leaf node; and γ and λ are the adjustment coefficients.
(3) Importance of Traffic Feature Parameters
To judge the importance of traffic feature parameters on truck crash risk, LightGBM and XGBoost use the total number of times and the sum of gains to measure the significance of the parameters, which are defined as follows:
T S p l i t = j K T S p l i t j
T G a i n = j K T G a i n j
where T S p l i t is the total number of splits in the iterative tree for each feature variable; T G a i n is the sum of the gains of the feature variables after partitioning in all decision trees; K is the K decision tree generated by K iterations.
(4) Model Evaluation
In classification algorithms, an evaluation measure can only reflect part of model performance, and if the selected evaluation measure is unreasonable, the model’s performance cannot be accurately evaluated. Therefore, this study selected accuracy, area under curve (AUC), recall, and false alarm rate to evaluate the prediction effect of the model comprehensively.

3. Results and Discussion

3.1. Extreme Value Theory Model Results

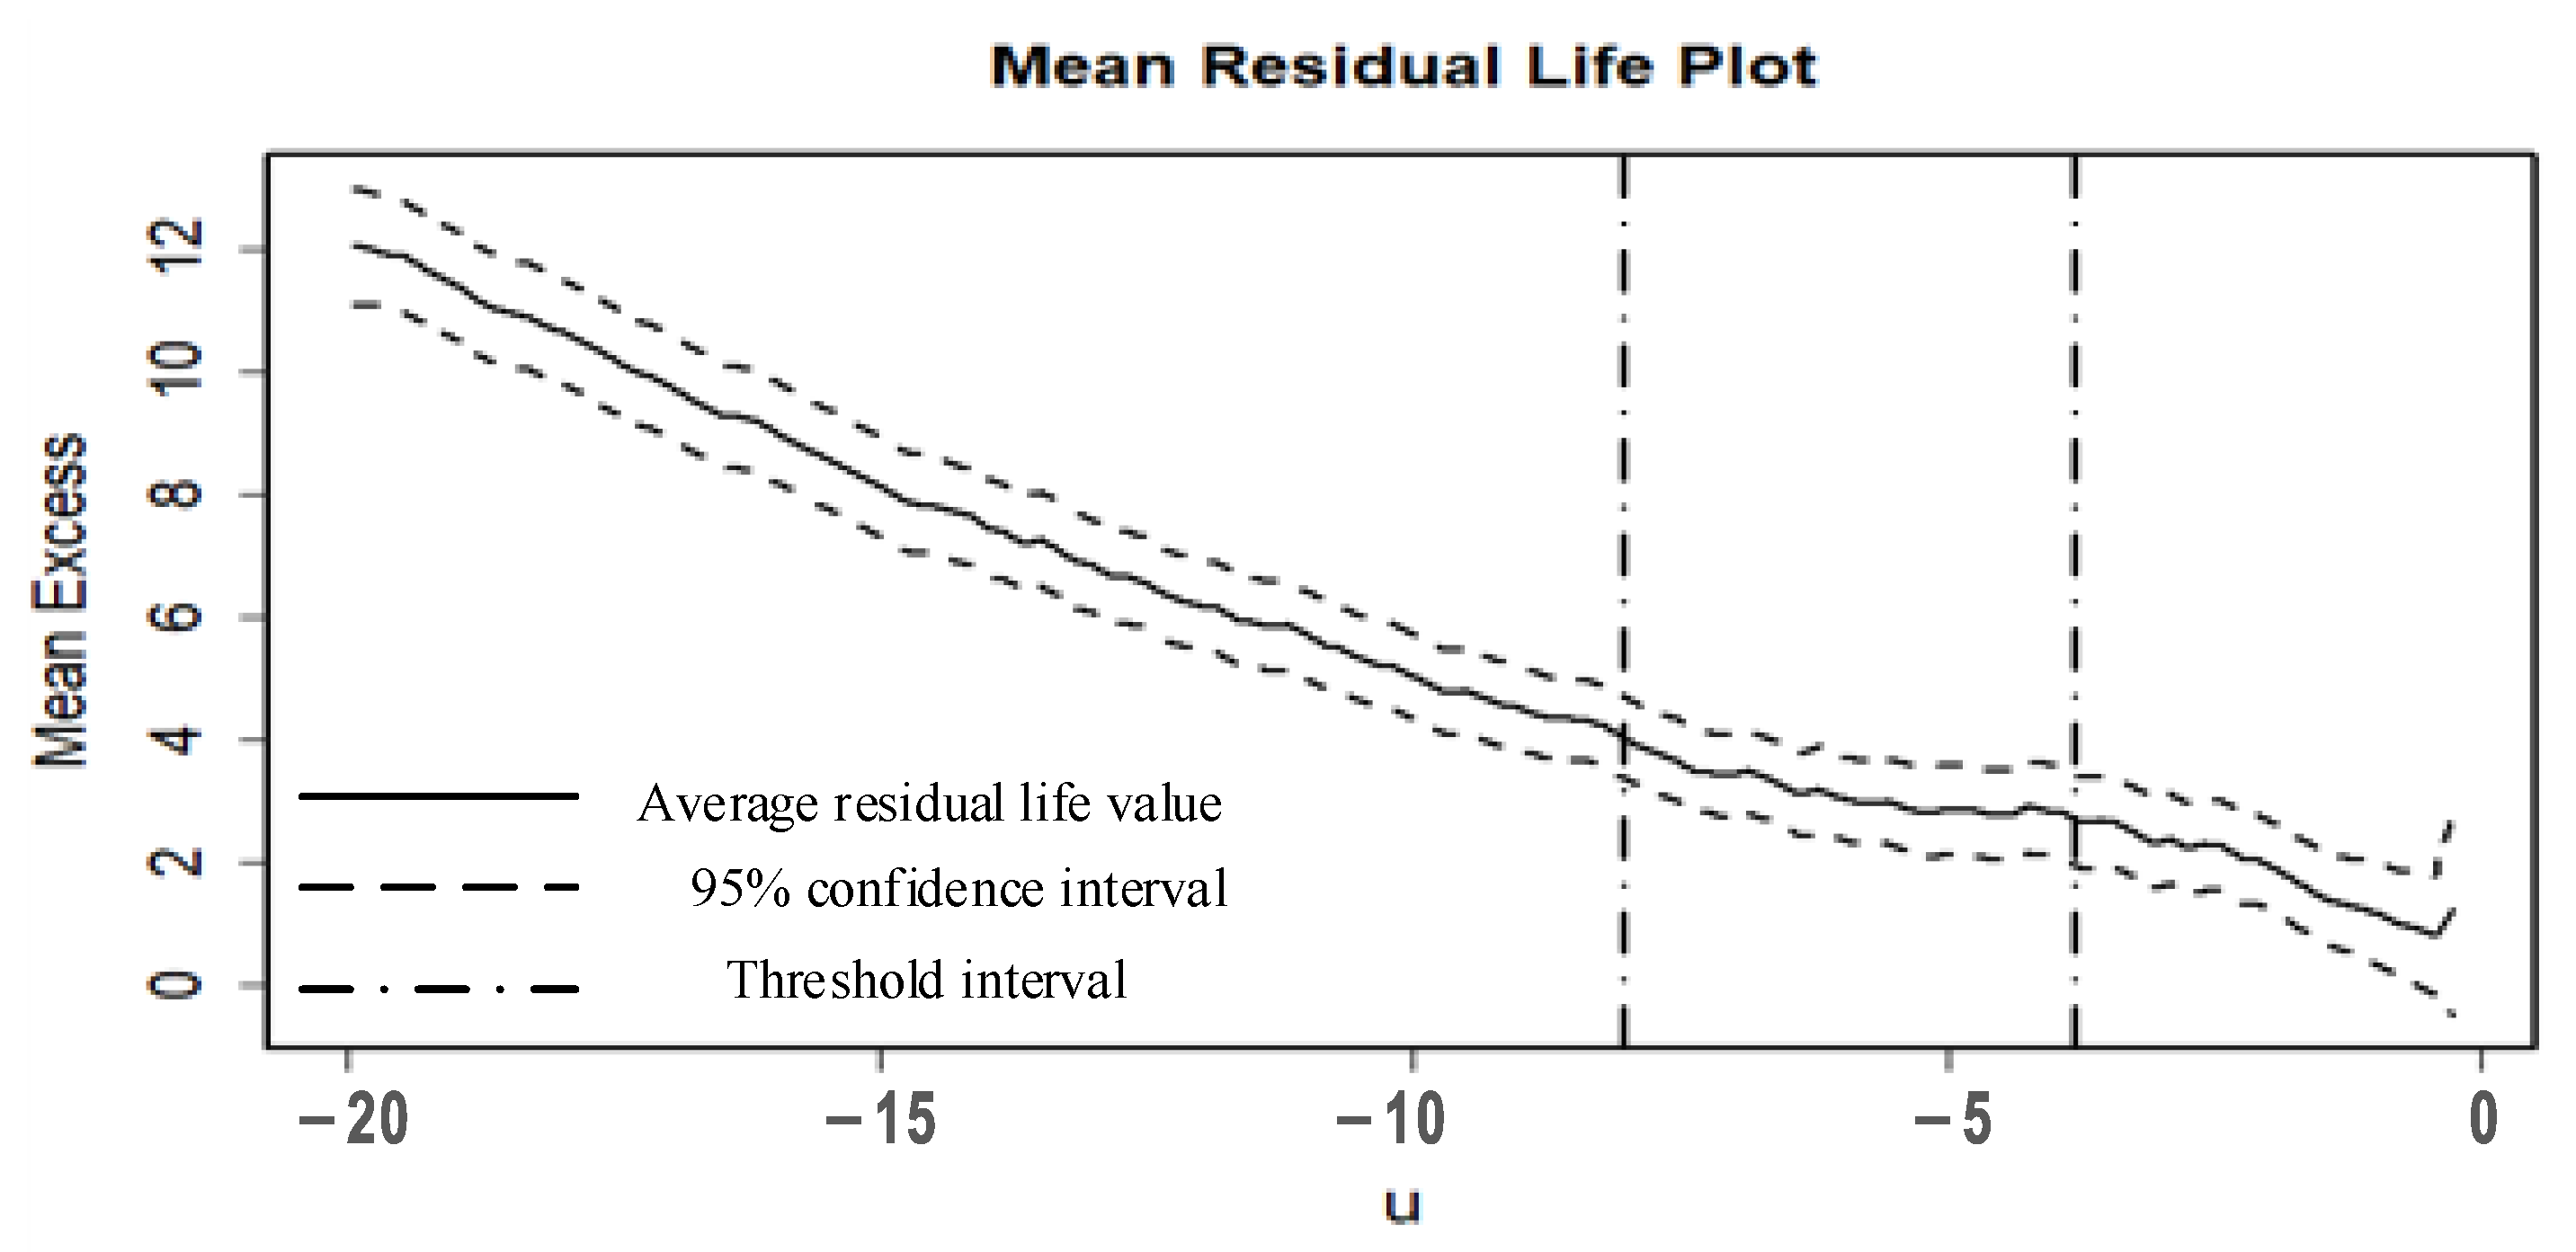
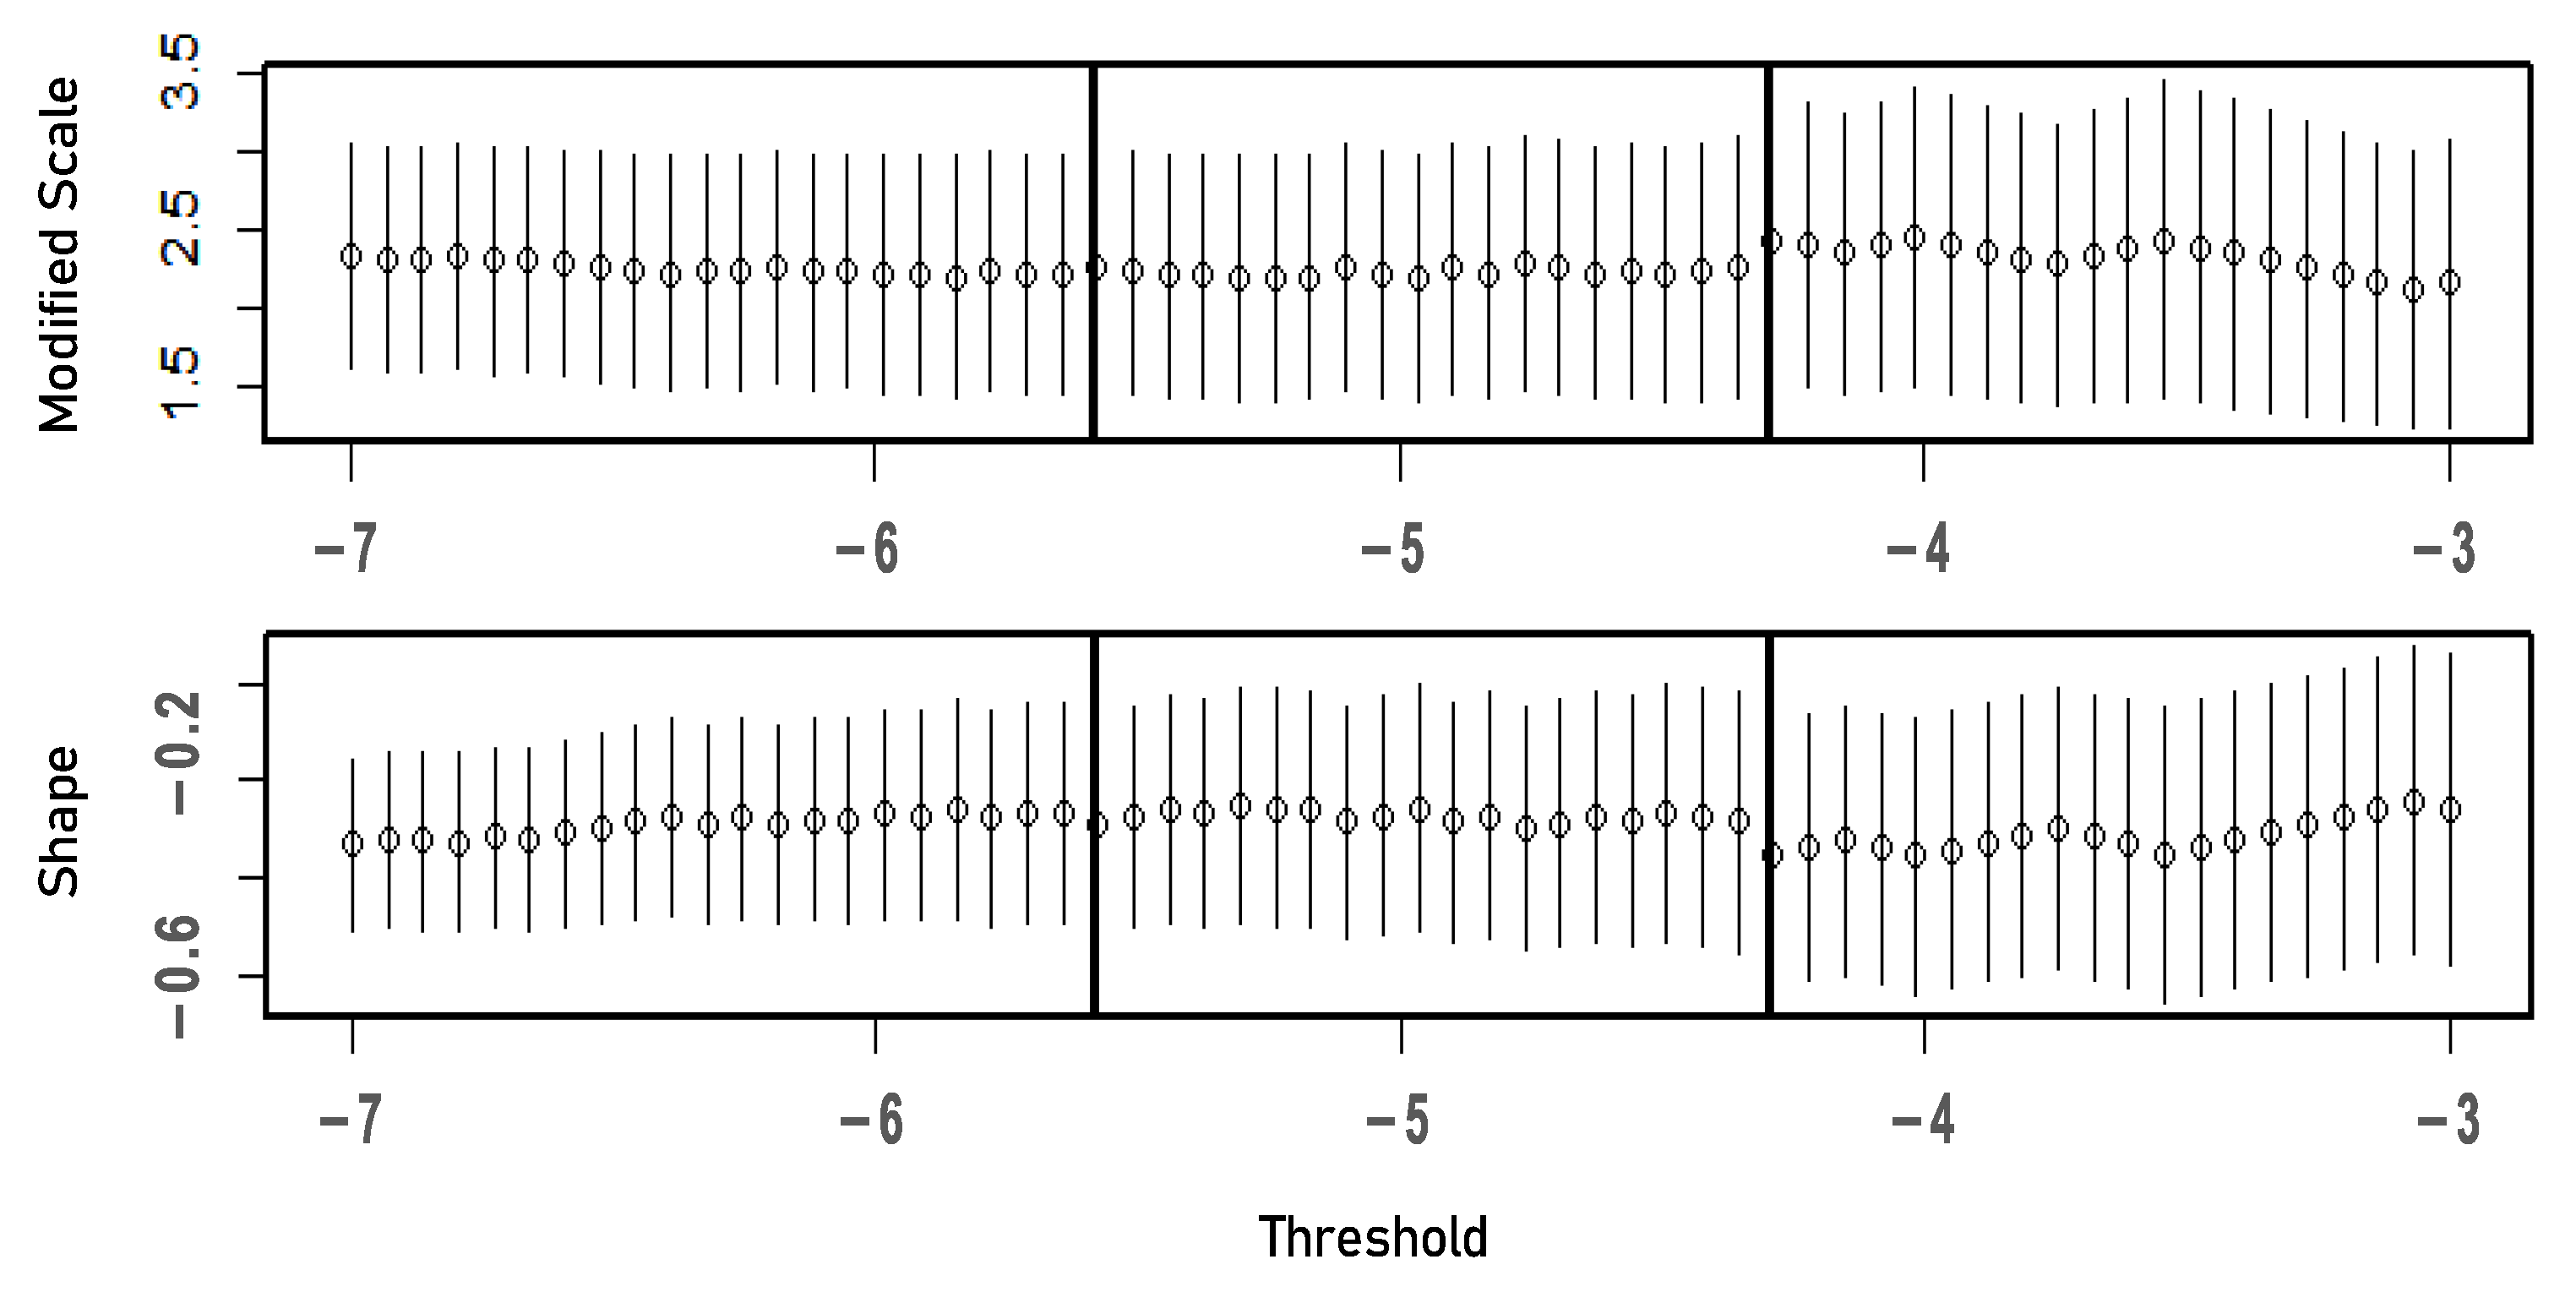
3.1.1. Univariate Extreme Value Theory Model Results

(1) Threshold Selection
Choosing a reasonable threshold in the peaks over threshold model is critical. In this study, the average residual lifetime plot and the threshold stability plot, commonly used in extreme value analysis, were chosen to determine the threshold.
For the average residual life plot when u > u 0 , E ( X u | X > u ) should be a linear function of the threshold u . For the threshold stability plot, the shape parameter ζ of the generalized pareto model and the modified scale parameter σ * = σ u - ξ u should be essentially constant. The specific steps of the graphical method to determine the threshold are as follows: first, choose the threshold range R 1 according to the average remaining life graph, where the average remaining life line is approximately linear; then, choose the stability range R 2 of the threshold according to the threshold stability graph, where the shape parameter and the modified scale parameter do not vary with the threshold u ; finally, take the intersection of the two ranges: R = R 1 R 2 , and the upper bound u + of R is used as the threshold.
The threshold selection range R p e t 1 and threshold stabilization range R p e t 2 of negative post-encroachment time are shown in Figure 3 and Figure 4, where R p e t 1 = (−0.651, −0.195) and R p e t 2 = (−0.494, −0.382), Thus, threshold range R p e t = R p e t 1 R p e t 2 = (−0.494, −0.382), and the final threshold for negative post-encroachment time is −0.382.
Similarly, in Figure 5 and Figure 6, R ttc 1 = (−8.125, −4.471), R ttc 2 = (−5.584, −4.392), R ttc = R ttc 1 R ttc 2 = (−5.584, −4.471), and the final threshold for negative time to collision is −4.471 = −4.471.
(2) Univariate Extreme Value Theory Model Truck Collision Prediction
The maximum likelihood function is used to estimate the parameters of the univariate extreme value theory model, and the estimation results are shown in Table 3.
By Equation (10):
R = P r ( P E T 0 ) = 1 F ( 0 ) = 0.1578 R = P r ( T T C 0 ) = 1 F ( 0 ) = 0.0520
Based on the above results, when the post-encroachment time is 0.382 s, or the time to collision is 4.471 s, there are severe conflicts between a truck and its interacting vehicle on two-lane rural highways; when the post-encroachment time is less than or equal to 0 s, the collision probability of trucks on two-lane rural highways is 15.78%, and by Equation (12), the annual collision rate of the trucks is 230.44 cases/year. Similarly, when the time to collision is less than or equal to 0 s, the truck collision probability on two-lane rural highways is 5.20%, and the annual collision rate of trucks is 75.96 cases/year.

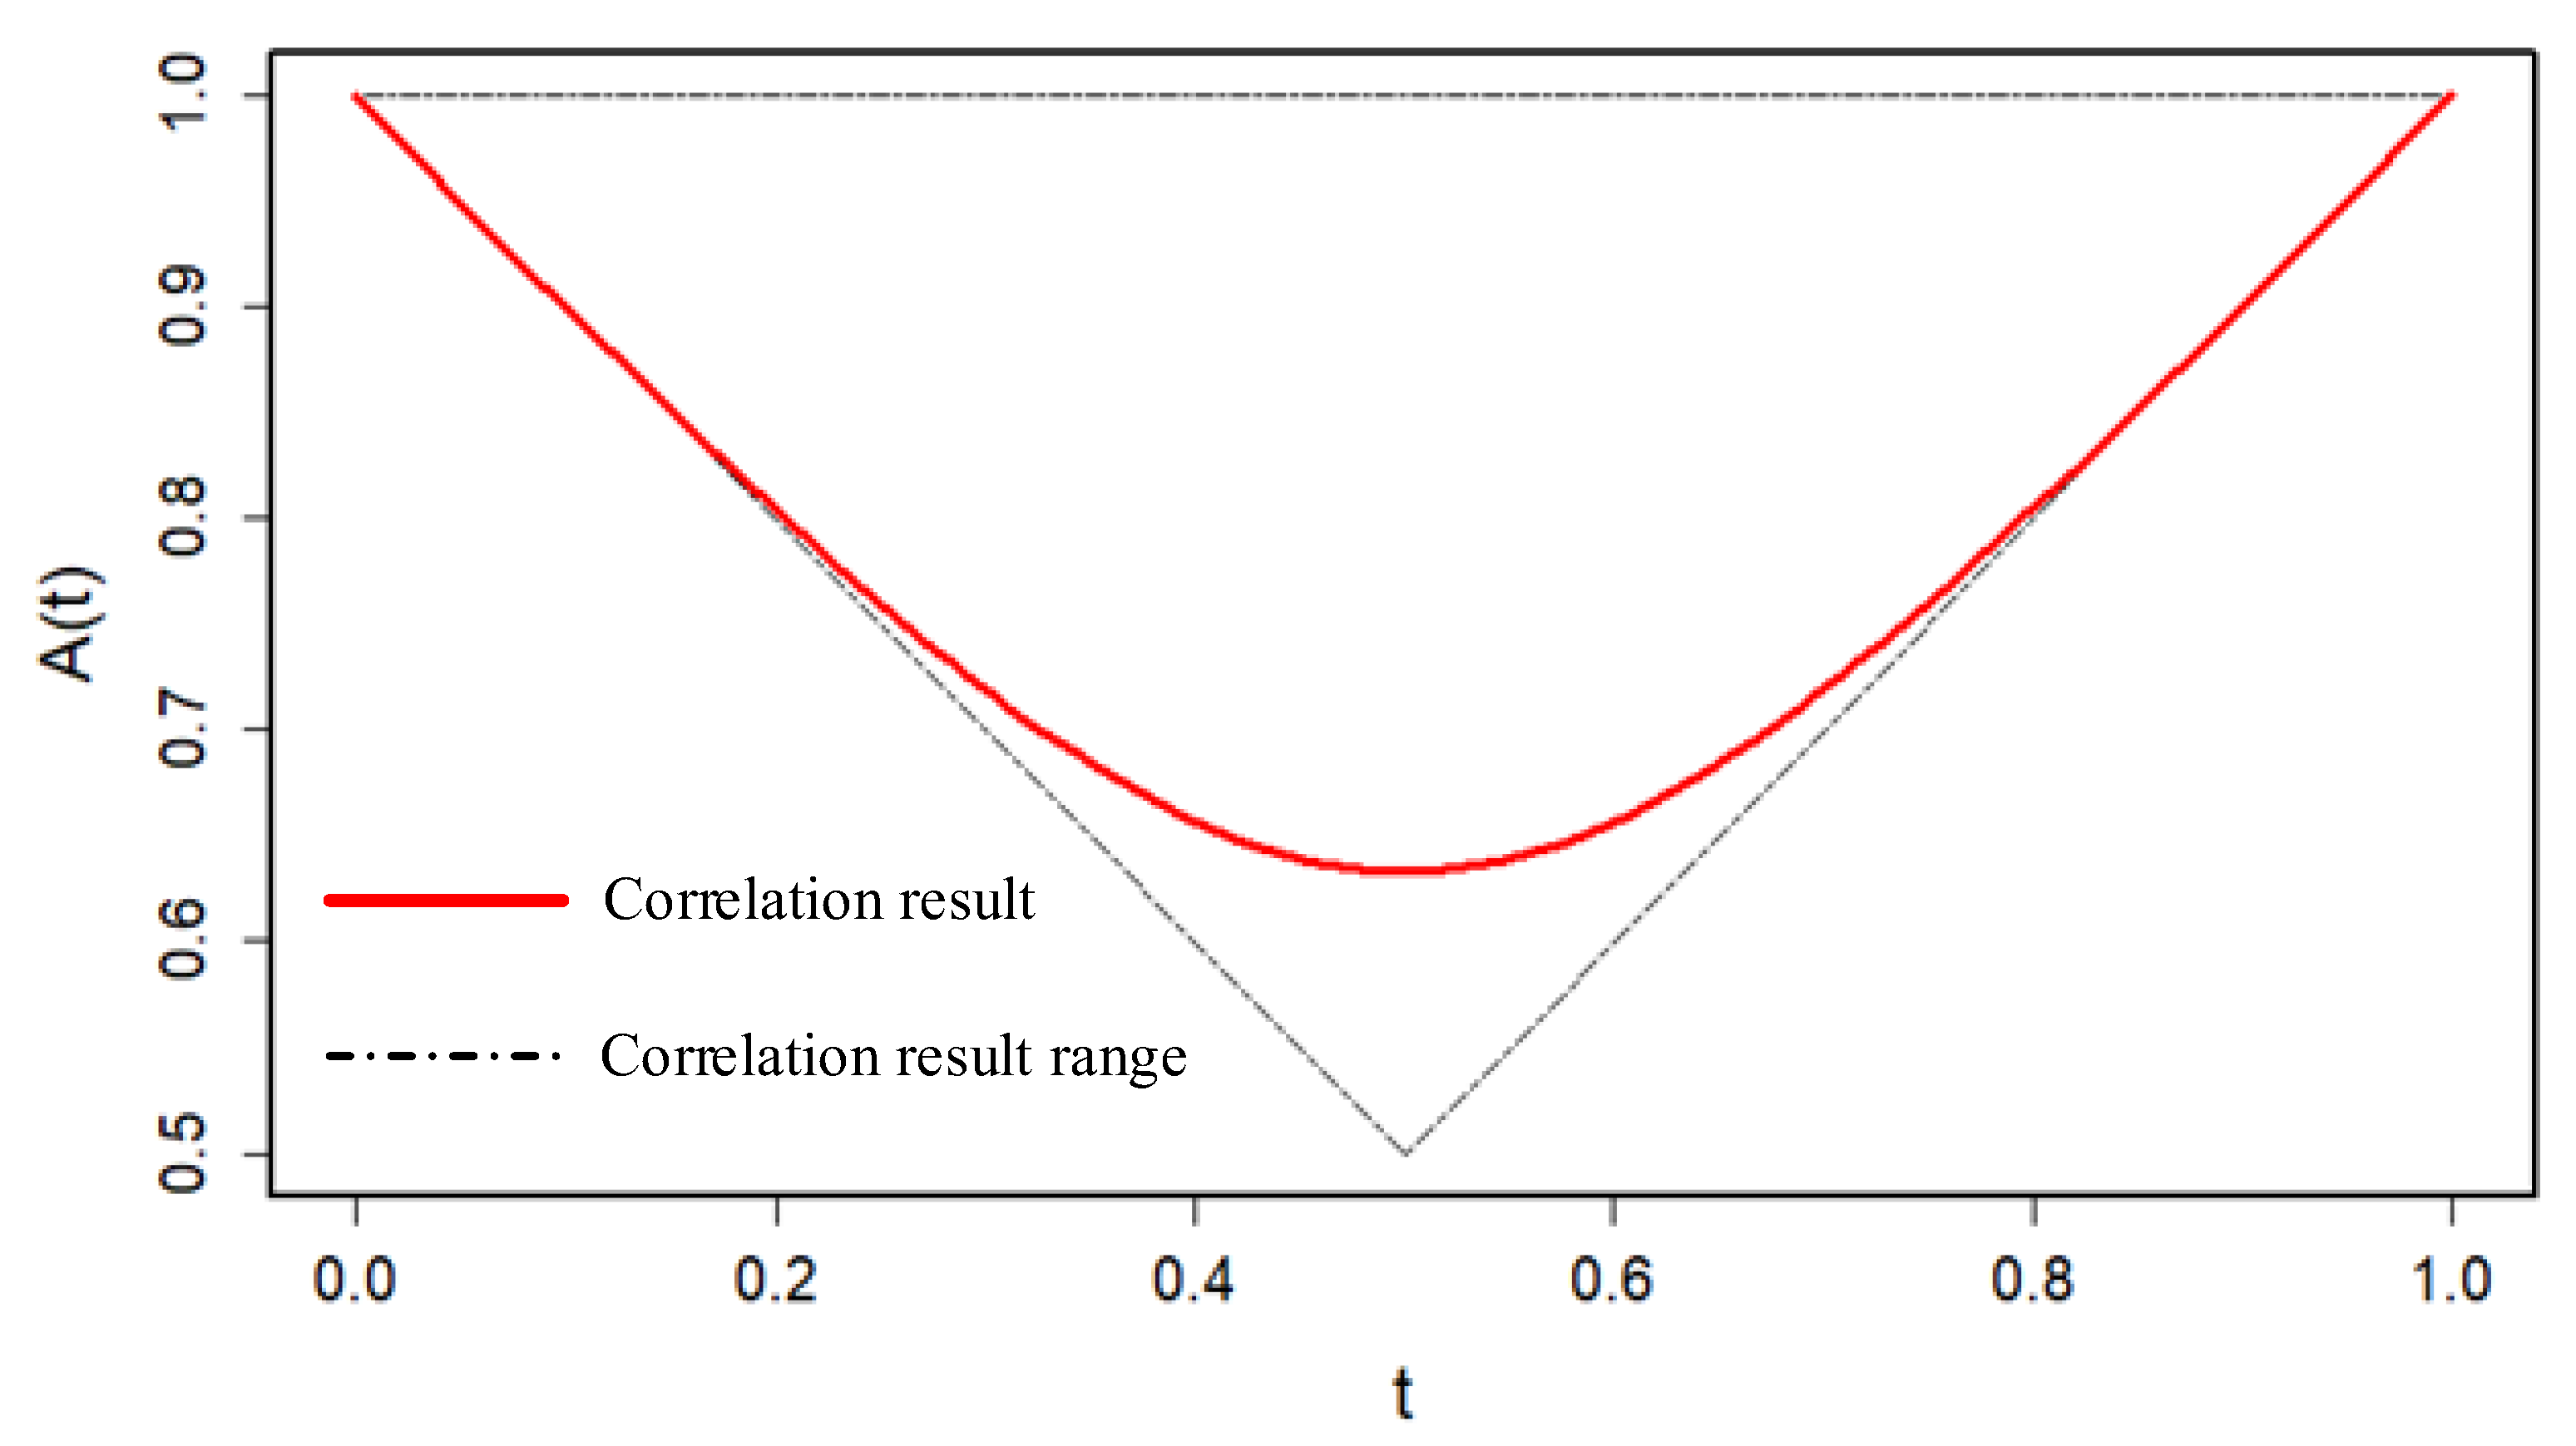
3.1.2. Bivariate Extreme Value Theory Model Results

(1) Bivariate Extreme Value Theory Model Truck Collision Prediction
The threshold of the bivariate extreme value theory model is the threshold of the marginal model; i.e., the time to collision of 4.471 s and the post-encroachment time of 0.382 s are used as thresholds for serious conflict of trucks on two-lane rural highways in the bivariate extreme value theory model. To avoid only one component in the model exceeding the threshold, a truncated maximum likelihood function is used to estimate the parameters of the bivariate extreme value theory model. The estimation results are shown in Table 4.
By Equation (11):
R = P r ( T T C 0 P E T 0 ) = 1 F ( 0 , 0 ) = 0.0584
When time to collision or post-encroachment time is less than or equal to 0 s, the collision probability of trucks on two-lane rural highways is 5.84%, and by Equation (13), the annual collision rate of trucks is 85.27 cases/year.
(2) Tail Correlation of the Post-Encroachment Time and the Time to Collision
The correlation dependence between the post-encroachment time and the time to collision was estimated using the R language. The correlation between the post-encroachment time and the time to collision was α = 0.634 (see Figure 7), which suggests that the post-encroachment time and the time to collision are not independent at extreme levels but are weakly correlated.

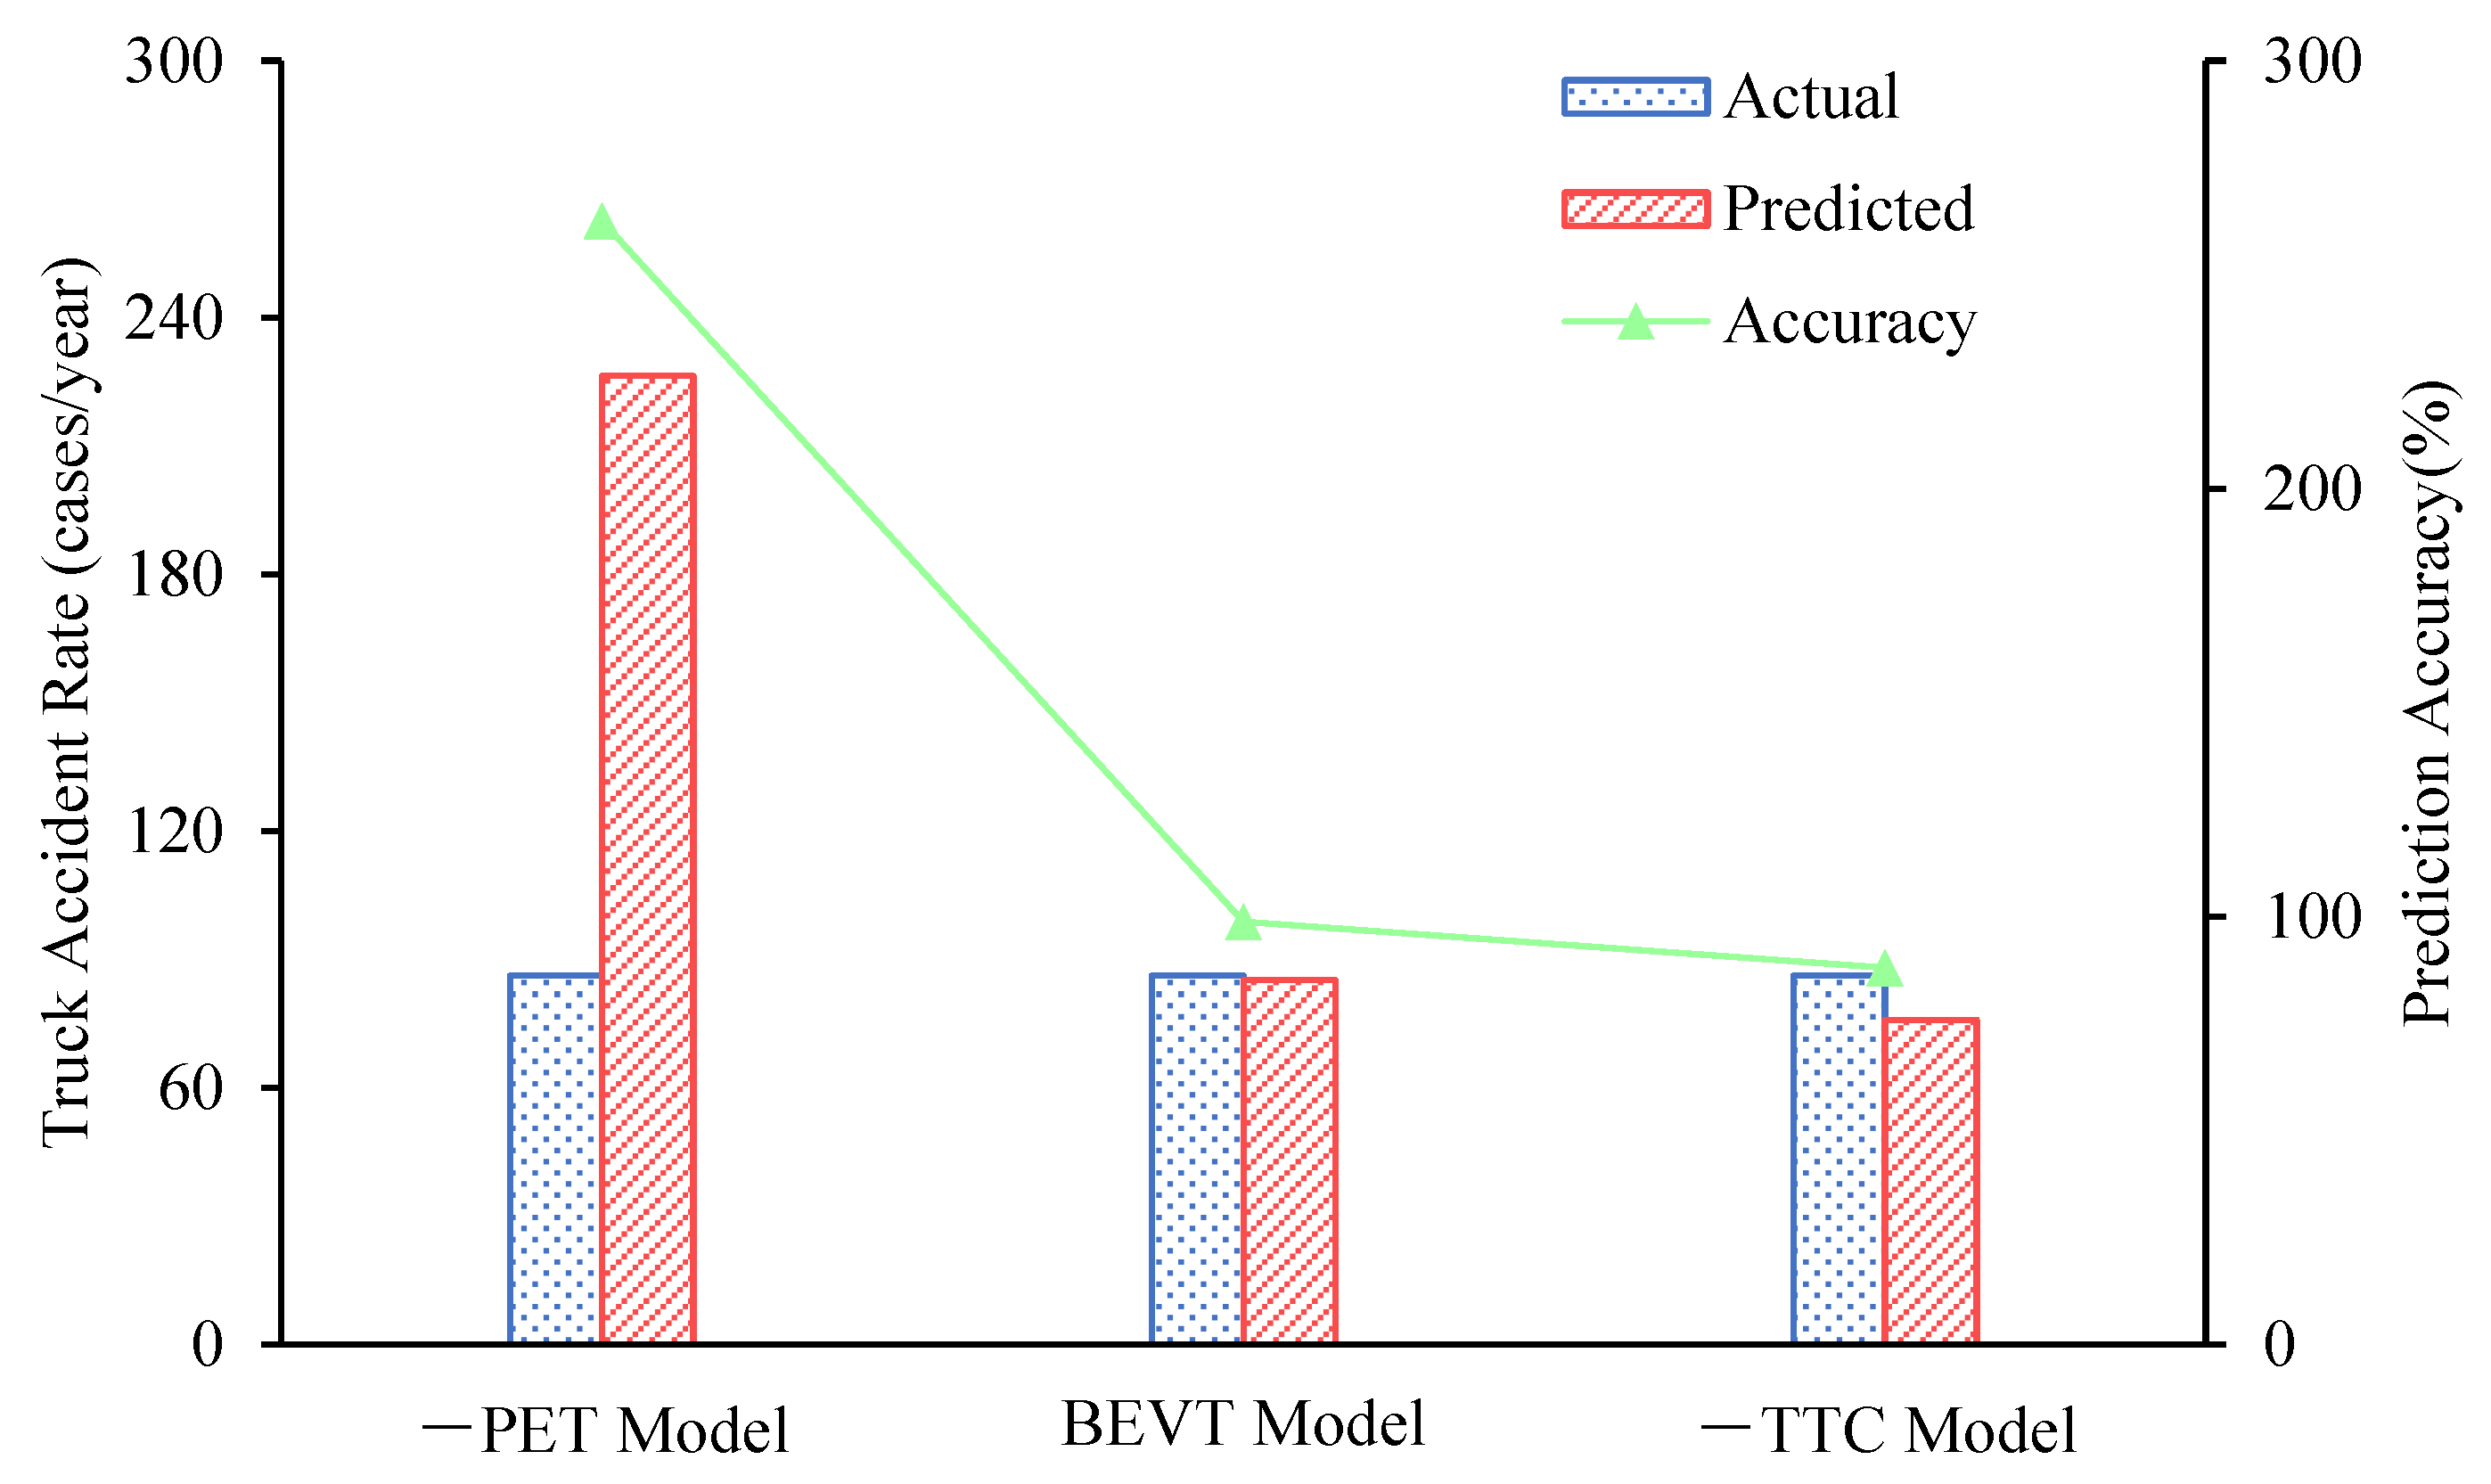
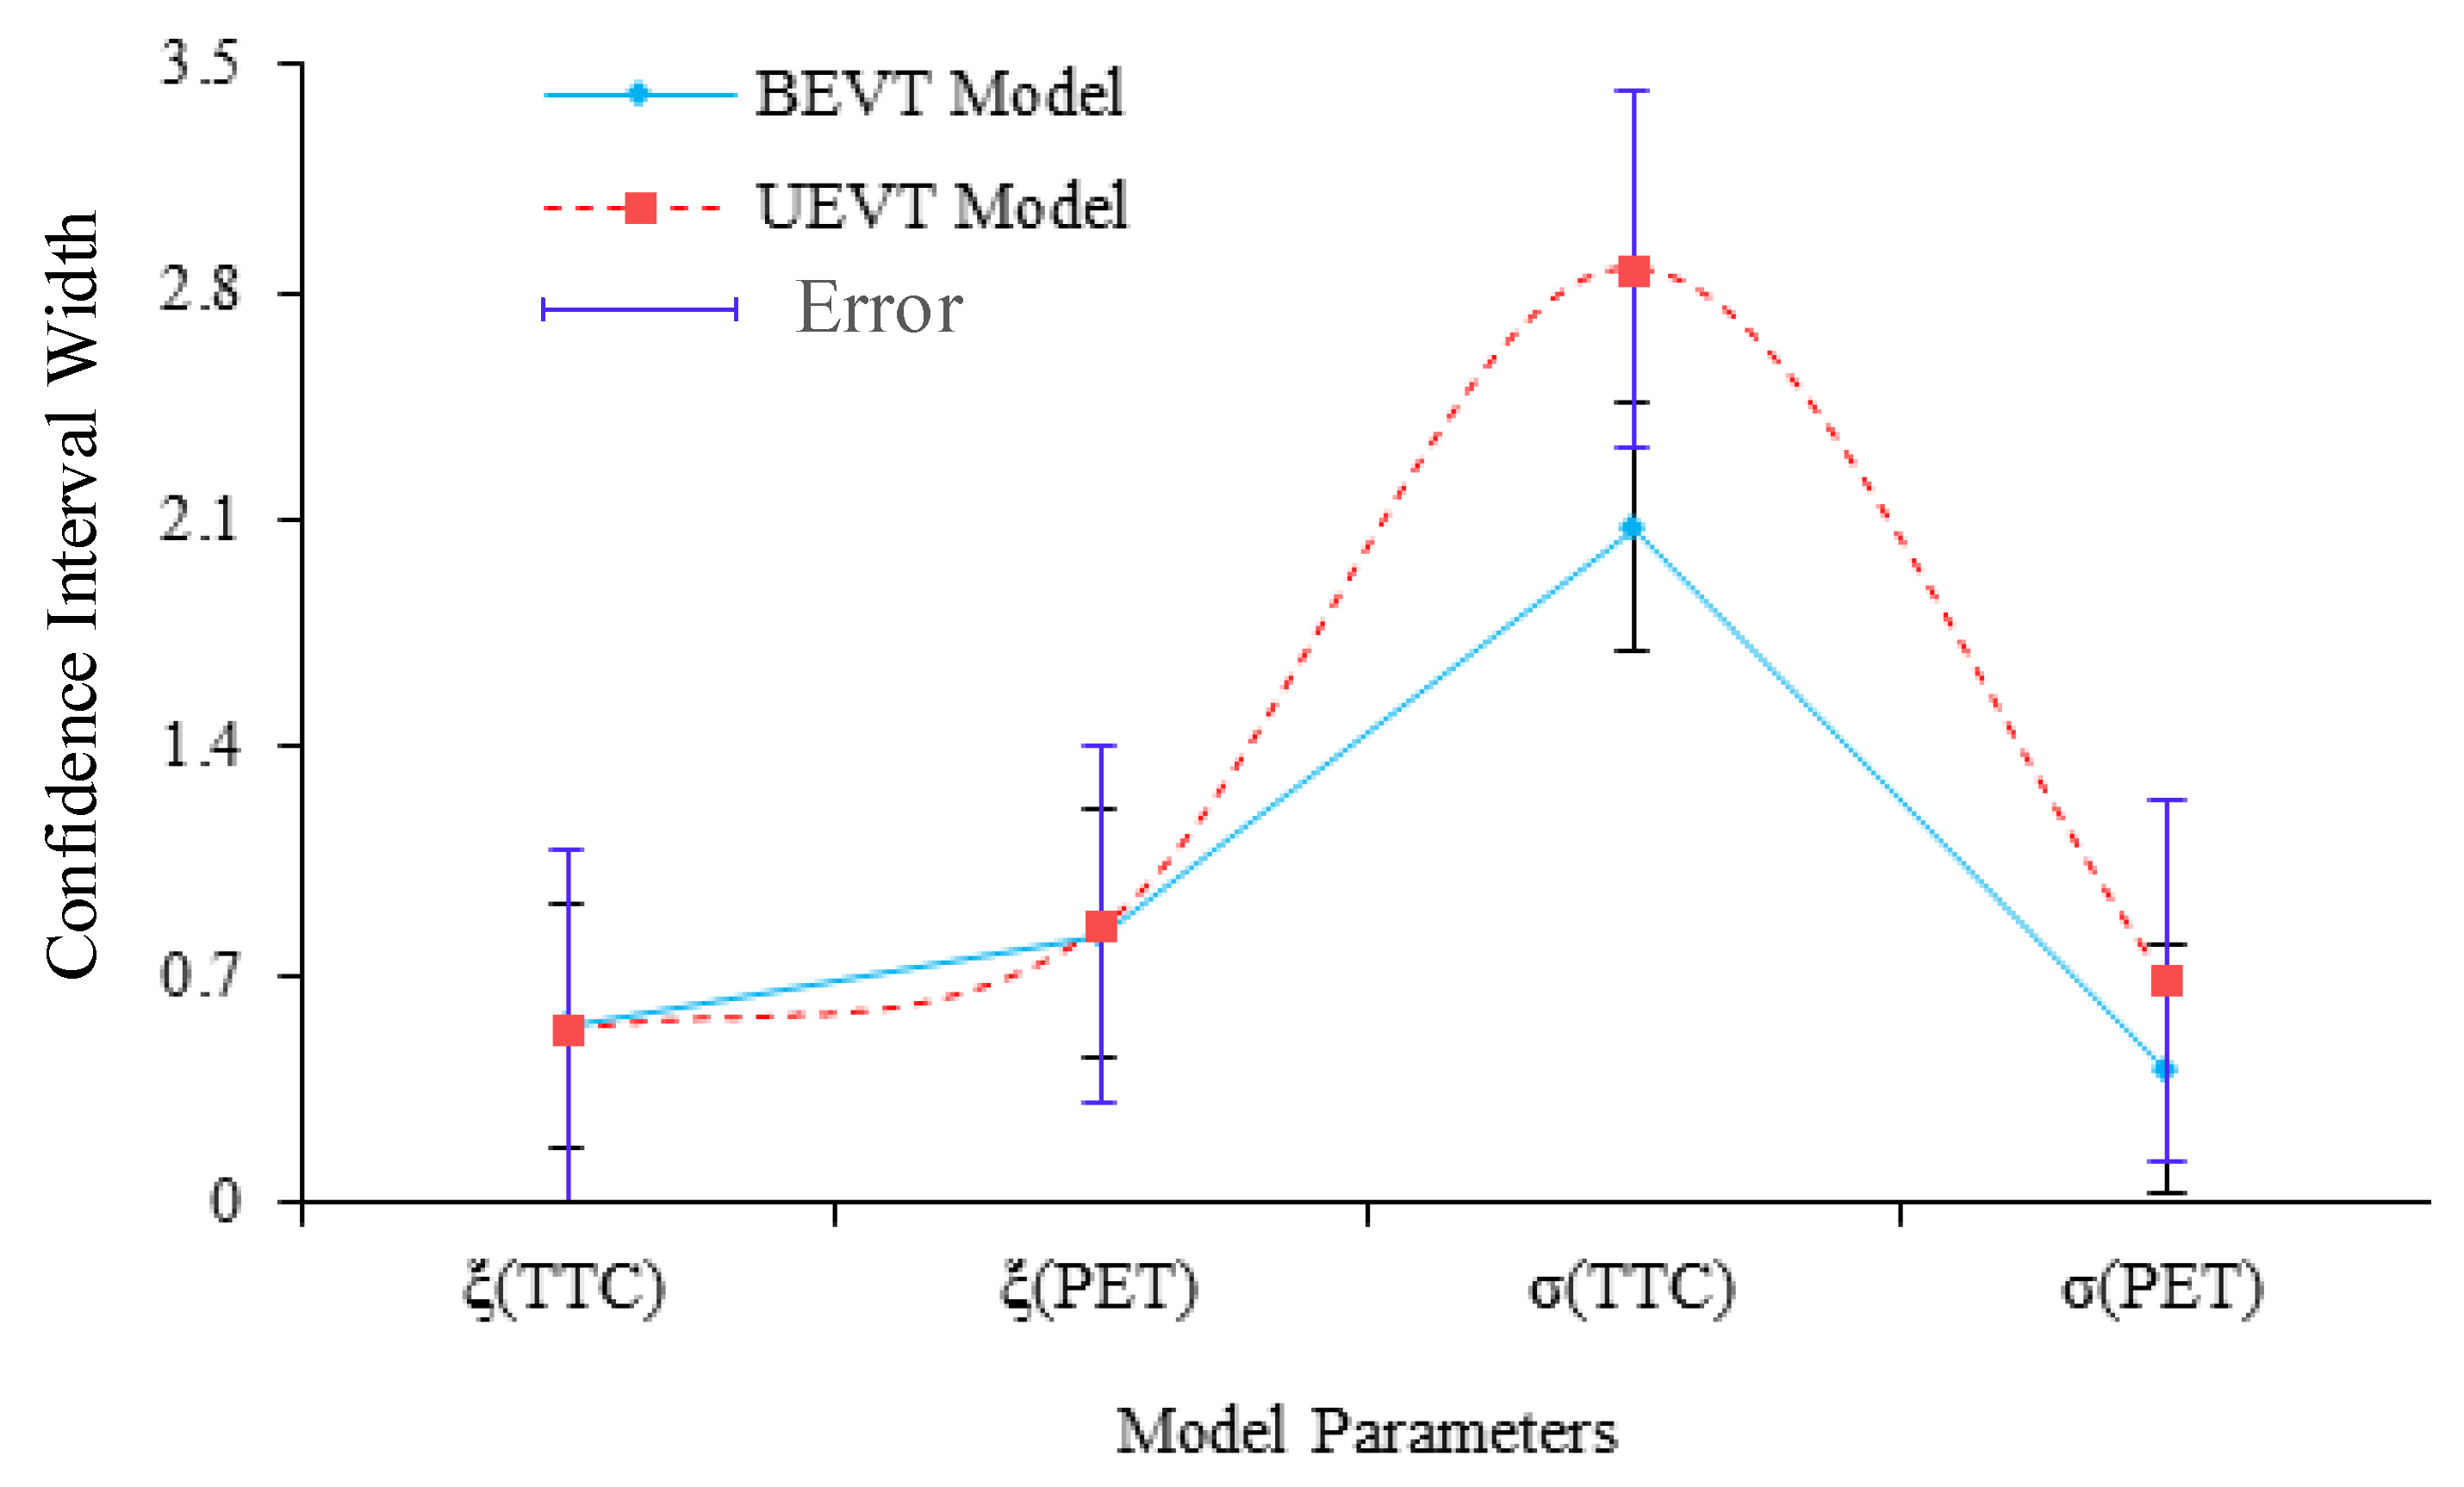
3.1.3. Model Prediction Effect Comparison

(1) Predicting Accuracy
The annual collision rate of trucks predicted by the univariate extreme value theory model and the bivariate extreme value theory model was compared with the real value of the annual accident rate of trucks on the Yuan-Shuang Highway. As shown in Figure 8, the prediction accuracy of the negative post-encroachment time model and the negative time to collision model is 267.34% and 88.12%, respectively, and the bivariate extreme value theory model is as high as 98.92%. It can be found that the prediction result of the univariate extreme value theory model has apparent deviation, while the bivariate extreme value theory model has a tiny prediction error. This is because the negative post-encroachment time model or the negative time-to-collision model cannot distinguish between different types of trajectories. Equivalently, offset trajectories and identical trajectories are considered to be more crash-prone cross trajectories, causing the negative post-encroachment time model to overestimate the occurrence of truck collisions on two-lane rural highways. Similarly, offset trajectories and cross trajectories are considered identical trajectories by the negative time-to-collision model, leading to an underestimation of the occurrence of truck collisions on two-lane rural highways. However, the bivariate extreme value theory model fully considers identical trajectories and crossing trajectories of the truck and its conflicting vehicles on two-lane rural highways and utilizes the applicability of the post-encroachment time and the time to collision in traffic safety analysis to avoid the bias caused by using only one surrogate safety measure.
(2) Prediction Precision
Comparison of confidence intervals for different parameters of the univariate extreme value theory model and the bivariate extreme value theory model, as shown in Figure 9. The confidence intervals estimated by the univariate and bivariate extreme value theory models are not significantly different for ξ . For δ , the confidence interval estimated by the bivariate extreme value theory is 6/10 of that estimated by the negative post-encroachment time model and 7/10 of that estimated by the negative time-to-collision model. The narrower the confidence interval, the higher the prediction precision produced, indicating that the bivariate extreme value theory model has significantly higher precision than the univariate extreme value theory model in predicting truck collisions on two-lane rural highways.
(3) Model Comparison Results
We compared the prediction effectiveness of the univariate extreme value theory model and the bivariate extreme value theory model in predicting truck collisions on two-lane rural highways and found that the bivariate extreme value theory model predicted better compared to the univariate extreme value theory model. Therefore, in this study, the bivariate extreme value theory model was used to predict truck collisions on two-lane rural highways with the time to collision of 4.471 s and the post-encroachment time of 0.382 s as the thresholds for severe conflicts between the truck and its interacting vehicle on two-lane rural highways.

3.2. Truck Crash Risk Identification Results

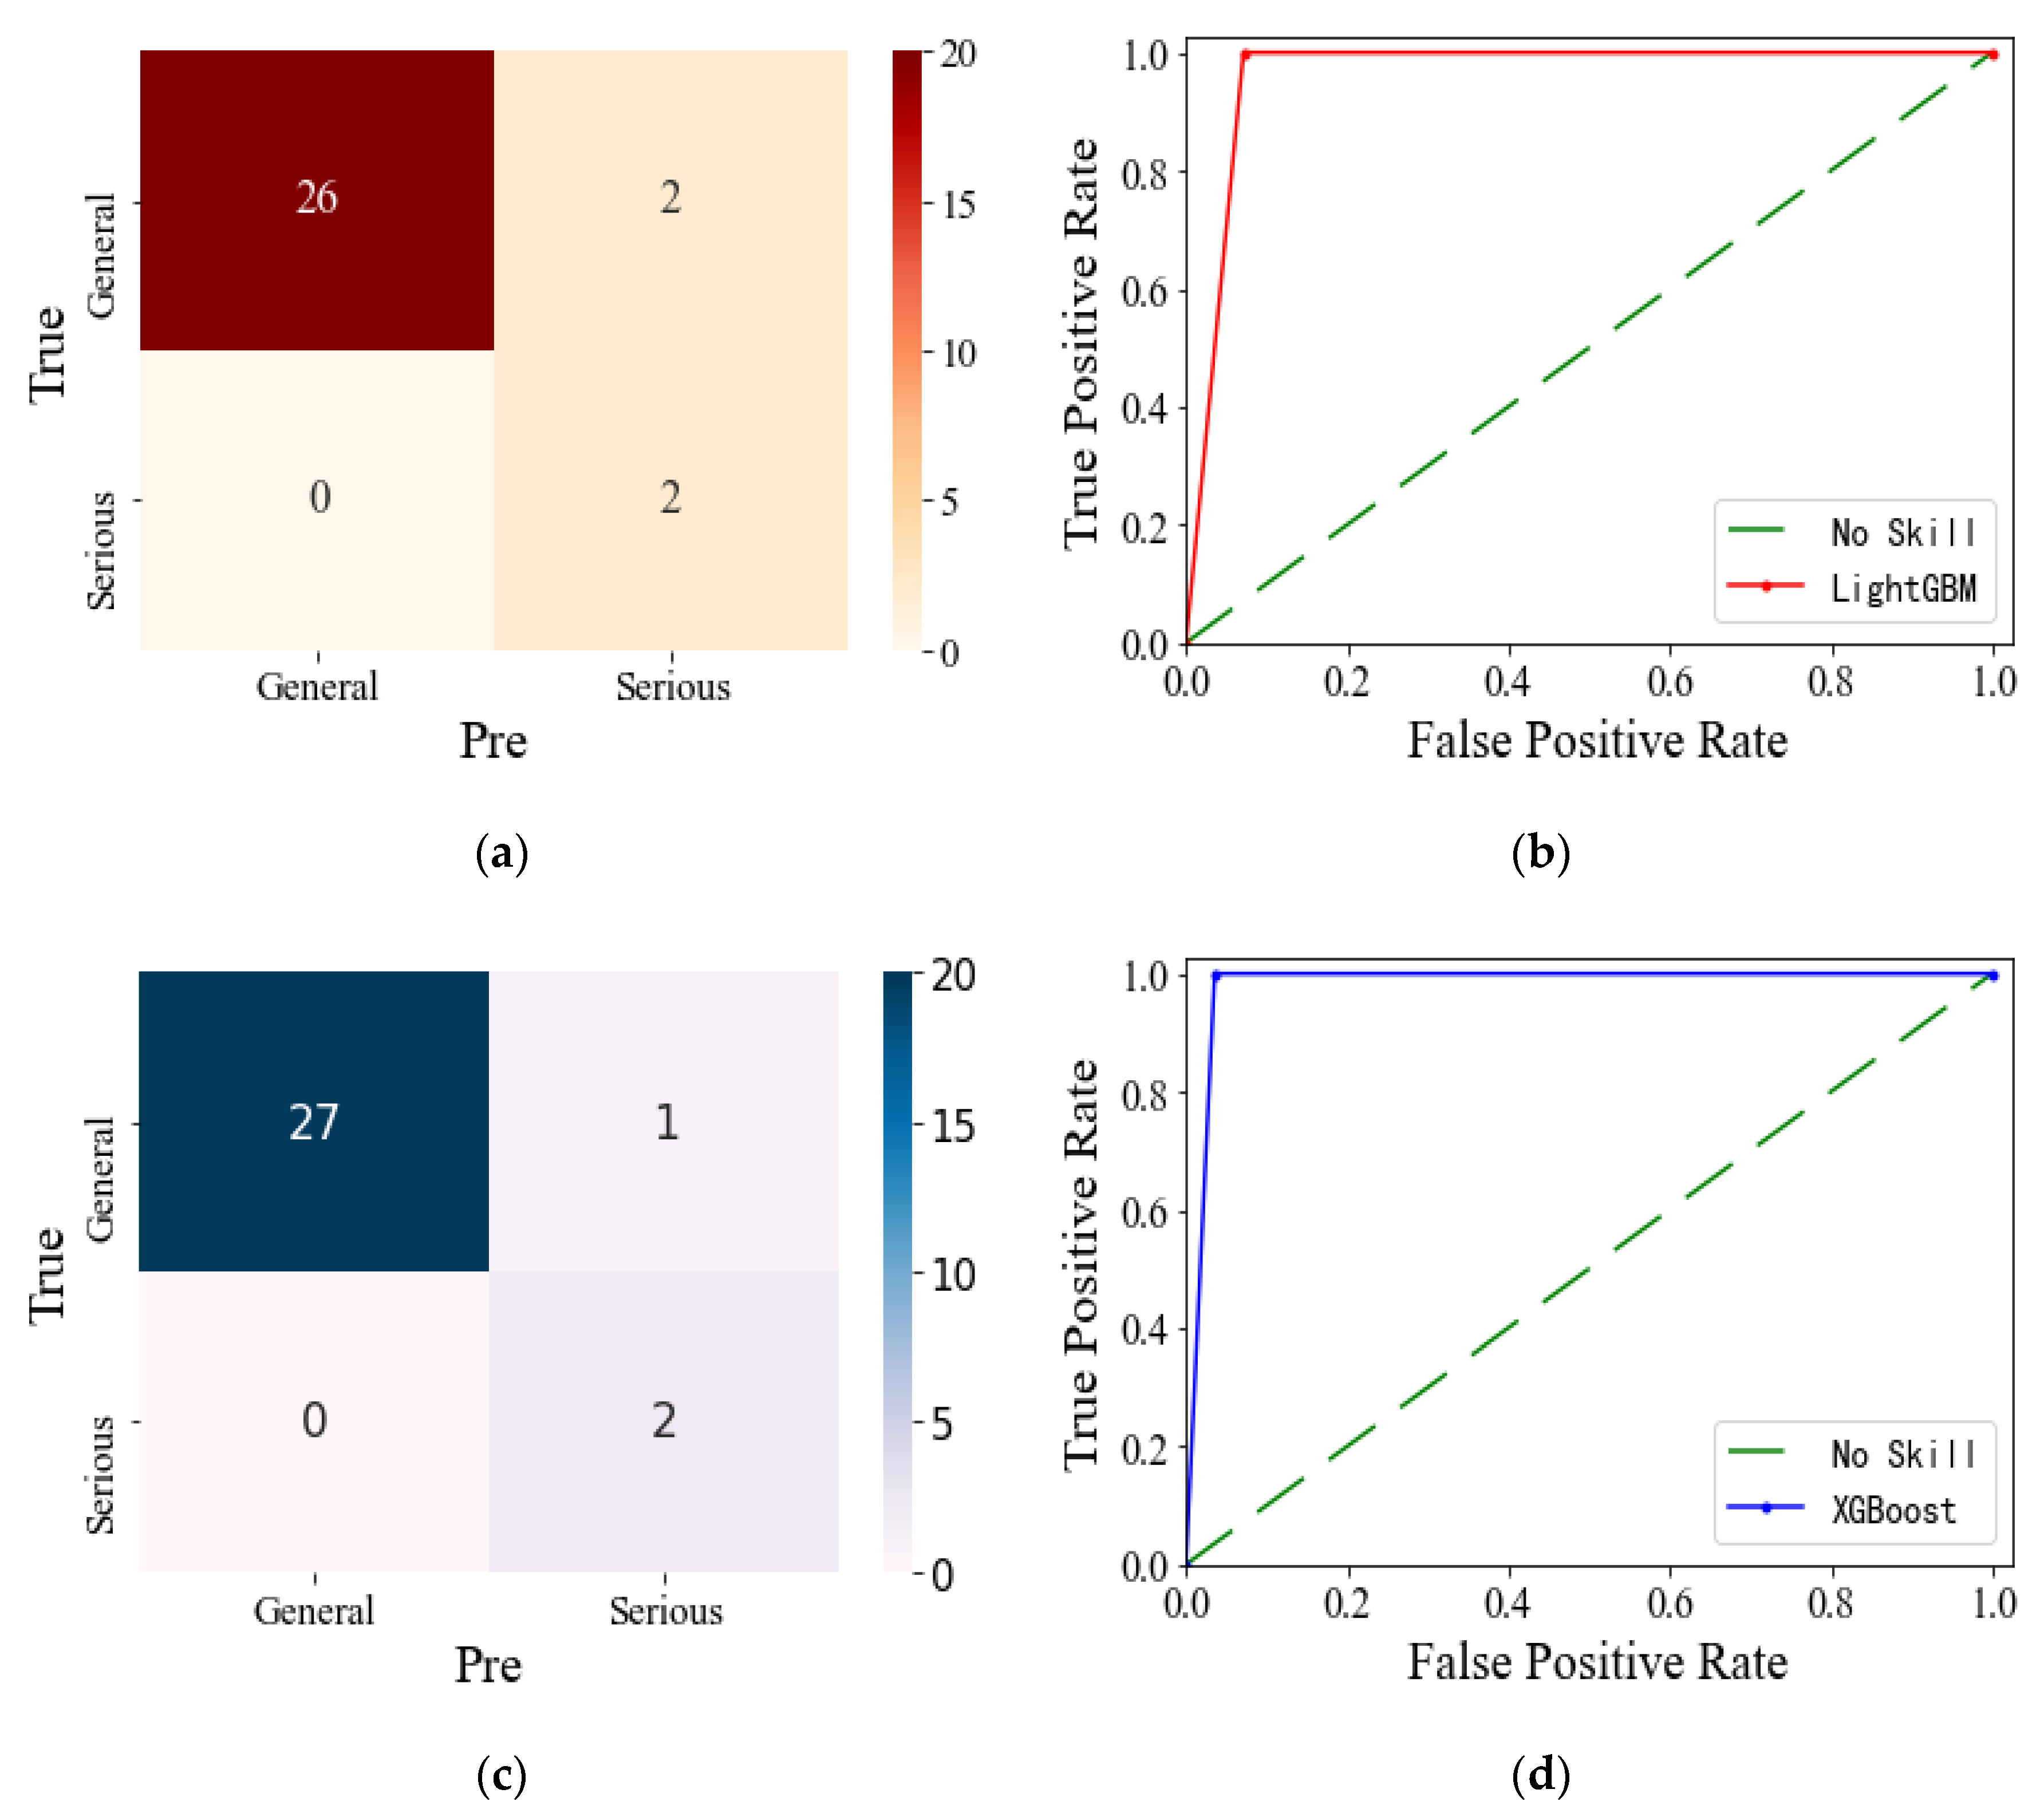
3.2.1. LightGBM Identification Effect

In this study, the conflicts between the truck and its interacting vehicle on the two-lane rural highways were classified into general and severe conflicts using the time to collision of 4.471 s and the post-encroachment time of 0.382 s as the threshold. Then, the data were imported into Python and divided into training and test sets in a 3:1 ratio. Finally, truck collision risk identification models on two-lane rural highways were built using LightGBM and XGBoost, with the constructed feature parameter set as the data features and the conflict level as the data labels. The prediction effect of the LightGBM and the XGBoost models are shown in Figure 10.
The AUC, accuracy, recall and false-alarm rate were calculated based on the confusion matrix (see Table 5). As shown in Table 5, compared with the LightGBM model, the XGBoost model has the same recall, and the AUC and accuracy are 0.018 and 3.334% higher, respectively, while the false-alarm rate is 1.75% lower, indicating the XGBoost model has good recognition performance for truck collision risk on two-lane rural highways. Thus, we used the XGBoost model to rank the importance of traffic feature parameters that affect truck collisions on two-lane rural highways.

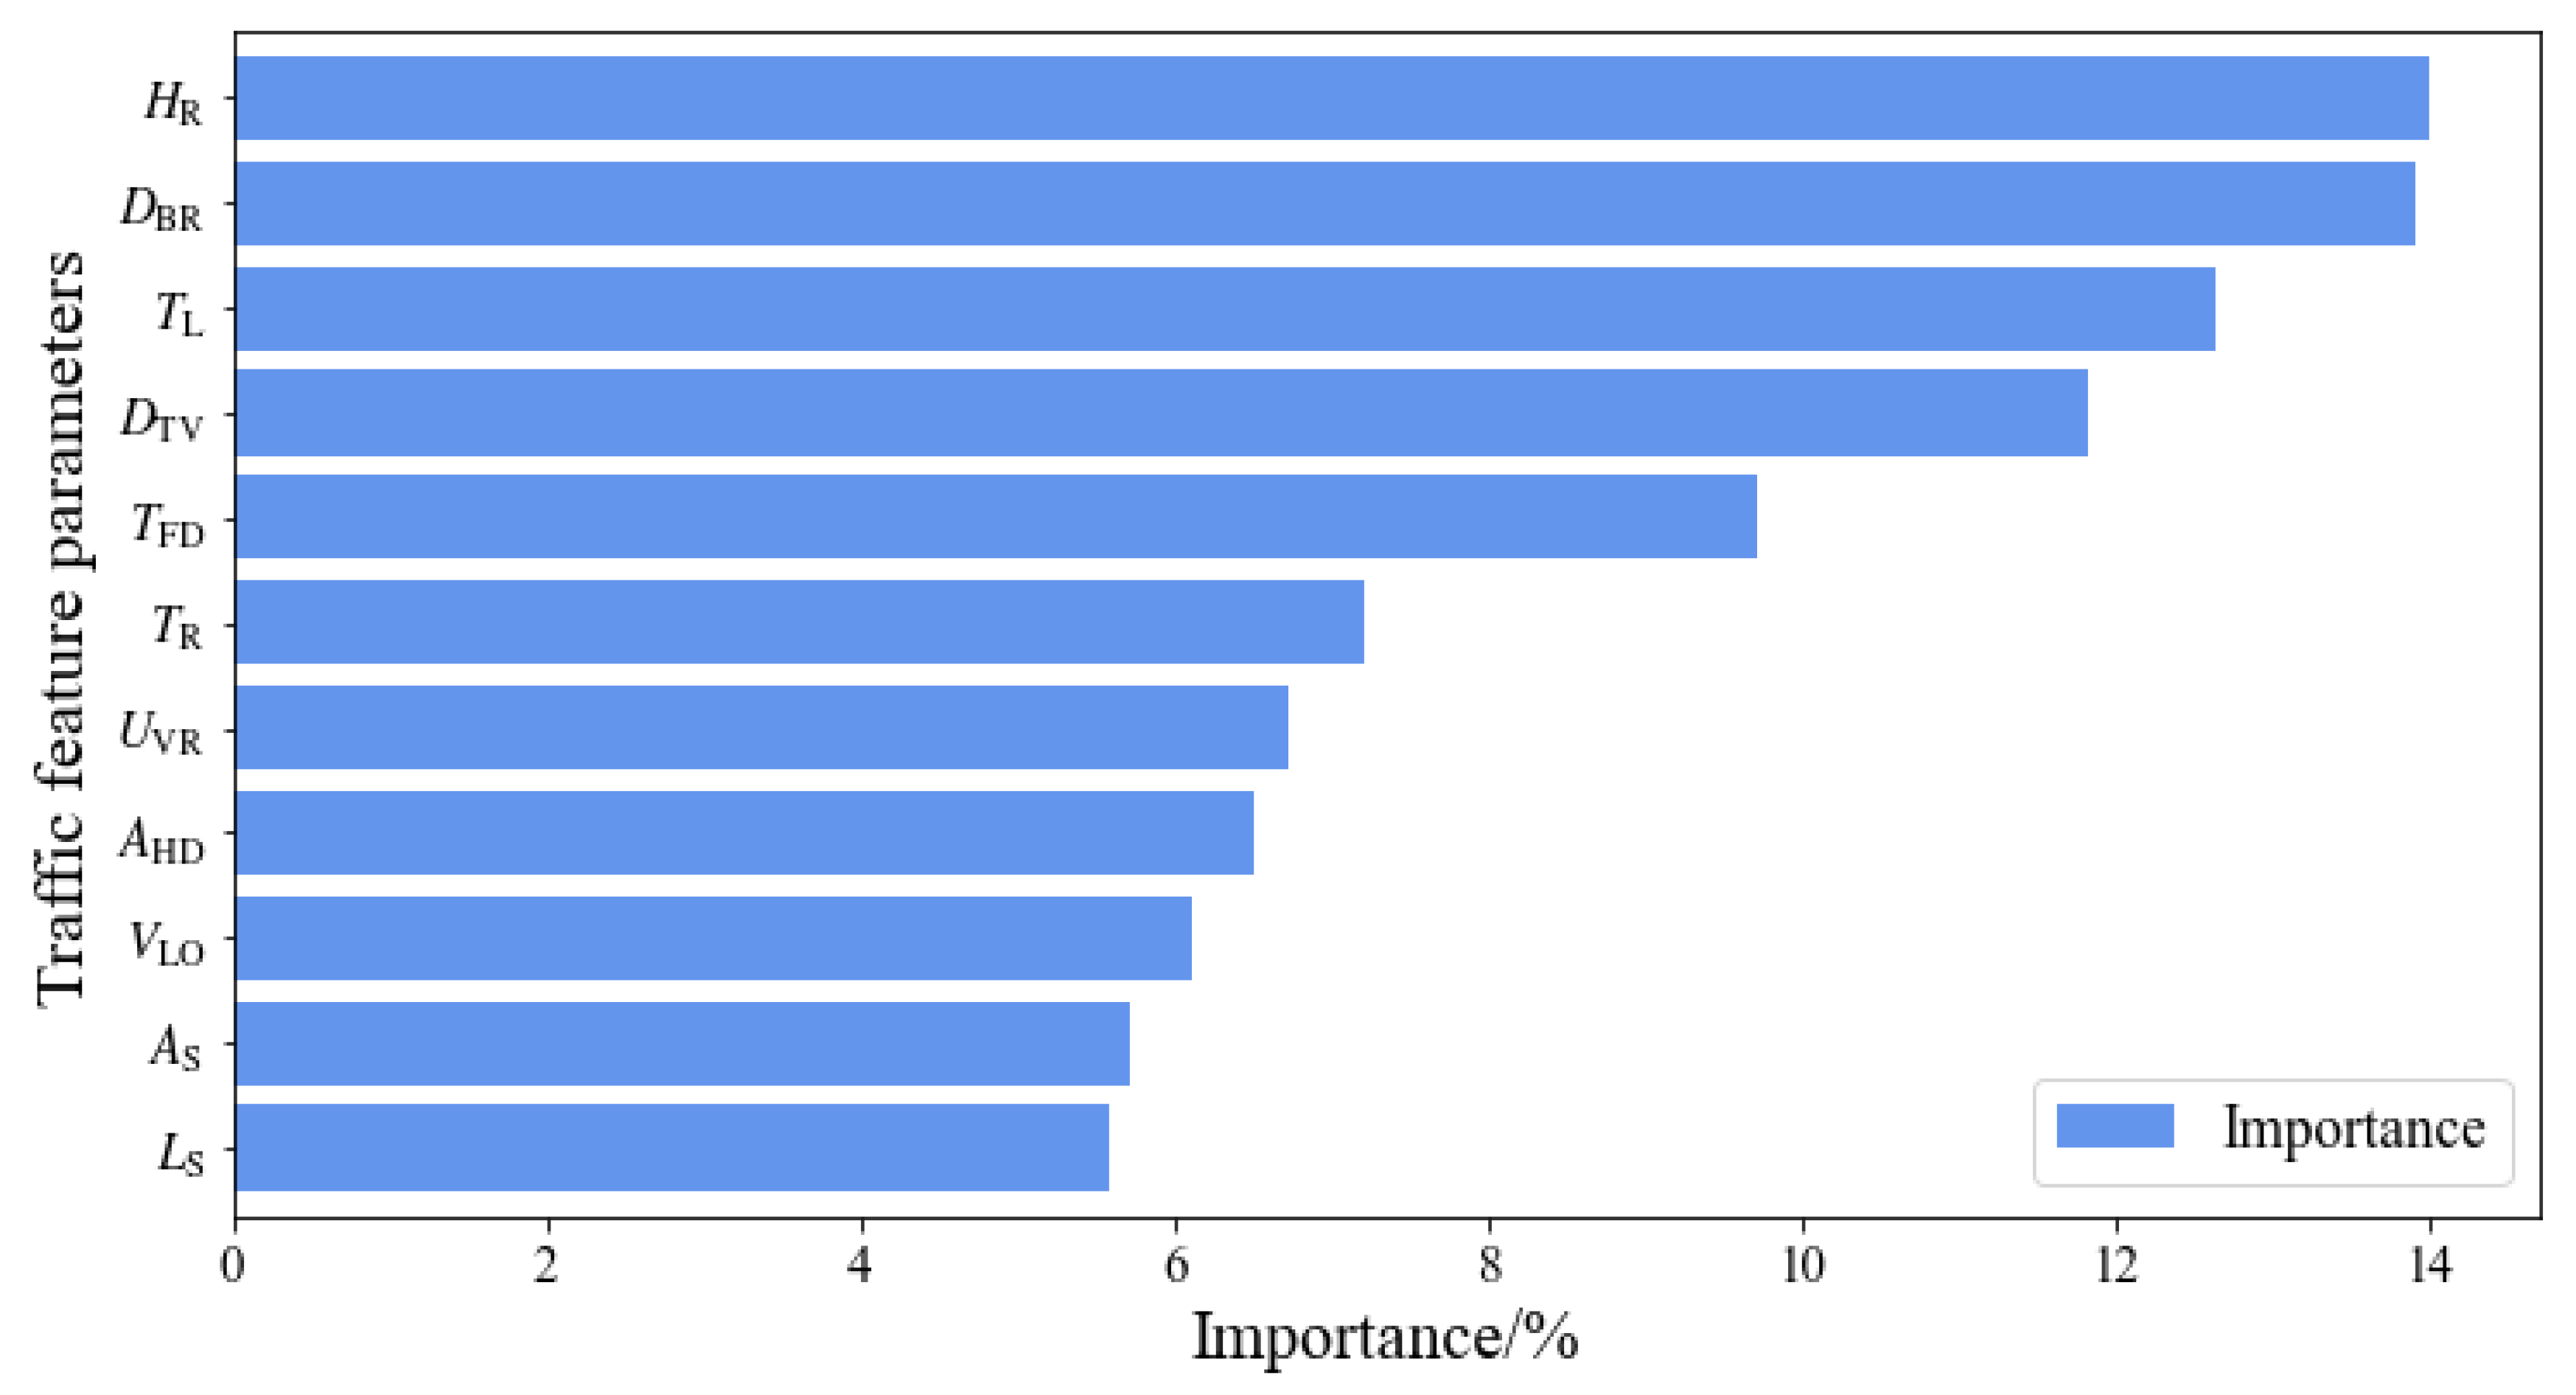
3.2.2. Ranking of Feature Variables

To screen the important feature parameters for the influence of truck collisions on two-lane rural highways. In this study, the information gain of the XGBoost model was used as the importance score of the feature parameters as a measure of the contribution of the feature parameters to the truck collision risk identification model on two-lane rural highways, and the importance was ranked according to the contribution of the feature parameters (see Figure 11). Figure 11 shows the greatest impact is the horizontal curve radius on truck crashes on two-lane rural highways, followed by the driving behavior risk, with the importance of 14.011% and 13.907%, respectively.
In summary, this study compares the prediction performance of the light gradient-boosting machine and the extreme gradient-boosting, and it can be found that the prediction effect of the extreme gradient-boosting is obviously better than that of the light gradient-boosting machine. The two most crucial traffic feature parameters screened based on the extreme gradient-boosting are the horizontal curve radius and the driving behavior risk, whose importance is 14.011% and 13.907%, respectively.

3.3. High-Risk Scene Identification

In this study, the bivariate extreme value theory model in part 3.1 was used to predict the collision probability of the truck and its interacting vehicle on two-lane rural highway, combined with the important feature variables screened in part 3.2 to identify high-risk scenes for truck driving on two-lane rural highways.

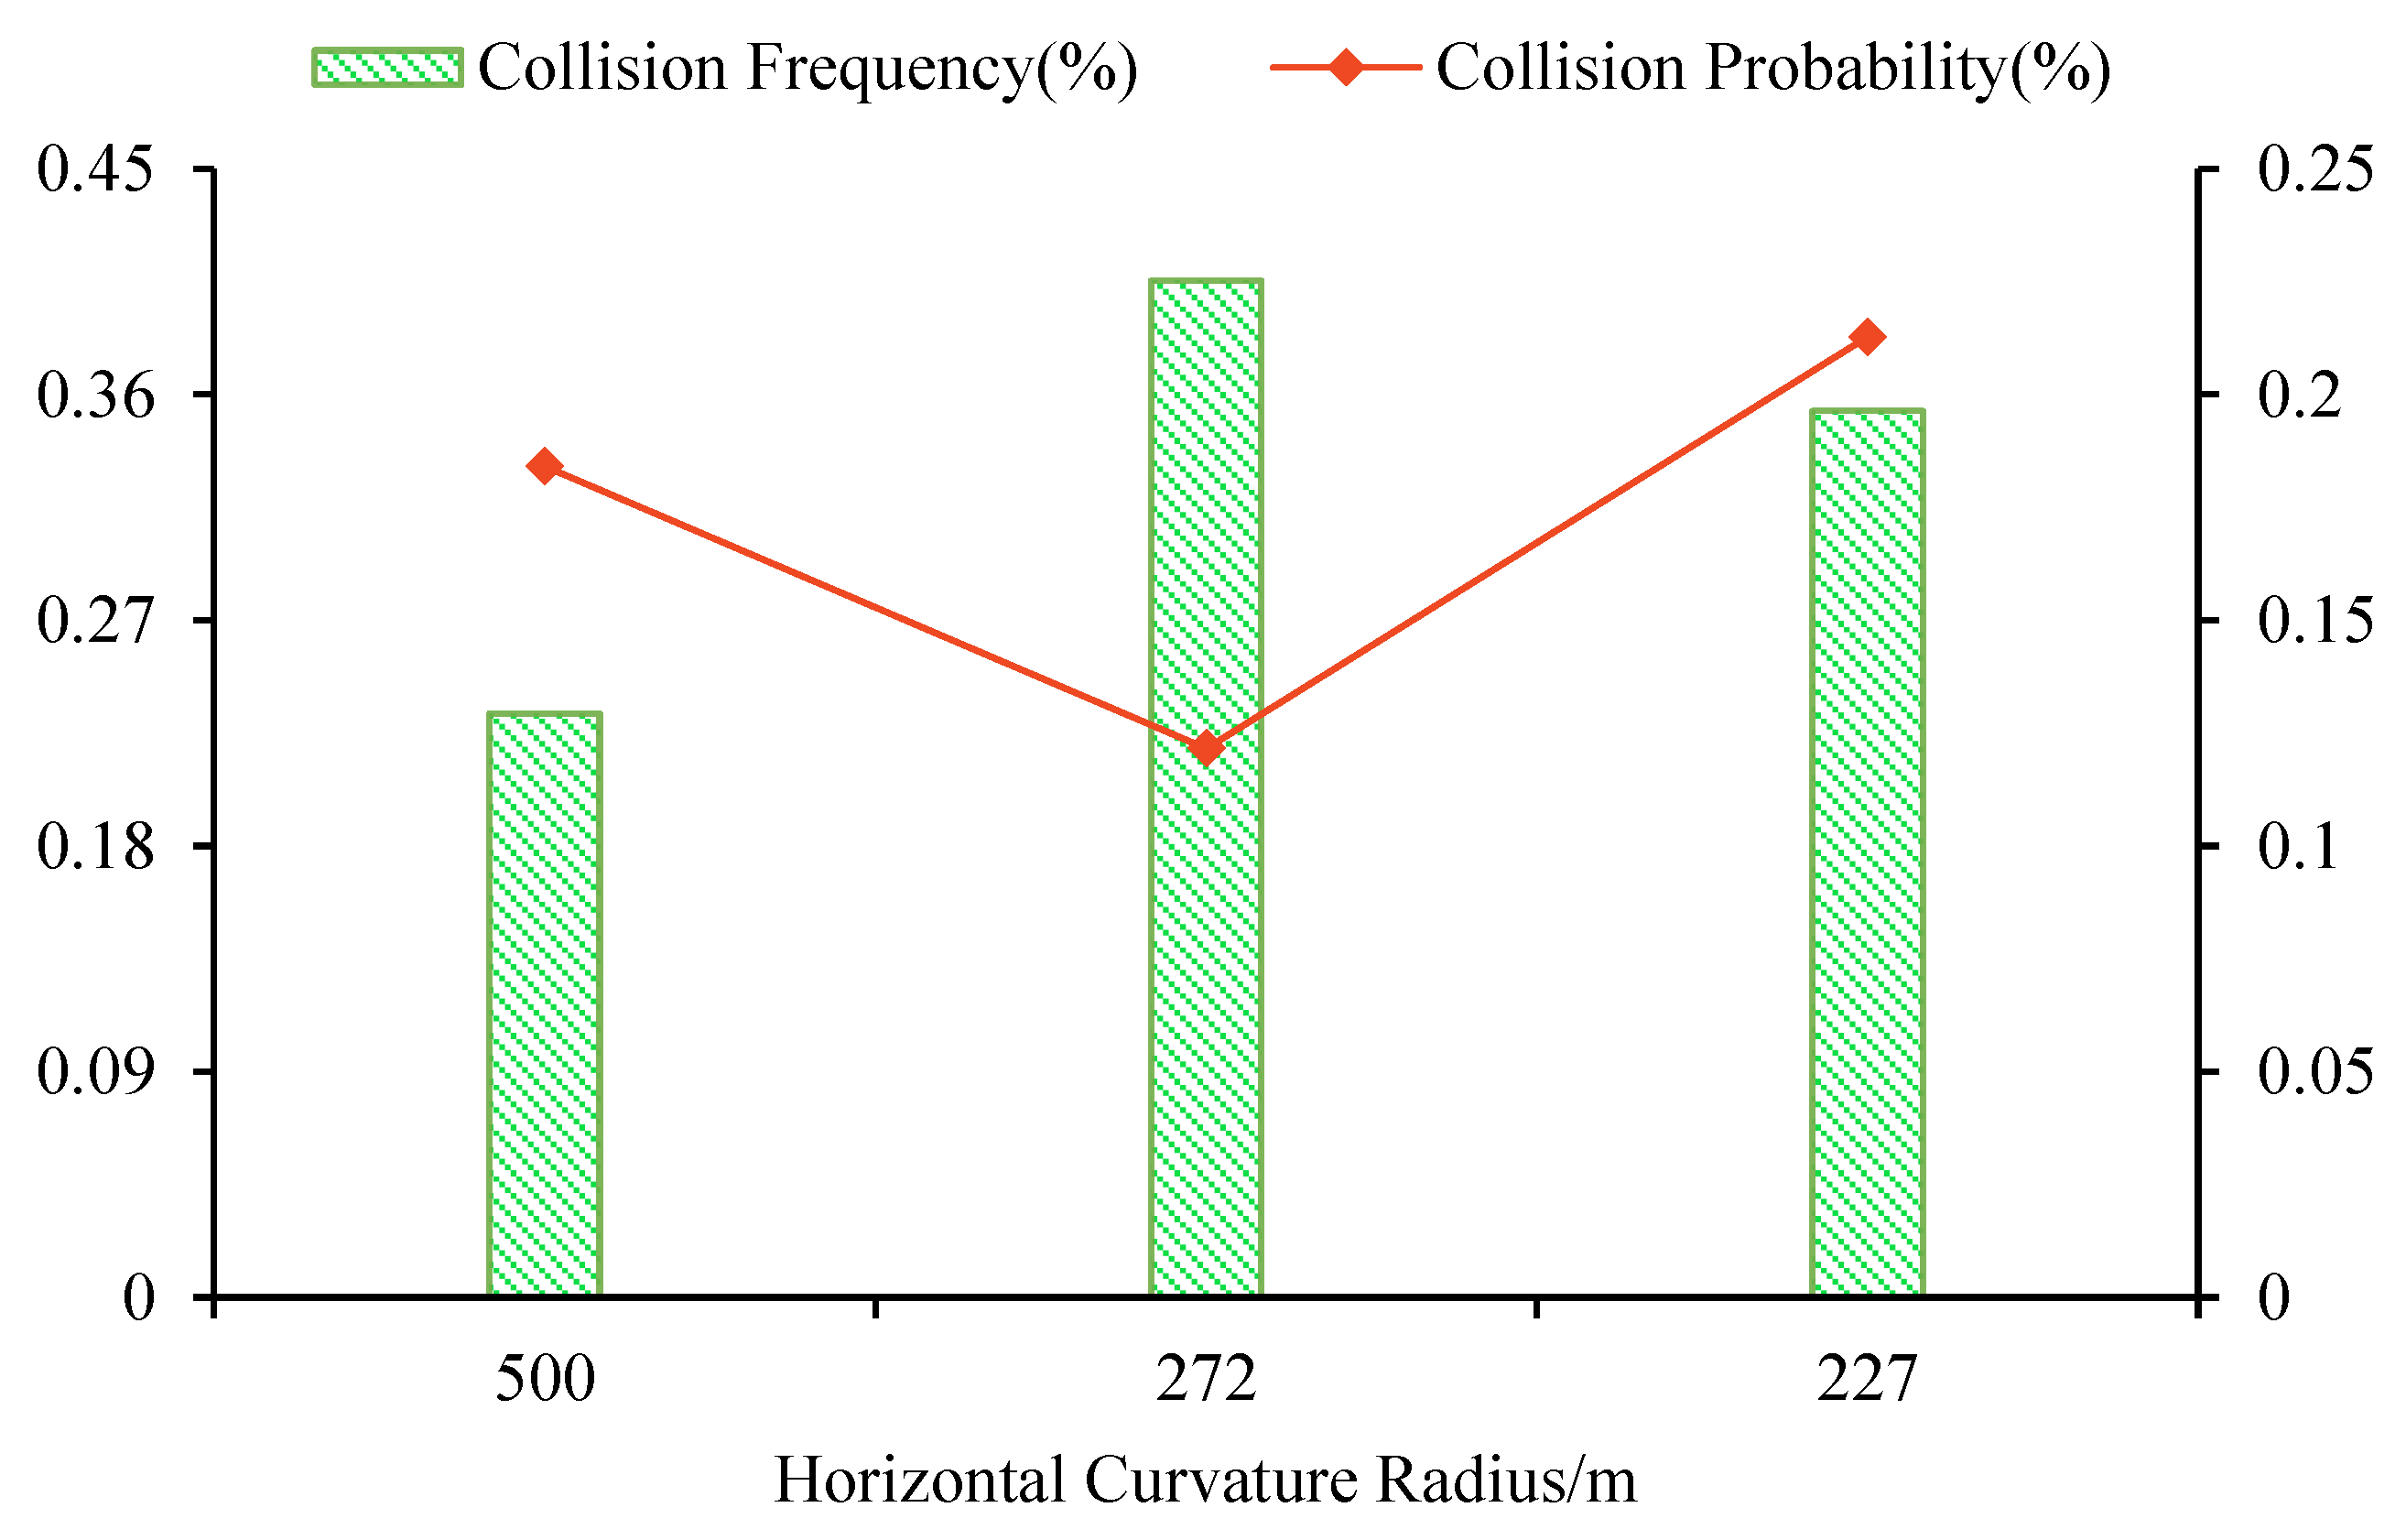
3.3.1. Identification of High-Risk Horizontal Curvature Radius

In Figure 12, the horizontal curve radius of 500 m has the lowest collision frequency on two-lane rural highways; yet, it has a higher collision probability, suggesting that the radius of the horizontal curve is larger, the driver’s crisis awareness is weak, and the truck driving speed is faster, resulting in a higher collision probability. The horizontal curve radius of 272 m on two-lane rural highways on the truck collision frequency is the highest, but the collision probability is the smallest; the reason is that the radius of the curve is smaller, and the driver’s awareness of the danger is enhanced, reducing the driving speed, and making the collision probability reduced. The horizontal curve radius of 227 m on two-lane rural highways truck collision frequency is high, and the probability of collision is the largest. It is because trucks have the characteristics of a high center of gravity position, heavy load, high kinetic energy, and large volume, and two-lane rural roads are narrow. When the curves are too sharp, the trucks deceleration is not timely, or trucks in the turning process cross the center line of the road and occupy the opposite lane and then collide with the opposite vehicle, leading to a high frequency and probability of collision on sharp curves. Therefore, it is reasonable to believe that the horizontal curve radius of 227 m is a high-risk scene for trucks on two-lane rural highways, which is a conclusion that corresponds with Gabauer et al.’s [60] conclusion that when the curve radius is less than 820 ft (250 m), the crash risk is ten times greater than the horizontal curve radius of more than 820 ft.
In this study, we recommend placing warning signs and deploying speed-reduction devices on two-lane rural highways with a horizontal bend radius of 227 m or less and installing center guardrail barriers to prevent trucks from crossing the centerline during turns. In addition, the geometric design of two-lane rural highways should cautiously be considered for the horizontal curve radius of 227 m or less.

3.3.2. Identification of High-Risk Driving Behaviors for Truck Drivers

Figure 13 illustrates the effect of the driving behavior risk on the probability of truck crashes. On the whole, it can be found from Figure 13 that the driving behavior risk of lower than 65 points, a relatively low value, indicates that the driving behavior of truck drivers on two-lane rural highways significantly impacts the risk of truck collisions. Specifically, at the driving behavior risk between 43–65 points, truck collisions are relatively concentrated and less probable, resulting in strong randomness of truck collision probability and implying that the driving behavior of truck drivers on two-lane rural highways is universal in this interval. When the driving behavior risk is lower than 43 points, the distribution of truck collision is less, the probability of truck collision increases sharply, and higher probabilities of truck collision occur from time to time, which means that if the driving behavior risk of lower than 43 points, the driving behavior of truck drivers on two-lane rural highways has a special characteristic, and the probability of truck collision is higher. Therefore, when the driving behavior risk is lower than 43 points, it can be judged as high-risk driving behavior of truck drivers on two-lane rural highways.
This study details measures of driving behavior risk in Section 2.3.1 and finds that the weight associated with the speed is 82% for assessing driving behavior risk. It shows that truck speed has a critical impact on driver behavior risk. Meanwhile, related studies have shown that speed cameras can effectively monitor vehicle speed and are a worthwhile intervention for reducing road traffic collisions [61,62]. Therefore, this study suggests installing speed cameras on two-lane rural highways, focusing on monitoring the truck lateral acceleration, the truck longitudinal acceleration, and the standard deviation of two vehicles’ speed difference to avoid the high-risk driving behavior of truck drivers on two-lane rural highways. If the driving behavior risk is lower than 43 points, i.e., if high-risk driving behavior occurs, the speed cameras should promptly send out signals to remind the truck driver not to accelerate or decelerate frequently, especially to control the driving speed of the truck, maintain the relative stability of the speed of the truck and its interacting vehicle, and thus ensure the safe driving of the trucks.
Thus, this study combined the bivariate extreme value model with the XGBoost model to analyze the influence of curve radius and driving risk trend on truck collisions on two-lane rural highways. We found that the collision probability is the highest when the truck is driving on a road with a horizontal curve radius of 227 m; i.e., a two-lane rural road with a horizontal curve radius of 227 m is a high-risk scene for truck driving. Meanwhile, when the driving behavior risk is lower than 43 points, the driving behavior of truck drivers has high riskiness.

4. Limitations and Future Research

In this study, we propose a modeling framework for truck safety assessment of two-lane rural highways based on the time to collision and the post-encroachment time, while both the time to collision and the post-encroachment time are temporal measures that mainly predict the probability of collision occurrence and cannot measure the severity of collisions. Therefore, the next step of our research focuses on the integration of measures that can reflect the severity of collisions (e.g., deceleration rate to avoid crash) based on the bivariate model of the time to collision and the post-encroachment time and the use of multivariate extreme value theory to construct a theoretical framework that can simultaneously assess the probability and severity of truck collisions on two-lane rural highways. At the same time, many crashes involve the vehicle leaving the road [7]. According to the definitions of the time to collision and the post-encroachment time, two or more moving traffic participants are necessary to complete the model construction, so the model framework proposed in this study cannot be adapted to this type of collision.
Since this study primarily uses custom approaches to predict truck collision probability, the model prediction performance needs to be improved, while advanced algorithms (e.g., heuristics, metaheuristics) are widely used in online learning, scheduling, transportation, data classification, etc., and have proven to be effective in improving model prediction performance [63,64,65,66,67]. Therefore, by optimizing the method proposed in this study using advanced algorithms, it will be possible to improve its computational performance (e.g., metaheuristic algorithm combined with XGBoost algorithm) and thus more accurately predict the collision probability of trucks on two-lane rural roads.

5. Conclusions

In this study, the truck’s and interacting vehicle’s different driving trajectories on two-lane rural highways were observed through drone video trajectory data. Then traffic conflict measures applicable to different driving trajectories were selected and combined with extreme value theory to construct a negative post-encroachment time model, a negative time-to-collision model, and a bivariate extreme value theory model incorporating the post-encroachment time and the time to collision into a unified framework for traffic safety analysis, respectively. It was found that the bivariate extreme value theory model predicted the annual probability of collision for trucks on two-lane rural highways to be 5.84%, with a prediction accuracy of 98.92%, which was 167.33% and 10.80% higher than the negative post-encroachment time model and the negative time-to-collision model, respectively. The confidence interval estimated by the bivariate extreme value theory model was narrower than that of the univariate extreme value theory model, indicating that the bivariate extreme value theory model had higher prediction precision.
Based on the bivariate extreme value theory model, severe conflict thresholds for trucks on two-lane rural highways were selected, and the conflict levels were classified into general and severe conflicts. Meanwhile, the traffic feature parameters were extracted from four aspects of the people–vehicle–road–environment using multi-source data and combined with LightGBM and XGBoost to construct truck collision risk identification models. Comparing the Light model and the XGBoost model, we found that the XGBoost model has better classification recognition performance for two-lane rural highway truck collision risk, and the false-alarm rate between general and severe conflicts was extremely low.
To identify high-risk scenes of trucks driving on two-lane rural highways, the XGBoost model was used to rank the importance of traffic feature parameters. Then, the bivariate extreme value theory model was applied to predict the truck collision probability under the influence of important traffic feature parameters. It was found that the horizontal curve radius and the driving behavior risk are the traffic feature parameters with the most significant impact on truck collisions on two-lane rural highways, and their importance is 14.011% and 13.907%, respectively. The collision probability of trucks driving on two-lane rural highways with a horizontal curve radius of 227 m is the highest; we can install warning signs, deceleration devices, and central guardrail barriers to alleviate the collision during truck steering. Additionally, when the driving behavior risk is lower than 43 points, the probability of truck collisions increases sharply, indicating that the two-lane rural highway has higher driving risks, and we advise installing speed cameras to control the speed to prevent unstable truck speed, which can lead to vehicle collisions.
Overall, based on extreme value theory, traffic conflict theory, and machine learning algorithms, this study successfully integrated the applicability of time to collision and post-encroachment time to different driving trajectories and incorporated the identical trajectories and cross trajectories into a unified framework for truck safety assessment on two-lane rural highways as a means to predict truck collision probability and identify high-risk scenes of truck driving. The research results have broad application prospects in analyzing truck traffic safety on two-lane rural highways, e.g., providing real-time and reliable risk warnings for managing two-lane rural road operation safety and avoiding risky driving behaviors of drivers to prevent and control traffic crashes on two-lane rural highways effectively. Looking at the horizontal curve radius of two-lane rural highways is essential. It has the greatest impact on truck collisions and has a high collision frequency and high probability in sharp curves. We can install warning signals to increase drivers’ awareness of danger and implement the deceleration devices to deaccelerate the vehicle. At the same time, the research results provide a theoretical foundation for the alignment design of two-lane rural highways. The other is driving behavior risk; it can provide real-time and reliable speed risk warning signals through speed cameras, remind the driver to adjust the speed timely and avoid the driver’s dangerous driving behavior, and effectively prevent and control two-lane rural highway truck collisions.

Author Contributions

Conceptualization and supervision, X.J. and Z.G.; methodology, Z.G.; software, Z.G. and R.C.; validation, M.L. and W.Q.; data curation, Z.G. and M.L.; writing—original draft preparation, Z.G. and X.J.; writing—review and editing, Z.G. and X.J.; visualization, Z.G. and R.C.; project administration, X.J. and W.Q.; funding acquisition, X.J. and W.Q. All authors have read and agreed to the published version of the manuscript.

Funding

This research was funded by the National Natural Science Foundation of China (52062024 and 52002161) and the Science and Technology Innovation and Demonstration Program for Department of Transport of Yunnan Province (2021-90-3).

Institutional Review Board Statement

Not applicable.

Informed Consent Statement

Not applicable.

Data Availability Statement

Data are available from the corresponding author upon request.

Acknowledgments

The author wants to express his gratitude to all the workmates of the research for their helpful suggestions and patient guidance.

Conflicts of Interest

The authors declare no conflict of interest.

References

  1. Cafiso, S.; Alessandro, D.G.; Giacomo, D.S.; Grazia, L.C.; Bhagwant, P. Development of comprehensive accident models for two-lane rural highways using exposure, geometry, consistency and context variables. Accid. Anal. Prev. 2010, 42, 1072–1079. [Google Scholar] [CrossRef] [PubMed]
  2. Xie, S.K.; Ji, X.F.; Yang, W.C.; Fang, R.; Hao, J.J. Exploring risk factors with crash severity on china two-lane rural roads using a random-parameter ordered probit model. J. Adv. Transp. 2020, 2020, 8870497. [Google Scholar] [CrossRef]
  3. Champahom, T.; Jomnonkwao, S.; Watthanaklang, D.; Karoonsoontawong, A.; Chatpattananan, V.; Ratanavaraha, V. Applying hierarchical logistic models to compare urban and rural roadway modeling of severity of rear-end vehicular crashes. Accid. Anal. Prev. 2020, 141, 105537. [Google Scholar] [CrossRef]
  4. Se, C.; Champahom, T.; Jomnonkwao, S.; Chaimuang, P.; Ratanavaraha, V. Empirical comparison of the effects of urban and rural crashes on motorcyclist injury severities: A correlated random parameters ordered probit approach with heterogeneity in means. Accid. Anal. Prev. 2021, 161, 106352. [Google Scholar] [CrossRef] [PubMed]
  5. Chen, C.; Zhang, G.; Tarefder, R.; Ma, J.; Wei, H.; Guan, H. A multinomial logit model-bayesian network hybrid approach for driver injury severity analyses in rear-end crashes. Accid. Anal. Prev. 2015, 80, 76–88. [Google Scholar] [CrossRef]
  6. Wang, L.J.; Ning, P.S.; Yin, P.; Cheng, P.X.; Schwebel, D.C.; Liu, J.M.; Wu, Y.; Liu, Y.N.; Qi, J.L.; Zeng, X.Y. Road traffic mortality in china: Analysis of national surveillance data from 2006 to 2016. Lancet Public Health 2019, 4, e245–e255. [Google Scholar] [CrossRef]
  7. Al-Bdairi, N.S.S.; Hernandez, S. Comparison of contributing factors for injury severity of large truck drivers in run-off-road crashes on rural and urban roadways: Accounting for unobserved heterogeneity. Int. J. Transp. Sci. Technol. 2020, 9, 116–127. [Google Scholar] [CrossRef]
  8. Yuda, E.; Konishi, K.; Takahashi, M. Evaluation of physiological and psychological stress in head driver leading self-driving truck. J. Ind. Manag. Optim. 2021, ISASE2021, 1–2. [Google Scholar] [CrossRef]
  9. Meng, F.; Sze, N.N.; Song, C.; Chen, T.; Zeng, Y. Temporal instability of truck volume composition on non-truck-involved crash severity using uncorrelated and correlated grouped random parameters binary logit models with space-time variations. Anal. Methods Accid. Res. 2021, 31, 100168. [Google Scholar] [CrossRef]
  10. Xu, J.L.; Xin, T.A.; Gao, C.; Sun, Z.H. Study on the maximum safe instantaneous input of the steering wheel against rollover for trucks on horizontal curves. Int. J. Environ. Res. Public Health 2022, 19, 2025. [Google Scholar] [CrossRef] [PubMed]
  11. Baikejuli, M.; Shi, J.; Hussain, M. A study on the probabilistic quantification of heavy-truck crash risk under the influence of multi-factors. Accid. Anal. Prev. 2022, 174, 106771. [Google Scholar] [CrossRef] [PubMed]
  12. Yuan, Y.L.; Yang, M.; Guo, Y.Y.; Rasouli, S.; Gan, Z.X.; Ren, Y.F. Risk factors associated with truck-involved fatal crash severity: Analyzing their impact for different groups of truck drivers. J. Saf. Res. 2021, 76, 154–165. [Google Scholar] [CrossRef]
  13. Friswell, R.; Williamson, A. Management of heavy truck driver queuing and waiting for loading and unloading at road transport customers’ depots. Saf. Sci. 2019, 120, 194–205. [Google Scholar] [CrossRef]
  14. Wang, C.Z.; Chen, F.; Zhang, Y.L.; Cheng, J.C. Spatiotemporal instability analysis of injury severities in truck-involved and non-truck-involved crashes. Anal. Methods Accid. Res. 2022, 34, 100214. [Google Scholar] [CrossRef]
  15. Hyun, K.; Jeong, K.; Tok, A.; Ritchie, S.G. Assessing crash risk considering vehicle interactions with trucks using point detector data. Accid. Anal. Prev. 2019, 130, 75–83. [Google Scholar] [CrossRef]
  16. Shah, D.; Lee, C. Analysis of effects of driver’s evasive action time on rear-end collision risk using a driving simulator. J. Saf. Res. 2021, 78, 242–250. [Google Scholar] [CrossRef] [PubMed]
  17. Davis, G.A.; Hourdos, J.; Xiong, H.; Chatterjee, I. Outline for a causal model of traffic conflicts and crashes. Accid. Anal. Prev. 2011, 43, 1907–1919. [Google Scholar] [CrossRef]
  18. Charly, A.; Mathew, T.V. Estimation of traffic conflicts using precise lateral position and width of vehicles for safety assessment. Accid. Anal. Prev. 2019, 132, 105264. [Google Scholar] [CrossRef]
  19. Hu, Y.P.; Li, Y.; Huang, H.L.; Lee, J.; Yuan, C.; Zou, G.Q. A high-resolution trajectory data driven method for real-time evaluation of traffic safety. Accid. Anal. Prev. 2022, 165, 106503. [Google Scholar] [CrossRef] [PubMed]
  20. Yu, R.J.; Han, L.; Zhang, H. Trajectory data based freeway high-risk events prediction and its influencing factors analyses. Accid. Anal. Prev. 2021, 154, 106085. [Google Scholar] [CrossRef] [PubMed]
  21. Goyani, J.; Paul Aninda, B.; Gore, N.; Arkatkar, S.; Joshi, G. Investigation of crossing conflicts by vehicle type at unsignalized t-intersections under varying roadway and traffic conditions in India. J. Transp. Eng. A Syst. 2021, 147, 05020011. [Google Scholar] [CrossRef]
  22. Zheng, L.; Sayed, T.; Tageldin, A. Before-after safety analysis using extreme value theory: A case of left-turn bay extension. Accid. Anal. Prev. 2018, 121, 258–267. [Google Scholar] [CrossRef] [PubMed]
  23. Yuan, Z.Z.; He, K.; Yang, Y. A roadway safety sustainable approach: Modeling for real-time traffic crash with limited data and its reliability verification. J. Adv. Transp. 2022, 2022, 1570521. [Google Scholar] [CrossRef]
  24. Zheng, Q.K.; Xu, C.C.; Liu, P.; Wang, Y.X. Investigating the predictability of crashes on different freeway segments using the real-time crash risk models. Accid. Anal. Prev. 2021, 159, 106213. [Google Scholar] [CrossRef]
  25. Guo, M.; Zhao, X.H.; Yao, Y.; Yan, P.W.; Su, Y.L.; Bi, C.F.; Wu, D.Y. A study of freeway crash risk prediction and interpretation based on risky driving behavior and traffic flow data. Accid. Anal. Prev. 2021, 160, 106328. [Google Scholar] [CrossRef]
  26. Orsini, F.; Gecchele, G.; Rossi, R.; Gastaldi, M. A conflict-based approach for real-time road safety analysis: Comparative evaluation with crash-based models. Accid. Anal. Prev. 2021, 161, 106382. [Google Scholar] [CrossRef]
  27. Haule, H.J.; Ali, M.D.S.; Alluri, P.; Sando, T. Evaluating the effect of ramp metering on freeway safety using real-time traffic data. Accid. Anal. Prev. 2021, 157, 106181. [Google Scholar] [CrossRef] [PubMed]
  28. Haghighi, N.; Liu, X.C.; Zhang, G.H.; Porter, R.J. Impact of roadway geometric features on crash severity on rural two-lane highways. Accid. Anal. Prev. 2018, 111, 34–42. [Google Scholar] [CrossRef]
  29. Liu, M.M.; Chen, Y.S. Predicting real-time crash risk for urban expressways in china. Math. Probl. Eng. 2017, 2017, 6263726. [Google Scholar] [CrossRef]
  30. Ampadu, V.; Alrejjal, A.; Ksaibati, K. Incorporating horizontal curves and roadway geometry into the automated updated grade severity rating system. Transp. Res. Rec. 2022, 2676, 329–343. [Google Scholar] [CrossRef]
  31. Alrejjal, A.; Ksaibati, K. Impact of mountainous interstate alignments and truck configurations on rollover propensity. J. Saf. Res. 2022, 80, 160–174. [Google Scholar] [CrossRef] [PubMed]
  32. Al-Bdairi, N.S.S.; Behnood, A. Assessment of temporal stability in risk factors of crashes at horizontal curves on rural two-lane undivided highways. J. Saf. Res. 2021, 76, 205–217. [Google Scholar] [CrossRef] [PubMed]
  33. Arbabzadeh, N.; Jafari, M. A data-driven approach for driving safety risk prediction using driver behavior and roadway information data. IEEE Trans. Intell. Transp. Syst. 2017, 19, 446–460. [Google Scholar] [CrossRef]
  34. Yuksel, A.S.; Atmaca, S. Driver’s black box: A system for driver risk assessment using machine learning and fuzzy logic. J. Intell. Transp. Syst. 2021, 25, 482–500. [Google Scholar] [CrossRef]
  35. Parsa, A.B.; Movahedi, A.; Taghipour, H.; Derrible, S.; Mohammadian, A. Toward safer highways, application of xgboost and shap for real-time accident detection and feature analysis. Accid. Anal. Prev. 2020, 136, 105405. [Google Scholar] [CrossRef]
  36. Parsa, A.B.; Taghipour, H.; Derrible, S.; Mohammadian, A. Real-time accident detection: Coping with imbalanced data. Accid. Anal. Prev. 2019, 129, 202–210. [Google Scholar] [CrossRef] [PubMed]
  37. Dong, C.J.; Dong, Q.; Huang, B.S.; Hu, W.; Nambisan, S. Estimating factors contributing to frequency and severity of large truck–involved crashes. J. Transp. Eng. A Syst. 2017, 143, 04017032. [Google Scholar] [CrossRef]
  38. Alozi, A.R.; Hussein, M. Evaluating the safety of autonomous vehicle–pedestrian interactions: An extreme value theory approach. Anal. Methods Accid. Res. 2022, 35, 100230. [Google Scholar] [CrossRef]
  39. Chan, S.; Chu, J.; Zhang, Y.Y.; Nadarajah, S. An extreme value analysis of the tail relationships between returns and volumes for high frequency cryptocurrencies. Res. Int. Bus. Financ. 2022, 59, 101541. [Google Scholar] [CrossRef]
  40. Vieira, S.; Migliavacca, D.; Quevedo, D. Analysis of hydrological extremes in the guaíba hydrographic region: An application of extreme values theory. Braz. J. Environ. Sci. 2022, 57, 239–255. [Google Scholar] [CrossRef]
  41. Stopka, K.S.; Yaghoobi, M.; Allison, J.E.; McDowell, D.L. Simulated effects of sample size and grain neighborhood on the modeling of extreme value fatigue response. Acta Mater. 2022, 224, 117524. [Google Scholar] [CrossRef]
  42. Songchitruksa, P.; Tarko, A.P. The extreme value theory approach to safety estimation. Accid. Anal. Prev. 2006, 38, 811–822. [Google Scholar] [CrossRef]
  43. Ali, Y.; Haque, M.M.; Zheng, Z.D. An extreme value theory approach to estimate crash risk during mandatory lane-changing in a connected environment. Anal. Methods Accid. Res. 2022, 33, 100193. [Google Scholar] [CrossRef]
  44. Zheng, L.; Sayed, T.; Essa, M. Bayesian hierarchical modeling of the non-stationary traffic conflict extremes for crash estimation. Anal. Methods Accid. Res. 2019, 23, 100100. [Google Scholar] [CrossRef]
  45. Jonasson, J.K.; Rootzén, H. Internal validation of near-crashes in naturalistic driving studies: A continuous and multivariate approach. Accid. Anal. Prev. 2014, 62, 102–109. [Google Scholar] [CrossRef] [PubMed]
  46. Zheng, L.; Ismail, K.; Sayed, T.; Fatema, T. Bivariate extreme value modeling for road safety estimation. Accid. Anal. Prev. 2018, 120, 83–91. [Google Scholar] [CrossRef]
  47. Zheng, L.; Sayed, T. From univariate to bivariate extreme value models: Approaches to integrate traffic conflict indicators for crash estimation. Transp. Res. Part C Emerg. Technol. 2019, 103, 211–225. [Google Scholar] [CrossRef]
  48. Arun, A.; Haque, M.M.; Bhaskar, A.; Washington, S.; Sayed, T. A bivariate extreme value model for estimating crash frequency by severity using traffic conflicts. Anal. Methods Accid. Res. 2021, 32, 100180. [Google Scholar] [CrossRef]
  49. Cavadas, J.; Azevedo, C.L.; Farah, H.; Ferreira, A. Road safety of passing maneuvers: A bivariate extreme value theory approach under non-stationary conditions. Accid. Anal. Prev. 2020, 134, 105315. [Google Scholar] [CrossRef] [PubMed]
  50. Zheng, L.; Sayed, T.; Essa, M. Validating the bivariate extreme value modeling approach for road safety estimation with different traffic conflict indicators. Accid. Anal. Prev. 2019, 123, 314–323. [Google Scholar] [CrossRef]
  51. Man, C.K.; Quddus, M.; Theofilatos, A. Transfer learning for spatio-temporal transferability of real-time crash prediction models. Accid. Anal. Prev. 2022, 165, 106511. [Google Scholar] [CrossRef]
  52. Yang, Y.; He, K.; Wang, Y.P.; Yuan, Z.Z.; Yin, Y.H.; Guo, M.Z. Identification of dynamic traffic crash risk for cross-area freeways based on statistical and machine learning methods. Phys. A 2022, 595, 127083. [Google Scholar] [CrossRef]
  53. Leonard, S.; Woehrle, T.; Nikizad, H.; Vearrier, J.; Odean, M.; Renier, C.; Bollins, J.; Eyer, S. Blunt traumatic brachial plexus injuries in a northern rural us setting: Increased likelihood in unshielded motor-powered crashes. Trauma Surg. Acute Care Open 2020, 5, e000558. [Google Scholar] [CrossRef] [PubMed]
  54. Wang, J.H.; Fu, T.; Xue, J.T.; Li, C.M.; Song, H.; Xu, W.X.; Shangguan, Q.Q. Realtime wide-area vehicle trajectory tracking using millimeter-wave radar sensors and the open TJRD TS dataset. Int. J. Transp. Sci. Technol. 2022. [Google Scholar] [CrossRef]
  55. Khoda Bakhshi, A.; Ahmed, M.M. Driving simulator trajectory-level analysis of truck drivers’ behavioral alteration in connected vehicles environment under fog with complex roadway geometry. Transp. Res. Rec. 2022, 2676, 435–451. [Google Scholar] [CrossRef]
  56. Shen, J.J.; Yang, G.C. Crash risk assessment for heterogeneity traffic and different vehicle-following patterns using microscopic traffic flow data. Sustainability. 2020, 12, 9888. [Google Scholar] [CrossRef]
  57. Hou, Q.Z.; Huo, X.Y.; Leng, J.Q. A correlated random parameters tobit model to analyze the safety effects and temporal instability of factors affecting crash rates. Accid. Anal. Prev. 2020, 134, 105326. [Google Scholar] [CrossRef]
  58. Li, Y.S.; Lu, J.; Xu, K.S. Crash risk prediction model of lane-change behavior on approaching intersections. Discret. Dyn. Nat. Soc. 2017, 2017, 7328562. [Google Scholar] [CrossRef]
  59. Alsharkawi, A.; Al-Fetyani, M.; Dawas, M.; Saadeh, H.; Alyaman, M. Poverty classification using machine learning: The case of jordan. Sustainability 2021, 13, 1412. [Google Scholar] [CrossRef]
  60. Gabauer, D.J.; Li, X.L. Influence of horizontally curved roadway section characteristics on motorcycle-to-barrier crash frequency. Accid. Anal. Prev. 2015, 77, 105–112. [Google Scholar] [CrossRef] [PubMed]
  61. Job, R.F.S. Evaluations of speed camera interventions can deliver a wide range of outcomes: Causes and policy implications. Sustainability 2022, 14, 1765. [Google Scholar] [CrossRef]
  62. Wilson, C.; Willis, C.; Hendrikz, J.; Le Brocque, R.; Bellamy, N. Speed cameras for the prevention of road traffic injuries and deaths. Cochrane Database Syst. Rev. 2010, 11, CD004607. [Google Scholar] [CrossRef]
  63. Zhao, H.T.; Zhang, C.S. An online-learning-based evolutionary many-objective algorithm. Inf. Sci. 2020, 509, 1–21. [Google Scholar] [CrossRef]
  64. Pasha, J.; Dulebenets, M.A.; Fathollahi-Fard, A.M.; Tian, G.; Lau, Y.-y.; Singh, P.; Liang, B. An integrated optimization method for tactical-level planning in liner shipping with heterogeneous ship fleet and environmental considerations. Adv. Eng. Inform. 2021, 48, 101299. [Google Scholar] [CrossRef]
  65. Kavoosi, M.; Dulebenets, M.A.; Abioye, O.F.; Pasha, J.; Wang, H.; Chi, H. An augmented self-adaptive parameter control in evolutionary computation: A case study for the berth scheduling problem. Adv. Eng. Inform. 2019, 42, 100972. [Google Scholar] [CrossRef]
  66. Dulebenets, M. A comprehensive evaluation of weak and strong mutation mechanisms in evolutionary algorithms for truck scheduling at cross-docking terminals. IEEE Access 2018, 6, 65635–65650. [Google Scholar] [CrossRef]
  67. Reilly, D.; Taylor, M.; Fergus, P.; Chalmers, C.; Thompson, S. The categorical data conundrum: Heuristics for classification problems—A case study on domestic fire injuries. IEEE Access 2022, 10, 70113–70125. [Google Scholar] [CrossRef]
Figure 1. Truck driving environment on two-lane rural highway.
Sustainability 14 11212 g001
Figure 2. Traffic environment in the research section and video screenshots. (a) Straight road section. (b) Curved road section.
Sustainability 14 11212 g002
Figure 3. Average residual life plot of the negative post-encroachment time.
Sustainability 14 11212 g003
Figure 4. Threshold stability plot of the negative post-encroachment time.
Sustainability 14 11212 g004
Figure 5. Average residual life plot of the negative time to collision.
Sustainability 14 11212 g005
Figure 6. Threshold stability plot of the negative time to collision.
Sustainability 14 11212 g006
Figure 7. Correlation dependence function plot.
Sustainability 14 11212 g007
Figure 8. Prediction accuracy of the univariate extreme value theory model and the bivariate extreme value theory model.
Sustainability 14 11212 g008
Figure 9. Comparison of confidence intervals between the univariate extreme value theory (UEVT) model and the bivariate extreme value theory (BEVT) model.
Sustainability 14 11212 g009
Figure 10. Model prediction effect plot. (a) Confusion matrix of LightGBM. (b) ROC curve of LightGBM. (c) Confusion matrix of XGBoost. (d) ROC curve of XGBoost.
Sustainability 14 11212 g010
Figure 11. Importance ranking plot of feature parameters.
Sustainability 14 11212 g011
Figure 12. The effect of horizontal curve radius on truck collisions on two-lane rural highways.
Sustainability 14 11212 g012
Figure 13. The effect of driver driving behavior on truck crash probability.
Sustainability 14 11212 g013
Table 1. Basic information of the study sections.
ParametersRoad Section 1Road Section 2Road Section 3
Turn angle74°44′01.3″33°36′52″59°30′54.7″
Radius of curve/(m)272500227
Spiral curve parameter/(m)165200125
Spiral curve length/(m)1008070
Curve length/(m)455373312
Table 2. Description of traffic feature parameters.
TypeNameSymbolsUnitsDescription
Traffic flow environmentAverage time headway [51] A HD sThe average time headway between vehicles in 5 min before the conflict
Average speed [25] A S Km/hThe average speed of vehicles in 5 min before the conflict
Traffic flow density [52] T FD Vehicles/mThe traffic flow density in 5 min before the conflict
Trucks ratio [19] T R %Percentage of truck traffic to total traffic in 5 min before the conflict
Unprotected vehicles ratio [53] U VR %Traffic of unprotected vehicles as a percentage of total traffic in 5 min before the conflict
Lateral offset [54] V LO mLateral deflection of conflict vehicle at conflict moment
Distance between two vehicles [20] D TV mDistance of truck and conflict vehicle at conflict moment
Driver factorDriving behavior risk [55] D BR -Integrated assessment of truck driver’s traffic risk in terms of speed and space
Truck factorTruck length [56] T L mThe truck’s entire length
Road alignmentLongitudinal slope [57] L S °Longitudinal slope in the study section
Horizontal curve radius [32] H R mHorizontal curve radius in the study section
Table 3. Parameter Estimation Results of Univariate Extreme Value Theory Model.
ParameterThreshold(s)Estimation ValueStandard Variance95% Confidence Interval
δ ξ δ ξ δ ξ
–PET−0.3820.642−0.2410.1740.218(0.300, 0.984)(−0.669, 0.187)
–TTC−4.4713.361−0.2610.7320.135(1.926, 4.797)(−0.527, 0.004)
Table 4. Parameter Estimation Results of Bivariate Extreme Value Theory Model.
StyleParametersValue (Standard Variance)
Threshold(s)–PET−0.382
–TTC−4.471
Exceeding(cases)–PET36
–TTC32
Join *25
Estimation value δ x 0.415 (0.105)
ξ y 0.182 (0.211)
δ y 2.585 (0.530)
ξ y −0.039 (0.139)
95% confidence interval δ x (0.209, 0.621)
ξ y (−0.232, 0.600)
δ y (1.546, 3.624)
ξ y (−0.311, 0.233)
* The Join is the number of negative post-encroachment time and negative collision time exceeding the threshold simultaneously; δ x is a scale parameter of the negative post-encroachment time; δ y is a shape parameter of the negative post-encroachment time; δ y is a scale parameter of the negative time to collision, and ξ y is a shape parameter of the negative time to collision.
Table 5. Comparison of Model Predictors.
IndexLightGBM ModelXGBoost Model
AUC0.9640.982
Accuracy93.333%96.667%
Recall100.000%100.000%
False-Alarm Rate3.571%1.786%
Publisher’s Note: MDPI stays neutral with regard to jurisdictional claims in published maps and institutional affiliations.

