Article

Rural Application of a Low-Pressure Reverse Osmosis Desalination System Powered by Solar–Photovoltaic Energy for Mexican Arid Zones

by
Esmeralda Cervantes-Rendón
1,
Jonathan Ibarra-Bahena
2,
Luis E. Cervera-Gómez
1,3,
Rosenberg J. Romero
4,
Jesús Cerezo
4,
Antonio Rodríguez-Martínez
1 and
Ulises Dehesa-Carrasco
2,*
1
Centro Regional de Investigacion y Desarrollo en Energia Alternativa, El Colegio de Chihuahua, Ciudad Juárez 32310, Chihuahua, Mexico
2
Subcoordinacion de Conservacion de Cuencas y Servicios Ambientales, Instituto Mexicano de Tecnología del Agua, Jiutepec 62550, Morelos, Mexico
3
Subdirección de Consejos de Cuencas, Gestion Social y Atención a Emergencias, Comisión Nacional del Agua, Chihuahua 31200, Chihuahua, Mexico
4
Centro de Investigación en Ingeniería y Ciencias Aplicadas, Universidad Autónoma del Estado de Morelos, Cuernavaca 62209, Morelos, Mexico
*
Author to whom correspondence should be addressed.
Sustainability 2022, 14(17), 10958; https://doi.org/10.3390/su141710958
Submission received: 21 July 2022 / Revised: 19 August 2022 / Accepted: 23 August 2022 / Published: 2 September 2022

Abstract

:
A reverse osmosis system driven by photovoltaic energy is an eco-friendly and sustainable way to produce freshwater in rural areas without connection to a power grid and with available brackish water sources. This paper describes a project where a photovoltaic-driven low-pressure reverse osmosis system (LPRO-PV) was designed, tested under laboratory conditions, and installed in Samalayuca, Chihuahua, Mexico, to evaluate the technical feasibility and social impact of this technology. The LPRO-PV system was tested with synthetic water with a salinity of 2921 ± 62.3 mg/L; the maximum freshwater volume produced was 1.8 ± 0.06 m3/day with a salinity value of 91 ± 1.9 mg/L. The LPRO-PV system satisfied the basic freshwater requirements for a local family of three members for one year, including the mobility-restriction period due to the COVID-19 pandemic. The social evaluation analysis reflects the importance of considering the technical aspects derived from the experimental tests, as well as the users’ perception of the performance and operation of the system. As a result of the implementation of this technology and the benefits described by the users, they committed to the maintenance activities required for the LPRO-PV system’s operation. This technology has great potential to produce fresh water in arid and isolated regions with high-salinity groundwater sources, thus fulfilling the human right to safe and clean drinking water.

1. Introduction

The economic and social growth of humankind depend on a sustainable supply of energy and water for every daily activity; however, in arid zones, these resources—especially good-quality water—are limited. Since precipitation is scarce in arid regions, the available water sources often have high salinity, even in groundwater sources (brackish groundwater). Nonetheless, these regions usually have a high availability of solar energy; thus, brackish water desalination, powered by solar technology, is an attractive option to supply fresh water in arid rural areas or isolated communities with a lack of water [1]. Membrane technology provides an opportunity for the desalination and treatment of brackish water in rural regions. This technology is a high-efficiency process (in terms of water production) and provides a wide filtration rating (by different membrane materials and pore sizes) allowing desalination and treatment at the lowest cost [2]. Moreover, membrane technology can be powered by renewable energies and operate without energy storage components (such as batteries), since the water can be stored while the energy source is available [3]. The capital cost of a photovoltaic reverse osmosis (PVRO) system and the cost per cubic meter of freshwater are 10% and 50% lower than an RO system powered by a wind turbine, respectively [4]. Thus, solar energy is the first option among the renewable energy sources. This concept has been broadly studied in the literature: Pimentel da Silva and Sharqawy [5] carried out a techno-economic feasibility analysis of small-scale solar PVRO systems for semiarid communities in Brazil. According to the mathematical model described by the authors, a 10 m3/day system with an area of PV panels going from 26 to 33 m2 produced freshwater with a cost from 1.44 to 1.65 USD/m3. Dehesa-Carrasco et al. [6] evaluated a nanofiltration system powered by photovoltaic energy (NF-PV) for agricultural irrigation for remote areas in northern Mexico. The authors reported a maximum specific energy consumption of 1.55 kWh/m3, with a salinity concentration of 4.9 mS/cm. The NF-PV system produced up to 4.8 m3/day to irrigate 1 ha of crop surface, with a range of freshwater production cost from 1.05 to 0.47 USD/m3. Munari et al. [7] tested a small-scale PVRO system without battery storage in South Australia for brackish water desalination. The authors reported that specific energy consumption was 3.2 kWh/m3, and the system produced 764 L/day of freshwater when low-salinity water (7.4 mS/cm) was supplied to the system. Ahmad and Schmid [8] performed a feasibility study of water desalination in Egyptian rural regions using a PVRO system. According to the authors, 1 m3 of freshwater can be produced at a cost of USD 3.73. This kind of desalination technology has great application opportunities in Mexico, especially in the northwest, since the reported solar energy potential goes from 5.6 to 6.1 kWh/m2 day in these regions [9] and, particularly, in the State of Chihuahua, this potential is from 5.07 to 7.31 kWh/m2 day, as can be seen in Figure 1. Additionally, there are isolated rural zones in the northern part of the State of Chihuahua with brackish water sources and without freshwater and electrical services. These cases are an opportunity for decentralized solutions for water scarcity problems. On the other hand, it is important to understand the users’ experience in relation to cost-efficiency [10] when new technology is implemented, since neglecting the human factor can lead to a low implementation of accessible technologies.
The present paper reports how a photovoltaic-driven low-pressure reverse osmosis system (LPRO-PV) was designed, tested under laboratory conditions, and installed in Samalayuca, Chihuahua, Mexico, to demonstrate the technical feasibility of this technology in order to satisfy the basic freshwater requirements of a family in this region for one year.

2. Photovoltaic-Powered RO Desalination

In PV–RO desalination, a direct current (DC) generated by the solar cells is used—directly or after regulation—to supply the electrical power to the pump to generate the pressure level required for the feed water to permeate the RO membranes [11]. The PV-RO systems are suitable especially for decentralized applications, such as in remote areas and islands [12]. The main issue of PV-RO systems is the high cost of the batteries for electricity storage, which includes the maintenance and operation; however, RO desalination could store water (in a tank) instead electricity (in batteries). Figure 2 shows a diagram of a PV-RO system without electricity storage.

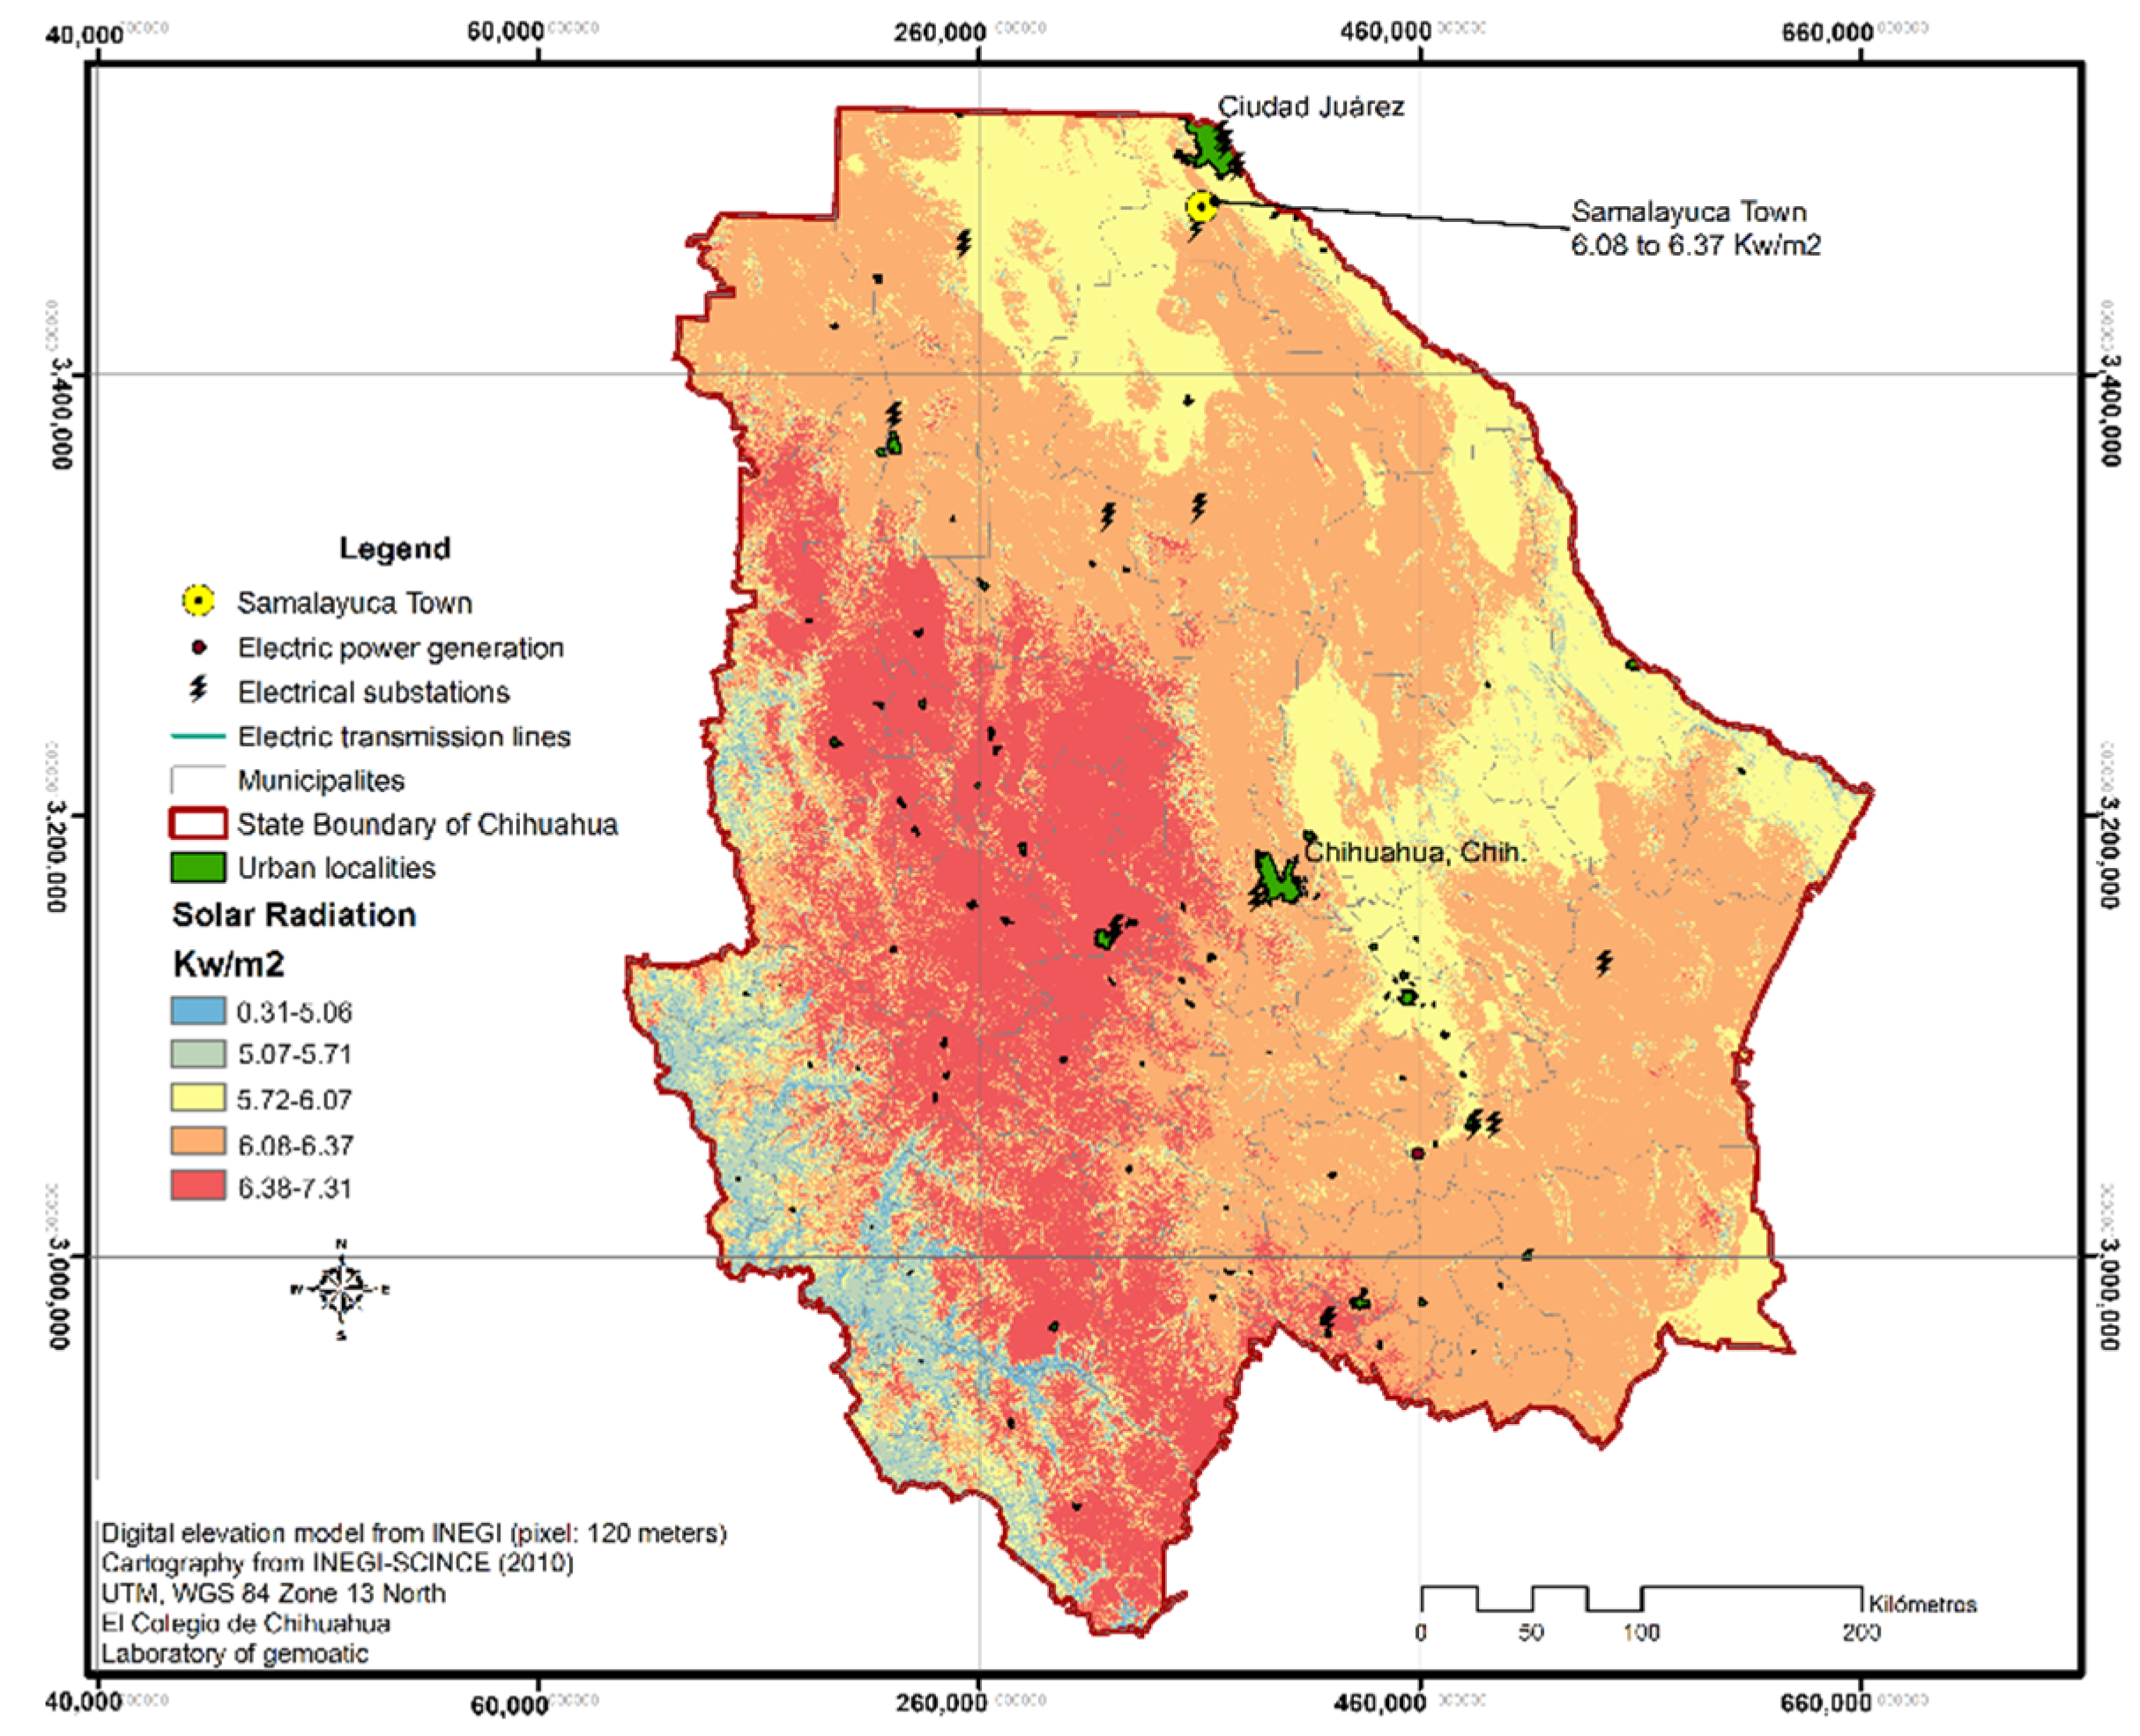
3. Description of the Study Area

Samalayuca is a locality that is part of the municipality of Juarez, Chihuahua, Mexico, with a population of 1577 inhabitants [13]. It is a Natural Protected Area, declared as such on 5 June 2009, with endemic flora and fauna where arid conditions allow the formation of sand dunes [14]. Its only source of water is the Samalayuca aquifer, with a closed zone and a free zone, of which 73% is for agricultural use and 26% is for public–urban use (without considering extraction by the thermoelectric power plant) [15].
In the drainage network of this region, a large part of the water flow that feeds the well comes from the drainage of the hills of Sierra del Presidio and another important part comes from the area of the Samalayuca dunes. Castillo et al. [16] carried out an isotopic analysis of shallow and groundwater samples from a place close to the well of this project area. The samples were taken from the springs and shallow wells, as well as in deep water. The water quality results revealed that the main components of the water in this region are calcium sulfate or sodium sulfate and, in the Samalayuca hills, there is a strong chemical dilution and sub-saturation of calcite (calcium carbonate), dolomite (calcium and magnesium carbonate), aragonite (calcium carbonate), and gypsum.
A water quality test was carried out on 14 September 2017, by the Environmental Laboratory of the Department of Civil and Environmental Engineering of the Autonomous University of Ciudad Juárez. The Maximum Permissible Limits (MPL) of the chemical compounds present in a water sample for human domestic use are reported in the Mexican Standard NOM-127-SSA1-1994. This standard was used to report the water quality results of the Samalayuca well. In Table 1, the main water quality parameters are shown.

4. Methodology

For the implementation of a socio-technical project that uses renewable energy, it is important to consider several aspects such as technical, social and environmental aspects, among others [17]. Therefore, this technological intervention was developed in four stages considering the aforementioned aspects: (1) characterization of the study area and identification of water user requirements; (2) design and experimental tests of the LPRO-PV system with synthetic water prepared according to the water salinity of the Samalayuca well; (3) installation of the LPRO-PV system on-site; and (4) operation and monitoring of the users’ experience with the system for one year.

4.1. Characterization of the Study Area and Identification of Users’ Water Requirements

At this stage, a hydrology characterization of the study area was carried out, as well as a sample of the well water to quantify salinity. Solar radiation was estimated based on the meteorological station databases from zones that were adjacent to the study area. The users’ water requirements were identified by means of on-site interviews with the selected family.

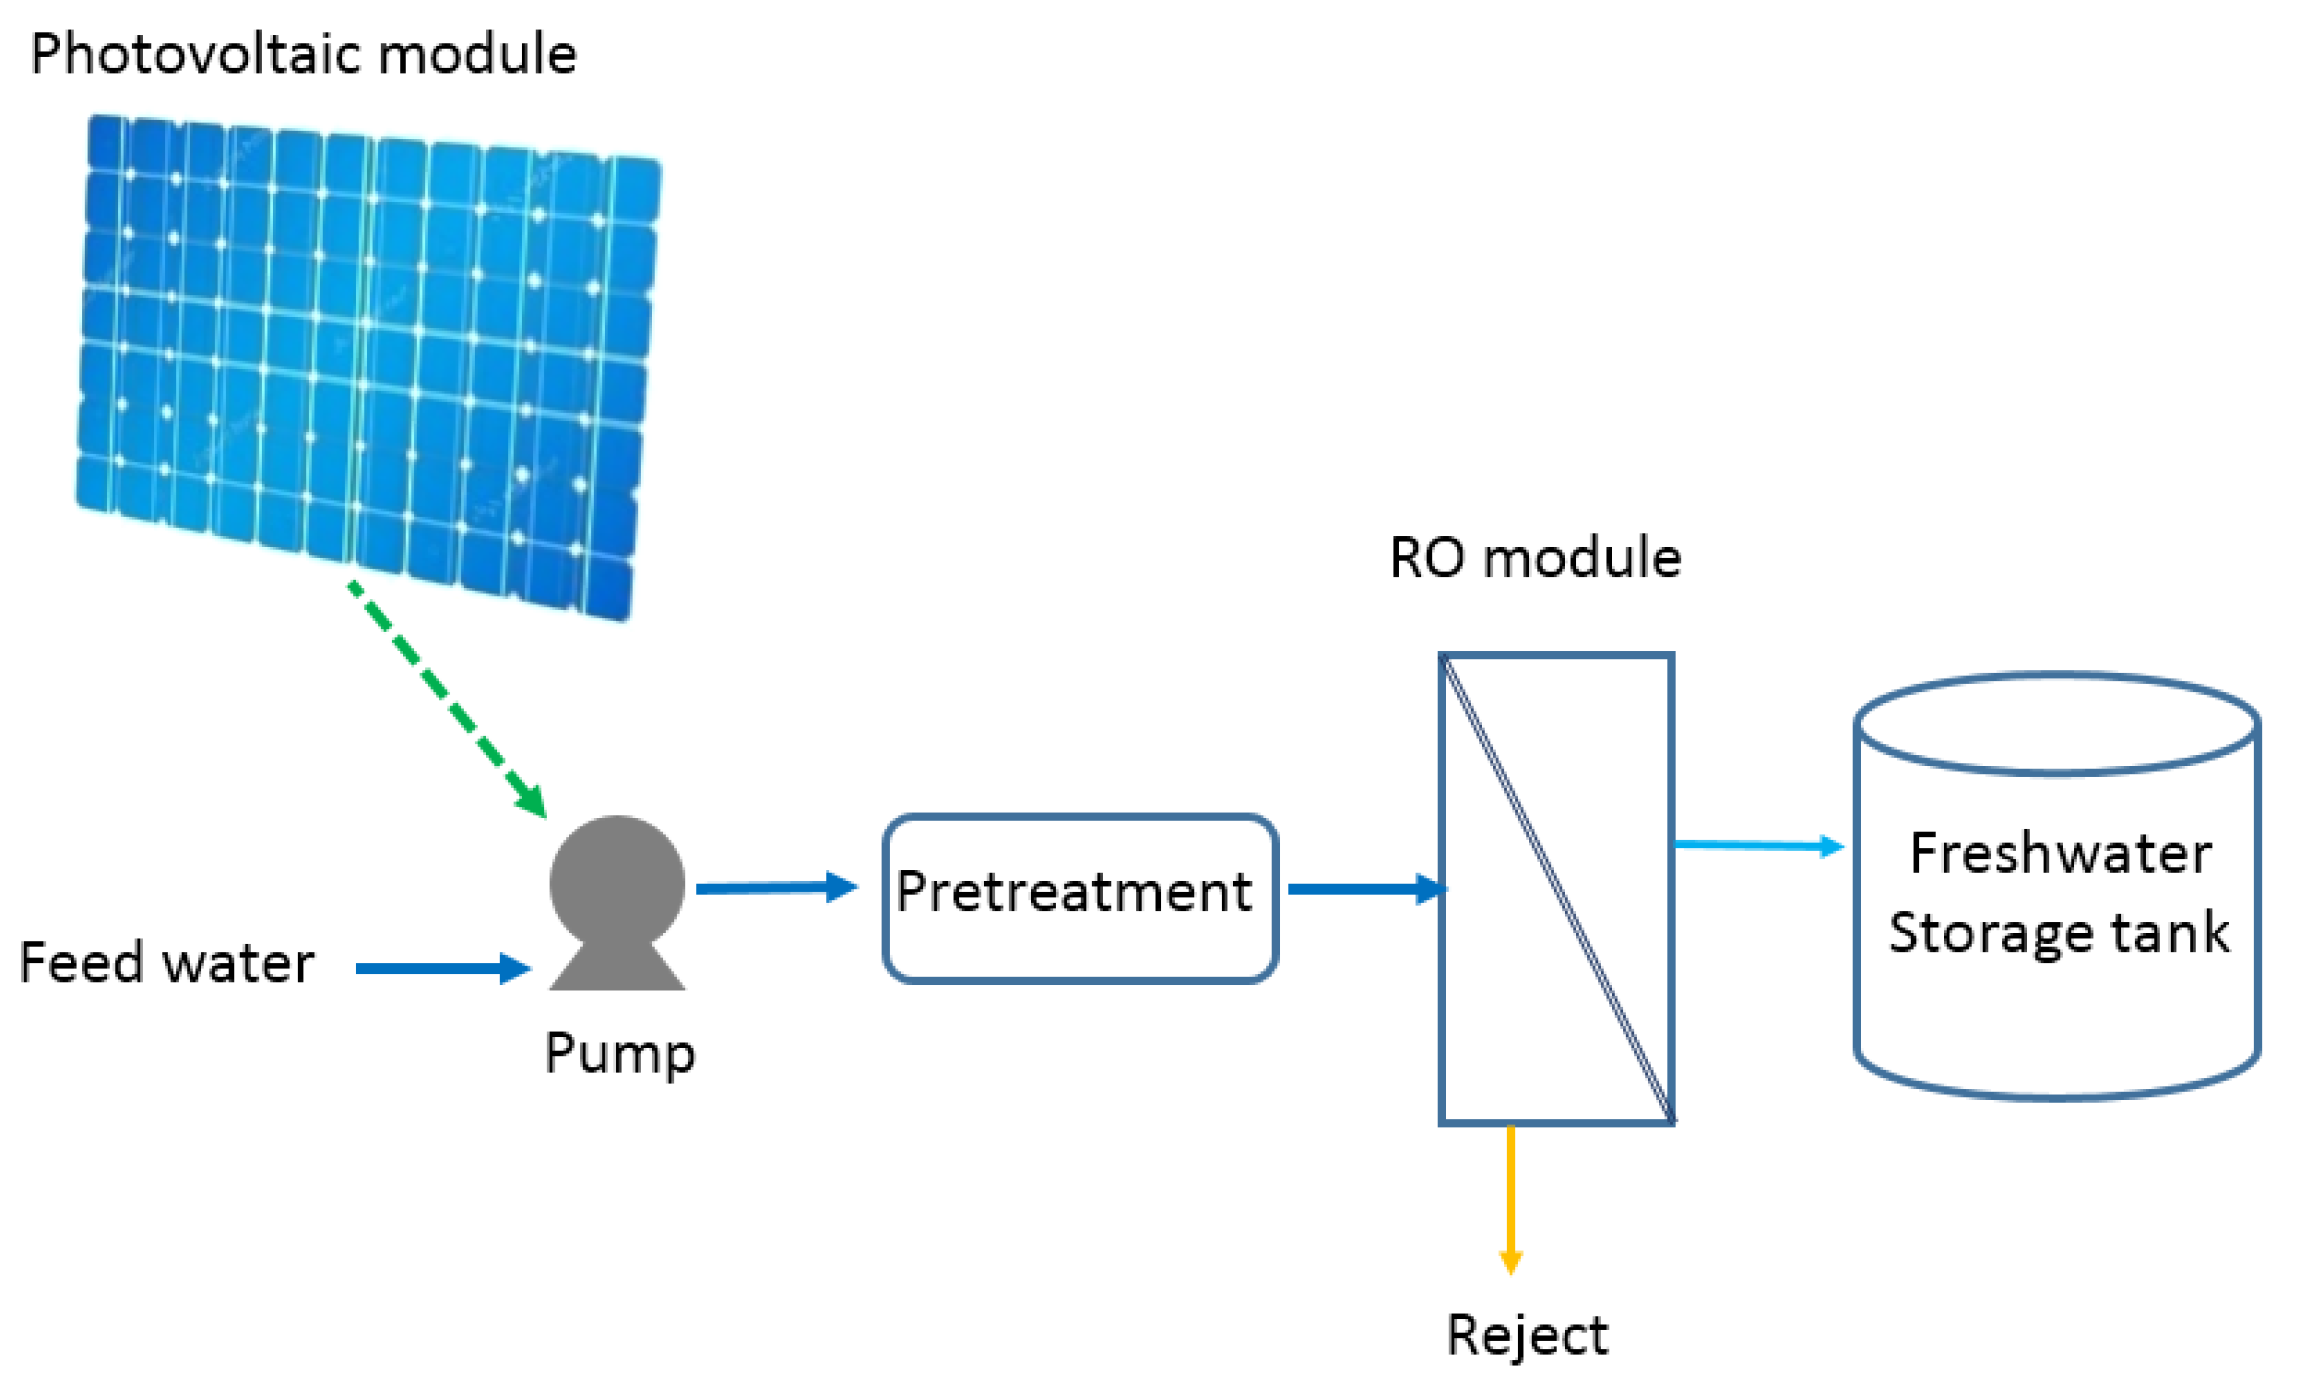
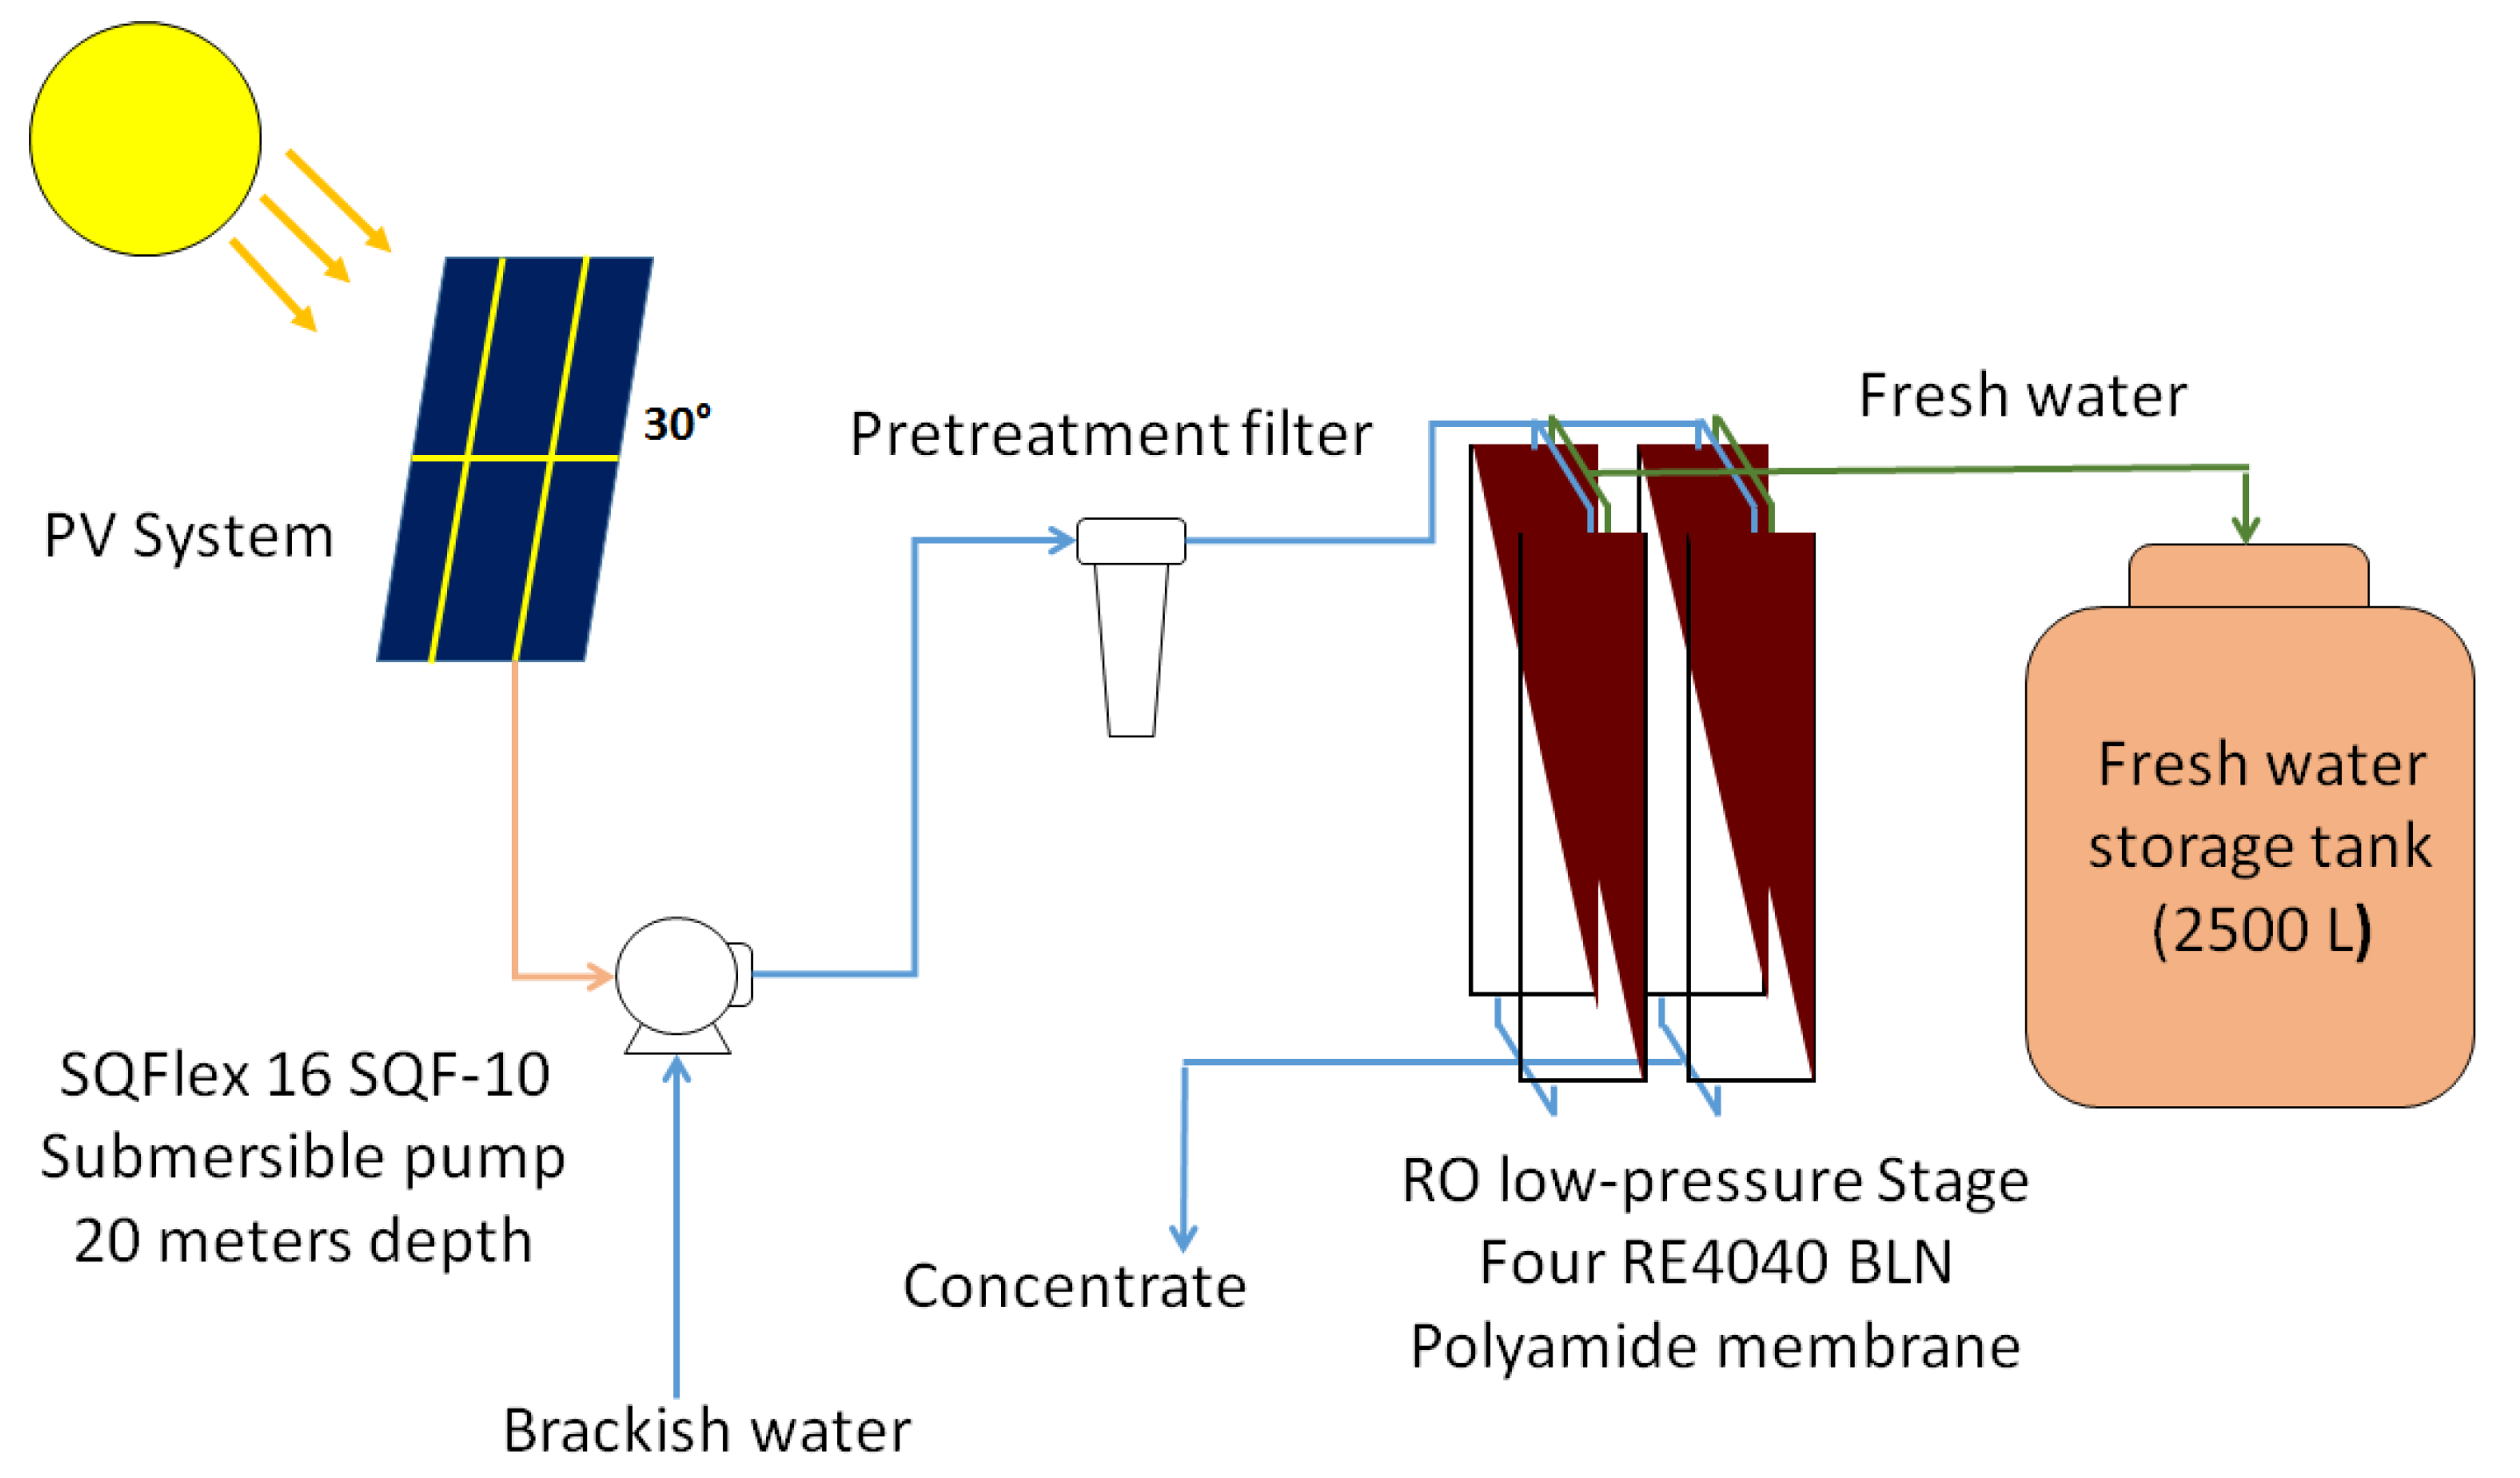
4.2. Design and Experimental Testing of the LPRO-PV System

Based on the water salinity result, an LPRO-PV system was designed. This system consisted of photovoltaic solar modules, a submersible pump, and an RO low-pressure desalination module. The photovoltaic solar system was made up of six polycrystalline silicon modules (CS6U-330) with a total area of 11.7 m2 and a combined nominal power of 1.98 kW. The technical characteristics of the module are shown in Table 2.
The photovoltaic system was sized according to the pressure requirements of the RO unit. A SQFlex 16 SQF-10 pump was selected to pump the brackish water stream to the RO unit. The pump was adapted to use direct current; therefore, a battery system was not necessary. Four RE4040 BLN polyamide membranes with stainless-steel housings were used for the RO unit. The membrane modules were connected in a parallel configuration in one pressure vessel. However, a pretreatment filter was added to reduce the membrane fouling and increase the recovery rate of the desalination system. The amount and quality of the freshwater produced by the RO unit are affected by the pumping pressure, which depends on the incident solar radiation. To quantify these effects, an experimental evaluation of the LPRO-PV system was carried out under laboratory conditions. These experimental tests were carried out at the Mexican Institute of Water Technology, which is located in Jiutepec, Morelos, Mexico (18°52′56.564″ N, 99°9′28.839″ W). Synthetic water samples were prepared based on the salinity results of the Samalayuca groundwater well. Figure 3 shows the LPRO-PV system diagram.

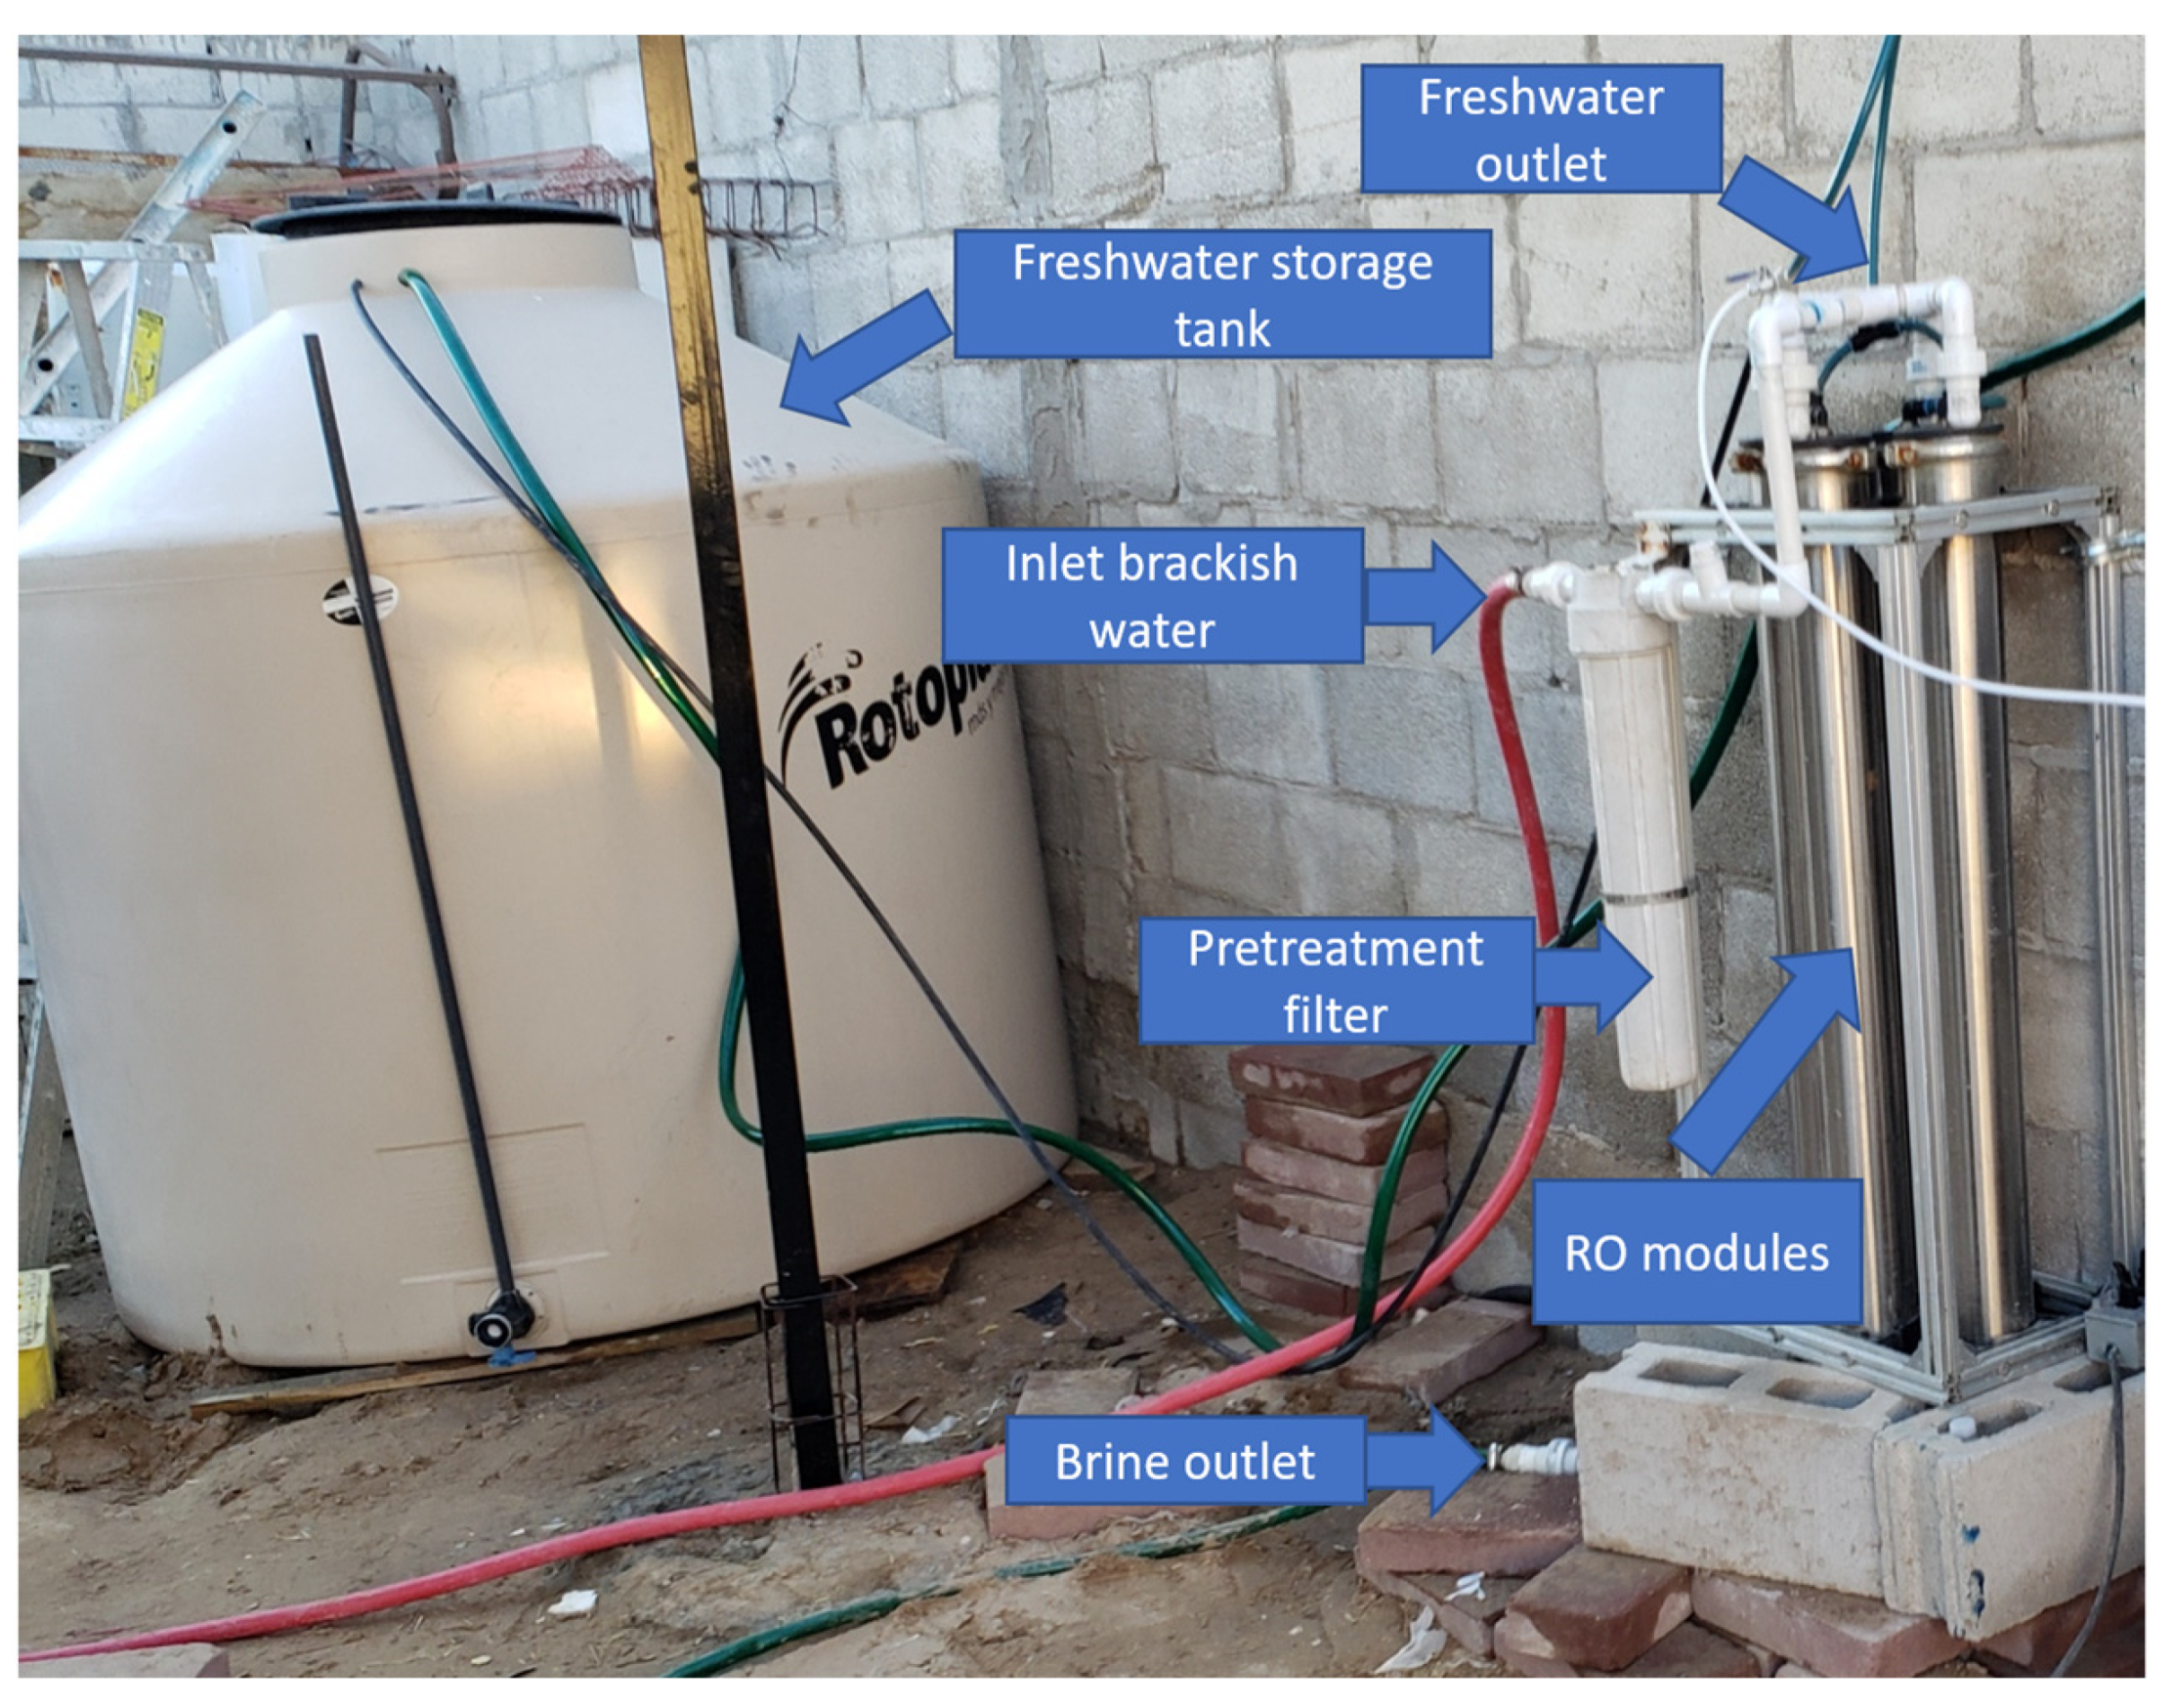
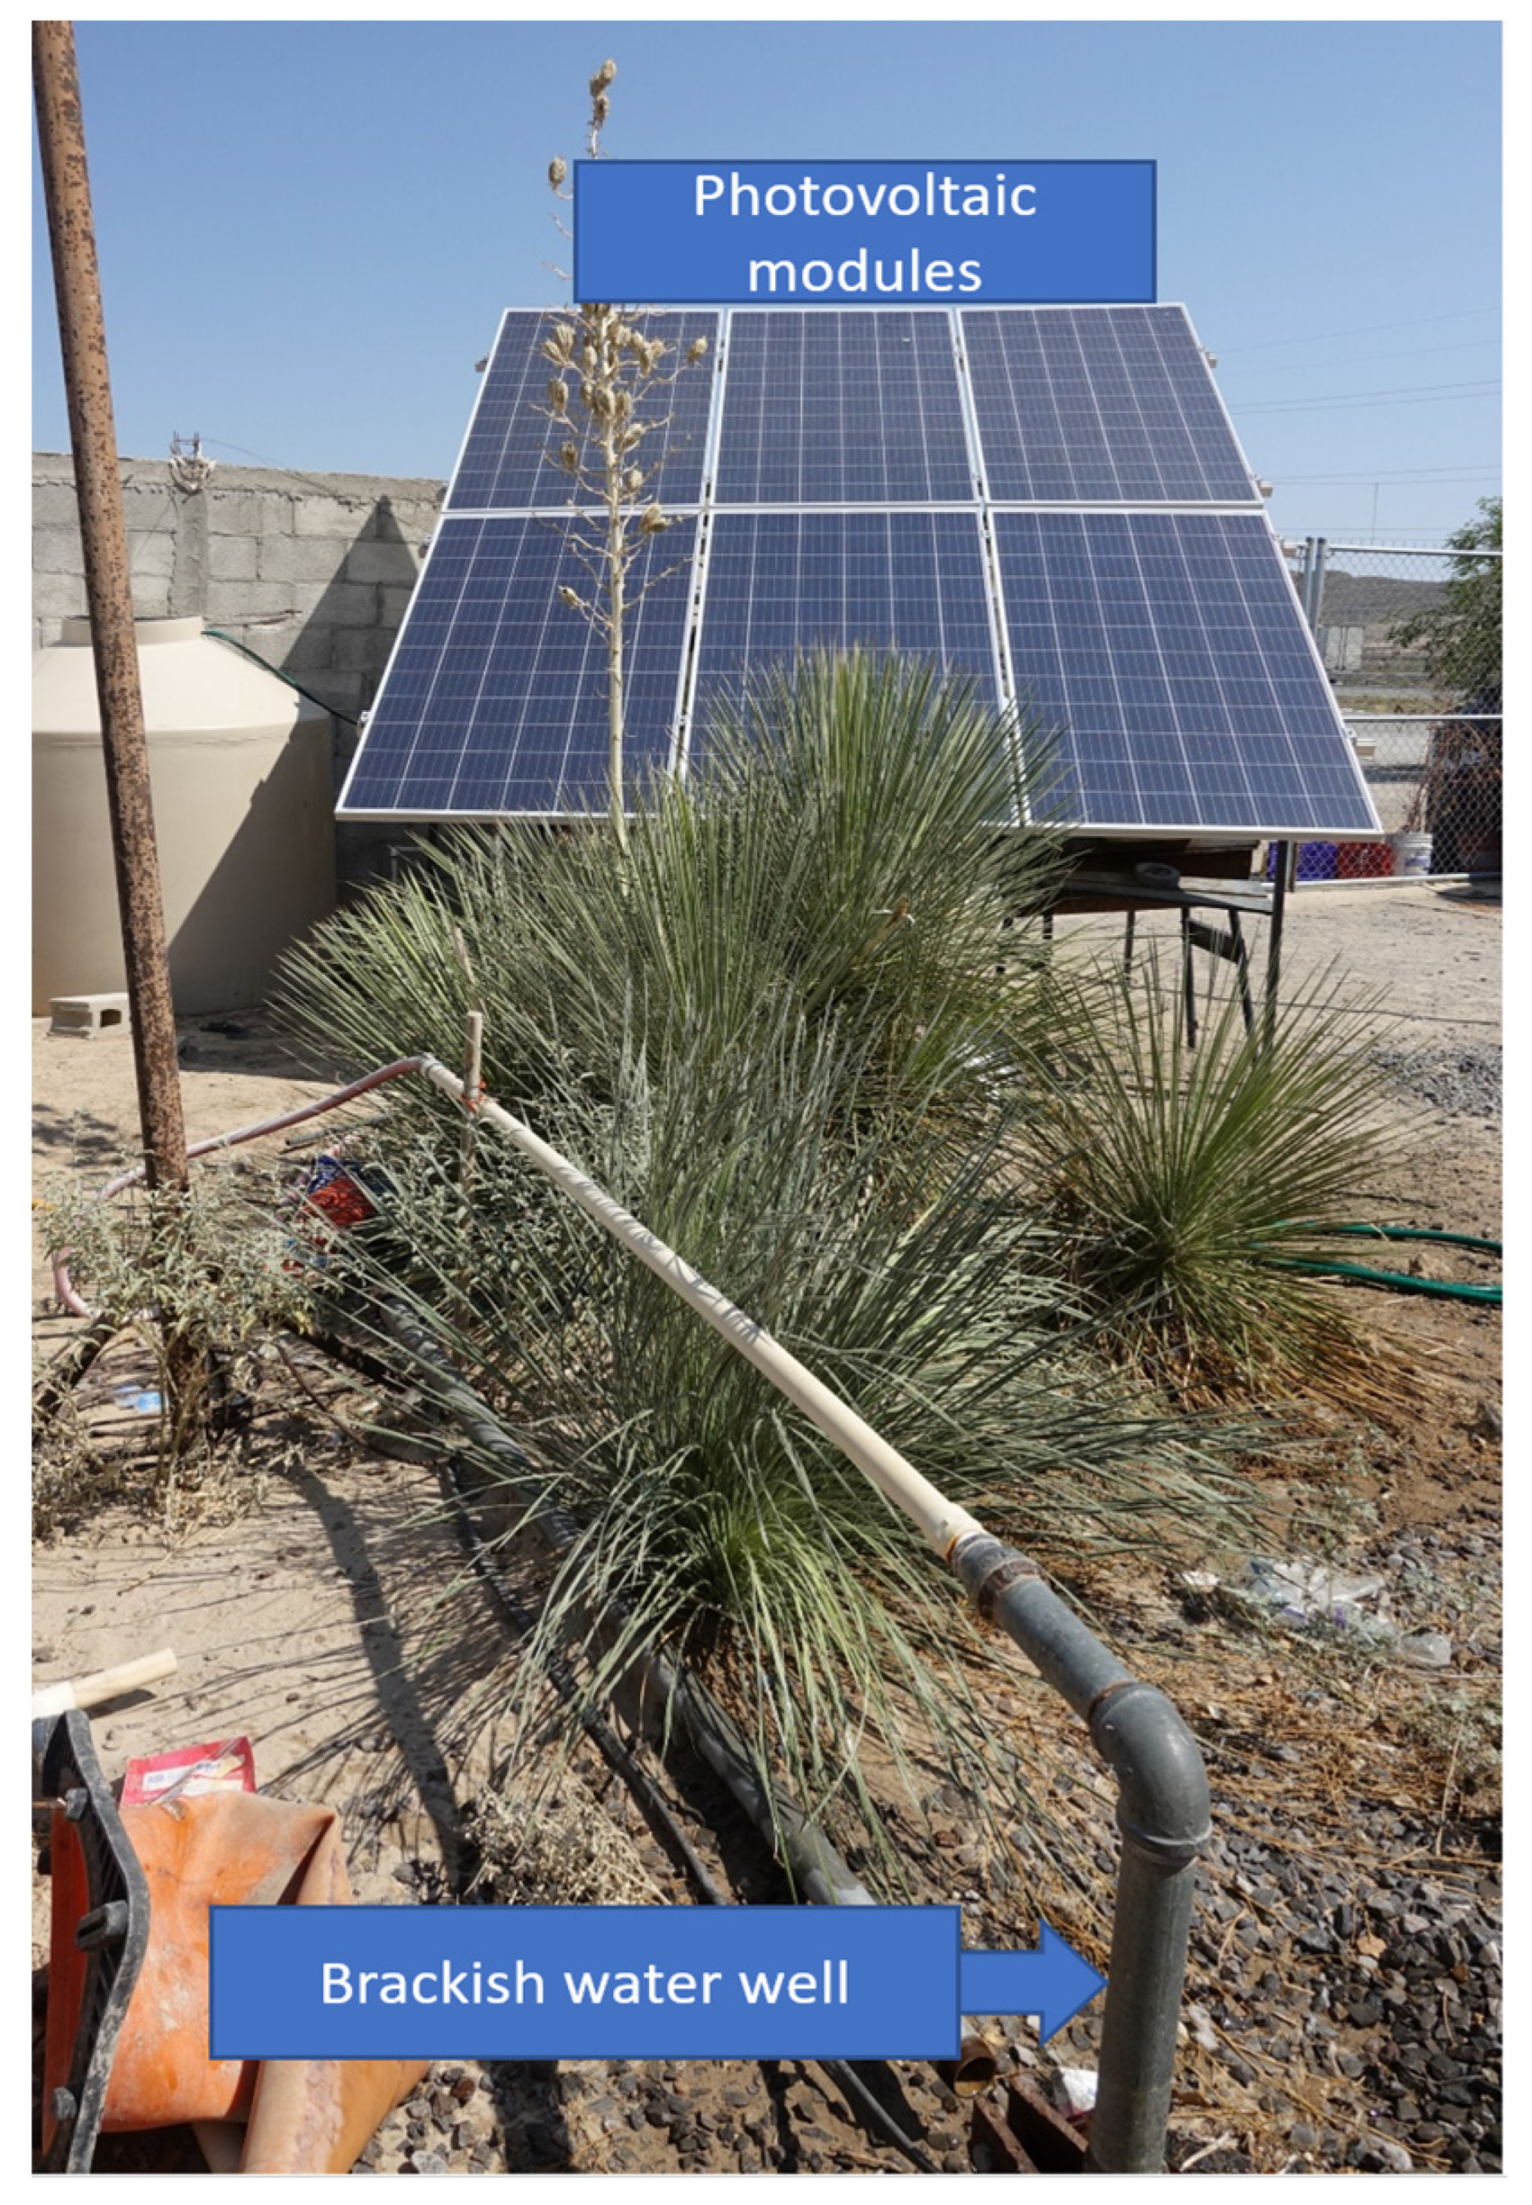
4.3. Installation of the LPRO-PV System On-Site

The LPRO-PV system was installed close to an old desalination plant (1910 m to the northeast). In this plant, water was extracted from the aquifer and deposited in shallow lagoons to produce salt by evaporation. In addition, there are two natural springs in the area: the first just 420 m to the north and the second 540 m to the northeast. With the participation of researchers and students, through an inter-institutional project, and the family members, on the first day, the metal structure that supports the photovoltaic modules was installed in such a way that it would withstand the strong winds in the area, which can reach up to 79 km/h [18]. Figure 4 shows the photovoltaic modules installed on site. During the second and third days, in various workgroups, the submersible pump (16SQF-10 Grundfos) was descended 20 m deep into the well, the photovoltaic panels were also installed, and the assembly of the LPRO-PV System began. On the last day, the LPRO-PV system was connected to the hydraulic and electrical parts, and an antifreeze valve was included to avoid ice forming from the freezing temperatures in the region. Figure 5 shows the LPRO-PV system.
An important aspect was training the family members on the operation and maintenance of the LPRO-PV system, which included turning the system on and off, cleaning the photovoltaic panels, changing the pretreatment filters every 15 days, and checking the operation of the antifreeze valve.

4.4. Perception of the Performance, Maintenance, and Use of the LPRO-PV System

The selected family consisted of two adults and a 12-year-old adolescent; they live at the entrance of the town of Samalayuca, next to the main road. The family has a small restaurant for people who travel and they have farm animals such as chickens and a donkey, as well as domestic pets (dogs). The basic water requirements were established through a semi-structured interview.
During one year of operation of the LPRO-PV system (October 2019 to November 2020), the experience and perception of the users were evaluated and recorded monthly, regarding: (a) the system’s performance regarding perception of water pressure (low = 1; medium = 2; and high = 3); (b) the operation period per month (1 to 2 weeks = 1; 3 weeks = 2; and 4 weeks = 3); (c) maintenance of the system (activities: 1 = cleaning solar panels; 2 = freeze protection valve; 3 = cleaning the water storage tank; 4 = replacing the pretreatment filters; 5 = system leaks; 6 = external adaptations); and (d) water uses (1 = bathing and handwashing; 2 = cleaning: floors, dishes, and laundry; 3 = restrooms; 4 = pets and farm animals; 5 = irrigation of trees; 6 = other uses). In addition, a second semi-structured interview was conducted after one year of use of the LPRO-PV system.

5. Results

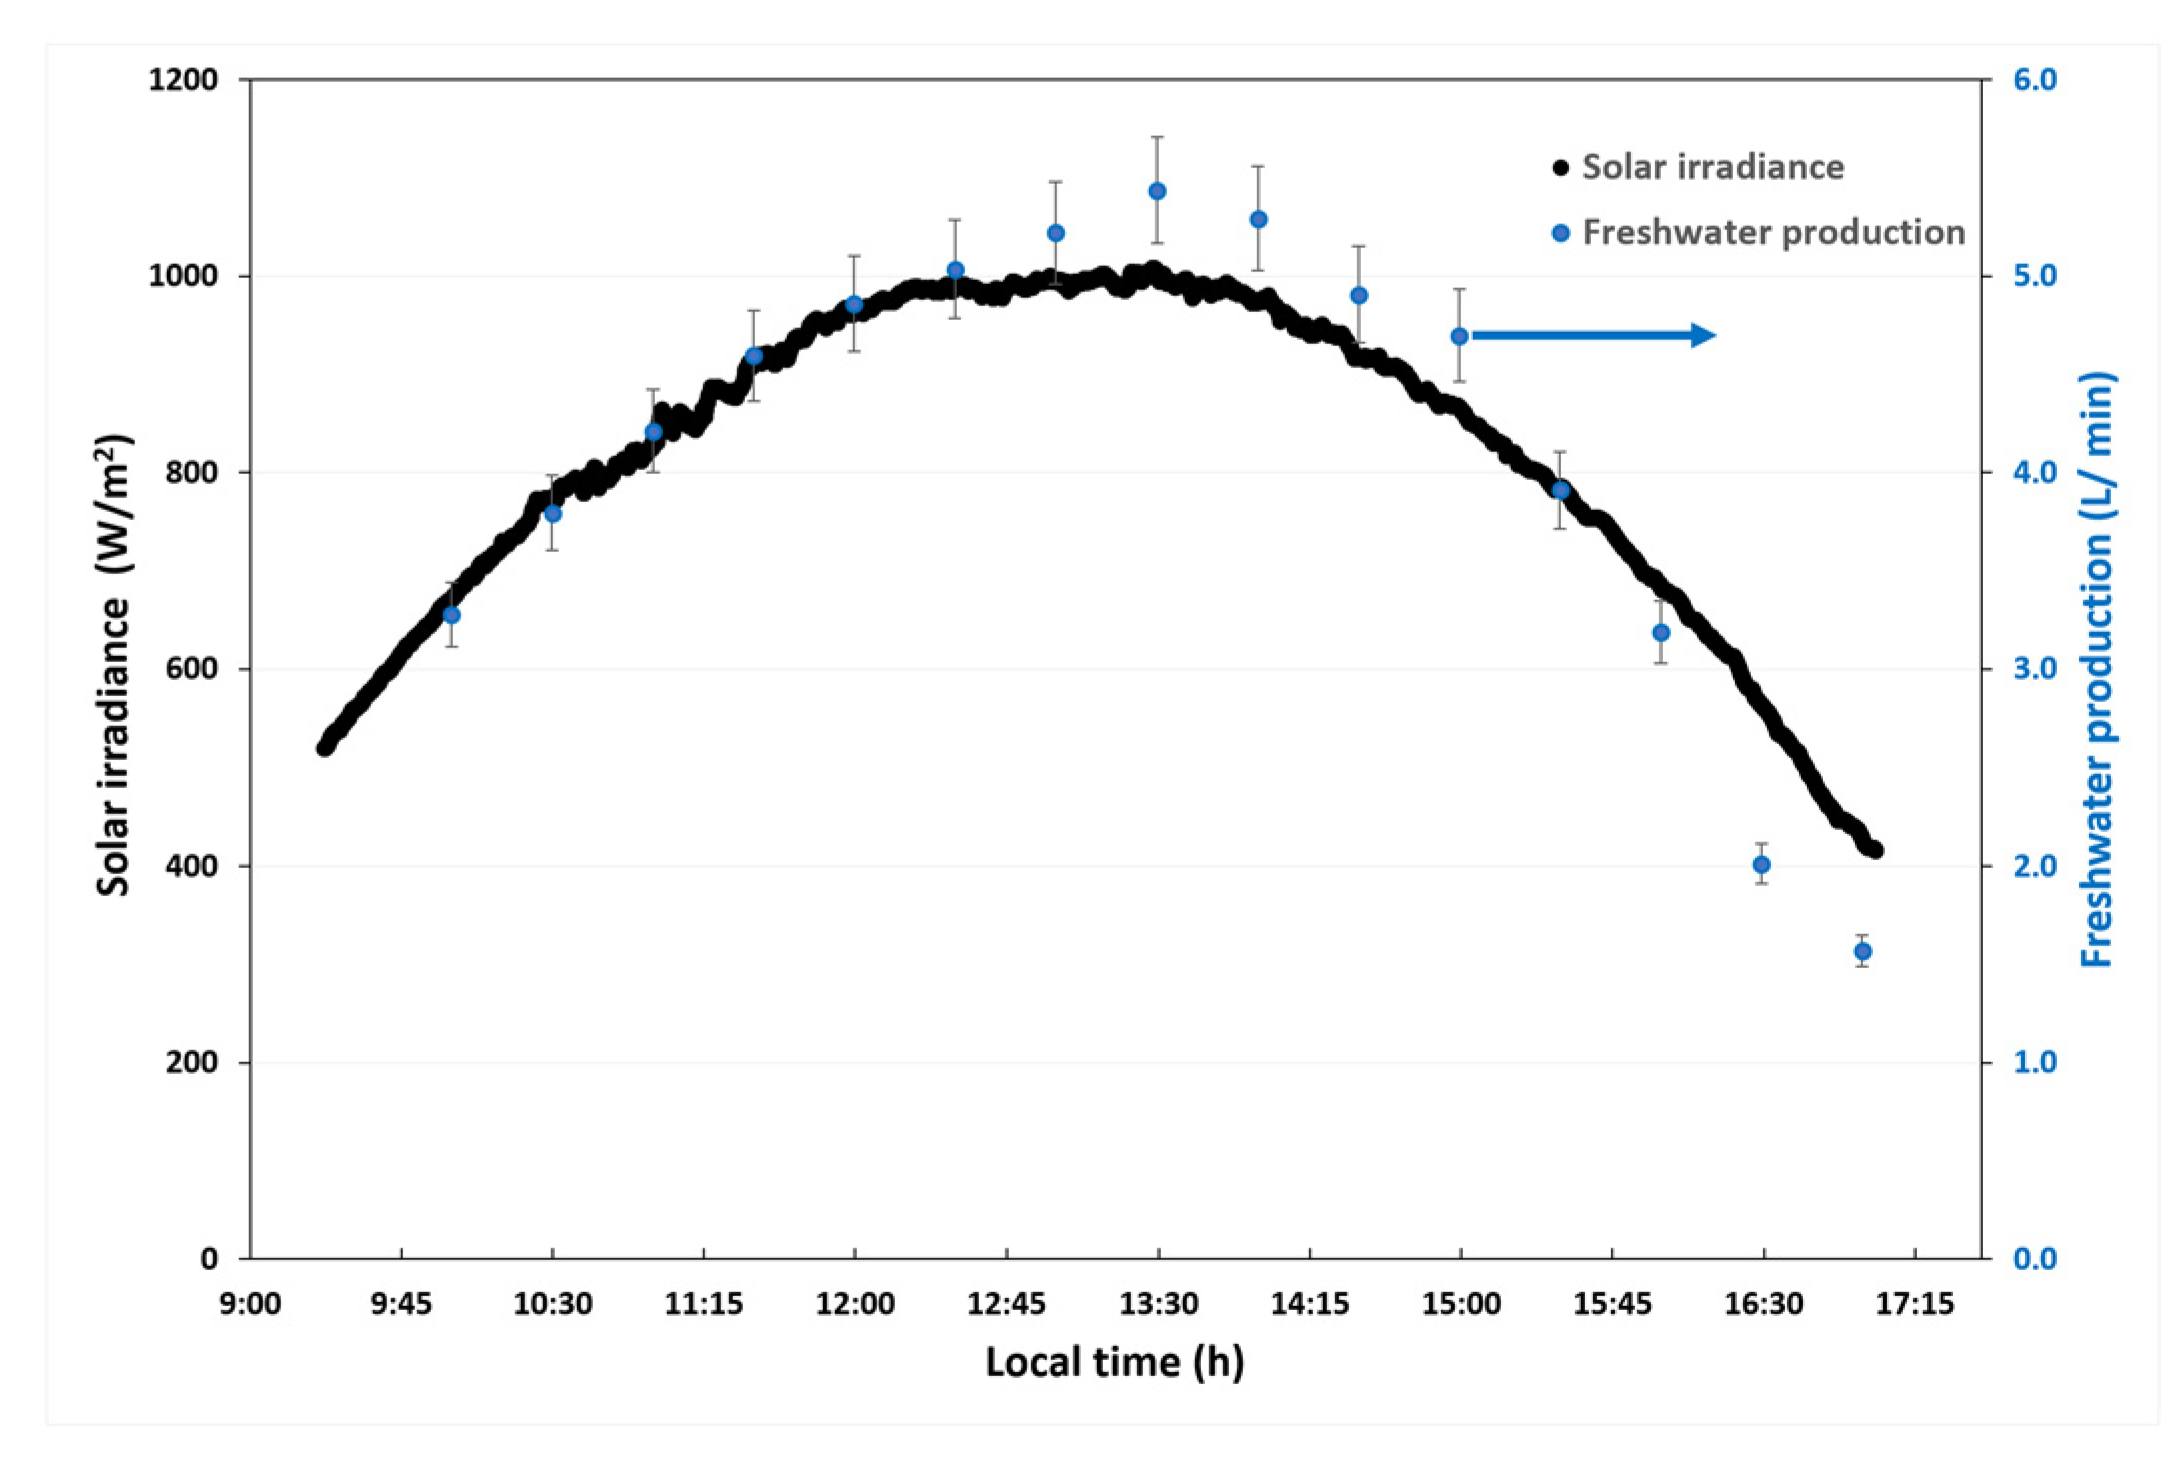
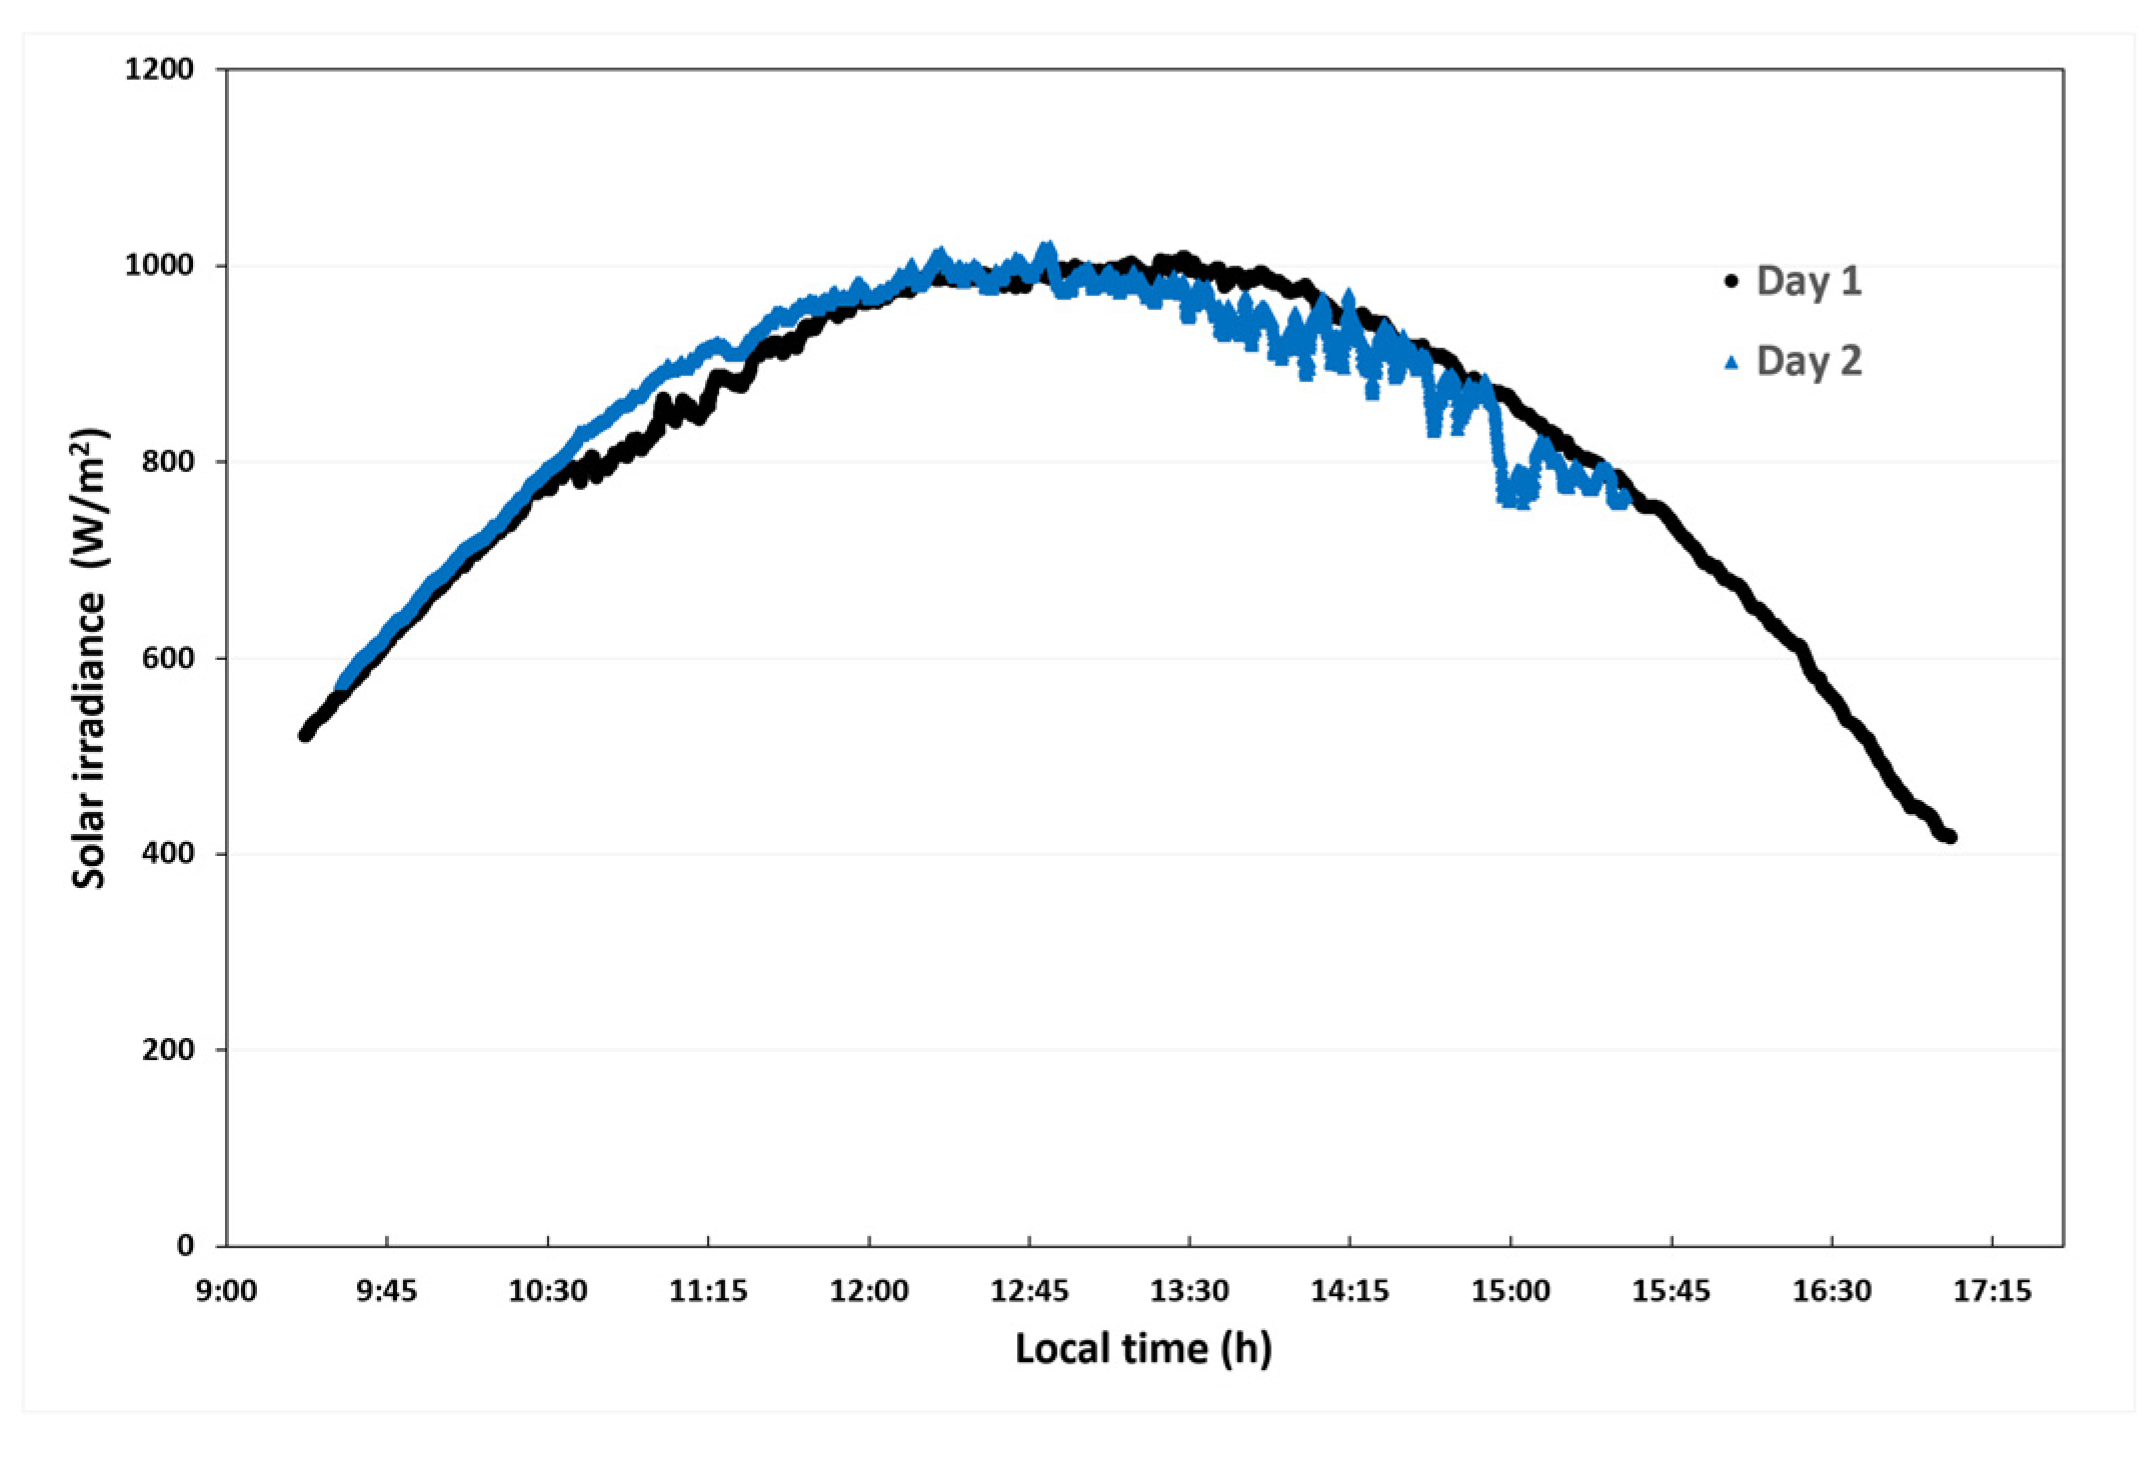
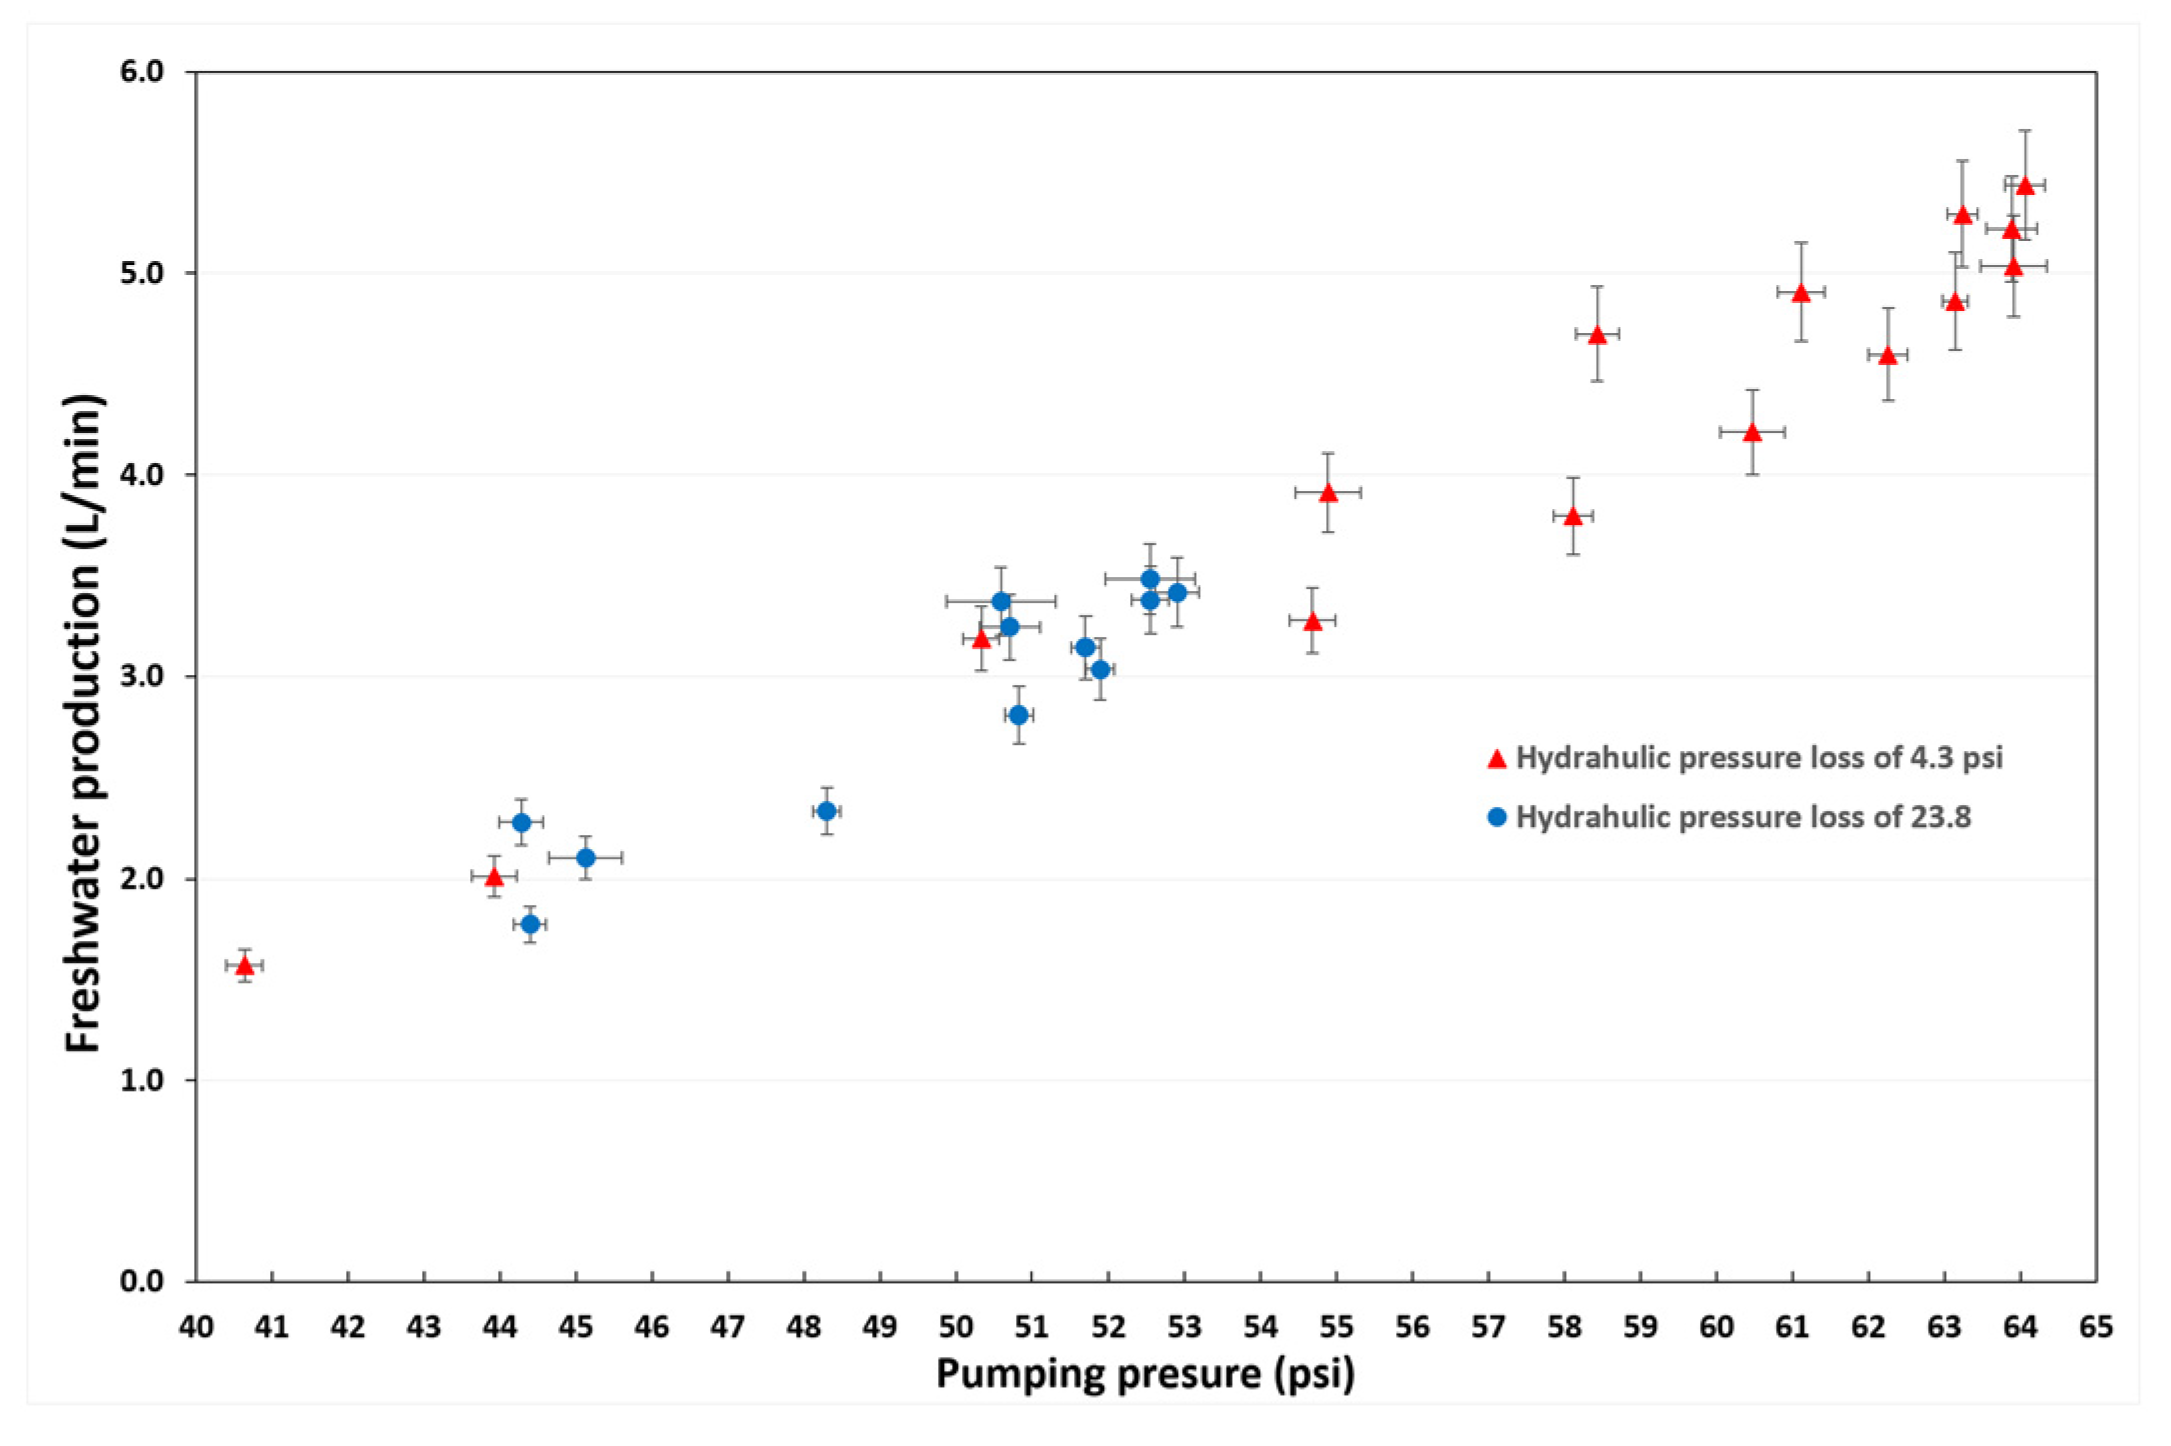
5.1. Evaluation of the LPRO-PV System under Laboratory Conditions

As previously mentioned, the LPRO-PV system was tested under open-sky operating conditions at the Mexican Institute of Water Technology. The instrumental devices are shown in Table 3.
Based on the water quality results, synthetic water samples were prepared with a salinity of 2921 ± 62.3 mg/L. As previously mentioned, the pump used to drive the water to the RO modules was adapted to use direct current; therefore, the pumping pressure depended on solar radiation. During the experimental tests, the solar irradiance varied from 520 to 1003.9 w/m2. Figure 6 shows the solar irradiance behavior during two typical days in spring. Freshwater production was measured in periods of 30 min and, according to Figure 7, is related to the pumping pressure.
Suspended solids are gradually deposited on the pretreatment filter and reduce the effective pumping pressure. A hydraulic pressure loss of 19.68 ± 1.08 psi reduces 1.9 ± 0.08 L/min which represents 35.18% of freshwater production. Figure 8 shows the effect of the hydraulic pressure loss on freshwater production, evaluated during two days under similar solar radiation conditions.
According to Dehesa et al. [6] monovalent compounds present in the synthetic mixture cross through the membrane and affect freshwater quality. The freshwater and monovalent compounds cross the membrane at different mass transfer rates; however, as the pumping pressure increases, the freshwater mass transfer rate increases as well (see Figure 7).
Based on the results, fouling in pretreatment filters has an important role in freshwater production and, consequently, water quality is affected. For an average hydraulic pressure loss of 4.3 ± 0.50 psi, the maximum daily performance was 1.8 ± 0.06 m3/day with a salinity of 91 ± 1.9 mg/L, while with an average hydraulic pressure loss of 23.8 ± 0.55 psi, performance was 1.1 ± 0.07 m3/day with 122.4 ± 7.6 mg/L. Figure 9 shows freshwater production dependence with respect to the pumping pressure. Figure 10 and Figure 11 show freshwater production and salinity behavior with a hydraulic pressure loss of 4.3 ± 0.50 psi and 23.8 ± 0.55 psi, respectively.
To reduce the electrical energy consumption and increase freshwater production, a hybrid process that combines low-pressure RO and thermal desalination (such as membrane distillation or thermal evaporation) could be used for small-scale applications in remote locations or very small communities disconnected from the electrical grid but with a high availability of solar energy [19].

5.2. Cost Analysis

Several factors must be considered for desalination costs. Dehesa et al. [6] describe a methodology to estimate the freshwater production costs. According to the authors, the main costs are the cost of capital and the annual operating costs. However, other factors related to plant capacity production, feed water quality, pretreatment processes, technology, energy cost, plant’s lifetime and investment amortization were included. In the present study, the following assumptions were considered:
  • Plant life expectative (n) is 20 years;
  • Operating and maintenance costs are estimated as 20% of plant annual payment. Close to 13% is related to maintenance. Service system includes replacement of the pretreatment filters;
  • Annual rate of membrane replacement is 10%;
  • Interest rate is 8% when financing is required.
A summary of the main features for cost estimation and the calculated unit cost for freshwater production of the LPRO-PV installed in Samalayuca are shown in Table 4 and Table 5, respectively.
The amortization factor (a) was estimated as follows:
a = i ( 1 + i ) n ( 1 + 1 ) n 1 = 0.07 ( 1 + 0.07 ) 20 ( 1 + 0.07 ) 20 1 = 0.09439   yr 1
where n is the plant life expectative and i is the interest rate.
In Table 6, the calculated freshwater production cost of the LPRO-PV system installed in Samalayuca is compared with the other studies reported in the literature for similar RO systems powered by photovoltaic solar energy without battery storage.

5.3. Perception of Performance, Maintenance, and Use of the LPRO-PV System

Based on the users’ experience, a value was assigned to the perception they had about water pressure in the system and the days that the LPRO-PV system was in operation. On the other hand, users identified subjective benefits in their health, with respect to the condition of their hair and skin. In addition, the fouling on surfaces that were in contact with brackish water before the installation of the LPRO-PV system (such as floors, bathrooms, and dishes) decreased. Within the maintenance activities, during the winter months, cleaning solar panels (1), inserting a freeze protection valve (2), and replacing the pretreatment filters (4) were carried out more frequently. In the spring–summer months, leak repairs were necessary due to the high temperatures (5). The maintenance activities increased in February, May, and August. On the other hand, regarding the operation, the users’ perception indicates that, starting in April, there is an increase in water pressure and in the time of operation. The highest water production period was from May to October, as shown in Table 7.
Figure 12 shows the users’ experience during one year of operation. According to this figure, the operation of the LPRO-PV system is a function of the season of the year related to solar radiation and the local weather (strong winds and/or cloudy days); however, the produced freshwater was enough to satisfy the family’s basic water requirements. On the other hand, maintenance depended on the local weather, e.g., cleaning of the photovoltaic modules.
In other studies related to the identification of risks and opportunities for the implementation of renewable energies, qualitative analysis through interviews has an important role, since the positions and assumptions regarding measures for the reduction in greenhouse gas emissions are identified by the people involved in the implementation [25].
Therefore, for this study, it was important to identify the users’ experiences from the interviews carried out before and after the technological intervention. For this purpose, two word clouds were created. The most notable terms in the first interview were “saline” and “concern”, focused on needs related to “food”, “wash”, “restaurant” and “trees”. On the other hand, the users refer to the LPRO-PV system as a “machine” (Figure 13), while in the interview carried out after one year of operation, the users refer to the LPRO-PV system as the “System”. From the second interview, the term “good” stands out in relation to all benefits related to the freshwater provided by the LPRO-PV system. Issues such as “change”, “feelings”, “difference” and “commitment” were noteworthy and related to the use and maintenance of the LPRO-PV system (Figure 14).

6. Conclusions

A photovoltaic-driven low-pressure reverse osmosis system (LPRO-PV) was designed, tested under laboratory conditions, and installed in Samalayuca, Chihuahua, Mexico, to evaluate the technical feasibility and social impact of this technology. The LPRO-PV system consisted of six photovoltaic modules with a combined nominal power of 1.98 kW, a submersible pump, and an RO low-pressure desalination component with four polyamide membrane modules. The LPRO-PV system performance evaluation was carried out under open sky conditions and with synthetic water prepared from the water quality results of the study well, which was located in Samalayuca. The synthetic water salinity was 2921 ± 62.3 mg/L and the solar irradiance went from 520.0 to 1003.9 w/m2. The maximum freshwater volume produced was 1.8 ± 0.06 m3/day with a salinity value of 91 ± 1.9 mg/L and the calculated freshwater cost was USD 2.22.
A user perception study of the performance and maintenance of the LPRO-PV system was carried out based on the monthly records. According to users, the highest water production period was from May to October. On the other hand, the maintenance activities increased in February, May, and August. An important maintenance activity carried out by the users was changing the pretreatment filter, which was replaced periodically throughout one year of the system’s operation. The users’ activities that required water remained constant during the year. Only two exceptions were identified: an increase in September when the users shared water with travelers and other persons, and a decrease in December when the water demand for tree irrigation was lower due to winter. In addition, user interviews before the LPRO-PV system installation were carried out to identify the daily activities that required water; these were grouped into six categories. Second, user interviews after one year of operation of the LPRO-PV system were carried out to identify changes in water use. Word clouds were generated based on the interview results, and words related to the benefits and engagement in the project were noted. At the end of one year of operation, the users carried out adaptations to the LPRO-PV system to reflect an appropriation of the technology. The LPRO-PV system satisfied the basic freshwater requirements for a family in this region for one year, including the mobility-restriction period due to the COVID-19 pandemic, and is still operating.
This analysis reflects the importance of considering the technical aspects derived from experimental tests, as well as the perception of the users, since they showed a commitment to the maintenance activities that were identified in the experimental tests.

Author Contributions

Conceptualization, E.C.-R., J.I.-B., L.E.C.-G., R.J.R., J.C., A.R.-M. and U.D.-C.; Methodology, E.C.-R., J.I.-B., L.E.C.-G., R.J.R., J.C., A.R.-M. and U.D.-C.; Validation, J.I.-B., R.J.R., J.C., A.R.-M. and U.D.-C.; Social analysis, E.C.-R.; Investigation, E.C.-R., J.I.-B., L.E.C.-G., R.J.R., J.C., A.R.-M. and U.D.-C.; Writing—original draft preparation, E.C.-R., J.I.-B. and U.D.-C.; Writing—review and editing, E.C.-R., J.I.-B., L.E.C.-G., R.J.R., J.C., A.R.-M. and U.D.-C.; Fund raising, E.C.-R., R.J.R., J.C., A.R.-M. and U.D.-C. All authors have read and agreed to the published version of the manuscript.

Funding

This research was funded by the El Colegio de Chihuahua, the Instituto Mexicano de Tecnología del Agua IMTA-RD2103.1 and IMTA-RD2203.1 projects, the Conacyt Thematic Network 271624 “Energy Sustainability, Environment and Society”, FORDECYT 297486 projects And The APC was funded by Instituto Mexicano de Tecnología del Agua IMTA-RD2203.1.

Institutional Review Board Statement

The study was conducted according to the guidelines of the Declaration of Helsinki and approved by the Institutional Review Board of El Colegio de Chihuahua (Annual Operating Program 2019–2023, from the Environment, Energy and Society Studies Program, in the 2020 budget, in component 1.2. Water desalination in Samalayuca with a nanofiltration system with photovoltaic energy (monitoring)).

Informed Consent Statement

Informed consent was obtained from all subjects involved in the study.

Acknowledgments

The authors thank for the donations of materials by the company “Sustentable Morelos” and the Academic Group CA-UAEMOR-100 “Energy Sustainability and the Environment”. They also thank the student Alejandra Santamaría Islas, with a master’s degree in Energy Sustainability of the Autonomous University of the State of Morelos, and the users of the LPRO-PV system. Ulises Dehesa-Carrasco, Jonathan Ibarra-Bahena and Esmeralda Cervantes-Rendón appreciate the technical support provided by Gabriela Montano Armendáriz, Marisol Garcia Medellin and Olga García Villa.

Conflicts of Interest

The authors declare no conflict of interest.

References

  1. Chaibi, M.T. An overview of solar desalination for domestic and agriculture water needs in remote arid areas. Desalination 2000, 127, 119–133. [Google Scholar] [CrossRef]
  2. Kharraz, J.A.; Richards, B.S.; Schäfer, A.I. Autonomous Solar-Powered Desalination Systems for Remote Communities. In Desalination Sustainability: A Technical, Socioeconomic, and Environmental Approach; Hassan, A.A., Ed.; Elsevier: Amsterdam, The Netherlands, 2017; pp. 75–125. [Google Scholar]
  3. Schäfer, A.I.; Hughes, G.; Richards, B.S. Renewable energy powered membrane technology: A leapfrog approach to rural water treatment in developing countries? Renew. Sustain. Energy Rev. 2014, 40, 542–556. [Google Scholar] [CrossRef]
  4. Ibrahim, M.M. Technical and Economic Comparison between Solar and Wind Energy Supplying Desalination System. J. Sustain. Dev. Energy Water Environ. Syst. 2022, 10, 1080382. [Google Scholar] [CrossRef]
  5. Pimentel da Silva, G.D.; Sharqawy, M.H. Techno-economic analysis of low impact solar brackish water desalination system in the Brazilian Semiarid region. J. Clean. Prod. 2020, 248, 119255. [Google Scholar] [CrossRef]
  6. Dehesa-Carrasco, U.; Ramírez-Luna, J.; Calderón-Mólgora, C.; Villalobos-Hernández, R.; Flores-Prieto, J.J. Experimental evaluation of a low pressure desalination system (NF-PV), without battery support, for application in sustainable agriculture in rural areas. Water Sci. Technol. Water Supply 2017, 17, 579–587. [Google Scholar] [CrossRef]
  7. De Munari, A.; Capão, D.P.S.; Richards, B.S.; Schäfer, A.I. Application of solar powered desalination in a remote town in South Australia. Desalination 2009, 248, 72–82. [Google Scholar] [CrossRef]
  8. Ahmad, G.E.; Schmid, J. Feasibility study of brackish water desalination in the Egyptian deserts and rural regions using PV systems. Energ. Convers. Manag. 2002, 43, 2641–2649. [Google Scholar] [CrossRef]
  9. Alemán-Nava, G.S.; Casiano-Flores, V.H.; Cárdenas-Chávez, D.L.; Díaz-Chavez, R.; Scarlat, N.; Mahlknecht, J.; Dallemand, J.-F.; Parra, R. Renewable energy research progress in Mexico: A review. Renew. Sustain. Energy Rev. 2014, 32, 140–153. [Google Scholar] [CrossRef]
  10. Nuño, N.; Muela, J.; Hausmann-Muela, S.; Cevallos, M.; Harting, S.M.; Christen, A.; Mäusezahl, D. The meanings of Water: Socio-Cultural Perception of Solar Disinfected (SODIS) Drinking Water in Bolivia and Implications for its Uptake. Water 2020, 12, 442. [Google Scholar] [CrossRef]
  11. Ghermandi, A.; Messalem, R. Solar-driven desalination with reverse osmosis: The state of the art. Desalination Water Treat. 2009, 7, 285–296. [Google Scholar] [CrossRef] [Green Version]
  12. Alhaj, M.; Al-Ghamdi, S.G. Integrating concentrated solar power with seawater desalination technologies: A multi-regional environmental assessment. Environ. Res. Lett. 2019, 14, 074014. [Google Scholar] [CrossRef]
  13. Censo de Población y Vivienda 2020. Access to INEGI. Available online: https://www.inegi.org.mx/app/cpv/2020/resultadosrapidos/default.html?texto=Samalayuca (accessed on 12 May 2021).
  14. SEMARNAT; CONANP. Programa de Manejo—Área de Protección de Flora y Fauna Médanos de Samalayuca; Gobierno de México: Mexico City, Mexico; Semarnat: Secretaría del Medio Ambiente y Recursos Naturales (SEMARNAT): Mexico City, Mexico; Comisión Nacional de Áreas Naturales Protegidas (CONANP): Mexico City, Mexico, 2013. [Google Scholar]
  15. Actualización de la Disponibilidad Media Anual de Agua en el Acuífero Samalayuca (0810), Estado de Chihuahua. Access to CONAGUA. Available online: https://sigagis.conagua.gob.mx/gas1/Edos_Acuiferos_18/chihuahua/DR_0810.pdf (accessed on 13 May 2021).
  16. Castillo, R.C.; Cortés, A.; Morales, P.; Romero, G. A survey of groundwater flow using deuterium and oxygen-18 as traces, in the Samalayuca Dunes Northern Mexico. Rev. Mex. Física 1984, 30, 647–655. [Google Scholar]
  17. Bozhikaliev, V.; Sazdovski, I.; Adler, J.; Markovska, N. Techno-economic, Social and Environmental Assessment of Biomass Based District Heating in a Bioenergy Village. J. Sustain. Dev. Energy Water Environ. Syst. 2019, 7, 601–614. [Google Scholar] [CrossRef]
  18. Universidad Autónoma de Ciudad Juárez. Access to the Statistics of Climatology and Air Quality Laboratory. Available online: https://cecatev.uacj.mx/Estacion101/stats.html (accessed on 15 March 2022).
  19. Shannon, M.A.; Bohn, P.W.; Elimelech, M.; Georgiadis, J.G.; Mariñas, B.J.; Mayes, A.M. Science and technology for water purification in the coming decades. Nature 2008, 452, 301–310. [Google Scholar] [CrossRef] [PubMed]
  20. Thomson, M. Reverse-Osmosis Desalination of Seawater Powered by Photovoltaics without Batteries. Ph.D. Thesis, Loughborough University, Loughborough, UK, 2003. [Google Scholar]
  21. Cheah, S. Photovoltaic Reverse Osmosis Desalination System; Desalination and Water Purification Research and Development Report No. 104; U.S. Department of the Interior Bureau of Reclamation: Washington, DC, USA, 2004. [Google Scholar]
  22. Kanzari, A. The Solco PV–RO system—Maldives case study. In Proceedings of the International Seminar on Desalination Units Powered by Renewable Energy Systems, Hammamet, Tunisia, 26 September 2005. [Google Scholar]
  23. Richards, B.S.; Capão, D.P.S.; Schäfer, A.I. Renewable energy powered membrane technology. 2. The effect of energy fluctuations on performance of a photovoltaic hybrid membrane system. Environ. Sci. Technol. 2008, 42, 4563–4569. [Google Scholar] [CrossRef] [PubMed]
  24. Keefer, B.G.; Hembree, R.D.; Schrack, F.C. Optimized matching of solar photovoltaic power with reverse osmosis desalination. Desalination 1985, 54, 89–103. [Google Scholar]
  25. Glanz, S.; Schönauer, A.-L. Towards a Low-Carbon Society via Hydrogen and Carbon Capture and Storage: Social Acceptance from a Stakeholder Perspective. J. Sustain. Dev. Energy Water Environ. Syst. 2021, 9, 1–9. [Google Scholar] [CrossRef]
Figure 1. Solar radiation distribution in the State of Chihuahua.
Sustainability 14 10958 g001
Figure 2. General scheme of a photovoltaic reverse osmosis (PV-RO) desalination plant without electricity storage.
Sustainability 14 10958 g002
Figure 3. Diagram of the LPRO-PV system.
Sustainability 14 10958 g003
Figure 4. Photovoltaic modules installed on-site.
Sustainability 14 10958 g004
Figure 5. The LPRO-PV system installed in Samalayuca, Chihuahua, Mexico.
Sustainability 14 10958 g005
Figure 6. Solar irradiance during two typical solar days.
Sustainability 14 10958 g006
Figure 7. Dependence of freshwater production on solar irradiance.
Sustainability 14 10958 g007
Figure 8. Comparative hydraulic pressure loss in the pretreatment filter, with and without fouling.
Sustainability 14 10958 g008
Figure 9. Freshwater production dependence on pumping pressure.
Sustainability 14 10958 g009
Figure 10. Freshwater production and salinity behavior with a hydraulic pressure loss of 4.3 ± 0.50 psi.
Sustainability 14 10958 g010
Figure 11. Freshwater production and salinity behavior with a hydraulic pressure loss of 23.8 ± 0.58 psi.
Sustainability 14 10958 g011
Figure 12. User experience of the LPRO-PV system.
Sustainability 14 10958 g012
Figure 13. Word cloud of the first interview.
Sustainability 14 10958 g013
Figure 14. Word cloud of the second interview.
Sustainability 14 10958 g014
Table 1. Water quality results of the Samalayuca well water sample.
ParameterSample ValueMLP
Electrical conductivity (µS/cm)6710Not applicable
Chlorides (mg/L)865250
Nitrates (mg/L)3.3910
pH7.536.5–8.5
Total phosphorus (mg/L)<2.45Not applicable
Sulphates (mg/L)2480400
Arsenic (mg/L)<0.0050.05
Copper (mg/L)0.0552
Iron (mg/L)0.210.30
Manganese (mg/L)<0.0500.15
Potassium (mg/L)<4.80Not applicable
Sodium (mg/L)826200
Zinc (mg/L)3595.0
Table 2. Characteristics of the photovoltaic module.
DescriptionValue
Nominal max. power (W)330
Operating voltage (V)37.2
Operating current (A)8.88
Open circuit voltage (V)45.6
Short circuit current (A)9.45
Table 3. Instrumental devices used for the evaluation of the LPRO-PV system.
InstrumentAccuracy
Pressure Transducer±0.25%
First class pyranometer SR12±1.8%
Data Acquisition / Data Logger Switch Unit0.003%
Type J Thermocouple±0.5%
Water Flow Meter±5%
Multiparameter waterproof meter1 ppm (mg/L)
Table 4. Main features for cost estimation.
Capital cost (Cc)USD 9250.00
Membrane module cost (Mc)USD 1800
Freshwater production capacity (M)1.8 m3/day
Plant availability (f)90%
Table 5. Calculated unit costs for freshwater production.
Item Cost
Annual fixed charges (USD/yr) A F = a × C c 942.13
Membrane replacement (USD/yr) A M R = 0.1 M c 180.00
Operating and maintenance annual cost (USD/yr) A O & M = 0.2 A F 188.43
Total annual payment (USD/yr) A T = A F + A M R 1310.56
Unit production cost (USD/m3) A P = A T f M 365 2.22
Table 6. PV-powered RO membrane filtration systems reported in the literature.
PV Capacity (kW)Freshwater Production (m3/day)Freshwater Production Cost (USD/m3)Reference
1.541.453.00[20]
0.541.506.50[21]
0.301.006.50[22]
0.541.283.60[21]
0.601.103.70[23]
0.480.869.0[24]
1.981.82.22Present study
Table 7. Perception of the performance, maintenance, and use of the LPRO-PV system.
MonthPerformanceMaintenanceUse
November 2019Water pressure (1)
Time of operation (1). Total: 2
1 and 61 to 5
December 2019Water pressure (1)
Time of operation (1). Total: 2
1, 2 and 4Improvement to hair and skin (1 to 4)
January 2020Water pressure (1)
Time of operation (1). Total: 2
1,2 and 41 to 4
February 2020Water pressure (1)
Time of operation (1). Total: 2
1 to 41 to 5
March 2020Water pressure (2)
Time of operation (2). Total: 4
1, 2 and 4Increase in personal hygiene due to the pandemic (1 to 5)
April 2020Water pressure (2)
Time of operation (3). Total: 5
1 and 41 to 5
May 2020Water pressure (3)
Time of operation (3). Total: 6
A small leak in the system was repaired. 1, 3, 4 y 51 to 5
June 2020Water pressure (3)
Time of operation (3). Total: 6
1 and 4Change in color in the pines, greener (1 to 5)
July 2020Water pressure (3)
Time of operation (3). Total: 6
1 and 41 to 5
August 2020Water pressure (3)
Time of operation (3). Total: 6
Maintenance due to high temperatures. 1, 4, 5 and 61 to 5
September 2020Water pressure (3)
Time of operation (3). Total: 6
4Share water with two homeless people (1 to 6)
October 2020Water pressure (3)
Time of operation (3). Total: 6
An irrigation system for the trees is added.1, 4 and 61 to 5
November 2020Water pressure (3)
Time of operation (1). Total: 4
1, 4 and 61 to 5
Publisher’s Note: MDPI stays neutral with regard to jurisdictional claims in published maps and institutional affiliations.

