Article

Designing a Recycling Network for the Circular Economy of Plastics with Different Multi-Criteria Optimization Approaches

Institute for Industrial Production, Karlsruhe Institute of Technology, 76187 Karlsruhe, Germany
*
Author to whom correspondence should be addressed.
Sustainability 2022, 14(17), 10913; https://doi.org/10.3390/su141710913
Submission received: 30 June 2022 / Revised: 12 August 2022 / Accepted: 16 August 2022 / Published: 1 September 2022

Abstract

:
A growing plastic production increases the pressure on waste management systems, which have to cope with greater volumes of plastic waste. Increased plastics recycling can reduce environmental impacts by lowering the need for primary plastics production and thus fossil resources demand. Current research is mainly focused on identifying environmentally friendly recycling technologies for different waste streams. However, recycling capacities must also be expanded to handle the waste generated. Therefore, this paper develops multiple exemplary multi-criteria optimization models to design an optimal recycling network. The models are deployed in a case study for plastic packaging waste in Europe for an advanced mechanical recycling process. We compare the different multi-criteria optimization approaches, how they balance environmental and economic aspects differently, and how this affects the recycling network design. Finally, we compare the optimization approaches and find goal programming the most promising approach for recycling network design that ensures a balance between economic and environmental objectives.

1. Introduction

In 2019, global plastic production reached almost 370 million tons, and European plastic production reached nearly 58 million tons [1]. Current forecasts indicate that the global annual production of plastic will grow further [2], resulting in an increasing amount of plastic waste that waste management systems must handle. In Europe, almost 40% of plastic is used in the packaging sector, from which only 32.5% was collected for recycling [1]. Primary plastic is produced from crude oil, and the production process is energy demanding, resulting in an intensive environmental footprint [3]. Recycling plastic waste and establishing a circular economy for plastics is a promising way to become more independent of fossil-based resources and reduce the plastic industry’s environmental footprint [4]. The European Union (EU) acknowledges this in its legislation and demands a recycling rate for plastic packaging waste of 50% in 2025 and 55% in 2030 [5]. Moreover, improving the circular economy of plastics is part of the current research focusing on the design for recycling [6], advanced mechanical recycling [7], or alternative recycling technologies such as chemical recycling [8].
Multiple studies have assessed current and evolving recycling technologies for plastic packaging waste and compared them regarding economic and environmental indicators. Neo et al. [9] provide life cycle assessments for end-of-life (EoL) plastic waste options in India and Indonesia, including mechanical recycling, co-processing in cement kilns, incineration, landfilling, open dumping, and open burning. Faraca et al. [10] provide an overview of the economic and environmental performance of simple and advanced mechanical recycling processes and a chemical recycling process for plastic waste in Denmark. Civancik-Uslu et al. [11] compare the environmental performance of mechanical and chemical recycling within a Belgium case study. Besides an environmental assessment, Volk et al. [12] include an economic assessment and the combination of mechanical and chemical recycling approaches in their German case study. Jeswani et al. [13], Tonini et al. [14], Keller et al. [15], Voss et al. [16] all assess different chemical or feedstock recycling technologies to improve the plastic recycling rate and contribute to a circular economy of plastics.
However, besides introducing new recycling approaches and establishing the most environmentally beneficial recycling technology for each plastic waste stream, current recycling capacities must be extended to reach the recycling targets set by the European Commission. The field of reverse logistics aims to recover secondary resources by efficient backward flows of materials from consumers to raw material processors and producers [17]. Designing an appropriate reverse logistics and recycling network is crucial, as it provides the basis for all operations connected to the circular resource flow [17], including establishing the needed recycling capacities and determining the optimum location of recycling plants. Different mathematical approaches support the design of appropriate European recycling networks [18,19]. Environmental burdens should be considered in planning the network since the overarching purpose of expanding plastic recycling capacities is the reduction of the total environmental footprint. Current approaches for designing recycling networks focus on minimizing the recycling costs [20,21,22]. A few approaches also consider environmental burdens [23,24]. However, these approaches mainly focus on one environmental burden and do not differentiate between environmental impact categories.
Therefore, this study compares two multi-objective decision-making approaches for designing a European recycling network for plastic packing waste, enabling a circular economy for plastics. The network design includes establishing the needed recycling capacities, defining the best locations of recycling plants, and determining optimal transport routes between waste generation locations and recycling plants and between recycling plants and demand locations. The vision is a European circular economy independent of waste exports. The network design focuses on minimizing both cost and multiple environmental burdens. A lexicographic modeling approach and a goal programming approach are compared regarding their suitability to model trade-offs between the economic and environmental objectives. It is determined whether the two approaches lead to different network layouts and, if so, how significant the differences in the recycling network are. A case study assesses the economic and environmental implications of a recycling network for plastic packaging waste that supports the European circular economy strategy.

2. Materials and Methods

This section provides a short overview of mathematical optimization approaches for designing a recycling network, introduces multi-objective decision-making, and describes the approaches implemented in the case study.

2.1. Designing Reverse Logistic Networks

Reverse logistic networks are designed to optimize the recovery or reuse of end-of-life resources in supply chains [17]. Recycling activities are usually a complex recovery process consisting of various collection, sorting, and processing stages that must be coordinated. Resources that can not be recycled must be disposed of by either incinerating or landfilling them. Part of the problem of designing reverse logistic networks can be solved with a respective facility location problem. Here, the objective is to find the optimal placement of facilities in a network to minimize costs, environmental burdens, or both. Mathematical models of facility location planning have been extensively studied [25]. Further extensions of the facility location problem such as capacities, stochastic modeling, or dynamic modeling are provided, e.g., by Nickel et al. [19].
Nickel et al. [19] also give an introduction and overview of multi-criteria optimization. Multi-criteria optimization allows the assessment of multiple objectives simultaneously. Multi-criteria decisions can be separated into Multi-Attribute Decision-Making (MADM) and Multi-Objective Decision-Making (MODM) [18]. With MODM, the optimal solution is determined by mathematical modeling, whereas with MADM, a solution is selected from a predefined set of alternatives [18]. This study focuses on MODM solution approaches, as the design of the recycling network has a high number of possible solutions [26].
MODM approaches describe the solution space with mathematical models, whereby all solutions are permissible that fulfill specified constraints [18]. Several quantifiable objective functions describe the decision-maker’s objective system [27]. Constraints restrict the solution space of the problem. Solving MODM problems includes investigating conflicting objectives [28]. The ideal solution consists of the optimum value for each objective, while an efficient solution has an objective that cannot be improved without a simultaneous detriment of another objective [29]. These efficient solutions are also defined as Pareto-optimal or Pareto-efficient [30]. All Pareto-efficient solutions form the Pareto front of the problem. The computation of this Pareto front is resource-consuming but helps decision-makers find the preferred solution. Based on the preference order of the decision-maker, approaches exist that reduce the complexity of calculating one optimal solution [18]. According to Colapinto et al. [31], goal programming algorithms are popular, while Farahani et al. [28] rather propose lexicographic methods. In the following, these two approaches are introduced as well as implemented and compared in this study.

2.1.1. Lexicographic Optimization

The lexicographic optimization is directly based on the preference order of the decision-maker. The objectives are considered sequentially in a predefined order determined by the decision-maker [19]. The solution procedure starts with the optimization of the objective with the highest priority, while subordinate objectives are not considered in this first step [19]. If there are multiple optimal solutions for the superordinate objective, the next subordinate objective is optimized based on this set of solutions [19]. This procedure is repeated until there is one solution left or all objectives have been optimized [19]. Objective suppression can occur since some objective functions could be disregarded [19].

2.1.2. Goal Programming

The method of goal programming assumes that the decision-maker has a target value for each objective value [19]. A solution is calculated by minimizing the deviation of the objective value from the target value [19]. Three main goal-programming approaches are differentiated by metric and are suitable for different types of optimization problems: lexicographic, weighted, and Chebyshev goal programming [32]. In the lexicographic goal-programming approach, a series of sequential optimizations are performed to solve the problem [32]. Due to the formulation with priority levels, and thereby its relation to lexicographic optimization, the approach is not pursued further here. In weighted goal programming, direct trade-offs of the undesirable variances are performed by a weighted, normalized single-target attainment function. The weights are assigned to the deviation variables that generally require a reasoned idea about the weighting. Another disadvantage of this approach is that the sum of the variances is minimized, which may result in an objective being weighted less if its variance has a minor impact on the objective function [32]. The min-max approach of Flavell [33], also referred to as Chebyshev Goal Programming (CGP), uses a maximum norm. The norm minimizes the maximum deviation from each goal rather than the sum of all deviations. Therefore, this approach is suitable when a good balance of all objectives is to be achieved. Furthermore, the CPG approach is the only goal programming approach of the three presented that finds solutions that are not at extreme points. Thus, the CPG approach is selected out of the three goal programming approaches to be compared to the lexicographic approach. Moreover, the CGP approach generally leads to a trade-off between objectives in contrast to the lexicographic approach, where prioritized objectives usually dominate the solution.

3. Case Study: Plastic Recycling Network for Europe

The approaches to designing a reverse logistics network are investigated based on a European case study to recycle post-consumer plastic packaging waste. In Europe, there are considerable differences in the recycling, landfilling, and energy recovery of plastic packaging waste between countries [34]. Despite these differences in handling plastic waste, this case study assumes that there are no regional differences in the implemented sorting and recycling steps and that the organization of the waste handling systems is the same throughout Europe. This assumption describes an idealized and standardized waste management system within Europe and a European circular economy. It is also justifiable since this study focuses on implementing a reverse logistic network for waste treatment with MODM approaches and comparing solution approaches regarding trade-offs between economic and environmental objectives. The assessed network includes waste generation within European regions, placement of recycling sites to treat the plastic packaging waste, and transportation of waste and the recycled material to processing and demand sites, respectively. Transportation is limited to direct and single supply; tour planning is not included. All materials are transported by lorry, other forms of transportation are neglected. Exports to other world regions are also not considered, as the vision of a European circular economy in which all European plastic waste is also treated in Europe is modeled.
The plastic packaging waste within the European regions is forwarded to a material recovery facility (MRF). Here, the different plastic types are separated, ground, washed, and pressed to pellets [10]. Separated metal scrap is forwarded to respective metal production processes (e.g., adhering aluminum), and remaining sorting residues are incinerated to recover electricity and heat [10]. The plastic pellets are input for plastic converters in Europe that produce new plastic products to close the material cycle. Costs and environmental burdens are associated with opening and operating MRFs, recycling plastic waste, and transporting waste and recycled plastic. The assessed indicators in this study are recycling costs and a subset of standard life cycle assessment indicators found in the literature: global warming potential (GWP), terrestrial acidification (TA), terrestrial eutrophication (ET), and human toxicity (HTc). The indicators chosen as data for the selected process are provided by Faraca et al. [10].

3.1. Mathematical Formulation

The case study models a static and deterministic facility location problem and aims to place two facility types of the same technology but with different waste handling capacities: a large central facility and a smaller decentral facility. Thus, it is a capacitated two-stage reverse logistics model with multi-sourcing and direct delivery without interaction between facilities. The model is formulated as a mixed-integer problem (MIP). Table 1 provides an overview of the problem’s sets, parameters, and variables.
Four sets are distinguished: First, set S of regions with recyclable waste contains all regions (NUTS 2) where the plastic waste in Europe is generated. Second, R is a set of regions where MRFs can potentially be placed. There are no limitations where MRFs can be opened, so this set also contains every considered region. Third, set D contains all regions where demand for recycled material exists. Further information on recyclable wastes and demand per region are described in Section 3.2. Forth, a set of input capacity classes for the MRFs is introduced. We distinguish between two capacity classes, and the models are formulated so that only one kind of MRF can be opened in one region at a time. The waste generated and its demand for recycled material are captured within the respective parameters for each region (see Section 3.2.1 and Section 3.2.1). The costs or environmental burdens of the transportation, recycling waste, and operating an MRF, as well as building an MRF, are parameters within the model (see Section 3.2.3 and Section 3.2.4). Costs and environmental burdens of opening and recycling plastic waste vary depending on the capacity class. The recycling costs of the material are also region-specific, especially as labor costs and labor cost levels differ throughout Europe. An environmental impact differentiation based on the different regions (such as applied by Schiessl et al. [35], Müller et al. [36]) is not conducted as the same MRF with the same recycling process is opened throughout Europe. Decision variables of the model are the amount of transported material from supply locations to MRFs ( x s r , i ) and from MRFs to the demand locations ( x r d , i ), and the binary variable y r , i indicates if an MRF of capacity i is placed in a region. A cost-minimizing MIP can be formulated using the sets, parameters, and variables within Equations (1) to (8):
min s S r R i I x s r , i · c t r a n s p o r t + r R d D i I x r d , i · c t r a n s p o r t +   r R s S i I c i , r r e c y c l i n g · x s r , i + r R i I c i o p e n i n g · y r , i
s . t . r R i I x s r , i = q s s u p p l y s S
d D x r d , i = 0.67 · s S x s r , i r R , i I
r R i I x r d , i q d d e m a n d d D
s S x s r , i K i · y r , i r R , i I
i I y r , i 1 r R ,
x s r , i , x r d , i 0 s S , r R , d D , i I
y r , i { 0 , 1 } r R , i I
This basic formulation of the model includes transport costs between s, r, and d, region-specific recycling costs at the MRF (includes recycling costs of the plastic waste and operating costs of the MRF), and costs associated with opening an MRF in a region in its objective function (1). The total costs of the recycling network are minimized.
The objective function (1) is subject to constraint (2) that all waste within a region must be handled within the network. Constraint (3) describes the material flow conservation of the network, defining that all the waste entering an MRF must be handled and associated products must be forwarded to the demand points. Therein, a plastics recovery rate of 67% of the input material is assumed [10]. Constraint (4) ensures that no demand point is oversupplied. Each MRF has a capacity (decentral or central) that must not be exceeded (Constraints (5)). Constraint (5) also ensurses that plastic waste is only forwarded to regions where an MRF has been placed. Constraint (6) ensures that only one facility is placed per region. Suppose this facility does not provide the capacity to handle all plastic waste in that region, then the remaining plastic waste must be exported to other European regions. Constraints (7) and (8) define the range of values of the decision variables.
In the following subsections, the one-dimensional formalization of the problem with a single objective is extended to a multi-objective linear program, including the assessment of environmental indicators.

3.1.1. Lexicographic Optimization

Additional objective functions for the assessed environmental indicators GWP, TA, ET, and HTc are formulated to include the minimization of environmental burdens in the model ((9) to (12)). Each objective function follows the same structure as the cost objective function (1). Environmental burdens for transporting material between different stages of the network, an environmental burden associated with material recycling, and an environmental burden associated with the opening of MRFs of different capacities are summed up to a total environmental impact per indicator.
min s S r R i I x s r , i · g w p t r a n s p o r t + r R d D i I x r d , i · g w p t r a n s p o r t +   r R s S i I g w p i r e c y c l i n g · x s r , i + r R i I g w p i o p e n i n g · y r , i
min s S r R i I x s r , i · t a t r a n s p o r t + r R d D i I x r d , i · t a t r a n s p o r t +   r R s S i I t a i r e c y c l i n g · x s r , i + r R i I t a i o p e n i n g · y r , i
min s S r R i I x s r , i · e t t r a n s p o r t + r R d D i I x r d , i · e t t r a n s p o r t +   r R s S i I e t i r e c y c l i n g · x s r , i + r R i I e t i o p e n i n g · y r , i
min s S r R i I x s r , i · h t c t r a n s p o r t + r R d D i I x r d , i · h t c t r a n s p o r t +   r R s S i I h t c i r e c y c l i n g · x s r , i + r R i I h t c i o p e n i n g · y r , i
These objective functions are considered sequentially in a predefined order, which is assumed here to start with cost minimization. However, any other order is likewise possible. The objective functions are then considered in the order listed. The network’s GWP objective (9) is minimized within all possible solutions with minimal recycling costs. Following that, the TA objective (10), ET objective (11), and HTC objective (12) are considered. In a slight variation of the lexicographic approach, we allow a deviation ( ϵ = 0.01 ) from the optimal objective function values to relax the lexicographic constraint and enable more flexibility. Thus, the feasible solution space can deviate from an optimal solution by 1%.

3.1.2. Goal Programming

As described above, CGP follows a satisfying approach, minimizing the maximum deviation from each goal and aiming at a balance of the achievement of each objective instead of suppressed objectives. Therefore, an adapted MIP is formulated with the Equations (13)–(25):
min d i s t
s . t . r R i I x s r , i = q s s u p p l y s S
d D x r d , i = 0.67 · s S x s r , i r R , i I
r R i I x r d , i q d d e m a n d d D
s S x s r , i K i · y r , i r R , i I
i I y r , i 1 r R
F 1 ( x , y ) F 1 E F 1 E d i s t 0
F 2 ( x , y ) F 2 E F 2 E d i s t 0
F 3 ( x , y ) F 3 E F 3 E d i s t 0
F 4 ( x , y ) F 4 E F 4 E d i s t 0
F 5 ( x , y ) F 5 E F 5 E d i s t 0
x s r , i , x r d , i , d i s t 0 s S , r R , d D , i I
y r , i { 0 , 1 } r R , i I
The continuous, non-negative auxiliary variable d i s t is introduced in the CGP formulation. It measures the distance of each solution to the optimal values of the single-criteria optimization and should be minimized (13). Constraints (14) to (18) do not differ from the former model formulation. Constraints (19) to (23) represent the distance measurement, where the distances between objective values are normalized with a percentage normalization. Consequently, the variable d i s t is interpreted as the relative deviation (in percent) of the objective value from the optimal value. Constraints (24) and (25) define the range of values of the decision variables, including d i s t .

3.2. Input Data

The input data for the case study include the waste volume in different European regions, the demand for recycled plastic pellets for the production of plastic products, costs, as well as environmental burdens associated with the transport and recycling of the plastic waste and the opening of MRFs. Furthermore, the distances between the different regions of the network are given.

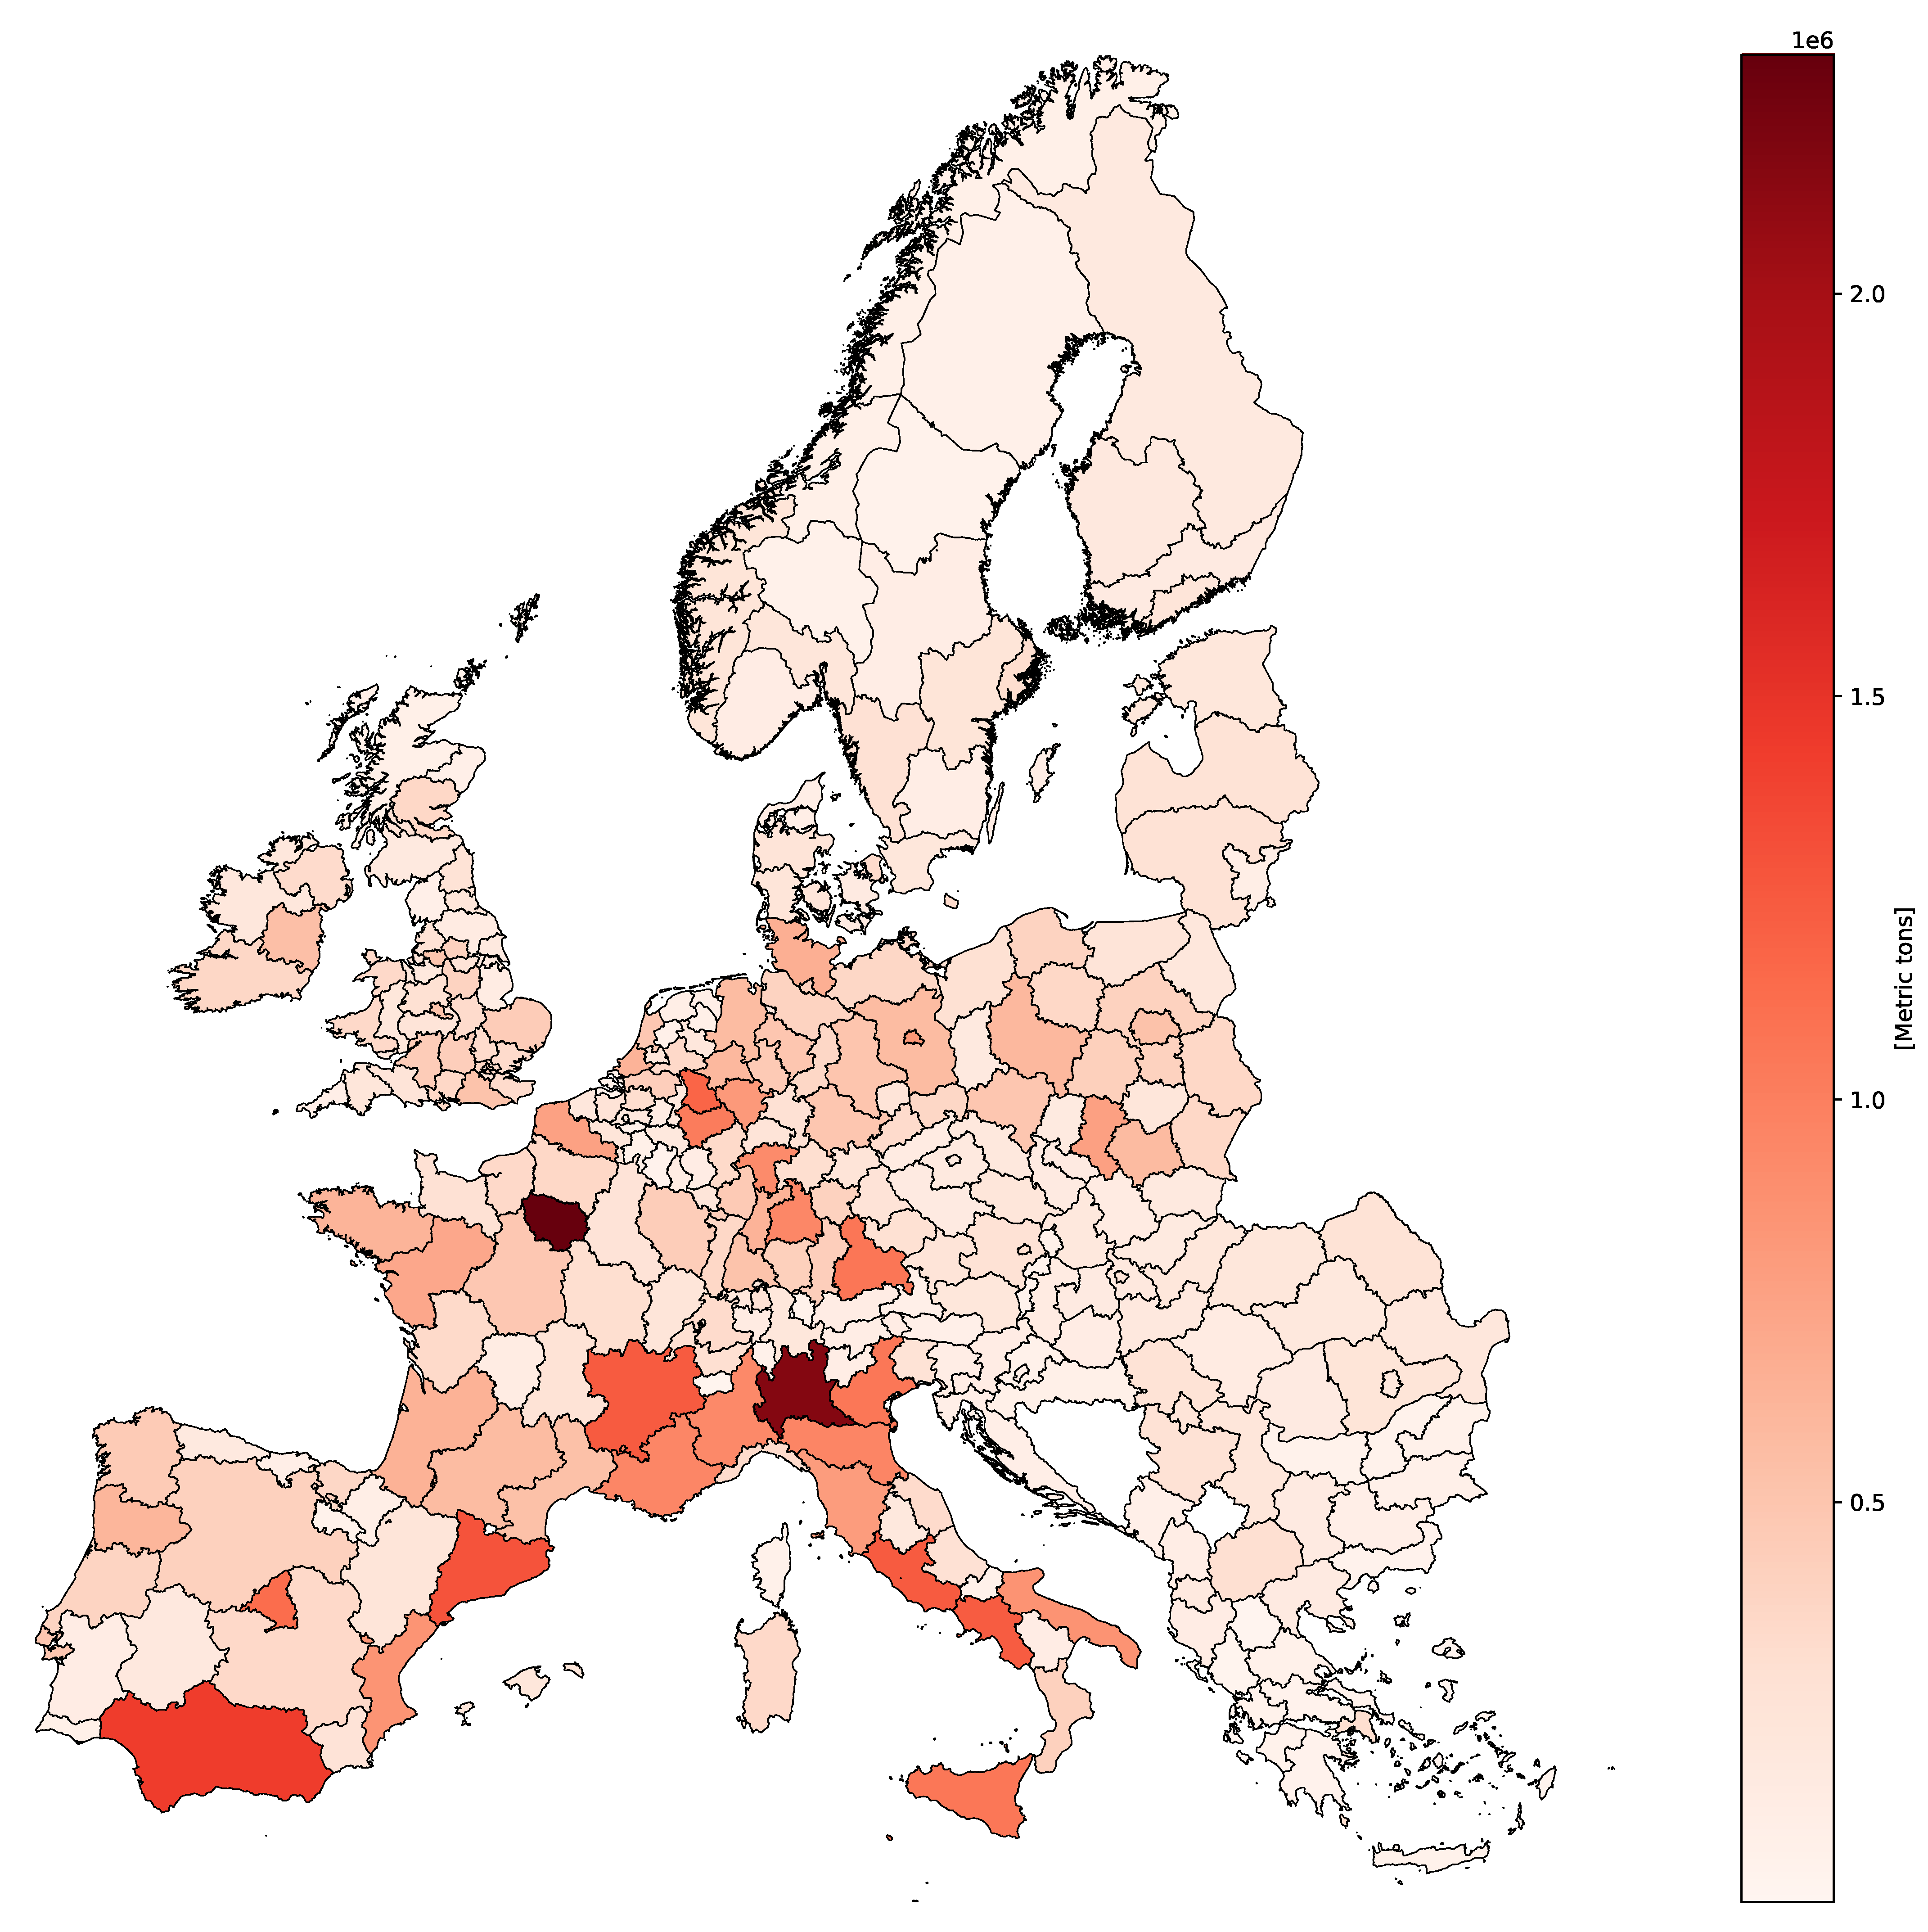
3.2.1. Plastic Waste Volume

In Europe, the plastic packaging waste generation per capita, as well as the residents for each NUTS 2 region are provided by Eurostat [34,37]. With this information, the European waste volume of post-consumer plastic packaging waste is regionalized, multiplying the number of residents of each region with the plastic packaging waste generation per capita. The calculation of the total plastic packaging waste is based on the data for the year 2019.
For six countries, no current data was available. In these cases, data from culturally and regionally consistent countries was adopted. Table 2 shows this relationship for countries with missing data.
Figure 1 provides an overview of the plastic waste volume throughout Europe. Some metropolitan regions such as Paris and Milan are clearly visible, while in south-western Europe, more plastic waste arises than in central and northern Europe.

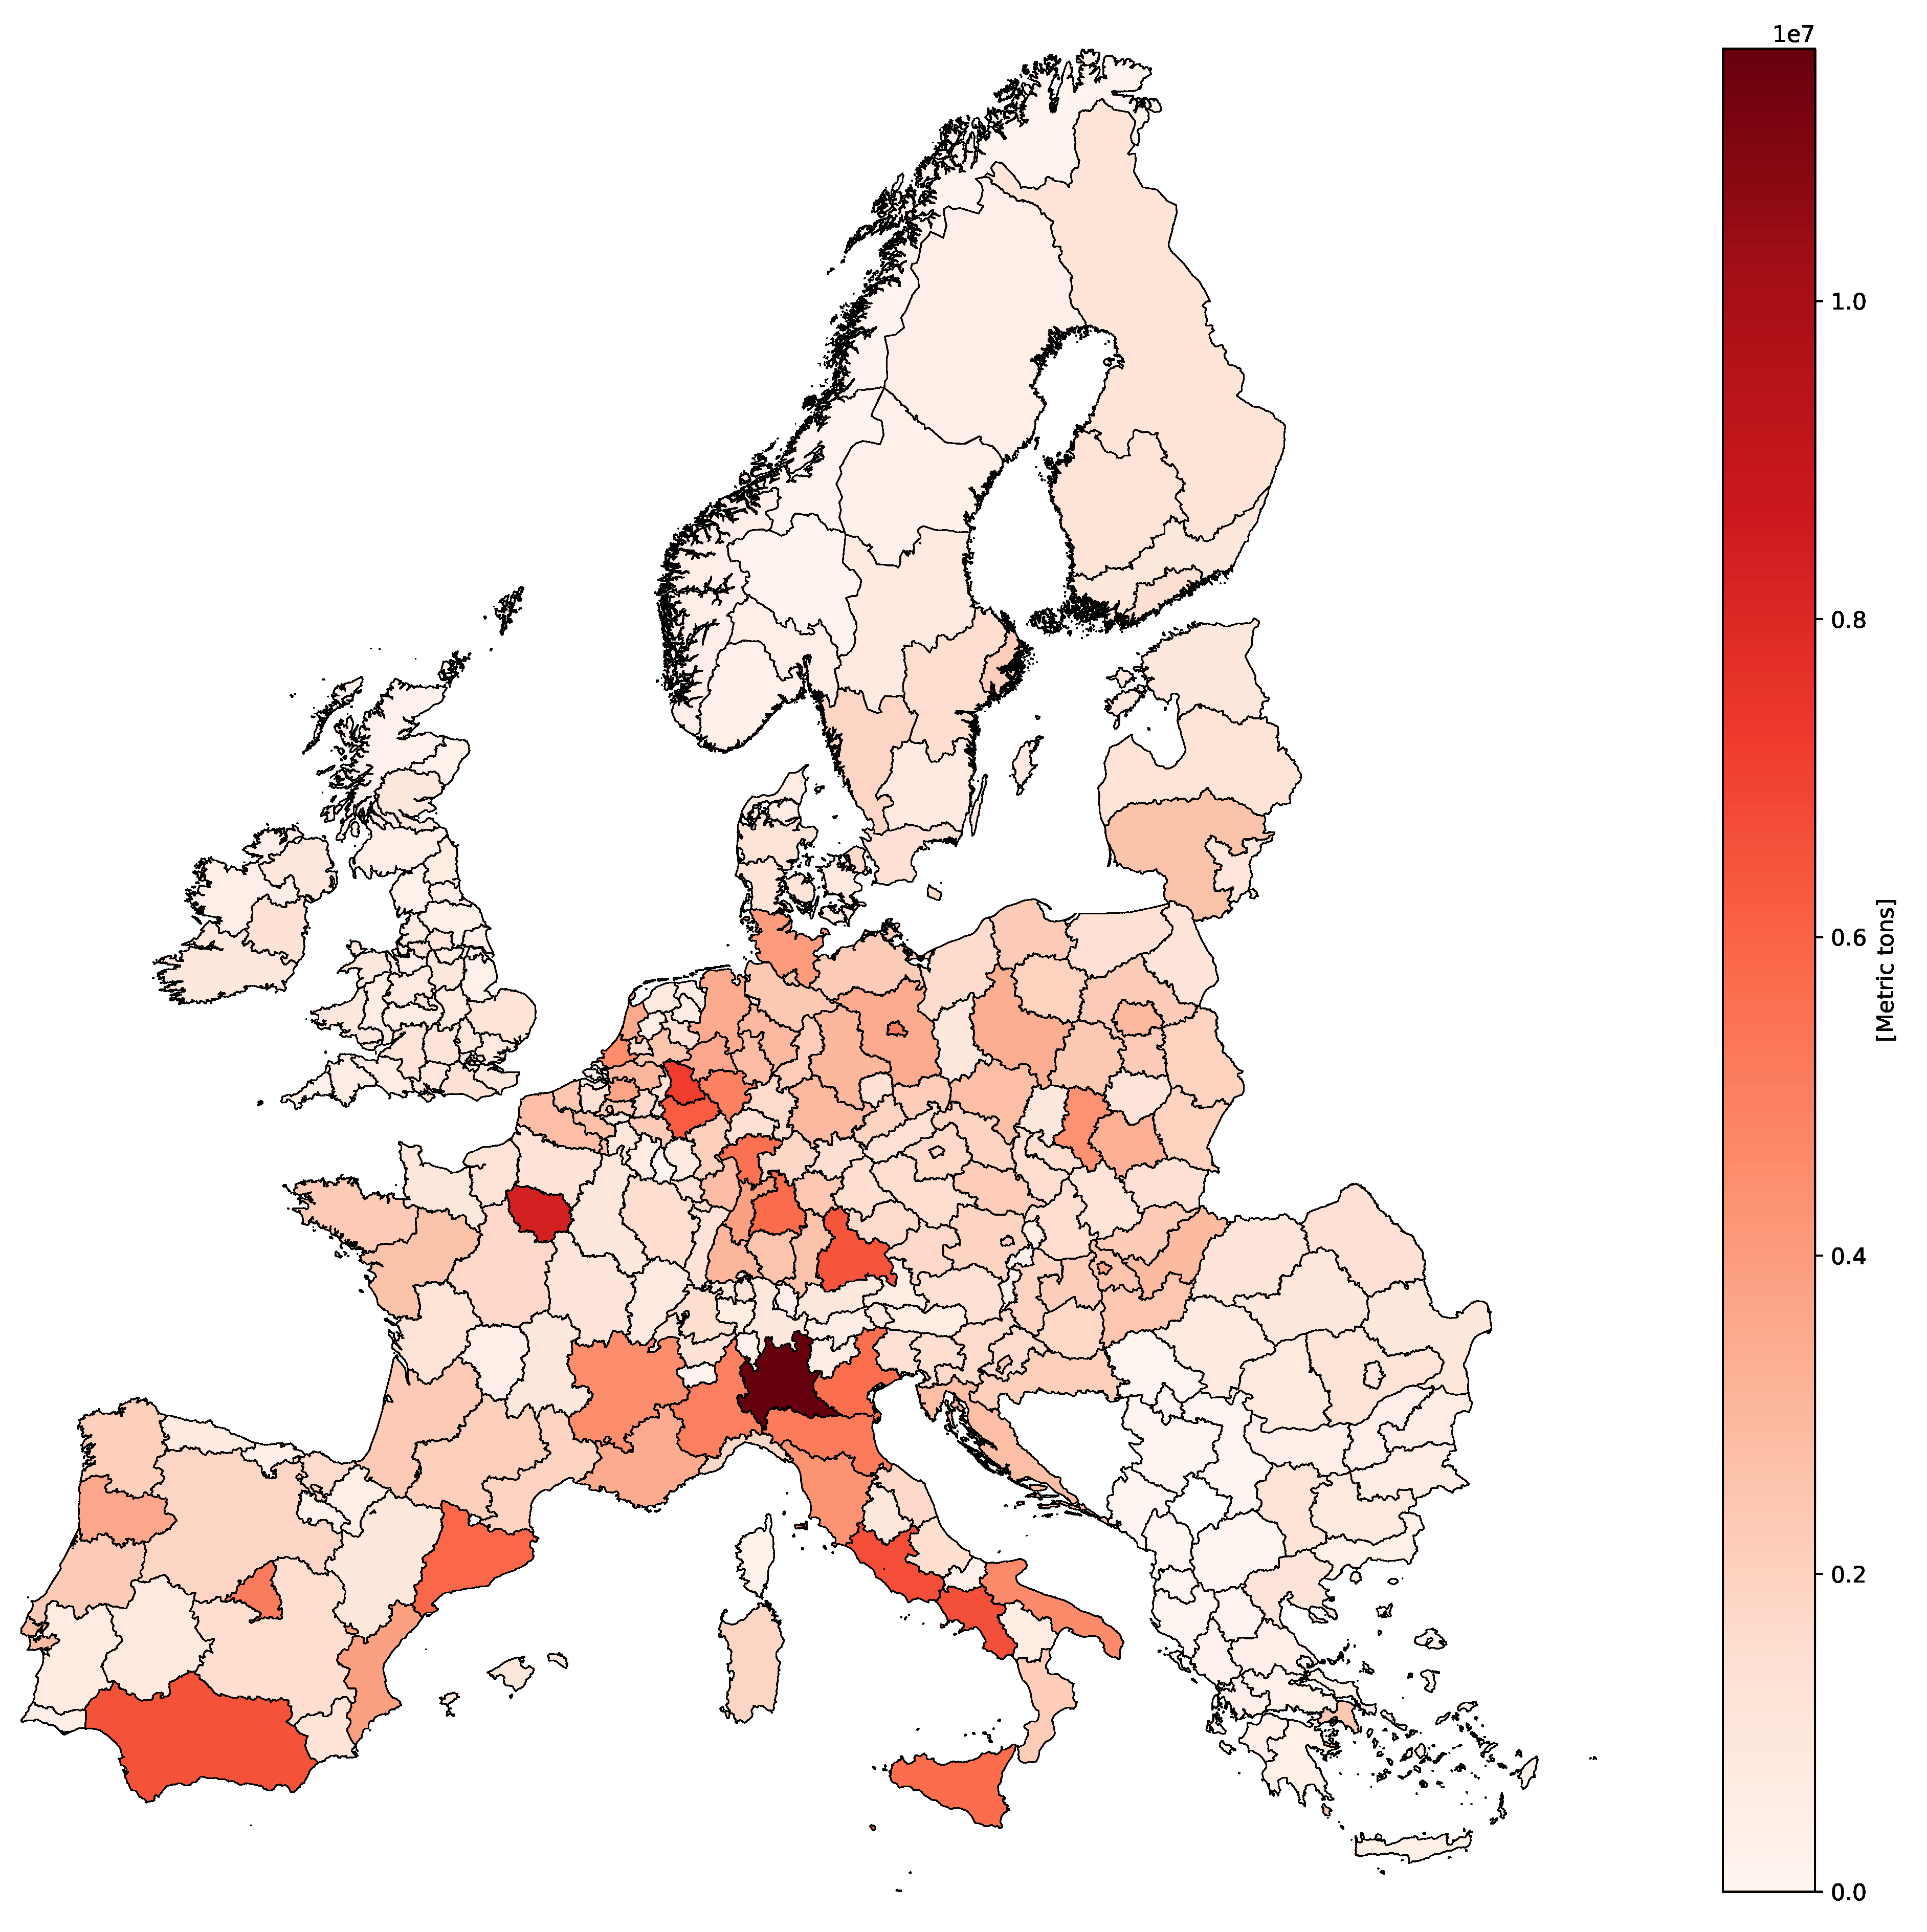
3.2.2. Recycled Plastic Demand

The plastic demand per region is not available in official statistics. However, the total plastic demand of each European country for 2019 is available [1]. The total plastic demand of each country is assigned to its NUTS 2 regions based on their number of residents.
The plastic demand data are not available for every single European country. For six countries, the data are not available. Therefore, the per capita demand from culturally and regionally comparable countries was adopted (Table 3).
An overview of the regionalized plastic demand is provided in Figure 2. Comparing Figure 1 and Figure 2, the plastic demand is similar to the waste generation in the respective regions since both datasets are based on the number of residents within each NUTS 2 region.

3.2.3. Recycling and Transportation Costs

Costs associated with plastic waste recycling are separated into costs for opening and initially equipping an MRF, costs for recycling the material and operating the MRF (per Mg), and transportation costs (per Mg and km). Two capacity classes of MRFs are differentiated between in this model. The decentral MRF has a capacity of 50,000 Mg input per year, while a central MRF can process 200,000 Mg input per year. The opening costs for the capacity classes are based on an MRF configuration introduced by Cimpan et al. [38]. They are adjusted to reflect inflation (base year 2019), taking the size degression with a coefficient of 0.8 into account. This results in fixed opening costs of 13,523,962 EUR for the decentral and 41,203,354 EUR for the central MRF.
The recycling and operating costs are based on the advanced mechanical recycling process introduced by Faraca et al. [10]. They describe the mechanical recycling of the plastic waste in an MRF similar to Cimpan et al. [38]. The gross costs for recycling 1 Mg of post-consumer plastic waste include recycling the material and operating the MRF (Faraca et al. [10]). Based on a size degression with a coefficient of 0.68 (derived from Cimpan et al. [38] and displayed in OPEX and CAPEX) and adjusted to 2019, the recycling costs in a decentral MRF are 415 EUR/FU, and in a central MRF, they are 267 EUR/FU. According to [38], 65% of the recycling costs are associated with labor costs. Therefore, we split the recycling costs provided by Faraca et al. [10] into a part associated with labor and a fixed part. Labor costs are regionalized by data for the labor cost levels in Europe [39].
Transportation costs are based on an Ecoinvent 3.8 dataset [40] and are adjusted for inflation (base year 2019). Therefore, the transportation of 1 Mg for 1 km results in average transportation costs of 0.174 EUR. All costs are summarized in Table 4.

3.2.4. Environmental Burdens

Environmental burdens are associated with the opening of MRFs, the recycling process itself, and waste and recycled material transportation. The environmental burdens associated with the opening of an MRF are based on an Ecoinvent 3.8 dataset [41] and the Environmental Footprint (EF) method of the European Commission [42]. Impacts of opening MRFs are scaled with a size degression coefficient of 0.8 for both capacity classes. Furthermore, Faraca et al. [10] provide environmental burdens for the recycling of 1 Mg plastic waste that is used here. Consistent with the recycling and operating costs, the environmental impacts of recycling and operating are scaled with the size degression factor of 0.68. All values are gross values, and credits for substituting primary plastic are not considered. The Ecoinvent 3.8 transportation data are considered for environmental burdens of the transport [40]. All burdens for the considered categories GWP, TA, ET, and HTc are summarized in Table 4.

3.2.5. Distances

Each European region is represented by its point with the highest population density. For modeling simplicity, it is assumed that all waste and demand for plastic pellets accumulate at this point. Additionally, if an MRF is opened in a region, it is also located at this point. We choose the point of the highest population density since it is likely that waste accumulation, plastic demand, and recycling infrastructure are associated with this region. Transport distances between these points are calculated using the Euclidean norm. However, the assumption of direct transport is not applicable when considering overland routes. Therefore, a tortuosity factor of 2 is introduced to embrace real road conditions [43,44].

3.3. Implementation

The model was implemented in Python. The Python API of CPLEX was used for the solution of the described model. Python 3.8.5 in the Anaconda distribution is installed on the machine used (Intel® Core™ i5-8265U at 1.60 GHz; 8.0 GB RAM). The integration of the CPLEX solver into Python is accomplished via the docplex library. When solving the formulated programs, a termination criterion with a selected time limit of 600 s is set for each optimization run to achieve comparability.

4. Results

The results of the case study are presented in this section. First, the optimal objective values for single objective optimization are presented. They are the basis for determining relative deviations between multi-criteria optimization solutions and individual optimality for each objective. Furthermore, they are needed to normalize the d i s t variable in the CGP approach. Second, the results of the lexicographic optimization are provided. We calculated two approaches: one without deviation from the optimal solution and one where a small deviation of ϵ = 0.01 is allowed. Third, the results of the introduced CGP approach are presented. A comparison and discussion of the results follow in Section 5.

4.1. Single Objective Optimization

Optimal solution values of the presented cost-minimizing optimization problem for all indicators, including cost, GWP, TA, ET, and HTc, as well as the relative shares of the recycling effort, the opening of the MRFs, and transport are presented in Table 5. GWP and HTC optimization are dominated by the recycling effort, with shares of 77% and over 99% in the optimal single objective solutions. Regarding costs, TA, and ET, there is a balance between the impact of the recycling process and opening MRFs. For all indicators, transportation of the waste and plastic pallets has a relatively small impact, with a maximum share of 8% within the TA indicator.

4.2. Lexicographic Optimization

The lexicographic optimization approach in this study considers the objective function in the following sequence: costs, GWP, TA, ET, and HTc. The lexicographic approach finds a solution that reaches the optimal value for total costs as the costs are the prioritized objective (see Table 6). Minimizing the GWP within the remaining solution space results in a deviation of 33% from the optimal solution obtained in the single objective optimization. As expected, the deviation further increases for the following two objectives to 64% (TA) and 257% (ET). For the HTc impact, there is only a deviation of 11% from its optimal value from the single objective optimization, as there is no strong conflict with the cost objective.
Figure 3 provides an overview of the opening of MRFs and material transportation throughout Europe within the lexicographic approach. Here, central MRFs with a capacity of up to 200,000 Mg input per year are placed throughout Southern Europe. In Western Europe, there are also decentral MRFs with a capacity of up to 50,000 Mg input per year. Specifically, in The Netherlands, there are multiple MRFs placed. In Northern and Eastern Europe, fewer MRFs are placed, and plastic waste is transported long distances. When comparing the results with the model’s input data, economies of scale lead to a cost advantage of central MRFs over smaller decentral MRFs.
A slight deviation ( ϵ = 0.01 = 1%) from the lexicographic objective function values is introduced to soften the lexicographic constraint and enable more flexibility in the solution approach. The results for this approach are presented in Table 7 and show a reduction in the deviation from the single objective optimal value of the GWP, TA, and ET compared to the strict lexicographic approach above. The cost optimization uses ϵ = 0.01 , leading to a reduction in the deviation for GWP, TA, ET, and HTc by 7, 13, 124, and 3 percentage points, respectively. Relaxing the optimality for the single objectives can lead to a more balanced result.
Figure 4 displays the recycling network for the lexicographic solution with ϵ = 0.01 . Here, and compared to the strict lexicographic solution, fewer decentral MRFs with smaller capacities are opened while the number of central MRFs only increases by four. They are placed in Western Europe, replacing decentral MRFs in The Netherlands. The layout also decreases the transport distance.
A sensitivity analysis (Figure 5) is performed to identify the effects of parameter variations on the objective values of the different indicators. In this case, all cost and environmental impact parameters of the recycling process, opening facilities, and transportation are varied separately within their corresponding parameter groups (recycling, opening, and transport).
The analysis reveals the following dependencies between total cost and the individual parameter groups: a 10% reduction of all recycling costs results in a 5% decrease in total costs, a 10% reduction of all opening costs causes a 4% decrease in total costs, while a 10% reduction of transportation costs has no influence on the total costs. These results and their linear relationship show that recycling costs significantly impact the cost target.
In contrast, the results of the environmental impact categories do not demonstrate a linear correlation as the objectives are developed based on the previous cost optimization. The sequential procedure leads to contingent shifts in the solution space for the environmental indicators that can allow for more flexibility and aid in aligning the results with each optimum. Despite these non-linear dependencies, certain trends regarding the impacts of parameter variations on GWP, TA, ET, and HTc can be identified.
Concerning GWP, the recycling process is found to have the most significant impact, causing a 7% decrease in total GWP when burdens are reduced by 10%. In contrast, varying the GWP impact for facility openings does not influence the total GWP at all and reducing the value associated with transportation by 10% causes only a 3% decrease in total GWP.
Transportation does, however, considerably influence the TA and ET impact categories. A 10% decrease in the parameters is found to cause a 4% (TA) and 5% (ET) reduction of total impact, while a 10% increase results in a 6% (TA) and 8% (ET) increase. In contrast, the final environmental indicator, HTc, is shown to be mostly influenced by the recycling process, with transportation having no impact.
The analysis results indicate competing objectives where cost and environmental impacts of GWP, TA, and ET are concerned. The softened lexicographic approach is, however, inherently incapable of calculating a more balanced solution, which considers both environmental and economic indicators. For this reason, an alternative method, namely the CGP approach, is implemented and presented in the next chapter.

4.3. Goal Programming

Solving the introduced optimization problem with the CGP approach leads to objective values presented in Table 8 and a recycling network displayed in Figure 5. Here, many decentral MRFs are opened to avoid heavy transport activity. Transportation is limited to short distances between neighboring regions. Central MRFs with higher capacity are placed in regions with very high waste volumes when a decentral MRF’s capacity is insufficient for handling all the plastic packaging waste in that region.
Table 8 and Figure 6 show different results for both lexicographic approaches. Less central MRFs are placed throughout Europe. Instead, multiple decentral MRFs reduce the transport activities. The difference in results can also be seen in deviations of the objectives from their optimal single objective value. Within the CGP approach, the costs deviate from their optimal value by 23%, and the HTc impact deviates by 23% from its optimal value. However, compared to the lexicographic approaches, the impacts of GWP (13% vs. 26%), TA (5% vs. 51%), and ET (23% vs. 133%) deviate less from their optimal values. Overall, the CGP approach reduces the maximum deviation from 133% in the adapted lexicographic approach to 23%. The CGP approach reaches a balance between the objectives, satisfying them with the objective value d i s t = 0.23 .
A sensitivity analysis is performed to vary the recycling, opening, and transport group parameters (Figure 7), illustrating their effects on the total cost and environmental impacts of the recycling network. In contrast to the previously applied lexicographic approach, utilizing the CGP method allows for linear relationships between all parameters and indicators.
The results indicate that the total costs of the recycling network are mainly influenced by the recycling costs themselves. A 10% reduction in recycling costs leads to a 6% overall decrease, while the same reduction in opening or transportation costs causes only a 3% and 1% in total cost decrease, respectively.
These numbers remain consistent for all indicators as the parameters are sorted into their respective groups, and both cost and environmental impacts are varied simultaneously within said groups. It can, therefore, be concluded that the recycling process has the most significant impact overall. In addition, the opening of a facility plays a more consequential role in the examined indicators than the transport of materials.
Overall, the results from both the CGP approach and lexicographic optimization show that a trade-off occurs between the cost and environmental indicators and all individual environmental indicators in the design of plastic recycling networks within a European circular economy.

5. Discussion

The discussion is separated into the case study discussion (Section 5.1), including the results, assumptions made, and the set time limit of 600 s for each optimization run, and into the discussion of the selected MODM approaches (Section 5.2).

5.1. Case Study

The case study results are calculated with a time limit of 600 s. The limitation of the computation time is introduced to compare both MODM approaches. The results of the one-dimensional optimization are only slightly affected since optimal solutions with MIP gaps of <0.28% were found in all optimization runs. The time limit of 600 s was used in the MODM approaches. MIP gaps of up to 5% are reached in the single optimization runs for the different subordinate objectives in the strict lexicographic formulation. By allowing a slight deviation from the optimal values ( ϵ = 0.01 ), the MIP gaps are reduced to a maximum of 2%. In the CGP approach, a MIP gap of 1% is achieved.
The lexicographic approach and the implemented goal programming lead to different network layouts. The lexicographic approach generates a network with more central MRFs opened. Here, the cost objective dominates the solution process. There are long transport distances, and fewer MRFs are opened, especially in less populated regions (Scandinavia, Bulgaria, Romania). The goal programming approach generates a network with fewer central MRFs and multiple decentral MRFs, reducing transport distances. An MRF is opened in nearly every region, and transport activities are limited to neighboring regions. For the environmental objectives GWP, TA, and ET, the focus is on minimizing transport, which conflicts with the cost objective. Due to this conflict of objectives, the different MODM approaches result in significantly different recycling network designs.
The assumptions of the case study and their impact on the results need to be critically discussed. The current model is limited to one stage, and only one type of facility is considered where the plastic waste is processed. The MRFs described by Faraca et al. [10] obtain the input material from recycling centers where the post-consumer waste is already processed, and the plastic fraction is forwarded. The sorting steps and efforts upstream of the MRF are not considered in the current model. Other waste handling options such as landfilling or energy recovery are not considered to reduce the complexity. Further, existing waste handling facilities are not considered and included in the design of the recycling network. It is assumed that the same type of MRF is placed throughout Europe. The incineration of sorting residues and recycling of metals is included in the recycling burdens [10], but it is assumed that all processes are part of the MRF, and no transport to other facilities is needed. The demand for the by-products (metals and energy) is not included in the location decision. The different plastic material fractions separated in the MRFs are considered as one material stream forwarded to the plastic converters since the plastic demand per European country is not available by polymer. The MRFs are limited to two capacity classes. Other capacities are neglected, and the optimization is limited to costs and the introduced environmental burdens. Transportation is limited to land, specifically road use by means of heavy trucks or lorries. Other modes such as water transport are neglected. Although they would be eligible within the model, both sensitivity analyses show the low influence of transport on the overall objectives, so modeling was refrained from.
Despite the assumptions made and the model’s limitations, it can be concluded from the case study that the economic objective and the various environmental objectives do compete with each other. However, The MODM approaches show that a good balance between economic interests and environmental objectives can be achieved.
Future research could adopt the model for case studies in other regions, including additional constraints, products, or waste streams (e.g., post-production waste). The optimization could be expanded to other environmental burdens, such as other impact indicators from life cycle assessment or material or carbon recycling quotas. Additionally, a three- or general multi-stage model with more facility types would allow further differentiation of recycling/production steps. Moreover, the model definition could include the existing recycling or waste handling infrastructure. Furthermore, transportation efforts and distance calculation could be calculated more precisely. Further, regions are represented by their point of highest population density. Using data on the European road network and including locations on the network would allow a more precise consideration of transportation distances.
The model also does not consider importing and exporting plastic waste and plastic pellets to regions outside Europe. This does not reflect the current reality. However, the modeled recycling network can be considered a model for a European circular economy for plastics independent of plastic waste exports. The model’s constraints reflect this.

5.2. Multi-Objective Decision-Making Approaches

The lexicographic approach considers the objectives in a predefined order determined by the decision-maker. In this case study, the objectives are considered in the following order: costs, GWP, TA, ET, and HTc. Other sequences of the objectives are not considered. However, both lexicographic formulations lead to the dominance of the cost objective. Therefore, it can be concluded that a different objective order results in a solution close to the solution of the single optimization of the first objective.
The modification of the lexicographic approach allowing a slight deviation from the optimal objective function values, changes the standard approach found in the literature. The slight deviation of ( ϵ = 0.01 ) is introduced to soften the strict lexicographic constraint and enable more flexibility in the solution approach. After adaption, the lexicographic approach achieves a more balanced solution than its strict formulation. However, the cost objective still dominates the solution, and the adapted version is not as balanced as the solution generated in the CGP approach. There is no variation of ϵ since the comparison between the lexicographic approach, and CGP is the focus of this study.
The lexicographic approach leads to higher deviations from the single objective solutions, while the CGP approach leads to a balance between the objectives. In general, the solutions show the expected characteristics mentioned in the literature. Therefore, CGP is the more suitable MODM approach for modeling a recycling network if economic and environmental trade-offs are to be considered in the design of the network and if economic and environmental indicators are to be considered equally. However, CGP is a satisfying approach, and no optimality of the individual goals is guaranteed.
The comparison of MODM approaches is limited to the lexicographic approach and goal programming. Other approaches, such as the scalarization approach, are not considered. In contrast to the CGP, the scalarization approach allows the calculation of optimality [19]. However, the scalarization approach needs weighting factors for every objective in the objective function. These weighting factors usually reflect the subjective opinion of decision-makers. Therefore, this study did not include the scalarization approach.

6. Conclusions

This study focuses on the recycling network planning for plastic packaging waste in Europe, including opening MRFs, transporting waste to the MRFs, and transporting plastic pellets from the MRFs to plastic converters. An MODM problem arises as costs and environmental burdens of GHG, TA, ET, and HTc are included in the network planning. We use a lexicographic approach, an adapted lexicographic approach with an ϵ = 0.01 allowing slight deviations from the optimal value, and a CGP approach to solve the problem. Comparing the results, the strict formulation of the lexicographical approach optimizes the main objective while subordinate goals are optimized in the remaining solution space. This leads to high deviations from the single objective optimizations’ optimal values. Allowing a slight deviation from optimality leads to a more balanced solution; however, there are still high deviations from the single objective optimizations. The CGP approach leads to the most balanced solution since economic and environmental indicators are considered equally in the design process. Therefore, the CGP approach is most suitable for designing a recycling network if economic and environmental trade-offs are to be considered in the design of the network.
The high objective function value of the CGP in the formulated case study indicates that the economic and environmental objectives compete within the chosen model design and the made assumptions. For the cost objective, a relatively small number of central MRFs with high capacity are preferable to exploit economies of scale. Combining central and decentral MRFs to limit transport activities is favorable for the environmental indicators GWP, TA, and ET. This results in two different recycling networks following either the lexicographic or the CGP approach.
The models presented can be extended to gain a more detailed overview of the economic and environmental impacts of a European recycling network designed from scratch. The CGP approach should be pursued to ensure a balance between the different impact indicators, especially since they appear contradictory.

Author Contributions

Conceptualization, C.S. and J.S.; methodology, J.S., C.S. and M.R.; software, C.S., M.R. and J.S.; validation, C.S. and J.S.; formal analysis, C.S., J.S. and M.R.; investigation, C.S. and M.R.; resources, R.V. and F.S.; data curation, M.R., C.S. and J.S.; writing—original draft preparation, C.S., J.S., M.R., R.V. and F.S.; writing—review and editing, C.S., J.S., M.R., R.V. and F.S.; visualization, C.S., J.S. and M.R.; supervision, R.V. and F.S.; project administration, R.V. and F.S.; funding acquisition, R.V. and F.S. All authors have read and agreed to the published version of the manuscript.

Funding

This study was carried out within the research projects “Leuchtturm Kreislaufwirtschaft—Schwerpunkt Chemisches Recycling” and “Kreislaufwirtschaft für Kunststoffe” funded by the “THINKTANK Industrielle Ressourcenstrategien” (Industrial Resource Strategies) which is financed by the Ministry of the Environment, Climate Protection, and the Energy Sector of the state of Baden-Württemberg in Germany and industry partners.

Institutional Review Board Statement

Not applicable.

Informed Consent Statement

Not applicable.

Data Availability Statement

Not applicable.

Acknowledgments

We acknowledge support by the KIT-Publication Fund of the Karlsruhe Institute of Technology.

Conflicts of Interest

The authors declare no conflict of interest.

References

  1. PlasticsEurope. Plastics—The Facts 2020: An Analysis of European Plastics Production, Demand and Waste Data. 2020. Available online: https://plasticseurope.org/knowledge-hub/plastics-the-facts-2020/ (accessed on 20 April 2022).
  2. IEA. The Future of Petrochemicals: Towards More Sustainable Plastics and Fertilisers. 2018. Available online: https://iea.blob.core.windows.net/assets/bee4ef3a-8876-4566-98cf-7a130c013805/The_Future_of_Petrochemicals.pdf (accessed on 25 April 2022).
  3. Cabernard, L.; Pfister, S.; Oberschelp, C.; Hellweg, S. Growing environmental footprint of plastics driven by coal combustion. Nat. Sustain. 2021, 5, 139–148. [Google Scholar] [CrossRef]
  4. Ellen MacArthur Foundation. The New Plastics Economy: Rethinking the Future of Plastics. 2016. Available online: https://www.ellenmacarthurfoundation.org/assets/downloads/EllenMacArthurFoundation_TheNewPlasticsEconomy_Pages.pdf (accessed on 15 May 2019).
  5. European Commission. A European Strategy for Plastics in a Circular Economy. 2018. Available online: https://ec.europa.eu/environment/circular-economy/pdf/plastics-strategy-brochure.pdf (accessed on 13 April 2022).
  6. De Mello Soares, C.T.; Ek, M.; Östmark, E.; Gällstedt, M.; Karlsson, S. Recycling of multi-material multilayer plastic packaging: Current trends and future scenarios. Resour. Conserv. Recycl. 2022, 176, 105905. [Google Scholar] [CrossRef]
  7. Alassali, A.; Picuno, C.; Chong, Z.K.; Guo, J.; Maletz, R.; Kuchta, K. Towards higher quality of recycled plastics: Limitations from the material’s perspective. Sustainability 2021, 13, 13266. [Google Scholar] [CrossRef]
  8. Schwarz, A.E.; Ligthart, T.N.; Godoi Bizarro, D.; de Wild, P.; Vreugdenhil, B.; van Harmelen, T. Plastic recycling in a circular economy; determining environmental performance through an LCA matrix model approach. Waste Manag. 2021, 121, 331–342. [Google Scholar] [CrossRef]
  9. Neo, E.R.K.; Soo, G.C.Y.; Tan, D.Z.L.; Cady, K.; Tong, K.T.; Low, J.S.C. Life cycle assessment of plastic waste end-of-life for India and Indonesia. Resour. Conserv. Recycl. 2021, 174, 105774. [Google Scholar] [CrossRef]
  10. Faraca, G.; Martinez-Sanchez, V.; Astrup, T.F. Environmental life cycle cost assessment: Recycling of hard plastic waste collected at Danish recycling centres. Resour. Conserv. Recycl. 2019, 143, 299–309. [Google Scholar] [CrossRef]
  11. Civancik-Uslu, D.; Nhu, T.T.; van Gorp, B.; Kresovic, U.; Larrain, M.; Billen, P.; Ragaert, K.; de Meester, S.; Dewulf, J.; Huysveld, S. Moving from linear to circular household plastic packaging in Belgium: Prospective life cycle assessment of mechanical and thermochemical recycling. Resour. Conserv. Recycl. 2021, 171, 105633. [Google Scholar] [CrossRef]
  12. Volk, R.; Stallkamp, C.; Steins, J.J.; Yogish, S.P.; Müller, R.C.; Stapf, D.; Schultmann, F. Techno–economic assessment and comparison of different plastic recycling pathways: A German case study. J. Ind. Ecol. 2021, 25, 1318–1337. [Google Scholar] [CrossRef]
  13. Jeswani, H.; Krüger, C.; Russ, M.; Horlacher, M.; Antony, F.; Hann, S.; Azapagic, A. Life cycle environmental impacts of chemical recycling via pyrolysis of mixed plastic waste in comparison with mechanical recycling and energy recovery. Sci. Total Environ. 2021, 769, 144483. [Google Scholar] [CrossRef]
  14. Tonini, D.; Schrijvers, D.; Nessi, S.; Garcia-Gutierrez, P.; Giuntoli, J. Carbon footprint of plastic from biomass and recycled feedstock: Methodological insights. Int. J. Life Cycle Assess. 2021, 26, 221–237. [Google Scholar] [CrossRef]
  15. Keller, F.; Voss, R.L.; Lee, R.P.; Meyer, B. Life cycle assessment of global warming potential of feedstock recycling technologies: Case study of waste gasification and pyrolysis in an integrated inventory model for waste treatment and chemical production in Germany. Resour. Conserv. Recycl. 2022, 179, 106106. [Google Scholar] [CrossRef]
  16. Voss, R.; Lee, R.P.; Fröhling, M. Chemical Recycling of Plastic Waste: Comparative Evaluation of Environmental and Economic Performances of Gasification- and Incineration-based Treatment for Lightweight Packaging Waste. Circ. Econ. Sustain. 2022. [Google Scholar] [CrossRef]
  17. Egri, P.; Dávid, B.; Kis, T.; Krész, M. Robust facility location in reverse logistics. Ann. Oper. Res. 2021. [Google Scholar] [CrossRef]
  18. Walther, G. Nachhaltige Wertschöpfungsnetzwerke: Überbetriebliche Planung und Steuerung von Stoffströmen Entlang des Produktlebenszyklus; Springer: Berlin/Heidelberg, Germany, 2010. [Google Scholar]
  19. Nickel, S.; Stein, O.; Waldmann, K.H. Operations Research, 2nd ed.; Springer-Lehrbuch; Springer Gabler: Berlin/Heidelberg, Germany, 2014. [Google Scholar]
  20. Mohammadi, M.; Jämsä-Jounela, S.L.; Harjunkoski, I. Optimal planning of municipal solid waste management systems in an integrated supply chain network. Comput. Chem. Eng. 2019, 123, 155–169. [Google Scholar] [CrossRef]
  21. Couto, M.C.L.; Lange, L.C.; Rosa, R.d.A.; Couto, P.R.L. Planning the location of facilities to implement a reverse logistic system of post-consumer packaging using a location mathematical model. Waste Manag. Res. 2017, 35, 1254–1265. [Google Scholar] [CrossRef]
  22. Achillas, C.; Vlachokostas, C.; Aidonis, D.; Moussiopoulos, T.; Iakovou, E.; Banias, G. Optimising reverse logistics network to support policy-making in the case of Electrical and Electronic Equipment. Waste Manag. 2010, 30, 2592–2600. [Google Scholar] [CrossRef]
  23. Pluskal, J.; Šomplák, R.; Nevrlý, V.; Smejkalová, V.; Pavlas, M. Strategic decisions leading to sustainable waste management: Separation, sorting and recycling possibilities. J. Clean. Prod. 2021, 278, 123359. [Google Scholar] [CrossRef]
  24. Santibañez-Aguilar, J.E.; Flores-Tlacuahuac, A.; Rivera-Toledo, M.; Ponce-Ortega, J.M. Dynamic optimization for the planning of a waste management system involving multiple cities. J. Clean. Prod. 2017, 165, 190–203. [Google Scholar] [CrossRef]
  25. Dekker, R.; Fleischmann, M.; Inderfurth, K.; van Wassenhove, L.N. (Eds.) Reverse Logistics: Quantitative Models for Closed-Loop Supply Chains; Springer: Berlin/Heidelberg, Germany; New York, NY, USA, 2004. [Google Scholar]
  26. Oberschmidt, J. Multikriterielle Bewertung von Technologien zur Bereitstellung von Strom und Wärme. Ph.D. Thesis, Universität Göttingen, Göttingen, Germany, 2010. [Google Scholar]
  27. Geldermann, J.; Lerche, N. Leitfaden zur Anwendung von Methoden der Multikriteriellen Entscheidungsunterstützung: PROMETHEE. 2014. Available online: https://www.uni-goettingen.de/de/document/download/285813337d59201d34806cfc48dae518-en.pdf/MCDA-Leitfaden-PROMETHEE.pdf (accessed on 27 April 2022).
  28. Farahani, R.Z.; Steadieseifi, M.; Asgari, N. Multiple criteria facility location problems: A survey. Appl. Math. Model. 2010, 34, 1689–1709. [Google Scholar] [CrossRef]
  29. Ulungu, E.L.; Teghem, J. Multi-objective combinatorial optimization problems: A survey. J.-Multi-Criteria Decis. Anal. 1994, 3, 83–104. [Google Scholar] [CrossRef]
  30. Marler, R.T.; Arora, J.S. Survey of multi-objective optimization methods for engineering. Struct. Multidiscip. Optim. 2004, 26, 369–395. [Google Scholar] [CrossRef]
  31. Colapinto, C.; Jayaraman, R.; Marsiglio, S. Multi-criteria decision analysis with goal programming in engineering, management and social sciences: A state-of-the art review. Ann. Oper. Res. 2017, 251, 7–40. [Google Scholar] [CrossRef]
  32. Jones, D.; Tamiz, M. Practical Goal Programming; International Series in Operations Research & Management Science; Springer US: Boston, MA, USA, 2010; Volume 141. [Google Scholar] [CrossRef]
  33. Flavell, R.B. A new goal programming formulation. Omega 1976, 4, 731–732. [Google Scholar] [CrossRef]
  34. Eurostat. Packaging Waste Statistics. 2022. Available online: https://ec.europa.eu/eurostat/statistics-explained/index.php?title=Packaging_waste_statistics (accessed on 6 April 2022).
  35. Schiessl, A.; Müller, R.; Volk, R.; Zimmer, K.; Breun, P.; Schultmann, F. Integrating site-specific environmental impact assessment in supplier selection: Exemplary application to steel procurement. J. Bus. Econ. 2020, 90, 1409–1457. [Google Scholar] [CrossRef]
  36. Müller, R.C.; Schiessl, A.; Volk, R.; Schultmann, F. Assessment of site-specific greenhouse gas emissions of chemical producers: Case studies of propylene and toluene diisocyanate. J. Clean. Prod. 2021, 317, 128086. [Google Scholar] [CrossRef]
  37. Eurostat. Population and NUTS 2 Region. 2022. Available online: https://appsso.eurostat.ec.europa.eu/nui/show.do?dataset=demo_r_d2jan&lang=en (accessed on 14 April 2022).
  38. Cimpan, C.; Maul, A.; Wenzel, H.; Pretz, T. Techno-economic assessment of central sorting at material recovery facilities—The case of lightweight packaging waste. J. Clean. Prod. 2016, 112, 4387–4397. [Google Scholar] [CrossRef]
  39. Eurostat. Labour Cost Levels. 2022. Available online: https://ec.europa.eu/eurostat/databrowser/view/LC_LCI_LEV__custom_3096795/default/table?lang=en (accessed on 20 April 2022).
  40. Doka, G. Municipal Waste Collection Service by 21 Metric Ton Lorry, RoW, Allocation Cut-Off. Retrieved from Ecoinvent Database Version 3.8. 2021. Available online: https://v38.ecoquery.ecoinvent.org/Details/LCIA/7370042e-e19a-4f51-a57b-94b3d90d60b8/290c1f85-4cc4-4fa1-b0c8-2cb7f4276dce (accessed on 30 March 2022).
  41. Kägi, T. Waste Preparation Facility Construction, RoW, Allocation Cut-Off. Retrieved from Ecoinvent Database Version 3.8. 2021. Available online: https://v38.ecoquery.ecoinvent.org/Details/LCIA/7e221508-848b-4a2e-845c-8c4debc80501/290c1f85-4cc4-4fa1-b0c8-2cb7f4276dce (accessed on 30 March 2022).
  42. European Commission. Environmental Footprint (EF). 2022. Available online: https://eplca.jrc.ec.europa.eu/LCDN/developerEF.xhtml (accessed on 21 April 2022).
  43. Delivand, M. Assessing the Feasibility of Process Chains for Energy Production from Rice Straw in Thailand. Ph.D. Thesis, Joint Graduate School of Energy and Environment, Krung Thep Maha Nakhon, Thailand, 2011. [Google Scholar]
  44. Diehlmann, F.; Zimmer, T.; Glöser-Chahoud, S.; Wiens, M.; Schultmann, F. Techno-economic assessment of utilization pathways for rice straw: A simulation-optimization approach. J. Clean. Prod. 2019, 230, 1329–1343. [Google Scholar] [CrossRef]
Figure 1. European regions and the associated total plastic packaging waste volume.
Sustainability 14 10913 g001
Figure 2. European regions and the associated plastic demand for plastic converters.
Sustainability 14 10913 g002
Figure 3. Results of the lexicographic optimization approach. Locations of decentral (blue triangles) and central MRFs (black circles) as well as transportation routes (black lines) are displayed. The size of the MRFs represents the allocated amount of plastic waste that is handled there.
Sustainability 14 10913 g003
Figure 4. Results of the softened lexicographic optimization approach. Locations of decentral (blue triangles) and central MRFs (black circles) as well as transportation routes (black lines) are displayed. The size of the MRFs represents the allocated amount of plastic waste that is handled there.
Sustainability 14 10913 g004
Figure 5. Sensitivity analysis for the softened lexicographic optimization approach.
Sustainability 14 10913 g005
Figure 6. Results of the CGP approach. Locations of decentral (blue triangles) and central MRFs (black circles) as well as transportation routes are displayed. The size of the MRFs represents the allocated amount of plastic waste that is handled there.
Sustainability 14 10913 g006
Figure 7. Sensitivity analysis for the goal programming approach.
Sustainability 14 10913 g007
Table 1. Notation of sets, parameters, and variables used in the optimization models.
Sets
SSet of regions with recyclable plastic waste ( s S )
RSet of regions with potential locations for MRFs ( r R )
DSet of regions with demand for recycled plastic material ( d D )
ISet of input capacity classes of MRFs ( i I )
Parameters
c t r a n s p o r t Transportation costs for 1 Mg waste per material and kilometer
c i , r r e c y c l i n g Recycling costs for 1 Mg plastic waste in an MRF of capacity class i in region r
c i o p e n i n g Opening costs for an MRF of capacity class i
g w p t r a n s p o r t GWP impact of transportation of 1 Mg waste per material per kilometer
g w p i r e c y c l i n g GWP impact of recycling 1 Mg plastic waste in an MRF of capacity class i
g w p i o p e n i n g GWP impact of opening an MRF of capacity class i
t a t r a n s p o r t TA impact of transportation of 1 Mg waste per material per kilometer
t a i r e c y c l i n g TA impact of recycling 1 Mg plastic waste in an MRF of capacity class i
t a i o p e n i n g TA impact of opening an MRF of capacity class i
e t t r a n s p o r t ET impact of transportation of 1 Mg waste per material per kilometer
e t i r e c y c l i n g ET impact of recycling 1 Mg plastic waste in an MRF of capacity class i
e t i o p e n i n g ET impact of opening an MRF of capacity class i
h t c t r a n s p o r t HTc impact of transportation of 1 Mg waste per material per kilometer
h t c i r e c y c l i n g HTc impact of recycling 1 Mg plastic waste in an MRF of capacity class i
h t c i o p e n i n g HTc impact of opening an MRF of capacity class i
q s s u p p l y Recyclable waste generated in region s
q d d e m a n d Demand of recycled material in region d
K i Maximum capacity of an MRF of capacity class i
Variables
x s r , i Amount of transported plastic waste from s to r to MRF of capacity class i
x r d , i Amount of transported recycled plastic from r to d out of MRF of capacity class i
y r , i 0 , if no MRF of capacity class i is opened in region r 1 , if an MRF of capity class i is opened in region r
Variables—Extension CGP approach
d i s t Maximum deviation from each normalized single objective optimum
Table 2. Countries with missing plastic packaging waste data and chosen reference country for adoption of waste generation per capita.
Countries Missing DataReference CountryWaste per Capita (kg)
SwitzerlandAustria33.31
Northern IrelandUnited Kingdom35.52
MontenegroHungary35.01
MacedoniaHungary35.01
AlbaniaHungary35.01
SerbiaHungary35.01
Table 3. Countries with missing plastic demand data and chosen reference country for adoption of demand per capita.
Countries Missing DataReference CountryDemand per Capita (kg)
LichtensteinSwitzerland80.44
LuxembourgGermany137.80
MontenegroHungary201.13
MacedoniaHungary201.13
AlbaniaHungary201.13
SerbiaHungary201.13
Table 4. Costs and environmental burdens for opening MRFs, recycling, and transportation. Recycling costs are regionalized with the factor x; x: level of labor costs normalized to the level of Denmark.
Decentral MRFCentral MRF
OpeningRecycling
(per Mg)
OpeningRecycling
(per Mg)
Transportation (per Mg and km)
Costs [EUR]13,523,962146 + 269 × x 41,203,35493 + 174 × x 0.174
GWP [kg CO2-Eq]1,222,9894093,726,0712621.28
TA [mol H+-Eq]14,7620.5444,9740.350.01
ET [mol N-Eq]26,4941.3680,7200.870.04
HTc [CTUh]1.230.093.740.05 7.7 × 10 8
Table 5. Results of the single objective optimization.
ObjectiveOptimal ValueUnitRecycling EffortOpening MRFsTransportation
Costs6,069,319,346(EUR)52%44%4%
GWP4,191,261,971(kg CO2-Eq)77%18%5%
TA11,405,202(mol H+-Eq)50%44%8%
ET25,485,141(mol N-Eq)54%41%5%
HTc675,943(CTUh)>99%<1%<1%
Table 6. Results of the multi-objective lexicographic optimization without deviation allowed.
ObjectiveSingle Objective Optimal ValueLexicographic OptimizationUnitDeviation
Costs6,069,319,3466,069,319,346(EUR)0%
GWP4,191,261,9715,569,965,276(kg CO2-Eq)33%
TA11,405,20218,645,709(mol H+-Eq)64%
ET25,485,14165,367,610(mol N-Eq)257%
HTc675,943748,970(CTUh)11%
Table 7. Results of the multi-objective lexicographic optimization allowing a 1% deviation from the preceding optimal objective function values.
ObjectiveSingle Objective Optimal ValueLexicographic Optimization ( ϵ = 0.01 )UnitDeviation
Costs6,069,319,3466,130,012,540(EUR)1%
GWP4,191,261,9715,259,633,202(kg CO2-Eq)26%
TA11,405,20217,210,674(mol H+-Eq)51%
ET25,485,14159,317,974(mol N-Eq)133%
HTc675,943727,387(CTUh)8%
Table 8. Results of the multi-objective CGP optimization.
ObjectiveSingle Objective Optimal ValueGoal ProgrammingUnitDeviation
Costs6,069,319,3467,471,799,556(EUR)23%
GWP4,191,261,9714,720,630,372(kg CO2-Eq)13%
TA11,405,20211,995,494(mol H+-Eq)5%
ET25,485,14131,374,173(mol N-Eq)23%
HTc675,943832,138(CTUh)23%
Publisher’s Note: MDPI stays neutral with regard to jurisdictional claims in published maps and institutional affiliations.

