Article

Environmental Justice Assessment of Fine Particles, Ozone, and Mercury over the Pearl River Delta Region, China

1
Guangdong Provincial Key Laboratory of Atmospheric Environment and Pollution Control, College of Environment and Energy, South China University of Technology, Guangzhou Higher Education Mega Center, Guangzhou 510006, China
2
Department of Civil and Environmental Engineering, Lamar University, Beaumont, TX 77710, USA
3
Institute for the Environment, University of North Carolina at Chapel Hill, Chapel Hill, NC 27599, USA
4
State Key Joint Laboratory of Environmental Simulation and Pollution Control, School of Environment, Tsinghua University, Beijing 100084, China
5
Guangdong Environmental Monitoring Center, Guangzhou 510308, China
*
Author to whom correspondence should be addressed.
Sustainability 2022, 14(17), 10891; https://doi.org/10.3390/su141710891
Submission received: 5 May 2022 / Revised: 20 August 2022 / Accepted: 26 August 2022 / Published: 31 August 2022
(This article belongs to the Special Issue Air Pollution and Environmental Sustainability)

Abstract

:
Assessment of environmental justice (EJ, a concept related to the distributional fairness of environmental risks) is a crucial component in environmental risk management. However, the risks associated with air pollutants and toxins have rarely been evaluated jointly. Therefore, using an approach integrating modeling, data fusion, and health benefits analysis, we performed an EJ assessment on the mortalities caused by fine particle (PM2.5) and ozone (O3) concentrations and mercury (Hg) deposition over the Pearl River Delta (PRD) region. The concentration index (CI) was used to measure EJ in low-income distributions and age structures, and a larger value implied a greater EJ issue. The results revealed that the CIs of PM2.5, O3, and Hg were 0.35, 0.32, and 0.16, respectively, based on the percentage of the low-income population, and 0.39, 0.36, and 0.23, respectively, based on the elderly and children, indicating that environmental injustice was more prominent for PM2.5 and more reflected in the elderly and children. The center (e.g., Guangzhou) and some marginal areas (e.g., northeast of Jiangmen) in the PRD were overburdened areas with PM2.5, O3, and Hg pollution due to their intensive source emissions. Moreover, cumulative environmental risk (CER) corrected by population vulnerability exhibited significant differences among the cities; for example, cumulative environmental risk scores (CERSs) in Jiangmen, Huizhou, and Zhaoqing were 14.18 to 32.98 times higher than that in Shenzhen. Hence, the implementation of multipollutant control policies for local PM2.5, O3, and Hg in overburdened areas is recommended to further promote EJ in the PRD.

1. Introduction

Environmental justice (EJ) is the fair treatment and meaningful involvement of all groups in environmental activities [1]. EJ issues, usually exhibited as the unequal distribution of environmental risks and benefits, will result in obvious health disparities between different groups (e.g., low-income versus wealthy groups) [2,3,4]. With rapid economic development and industrial transfer, there is an increasing gap among different social groups, especially in developing countries such as China, making EJ problems gradually prominent [5,6]. To address EJ issues and achieve the balanced and sustainable development of society and the ecoenvironment [7,8], it is necessary to conduct an EJ assessment for environmental risks of major pollutants.
A series of related studies have been conducted since the 1980s in the United States [4,9], in which wide-ranging political, socioeconomic, and discriminatory forces, combined with spatial patterns of industrialization and development, were found to segregate people of color (including low-income groups) into communities with higher indices of urban poverty and material deprivation [10,11]. Furthermore, most of these communities are located near sources of pollutant emissions, such as placing waste sites, industrial areas, highways, etc. [12,13]. Hence, those minorities and low-income groups disproportionately endure a higher share of environmental exposure risks [12,14,15,16]; in addition, they are affected by unfavorable factors such as persistent poverty and a lack of health care, resulting in obvious health disparities between them and advantageous populations [17,18]. For example, infant mortality rates for nonHispanic blacks and indigenous residents are 2.35 and 1.97 times higher than that for nonHispanic whites, respectively [19], and life expectancies for nonHispanic white males and white females are 4.9 and 3.1 years higher than that for nonHispanic black males and black females, respectively [20]. EJ-related research initiated in China in the last 10 years [21] is currently in the exploratory stage. Existing studies have mainly focused on the unequal distribution of environmental resources [22,23], the differences in pollution burdens between urban and rural residents [21,24], and pollution transfer due to industry migration or trade [25,26,27]. Research considering both criteria—air pollutants and air toxins—is seldom reported in EJ-related publications.
The Pearl River Delta (PRD), one of the typical city clusters in China, has experienced deteriorating air quality during China’s 13th Five-Year Plan (2016~2020), especially in 2017 (Supplementary Materials, Table S1) when concentrations of PM2.5 and O3 exceeded the WHO’s guidelines by 220% and 51%, at 151 µg/m3 and 32 µg/m3, respectively [28]. Moreover, in terms of air toxins, the concentration of total gaseous mercury (TGM) was about twice the background Northern Hemisphere concentration of 1.5 ng/m3 [29,30,31]. High PM2.5 and O3 levels can endanger public health with respiratory disease, cardiovascular disease, and lung cancer [32,33,34], and intensive atmospheric mercury can also be deposited into soil and water bodies and then enter the human body along the food chain, attacking the heart and lowering the intelligence quotient of the fetus [35,36,37].
Accordingly, in this presented paper, the intercity differences in mortalities attributed to PM2.5 and O3 concentrations and Hg deposition fluxes in 2017 are explored, using the economically developed PRD region of China as an example. The assessment process and results are expected to assist policymakers in characterizing environmental hazards and social vulnerability for environmental risk management.

2. Materials and Methods

The process for EJ assessment of PM2.5- and O3-related mortalities and Hg deposition flux over the PRD is shown in Figure 1. First, the 2017 meteorological conditions were simulated using the Weather Research and Forecasting Model (WRF, http://www2.mmm.ucar.edu/wrf/ (accessed on 30 June 2021)) to drive the Community Multiscale Air Quality Model (CMAQ, http://www.epa.gov/cmaq (accessed on 30 June 2021)) simulations for PM2.5, O3, and Hg. Second, the simulation results of PM2.5 and O3 were fused with the monitoring data to improve simulation accuracy utilizing the data fusion (DF) tool [38], and the fused data subsequently flowed into the Environmental Benefits Mapping and Analysis Program—Community Edition (BenMAP-CE) to assess premature mortality attributed to PM2.5 and O3 [39]. Finally, based on the BenMAP-CE results, Hg deposition flux, and selected demographic vulnerability indicators, injustices in the distribution of mortalities caused by PM2.5, O3, and Hg deposition over the PRD and the cumulative environmental risk score (CERS) of PM2.5, O3, and Hg in different cities were comprehensively assessed.

2.1. PM2.5, O3, and Hg Simulations

Considering the spatial and temporal continuity of air quality data, the WRF-CMAQ system was constructed to simulate the concentration or deposition of PM2.5, O3, and Hg, and the DF was adopted to further reduce simulation error.
Meteorological inputs were provided by the WRF v3.9.1, and PM2.5, O3, and Hg were simulated by the CMAQ v5.2. The modeling domain was three-nested with 27 km, 9 km, and 3 km horizontal resolutions from outside to inside, and the innermost modeling domain (d03) covered the whole PRD region (Figure 2). January, April, July, and October (representing winter, spring, summer, and autumn, respectively) were chosen for the simulations to represent overall PM2.5 and O3 concentrations in 2017 and Hg deposition in the typical periods, and spin-up times of 5 and 7 days were determined to offset the effect of the initial condition on concentrations and deposition, respectively. In addition, the simulation results of PM2.5 and O3 were assimilated with the observed data from the national air quality monitoring stations in the PRD region using the downscaler (DS) algorithm in the DF v2.2 developed by our team [38]. It should be noted that Hg was not included in the assimilation process due to the lack of online monitoring data. The detailed model configurations, simulation results, and their validation are described in the Supplementary Materials, Sections S2–S4, respectively.

2.2. Environmental Risks Assessment

The environmental risks of PM2.5 and O3 were represented by their relative attributed premature mortalities, which were quantified using the health impact function (HIF) in BenMAP-CE v1.4.7 developed by the EPA [39,40]:
Δ Y = [ 1 e x p ( β × Δ A Q ) ] × Y 0 × P o p
where Δ Y is the estimated health impact attributed to PM2.5 or O3, β is the concentration–response function (C-R) coefficient derived from the relative risk (RR) reported in epidemiologic studies, Δ A Q is the change in pollutant concentration (pollutant concentration changes to zero was assumed in this study), Y 0 is the incidence rate, and P o p is the exposed population.
In this study, six health endpoints (i.e., COPD, coronary heart disease, CVD, hypertension, respiratory mortality, and stroke) and four health endpoints (i.e., coronary heart disease, CVD, hypertension, and stroke) were selected to estimate PM2.5- and O3-related premature mortalities, respectively, and the C-R coefficients used for PM2.5 and O3 were derived from studies by Chen et al. [41] and Yin et al. [42], respectively. Incident rates in 2017 were obtained from the China Health Statistical Yearbook (http://www.nhc.gov.cn/mohwsbwstjxxzx/new_index.shtml (accessed on 1 June 2021)), and population data for the exposure were collected from the statistical yearbooks or statistical bulletins of each district in the PRD.

2.3. EJ Assessment of Environmental Risks

2.3.1. Inequality Curve and Concentration Index

The inequality curve and the concentration index (CI) were used to assess how and to what extent environmental risk is unjustly distributed over the PRD region [43]. The inequality curve is essentially a concentration curve developed by the World Bank and demonstrates the trend in the distribution of risk, with the cumulative proportion of grids of d03 in descending order by a demographic vulnerability indicator represented on the x-axis and the cumulative share of risk represented on the y-axis. If the risk is allocated evenly, the inequality curve is a 45-degree diagonal line through the origin. When the inequality curve lies above the 45-degree diagonal, it indicates that more risk is disproportionately distributed in the disadvantaged d03 grids with a higher demographic vulnerability indicator, and vice versa, that more risk is disproportionately spread over the advantaged d03 grids (Supplementary Materials, Figure S10). In this study, a disproportionate distribution of environmental risk is considered unjust.
The CI is defined as twice the area between the 45-degree diagonal and the inequality curve and takes values between −1 and 1 (Equation (2)). When it is negative (positive), it represents that the risk tends to be in favor of disadvantaged (advantaged) grids, and a larger absolute value means a higher degree of injustice.
C I j = 2 × [   1 2 0 1 f ( x ) d x   ]
where f ( x ) is the fitted inequality curve for risk j .

2.3.2. Cumulative Environmental Risk Score

Existing research consistently agrees that socioeconomic and sensitive factors identified as “effect modifiers” can multiply the risk of pollutants [44,45,46], and multiple environmental hazards may accumulate or interact in complex ways to amplify their risks to human health [47]. Therefore, we proposed CERS, a comprehensive indicator that combines environmental and demographic information to investigate the differences in environmental risks and vulnerable populations among cities in the PRD. Firstly, the simple additive weighting (SAW) method, one of the most commonly used aggregation methods for constructing environmental composite indicators [43,48], was used to aggregate the three environmental risk indicators to gain the cumulative environmental risk (CER, Equation (3)). Subsequently, the CER was modified using the demographic vulnerability indicator to obtain the CERS by referring to the CalEnviroScreen Score developed by the CalEPA (Equation (4)) [44,49,50]. It is important to note that CERS values range from 0 to 1 and that the CERS, similar to the CalEnviroScreen Score and the EJ Index (an indicator developed by EPA [51]), has only comparative and not absolute meaning. Environmental risk management needs to be strengthened to protect public health, no matter whether the larger CERS is the result of population vulnerability, air pollution, or a combination of both.
C E R = j = 1 n w j r j
where n is the number of risks, r j is the normalized environmental risk j , and w j is the weight assigned to the environmental risk j , j = 1 n w j = 1 . The weights in the SAW method are generally used to reflect stakeholders’ preferences on environmental issues and can be obtained by combining expert surveys with some multiattribute evaluation models [48,52,53]. In the absence of accurate expert information or objective mechanisms to determine the relative importance of different environmental variables, the choice of equal weights may be more reasonable and more widely accepted [54,55]. This study assumes that each environmental risk is treated equally and considers that the route of human exposure to atmospheric Hg is less immediate than PM2.5 and O3. Hence, the weight of Hg was set to half the weight of PM2.5 and O3 by referencing the research of Cushing et al. [14] (i.e., 2/5 weighting to PM2.5 and O3, 1/5 weighting to Hg).
C E R S k = C E R × P k
where C E R S k is the CERS based on the demographic vulnerability indicator k , and P k is the normalized demographic vulnerability indicator k .

3. Results and Discussion

3.1. Statistical Results of EJ Assessment Indicators

The EJ assessment indicators for the PRD are divided into demographic vulnerability indicators and environmental risk indicators, of which the city-level statistical results are summarized in Figure 3 and Figure 4, respectively, and of which the selection bases are elaborated on in the Supplementary Materials, Section S6, and the Introduction, respectively.

3.1.1. Demographic Vulnerability Indicators

The percentage of low-income and elderly and children population groups over the entire PRD are 0.85% and 20.22%, respectively. The city with the highest percentage of the elderly and children is ZQ (29.60%), followed by HZ (25.27%) and JM (23.03%), and the lowest is DG (10.51%). Similarly, the highest percentage of the low-income population is in HZ (1.83%), followed by JM (1.30%) and ZQ (0.78%), while the lowest is in SZ (0.16%). In general, the percentage of both low-income and elderly and children population groups is higher in the peripheral cities (i.e., JM, HZ, and ZQ) and lower in the central cities of the PRD. According to the information on socioeconomics and the population of the PRD cities (Supplementary Materials, Table S6), this may be caused by the central cities having more working opportunities, with a higher salary than the peripheral ones, which attracts more young people.

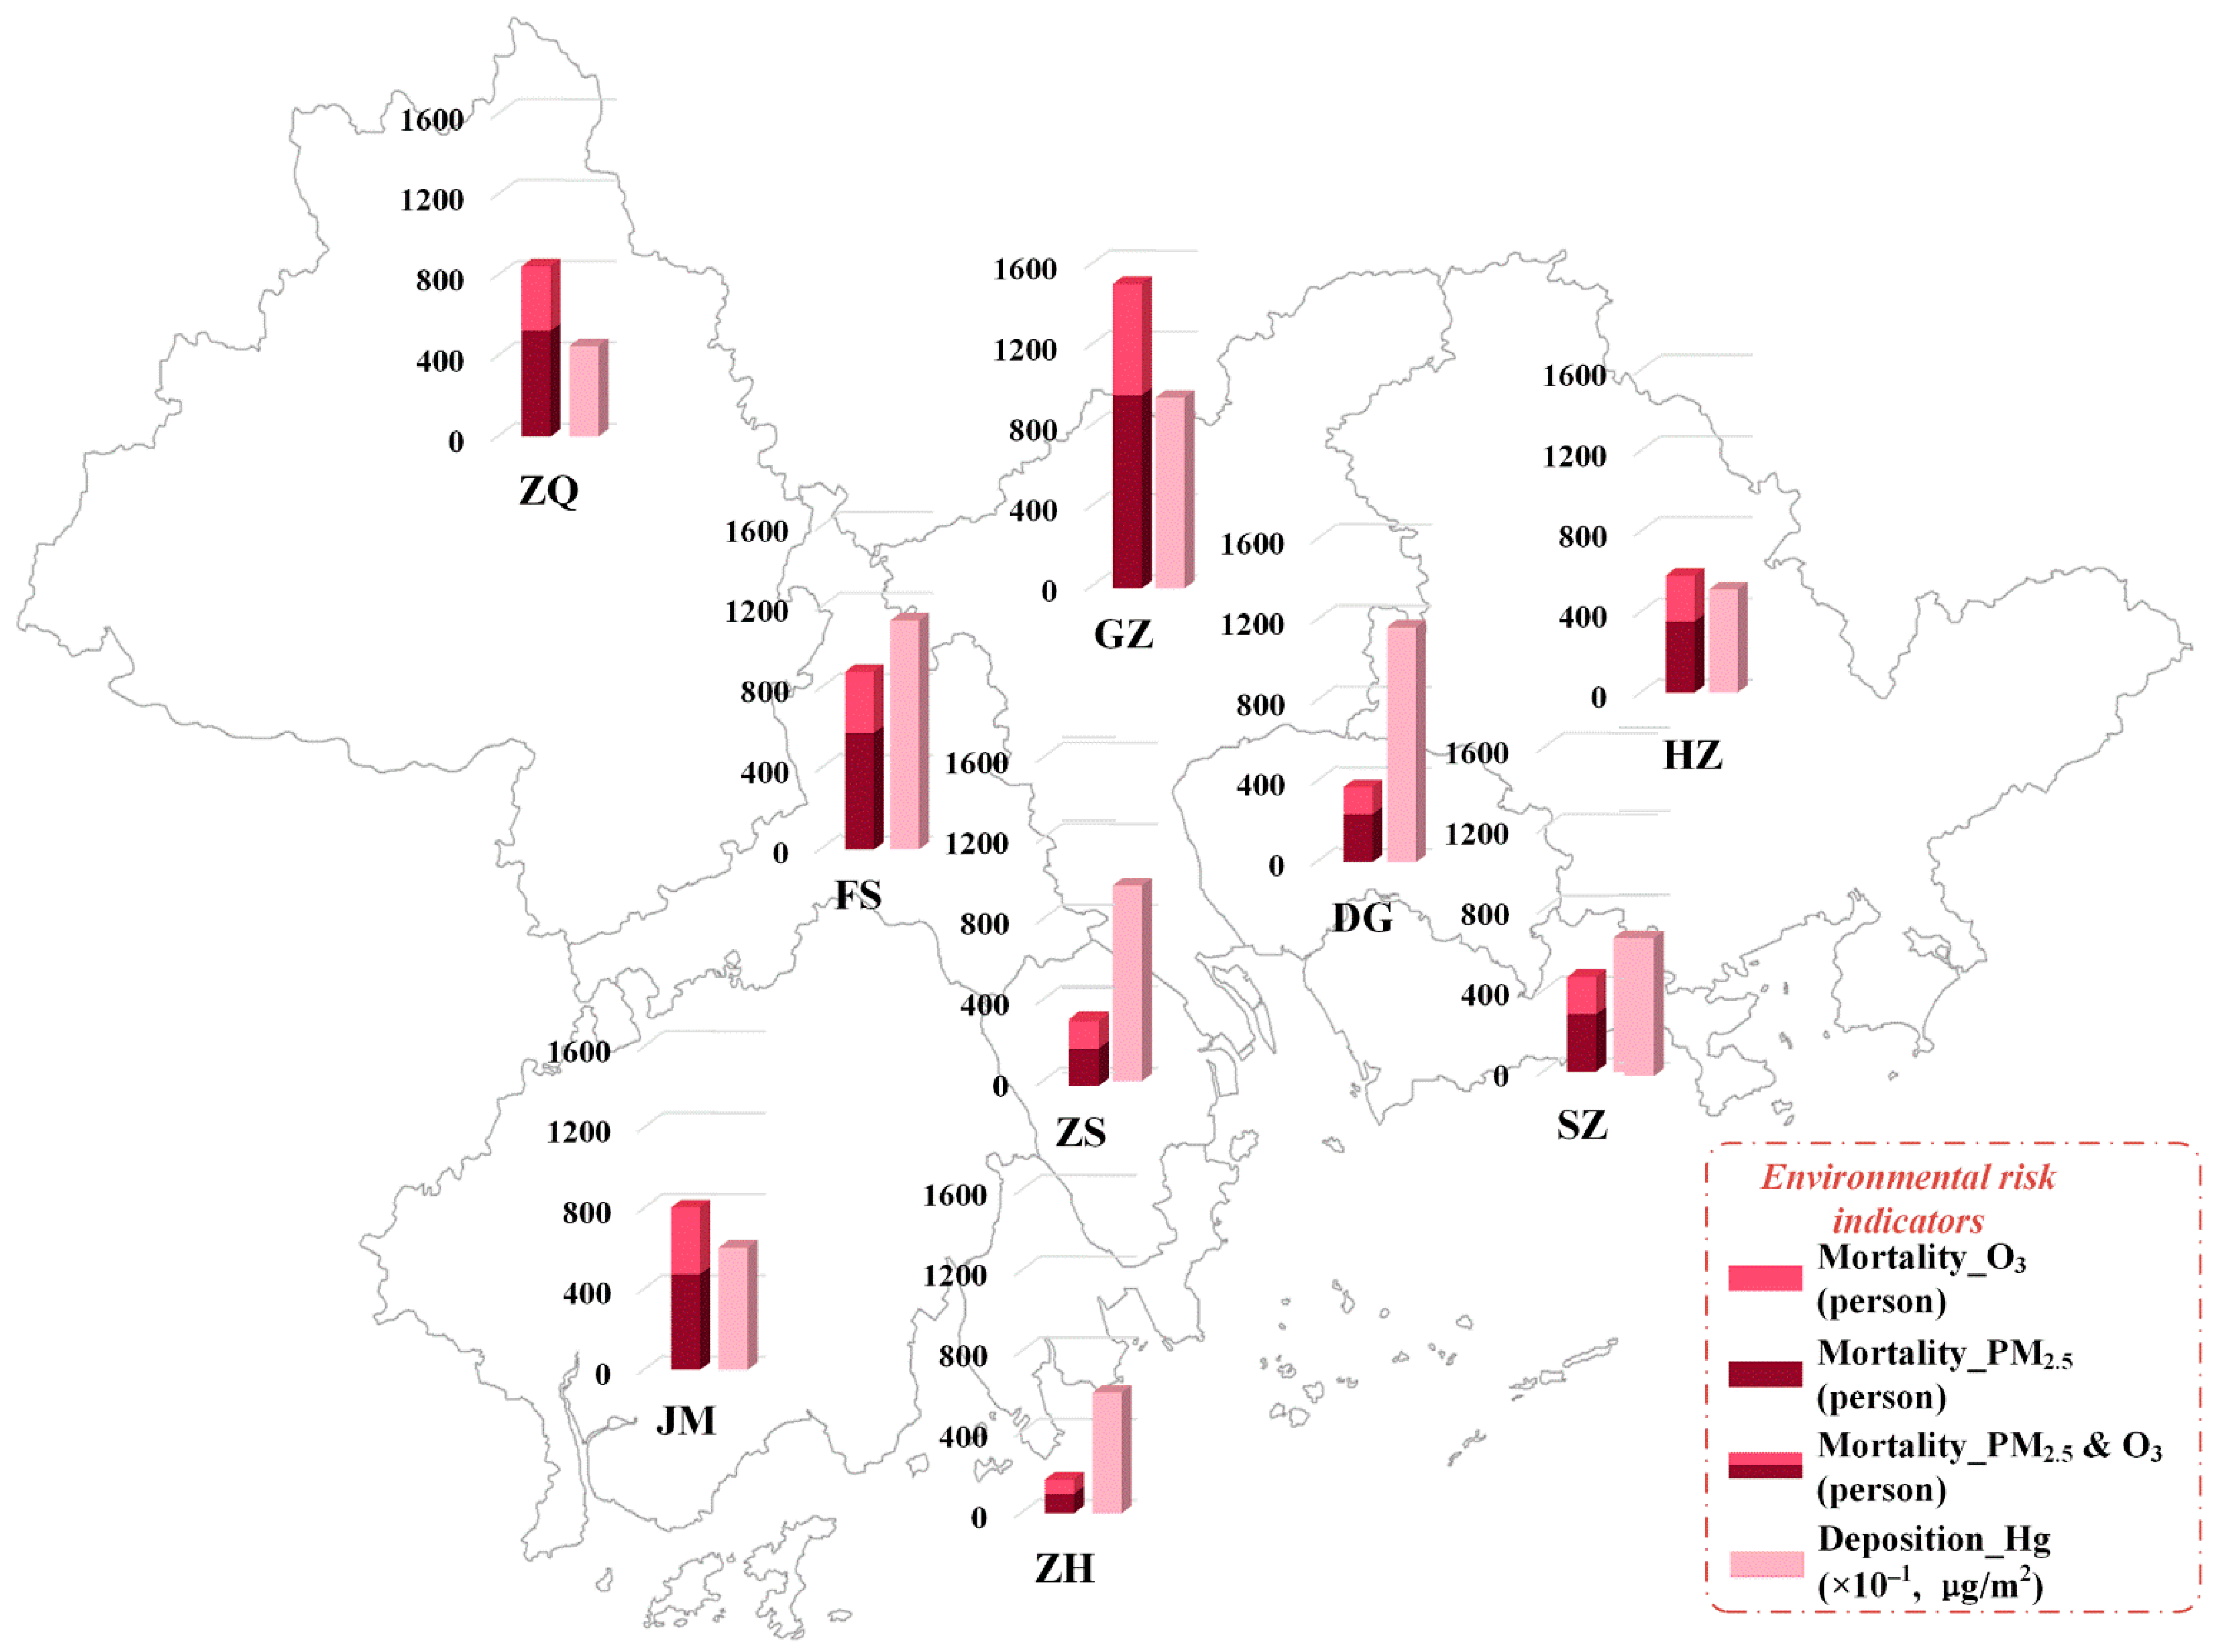
3.1.2. Environmental Risk Indicators

The premature mortalities attributed to PM2.5 and O3 in the PRD are 3657 and 2238, respectively, and Hg deposition during the simulation period is 77.7 μg/m2. The highest PM2.5-attributable mortality is observed in GZ (952), followed by FS (574) and ZQ (521), as a result of the higher PM2.5 concentrations in these three cities, contributed by intensive dust and mobile emissions in the northern PRD (Supplementary Materials, Figure S1) [56]. The highest O3-attributable mortality is also noticed in GZ (548), followed by FS (302), which is probably because of considerable VOC emissions from local industries and transportation sources that may contribute to high O3 levels [57]. In addition, it was noticed that the O3-attributable mortality in JM, a typical disadvantaged city with a high degree of population vulnerability, is the third highest in the PRD; this may be caused by the distinct NOx contribution from local biomass burning and ship activities and also the significant regional contribution from the northeast areas to O3 in JM [57]. Regarding Hg, the central cities of the PRD have greater Hg deposition fluxes during the simulation period, represented by DG (115.9 μg/m2), FS (112.78 μg/m2), and ZS (96.12 μg/m2); this is because the mercury sources are mainly concentrated in the central PRD (Supplementary Materials, Figure S12), while atmospheric mercury emitted from these sources usually exhibits a short atmospheric lifetime and is mostly deposited near the emission sources [29,58,59,60].

3.2. Unequal Distributions of PM2.5, O3, and Hg Risks

3.2.1. Trends in Risk Distributions

The distributions of environmental risks concerning age structure and low-income levels are illustrated by the inequality curves in Figure 5. As can be seen, the inequality curves based on the percentage of low-income and elderly and children population groups are, overall, consistent. The inequality curves for mortalities attributed to PM2.5 and O3 and Hg deposition all lie below the equality line, implying that more risks are disproportionately taken by the advantaged areas in the center of the PRD because of the more intensive precursor emissions in these areas (Supplementary Materials, Figure S13). The inequality curves of Hg deposition are closer to the equality line compared with that of PM2.5 and O3 since some grids located in the central PRD have high PM2.5- and O3-attributable mortalities but not high Hg deposition fluxes for the reason mentioned in Section 3.1.2, most obviously those located in SZ (Supplementary Materials, Figures S1 and S14). In addition, it was found that the inequality curves for O3 are slightly closer to the equality line than that for PM2.5; this is because the difference in O3-attributable mortalities between the central and peripheral cities is smaller than that in PM2.5, as demonstrated by the variation coefficient for O3-attributable mortalities of 58%, while that for PM2.5 is 64%.

3.2.2. Degrees of Injustices in Risk Distributions

The CIs in the environmental risk distributions and their significance test results are presented in Table 1. In the distributions of environmental risks based on the percentage of the low-income (elderly and children) population, the CIs for PM2.5, O3, and Hg are 0.35 (0.39), 0.32 (0.36), and 0.16 (0.23), respectively. Compared with those in the United States case studies [14,43,61], the CIs in our study are all positive, implying that the environmental risks are disproportionately imposed more on central areas with lower proportions of vulnerable groups instead of marginal areas with population disadvantage; however, the absolute values of our CIs are larger in general, suggesting the more concentrated distribution of environmental risks in the PRD. The reason for the differences is that the PRD contrasts with the situation in the United States, and the more developed areas in the heart of the PRD experience more intensive pollutant emissions and, correspondingly, take more exposure risks.
The injustice degree of PM2.5-attributable mortality is the greatest, followed closely by O3, manifesting that the EJ issues in the PRD are mainly exhibited in PM2.5 and O3 risks. The injustice degree of Hg deposition is much smaller than that of PM2.5 and O3; this is probably because the implementation of a series of industrial pollution control policies (Supplementary Materials, Section S4) has reduced mercury emissions in the central cities of the PRD, especially SZ, which exhibits indistinctive mercury emissions even with concentrated mercury sources (Supplementary Materials, Figures S12 and S13), leading to a decreasing difference in Hg deposition between the central and peripheral cities in the PRD. As for the environmentally vulnerable groups, the absolute values of the CIs based on the percentage of the elderly and children are slightly larger than that based on the percentage of the low-income population overall. Therefore, the injustice distributions of environmental risks in the PRD may be more reflected in age structure, in which the elderly and children, one of the susceptible groups (Supplementary Materials, Section S6), should be given more assistance than the low-income population. Moreover, to verify the statistical significance of our assessment results, a one-sample t-test was conducted, and the results are given in Table 1. It can be seen that the p-values are all lower than the reference (0.05) and the absolute values of t are all larger than the reference (2.01), indicating that there are significant differences in the CIs of our results [62].

3.2.3. Overburdened Areas of PM2.5, O3, and Hg

The injustice in the distribution of environmental risk is usually caused by the existence of certain areas that disproportionately take more risk (denoted as “overburdened area” hereafter); thus, screening out these overburdened areas can support policymaking for risk management. Inspired by the research conducted by Damgaard et al. [63] on exploring inequalities in plant size or fecundity and considering the negative effects of environmental risk, the overburdened areas in this research were screened based on the points on the inequality curve that were obtained by differentiating the fitted inequality curve and parallel to the equality line. As shown in the example graphs in the Supplementary Materials (Figure S11), when the inequality curve is below (above) the equality line, the areas represented by the x-axis after (before) the parallel point are recognized as the overburdened areas (Supplementary Materials, Figure S11a,b); when the inequality curve crosses the equality line, the areas represented by the x-axis between or at both ends of the parallel points will host more risk (Supplementary Materials, Figure S11c,d).
The overburdened areas screened out using the inequality curves in Figure 5 are overlapping, as displayed in Figure 6. It can be seen that the central cities of the PRD—GZ, FS, SZ, DG, ZS, and ZH—are all screened as overburdened areas for the three environmental risks, which is generally consistent with the spatial patterns of precursor emissions. For example, these overburdened areas account for 81.79%, 86.51%, 66.48%, and 72.77% of the entire PRD for VOC, NOx, primary PM2.5, and Hg emissions, respectively (Supplementary Materials, Figure S13). One notable thing is that parts of the three marginal disadvantaged cities are also screened as overburdened areas, including northeastern and southern JM and south-central HZ and ZQ. Northeastern JM was screened as a PM2.5 and O3 overburdened area because of considerable local primary PM2.5 and PM2.5 precursor emissions from dust sources and agricultural activities, as well as the reasons mentioned in Section 3.1.2; in contrast, northeastern and southern JM were screened as a Hg overburdened area since 73.61% of industrial boilers and all power plants in JM are concentrated there (Supplementary Materials, Figure S12). Likewise, 54.3% of industrial boilers and 80% of power plants in HZ are located in the overburdened area, resulting in more intensive Hg, NOx, and primary PM2.5 emissions (Supplementary Materials, Figures S12 and S13), and the situation in ZQ is also similar to that in HZ. Summarily, the central cities of the PRD should be the priority for PM2.5, O3, and Hg risk management, but overburdened areas in the peripheral cities also require special attention because of local population vulnerability in these areas.

3.3. CERS in Different Cities

The distributions of CERSs in different cities of the PRD are visually compared in Figure 7 (details in Supplementary Materials, Table S7), and the CERS in each city is represented by the overall condition in different districts of this city. The city with the lowest median CERS value based on the percentage of low-income or elderly and children population groups is SZ, the most advantaged central city in the PRD, with values of 0.003 and 0.008, respectively. In contrast, the median CERS based on the percentage of the low-income population in JM, HZ, and ZQ, three marginal cities in the PRD, is 30.88, 32.98, and 14.18 times higher than that of SZ, respectively, and based on the percentage of the elderly and children, is 16.01, 18.23 and 20.30 times greater than that of SZ, respectively. This regional disparity is driven jointly by differences in environmental risk and population vulnerability. Although individual environmental risk (particularly that of Hg deposition) in the peripheral cities is relatively insignificant compared to that in the central cities, the impact of CER is magnified by demographic disadvantages to a certain extent, which may further increase health disparities between the peripheral cities and the demographically advantaged cities. Therefore, cities with higher levels of CERS, such as JM, HZ, and ZQ, should be given further consideration for risk management in the PRD.

4. Conclusions

In this study, injustices in the distribution of mortalities attributed to PM2.5 and O3 and Hg deposition over the PRD region of China were comprehensively assessed by combining the WRF-CMAQ, DF tool, and BenMAP-CE.
Our results suggested that the CIs for PM2.5- and O3-attributable mortalities and Hg deposition were 0.35, 0.32, and 0.16, respectively, based on the percentage of the low-income population, and 0.39, 0.36, and 0.23, respectively, based on the elderly and children. These findings indicated that EJ issues were more evident for PM2.5 than for O3 and Hg and more reflected in the elderly and children than in the low-income group in the PRD. The screened overburdened areas of mortalities attributed to PM2.5 and O3 and Hg deposition were mainly located in the center (GZ, FS, SZ, DG, ZS, and ZH) and some marginal areas (northeast of JM and south-central HZ and ZQ) because many emission sources were concentrated in the central areas of PRD and, accordingly, more risks were taken, as shown by the inequality curves. The CER affected by population vulnerability exhibited distinct differences among the PRD cities, in which the CERSs in JM, HZ, and ZQ were 14.18 to 32.98 times higher than that in SZ. Therefore, multipollutant control strategies for PM2.5 and O3 and combined with air toxins (e.g., Hg) for overburdened areas and risk management with increased attention on cities with higher CERSs (e.g., JM, HZ, and ZQ) are recommended to effectively promote EJ and achieve sustainable development in the PRD, China.

Supplementary Materials

The following supporting information can be downloaded at: https://www.mdpi.com/article/10.3390/su141710891/s1, References [29,36,59,64,65,66,67,68,69,70,71,72,73,74,75,76,77,78,79,80,81,82,83,84,85] are also cited in the supplementary material file.

Author Contributions

Conceptualization, W.C.; methodology, W.C.; validation, S.L., J.L. and G.C.; formal analysis, S.L., J.L. and G.C.; investigation, W.C.; resources, Y.Z., C.-J.L. and S.A.; data curation, Y.Z., C.-J.L. and S.A.; writing—original draft preparation, W.C.; writing—review and editing, Y.Z., C.-J.L., S.A., S.W., J.X. and T.F.; visualization, S.L., J.L. and G.C.; supervision, Y.Z.; project administration, Y.Z.; funding acquisition, G.C. All authors have read and agreed to the published version of the manuscript.

Funding

This research was funded by the Science and Technology Program of Guangzhou, China (Grant No. 202002030188), and the Science and Technology Planning Project of Guangdong Province, China (Grant No. 20180208).

Institutional Review Board Statement

Not applicable.

Informed Consent Statement

Not applicable.

Data Availability Statement

Not applicable.

Acknowledgments

The authors sincerely thank Carey Jang (U.S. Environmental Protection Agency) for his assistance in the preparation and management of this paper. The views expressed in this paper are those of the authors alone and do not necessarily reflect the views and policies of the U.S. Environmental Protection Agency.

Conflicts of Interest

The authors declare no conflict of interest.

References

  1. EPA. Environmental Justice. Available online: https://www.epa.gov/environmentaljustice (accessed on 10 March 2021).
  2. Chakraborty, J.; Green, D. Australia’s first national level quantitative environmental justice assessment of industrial air pollution. Environ. Res. Lett. 2014, 9, 044010. [Google Scholar] [CrossRef]
  3. Finkelstein, M.M.; Jerrett, M. A study of the relationships between Parkinson’s disease and markers of traffic-derived and environmental manganese air pollution in two Canadian cities. Environ. Res. 2007, 104, 420–432. [Google Scholar] [CrossRef] [PubMed]
  4. Banzhaf, S.; Ma, L.; Timmins, C. Environmental Justice: The Economics of Race, Place, and Pollution. J. Econ. Perspect. 2019, 33, 185–208. [Google Scholar] [CrossRef] [PubMed]
  5. Zhao, X.; Zhang, S.; Fan, C. Environmental externality and inequality in China: Current Status and future choices. Environ. Pollut. 2014, 190, 176–179. [Google Scholar] [CrossRef]
  6. Ji, S.; Cherry, C.R.; Bechle, M.J.; Wu, Y.; Marshall, J.D. Electric Vehicles in China: Emissions and Health Impacts. Environ. Sci. Technol. 2012, 46, 2018–2024. [Google Scholar] [CrossRef]
  7. Li, C.; Chandio, A.A.; Farooq, U.; Sahito, J.G.M.; He, G. Assessing the impact of mechanism of green public consumption policy on environmental equity: Evidence from China. Environ. Dev. Sustain. 2021, 24, 271–292. [Google Scholar] [CrossRef]
  8. Adger, W.N. Inequality, Environment, and Planning. Environ. Plan. A Econ. Space 2002, 34, 1716–1719. [Google Scholar] [CrossRef]
  9. Hampson, C. Warren County and Environmental Justice: A Community Fighting Back. Bachelor’s Thesis, UNC Asheville, Asheville, NC, USA, 2010. [Google Scholar]
  10. Williams, D.R.; Collins, C. Reparations: A Viable Strategy to Address the Enigma of African American Health. Am. Behav. Sci. 2004, 47, 977–1000. [Google Scholar] [CrossRef]
  11. Morello-Frosch, R.; Jesdale, B.M. Separate and Unequal: Residential Segregation and Estimated Cancer Risks Associated with Ambient Air Toxics in U.S. Metropolitan Areas. Environ. Health Perspect. 2006, 114, 386–393. [Google Scholar] [CrossRef]
  12. Mohai, P.; Saha, R. Which came first, people or pollution? Assessing the disparate siting and post-siting demographic change hypotheses of environmental injustice. Environ. Res. Lett. 2015, 10, 115008. [Google Scholar] [CrossRef]
  13. Lee, H.J.; Park, H.-Y. Prioritizing the control of emission sources to mitigate PM2.5 disparity in California. Atmos. Environ. 2020, 224, 117316. [Google Scholar] [CrossRef]
  14. Cushing, L.; Faust, J.; August, L.M.; Cendak, R.; Wieland, W.; Alexeeff, G. Racial/Ethnic Disparities in Cumulative Environmental Health Impacts in California: Evidence from a Statewide Environmental Justice Screening Tool (CalEnviroScreen 1.1). Am. J. Public Health 2015, 105, 2341–2348. [Google Scholar] [CrossRef] [PubMed]
  15. Schulz, A.J.; Mentz, G.B.; Sampson, N.; Ward, M.; Anderson, R.; de Majo, R.; Israel, B.A.; Lewis, T.C.; Wilkins, D. Race and the Distribution of Social and Physical Environmental Risk: A Case Example from the Detroit Metropolitan Area. Bois Rev. Soc. Sci. Res. Race 2016, 13, 285–304. [Google Scholar] [CrossRef]
  16. Bullard, R.D.; Johnson, G.S. Environmentalism and Public Policy: Environmental Justice: Grassroots Activism and Its Impact on Public Policy Decision Making. J. Soc. Issues 2000, 56, 555–578. [Google Scholar] [CrossRef]
  17. Grineski, S.E.; Collins, T.W.; Chakraborty, J.; McDonald, Y.J. Environmental Health Injustice: Exposure to Air Toxics and Children’s Respiratory Hospital Admissions in El Paso, Texas. Prof. Geogr. 2013, 65, 31–46. [Google Scholar] [CrossRef]
  18. Collins, T.W.; Grineski, S.E.; Morales, D.X. Environmental injustice and sexual minority health disparities: A national study of inequitable health risks from air pollution among same-sex partners. Soc. Sci. Med. 2017, 191, 38–47. [Google Scholar] [CrossRef]
  19. Ely, D.M.; Driscoll, A.K. Infant mortality in the United States, 2018: Data from the period linked birth/infant death file. Natl. Vital Stat. Rep. 2020, 69, 1–18. [Google Scholar]
  20. Arias, E.; Xu, J. United States Life Tables, 2018. Natl. Vital Stat. Rep. 2020, 69, 1–45. [Google Scholar]
  21. Ma, C. Who bears the environmental burden in China—An analysis of the distribution of industrial pollution sources? Ecol. Econ. 2010, 69, 1869–1876. [Google Scholar] [CrossRef]
  22. Zhu, Z.; Ren, J.; Liu, X. Green infrastructure provision for environmental justice: Application of the equity index in Guangzhou, China. Urban For. Urban Green. 2019, 46, 126443. [Google Scholar] [CrossRef]
  23. Feng, S.; Chen, L.; Sun, R.; Feng, Z.; Li, J.; Khan, M.S.; Jing, Y. The Distribution and Accessibility of Urban Parks in Beijing, China: Implications of Social Equity. Int. J. Environ. Res. Public Health 2019, 16, 4894. [Google Scholar] [CrossRef] [PubMed]
  24. Schoolman, E.D.; Ma, C. Migration, class and environmental inequality: Exposure to pollution in China’s Jiangsu Province. Ecol. Econ. 2012, 75, 140–151. [Google Scholar] [CrossRef]
  25. Zhang, W.; Liu, Y.; Feng, K.; Hubacek, K.; Wang, J.; Liu, M.; Jiang, L.; Jiang, H.; Liu, N.; Zhang, P.; et al. Revealing Environmental Inequality Hidden in China’s Inter-regional Trade. Environ. Sci. Technol. 2018, 52, 7171–7181. [Google Scholar] [CrossRef] [PubMed]
  26. Dou, J.; Han, X. How does the industry mobility affect pollution industry transfer in China: Empirical test on Pollution Haven Hypothesis and Porter Hypothesis. J. Clean. Prod. 2019, 217, 105–115. [Google Scholar] [CrossRef]
  27. He, Q.; Fang, H.; Ji, H.; Fang, S. Environmental Inequality in China: A “Pyramid Model” and Nationwide Pilot Analysis of Prefectures with Sources of Industrial Pollution. Sustainability 2017, 9, 1871. [Google Scholar] [CrossRef]
  28. WHO. Air Quality Guidelines: Global Update 2005: Particulate Matter, Ozone, Nitrogen Dioxide, and Sulfur Dioxide. Available online: https://www.who.int/publications/i/item/WHO-SDE-PHE-OEH-06.02 (accessed on 1 April 2021).
  29. Liu, J.; Wang, L.; Zhu, Y.; Lin, C.-J.; Jang, C.; Wang, S.; Xing, J.; Yu, B.; Xu, H.; Pan, Y. Source attribution for mercury deposition with an updated atmospheric mercury emission inventory in the Pearl River Delta Region, China. Front. Environ. Sci. Eng. 2019, 13, 2. [Google Scholar] [CrossRef]
  30. Fu, X.; Feng, X.; Sommar, J.; Wang, S. A review of studies on atmospheric mercury in China. Sci. Total Environ. 2012, 421–422, 73–81. [Google Scholar] [CrossRef]
  31. Lindberg, S.; Bullock, R.; Ebinghaus, R.; Engstrom, D.; Feng, X.; Fitzgerald, W.; Pirrone, N.; Prestbo, E.; Seigneur, C. A Synthesis of Progress and Uncertainties in Attributing the Sources of Mercury in Deposition. Ambio 2007, 36, 19–33. [Google Scholar] [CrossRef]
  32. Mo, Z.; Fu, Q.; Zhang, L.; Lyu, D.; Mao, G.; Wu, L.; Xu, P.; Wang, Z.; Pan, X.; Chen, Z.; et al. Acute effects of air pollution on respiratory disease mortalities and outpatients in Southeastern China. Sci. Rep. 2018, 8, 3461. [Google Scholar] [CrossRef]
  33. Huang, F.; Pan, B.; Wu, J.; Chen, E.; Chen, L. Relationship between exposure to PM2.5 and lung cancer incidence and mortality: A meta-analysis. Oncotarget 2017, 8, 43322–43331. [Google Scholar] [CrossRef]
  34. Farzad, K.; Khorsandi, B.; Khorsandi, M.; Bouamra, O.; Maknoon, R. Estimating short-term mortality benefits associated with a reduction in tropospheric ozone. Atmos. Environ. 2021, 252, 118342. [Google Scholar] [CrossRef]
  35. Chen, L.; Liang, S.; Liu, M.; Yi, Y.; Mi, Z.; Zhang, Y.; Li, Y.; Qi, J.; Meng, J.; Tang, X.; et al. Trans-provincial health impacts of atmospheric mercury emissions in China. Nat. Commun. 2019, 10, 1484. [Google Scholar] [CrossRef] [Green Version]
  36. Huang, M.; Deng, S.; Dong, H.; Dai, W.; Pang, J.; Wang, X. Impacts of Atmospheric Mercury Deposition on Human Multimedia Exposure: Projection from Observations in the Pearl River Delta Region, South China. Environ. Sci. Technol. 2016, 50, 10625–10634. [Google Scholar] [CrossRef]
  37. Mahaffey, K.R.; Clickner, R.P.; Bodurow, C.C. Blood organic mercury and dietary mercury intake: National Health and Nutrition Examination Survey, 1999 and 2000. Environ. Health Perspect. 2004, 112, 562–570. [Google Scholar] [CrossRef]
  38. Li, J.; Zhu, Y.; Kelly, J.T.; Jang, C.J.; Wang, S.; Hanna, A.; Xing, J.; Lin, C.-J.; Long, S.; Yu, L. Health benefit assessment of PM2.5 reduction in Pearl River Delta region of China using a model-monitor data fusion approach. J. Environ. Manag. 2019, 233, 489–498. [Google Scholar] [CrossRef] [PubMed]
  39. Sacks, J.D.; Lloyd, J.M.; Zhu, Y.; Anderton, J.; Jang, C.J.; Hubbell, B.; Fann, N. The Environmental Benefits Mapping and Analysis Program—Community Edition (BenMAP–CE): A tool to estimate the health and economic benefits of reducing air pollution. Environ. Model. Softw. 2018, 104, 118–129. [Google Scholar] [CrossRef] [PubMed]
  40. EPA. Environmental Benefits Mapping and Analysis Program—Community Edition (BenMAP-CE). Available online: https://www.epa.gov/benmap (accessed on 28 November 2021).
  41. Chen, R.; Yin, P.; Meng, X.; Liu, C.; Wang, L.; Xu, X.; Ross, J.A.; Tse, L.A.; Zhao, Z.; Kan, H.; et al. Fine Particulate Air Pollution and Daily Mortality. A Nationwide Analysis in 272 Chinese Cities. Am. J. Respir. Crit. Care Med. 2017, 196, 73–81. [Google Scholar] [CrossRef]
  42. Yin, P.; Chen, R.; Wang, L.; Meng, X.; Liu, C.; Niu, Y.; Lin, Z.; Liu, Y.; Liu, J.; Qi, J.; et al. Ambient Ozone Pollution and Daily Mortality: A Nationwide Study in 272 Chinese Cities. Environ. Health Perspect. 2017, 125, 117006. [Google Scholar] [CrossRef]
  43. Su, J.G.; Morello-Frosch, R.; Jesdale, B.M.; Kyle, A.D.; Shamasunder, B.; Jerrett, M. An Index for Assessing Demographic Inequalities in Cumulative Environmental Hazards with Application to Los Angeles, California. Environ. Sci. Technol. 2009, 43, 7626–7634. [Google Scholar] [CrossRef]
  44. OEHHA. California Communities Environmental Health Screening Tool. Available online: https://oehha.ca.gov/calenviroscreen/report/calenviroscreen-40 (accessed on 6 January 2022).
  45. Samet, J.M.; White, R.H. Urban air pollution, health, and equity. J. Epidemiol. Community Health 2004, 58, 3–5. [Google Scholar] [CrossRef]
  46. Ponce, N.A.; Hoggatt, K.J.; Wilhelm, M.; Ritz, B. Preterm Birth: The Interaction of Traffic-related Air Pollution with Economic Hardship in Los Angeles Neighborhoods. Am. J. Epidemiol. 2005, 162, 140–148. [Google Scholar] [CrossRef] [PubMed]
  47. National Research Council. Science and Decisions: Advancing Risk Assessment; National Academies Press: Washington, DC, USA, 2009. [Google Scholar]
  48. Zhou, P.; Ang, B.W.; Poh, K.L. Comparing aggregating methods for constructing the composite environmental index: An objective measure. Ecol. Econ. 2006, 59, 305–311. [Google Scholar] [CrossRef]
  49. Brody, T.M.; Di Bianca, P.; Krysa, J. Analysis of Inland Crude Oil Spill Threats, Vulnerabilities, and Emergency Response in the Midwest United States: Inland Crude Oil Spill Threats, Vulnerabilities, and Emergency Response. Risk Anal. 2012, 32, 1741–1749. [Google Scholar] [CrossRef]
  50. EPA. Conducting a Human Health Risk Assessment. Available online: https://www.epa.gov/risk/conducting-human-health-risk-assessment (accessed on 17 November 2021).
  51. United States Environmental Protection Agency. EJScreen: Environmental Justice Screening and Mapping Tool. Available online: https://www.epa.gov/ejscreen (accessed on 28 February 2022).
  52. Kang, S.M.; Kim, M.S.; Lee, M. The trends of composite environmental indices in Korea. J. Environ. Manag. 2002, 64, 199–206. [Google Scholar] [CrossRef] [PubMed]
  53. Tzeng, G.H.; Tsaur, S.H.; Laiw, Y.D.; Opricovic, S. Multicriteria analysis of environmental quality in Taipei: Public preferences and improvement strategies. J. Environ. Manag. 2002, 65, 109–120. [Google Scholar] [CrossRef]
  54. Hope, C.; Parker, J.; Peake, S. A pilot environmental index for the UK in the 1980s. Energy Policy 1992, 20, 335–343. [Google Scholar] [CrossRef]
  55. Esty, D.C.; Levy, M.; Srebotnjak, T.; Sherbinin, A.D. Environmental Sustainability Index: Benchmarking National Environmental Stewardship. Ph.D. Thesis, Yale Center for Environmental Law & Policy Yale University, New Haven, CT, USA, 2005. [Google Scholar]
  56. Li, Z.; Zhu, Y.; Wang, S.; Xing, J.; Zhao, B.; Long, S.; Li, M.; Yang, W.; Huang, R.; Chen, Y. Source contribution analysis of PM2.5 using Response Surface Model and Particulate Source Apportionment Technology over the PRD region, China. Sci. Total Environ. 2021, 818, 151757. [Google Scholar] [CrossRef]
  57. Fang, T.; Zhu, Y.; Wang, S.; Xing, J.; Zhao, B.; Fan, S.; Li, M.; Yang, W.; Chen, Y.; Huang, R. Source impact and contribution analysis of ambient ozone using multi-modeling approaches over the Pearl River Delta region, China. Environ. Pollut. 2021, 289, 117860. [Google Scholar] [CrossRef]
  58. Wang, L.; Wang, S.; Zhang, L.; Wang, Y.; Zhang, Y.; Nielsen, C.; McElroy, M.B.; Hao, J. Source apportionment of atmospheric mercury pollution in China using the GEOS-Chem model. Environ. Pollut. 2014, 190, 166–175. [Google Scholar] [CrossRef]
  59. Xu, H.; Zhu, Y.; Wang, L.; Lin, C.-J.; Jang, C.; Zhou, Q.; Yu, B.; Wang, S.; Xing, J.; Yu, L. Source contribution analysis of mercury deposition using an enhanced CALPUFF-Hg in the central Pearl River Delta, China. Environ. Pollut. 2019, 250, 1032–1043. [Google Scholar] [CrossRef]
  60. Gbor, P.K.; Wen, D.; Meng, F.; Yang, F.; Sloan, J.J. Modeling of mercury emission, transport and deposition in North America. Atmos. Environ. 2007, 41, 1135–1149. [Google Scholar] [CrossRef]
  61. Su, J.G.; Jerrett, M.; Morello-Frosch, R.; Jesdale, B.M.; Kyle, A.D. Inequalities in cumulative environmental burdens among three urbanized counties in California. Environ. Int. 2012, 40, 79–87. [Google Scholar] [CrossRef] [PubMed]
  62. Box, J.F. Guinness, Gosset, Fisher, and Small Samples. Stat. Sci. 1987, 2, 45–52. [Google Scholar] [CrossRef]
  63. Damgaard, C.; Weiner, J. Describing Inequality in Plant Size or Fecundity. Ecology 2000, 81, 1139–1142. [Google Scholar] [CrossRef]
  64. Zhao, B.; Zheng, H.; Wang, S.; Smith, K.R.; Lu, X.; Aunan, K.; Gu, Y.; Wang, Y.; Ding, D.; Xing, J.; et al. Change in household fuels dominates the decrease in PM2.5 exposure and premature mortality in China in 2005–2015. Proc. Natl. Acad. Sci. USA 2018, 115, 12401–12406. [Google Scholar] [CrossRef]
  65. Wang, S.X.; Zhao, B.; Cai, S.Y.; Klimont, Z.; Nielsen, C.P.; Morikawa, T.; Woo, J.H.; Kim, Y.; Fu, X.; Xu, J.Y.; et al. Emission trends and mitigation options for air pollutants in East Asia. Atmos. Chem. Phys. 2014, 14, 6571–6603. [Google Scholar] [CrossRef]
  66. Emery, C.; Liu, Z.; Russell, A.G.; Odman, M.T.; Yarwood, G.; Kumar, N. Recommendations on statistics and benchmarks to assess photochemical model performance. J. Air Waste Manag. Assoc. 2017, 67, 582–598. [Google Scholar] [CrossRef]
  67. Luo, Q.; Ren, Y.; Sun, Z.; Li, Y.; Li, B.; Yang, S.; Zhang, W.; Hu, Y.; Cheng, H. Atmospheric mercury pollution caused by fluorescent lamp manufacturing and the associated human health risk in a large industrial and commercial city. Environ. Pollut. 2021, 269, 116146. [Google Scholar] [CrossRef]
  68. Chen, L.; Liu, M.; Xu, Z.; Fan, R.; Tao, J.; Chen, D.; Zhang, D.; Xie, D.; Sun, J. Variation trends and influencing factors of total gaseous mercury in the Pearl River Delta—A highly industrialised region in South China influenced by seasonal monsoons. Atmos. Environ. 2013, 77, 757–766. [Google Scholar] [CrossRef]
  69. Wang, Z.; Chen, Z.; Duan, N.; Zhang, X. Gaseous elemental mercury concentration in atmosphere at urban and remote sites in China. J. Environ. Sci. 2007, 19, 176–180. [Google Scholar] [CrossRef]
  70. NBS. Key Data Bulletin of China’s 1% Population Sample Survey in 2015. Available online: http://www.stats.gov.cn/tjsj/zxfb/201604/t20160420_1346151.html (accessed on 15 January 2021).
  71. Guangzhou, W.; Jun, W. Economic and social impact of China’s aging population and public policy response. China Econ. 2021, 16, 78–107. [Google Scholar] [CrossRef]
  72. China’s 2020 Fertility and Adoption of a Three-Child Policy. Popul. Dev. Rev. 2021, 47, 877–879. [CrossRef]
  73. Tatum, M. China’s three-child policy. Lancet 2021, 397, 2238. [Google Scholar] [CrossRef]
  74. Balfour, J.L.; Kaplan, G.A. Neighborhood Environment and Loss of Physical Function in Older Adults: Evidence from the Alameda County Study. Am. J. Epidemiol. 2002, 155, 507–515. [Google Scholar] [CrossRef]
  75. Maio, S.; Sarno, G.; Baldacci, S.; Annesi-Maesano, I.; Viegi, G. Air quality of nursing homes and its effect on the lung health of elderly residents. Expert Rev. Respir. Med. 2015, 9, 671–673. [Google Scholar] [CrossRef]
  76. Sandstrom, T.; Frew, A.J.; Svartengren, M.; Viegi, G. The need for a focus on air pollution research in the elderly. Eur. Respir. J. 2003, 21, 92S–95S. [Google Scholar] [CrossRef]
  77. Annesi-Maesano, I.; Agabiti, N.; Pistelli, R.; Couilliot, M.F.; Forastiere, F. Subpopulations at increased risk of adverse health outcomes from air pollution. Eur. Respir. J. 2003, 21, 57S–63S. [Google Scholar] [CrossRef]
  78. EPA. Integrated Science Assessment for Particulate Matter (Final Report). Available online: https://cfpub.epa.gov/ncea/risk/recordisplay.cfm?deid=216546 (accessed on 20 June 2022).
  79. EPA. Exposure Factors Handbook: 2011 Edition. Available online: https://nepis.epa.gov/Exe/ZyPURL.cgi?Dockey=P100LMCH.txt (accessed on 20 June 2022).
  80. Annesi-Maesano, I.; Hulin, M.; Lavaud, F.; Raherison, C.; Kopferschmitt, C.; de Blay, F.; André Charpin, D.; Denis, C. Poor air quality in classrooms related to asthma and rhinitis in primary schoolchildren of the French 6 Cities Study. Thorax 2012, 67, 682–688. [Google Scholar] [CrossRef]
  81. Clark, N.A.; Demers, P.A.; Karr, C.J.; Koehoorn, M.; Lencar, C.; Tamburic, L.; Brauer, M. Effect of Early Life Exposure to Air Pollution on Development of Childhood Asthma. Environ. Health Perspect. 2010, 118, 284–290. [Google Scholar] [CrossRef]
  82. Song, W.; Li, Y.; Hao, Z.; Li, H.; Wang, W. Public health in China: An environmental and socio-economic perspective. Atmos. Environ. 2016, 129, 9–17. [Google Scholar] [CrossRef]
  83. Whyte, M.K. Soaring Income Gaps: China in Comparative Perspective. Daedalus 2014, 143, 39–52. [Google Scholar] [CrossRef]
  84. Szaflarski, M. The Impact of Inequality: How to Make Sick Societies Healthier. Prev. Chronic Dis. 2005, 3, 477–479. [Google Scholar]
  85. Wright, T. The Political Economy of Coal Mine Disasters in China: “Your Rice Bowl or Your Life”. China Q. 2004, 179, 629–646. [Google Scholar] [CrossRef]
Figure 1. Flowchart for EJ assessment of PM2.5- and O3-attributable mortalities and Hg deposition: EI, emission inventory; EI-Hg, emission inventory of Hg.
Sustainability 14 10891 g001
Figure 2. Three-nested modeling domains (a) and the PRD region in the d03 (b). The dots in the d03 represent the national air quality monitoring stations in the PRD, in which the blue square dots represent the randomly selected national air quality monitoring stations to analyze the model performance. The PRD region was divided into nine cities: Guangzhou (GZ), Foshan (FS), Shenzhen (SZ), Zhuhai (ZH), Dongguan (DG), Zhongshan (ZS), Jiangmen (JM), Huizhou (HZ), and Zhaoqing (ZQ).
Sustainability 14 10891 g002
Figure 3. Statistical results of demographic vulnerability indicators in the PRD region.
Sustainability 14 10891 g003
Figure 4. Statistical results of environmental risk indicators in the PRD region.
Sustainability 14 10891 g004
Figure 5. Inequality curves of mortalities attributed to PM2.5 and O3 and Hg deposition based on the percentage of low-income (a) and elderly and children population groups (b).
Sustainability 14 10891 g005
Figure 6. Overlay map of overburdened areas with PM2.5, O3, and Hg pollution.
Sustainability 14 10891 g006
Figure 7. The district-level CERSs based on the % of low-income and elderly (≥65) and children (≤14) populations. Note: * DG and ZS are not further divided into districts by the Chinese government.
Sustainability 14 10891 g007
Table 1. CIs and t-test results of the environmental risk distributions based on the demographic vulnerability indicators.
Demographic Vulnerability IndicatorsEnvironmental Risk IndicatorsCIt-Test Results on CI
t-Value
(Ref: 2.01)
p-Value
(Ref: 0.05)
95% Confidence Interval
% of the population with low incomeMortality_PM2.50.355.67<0.001(0.23, 0.47)
Mortality_O30.325.67<0.001(0.21, 0.43)
Deposition_Hg0.165.66<0.001(0.10, 0.22)
% of elderly (≥65) and children (≤14)Mortality_PM2.50.395.93<0.001(0.26, 0.52)
Mortality_O30.365.94<0.001(0.24, 0.49)
Deposition_Hg0.235.92<0.001(0.15, 0.30)
Note: If the absolute value of the t-value is greater than 2.01 or the p-value is less than 0.05, then it suggests that there is a significant difference in the CI.
Publisher’s Note: MDPI stays neutral with regard to jurisdictional claims in published maps and institutional affiliations.

