Article

A Thorough Emission-Cost Analysis of the Gradual Replacement of Carbon-Rich Fuels with Carbon-Free Energy Carriers in Modern Power Plants: The Case of Cyprus

by
Pavlos Nikolaidis
1 and
Andreas Poullikkas
2,*
1
Department of Electrical Engineering, Cyprus University of Technology, 3036 Limassol, Cyprus
2
Cyprus Energy Regulatory Authority, 1305 Nicosia, Cyprus
*
Author to whom correspondence should be addressed.
Sustainability 2022, 14(17), 10800; https://doi.org/10.3390/su141710800
Submission received: 31 July 2022 / Revised: 22 August 2022 / Accepted: 24 August 2022 / Published: 30 August 2022

Abstract

:
Global efforts towards de-carbonization give rise to remarkable energy challenges, which include renewable energy penetration increase and intermediate energy carriers for a sustainable transition. In order to reduce the dependence on fossil fuels, alternative sources are considered by commodities to satisfy their increasing electricity demand, as a consequence of a rise in population and the quantity of residential appliances in forthcoming years. The near-term trends appear to be in fuel and emission reduction techniques through the integration of carbon capture and storage and more efficient energy carriers, exploiting alternative energy sources, such as natural gas and hydrogen. Formulating both the fuel consumption and emission released, the obtained experimental results showed that the total production cost can be reduced by making use of natural gas for the transition towards 2035’s targets. Maximum profits will be achieved with hydrogen as the only fuel in modern power plants by 2050. In this way, the lowest electricity production can be achieved as well as the elimination of carbon dioxide emissions. Since the integration of renewable energy resources in the sectors of electricity, heating/cooling and transportation will continuously be increased, alternative feedstocks can serve as primary inputs and contribute to production cost profits, improved utilization factors and further environmental achievements.

1. Introduction

Climate change has attracted great attention worldwide. The greenhouse effect is responsible for changes in the world, forcing many countries to implement strategies to reduce greenhouse gas (GHG) emissions, especially those of carbon dioxide (CO2) [1,2]. On the other hand, the fossil fuels utilized by conventional power plants are decreasing, calling for increased penetration levels of renewable energy for the electricity, heating/cooling and transportation sectors, which account for 51%, 32% and 17% of the total final energy consumption, respectively [3,4]. Up to a certain share, the conventional generating units can adequately adjust the produced power to the variable load demand [5]. At higher renewable levels, they occur inadequately, exposing the operational and technical limitations of modern power systems.
As the target for integrating renewable energy sources (RES) becomes higher, the challenges to retain the system stability and reliability at reasonable cost grow as well. Specifically, the volatile and uncertain potential availability of RES has led many researchers to explore the feasibility of large-scale storage options [6,7]. However, the aim is to identify the feasibility of a 100% renewable energy system by 2050 and promote (1) technologies for energy conservation on the demand side [8], (2) power plant upgrades by gradual replacement of fossil fuels with renewable resources [9] and (3) production efficiency improvements [10]. For the long-term treatment of the environmental burden and climate change, the European Union imposed on member states a reduction in GHG emissions by 50% and an enhancement of RES penetration in the order of 50% by 2030, compared to their 1990s levels [11,12]. This forms a complicated challenge especially for islanded and isolated systems where imported fuels cost considerably more than in mainland areas.
Depending on the renewable energy potential, each member state is called upon to assess its individual domestic technologies. As a result, production, storage, conversion and delivery to the grid must be combined to provide sustainable solutions and make the targets achievable. To ameliorate the dependency on imported fossil fuels and conserve an appropriate utilization factor of the expensive power plants, many countries have turned to the gradual replacement of carbon-rich fuels with cleaner alternatives [13]. These mainly include natural gas (CH4) and hydrogen (H2) for electricity production, while the primary sources used for heating are liquefied petroleum gas (LPG) and biomass feedstocks. Finally, before turning to fully electrified transportation, an intermediarytransition to biofuels seems to be a promising solution.
Putting a price on carbon released during energy conversion, international markets reshape incentives and reduce the value of emissions, forming an appealing tool to regulate pollution [14]. To deal with the emission-constrained unit commitment and economic dispatch problems in the electricity industry, some representative studies performed are summarized as follows. The authors in [15] proposed a novel hybrid approach based on a grey wolf optimizer, a sine–cosine mechanism and a crow search algorithm applied on a three-unit stand-alone micro-grid system. A mixed binary-continuous particle swarm optimization algorithm was presented in [16] for the optimal unit commitment in microgrids considering uncertainties and emissions. A similar work found in [17] proposed the binary Jaya algorithm to formulate and solve the economic/environmental unit commitment problem. All studies concluded that the generation cost decreases in the presence of renewable energy. However, above a certain share, electricity storage is needed in order to retain the security and reliability of supply. In this way, realistic or simulated power networks have been assessed in the presence of renewable resources to lower gaseous emissions rather than eliminating them.
A formulation based on a genetic algorithm-priority list strategy was demonstrated by the authors in [18]. In the presence of storage, more operational constraints have to take place in order to recover the capital costs, including power balance, spinning reserve, minimum up and down times, ramping capability and so on. The robustness of the proposed solution is achieved by making use of the Taguchi orthogonal arrays technique. Apart from storage, a host of other smart-grid technologies are investigated in stochastic multi-objective unit commitments from the emission perspective. These technologies include plug-in electric vehicles, demand response programs, demand-side management and distributed generation systems [19]. Towards this goal, a practical approach for profit-based unit commitment with emission limitations is presented in [20], while [21] provides a solution based on a modified Lagrange relaxation combined with Henry gas solubility optimization. The objective of the latter was the minimization of the emission and operating cost. Exhaustive efforts in research found that the marginal benefits achieved by the reduction in GHG emissions must be equal at least to the marginal costs [22]. Based on the extensive literature, the impact of firm, low-carbon electricity resources in deep de-carbonization systems has not yet properly assessed. None of these studies has explored the potential of replacing conventional fuels by making use of the existing equipment in real-world scenarios.
To motivate the development of novel methods for methane and hydrogen production, further studies should be conducted to determine the effects of their involvement in electricity generation processes. This study provides an introduction to the working principles pertaining to the main technologies utilized for electricity generation in thermal power plants. The main fuel types used as imports are presented and their impact is quantified on a GHG emission target. Moreover, a deep understanding relating to the formulation of emission cost coefficients is offered for various fuel types and a comprehensive estimation of their impact on total production cost is realized. Specifically, a thorough analysis is performed based on generation schedules and two transitional scenarios are analyzed concerning the 2035 and 2050 EU targets. The results are discussed and demonstrated graphically.
In the following section, a brief description of the major thermal-to-power principles is provided along with their main characteristics and limitations. Section 3 presents the emission cost formulation for the case studies. The results of the performed analysis are provided in Section 4, while the conclusions are included in Section 5.

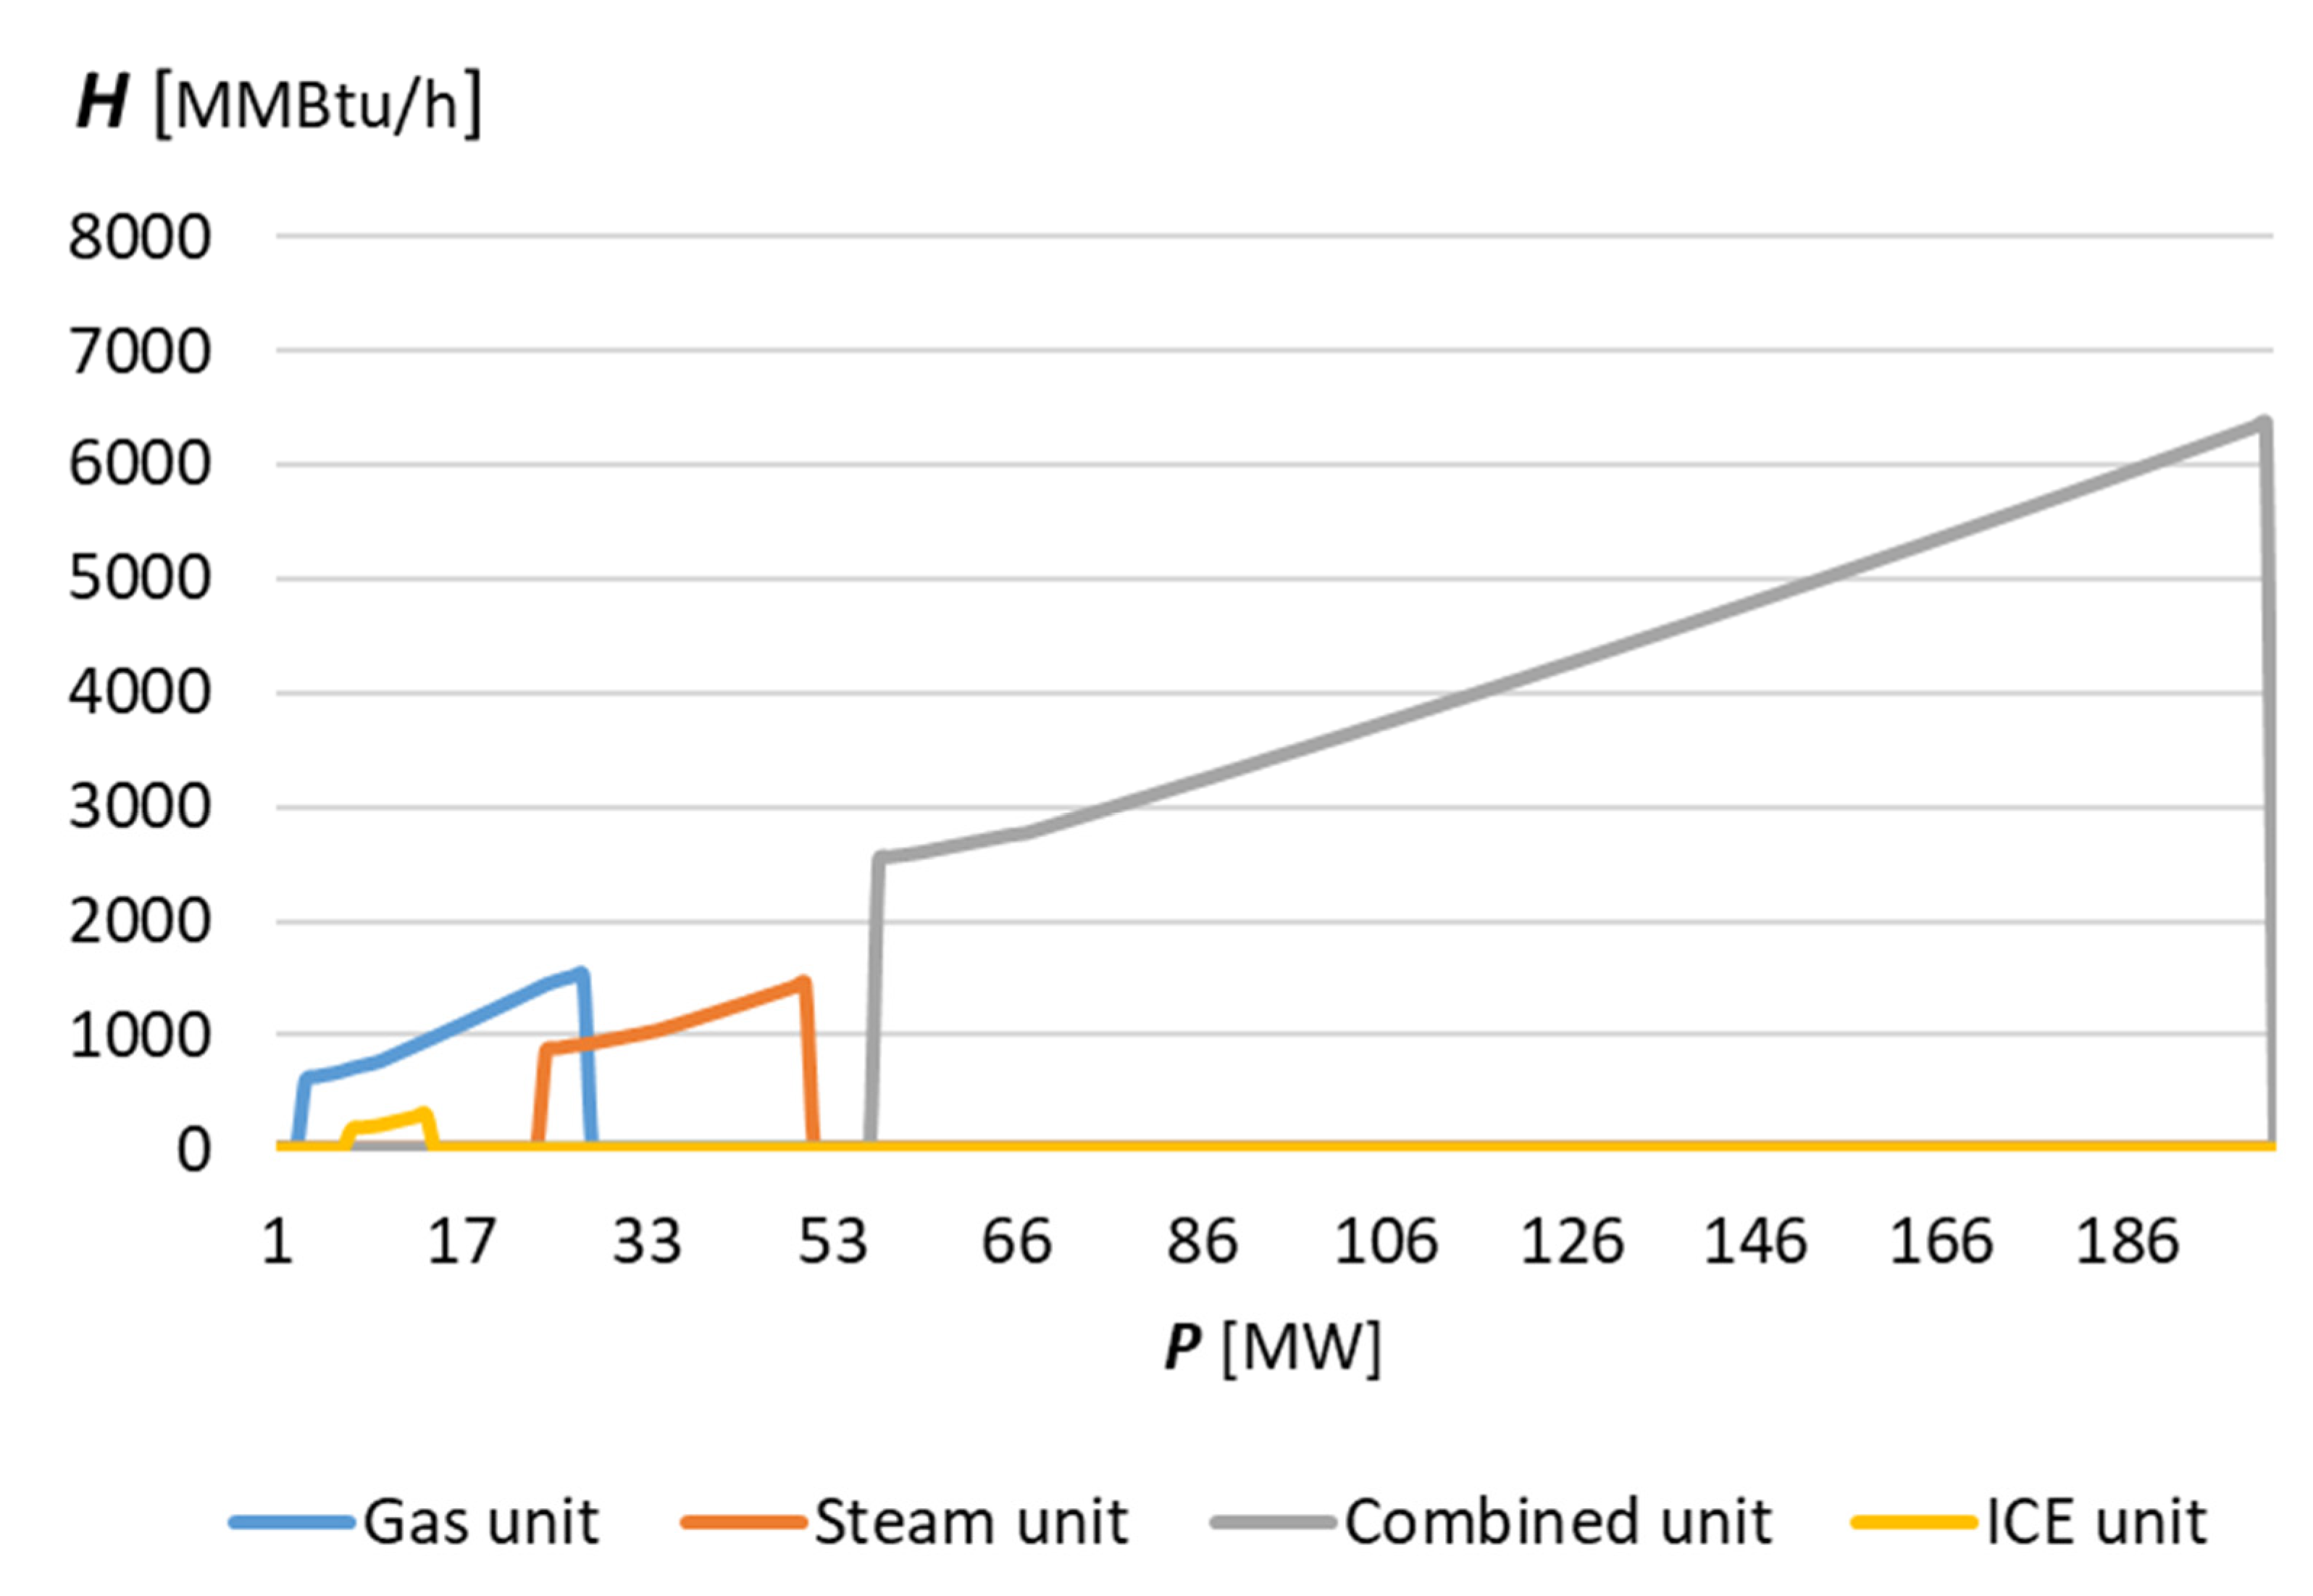
2. Thermal-to-Power Generation Technologies

The requirement to replace the currently exploited energy sources while meeting increasing demand leads to the exploration of their principal characteristics and their conversion technologies. Thermal power plants are used as base stations and constitute the most economical candidate for generating large amounts of electricity, with parallel operation of different technologies. In order for the electrical energy to be produced, a rotating electromagnetic field must be evolved with the aid of a rotor, to induce potential difference (V) at the steady part of the generator, namely the stator. The rotational movement of the rotor is performed via turbines in series and according to the applied force that produces the required work, and the commonly used technologies are classified into steam turbines, gas turbines, combined cycle units and internal combustion engines.

2.1. Steam Units

In their most typical form, steam units consist of a boiler, a turbine and a condenser. The fuel (coal, oil, etc.) is injected into the boiler and the flowing water is heated until its evaporation up to the required temperature and pressure rates. The super-heated steam is expanded to the turbine which in turns rotates in series with a generator enabling electricity production. The water vapor continues its flow towards the condenser where it is liquefied, completing a Rankine cycle. This is also known as the closed-loop generation since the water is recycled and reused based on the discussed process. The main advantages of this technology are the ability to operate for a long time and the cheap electricity production cost. However, it shows some installation site-selection problems due to the prospect of expansion, fuel transportation costs, access to water sources, greenhouse gas release, and so on.
The main operations can be briefly explained with the help of Figure 1 as follows:
  • Boiler: where the combustion takes place by heating the water until it evaporates
  • Turbine: which is set in motion by the release of steam which is then liquefied
  • Condenser: which directs the hot water to the boiler for reheating and evaporation
  • Cooling tower: where the water liquefaction is realized based on the temperature difference (otherwise the system must be cooled via pumped water from a river or the open sea)
  • Pump: to redirect the liquefied water back to the boiler
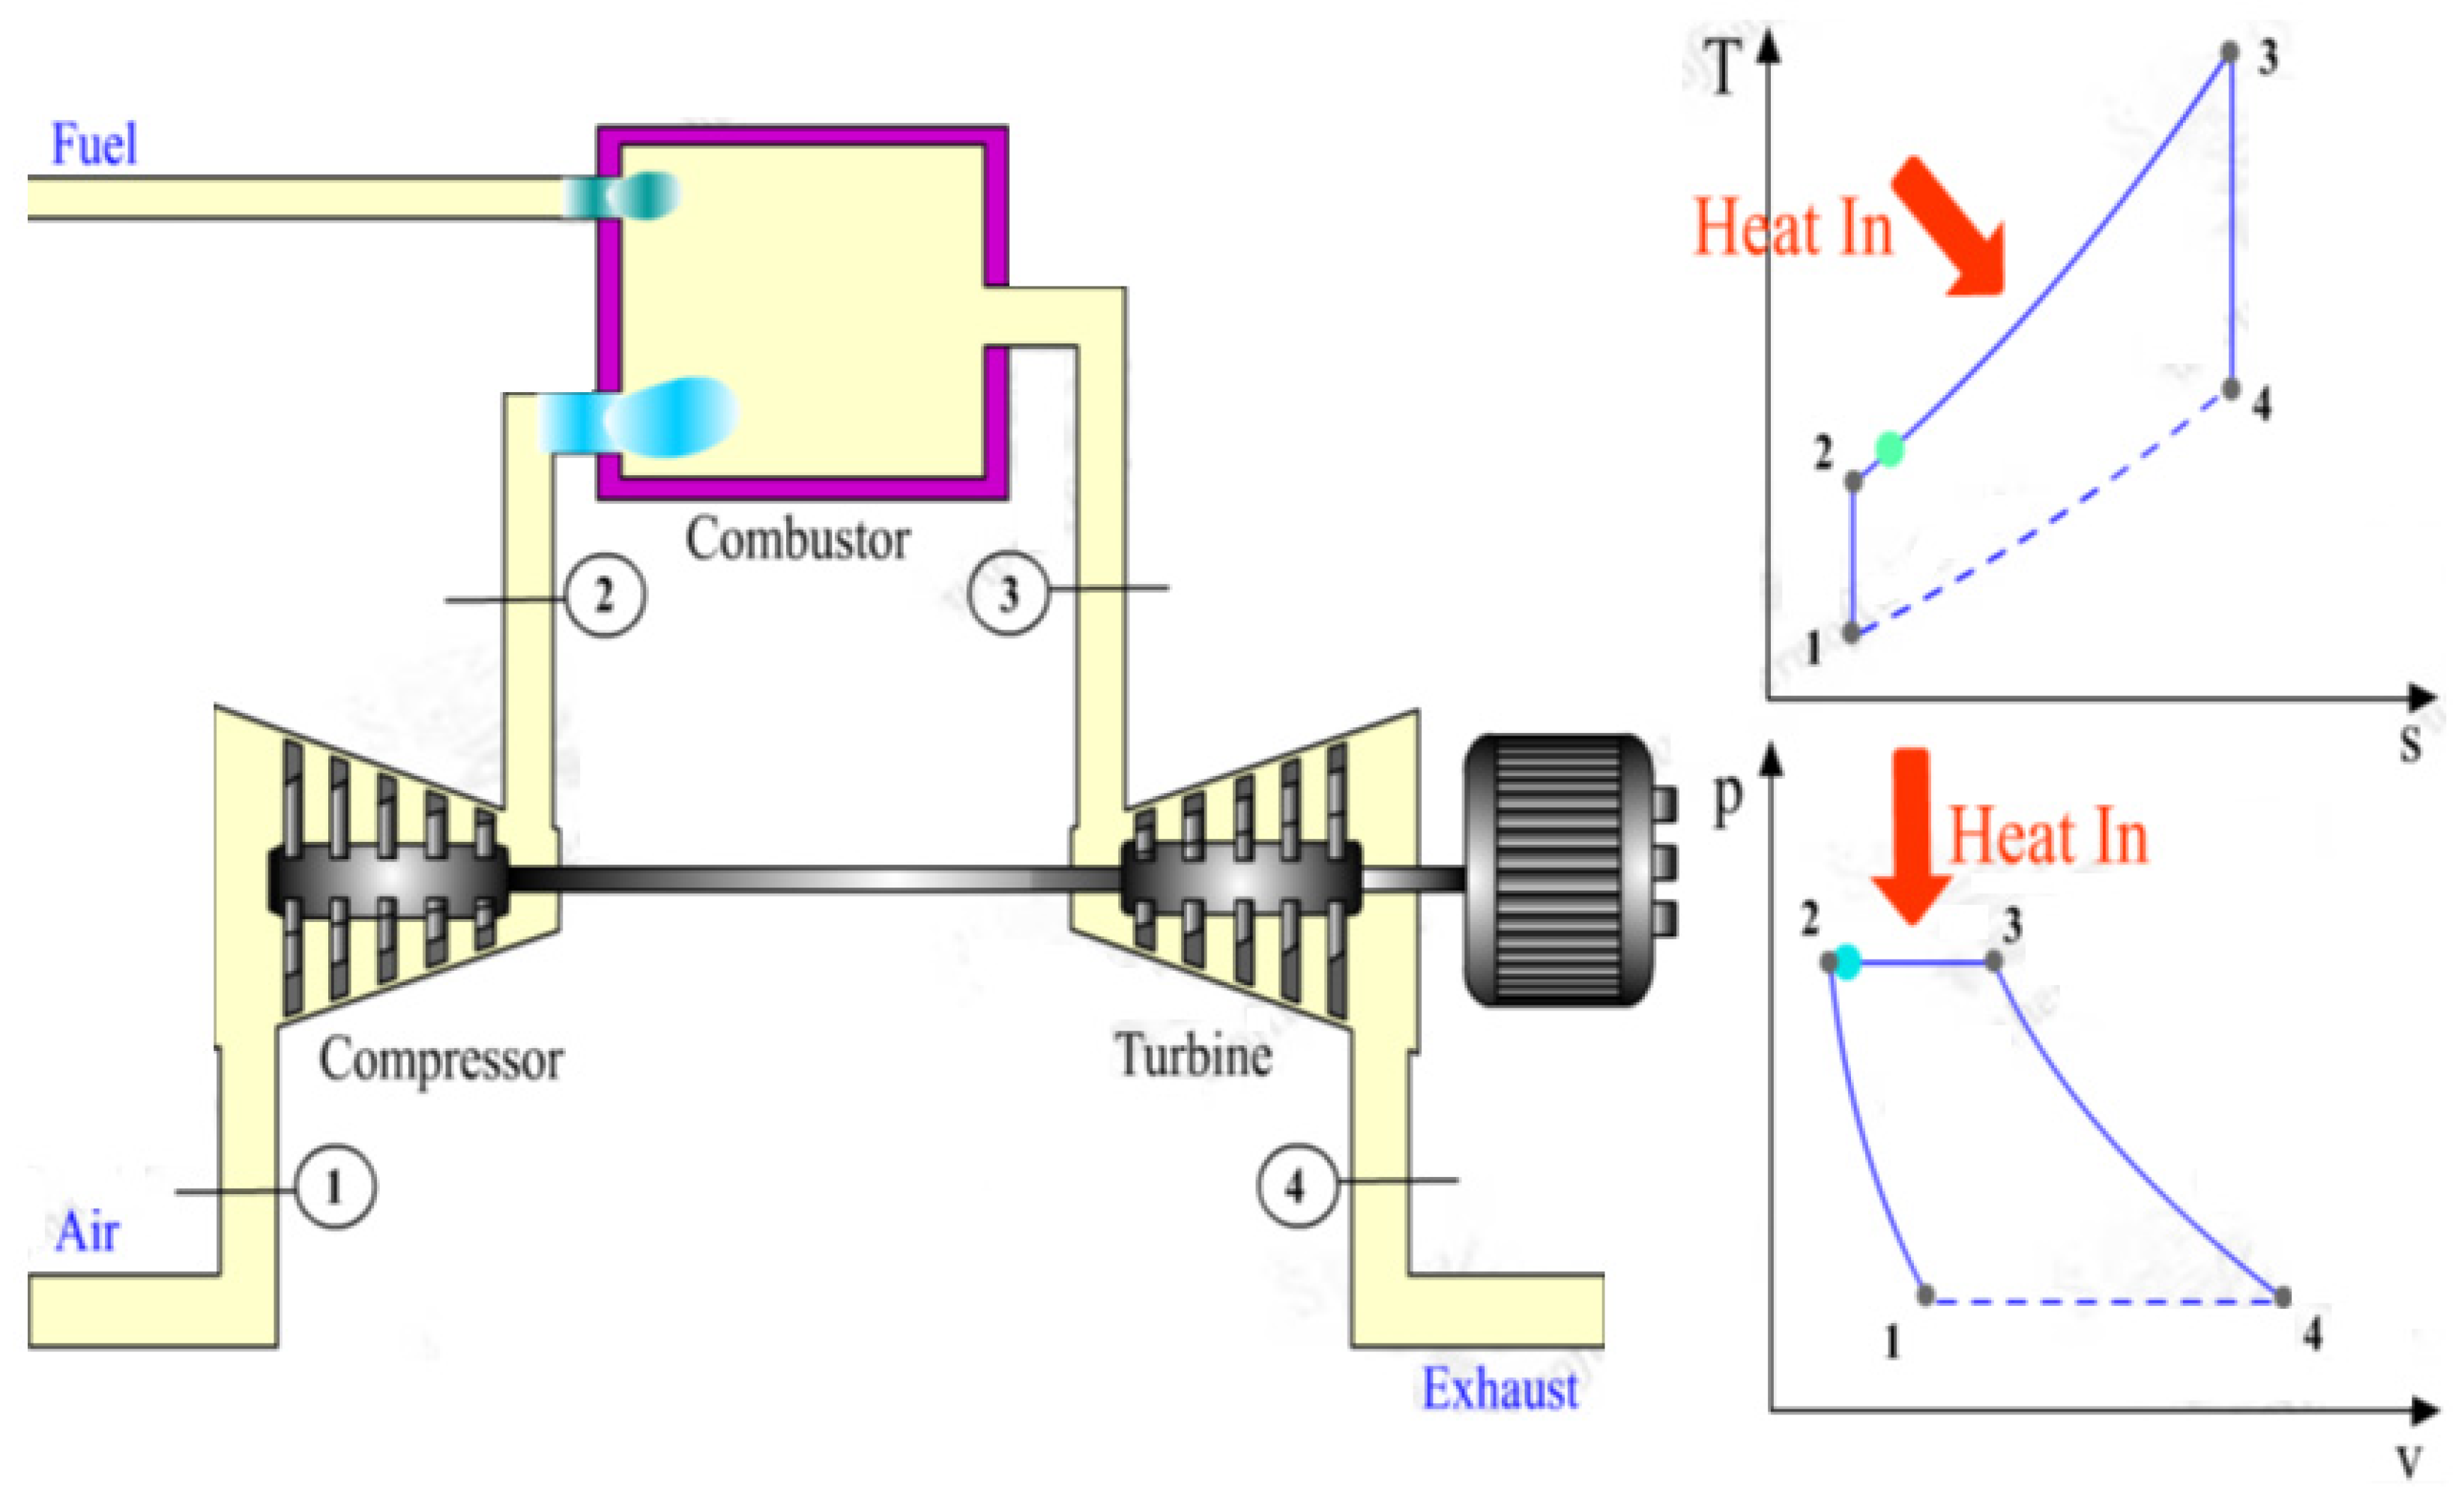
The rated 34–40% efficiency can be improved by 4–5%, either by increasing the average temperature of the transferred heat to the working fluid or by decreasing the average temperature of the rejected heat from the working fluid in a condenser [24]. However, elevated temperatures are limited by metallurgical considerations, while lower condenser pressures increase the moisture content of the steam. A solution to the mentioned effects is given by reheating the steam so that it is expanded in the turbine in two stages. Figure 2 shows the reheating process of the so-called reheat Rankine cycle.

2.2. Gas Units

A typical thermal generation unit based on gas turbines is composed of the fuel burner, the turbine and a compressor, as illustrated in Figure 3. Initially, the system withdraws electrical energy from the grid and the generator operates in motor mode. The motor rotates the compressor which is in series to produce the required air flow to the burner. There, the fuel is introduced and combusted to transfer the required heat to the flowing air and, when the super-heated gases acquire the needed temperature and pressure, they are directed to the turbine. The turbine enables electricity production through the serial connected generator and once the system becomes autonomous, the motor changes over to the generation mode.
The main operations and basic elements are presented below:
  • Burner: where combustion takes place and the exhaust gases are led to the turbine
  • Turbine: which is set in motion by the release of exhaust gases which are then released into the atmosphere
Similar to steam-turbine generators, gas turbines also offer the ability to operate for a long time at the expense of site selection problems for their installation including the prospect of expansion, fuel transportation costs, access to water sources and GHG emissions

2.3. Combined-Cycle Units

The generators falling into this category exploit the combined, working principles of a closed-loop Rankine and open Brayton cycle via an appropriately designed heat exchanger as depicted in Figure 4.
The basic elements of a combined-cycle system are summarized as follows:
  • Gas turbine: after being released by moving the gas turbine, the exhaust gases pass through a heat exchanger and are then released into the atmosphere
  • Steam turbine: the heat recovery from the exchanger evaporates the passing water and the vapors are released giving movement to the steam turbine
The merits relating to the combined cycle generating units are the optimal heat utilization, lower return temperature to the environment and consequent increased efficiency. On the other hand, concerns exist with respect to the precise heat exchanger design.

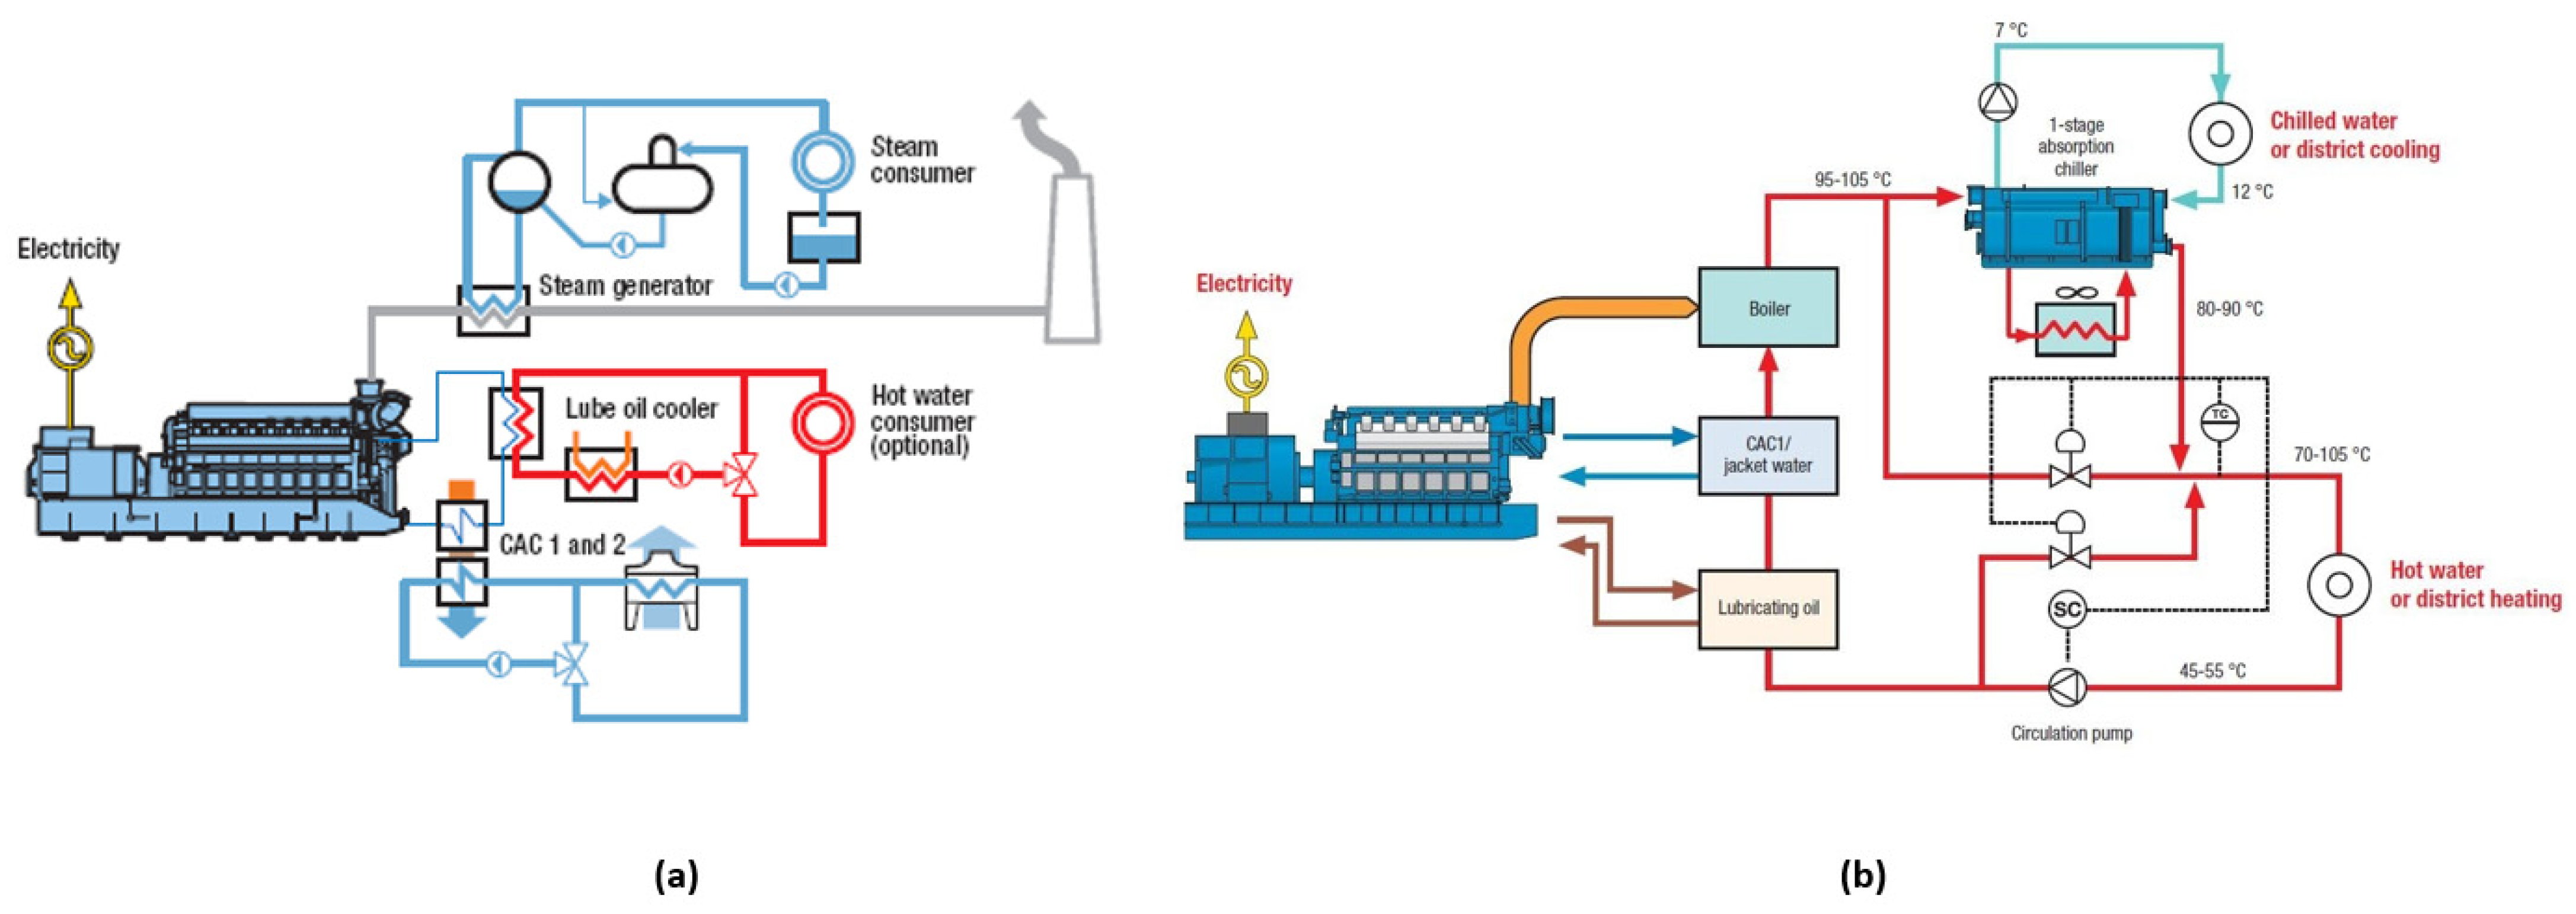
2.4. Internal Combustion Engines (ICE)

In contrast to gas turbines that imitate the engines used in aircrafts, internal combustion engines follow the exact operating principles used in transportation vehicles with the difference being at the final work exploitation. They are usually installed in areas with low demand where the installation of other technologies is considered unprofitable. In thermal power plants they have mainly a backup role to recover peak loads. By burning a mixture of fuel, pressures are exerted on pistons that, with appropriate mechanisms, cause the generator to rotate. A four-stroke configuration of an ICE plant is presented in Figure 5. The fuel together with the air is introduced into the intake stroke as the piston moves downwards. When the piston goes upwards, the mixture is compressed in the compression stroke, and it is ignited in the combustion and power stroke forcing the piston downwards. Finally, the last stroke takes place to release the waste gases out of the cylinder [23].
ICE plants perform advantageously in terms of installation complexity and space requirements, time of response and ease of operation. Their main disadvantages are that they present frequent failures and require periodical maintenance. However, apart from conventional hydrocarbons, hydrogen-based renewable fuels such as biogas (H2-CH4-CO), ammonia (NH3), methanol (CH4O) and hydrogen can be used directly [26]. In this way, an opportunity is given to improve the overall efficiency by making use of the produced work and heat recovery among multiple energy activities. Hence, the achieved efficiency of 56% can be further enhanced via co-generation (combined heat and power) and tri-generation (combined cooling, heating and power) systems to near 83% [25,27]. Figure 6 presents two paradigms via which the concept of co-generation and tri-generation can be explained.

3. Fuel Diversity and Combustion Pollutants

As stated in the introductory section, each storage system is considered appropriate only for a narrow range of applications [28,29,30,31]. However, taking into consideration the future, growing contribution of stochastic RES it is clear that no single electricity storage technology could be used to fully satisfy a whole sector. The most important challenges for electricity storage systems are to conserve the energy stored for extended periods of time and supply it by responding rapidly when required [32]. Therefore, several studies in their attempt to promote a clean, reliable, sustainable and secure alternative to traditional fossil fuels were focused on carbon capture and sequestration (CCS) mechanisms and hydrogen (H2) technology [33,34].
Unlike traditional fuels, hydrogen is not readily available in nature. Nevertheless, it can be generated from any primary source and utilized as a fuel in gas turbines, internal combustion engines or fuel cells, producing water as the only byproduct. Possessing carbon-free and extremely high energy content, compared to other fuels, hydrogen is globally accepted as an environmentally benign renewable energy carrier and alternative to conventional fuels [35]. A further advantage is that it can be safely transported by conventional means and used for domestic consumption supported by various storage methods [36].
Anthropogenic carbon dioxide (CO2) emissions weighted by global warming potentials constitute the largest portion of GHG emissions. Within this range, the emissions derived from fuel combustion constitute the great majority, providing the ability to be directly and immediately estimated from the activities of combustion [37]. In this section, an attempt is undertaken to evaluate the emission impact on the total production cost based on power generation modeling and optimal scheduling.

3.1. Cost Function Formulation

Generally, the total electricity generation cost is calculated based on the fuel consumption f(Pi) and unit start-up cost SUi. The proposed methods aim at delivering optimal schedules in terms of unit commitment status (U) and economic dispatch (P) pertaining to the available number of generators (N) during different time frames (T). This objective is mathematically formulated as follows [38,39,40]:
T P C = i = 1 N t = 1 T U i t [ f ( P i t ) + S U i t ]
The optimal solution is obtained under different technical and generational constraints including:
  • system power balance: the total power produced by generating units must satisfy the total electricity demand (PD)
  • spinning reserve margins (SR): the maximum capacity (Pmax_cap) of the synchronized (on-line) generators must account for forecast errors with respect to load and renewable contribution as well as for a probable generation failure
  • capacity limits: each generator must operate within its minimum (Pmin) and maximum (Pmax) boundaries
  • minimum up (MU) and down (MD) times: each generator can change its status once the minimum required time elapsed
  • maximum ramp up (RU) and down (RD) capability: each generator possesses a maximum positive and negative rate of change of its power output
  • conditional restrictions: due to environmental and economic issues some units may fall in the must-run, must-out and run at fixed-MW output
Consequently, the optimal solution refers to those values (binary and continuous) which enable the most economical demand satisfaction. This way, the Equation (1) can be rewritten as:
( U * , P * ) = a r g m i n ( T P C )   s o   t h a t   { c 1 c 2 c 3 c 4 c 5 c 6   e
The fuel costs depend on the output generation level of each generator and some predefined coefficients a, b and c. These coefficients are retrieved by the quadratic function utilized to express the heat-rate curve of each generator multiplied by the specific fuel cost used in each case [41]. Figure 7 illustrates an example of four different technologies found in [42] and described in the previous section.
In real-world conditions, the heat-rate curves are initially provided by manufacturers and typically reconstructed every time a new fuel receiving takes place. Once the heat-rate curves are constructed, the coefficients can be retrieved and the respective fuel cost is obtained based on Equation (3), where fi is the specific fuel cost.
f ( P i t ) = f i ( a i P i t 2 + b i P i t + c i )

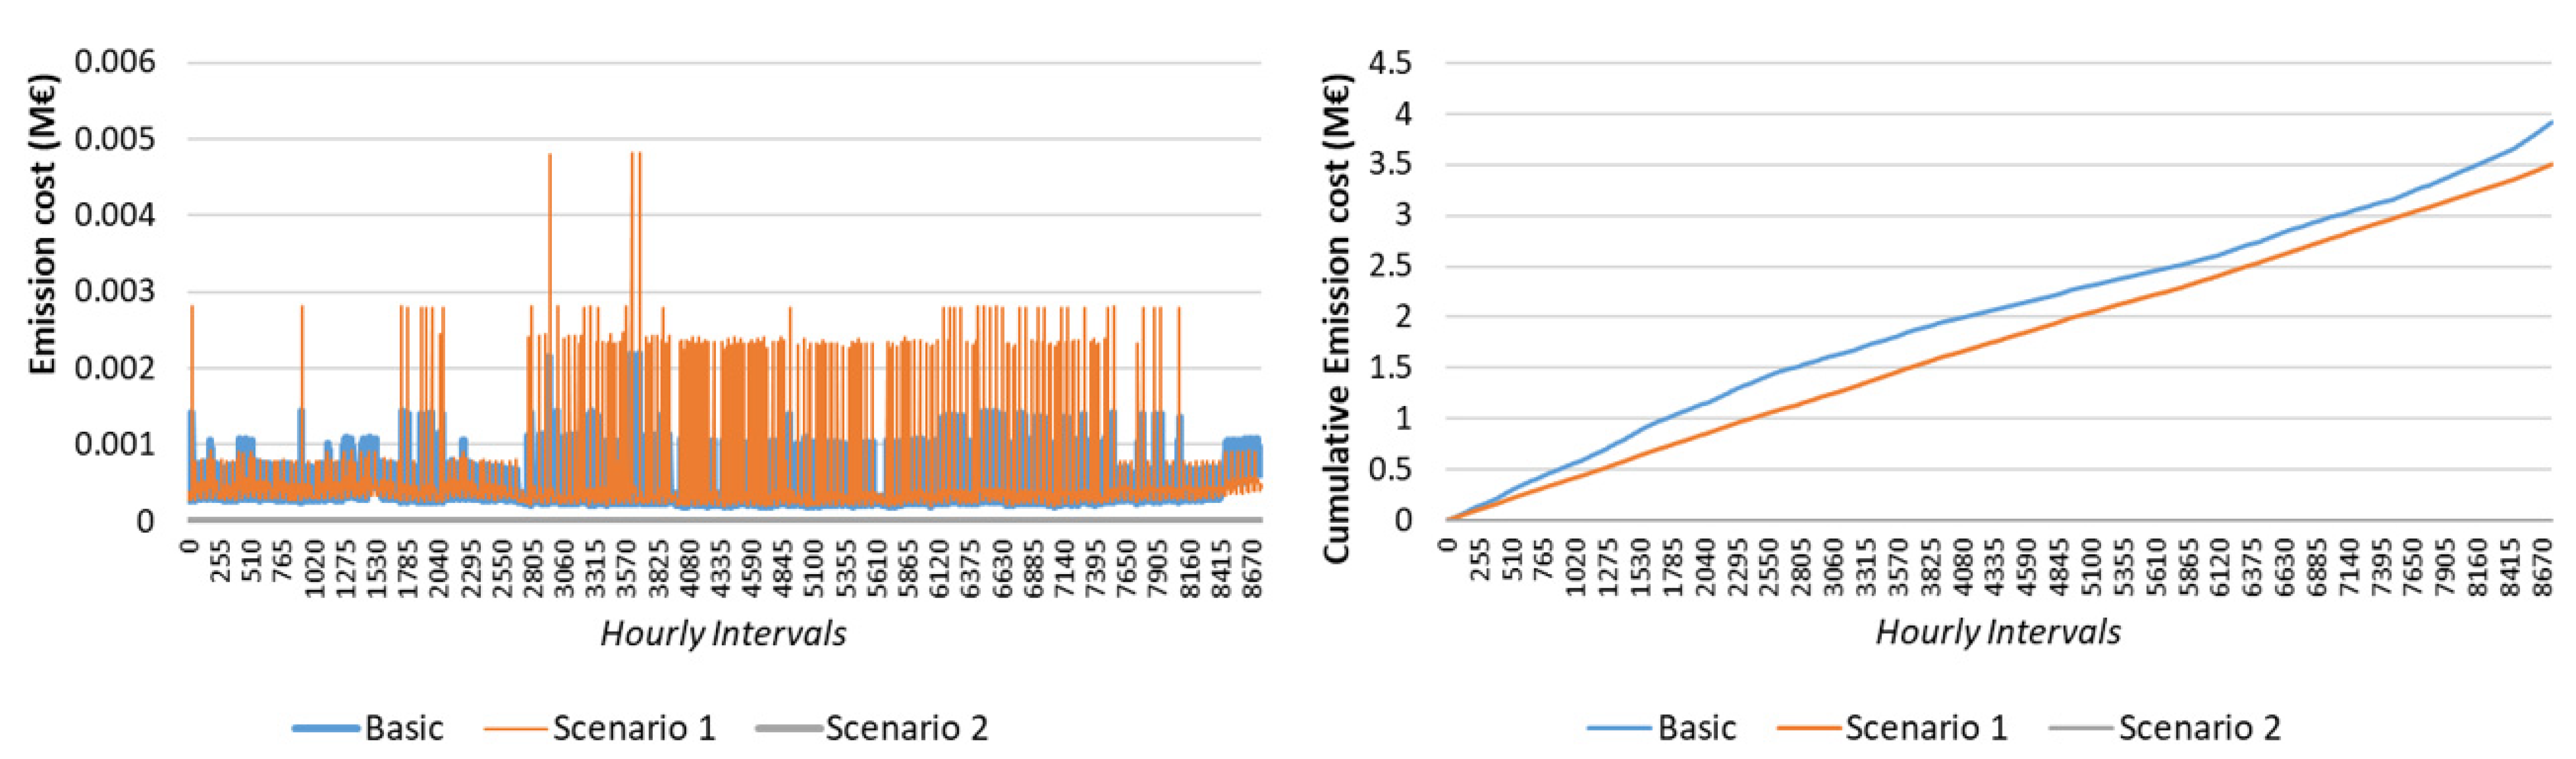
3.2. Emission Function Formulation

A second formulation is needed to include the emission cost impact in the objective and estimate the amount of carbon released into the atmosphere. In fact, in quantitative assessments for the fuel combustion process it is standard practice to express this amount by the equivalent mass of CO2 released. Although the great majority of GHG is due to CO2, carbon monoxide (CO), methane (CH4), nitrogen oxides (NOx) including NO and NO2, sulphur oxides (SOx), non-methane volatile organic compounds (NMVOCs), such as benzene, xylene, propane and butane, and other matter particulates (PMs) also occur as by-products in combustion reactions.
Assuming that modern power plants follow strict practices towards de-sulfurization and that NOx only occur at very specific conditions, under ideal combustion conditions (complete combustion) the whole quantity of fuel is converted into useful energy (thermal in our case), CO2 and water (H2O). To this end, the following chemical reactions are listed, representing the combustion of heavy fuel oil (HFO), diesel, natural gas (NG) and hydrogen. It is noted that the chemical composition of HFO varies according to the extent of mixing or blending with cleaner fuels. Blended streams may include carbon numbers from x = 20 to greater than x = 50 [43,44].
HFO :   C x H y + ( x + y 4 ) O 2     xCO 2 + y 2 H 2 O
Diesel oil: C13H28 + 20O2 → 13CO2 + 14H2O
NG: CH4 + 2O2 → CO2 + 2H2O
Hydrogen: 2H2 + O2 → 2H2O
Apart from the hydrogen, the carbon in fossil fuels produces carbon dioxide when utilized for heat raising. The underlying equation that estimates the amount released is as follows:
C r [ t C k g f ] = 1 k g . q . N C V f . E F f . ( 1 S f ) . F f
q: quantity of carbon released and attributed to fuel combustion q = 44 12 for CO2. NCV: net calorific value of fuel (MJ/kg). EF: emission factor (tC/TJ). S: carbon storage factor. F: oxidation factor.
Based on this formulation, Table 1 shows the obtained rates, namely the amount of carbon released (in tonnes) if 1 kg of fuel subjected to combustion generates 1 kg of molar CO2. To determine the actual amount of CO2 released based on the balanced combustion reactions, the stoichiometric coefficient Mr is taken into account, converting q into Q = M r · q .
To estimate the total amount of carbon emissions, the total fuel consumption can be computed via the following equation:
m f = H ( a f , b f , c f ) N C V f
As a result, the total emission cost stems from the product of total carbon released and specific emission cost ec, which in the case of CO2 is assumed to be 5 €/t [38], as shown below:
m f . C r . e c = H ( a f , b f , c f ) N C V f . C r f .5 · 10 3
Finally, the objective function of Equation (1) can be transformed (into Equation (7)) to include the emission cost coefficients which are presented in Equation (8).
T P C = i = 1 N t = 1 T U i t [ F ( P i t ) + E ( P i t ) + S U i t ]
E ( P i t ) = e c ( a i P i t 2 + b i P i t + c i )

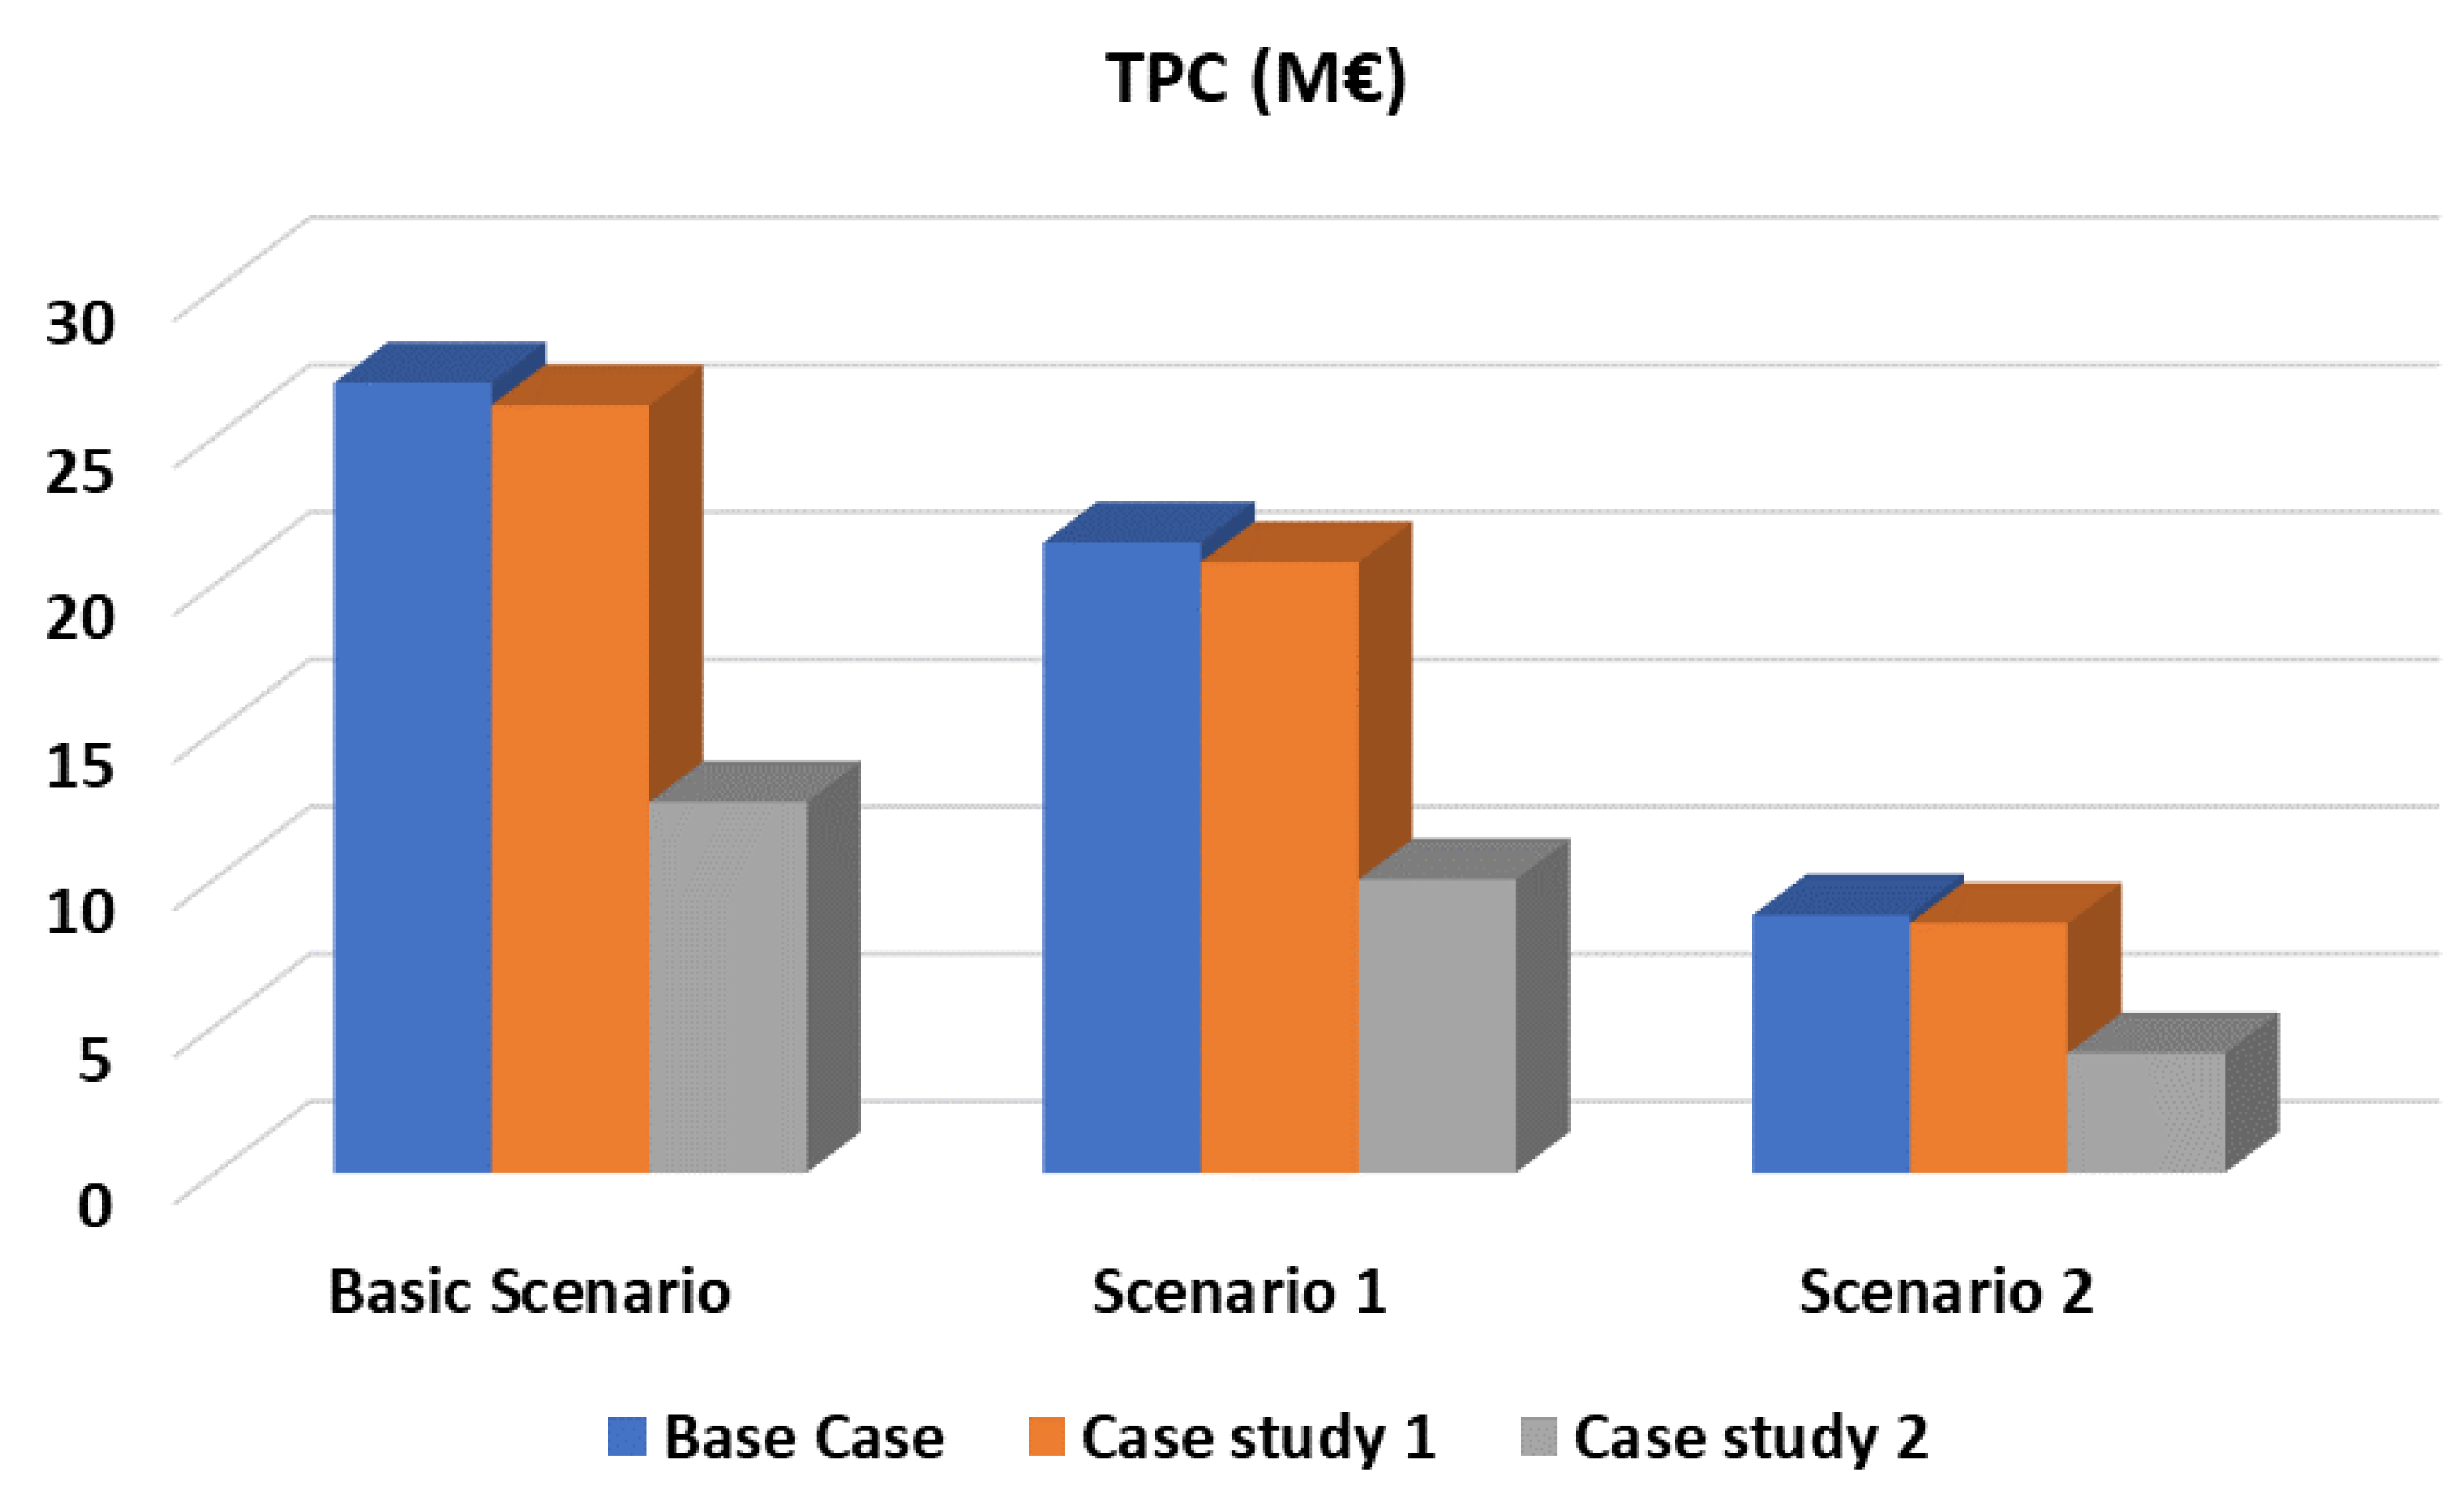
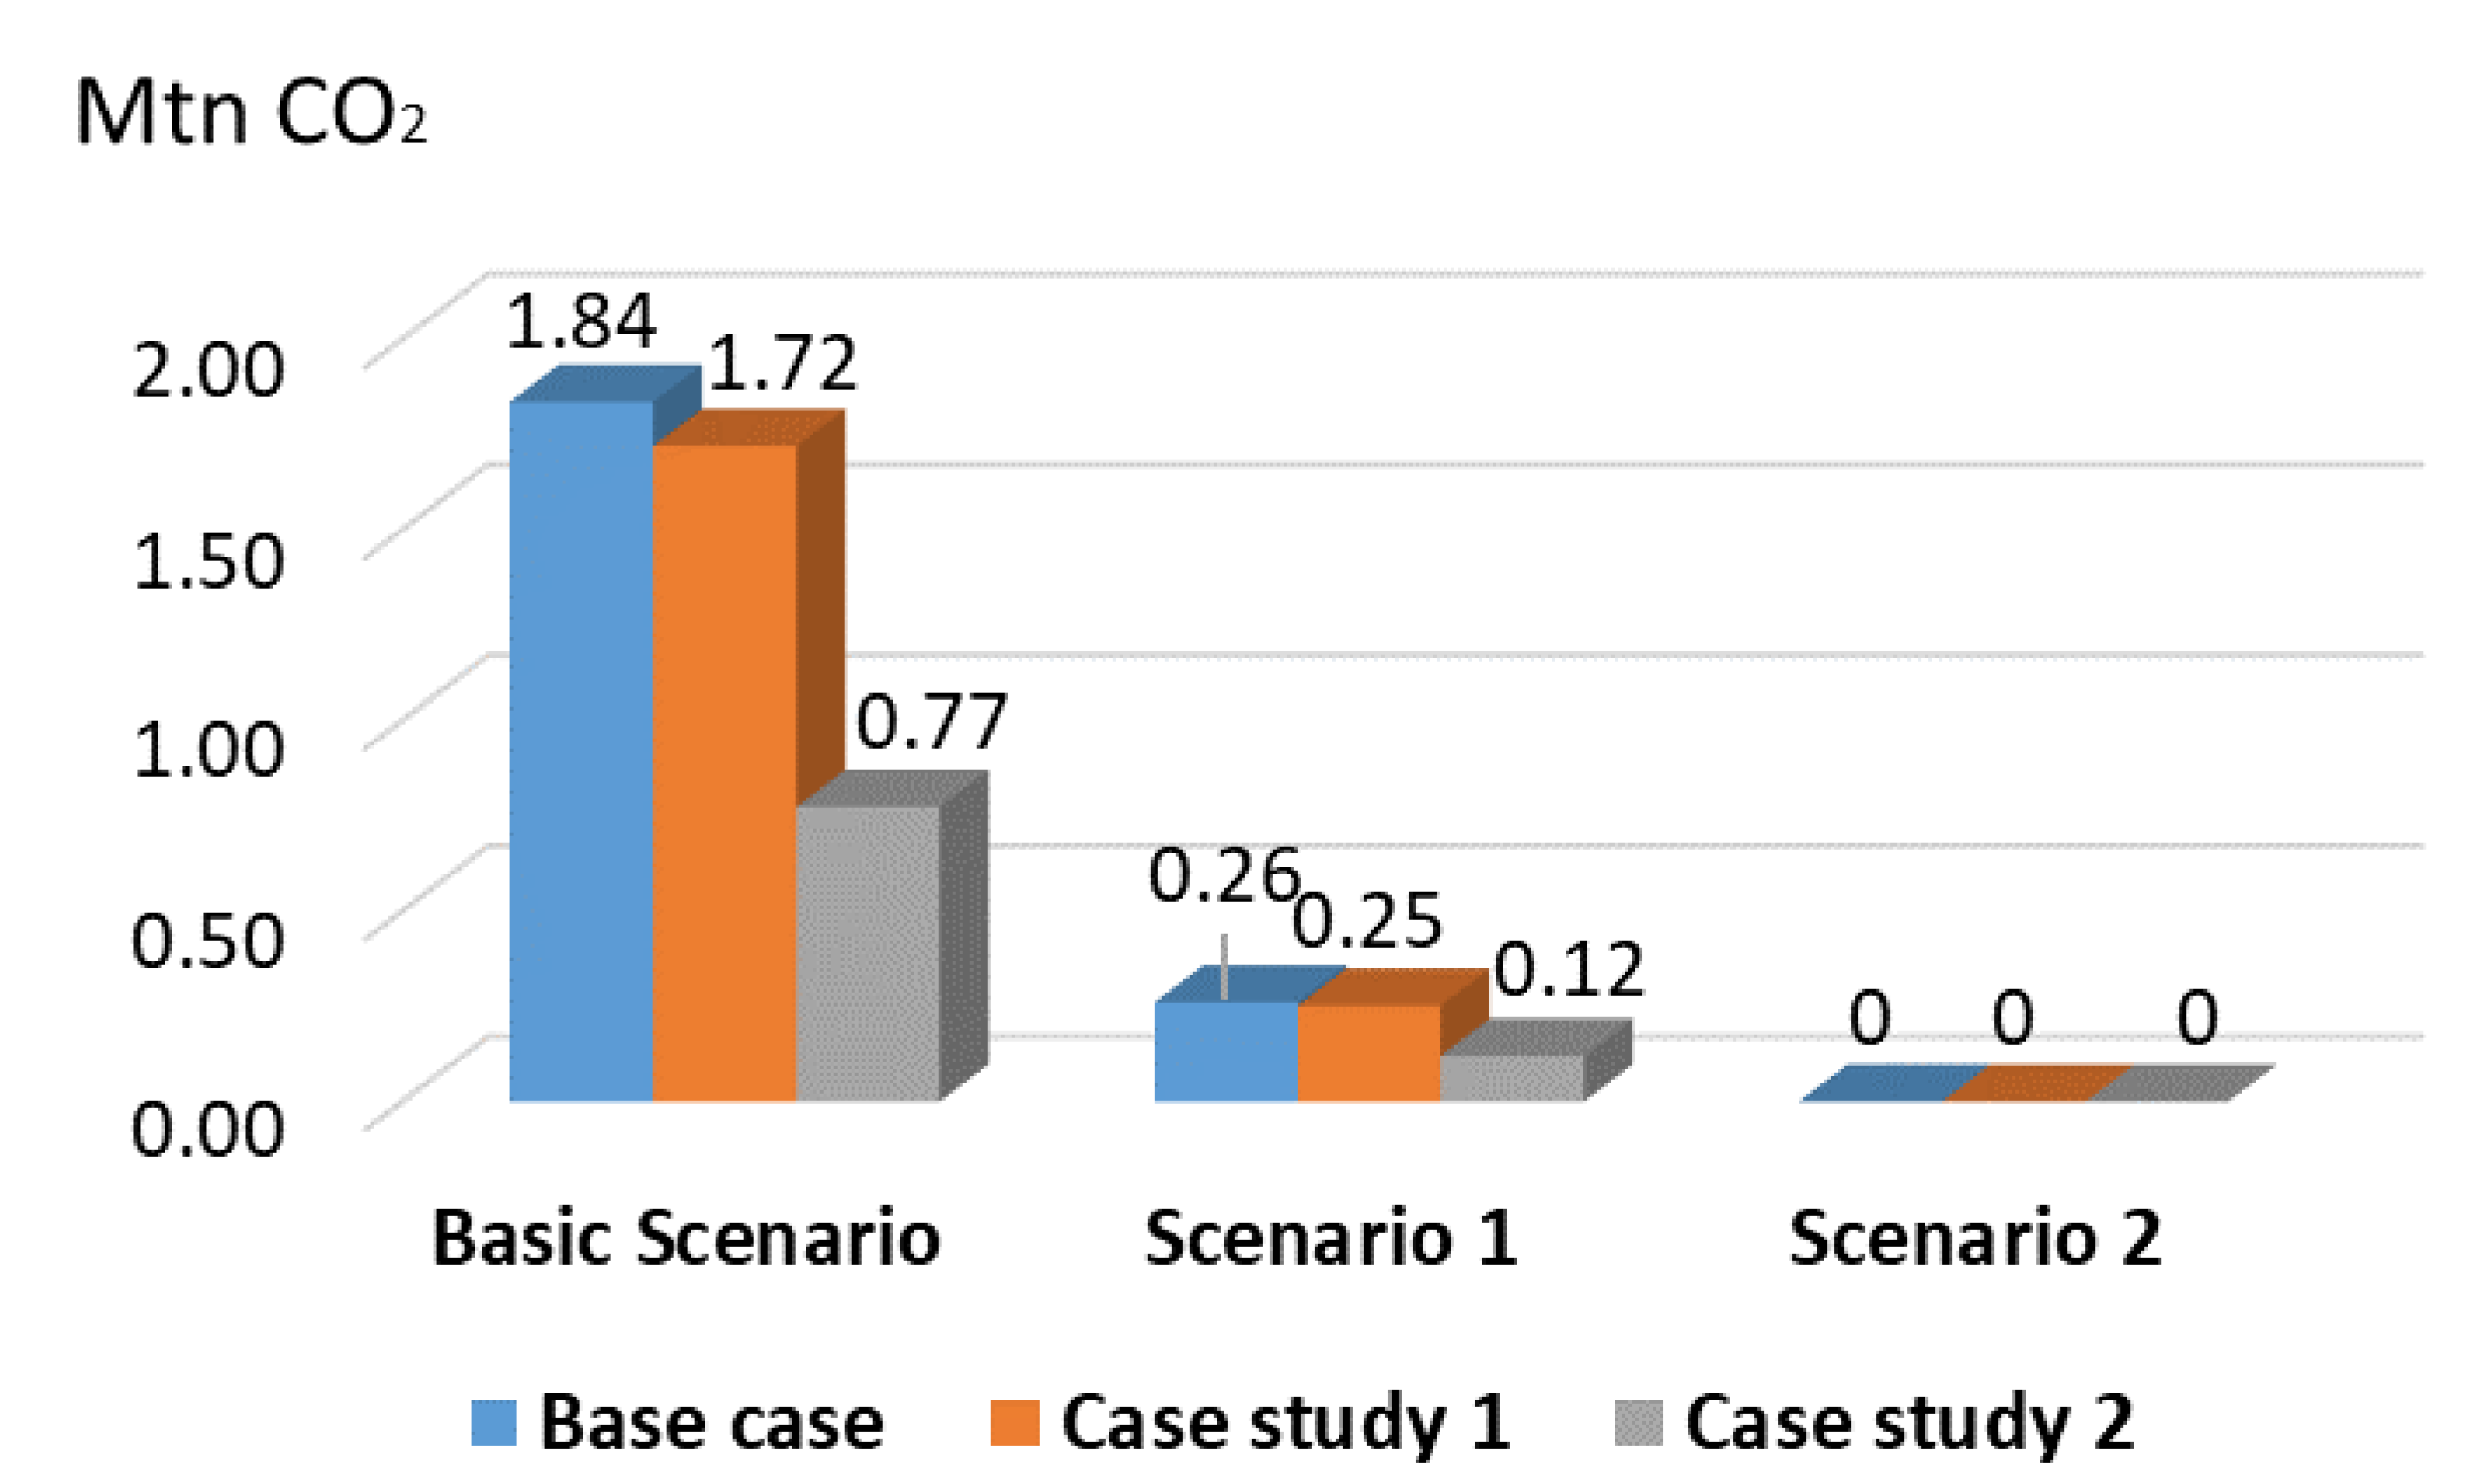
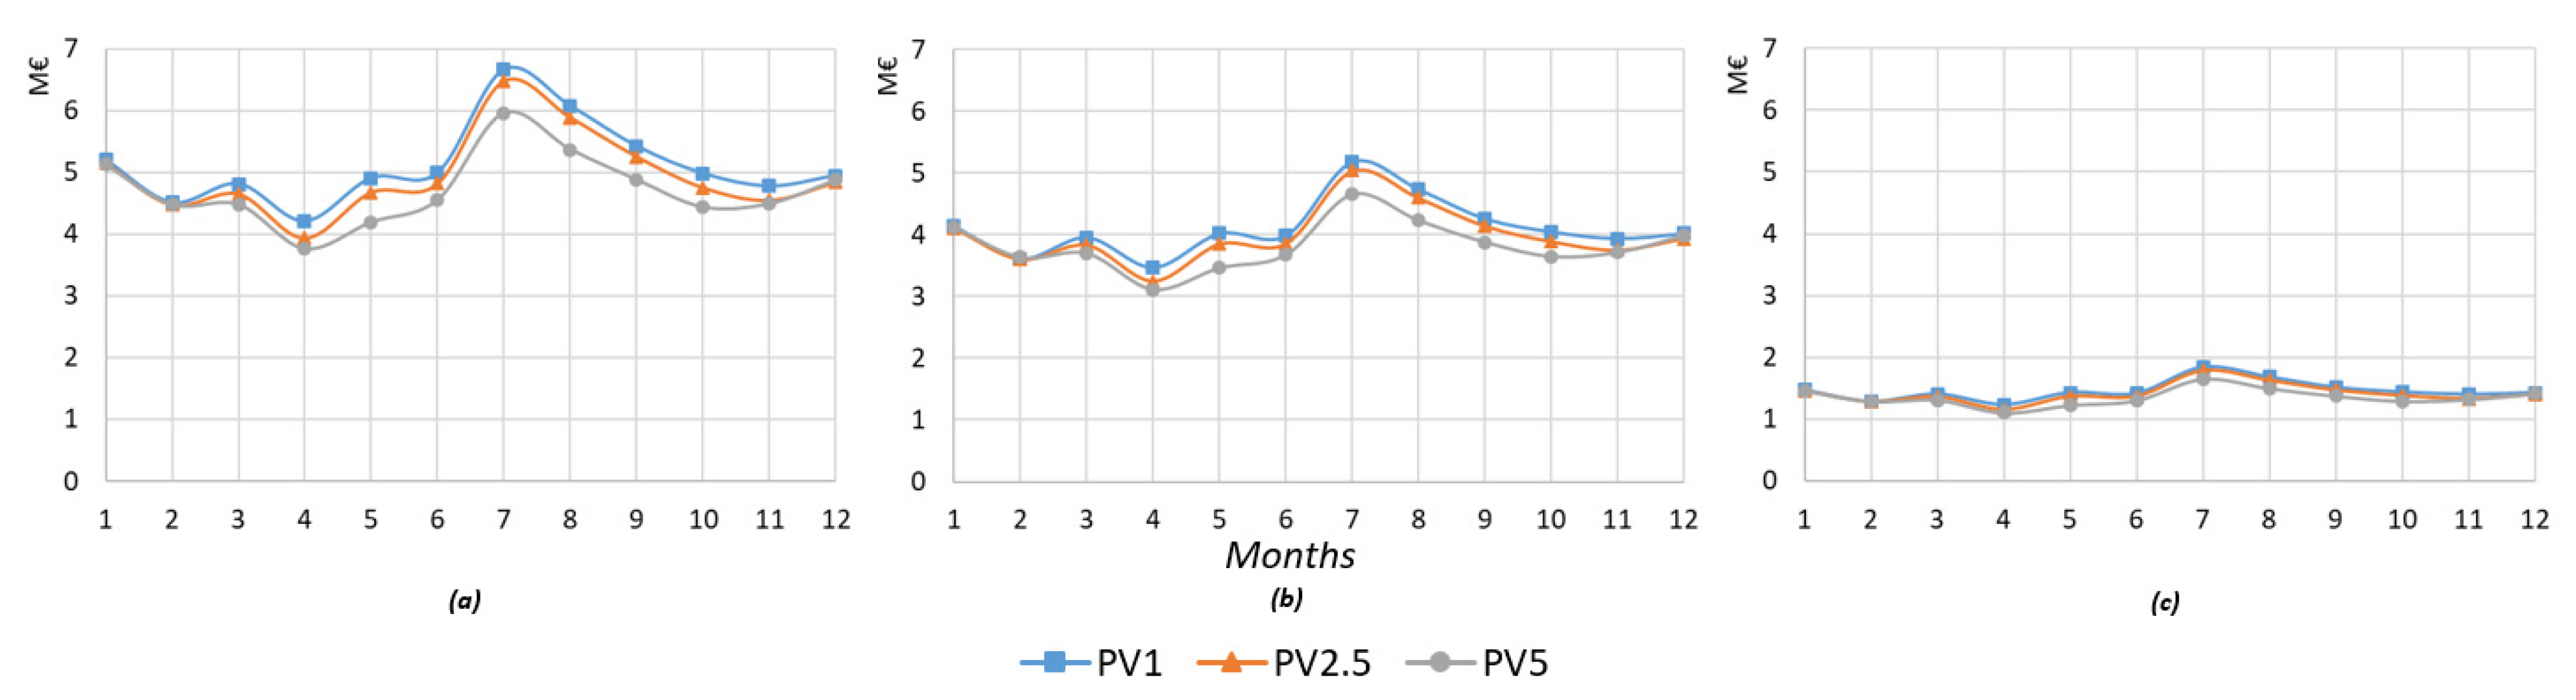
4. Transition to Carbon-Neutral and Carbon-Free Energy

To serve the electricity industry, hydrogen can be used in two ways: either fed to a fuel cell or directly burnt and then converted into electricity by a reaction with the air. To evaluate the impact on total production cost in terms of both fuel consumption and emission released, a power system consisting of 20 generating units is taken into account. The generating units are distinguished by technology into 8 steam-turbine, 4 gas-turbine, 2 combined-cycle and 6 internal combustion generators. These units constitute the available generators for conventional electricity production in Cyprus during the year 2020 and belong to a semi-governmental organization called the Electricity Authority of Cyprus (EAC).
Cyprus represents a clear example of an isolated energy system of relatively important size. Although the island’s domestic resources utilized for electricity production include biomass, solar PV and wind, the interest of RES investors is focused on PV [46]. During the year under assessment, the maximum demand amounted on Friday 4 September at 14:22 h to 1160 MW. RES systems constitute 396.7 MW of total installed capacity, accounting for 229.1 MW PV, 157.5 MW wind and 12.1 MW biomass. Their annual contribution achieved 561.004 MWh in contrast to 4246.106 GWh for conventional units. The annual electrical energy consumption recorded at 4,807,110 MWh [47].
In our analysis, the lowest molecular weight structure with 20 carbon atoms was considered for the chemical composition of the imported HFO to supply the steam units. The rest of the technologies are fueled by diesel. Their technical characteristics are tabulated in Table 2.
Considering the participation of the defined units in annual demand satisfaction, the results obtained assumed three case studies. The base case refers to the current share of 150 MWe photovoltaic systems, while the rest regard a 250% and 500% increase [48]. Since an average wind speed of 3–4 m/s is dominant across the island and offshore power densities of up to 500 W/m2 are limited to short winter periods, wind capacity extensions were not taken into account for the isolated system of Cyprus. On the other hand, case study 1 assumes a PV installed capacity of 375 MW. This forms a realistic condition for the islanded system of Cyprus. As a result, the overall contribution of PV systems, in terms of energy during 2035’s paradigm shows an increase of 2.5 times the real PV energy generated in 2020. With the increasing interest in PV installations for domestic consumption and commercial purposes, the case study 2 assumes an installed capacity of up to 750 MW. Similarly, an increase in the order of 500% in PV contribution during the 2050 scenario is taken into account. Figure 8 and Figure 9 demonstrate the onshore and offshore wind potential, respectively, as a comparison with solar energy illustrated in Figure 10. The contribution per unit is presented in Table 3.
Based on this configuration, the obtained total production cost is €26.815 M, €26.060 M and €12.590 M. As can be observed, the emission costs drastically decrease at higher photovoltaic integration levels. After the validation of the results through the EAC annual report [52], two scenarios are examined concerning the 2035 and 2050 targets. The first scenario accounts for the replacement of HFO and diesel fuels with the upcoming natural gas, whereas by 2050 the electricity sector must be satisfied with 100% RES and thus, all generating units must utilize hydrogen. In this way, the heat-rate coefficients greatly improve based on the lower calorific values (LCV) and fuel costs in each case. In addition, the emission cost using natural gas is reduced in accordance with CO2 emissions, while it is completely eliminated by making use of hydrogen derived from RES. The operational features are demonstrated in Table 4 and Table 5 for the respective scenarios. The specific fuel cost of natural gas is rolling for 12 months and an average value between 2.60 €/MBtu in January and 2.47 €/MBtu in August is taken into consideration. On the other hand, the cost of hydrogen is expected to hit 12.5 €/MBtu by 2050 [47].
The new coefficients were determined relying on Equation (9), converting the S.I. units such that 1 MBtu = 1055.056 MJ.
( a f , b f , c f ) N E W = ( a f , b f , c f ) B A S E . L C V B A S E L C V N E W
The total production cost consuming natural gas during the year becomes €21.395 M, €20.729 M and €9.960 M for the base, first and second case study, respectively. This reveals that with less expensive and more efficient fuels, the expenses due to fuel consumption and emission released can be decreased reasonably. In the case of hydrogen (scenario 2), the annual costs fall even more rapidly, despite the higher cost of hydrogen used as the primary source. These are estimated at €8.744 M, €8,470 M and €4.057 M. Figure 11 includes the varying and cumulative emission cost pertaining to the assessed scenarios in base case.
Increasing the contribution of photovoltaic power, the monthly fluctuation of the base case, case study 1 (250% PV increase) and case study 2 (500% PV increase) can be observed in Figure 12. For the sake of completeness, the comparative results are demonstrated in Figure 13 and Figure 14, where the total production cost and the amount of CO2 released are respectively presented. The obtained results with respect to hydrogen transition appear very promising. In the absence of a hydrogen network, due to the isolated nature of Cyprus’s energy system, the price of imported H2 can be decreased drastically if domestic energy resources could be exploited. In this way, RES will dominate in hydrogen production and excess green energy can be injected into the forthcoming EuroAsia HVDC interconnector, helping the European Union to reduce its dependence on imported fuels.
Considering only an inferior specific cost of the alternative natural gas and hydrogen fuels to replace the conventional resources, the renewable routes for hydrogen production are not compared fairly. Certainly, each H2-production process greatly depends on different geographical limitations and the final cost includes the storage and transportation expenses. In our attempt to provide this information, the case studies during Scenario 2 were examined under different hydrogen production costs. Hence, the inflated costs obtained from [34] are tabulated by the process and energy source in Table 6, whereas the obtained total production costs are shown in Figure 15.
As can be observed, hydrogen routes that exploit biomass as a feedstock offer the lowest production costs ranging between 16.5–20.6 M€ in the base case, 15.9–19.9 M€ during case study 1 and 7.7–9.5 M€ during case study 2. The most economical results were obtained by biomass pyrolysis. Next was the water-electrolysis route from wind energy, while solar-thermal electrolysis and solar thermolysis sit in the middle with around 69 M€, 67 M€ and 32 M€ during the base case, case study 1 and case study 2, respectively. The highest hydrogen generation costs are provided by PV electrolysis systems, with respective values greater than 126 M€, 122 M€ and 58 M€.

5. Conclusions

In this study, the most important conventional technologies for power generation were presented along with their principle of operation and main advantages. A comprehensive formulation of the fuel cost with respect to the technical and operational system constraints was provided. The formulation was extended to include the emission impact on total production cost and three experimental evaluations were compared and discussed in detail. The simulation results were based on a representative power system which consists of 20 generating units combining all the technologies explained. According to their contribution in the base case, the total production costs including carbon dioxide emissions were compared under different photovoltaic penetration levels and fuel types.
Apart from the basic scenario where heavy fuel oil and diesel were the main fuels, two further scenarios were taken into account. The second scenario considers the 2035 targets and a gradual transition towards cleaner electricity production by making use of natural gas (methane). During the last scenario (Scenario 2), a 100% renewable power generation is expected by 2050 and consequently hydrogen constitutes the only option for the thermal source in modern power plants. According to the simulation results, the application of natural gas can lower the annual expenses in cooperation with the integrated photovoltaic systems. However, the total annual costs are drastically decreased when hydrogen constitutes the main source in conventional plants. The total production costs were lowered by one-third, mitigating the uncertainty in renewable contributions and eliminating the emissions released. Since only the operational expenses have been included in this assessment and considering that the existing power plants will be replaced in a generation, future exploration of the impact of installation, design and planning costs should be conducted to evaluate the overall cost of the transition to cleaner fuels.

Author Contributions

Conceptualization, P.N. and A.P.; methodology, P.N.; software, P.N.; validation, P.N.; formal analysis, P.N.; investigation, P.N.; resources, A.P.; data curation, A.P.; writing—original draft preparation, P.N.; writing—review and editing, A.P.; visualization, P.N.; supervision, A.P.; project administration, A.P. All authors have read and agreed to the published version of the manuscript.

Funding

This research received no external funding.

Institutional Review Board Statement

Not applicable.

Informed Consent Statement

Not applicable.

Data Availability Statement

Not applicable.

Conflicts of Interest

The authors declare no conflict of interest.

References

  1. Cosi, B.; Kraja, G. A 100% renewable energy system in the year 2050: The case of Macedonia. Energy 2012, 48, 80–87. [Google Scholar] [CrossRef]
  2. Vad, B.; Lund, H.; Karlsson, K. 100% Renewable energy systems, climate mitigation and economic growth. Appl. Energy 2015, 88, 488–501. [Google Scholar] [CrossRef]
  3. Ã, R.K.; Buddhi, D.; Sawhney, R.L. Comparison of environmental and economic aspects of various hydrogen production methods. Renew. Sustain. Energy Rev. 2008, 12, 553–563. [Google Scholar] [CrossRef]
  4. International Energy Agency (IEA). Annual Growth for Renewable Electricity Generation; International Energy Agency: Paris, France, 2020. [Google Scholar]
  5. Nikolaidis, P.; Fotiou, S.; Kasparis, T.; Poullikkas, A. Dynamic analysis of high-response storage systems to minimize the generation ramping requirements. IET Conf. Publ. 2020, 2020, 398–403. [Google Scholar] [CrossRef]
  6. Poullikkas, A. A comparative overview of large-scale battery systems for electricity storage. Renew. Sustain. Energy Rev. 2013, 27, 778–788. [Google Scholar] [CrossRef]
  7. Nikolaidis, P. Mathematical and Bayesian Inference Strategies for Optimal Unit Commitment in Modern Power Systems Pavlos Nikolaidis. Ph.D. Thesis, Cyprus University of Technology, Limassol, Cyprus, 2019. [Google Scholar]
  8. Lund, H. Renewable energy strategies for sustainable development. Energy 2007, 32, 912–919. [Google Scholar] [CrossRef]
  9. Lior, N. Thoughts about future power generation systems and the role of exergy analysis in their development. Energy Convers. Manag. 2002, 43, 1187–1198. [Google Scholar] [CrossRef]
  10. Blok, K. Enhanced policies for the improvement of electricity efficiencies. Energy Policy 2020, 33, 1635–1641. [Google Scholar] [CrossRef]
  11. Hooghe, L. The European Commission and the Integration of Europe; Cambridge University Press: Cambridge, UK, 2001; pp. 1–26. [Google Scholar]
  12. Spanias, C.A.; Nikolaidis, P.N.; Lestas, I. Techno-Economic Analysis of the Potential Conversion of the Outdated Moni Power Plant to a Large Scale Research Facility. In Proceedings of the 5th International Conference on Renewable Energy Sources & Energy Efficiency, Nicosia, Cyprus, 5–6 May 2016; pp. 208–220. [Google Scholar]
  13. Poullikkas, A. Technology Prospects of Wave Power Systems. Electron. J. Energy Environ. 2014, 2, 47–69. [Google Scholar] [CrossRef]
  14. Bayer, P.; Aklin, M. The European Union Emissions Trading System reduced CO2 emissions despite low prices. Proc. Natl. Acad. Sci. USA 2020, 117, 8804–8812. [Google Scholar] [CrossRef] [Green Version]
  15. Dey, B.; Bhattacharyya, B.; Raj, S.; Babu, R. Economic emission dispatch on unit commitment-based microgrid system considering wind and load uncertainty using hybrid MGWOSCACSA. J. Electr. Syst. Inf. Technol. 2020, 7, 15. [Google Scholar] [CrossRef]
  16. Rezaee Jordehi, A. A mixed binary-continuous particle swarm optimisation algorithm for unit commitment in microgrids considering uncertainties and emissions. Int. Trans. Electr. Energy Syst. 2020, 30, e12581. [Google Scholar] [CrossRef]
  17. Yang, Z.; Guo, Y.; Niu, Q.; Ma, H.; Zhou, Y.; Zhang, L. A Novel Binary Jaya Optimization for Economic/Emission Unit Commitment. In Proceedings of the 2018 IEEE Congress on Evolutionary Computation, CEC 2018-Proceedings, Rio de Janeiro, Brazil, 8–13 July 2018; pp. 1–6. [Google Scholar]
  18. Nikzad, H.R.; Abdi, H. A robust unit commitment based on GA-PL strategy by applying TOAT and considering emission costs and energy storage systems. Electr. Power Syst. Res. 2020, 180, 106154. [Google Scholar] [CrossRef]
  19. Soltani, Z.; Ghaljehei, M.; Gharehpetian, G.B.; Aalami, H.A. Integration of smart grid technologies in stochastic multi-objective unit commitment: An economic emission analysis. Int. J. Electr. Power Energy Syst. 2018, 100, 565–590. [Google Scholar] [CrossRef]
  20. Catalão, J.P.S.; Mariano, S.J.P.S.; Mendes, V.M.F.; Ferreira, L.A.F.M. A practical approach for profit-based unit commitment with emission limitations. Int. J. Electr. Power Energy Syst. 2010, 32, 218–224. [Google Scholar] [CrossRef]
  21. Saranya, S.; Saravanan, B. Effect of emission in SMES based unit commitment using modified Henry gas solubility optimization. J. Energy Storage 2020, 29, 101380. [Google Scholar] [CrossRef]
  22. Gillingham, K.; Stock, J.H. The cost of reducing greenhouse gas emissions. J. Econ. Perspect. 2018, 32, 53–72. [Google Scholar] [CrossRef]
  23. Poullikkas, A. Introduction to Power Generation Technologies; Nova Science: Hauppauge, NY, USA, 2009; ISBN 9781119130536. [Google Scholar]
  24. Cengel, Y.A.; Boles, M.A.; Kanoğlu, M. Chapter 10 Vapor and Combined Power Cycles. In Thermodynamics: An Engineering Approach; The British University of Egypt: Cairo, Egypt, 2011; pp. 1–29. [Google Scholar]
  25. Water Environment Federation Residuals and Biosolids Committee. Internal Combustion Engines; Water Environmental Federation: Alexandria, VA, USA, 2017; pp. 1–24. [Google Scholar]
  26. Van Blarigan, P.; Laboratories, S.N. Advanced Internal Combustion; Warsaw University of Technology: Warsaw, Poland, 2001; pp. 1–20. [Google Scholar]
  27. Al Moussawi, H.; Fardoun, F.; Louahlia, H. Selection based on differences between cogeneration and trigeneration in various prime mover technologies. Renew. Sustain. Energy Rev. 2017, 74, 491–511. [Google Scholar] [CrossRef]
  28. Nikolaidis, P.; Poullikkas, A. Secondary battery technologies: A static potential for power. In Energy Generation and Efficiency Technologies for Green Residential Buildings; The Institution of Engineering and Technology: London, UK, 2019; pp. 191–207. [Google Scholar]
  29. Nikolaidis, P.; Poullikkas, A. Cost metrics of electrical energy storage technologies in potential power system operations. Sustain. Energy Technol. Assess. 2018, 25, 43–59. [Google Scholar] [CrossRef]
  30. Nikolaidis, P.; Poullikkas, A. A comparative review of electrical energy storage systems for better sustainability. J. Power Technol. 2011, 97, 220–245. [Google Scholar]
  31. Nikolaidis, P.; Chatzis, S.; Poullikkas, A. Life cycle cost analysis of electricity storage facilities in flexible power systems. Int. J. Sustain. Energy 2019, 38, 752–772. [Google Scholar] [CrossRef]
  32. Nikolaidis, P.; Poullikkas, A. Sustainable services to enhance flexibility in the upcoming smart grids. In Sustaining Resources for Tomorrow; Springer: Cham, Switzerland, 2020; pp. 245–274. [Google Scholar]
  33. Nikolaidis, P. Sustainable Routes for Renewable Energy Carriers in Modern Energy Systems. In Bioenergy Research: Commercial Opportunities & Challenges; Springer: Singapore, 2021; pp. 239–265. ISBN 978-981-16-1189-6. [Google Scholar]
  34. Nikolaidis, P.; Poullikkas, A. A comparative overview of hydrogen production processes. Renew. Sustain. Energy Rev. 2017, 67, 597–611. [Google Scholar] [CrossRef]
  35. Asada, Y.; Tokumoto, M.; Aihara, Y.; Oku, M.; Ishimi, K. Hydrogen production by co-cultures of Lactobacillus and a photosynthetic bacterium, Rhodobacter sphaeroides RV. Int. J. Hydrogen Energy 2006, 31, 1509–1513. [Google Scholar] [CrossRef]
  36. Hadjipaschalis, I.; Poullikkas, A.; Efthimiou, V. Overview of current and future energy storage technologies for electric power applications. Renew. Sustain. Energy Rev. 2009, 13, 1513–1522. [Google Scholar] [CrossRef]
  37. Simmons, T. CO2 Emissions from Stationary Combustion of Fossil Fuels. In Good Practice Guidance and Uncertainty Management in National Greenhouse Gas Inventories; IPCC: London, UK, 2000; pp. 15–40. [Google Scholar]
  38. Nikolaidis, P.; Chatzis, S. Gaussian process-based Bayesian optimization for data-driven unit commitment. Int. J. Electr. Power Energy Syst. 2021, 130, 106930. [Google Scholar] [CrossRef]
  39. Nikolaidis, P.; Chatzis, S.; Poullikkas, A. Optimal planning of electricity storage to minimize operating reserve requirements in an isolated island grid. Energy Syst. 2020, 11, 1157–1174. [Google Scholar] [CrossRef]
  40. Nikolaidis, P.; Partaourides, H. A Model Predictive Control for the Dynamical Forecast of Operating Reserves in Frequency Regulation Services. Forecasting 2021, 3, 228–241. [Google Scholar]
  41. Nikolaidis, P.; Poullikkas, A. Enhanced Lagrange relaxation for the optimal unit commitment of identical generating units. IET Gener. Transm. Distrib. 2020, 14, 3920–3928. [Google Scholar] [CrossRef]
  42. Nikolaidis, P.; Poullikkas, A. Co-optimization of active power curtailment, load shedding and spinning reserve deficits through hybrid approach: Comparison of electrochemical storage technologies. IET Renew. Power Gener. 2022, 16, 92–104. [Google Scholar] [CrossRef]
  43. Fritt-Rasmussen, J.; Wegeberg, S.; Gustavson, K.; Sørheim, K.R.; Daling, P.S.; Jørgensen, K.; Tonteri, O.; Holst-Andersen, J.P. Heavy Fuel Oil (HFO): A Review of Fate and Behaviour of HFO Spills in Cold Seawater, Including Biodegradation, Environmental Effects and Oil Spill Response; Nordisk Ministerråd: Copenhagen, Denmark, 2018; ISBN 9789289358507. [Google Scholar]
  44. The American Petroleum Institute. Heavy fuel oils category submitted to the US EPA. Fuel 2007, 2012, 1–138. [Google Scholar]
  45. Nikolaidis, P.; Poullikkas, A. A novel cluster-based spinning reserve dynamic model for wind and PV power reinforcement. Energy 2021, 234, 121270. [Google Scholar] [CrossRef]
  46. Nikolaidis, P.; Chatzis, S.; Poullikkas, A. Renewable energy integration through optimal unit commitment and electricity storage in weak power networks. Int. J. Sustain. Energy 2018, 38, 398–414. [Google Scholar] [CrossRef]
  47. Cyprus Energy Regulatory Authority. Annual Report of the Cyprus Energy Regulatory Authority; Cyprus Energy Regulatory Authority: Nicosia, Cyprus, 2020. [Google Scholar]
  48. Naxakis, I.; Nikolaidis, P.; Pyrgioti, E. Performance of an installed lightning protection system in a photovoltaic park. In Proceedings of the 2016 IEEE International Conference on High Voltage Engineering and Application (ICHVE), Chengdu, China, 19–22 September 2016; pp. 2–5. [Google Scholar]
  49. Ercan, F.; Yenen, M.; Fahrioğlu, M. Method and Case Study for Wind Power Assessment in Cyprus. In Proceedings of the Renewable Energy Sources Symposium, Nicosia, Cyprus, 19–23 September 2013; pp. 1–6. [Google Scholar] [CrossRef]
  50. Hadjipetrou, S.; Liodakis, S.; Sykioti, A.; Katikas, L.; Park, N.W.; Kalogirou, S.; Akylas, E.; Kyriakidis, P. Evaluating the suitability of Sentinel-1 SAR data for offshore wind resource assessment around Cyprus. Renew. Energy 2022, 182, 1228–1239. [Google Scholar] [CrossRef]
  51. Gallo, C. Bioclimatic Architecture; Pantheon Cultural Association Location: Nicosia, Cyprus, 1994; Volume 5, ISBN 9789963978984. [Google Scholar]
  52. Electricity Authority of Cyprus Annual Report of the Electricity Authority of Cyprus. 2020. Available online: https://www.eac.com.cy/EN/EAC/FinancialInformation/Pages/AnnualReports.aspx (accessed on 15 May 2022).
Figure 1. Simulation of a steam plant (Rankine cycle), state 1: saturated vapor, state 2: vapor, state 3: compressed liquid, state 4: liquid pumped into the boiler [23].
Sustainability 14 10800 g001
Figure 2. Representation of ideal reheat Rankine cycle, state 1: compressed liquid, state 2: liquid, state 3: saturated vapor, state 4: vapor, state 5: reheated vapor, 6: vapor [24].
Sustainability 14 10800 g002
Figure 3. Simulation of a gas-turbine cycle (Brayton cycle), state 1: air inlet, state 2: air isentropic compression, state 3: air isobaric heating, state 4: isobaric heat rejection [23].
Sustainability 14 10800 g003
Figure 4. Simulation of combined cycle, state 1: air inlet, state 2: air isentropic compression, state 3: air isobaric heating, state 4: heated air introduction to heat exchanger, state 5: isobaric heat rejection, state 6: heat-recovered vapor, state 7: vapor, state 8: compressed liquid, state 9: liquid pumped into the heat exchanger [23].
Sustainability 14 10800 g004
Figure 5. Simulation of an internal combustion engine power plant [25].
Sustainability 14 10800 g005
Figure 6. Demonstration of (a) co–generation and (b) tri–generation ICE system [27].
Sustainability 14 10800 g006
Figure 7. Heat-rate (H) curves pertaining to various generation technologies.
Sustainability 14 10800 g007
Figure 8. Mean annual wind speed measured at 10 m altitude [49].
Sustainability 14 10800 g008
Figure 9. Average wind power density per season over a 10–year period from January 2009 to July 2019 [50].
Sustainability 14 10800 g009
Figure 10. Global horizontal irradiation map of Cyprus for the period 1994–2018 [51].
Sustainability 14 10800 g010
Figure 11. Varying and cumulative emission cost pertaining to the assessed scenarios in base case.
Sustainability 14 10800 g011
Figure 12. Monthly generation cost pertaining to the (a) basic scenario, (b) scenario 1 and (c) scenario 2.
Sustainability 14 10800 g012
Figure 13. Total production cost pertaining to the assessed case studies (PV1, PV2.5 and PV5) for the targets of 2020 (Basic scenario), 2035 (Scenario 1) and 2050 (Scenario 2).
Sustainability 14 10800 g013
Figure 14. Amount of CO2 released (measured in Mtn) pertaining to the assessed case studies.
Sustainability 14 10800 g014
Figure 15. Total production cost utilizing hydrogen derived from different production routes.
Sustainability 14 10800 g015
Table 1. Main parameters and factors pertaining to the fuel combustion process [43,44,45].
fNVCEFSFCr (kgC/kgf)
HFO3921.10.80.980.591389
Diesel45.520.20.50.991.668167
NG5017.20.330.9952.10217
H21200000
Table 2. Technical characteristics of the thermal generating units [46].
Unita (MBtu/MW2h)b (MBtu/MWh)c (MBtu/h)TechnologyFuelSpecific Cost (€/MBtu)
1–40.0134.07757.034Gas turbineDiesel8.32
5–100.0173.73460.261Steam turbineHFO5.05
11–130.0013.7419.3ICEHFO5.05
14–160.0263.10511.28ICEHFO5.05
17–180.0043.40774.284Steam turbineHFO5.05
19–200.0022.596148.844Combined cycleDiesel8.32
Table 3. Annual electricity generation (in GWh) per unit.
GeneratorBase CaseCase Study 1Case Study 2
13.1542281.9976470.809017
21.0972650.5545990.257415
30.07624100
4000
51678.5621687.9551701.377
61675.5071681.2051684.223
71653.8691644.4271628.991
81527.9251502.541439.053
91253.0891202.2521095.075
10988.9184940.3106826.6504
11553.6949561.1234548.1765
12553.6949561.1234548.1765
13553.6949561.1234548.1765
14591.9923594.3116587.3696
15591.9923594.3116587.3696
16591.9923594.3116587.3696
173459.7063441.9073349.22
183459.7063441.9073349.22
193245.9112824.9132272.047
20852.4629720.0493483.3979
Table 4. Technical characteristics of the thermal generating units in 2035 scenario.
Unita (MBtu/MW2h)b (MBtu/MWh)c (MBtu/h)TechnologyFuelSpecific Cost (€/MBtu)
1–40.0123.7151.901Gas turbineNG2.60
5–100.0132.91247.004Steam turbineNG2.60
11–130.0012.9187.254ICENG2.47
14–160.0212.4228.798ICENG2.47
17–180.0032.65857.941Steam turbineNG2.47
19–200.0022.362135.448Combined cycleNG2.47
Table 5. Technical characteristics of the thermal generating units in 2050 scenario.
Unita (MBtu/MW2h)b (MBtu/MWh)c (MBtu/h)TechnologyFuelSpecific Cost (€/MBtu)
1–40.0051.54621.626Gas turbineH212.52
5–100.0061.21419.585Steam turbineH212.52
11–130.00041.2163.022ICEH212.52
14–160.0091.0093.666ICEH212.52
17–180.00131.10724.142Steam turbineH212.52
19–200.00090.98456.437Combined cycleH212.52
Table 6. Renewable routes for hydrogen production.
H2 RouteProcessEnergy SourceProduction Cost (€/MBtu)
R1Biomass pyrolysisbiomass23.59
R2Biomass gasificationbiomass26.12
R3Bio-photolysissolar25.51
R4Fermentationsolar29.40
R5PV electrolysissolar180.94
R6Solar-thermal electrolysissolar97.11
R7Wind electrolysiswind78.92
R8Solar thermolysissolar102.03
R9Photo-electrolysissolar112.81
Publisher’s Note: MDPI stays neutral with regard to jurisdictional claims in published maps and institutional affiliations.

