


Energy Efficiency Optimization in Polyisoprene Footwear Production


Abstract
:1. Introduction
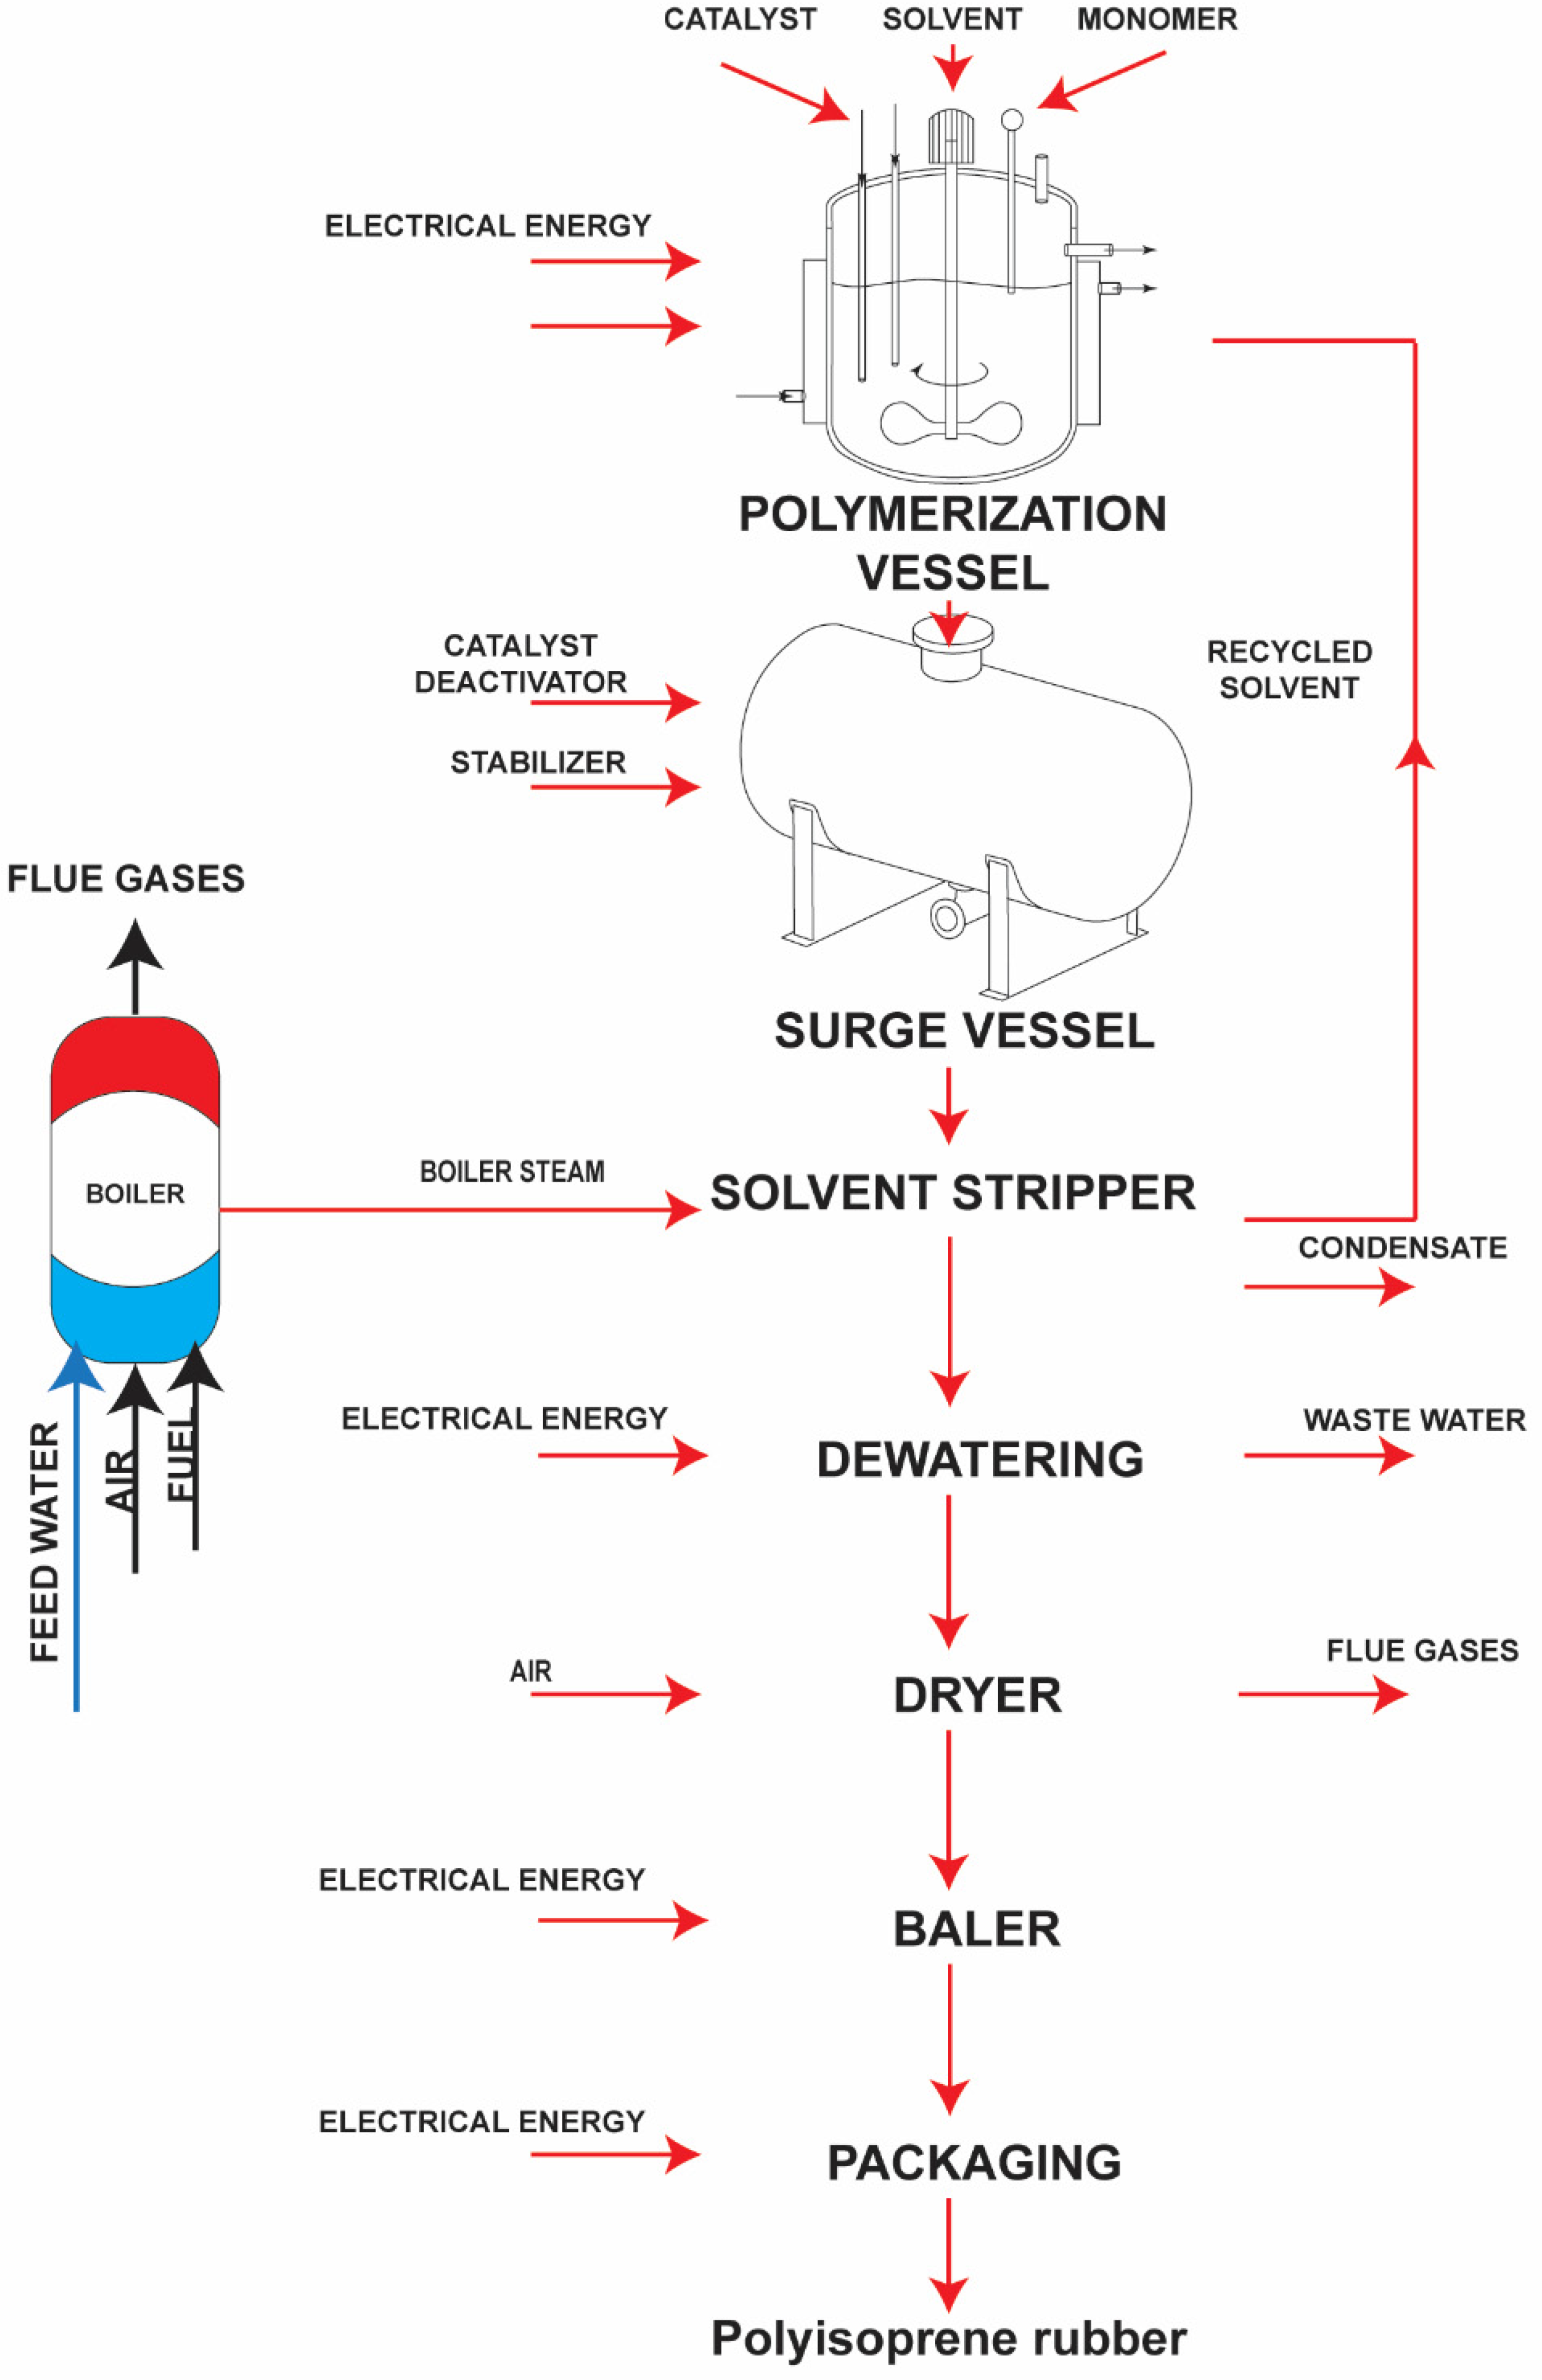
2. Process Data and Methods of the Energy Efficiency Improvements
2.1. Exhaust Product Analysis
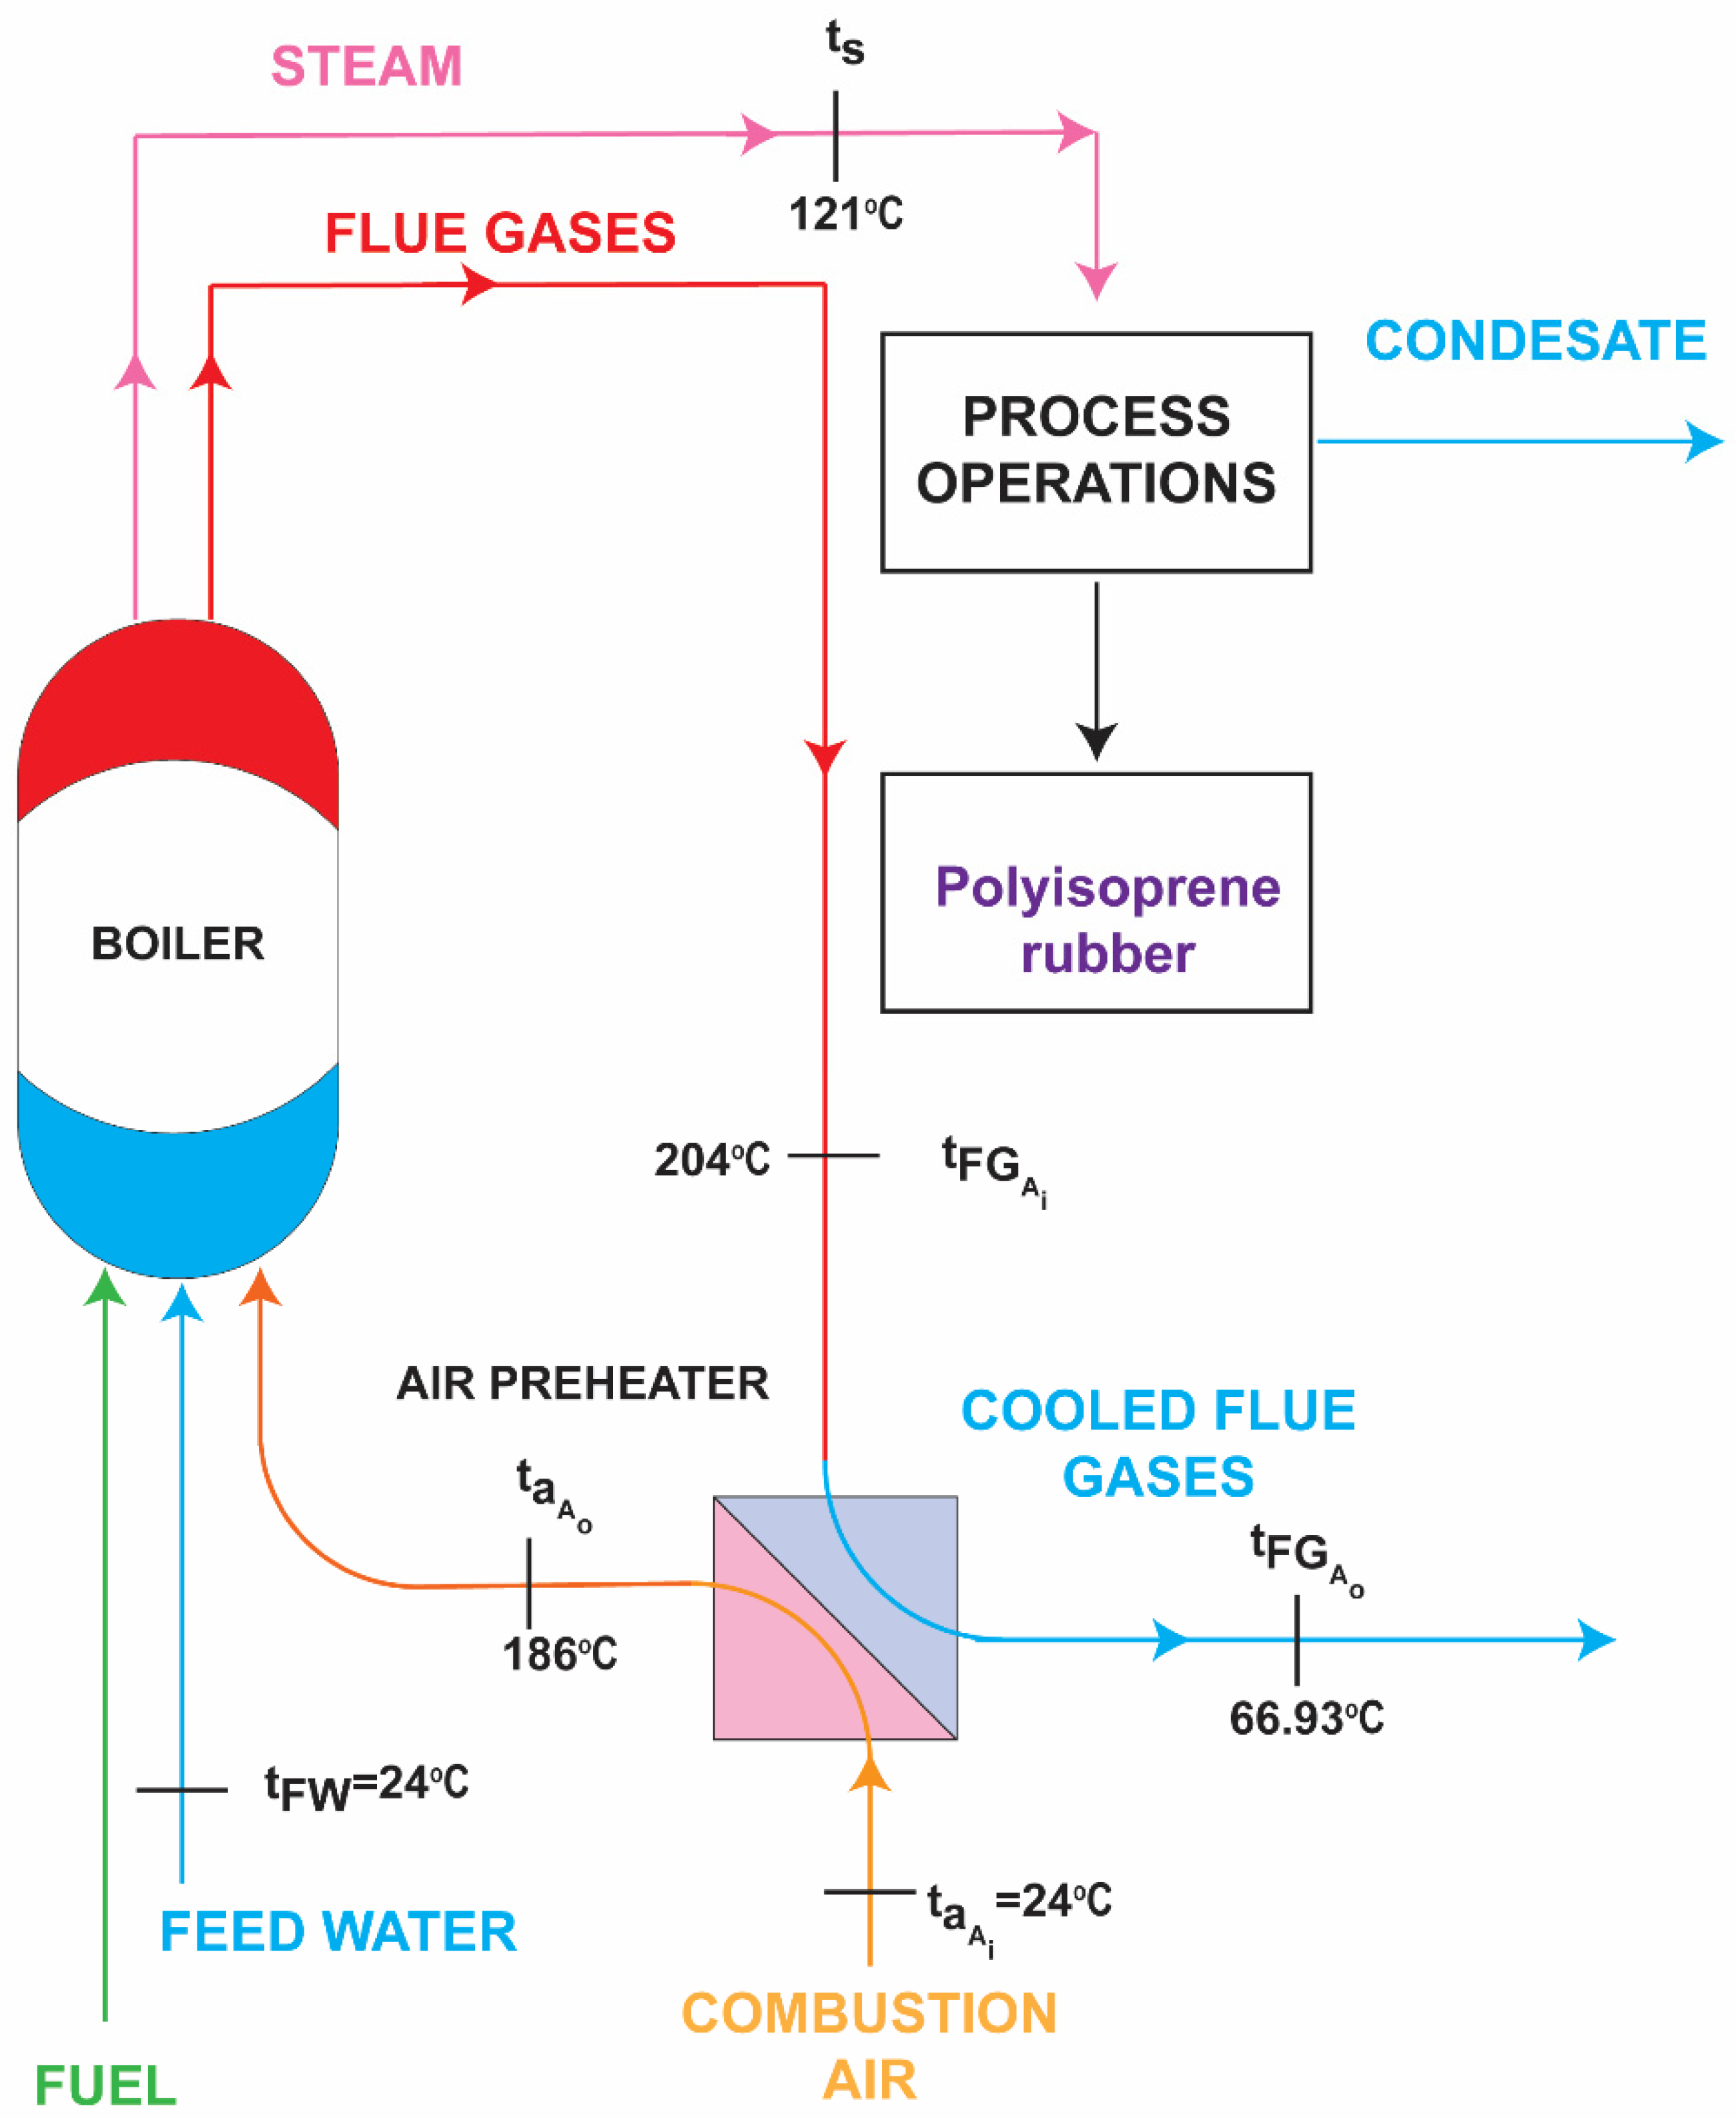
2.2. Air Preheating Using Heat of Exhaust Flue Gases in Air Preheater
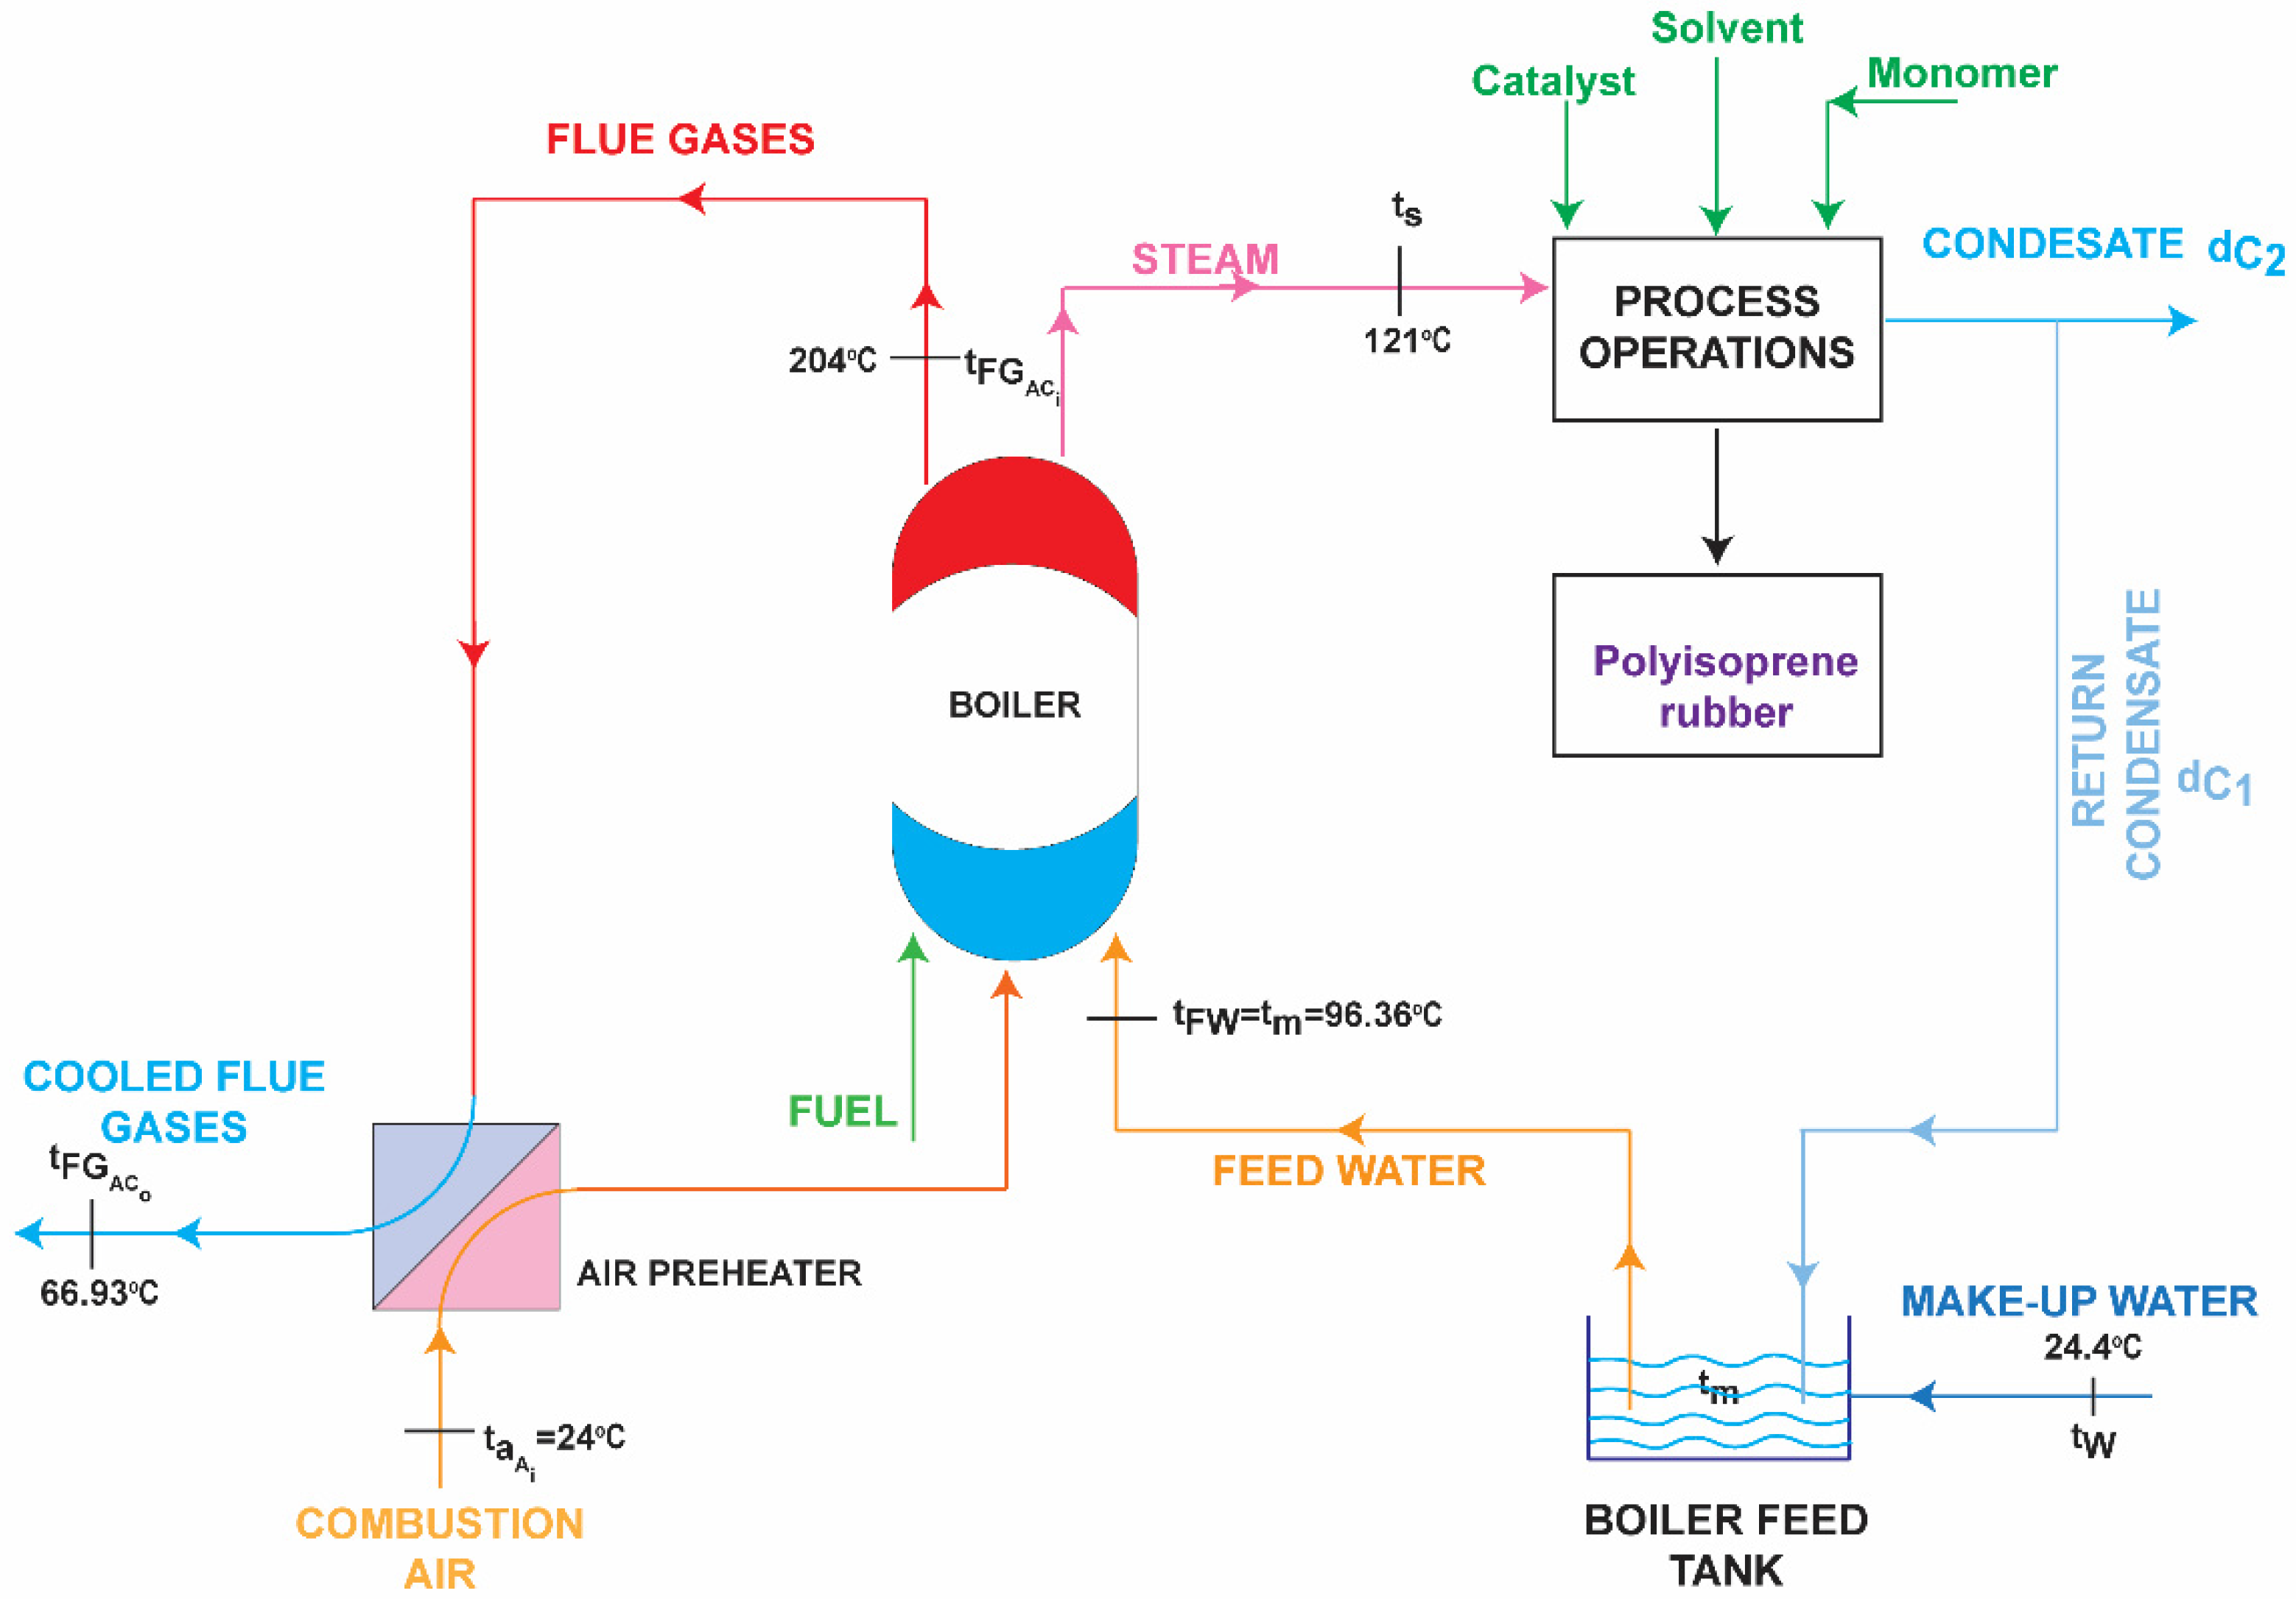
2.3. Condensate Heat Recovery
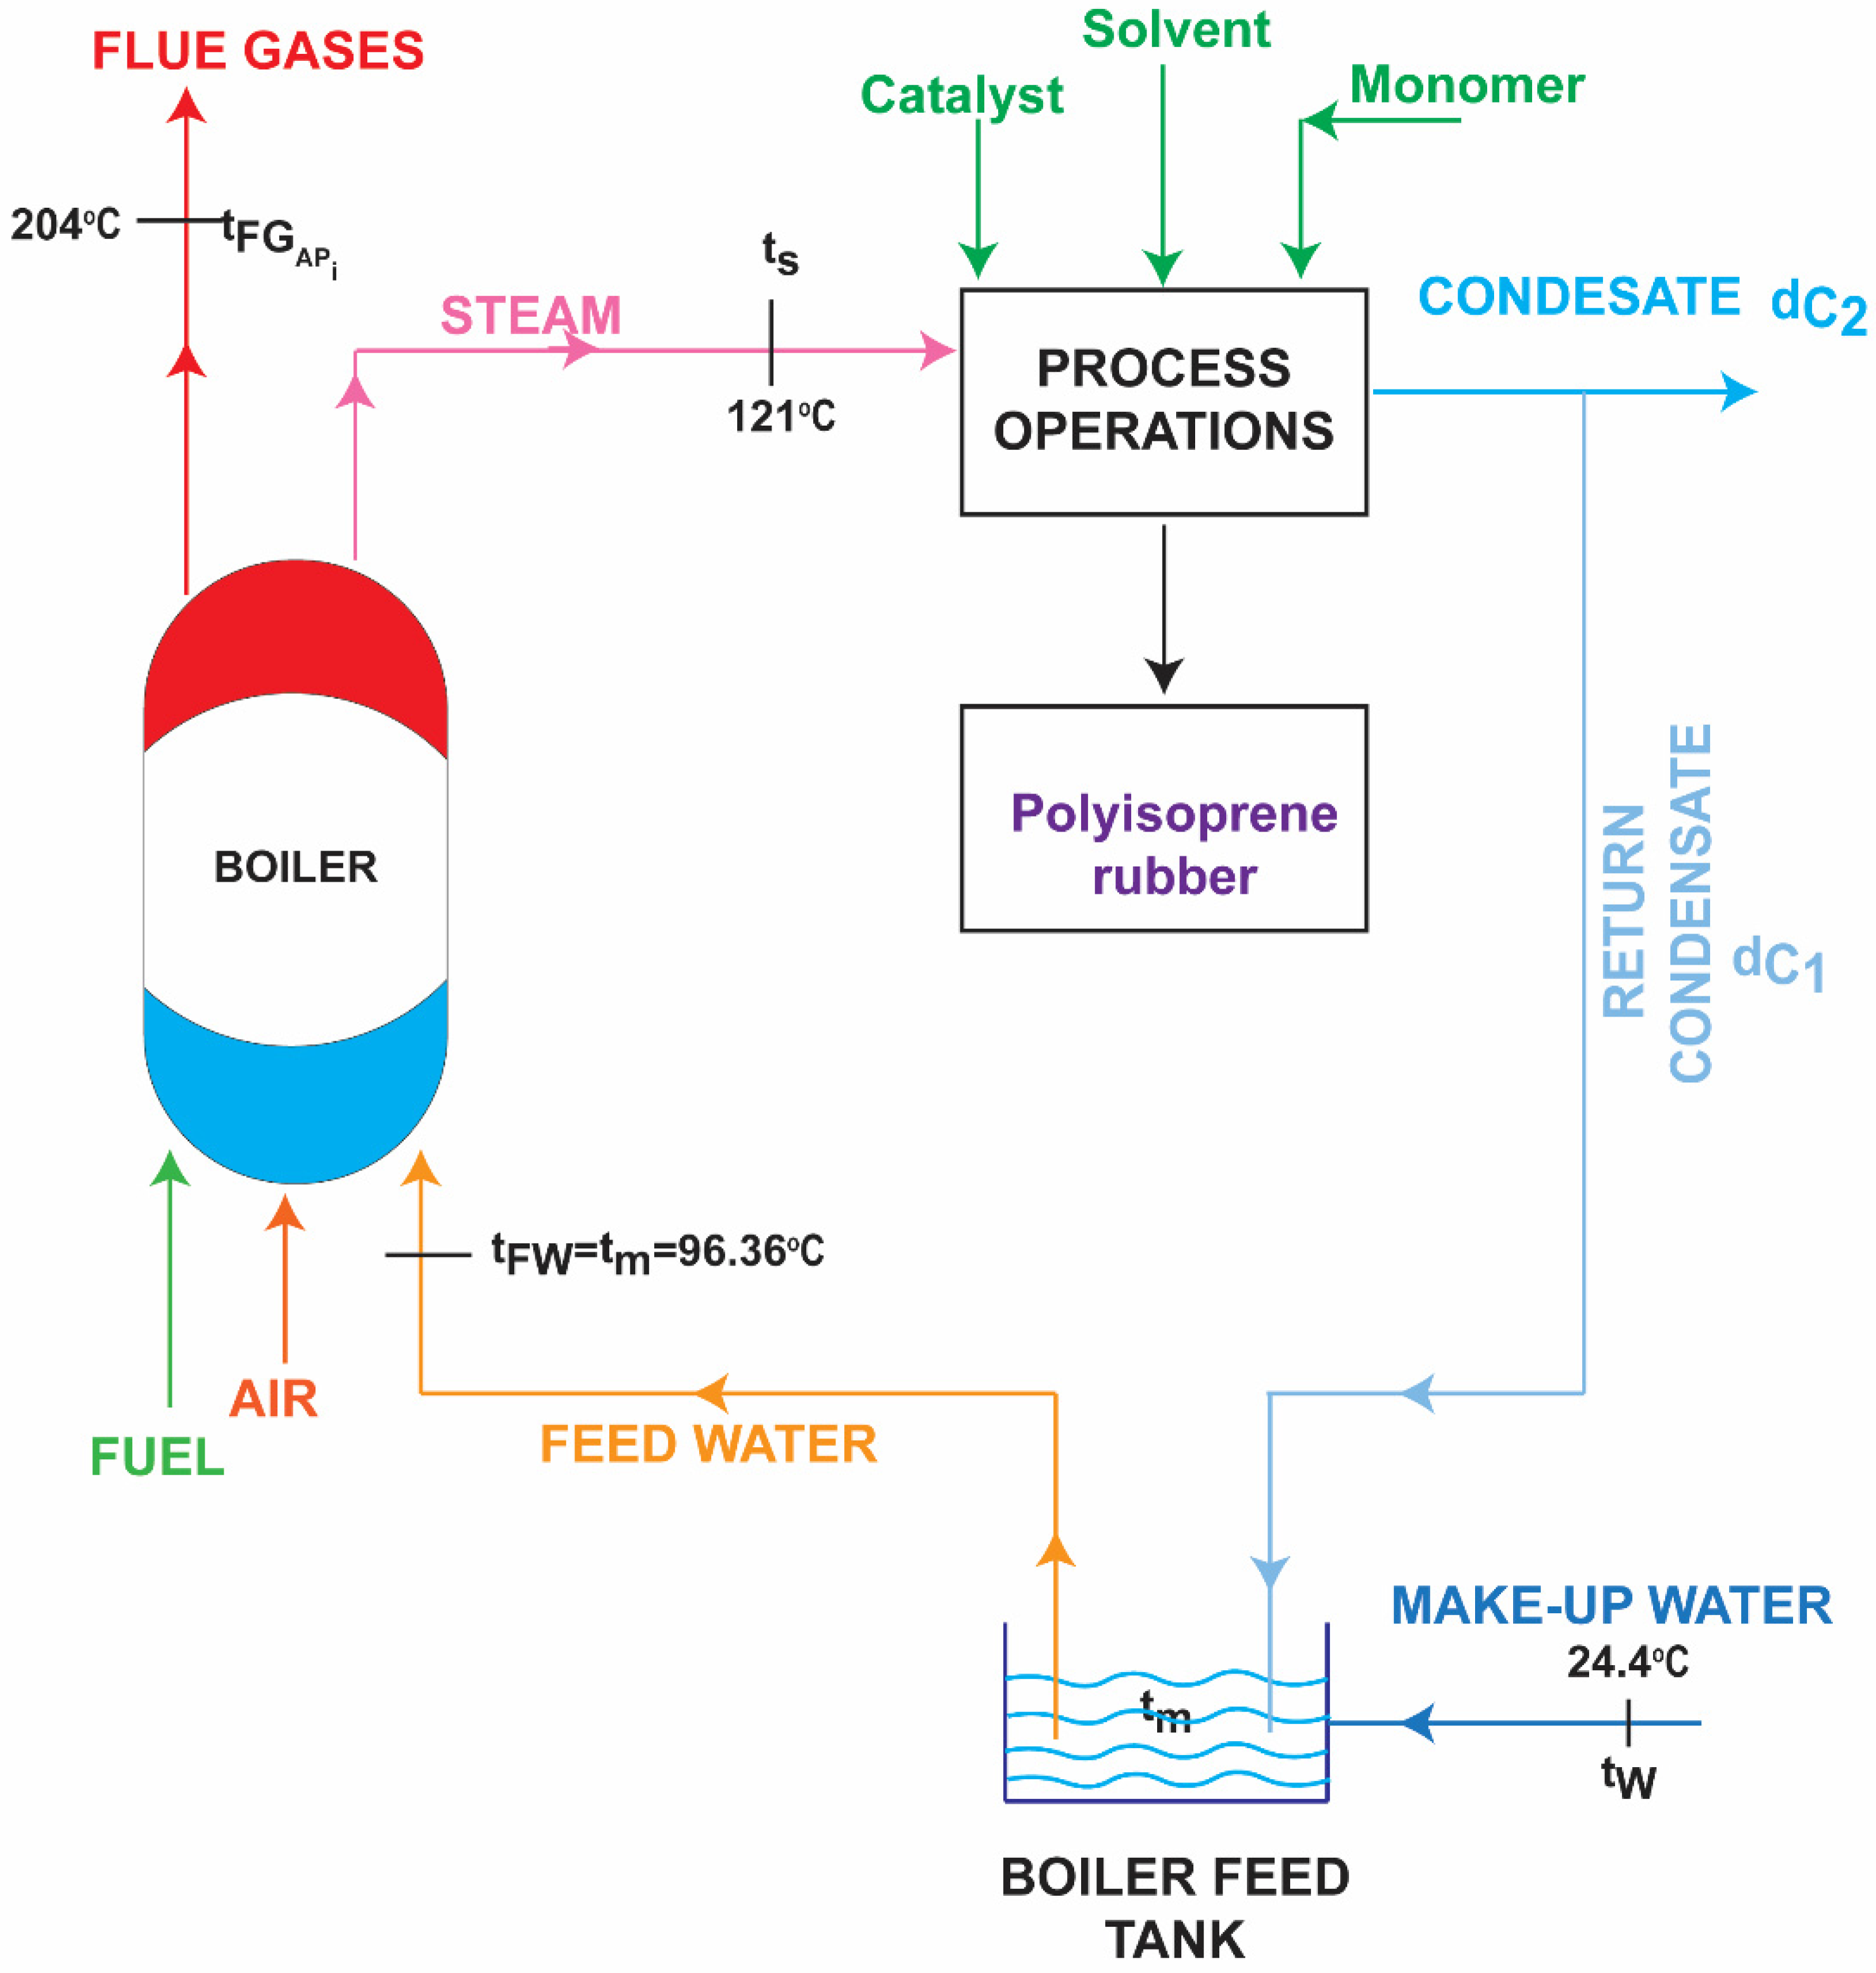
2.4. Air Preheating with Flue Gases in Process with Condensate Heat Recovery
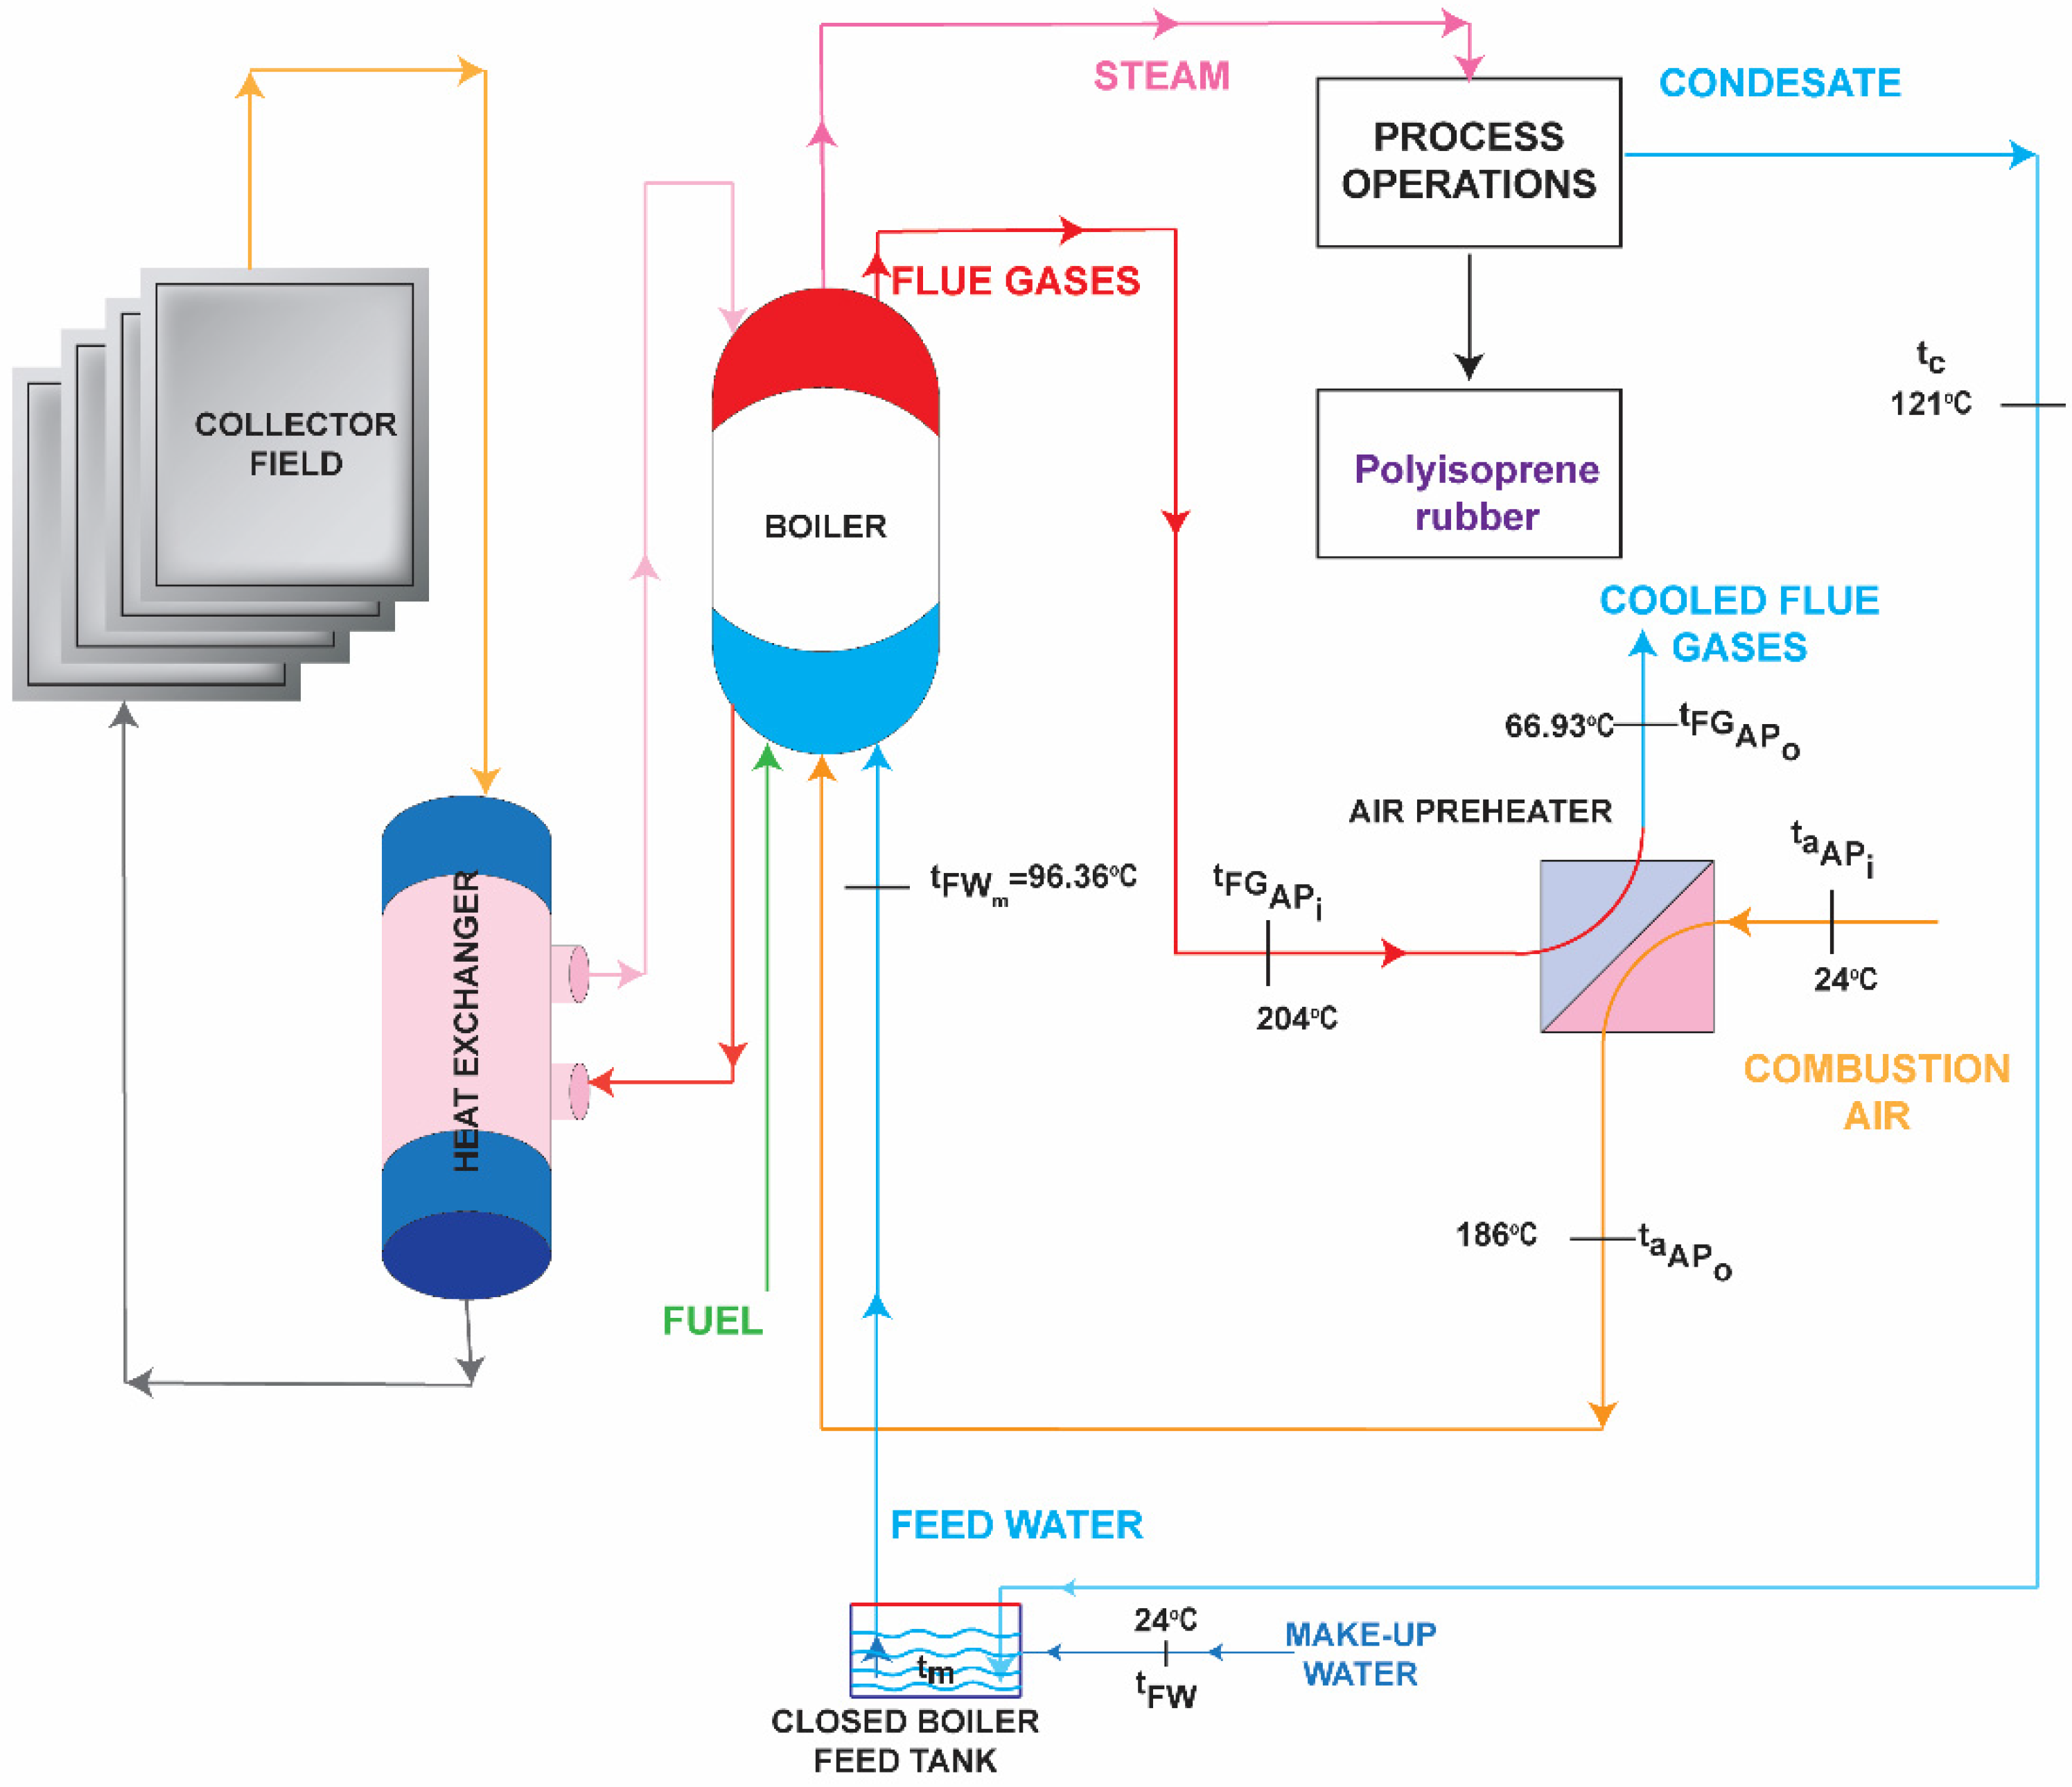
2.5. Solar Energy Application in Polyisoprene Footwear Production
3. Cost and Savings Analysis
4. Results and Discussion
5. Conclusions
Author Contributions
Funding
Institutional Review Board Statement
Informed Consent Statement
Data Availability Statement
Conflicts of Interest
Nomenclature
| Nomenclature | Symbol | Unit |
| specific heat of water | ||
| specific heat of carbon dioxide | ||
| specific heat of nitrogen | ||
| specific heat of oxygen | ||
| specific heat of air | ||
| specific heat of flue gases | ||
| unit mass of process water per unit of product | ||
| unit mass of saturated steam for industrial process per unit of product | ||
| unit mass of condensate used in industrial process per unit of product | ||
| specific steam consumption for basic process per unit of product | ||
| unit mass of specific steam consumption for process with condensate heat recovery per unit of product | ||
| fuel consumption needed in process with condensate heat recovery | ||
| unit mass of fuel consumption needed for feed water preheating with air preheater in process with condensate heat recovery | ||
| unit volume of fuel consumption needed for air preheating with air preheater (AP) | ||
| fuel savings in process with air preheater | ||
| fuel savings in process with condensate heat recovery and air preheater | ||
| hourly production capacity | ||
| daily production capacity | ||
| monthly production capacity | ||
| yearly production capacity | ||
| the rate of fuel consumption per hour in basic process | ||
| the rate of fuel consumption per day in basic process | ||
| the rate of fuel consumption per month in basic process | ||
| the rate of fuel consumption per year in basic process | ||
| quantity of condensate from the process | ||
| the rate of fuel consumption per hour in process with air preheater | ||
| the rate of fuel consumption per day in process with air preheater | ||
| the rate of fuel consumption per month in process with air preheater | ||
| the rate of fuel consumption per year in process with air preheater | ||
| the rate of fuel consumption per hour in process with condensate heat recovery | ||
| the rate of fuel consumption per day in process with condensate heat recovery | ||
| the rate of fuel consumption per month in process with condensate heat recovery | ||
| the rate of fuel consumption per year in process with condensate heat recovery | ||
| the rate of fuel consumption per hour in process with condensate heat recovery and air preheater | ||
| the rate of fuel consumption per day in process with condensate heat recovery and air preheater | ||
| the rate of fuel consumption per month in process with condensate heat recovery and air preheater | ||
| the rate of fuel consumption per year in process with condensate heat recovery and air preheater | ||
| the rate of fuel consumption per hour in solarized basic process | ||
| the rate of fuel consumption per hour in solarized process with air preheater | ||
| the rate of fuel consumption per hour in solarized process with process condensate heat recovery | ||
| the rate of fuel consumption per hour in solarized process with condensate heat recovery and combustion air preheating using flue gases | ||
| electrical energy consumption per unit of product | ||
| enthalpy of steam | ||
| enthalpy of boiler feed water | ||
| enthalpy of condensate | ||
| lower heating value | ||
| heat transferred to the boiler per unit of product | ||
| heat of condensate per unit of product in basic process | ||
| heat of process condensate to preheat water per unit of product in process with condensate heat recovery | ||
| condensate heat discharged to the surroundings in process with condensate heat recovery | ||
| energy released during complete combustion per unit mass of the fuel | ||
| energy released during complete combustion per unit of products | ||
| flue gas heat recovery in process with air preheater per unit of products | ||
| flue gas heat recovery in process with condensate heat recovery and air preheating | ||
| overall heat transfer rate to the boiler per hour in basic process | ||
| overall heat transfer rate to the boiler per day in basic process | ||
| overall heat transfer rate to the boiler per month in basic process | ||
| overall heat transfer rate to the boiler per year in basic process | ||
| overall heat transfer rate with air preheater to the boiler per hour | ||
| overall heat transfer rate with air preheater to the boiler per day | ||
| overall heat transfer rate with air preheater to the boiler per month | ||
| overall heat transfer rate with air preheater to the boiler per year | ||
| overall heat transfer rate to the boiler per hour in process with condensate heat recovery | ||
| overall heat transfer rate to the boiler per day in process with condensate heat recovery | ||
| overall heat transfer rate to the boiler per month in process with condensate heat recovery | ||
| overall heat transfer rate to the boiler per year in process with condensate heat recovery | ||
| overall heat transfer rate to the boiler per hour in process with condensate heat recovery and air preheater | ||
| overall heat transfer rate to the boiler per day in process with condensate heat recovery and air preheater | ||
| overall heat transfer rate to the boiler per month in process with condensate heat recovery and air preheater | ||
| overall heat transfer rate to the boiler per year in process with condensate heat recovery and air preheater | ||
| fuel savings in process with air preheater | ||
| fuel savings in process with condensate heat recovery | ||
| fuel savings in process with condensate heat recovery and air preheater | ||
| fuel savings in solarized basic process | ||
| fuel savings in solarized process with air preheater | ||
| fuel savings in solarized process with process condensate heat recovery | ||
| fuel savings in solarized process with condensate heat recovery and combustion air preheating using flue gases | ||
| temperature of condensate | ||
| temperature of boiler steam | ||
| temperature of water after mixing of the condensate and make up water | ||
| temperature of exhaust flue gases | ||
| air preheater flue gases outlet temperature in process with condensate heat recovery | ||
| air preheater flue gases inlet temperature in process with condensate heat recovery | ||
| Inlet temperature of air | ||
| air preheater air outlet temperature | ||
| air preheater air inlet temperature | ||
| air preheater flue gases outlet temperature | ||
| air preheater flue gases outlet temperature | ||
| temperature of boiler feed water inlet | ||
| actual volume of air calculated with the excess air coefficient | ||
| volume of inlet boiler air per unit of fuel | ||
| unit volume of fuel requirement | ||
| volume of flue gases per unit of fuel | ||
| volume of carbon dioxide in flue gases per unit of fuel | ||
| volume of nitrogen in flue gases per unit of fuel | ||
| minimum volume of oxygen in flue gases per unit of fuel | ||
| volume of oxygen in flue gases per unit of fuel | ||
| volume of water vapour in flue gases per unit of fuel | ||
| volume of rejected exhaust flue gases calculated per hour to the surrounding in process with economizer | ||
| volume of rejected exhaust flue gases calculated per hour to the surrounding in process with air preheater | ||
| volume of rejected exhaust flue gases calculated per hour to the surrounding in process with condensate heat recovery | ||
| volume of rejected exhaust flue gases calculated per hour to the surrounding in process with condensate heat recovery and air preheater | ||
| volume of rejected exhaust flue gases calculated per hour to the surrounding in solarized basic process | ||
| volume of rejected exhaust flue gases calculated per hour to the surrounding in solarized process with air preheater | ||
| volume of rejected exhaust flue gases calculated per hour to the surrounding in solarized process with process condensate heat recovery | ||
| volume of rejected exhaust flue gases calculated per hour to the surrounding in solarized process with condensate heat recovery and combustion air preheating using flue gases | ||
| volume of flue gases per unit of product | ||
| total volume of flue gases per unit of fuel | ||
| volume of exhaust flue gases per unit of product rejected to the surrounding in process with air preheater | ||
| volume of rejected exhaust flue gases calculated per unit of product to the surrounding in process with condensate heat recovery | ||
| volume of rejected exhaust flue gases calculated per unit of product to the surrounding in process with condensate heat recovery and air preheater | ||
| volume of excess air per unit of fuel | ||
| boiler efficiency | % | |
| air preheater efficiency | % | |
| collector efficiency | % | |
| collector area | ||
| mean flat plate collector area | ||
| daily heat input to the boiler | ||
| useful daily radiation | ||
| average daily radiation (insolation) | ||
| monthly useful solar energy | ||
| yearly useful radiation | ||
| number of days in a month | ||
| security factor for large collector installation | - | |
| excess air coefficient | - | |
| usage factor | % | |
| operating time |
Abbreviations
| BCHP | building combined cooling heating and power |
| AP | air preheater |
| HPHE | heat pipe heat exchanger |
| CHP | conventional heat pipe |
| TPCT | two-phase closed thermosyphon |
| OHP | oscillating heat pipe |
| WHR | waste heat recovery systems |
| HHRS | hybrid heat recovery systems |
| CHR | condensate heat recovery |
References
- Speight, J.G. Handbook of Petrochemical Processes; CRC Press, Taylor & Francis Group: Boca Raton, FL, USA, 2019; ISBN 978-1-4987-2970-3. [Google Scholar]
- Wehlan, A.; Lee, K.S. Developments in Rubber Technology—2; Springer: Dordrecht, The Netherlands, 1981; ISBN 978-9-40098-110-2. [Google Scholar]
- Akovali, G. Advances in Polymer Coated Textiles; Smithers Rapra Technology Ltd.: Shropshire, UK, 2012; ISBN 978-1-84735-497-6. [Google Scholar]
- Ahrends, A.; Hollingsworth, P.M.; Ziegler, A.D.; Fox, J.; Chen, H.; Su, Y.; Xu, J. Current trends of rubber plantation expansion may threaten biodiversity and livelihoods. Glob. Environ. Chang. 2015, 34, 48–58. [Google Scholar] [CrossRef]
- Valiev, A.; Zemskii, D. The catalytic cracking of the off-spec polyisoprene rubber thermolysis products. E3S Web Conf. 2020, 157, 02027. [Google Scholar] [CrossRef]
- Musikavong, C.; Gheewala, S.H. Assessing ecological footprints of products from the rubber industry and palm oil mills in Thailand. J. Clean. Prod. 2017, 142, 1148–1157. [Google Scholar] [CrossRef]
- Jawjit, W.; Pavansant, P.; Kroeze, C. Evaluation environmental performance of concentrated latex production in Thailand. J Clean. Prod. 2015, 98, 84–91. [Google Scholar] [CrossRef]
- Jawjit, W.; Rattanapan, S.; Kroeze, C. Greenhouse gases emissions of rubber industry in Thailand. J. Clean. Prod. 2010, 18, 403–411. [Google Scholar] [CrossRef]
- Jawjit, W.; Pavasant, P.; Kroeze, C.; Tuffrey, J. Evaluation of the potential environmental impacts of condom production in Thailand. J. Integr. Environ. Sci. 2021, 18, 89–114. [Google Scholar] [CrossRef]
- Batten, R.; Karanjikar, M.; Spatari, S. Bio-Based Polyisoprene Can Mitigate Climate Change and Deforestation in Expanding Rubber Production. Fermentation 2021, 7, 204. [Google Scholar] [CrossRef]
- Panda, B.K.; Sarkar, S. Environmental impact of rubber plantation: Ecological vs. economical perspectives. Asian J. Microbiol. Biotechnol. Environ. Sci. 2020, 22, 657–661. [Google Scholar]
- Sarkar, P.; Bhowmick, A.K. Sustainable rubbers and rubber additives. J. Appl. Polym. Sci. 2018, 135, 45701. [Google Scholar] [CrossRef]
- Asghar, U.; Masoom, A.; Javed, A.; Abbas, A. Economic Analysis of Isoprene Production from Good Year Scientific Process. Austin Chem. Eng. 2020, 7, 1071. [Google Scholar] [CrossRef]
- Johnson, I.; Choate, W.T.; Davidson, A. Waste Heat Recovery. Technology and Opportunities in U.S. Industry; Technical Report; BSC Inc.: Laurel, MS, USA, 2008. [Google Scholar]
- Bruckner, S.; Liu, S.; Laia, M.; Radspieler, M.; Cabeza, L.F.; Eberhard, L. Industrial waste heat recovery technologies: An economic analysis of heat transformation technologies. Appl. Energy 2015, 151, 157–167. [Google Scholar] [CrossRef]
- Zhao, X.L.; Fu, L.; Zhang, S.G.; Jiang, Y.; Li, H. Performance improvement of a 70 kWe natural gas combined heat and power (CHP) system. Energy 2010, 35, 1848–1853. [Google Scholar] [CrossRef]
- Fu, L.; Zhao, X.L.; Zhang, S.G.; Jiang, Y.; Li, H.; Yang, W.W. Laboratory research on combined cooling, heating and power (CCHP) systems. Energy Convers. Manag. 2009, 50, 977–982. [Google Scholar] [CrossRef]
- Thumann, A. Plant Engineers & Managers; Guide to Energy Conservation, 8th ed., The Fairmont Press: Lilburn, GA, USA, 2002. [Google Scholar]
- Mihelić-Bogdanić, A.; Budin, R.; Špelić, I. Impact of hybrid system in polyester production. Cogent. Eng. 2017, 4, 1362198. [Google Scholar] [CrossRef]
- Chen, W.; Shi, W.; Wang, B.; Shang, S.; Li, X. A deep heat recovery device between flue gas and supply air of gas-fired boiler by using non-contact total heat exchanger. Energy Procedia 2017, 105, 4976–4982. [Google Scholar] [CrossRef]
- Jia, L.; Peng, X.F.; Sun, J.D.; Chen, T.B. An Experimental Study on Vapor Condensation of Wet Flue Gas in a Plastic Heat Exchanger. Heat Trans. Asian Res. 2001, 30, 571–580. [Google Scholar] [CrossRef]
- Srimuang, W.; Amatachaya, P. A review of the applications of heat pipe heat exchangers for heat recovery. Renew. Sustain. Energy Rev. 2012, 16, 4303–4315. [Google Scholar] [CrossRef]
- Hou, J.; Che, D.; Liu, Y.; Jiang, Q. A New System of Absorption Heat Pump Vs. Boiler for Recovering Heat and Water Vapor in Flue Gas. Energy Procedia 2018, 152, 1266–1271. [Google Scholar] [CrossRef]
- Wang, S.L.; Zhang, J.F.; Wen, Z.; Pan, S.Y.; Liu, J.; Wu, Y.Y. Forced convective heat transfer of flue gas on anticorrosion plane surface with condensation. In Proceedings of the 13th International Heat Transfer Conference, Sydney Convention and Exhibition Centre, Sydney, Australia, 13–18 August 2006; Leonardi, E., De Vahl Davis, G., Eds.; Begell House Inc.: Danbury, CT, USA, 2006. [Google Scholar]
- Kan, Z.; Xia, J.; Xie, X.; Jiang, Y. Total heat recovery of gas boiler by absorption heat pump and direct-contact heat exchanger. Appl. Therm. Eng. 2014, 71, 213–218. [Google Scholar]
- Jouhara, H.; Khordehgah, N.; Almahmoud, S.; Delpech, B.; Chauhan, A.; Tassou, S.A. Waste heat recovery technologies and applications. Therm. Sci. Eng. Prog. 2018, 6, 268–289. [Google Scholar] [CrossRef]
- Bălănescu, D.T.; Homutescu, V.T.; Popescu, A. In situ study on the condensate latent heat recovery and its economic impact in the case of a 60 kW condensing boilers system. In IOP Conference Series: Materials Science and Engineering, Proceedings of the 9th International Conference on Advanced Concepts in Mechanical Engineering—ACME 2020, Iași, Romania, 4–5 June 2020; Mechanical Engineering Faculty, Gheorghe Asachi Technical University of Iasi: Iasi, Romania, 2020; Volume 997, p. 012139. [Google Scholar]
- Kalogirou, S.A. The potential of solar industrial process heat applications. Appl. Energy 2003, 76, 337–361. [Google Scholar] [CrossRef]
- Farhat, O.; Faraj, J.; Hachem, F.; Castelain, C.; Khaled, M. A recent review on waste heat recovery methodologies and applications: Comprehensive review, critical analysis and potential recommendations. Clean. Eng. Technol. 2022, 6, 100387. [Google Scholar] [CrossRef]
- Jamil, S.R.; Wang, L.; Che, D. Techno-economic analysis of a novel hybrid heat pump system to recover waste heat and condensate from the low- temperature boiler exhaust gas. Int. J. Energy Res. 2020, 44, 3821–3838. [Google Scholar] [CrossRef]
- Brown, L.H.; Hamel, B.B.; Hedman, B.A. Energy Analysis of 108 Industrial Processes; Fairmont Press: Philadelphia, PA, USA, 1996; ISBN 0-915586-93-2. [Google Scholar]
- Budin, R.; Mihelić-Bogdanić, A.; Vujasinović, E. Cogeneration and Heat Recovery in the Industrial Process. Chem. Ind. 2007, 56, 551–555. [Google Scholar]
- Budin, R.; Mihelić-Bogdanić, A. Basics of Technical Thermodynamics, 3rd ed.; Školska Knjiga: Zagreb, Croatia, 2012; ISBN 9789530316881. [Google Scholar]
- Turner, W.C. (Ed.) Energy Management Handbook, 8th ed.; Fairmont Press: Philadelphia, PA, USA, 2012; ISBN 9781466578289. [Google Scholar]
- Bošnjaković, F. The Science of Heat; Grafis: Zagreb, Croatia, 2012; Volume 1, pp. 2–3. ISBN 9789532790177. [Google Scholar]
- Flue Gas Heat Recovery. Power Systems, Babcock Borsig Steinmüller GmbH. Brochure. 2012. Available online: http://www.bbs.bilfinger.com/fileadmin/power_steinmuller/Mediathek/Broschuere_Rauchgasw_rmenutzung_BBS_web_E.pdf (accessed on 13 July 2017).
- Eades, W.G. Energy and water recovery using air-handling unit condensate from laboratory HVAC systems. Sustain. Cities Soc. 2018, 42, 162–175. [Google Scholar] [CrossRef]
- Einstein, D.; Worrell, E.; Khrushch, M. Steam systems in industry: Energy use and energy efficiency improvement potentials. In Proceedings of the ACEEE 2001 Summer Study on Energy Efficiency in Industry; American Council for an Energy-Efficient Economy (ACEEE): Washington, DC, USA, 2001; pp. 535–547. [Google Scholar]
- Luo, X.; Huang, X.; El-Halwagi, M.M.; Ponce-Ortega, J.M.; Chen, Y. Simultaneous synthesis of utility system and heat exchanger network incorporating steam condensate and boiler feedwater. Energy 2016, 113, 875–893. [Google Scholar] [CrossRef]
- Levy, E.; Bilirgen, H.; DuPont, J. Recovery of Water from Boiler Flue Gas Using Condensing Heat Exchangers; Final Technical Report; Energy Research Center: Bethlehem, PA, USA, 2011. [Google Scholar]
- Budin, R.; Mihelić-Bogdanić, A. Sources and Energy Management in Industry; Element: Zagreb, Croatia, 2013. [Google Scholar]
- Rockenbaugh, C.; Dean, J.; Lovullo, D.; Lisell, L.; Barker, G.; Hanckock, E.; Norton, P. High Performance Flat Plate Solar Thermal Collector Evaluation; General Services Administration by the National Renewable Energy Laboratory: Golden, CO, USA, 2016. [Google Scholar]


| Process | Fuel Consumption | Flue Gases’ Volume | Condensate Rejected to the Surroundings |
|---|---|---|---|
| Basic | 0.1384 | 1.7969 | 1.320 |
| Process | Fuel consumption | Flue gases’ volume | Condensate rejected to the surroundings |
| Basic | 415.2 | 5390.96 | 3960 |
| Process | Fuel Consumption | Flue Gases’ Volume | Condensate Rejected to the Surroundings |
|---|---|---|---|
| Air preheating | 0.1287 | 1.671 | 1.320 |
| Process | Fuel consumption | Flue gases volume | Condensate rejected to the surroundings |
| Air preheating | 386.16 | 5013 | 3960 |
| Process | Fuel Consumption | Flue Gases’ Volume | Condensate Rejected to the Surroundings |
|---|---|---|---|
| Air preheating and condensate heat recovery | 0.11353 | 1.474 | 0.132 |
| Process | Fuel consumption | Flue gases’ volume | Condensate rejected to the surroundings |
| Air preheating and condensate heat recovery | 340.59 | 4422.22 | 396 |
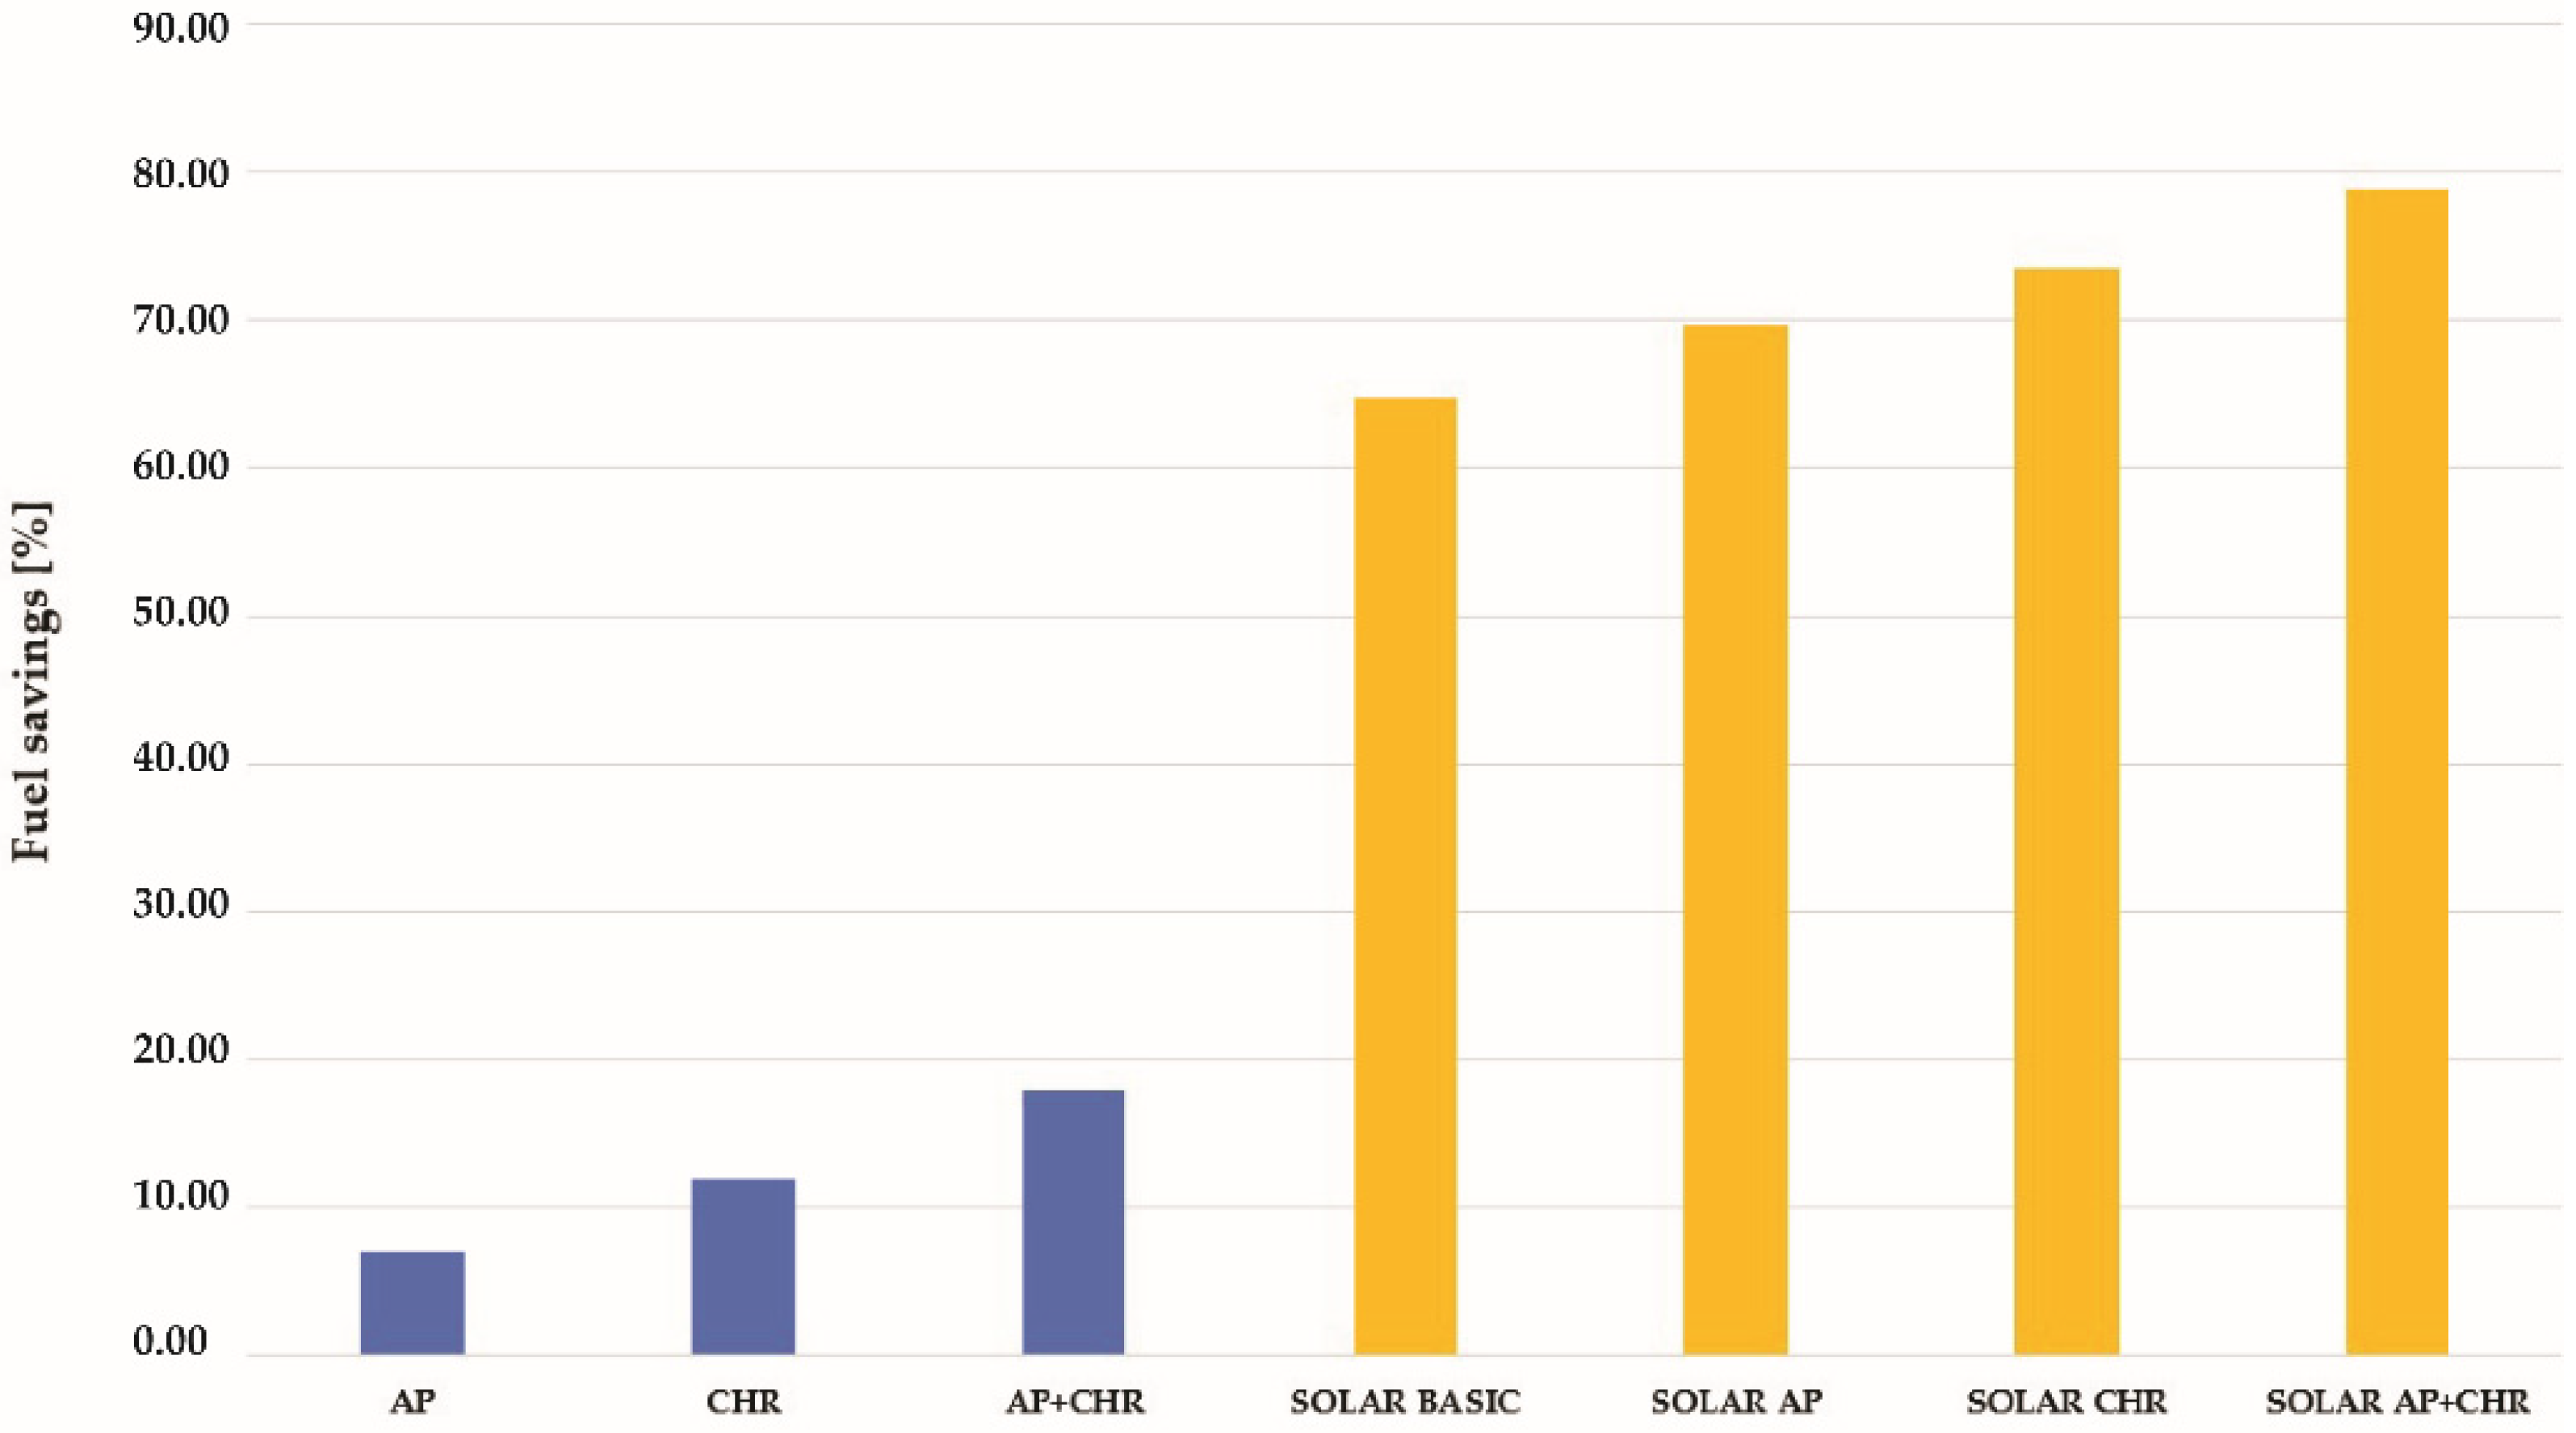
| Type of the Solarized Process | Fuel Consumption | Flue Gases’ Volume | Fuel Savings |
|---|---|---|---|
| Basic | 146.51 | 1902.28 | 64.71 |
| Air preheating | 117.35 | 1523.67 | 69.6 |
| Condensate heat recovery | 97.71 | 1262.17 | 73.44 |
| Air preheating and condensate heat recovery | 71.79 | 932.12 | 78.92 |
| Month | Average Daily Radiation, | Collector Efficiency, | Useful Daily Radiation, | Collector Area, | Days Per Month, | Monthly Useful Energy, |
|---|---|---|---|---|---|---|
| February | 6.5 | 25 | 1.63 | 103.89 | 28 | 0.59 |
| March | 9.7 | 25 | 2.43 | 69.69 | 31 | 0.974 |
| April | 14.8 | 25 | 7.4 | 22.28 | 30 | 2.872 |
| May | 19.3 | 50 | 9.65 | 17.55 | 31 | 3.869 |
| June | 20.6 | 50 | 13.4 | 12.66 | 30 | 5.084 |
| July | 21.3 | 65 | 13.85 | 12.22 | 31 | 5.554 |
| August | 18.7 | 65 | 12.16 | 13.93 | 31 | 4.876 |
| September | 14 | 65 | 7 | 24.19 | 30 | 2.716 |
| October | 8.6 | 50 | 2.1 | 80.64 | 31 | 0.842 |
| November | 3.6 | 25 | 0.9 | 188.16 | 30 | 0.34927 |
| Cost Item | Analysis |
|---|---|
| in Europe (www.barrons.com accessed on 26th July 2022) | |
| Investment cost prediction | |
| Annual consumption of heat transferred to the boiler in the basic process | |
| (Maraj et al., 2019) | |
| Annual production of heat with solar-based hybrid system | |
| Annual gas consumption in basic system |
| Process Variant | Annual Fuel Consumption | Annual Fuel Cost | Cost Savings |
|---|---|---|---|
) | (%) | ||
| AP | 6.05 | ||
| CHR | 12.39 | ||
| CHR and AP | 18.16 | ||
| Solar basic | 64.84 | ||
| Solar with AP | 71.75 | ||
| Solar with CHR | 76.65 | ||
| Solar with CHR and AP | 82.71 |
| Process | Fuel Consumption | Flue Gases’ Volume | Flue Gases Outlet Temperature | Condensate Rejected to the Surroundings | Fuel Savings |
|---|---|---|---|---|---|
| Basic | 0.1384 | 1.7969 | 204 | 1.320 | - |
| Air preheating | 0.1287 | 1.671 | 66.93 | 1.320 | 6.99 |
| Condensate heat recovery | 0.122 | 1.584 | 204 | 0.132 | 11.85 |
| Air preheating and condensate heat recovery | 0.11353 | 1.474 | 66.93 | 0.132 | 17.97 |
| Process | Fuel consumption | Flue gases’ volume | Condensate rejected to the surroundings | ||
| Basic | 415.2 | 5390.96 | 3960 | ||
| Air preheating | 386.16 | 5013 | 3960 | ||
| Condensate heat recovery | 366 | 4752.14 | 396 | ||
| Air preheating and condensate heat recovery | 340.59 | 4422.22 | 396 | ||
Publisher’s Note: MDPI stays neutral with regard to jurisdictional claims in published maps and institutional affiliations. |
© 2022 by the authors. Licensee MDPI, Basel, Switzerland. This article is an open access article distributed under the terms and conditions of the Creative Commons Attribution (CC BY) license (https://creativecommons.org/licenses/by/4.0/).
Share and Cite
Mihelić-Bogdanić, A.; Špelić, I. Energy Efficiency Optimization in Polyisoprene Footwear Production. Sustainability 2022, 14, 10799. https://doi.org/10.3390/su141710799
Mihelić-Bogdanić A, Špelić I. Energy Efficiency Optimization in Polyisoprene Footwear Production. Sustainability. 2022; 14(17):10799. https://doi.org/10.3390/su141710799
Chicago/Turabian StyleMihelić-Bogdanić, Alka, and Ivana Špelić. 2022. "Energy Efficiency Optimization in Polyisoprene Footwear Production" Sustainability 14, no. 17: 10799. https://doi.org/10.3390/su141710799
APA StyleMihelić-Bogdanić, A., & Špelić, I. (2022). Energy Efficiency Optimization in Polyisoprene Footwear Production. Sustainability, 14(17), 10799. https://doi.org/10.3390/su141710799