Abstract
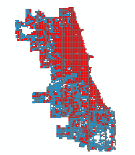
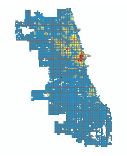
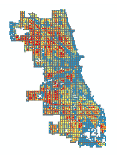
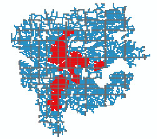
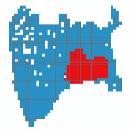
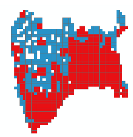
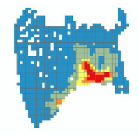
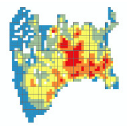
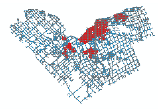
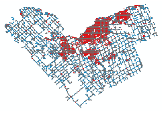
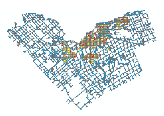
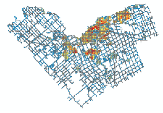
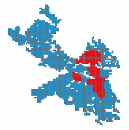
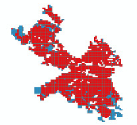
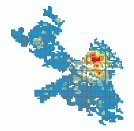
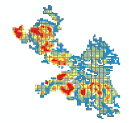
Spatial pattern (SP) helps to analyze the tasks and provisions that arise in the spatial planning and design disciplines examining a complex spatial system (CSS). The aim of this article is to present a territorial planning process and how SP description, identification, and application methodology (SPDIAM) can help to work with it using a CSS model. First, the quantitative spatial analysis methods and spatial network analysis tools that can be used to identify SP are compared with SPDIAM. Then, the main concepts of SPDIAM and created IT artefacts are explained. In the experiment section, the SP is identified using spatial metapatterns in different North American, European, and African cities and the correlation results of SP and statistics are calculated to show a medium to close relationship. Then, the territorial planning cycle and SPDIAM application use case using the data of Kaunas city (Lithuania) are presented. The results of SPDIAM can be used to associate the shape of the territory with the geographer models and Alexander patterns using the bottom-up modelling principle and allows us to standardize urban planning solutions.
1. Introduction
Territorial planning reshapes the forms and functions of cities and regions in order to generate economic growth, prosperity, and employment while addressing the needs of the most vulnerable groups [1]. Urban dynamics and the transformation of space require theoretical approaches and planning methodologies that enable an approximation to the ongoing processes from a complex and multidimensional perspective [2]. Spatial decision support tools can provide informative that is assistance for urban planners in order to meet the interconnected challenges of complex urban systems and to estimate the consequences of specific planning strategies [3], incorporate variables that were not initially considered, and evaluate hypotheses in the evolution of urban development [2].
Important progress has been made in the use of simulation models that attempt to represent urban growth and change [4], and various spatial simulations were created within the fields of system dynamics and agent-based modeling [3]. The observable patterns in complex organized systems allow us to understand a wide range of relationships that no other methods could attain which is extremely relevant in multi-disciplinary research [4]. In territorial planning, the model can be considered as a way to make an experiment using different variables, analyzing the effects that are produced, and the possibility to predict future scenarios of intervention according to the performance of the different variables that are included in the modeling [2]. Using a computer simulation tool has value only if it is possible to have a methodology to address complex variables simultaneously and to make decision-making processes more transparent with the clear advantages and disadvantages that are associated with a project [2].
A complex spatial system (CSS) defines a complex urban system or spatial entity and is described by many variables, with high levels of interdependence between the elements, governed by nonlinear processes, and having a significant spatial structure [5,6]. A spatial pattern (SP) may be regarded as a complex physical entity (such as a road) or as any kind of structure, spatial distribution, or a recurring feature (such as a street pattern) that is represented as lines, areas, or bodies in a 2D or 3D map [7,8]. The SP concept can help to analyze the tasks and provisions that arise in such spatial planning and design disciplines as the territorial planning. And even more—SP when used together with simulation models can add additional value to CSS analysis. The oldest SP are urban models that nowadays can be defined as computer simulation models, combining theory, data, and algorithms, and which are classified into basic models (scale, analogue, conceptual); mathematical models (normative, probabilistic, optimizing) [9]; descriptive and analytical models [10]; and land-use–transportation models, that are used to predict demographic and economic measures of land-based activities [9,11].
SP description, identification, and application methodology (SPDIAM) [11] was developed for describing and detecting such spatial economic, social, and environmental phenomena and providing basic information technology (IT) artefacts that can be used for the development of the spatial structure (such as network or grid) analysis tools in Geographic Information System (GIS) [6]. SPDIAM allows urban planning and design (UPD) practitioners to describe SP in a computerized manner, identify SP automatically and apply them in the spatial planning and design domain. An SPDIAM data model [6,11] is based on the theory of CSS, spatial configuration and spatial capital concepts, space syntax method, and visibility graph analysis (VGA) [12]. It creates a computer model of space and quantifies its configuration which can be used to handle geographic and geometric data that are associated with attribute information, to perform spatial, mathematical, and statistical calculations. SPDIAM can be used to describe and identify complex SP (the geographers’ models [13] and Alexander patterns [14]) and to apply them in CSS analysis in various domains. SPDIAM is a structural, ruled-based SP recognition method that provides SP structural description using spatial metapatterns and morphological relationships and uses space syntax topology and visibility analysis to identify the SP of road networks using GIS. It can be applied in spatial planning and design disciplines such as territorial planning to reveal the tasks and provisions of the urban development.
The main objective of this research is to test SPDIAM in the territorial planning process using CSS model to identify SP in different North American, European, and African cities and statistically evaluate the experimental results. For this purpose, several tasks were achieved as presented in Figure 1. First, the quantitative spatial analysis methods that can be used in territorial planning and to identify SP are compared with each other and SPDIAM. As the spatial network analysis is used in SPDIAM as the most promising and convenient method for SP identification, the network analysis tools are discussed and compared with SPDIAM. Then, the concepts of SPDIAM and created IT artefacts are briefly presented to understand SPDIAM logic. Then, the experiment of spatial data preparation, SP identification, and evaluation was conducted. After that the territorial planning cycle, SP and SPDIAM application in territorial planning use case, together with the detailed examples of each step using the data of Kaunas city (Lithuania), are presented and tested.

Figure 1.
Methodological flow diagram describing and solving spatial problems in territorial planning using SPDIAM.
2. Materials and Methods
2.1. Spatial Pattern in Territorial Planning
Territorial planning can be defined as a decision-making process that is aimed at realizing economic, social, cultural, and environmental goals through the development of spatial strategies and plans and the application of a set of policy principles, tools, and regulatory procedures [1]. Territorial planning is a process that is carried out in compliance with requirements of the laws which aims at sustainable territorial development and includes the establishment of land use priorities, measures of environmental protection, public health and heritage protection, and the creation of residential areas, manufacturing, engineering, and social infrastructure systems [15].
The objectives of territorial planning are very complex and consist of many different dimensions that are hard to evaluate and combine, especially in computerized manner. The comprehensive plan of the territory must be prepared in compliance with the directions of spatial development of the territory and functional priorities of the use of territories [15]. Complex territorial planning shall mean territorial planning for the establishment of spatial development directions and priorities of use and protection of territories [15]. The objects of special territorial planning shall be territories that are characterized by functional commonality: (1) territories that are intended for agriculture, forestry, use of subsoil resources and earth cavities, or other activity; (2) systems of the engineering infrastructure; and (3) the system of protected areas [15]. Therefore, territorial planning objectives are usually defined and set by different stakeholders as well as UPD practitioners and the public.
Different types of territorial planning methods exist and have been tested in many countries (city-wide strategic, master, community, land-use planning, etc.), and they all aim to influence urban forms and functions and do so in different ways, so that top-down and bottom-up approaches are combined [1]. Applying the model is possible to include the perspective of different urban actors (developers, organizations, etc.) in the evaluation, and to highlight the effects that are derived from a future intervention that could hypothetically represent the conflict of interest [2].
SP can help to find the functional priorities. For example, space syntax measures are already being used for Space Syntax OpenMapping platform in Great Britain [16]. SP can show the mixed functional zones, the multi-functionality, and reveal the most important zones, such as ecological zones that should not be reduced, where to establish the infrastructure or green areas, and so on. SP can be used to define the provisions for the use of a territory. Some practical use cases to illustrate SP application in such processes are: (a) the development of the dynamic plan (e.g., the plan that is based on simulation in real or conditional time or in compressed time); (b) the development of the digital twin-a digital city model that reflects the real city and allows us to observe or model real processes of the urban form; (c) development of the memory (heritage) map, sociotope (acceptable) map (methodology for the detailed use of public spaces) [17], acupuncture (measured as points) map, or general vision map (quick presentation of current and desired situation and their comparison); (d) decision-making on the land use functions; (e) development of the City Country Fingers map [14] to define the framework of the city vs. nature; (f) development of the ecological and biological SP for making nature frame analysis from ecologically or biologically important data; (g) the development of the Street Culture map [18] and be able to select the priority locations for the street culture objects; and (h) geographer models [13] and so on.
SPDIAM can be used in any of these fields as we can use the same steps to describe, identify, and apply different types of SP in various application fields. Only the principle of how to collect the input data that make up SP can differ, but the whole procedure is the same as described in [11].
2.2. Spatial Analysis in Territorial Planning
2.2.1. Quantitative Spatial Analysis Methods
The provisions of the use of the territory arising in the territorial planning discipline can be set using spatial analysis methods and tools. A number of modelling methods have been used to investigate urban development, such as cellular automata, geographic network automata, agent-based modelling, Monte Carlo simulations, random utility, network and land use, categorical maps of landscape type, input-output analysis, entropy, and system dynamics [4,19,20,21,22]. Also, there are many qualitative (morphological and morphographic descriptions) and quantitative (artificial neural networks, linear/logistic regression, decision trees) methods to identify SP [7,8,23]. In this section we discuss only those quantitative methods that meet two conditions: (1) can be used to analyze CSS, and (2) can be used to identify SP; therefore, such analysis methods as data mining or game theory are not considered.
There were five spatial analysis methods-agent-based modelling, cellular automata, fractal analysis, space syntax, and SPDIAM that were compared using the qualitative descriptive method [24]. The features of the possible SP identification methods are compared focusing on three groups of criteria: (a) CSS modelling [11,23,25,26,27,28,29], (b) method implementation [11,23,25,28], and (c) method application [23,25,26,27,28]. Such method implementation aspects as source code, type of agent, coding language, API for model development, integrated development environment, operating system, or implementation platform [25] have not been compared, as currently there are too many different options that can be applied to each method, thus the implementation method alone does not bring enough added value to the method.
For now, there is no one defined SP identification method, thus UPD practitioners tend to identify SP visually, based on observations or statistical data, and only some of the SP identification methods are using the bottom-up modelling principle. For example, fractal analysis is based on the examination of the urban morphology aspects, that can be associated with the functional features of the city. Also, it uses multi-hierarchy to define the urban morphology aspects that are related to the functional properties and the potential of the city. However, this method completely elucidates the Euclidean form [30] and it is difficult to associate with Alexander patterns and geographer models. The main advantage of cellular automata, agent-based modelling, and space syntax methods is that they are all based on the bottom-up modelling principle, that conforms to the complex nature of the city. These methods can be used to model and predict self-organizing SP. Additionally, space syntax also can cover the whole city due to the links that are modelled between the road segments. On the other hand, it is difficult to associate the cellular automata, agent-based, and space syntax models with Alexander patterns or geographer models. Applying space syntax analysis to urban planning and design has some limitations as incorrect radius and resolution of the axial map, limited knowledge of the combination, and correlation of space syntax with other types of analysis and data; these lead to misinterpretations of the space syntax results [31]. On the other hand, space syntax strength is derived from the highly effective connection between theory and practice at an architectural, urban, and regional scale and offers, in a more practical way, powerful methods for the description of the spatial features of sustainable and unsustainable cities [31]. For example, space syntax methodology for the determination of street lighting classes [32] can be used by lighting designers as a valuable alternative tool to a traffic observation campaign because space syntax analysis proved to be easier and faster than classical methods.
SPDIAM shares all the advantages of the other methods and can be used to compare different SP using the normalized space syntax values, further reducing the subjectivity of the method. SPDIAM no longer relies on statistical information and forms SP that is based on the complex model of CSS. SPDIAM can be used to associate the shape of the territory with the geographer models using the bottom-up modelling principle [11]. The restriction of SPDIAM is that it requires practical experiments to acquire the values of SP for SP identification.
2.2.2. Spatial Network Analysis Tools
Spatial network analysis is a collection of methods for measuring accessibility potentials and analyzing flows over transport networks [33]. As we go deeper into the analysis of the quantitative spatial analysis methods, the spatial network analysis proves itself as the promising and convenient method for SP identification. The network analysis model provides a time-compressed overall picture compared to other methods and it does not require rules to be detailed for the individual population groups in a particular city, which is a labor-intensive process. With network analysis methods such as space syntax, the preparation and analysis of input data is simpler, so it suits for the large urban structure analysis. Another important argument is that both the data of the existing streets network and the data of the planned streets network are usually available as the input data for this method.
Computational models of spatial networks for GIS are frequently used in applications such as spatial planning, transport analysis, supply infrastructures, and the analysis of flows [33]. The analysis of the spatial network analysis tools was conducted by comparing features, provided measures, and techniques of network vertices mapping. The analysis of the spatial network analysis tools included spatial design network analysis [34], the Urban Network Analysis Toolbox [35,36], multiple centrality assessment [37], DepthmapX [38], QGIS Space Syntax Toolkit [39,40], ArcGIS Network analyst [41], Centrality Analysis Tools (ESRI) [42,43], and Confeego [44].
After the analysis, it can be seen that some improvements could be done to the quantitative and the qualitative characteristics of the network analysis. All the network analysis tools that are listed above operate only with the simple measures of centrality [45] (Integration, Choice, etc.). The aggregated and complex measures would allow us to combine basic measures and to define new ones. QGIS Space Syntax Toolkit (using DepthmapX) already works with normalized measures and DepthmapX lets us write the normalized measures formulas, but yet it is not widely used. The method that would use normalized measures in spatial network analysis would enable the comparison of the different size spatial entities and between their elements. ArcGIS Network analyst (ESRI) focuses only on the analysis of the individual network vertices rather than the whole network. Most of the other network analysis tools use the whole network information, but don’t use normalized measures. The method that could offer both will also improve the characteristics of the existing spatial network analysis tools.
Although spatial network analysis has been part of GIS for a long time, designing network analytical workflows still requires a considerable amount of expertise, and although the underlying graph algorithms [46] are well understood, we still lack a conceptual model that captures the required methodological know-how [33]. Analyzed spatial network analysis tools do not offer capabilities to describe SP, SP identification methods, and measures; this can be seen as the main SPDIAM quantitative and qualitative improvement to the spatial network analysis tools family. Space syntax-based SP can be linked to various information and distinguished on its basis (by supplementing space syntax measures with other indicators), also space syntax-based SP can be easily compared with other SP (e.g., population density, economic typology of activities, etc.), thus the addition of SP would show the versatility of the proposed model.
2.3. SPDIAM Concepts
SPDIAM was described in detail in [6,11], thus in this section we present the main principles to understand how SPDIAM works to make it possible to apply it in the territorial planning cycle as described in further Section 3.4. SPDIAM consists of the concepts that are presented in Figure 2 based on which SPDIAM static and dynamic views are created. SPDIAM static view (Figure 3) is SPDIAM conceptual data model that let us describe, identify, and apply SP. The SPDIAM dynamic view (Figure 4) presents SPDIAM application process and consists of three phases: SP description, SP identification, and SP application. In the SP description phase SP is connected with the problem and some thematically-related indicators and can have some values. In the SP identification phase, the SP identification method is connected with possible operations. Each operation is defined by the measures. The measure can be calculated for the element of the spatial structure. In the SP application phase, the spatial structure should be filled with the spatial data of CSS, the indicators should be filled with the indicators layer data, and then the objectives for CSS development can be set.
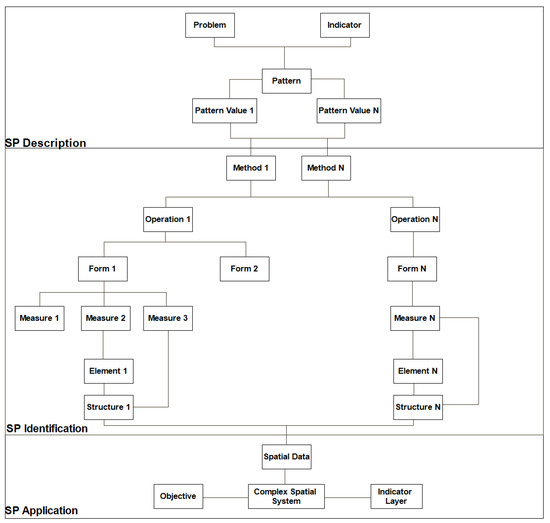
Figure 2.
SPDIAM concepts: the relationships between the concepts show the simplified logical connections in every SPDIAM phase.
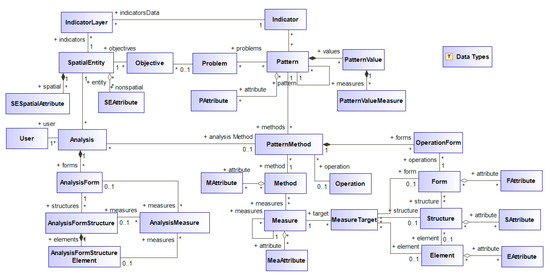
Figure 3.
SPDIAM static view: conceptual data model [11] (UML Class diagram).
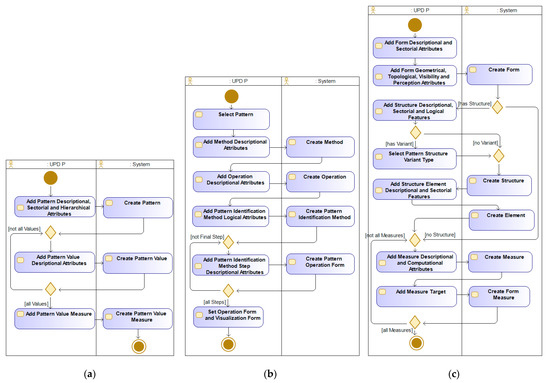
Figure 4.
SPADIAM dynamic view: (a) SP creation; (b) SP identification method creation; (c) SP identification method’s step creation (UML Activity diagram).
The static view of SPADIAM is defined by Unified Modeling Language (UML) Class diagram (Figure 3), and it consists of five main parts that are dedicated to described: (1) SP, (2) SP identification method, (3) SP identification method steps, (4) spatial entity (or CSS), and (5) spatial entity analysis. The two principal SPDIAM concepts are PatternMethod class, which defines specific Pattern class identification methods, and the Analysis class, which defines a user-created instance of SpatialEntity class analysis. Once the SP identification method is described, the process of SP identification can be defined. This process uses two main classes-Form (defines different SP forms that are emerging in SP identification process) and Structure (defines spatial structures of the Form class and is based on SpatialEntity class spatial data). Also, the measures that will be used to estimate the features of SP form, structure, and its elements are defined by the MeasureTarget class. Both instances of Form and Structure class can be reused for other SP, using the same method, so it makes the SP description process simpler in the future [11].
In Figure 4, new SP, its values and measures, SP identification method, and its step creation algorithms using the forms and structures are presented.
3. Results
3.1. Introduction and Input Spatial Data Preparation
In this section we present a case study to prove that SPDIAM can identify SP that later can be used in the territorial planning process. The previous case study [6] was dedicated to the general SP and metapattern model and spatial metapattern identification experiment, that showed that three VGA measures (Isovist compactness, drift magnitude, mean depth) are suitable for SP identification as their values show clear ranges for different spatial metapattern values (measure value approaching to 0 shows line, and approaching to 1-circle metapattern value) and that the general SP and metapattern models and IT artefacts that are presented in [6] can be used to describe and identify spatial metapatterns in the spatial vector data of CSS, taking into account CSS analysis problems. This case study is dedicated to SP identification using those metapatterns that were identified in [6]. There are three steps of the experiment that are conducted: (1) spatial metapatterns and their values preparation; (2) spatial metapattern assignment to the city parts (e.g., parts of CSS); and (3) calculation of SP identification based on the spatial metapattern. As a result, four SP (Linear, Star, Sector, Concentric Zone) are identified in 12 cities data.
This case study also includes an input data preparation experiment. The vector map data (taken from [47]) in *. SHP format of 12 North American, European, and African cities (Baltimore (USA), Chicago (USA), Gdansk (Poland), Helsinki (Finland), Ibadan (Nigeria), Kaunas (Lithuania), Klaipeda (Lithuania), Nice (France), Vilnius (Lithuania), Stockholm (Sweden), Bucharest (Romania), and Ottawa (Canada)) were prepared as described in [6]. Then, these primary spatial structures in *. DXF format was imported into DepthmapX (0.5.0.) [38], the Grid property was set to 200x200 (as the same grid size was used in all the experiments) and a separate map (*.GRAPH file) for each independent part of the city was created. The independent part is defined by the rule, that it is not connected in any of the other parts of the city. Then, each map was transformed to Visuality Graph using DepthmapX (0.5.0.). As a result, 41 Visuality Graphs were prepared for the separate parts of 12 cities as input data for the experiment.
3.2. Spatial Pattern Identification Using Spatial Metapattern
Step 1: Spatial metapatterns and their values preparation. We selected 6 basic spatial metapatterns and their value measures that were calculated in [6]. Then, we performed the cluster analysis on these 6 basic spatial metapatterns and their measures by selecting K-Means Cluster Analysis [48] and using IBM SPSS Statistics [49] tool. The goal of this step was to create six clusters of three space syntax measures and their values, to use these measurement value combinations to identify SP using metapatterns. The K-Means cluster analysis procedure attempts to identify relatively homogeneous groups of cases based on selected characteristics using an algorithm that requires specifying the number of clusters [48]. The results of the K-Means cluster analysis are presented in Table 1. As the MAX values of each measure show the best result (e.g., the biggest difference in clusters), only the MAX values were used further.

Table 1.
Spatial metapattern identification results of K-Means cluster analysis of Isovist cgfdompactness, drift magnitude, and mean depth measures (MIN, MEAN, and MAX values).
Step 2: Spatial metapattern assignment to CSS parts. First, VGA was performed using DepthmapX to calculate Isovist Properties and Calculate visibility relationships (using options Include global measures and Radius = n) and to get MAX measure values on 41 Visuality Graphs of the parts of 12 cities. The calculated values of space syntax measures (Isovist compactness, drift magnitude, mean depth) are presented in Table 2. Then, K-Means Cluster Analysis was performed on the parts of 12 cities and their measures by using the IBM SPSS Statistics [49] tool. The parts of the cities were clustered in six clusters and each of them had assigned metapattern from the previous step.

Table 2.
Results of K-Means cluster analysis results of city parts of Isovist compactness, drift magnitude, and mean depth measures (MAX values).
Step 3: SP identification based on spatial metapattern. First, each city part was assigned a spatial metapattern value and additional map-defined measures: PART SIZE (how big is the part of CCS), PART COUNT (how many separate parts CSS has), and PART DOMINATION (expresses the percentage dominance of the specific part size comparing to all CCS). Then, the biggest part is taken and its identified metapattern is evaluated and assigned as SP using the simple rules that are listed in Table 3.

Table 3.
Metapattern and corresponding SP relationship.
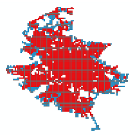
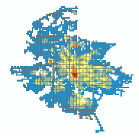
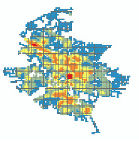
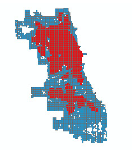
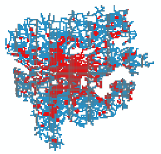
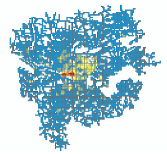
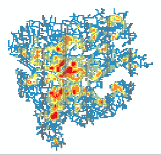
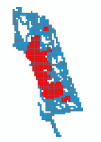
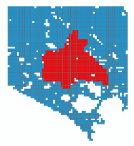
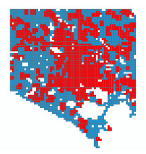
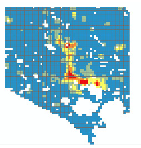
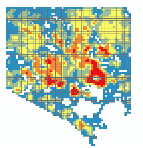
The final result of spatial entities SP identification is presented in Table 4. For example, Baltimore has only one part (PART COUNT = 1). In such cases, the size of the part (PART SIZE) and the domination of the part (PART DOMINATION) is not important. The visibility graph of Baltimore is presented in Image column. Using this visibility graph, three measures are calculated and then based on the values of these measures the cluster is assigned (see Table 2), so Cluster = 3. Then, the value of the whole city spatial metapattern is assigned using the method that is described above, so the resulting metapattern = Star4. As the spatial metapattern Star4 refers to SP Star (please see Table 4), Star is identified as SP for Baltimore.

Table 4.
SPDIAM entities and variables that were used for SP identification using spatial metapatterns.
The same logic applies to the cities with more than one structural part such as Bucharest. As Bucharest 3 is the biggest part of all the Bucharest parts (PART SIZE = 644) and the most dominant part of the city (PART DOMINATION = 87%), the whole process that is described above is repeated for Bucharest 3, and as the result its metapattern Star4 is identified, that leads to the decision that SP of Bucharest is also Star. Such decisions can be automated using SPDIAM data model.
The results of the experiment show that SP can be calculated using spatial metapatterns that are based on the clustering analysis of three space syntax measures MAX values (Isovist compactness, drift magnitude, and mean depth). After that, using three map-defined measures (PART SIZE, PART COUNT, PART DOMINATION) and simple rules, the evaluation of the identified spatial metapattern can be made and an automated decision can be taken which SP must be selected as an SP value. This solution is suitable for those spatial entities (or CSS) that have a high percentage of the central part. However, a simple refinement of SPDIAM and the proposed algorithm can be made, given that if a spatial entity does not have one larger part, then its SP must be evaluated in terms of the fact that the spatial entity can be multi-nuclei.
3.3. Experiment Results Evaluation and Statistics Data Correlation
The results of the experiment show that SP can be calculated using the evaluation of the identified spatial metapattern, map-defined measures, and simple rules and that automated decision can be taken which SP value must be selected. In order to check if the identified SP reflect real processes in urban structures, SP was compared to the points of interest (POIS) open data which represent the various objects of attraction of human activities can be related to human flows, etc. It is expected that identified SP should correspond to the allocation of POIS, and the results of the correlation are presented in Table 5.

Table 5.
SP, points of interest (POIS) and buildings density correlation results (ESRI ArcMap).
In Table 6, all of the cities were compared using the size of entire city area, the size of the area that was occupied by SP, and the size of SP area compared to the entire city area. Based on such comparisons, various conclusions can be drawn about the location, proportions, and possible scenarios of urban development in the cities center and periphery. For all cities several statistical indicators were calculated, such as Kramer’s association coefficient, Pearson’s correlation coefficient, and Spearman rank correlation, between SP and POIS and building density data. Then, the correlation significance was verified by calculating the approximate significance and Sig (2-tailed) p-value. The SP correlation results are summarized in Table 6 and show a medium to close (from 0.3 to 0.5) relationship between the identified SP and the statistics and all the correlations are at the 0.01 significance level, which means that there is only 1% probability that they are random.

Table 6.
City and SP correlation results and results significance.
The data of Stockholm shows a negative correlation, as due to the natural conditions (Stockholm is located in the archipelago), the urban structure adapts to the nature and cannot follow the laws of brevity or straightforwardness that normally affects the formation of the urban structure. A weak correlation in Ibadan could be explained by the following: (1) lack of reliable data, (2) a relatively low number of POIS in relation to the territory of both city and SP, and (3) peculiarities of the city itself. Helsinki is located on island-peninsulas, so the geographical situation largely determines the urban structure. In such cases, the evaluation of SP depends on UPD practitioner estimation.
3.4. SPDIAM Application in Territorial Planning
In this section, the SPDIAM application use case in territorial planning will be discussed. Since the proposed method of SP identification allows us to talk about its prognostic potential, SPDIAM is generally suitable for both the analysis of SP and the evaluation of the possible alternatives, as well as the evaluation of the effectiveness of the chosen final solution. The territorial planning cycle is presented in Figure 5.
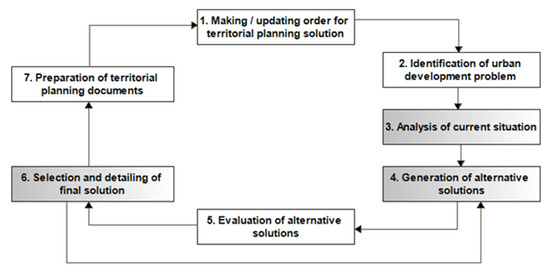
Figure 5.
The territorial planning cycle (grey blocks indicate the steps that can be implemented using SPDIAM).
The main roles participating in the territorial planning are: Stakeholder (developer, investor)-defines a person who has an interest or concern in something especially a business; (1) UPD practitioner-can be seen as a moderator of all stakeholders’ interests; (2) System-computerizes (and in some cases-automates) the steps of SPDIAM; Public-one or more natural and/or legal persons, their associations, organizations, or groups; Territorial Planning Specialist-specialist that is involved in the territorial planning process and territorial planning documents preparation. Given that the SP identification method is suitable for a variety of stakeholders, the SP application procedure in the territorial planning cycle are presented in Table 7.

Table 7.
SPDIAM and identified SP application in territorial planning.
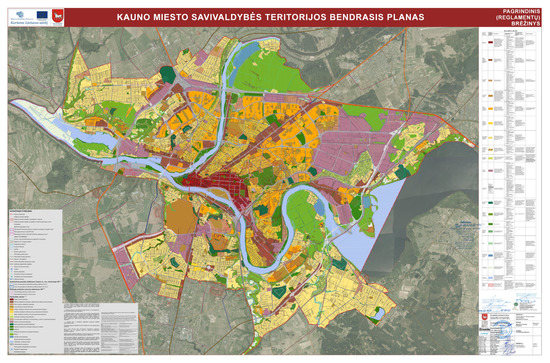
Figure 10.
Comprehensive plan of Kaunas city municipality territory for 2013–2023: main drawing [52].
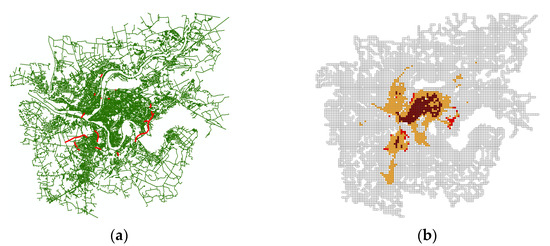
Figure 9.
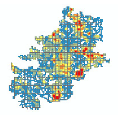
Second alternative for Kaunas (ESRI ArcMap): (a) Kaunas second alternative street network (new streets are marked in red); (b) Kaunas second alternative City Layout SP (changes are marked in red).
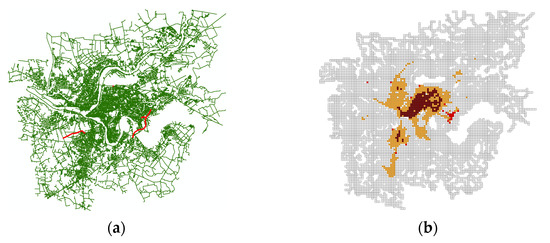
Figure 8.
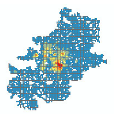
First alternative for Kaunas (ESRI ArcMap): (a) Kaunas first alternative street network (new streets are marked in red); (b) Kaunas first alternative City Layout SP (changes are marked in red).
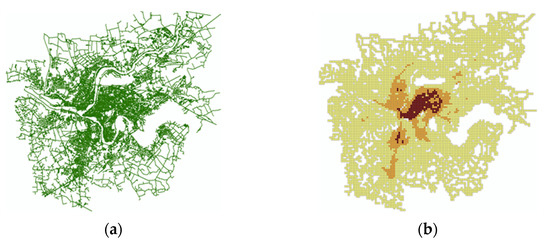
Figure 7.
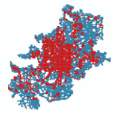
Current situation in Kaunas (ESRI ArcMap): (a) Kaunas current street network; (b) Kaunas City Layout SP.
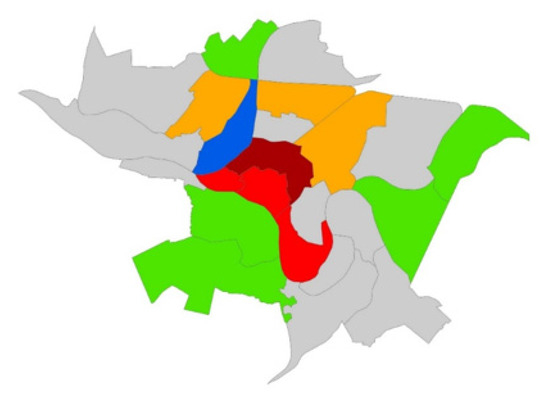
Figure 6.
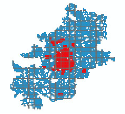
Kaunas social infrastructure areas and their development [51]: historical core area (red); representative area (dark red); poor infrastructure area (blue and yellow); relatively good infrastructure area (green).
Such knowledge of SP and metapatterns allows spatial planning and design professionals to standardize the proposed urban planning solutions, model different alternatives, and assess the impact on urban or other complex spatial structure development based on computable measures. Based on SP, urban development solutions can be compared with each other, thus gaining additional insights into the causes and factors that are associated with the functioning of a CSS. Also, the SP approach combines the spatial dimension with the social, cultural, and economic dimensions, and these interactions allow spatial planning and design professionals to interpret the urban spatial structure as spatial capital which interacts with social, economic, and ecological capitals.
4. Discussions
SPDIAM that was proposed and tested in this research expands the relatively simple simulative urban model that is based on the generic rules while making it more complex, e.g., creating the possibility to apply the same model to the various layers of the capitals of the city (spatial, ecological, social, etc.), creating the link with the fundamental theory of the architectural patterns by Alexander [14] and classification of the urban patterns in the field of geography [22]. The simulative nature of the model means that it has a predictive power and could be used as a part of the decision support system in the urban planning discipline.
The validation of SPDIAM is based on the following: (a) SP identification of the selected cities spatial structure that is based on the available open data; (b) statistical analysis of the relationships between the identified SP and available indicators of use intensity of spatial urban structure (density of buildings and amenities); (c) classification of identified SP according to the spatial form and an attempt to relate it to Alexander ‘s patterns.
The results of SP classification in different North American, European, and African cities using spatial metapattern experiments show that SP can be calculated using the evaluation of the identified spatial metapattern, map-defined measures, and simple rules and that automated decision can be taken which SP value must be selected. This solution is suitable for those CSS that have a high percentage of the central part, but a simple refinement of the proposed algorithm can be made, given that if a spatial entity does not have one larger part, then its SP must be evaluated in terms of the fact that CSS can be multi-nuclei.
The correlation results of SP and statistics show a medium to strong (from 0.3 to 0.5) relationship between the identified SP and the statistics and all correlations are at the 0.01 significance level, which means that there is only a 1% probability that they are random. In some cases, there is a lack of data (Ibadan), the archipelago influences and determines the even distribution (Stockholm), or the city is located on island-peninsulas so the geographical situation largely determines the urban structure (Helsinki). Then, the evaluation of SP depends on the UPD practitioner’s estimation as it is defined in one of SPDIAM phases.
The main advantage of the analyzed methods in comparison to the reviewed ones is that cellular automata, agent-based modelling, and space syntax or mathematical graph-based methods are all based on the bottom-up modelling principle and can be used to model and predict self-organizing SP, but it is difficult to associate these models with Alexander patterns or geographer models. The creation of such an association lead UPD to the much deeper interpretation and understanding of urban spatial configuration while relating its geometrical properties with various functional aspects, zoning, and geographical conditions, etc. Applying stand-alone space syntax analysis to urban planning and design has some limitations [31] too, that can lead to misinterpretations of the space syntax results, but it can be used for the description of the spatial features of the cities, and in some cases [32] proved to be easier and faster than classical methods. Space syntax-based SP can be linked to various information and can be easily compared with other SP (e.g., population density, economic typology of activities, etc.). With network analysis methods such as space syntax, the preparation and analysis of input data is simpler, so it is suitable for the large urban structure analysis and the data of the existing and planned streets networks are usually available as the input data for this method.
The strength of the proposed model is demonstrated within the contexts of the analyzed network analysis tools which operate only with the simple measures of centrality and are not widely used. The method that would use normalized measures in spatial network analysis would enable the comparison of the different sized spatial entities and between their elements. At the moment, designing network analytical workflows requires the expert knowledge of the selected spatial analysis method, and analyzed spatial network analysis tools do not offer capabilities to describe SP, SP identification methods, and measures.
SPDIAM shares all the advantages of the other methods and can be used to compare different SP, reducing the subjectivity of the results of the territorial planning discipline. SPDIAM can be used to associate the shape of the territory with the geographer models using the bottom-up modelling principle.
However, some of SPDIAMs weaknesses and limitations should be considered: the value ranges of SP and spatial metapattern values can be obtained only by the experiments and it is quite demanding in terms of time and knowledge as, for example, the statistical tools can be used for it. Also, SPDIAM is limited by the available open data of CSS-both for SP identification and then evaluation. These limitations can be addressed in the future works.
The unexpected finding of the research is related to the attempt to classify SP based on statistical cluster analysis, as it demonstrated some possible oversimplification and overgeneralization of urban forms that are described by experts. In this case, the classification that was based on the results of SPDIAM could be seen as more objective and suitable for comparison of the urban spatial patterns comparing to experts’ opinion.
While summarizing the discussion, it could be stated that SPDIAM, including not only its predictive, but also its analytical possibilities, revealed itself as a useful complex decision support tool in urban spatial planning. The usage of more diverse data for the validation of SPDIAM results and application of the method for the other types of urban capitals (e.g., ecological, social, economic, etc.) should be considered in the future development of the model. It should be pointed out as well that SPDIAM was tested at the whole city level, but its application possibilities could be investigated at both regional or urban neighborhood scales.
5. Conclusions
SP helps to analyze the tasks and provisions that arise examining cities as CSS in the territorial planning discipline. SPDIAM was developed for describing and identifying such spatial economic, social, and environmental SP. After performing the comparison of the quantitative spatial analysis methods and spatial network analysis tools that can be used to identify SP, the conclusion was made, that the existing methods and tools do not offer capabilities to describe SP, SP identification methods, and measures. This can be seen as the main SPDIAM quantitative and qualitative improvement to spatial analysis methods and tools family. Then, the main concepts of SPDIAM and IT artefacts were presented, in order to use them for the development of the spatial structure (such as the network or grid) analysis tools in GIS.
In the experiment section, SPDIAM was tested using the CSS model and identifying SP in different North American, European, and African cities and then statistically evaluating the experiment results. The correlation results of SP and statistics showed a medium to close relationship between the identified SP and the statistics. Then, territorial planning cycle and SPDIAM application use case using the data of Kaunas city (Lithuania) were presented using the existing and two alternative networks of Kaunas streets to illustrate how the identified SP can improve the process of decision-making in territorial planning.
The conclusion can be made that SPDIAM data model based on the theory of CSS, spatial configuration, spatial capital concepts, space syntax, and VGA creates a computer model of space and quantifies its configuration which can be used to handle geographic and geometric data that are associated with attribute information to perform spatial, mathematical, and statistical calculations. SPDIAM can be used to describe and identify complex SP (the geographers’ models and Alexander patterns) and to apply them in CSS analysis in various domains. Such knowledge of SP allows spatial planning and design professionals to standardize proposed urban planning solutions, model different alternatives, and assess the impact on complex spatial structure development based on computable measures. Based on SP, urban development solutions can be compared with each other, thus gaining additional insights into the causes and factors that are associated with the functioning of CSS.
Author Contributions
Conceptualization, I.G., K.Z. and R.B.; methodology, I.G., K.Z. and R.B.; validation, I.G., K.Z. and R.B.; formal analysis, I.G., K.Z. and R.B.; investigation, I.G. and K.Z.; resources, I.G. and K.Z.; data curation, I.G. and K.Z.; writing—original draft preparation, I.G. and K.Z. writing—review and editing, I.G. and R.B.; visualization, I.G. and K.Z.; supervision R.B. All authors have read and agreed to the published version of the manuscript.
Funding
This research received no external funding.
Institutional Review Board Statement
Not applicable.
Data Availability Statement
The data that are presented in this study are available on request from the corresponding author.
Conflicts of Interest
The authors declare no conflict of interest.
References
- United Nations Human Settlements Programme. International Guidelines on Urban and Territorial Planning; UN-Habitat: Nairobi, Kenya, 2015. [Google Scholar]
- Cecilia, M. Urban Simulation Models: Contributions as Analysis-Methodology in a Project of Urban Renewal *. Curr. Urban Stud. 2014, 2, 298–305. [Google Scholar] [CrossRef][Green Version]
- Mueller, C.H.; Klein, U.; Hof, A. An easy-to-use spatial simulation for urban planning in smaller municipalities. Comput. Environ. Urban Syst. 2018, 71, 109–119. [Google Scholar] [CrossRef]
- González-Méndez, M.; Olaya, C.; Fasolino, I.; Grimaldi, M.; Obregón, N. Agent-Based Modeling for Urban Development Planning based on Human Needs. Conceptual Basis and Model Formulation. Land Use Policy 2021, 101, 105110. [Google Scholar] [CrossRef]
- Wilson, G. Complex Spatial Systems: The Modelling Foundations of Urban and Regional Analysis; Prentice Hall: Harlow, UK, 2008; pp. 1–4, 6–8, 14, 18, 23–25, 96–97. [Google Scholar]
- Germanaite, I.E.; Zaleckis, K.; Butleris, R.; Lopata, A. General Spatial Pattern and Meta-Pattern Model for Problems That Need Analytical Approach in Complex Spatial Systems. Appl. Sci. 2022, 12, 302. [Google Scholar] [CrossRef]
- Marshall, S.; Gong, Y. WP4 Deliverable Report: Urban Pattern Specification. 2009. Available online: https://www.suburbansolutions.ac.uk/documents/WP4DeliverableReportNov2009.pdf (accessed on 14 May 2022).
- Germanaite, I.E.; Butleris, R.; Zaleckis, K. How to Describe Basic Urban Pattern in Geographic Information Systems; Information and Software Technologies; ICIST 2018; Communications in Computer and Information Science; Springer: Cham, Switzerland, 2018; Volume 920, pp. 153–163. [Google Scholar] [CrossRef]
- Torrens, P.M. How Land-Use-Transportation Models Work; Centre for Advanced Spatial Analysis Working Papers: London, UK, 2000. [Google Scholar]
- Seyed, B.; Miller, E.; Ming, Z. Spatial pattern recognition of the structure of urban land uses useful for transportation and land use modelling. In Proceedings of the International Conference on Transportation Information and Safety (ICTIS), Wuhan, China, 25–28 June 2015; pp. 258–263. [Google Scholar]
- Germanaite, I.E.; Zaleckis, K.; Butleris, R.; Jarmalavičienė, K. Case Study of Spatial Pattern Description, Identification and Application Methodology. J. Univers. Comput. Sci. Spec. Issue Pattern Recognit. Artif. Intell. Curr. Chall. Nov. Solut. Emerg. Appl. 2020, 26, 649–670. [Google Scholar]
- Lu, Y.; Gou, Z.; Ye, Y.; Sheng, Q. Three-dimensional visibility graph analysis and its application. Environ. Plan. B Urban Anal. City Sci. 2019, 46, 948–962. [Google Scholar] [CrossRef]
- Major, M.D. The Syntax of City Space: American Urban Grids; Routledge Books: New York, NY, USA, 2018. [Google Scholar]
- Alexander, C. A Pattern Language; Oxford University Press: New York, NY, USA, 1977. [Google Scholar]
- Register of Legal Acts. Law on Territorial Planning of the Republic of Lithuania. 2020. Available online: https://www.e-tar.lt/portal/lt/legalAct/TAR.26B563184529/asr (accessed on 18 April 2022).
- Space Syntax Ltd. Space Syntax OpenMapping. 2022. Available online: https://spacesyntax-openmapping.netlify.app/#7/54.810/-1.329 (accessed on 21 May 2022).
- Alexander, S. Sociotope mapping—Exploring public open space and its multiple use values in urban and landscape planning practice. Nord. J. Archit. Res. 2006, 19, 59–71. [Google Scholar]
- Lewis, M. The Culture of Cities; Harcourt, Brace and Co.: New York, NY, USA, 1938. [Google Scholar]
- Bach, M.P.; Tustanovski, E.; Ip, A.W.H.; Yung, K.; Kybernetes, V.R. System Dynamics Models for the Simulation of Sustainable Urban Development. Kybernetes 2019, 49, 460–504. [Google Scholar] [CrossRef]
- Anderson, T.; Dragićević, S. Representing Complex Evolving Spatial Networks: Geographic Network Automata. ISPRS Int. J. Geo.-Inf. 2020, 9, 270. [Google Scholar] [CrossRef]
- Chen, Y.; Huang, L. Spatial Measures of Urban Systems: From Entropy to Fractal Dimension. Entropy 2018, 20, 991. [Google Scholar] [CrossRef]
- Nowosad, J.; Stepinski, T.F. Pattern-based identification and mapping of landscape types using multi-thematic data. Int. J. Geogr. Inf. Sci. IJGIS 2021, 35, 1634–1649. [Google Scholar]
- Musa, S.I.; Hashim, M.; Reba, M.N. A review of geospatial-based urban growth models and modelling initiatives. Geocarto Int. 2016, 32, 813–833. [Google Scholar] [CrossRef]
- Hevner, A.; Chatterjee, S. Design Research in Information Systems: Theory and Practice; Springer: Berlin/Heidelberg, Germany, 2010; Volume 22. [Google Scholar]
- Sameera, A.; Georgios, T.; Pierre, L.; Gregory, O. Agent Based Modelling and Simulation tools: A review of the state-of-art software. Comput. Sci. Rev. 2017, 24, 13–33. [Google Scholar] [CrossRef]
- Li, X.; Peng, G. Urban growth models: Progress and perspective. Sci. Bull. 2016, 61, 1637–1650. [Google Scholar] [CrossRef]
- Space Syntax. 2021. Available online: http://www.spacesyntax.com (accessed on 30 May 2022).
- Cheng, J.; Masser, I.; Ottens, H. Understanding Urban Growth System: Theories and Methods. In Proceedings of the 8th International Conference on Computer Techniques for Urban Planning and Management, Sendai, Japan, 27–29 May 2003. [Google Scholar]
- Paul, W. UrbanSim: Modeling Urban Development for Land Use, Transportation and Environmental Planning. J. Am. Plan. Assoc. 2002, 68, 297–314. [Google Scholar] [CrossRef]
- D’Autilia, R.; Spada, M. Shaping ideal cities: The graph representation of the urban utopia. Environ. Plan. B Urban Anal. City Sci. 2019, 46, 423–444. [Google Scholar] [CrossRef]
- Yamu, C.; van Nes, A.; Garau, C. Bill Hillier’s Legacy: Space Syntax—A Synopsis of Basic Concepts, Measures, and Empirical Application. Sustainability 2021, 13, 3394. [Google Scholar] [CrossRef]
- Leccese, F.; Lista, D.; Salvadori, G.; Beccali, M.; Bonomolo, M. On the Applicability of the Space Syntax Methodology for the Determination of Street Lighting Classes. Energies 2020, 13, 1476. [Google Scholar] [CrossRef]
- Scheider, S.; de Jong, T. A conceptual model for automating spatial network analysis. Trans. GIS 2022, 26, 421–458. [Google Scholar] [CrossRef]
- Sustainable Places Research Institute (Cardiff University): sDNA Software. Available online: https://www.cardiff.ac.uk/sdna/software/software/ (accessed on 7 May 2022).
- City Form Lab (Massachusetts Institute of Technology): Urban Network Analysis Toolbox for ArcGIS. 2016. Available online: http://cityform.mit.edu/projects/urban-network-analysis (accessed on 13 May 2022).
- City Form Lab (Massachusetts Institute of Technology): Urban Network Analysis Toolbox for Rhino3D. 2018. Available online: http://cityform.gsd.harvard.edu/projects/una-rhino-toolbox (accessed on 2 June 2021).
- Urban Design Studies Unit (University of Strathclyde): MCA (Multiple Centrality Assessment). 2012. Available online: http://www.udsu-strath.com/msc-urban-design/mca-multiple-centrality-assessment/ (accessed on 14 May 2022).
- Varoudis, T. Multi-Platform Spatial Network Analysis Software. 2014. Available online: https://varoudis.github.io/depthmapX/ (accessed on 13 May 2022).
- Space Syntax Laboratory (Bartlett, University College London): QgisSpaceSyntaxToolkit. 2018. Available online: https://github.com/SpaceGroupUCL/qgisSpaceSyntaxToolkit (accessed on 22 May 2022).
- Space Syntax Laboratory (Bartlett, University College London), Space Syntax Limited: Qgis Space Syntax Toolkit. 2018. Available online: http://otp.spacesyntax.net/software-and-manuals/space-syntax-toolkit-2/ (accessed on 25 May 2022).
- ESRI: ArcGIS Network Analyst. 2020. Available online: https://www.esri.com/en-us/arcgis/products/arcgis-network-analyst/overview (accessed on 25 May 2022).
- Gerlt. B. Centrality Analysis Toolbox. 2018. Available online: https://community.esri.com/groups/applications-prototype-lab/blog/2018/05/14/centrality-analysis-toolbox (accessed on 14 May 2022).
- Gerlt. B. Centrality Analysis Tools. 2019. Available online: https://www.arcgis.com/home/item.html?id=06a6f1a2e2fe4cda9c1196ab8c7f7408 (accessed on 14 May 2022).
- Jorge, G.; Chris, S.; Alain, C. Confeego: Tool Set for Spatial Configuration Studies. In Proceedings of the 6th International Space Syntax, Istanbul, Turkey, 12–15 June 2007. [Google Scholar]
- Freeman, L.C. Centrality in social networks conceptual clarification. Soc. Netw. 1978, 1, 215–239. [Google Scholar] [CrossRef]
- Jiang, B.; Claramunt, C. A structural approach to the model generalization of an urban street network. GeoInformatica 2004, 8, 157–171. [Google Scholar] [CrossRef]
- Geofabrik. 2019. Available online: https://www.geofabrik.de (accessed on 5 May 2022).
- K-Means Cluster Analysis. 2021. Available online: https://www.ibm.com/docs/en/spss-statistics/24.0.0?topic=option-means-cluster-analysis (accessed on 30 January 2022).
- IBM SPSS Statistics. 2021. Available online: https://www.ibm.com/products/spss-statistics (accessed on 30 May 2022).
- Urbanisme, B. The Sustainability Compass—A Tool for Analysing and Orienting Urban Scale Projects. 2014. Available online: http://sustainabilitycompass.eu/theory/ (accessed on 15 May 2022).
- Kaunas University of Technology Institute of Architecture and Construction. Project “Kauno miesto teritorijos bendrojo plano koregavimas”: “Teritorijos vystymo galimybiu nustatymas”. 2022. [Google Scholar]
- Kaunas City Municipal Administration. Comprehensive Plan of Kaunas City Municipality Territory for 2013–2023. 2019. Available online: http://www.kaunas.lt/urbanistika/bendrasis-planavimas/kauno-miesto-savivaldybes-teritorijos-bendrasis-planas-2013-2023-m/ (accessed on 17 May 2022).
Publisher’s Note: MDPI stays neutral with regard to jurisdictional claims in published maps and institutional affiliations. |
© 2022 by the authors. Licensee MDPI, Basel, Switzerland. This article is an open access article distributed under the terms and conditions of the Creative Commons Attribution (CC BY) license (https://creativecommons.org/licenses/by/4.0/).

