
Exploring the Variations and Influencing Factors of Land Surface Temperature in the Urban Agglomeration on the Northern Slope of the Tianshan Mountains

 ,
,  ,
,  ,
,  and
and
Abstract
:1. Introduction
2. Study Area and Data Source
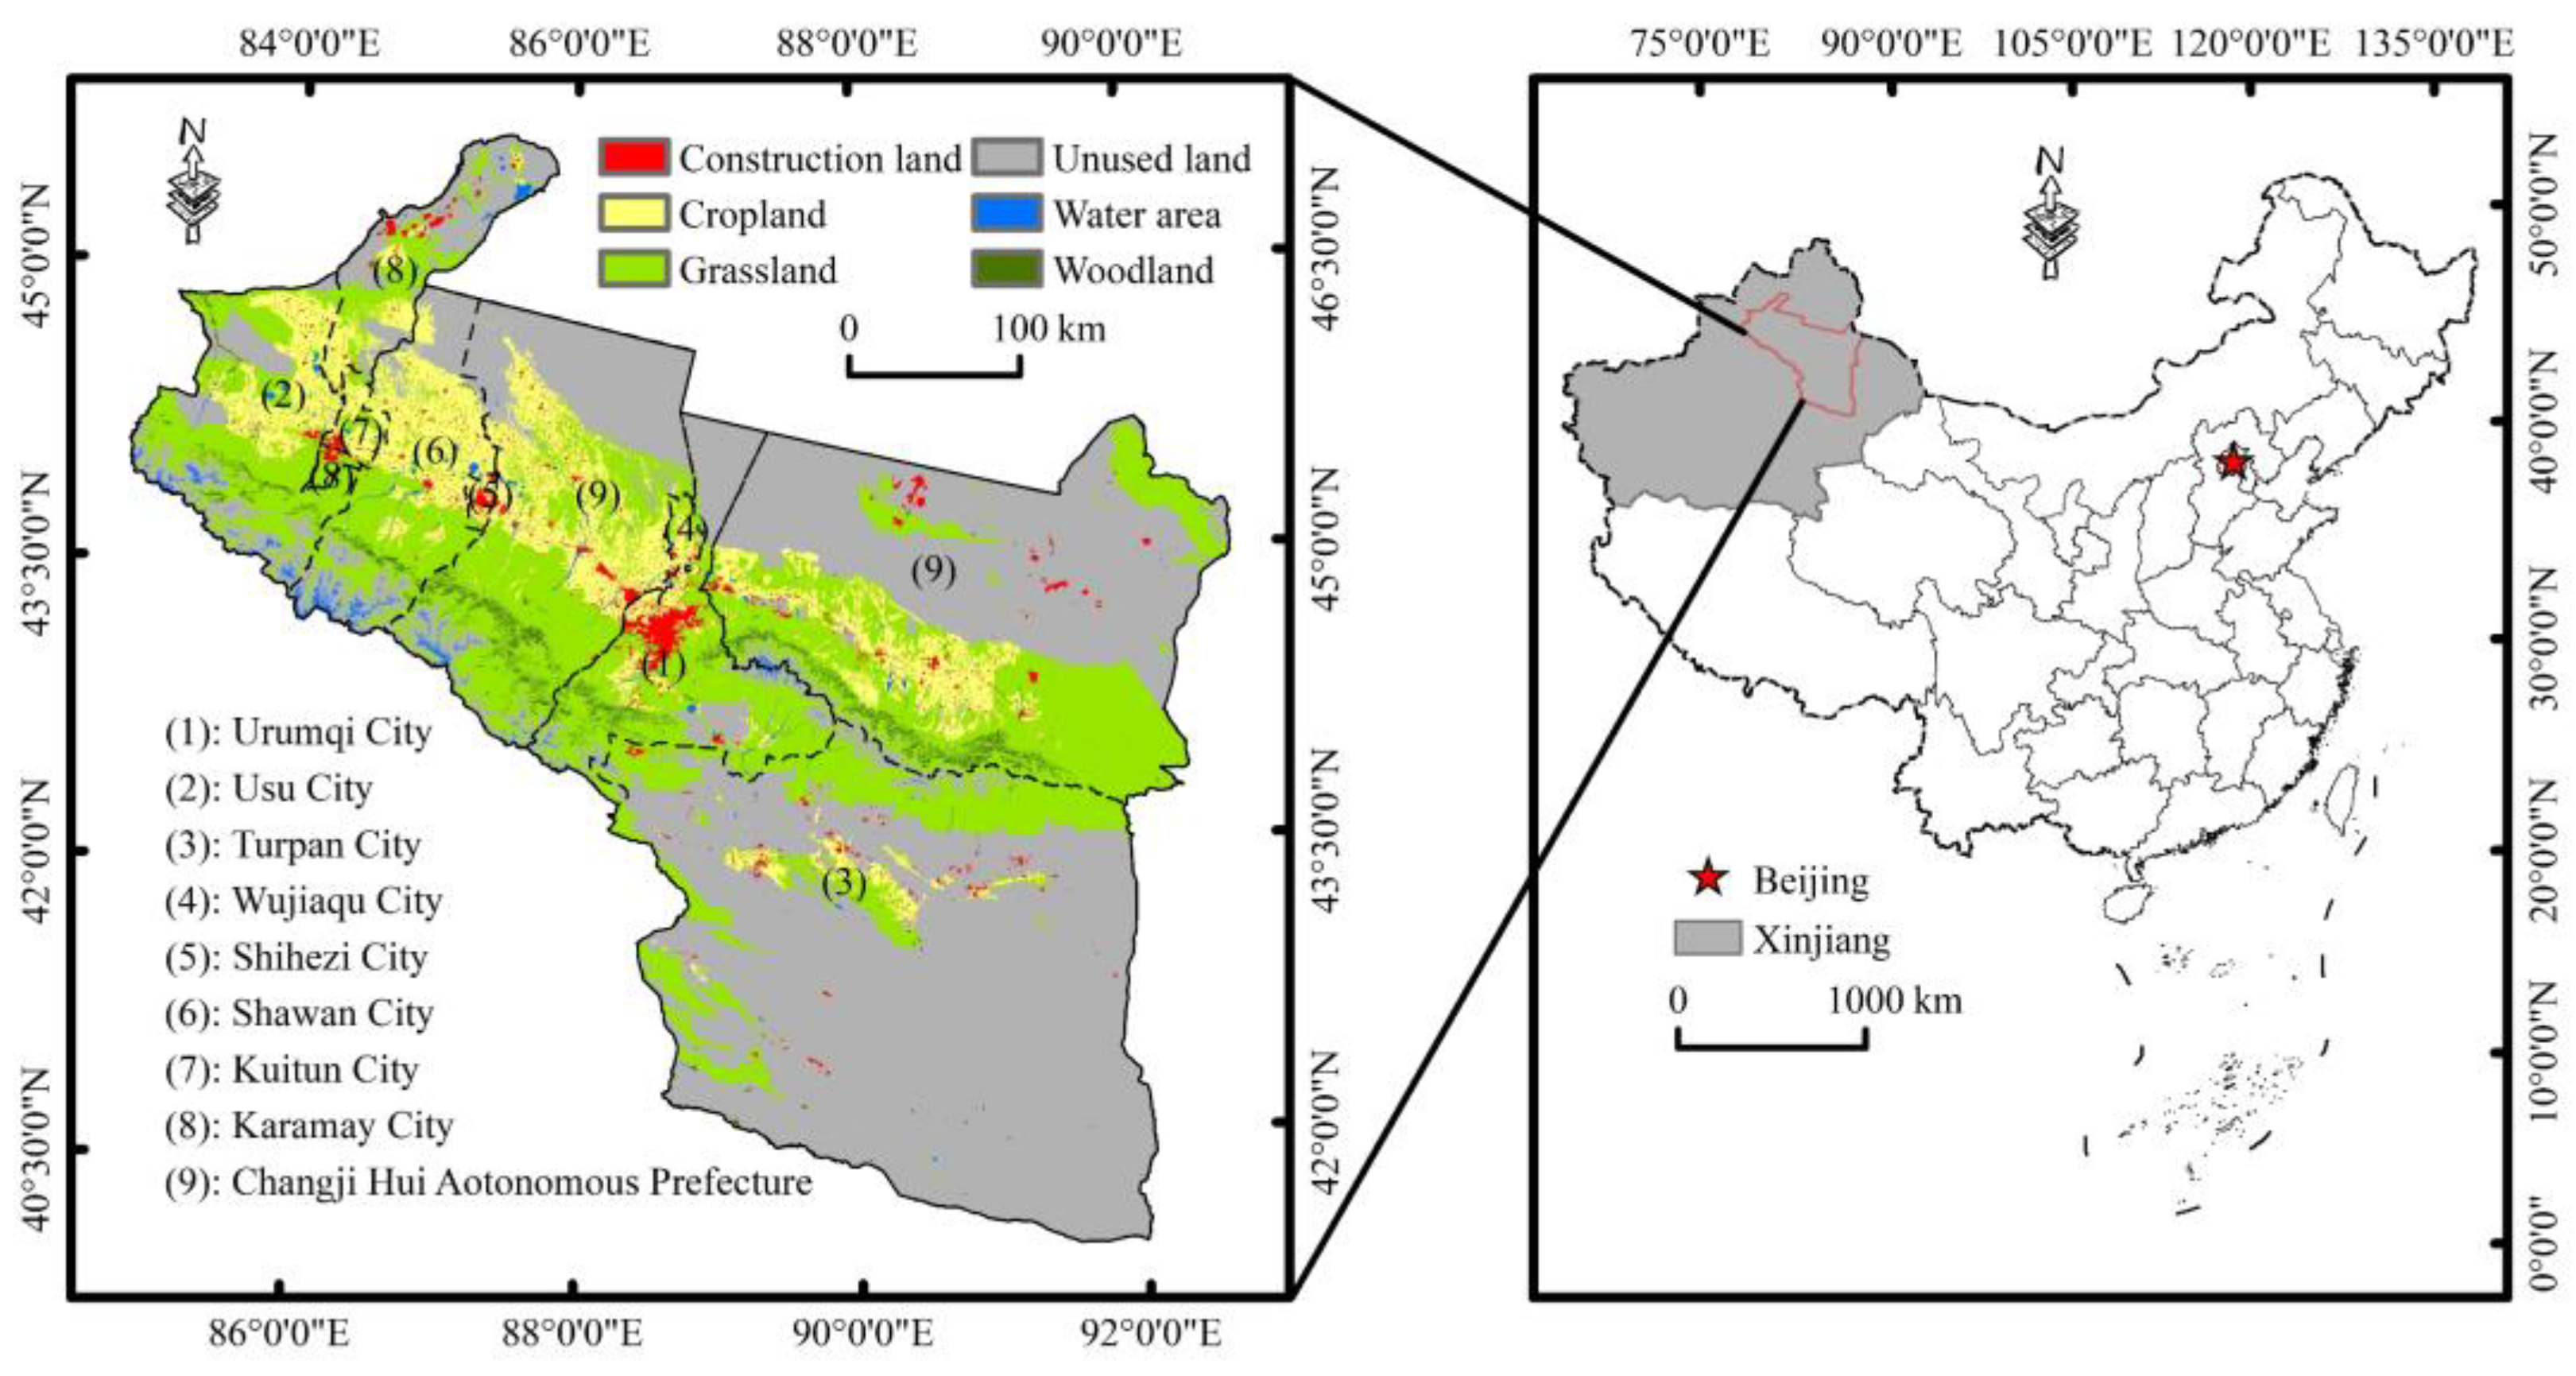
2.1. Study Area
2.2. Data Collection and Preprocessing
2.2.1. LST Data
2.2.2. Influencing Factors’ Data
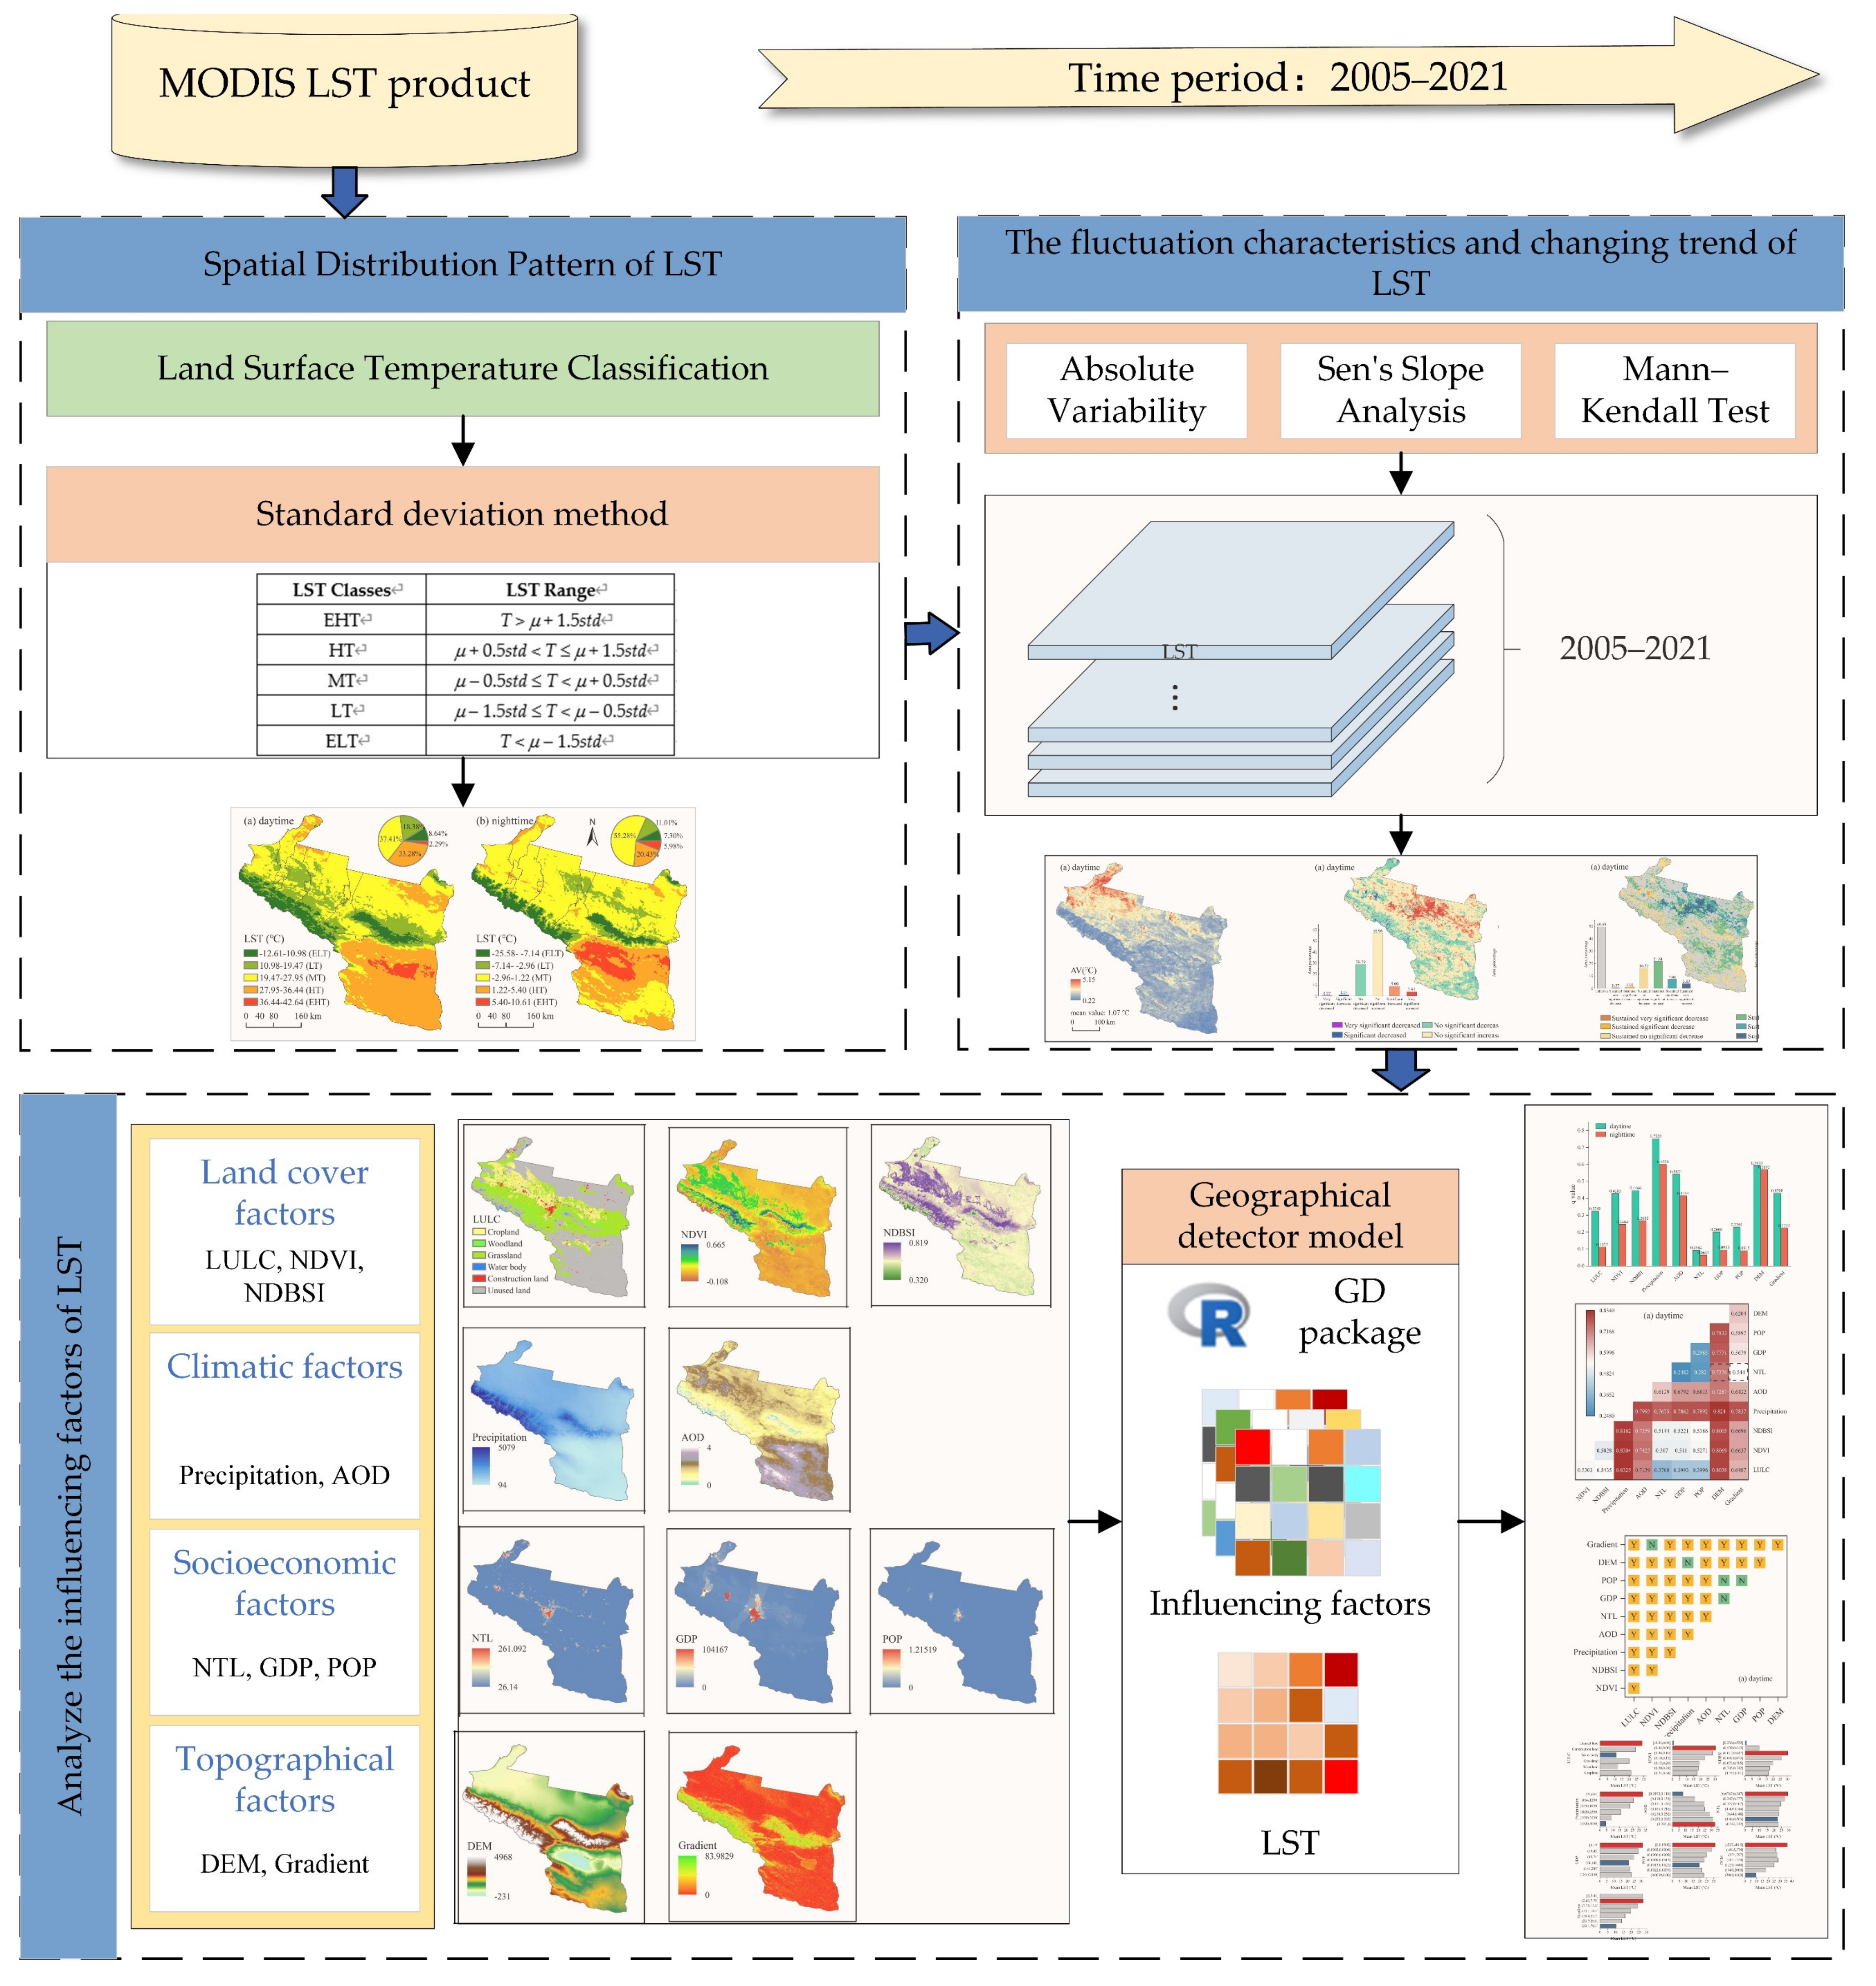
3. Methodology
3.1. Land Surface Temperature Classification
3.2. Absolute Variability (AV)
3.3. Trend Analysis Methods
3.3.1. Sen’s Slope Analysis
3.3.2. Mann–Kendall Trend Test
3.3.3. Hurst Index
3.4. Geo-Detector Model Based on Optimal Parameters
3.4.1. Factor Detector
3.4.2. Interaction Detector
3.4.3. Risk Detector
3.4.4. Ecological Detector
4. Results
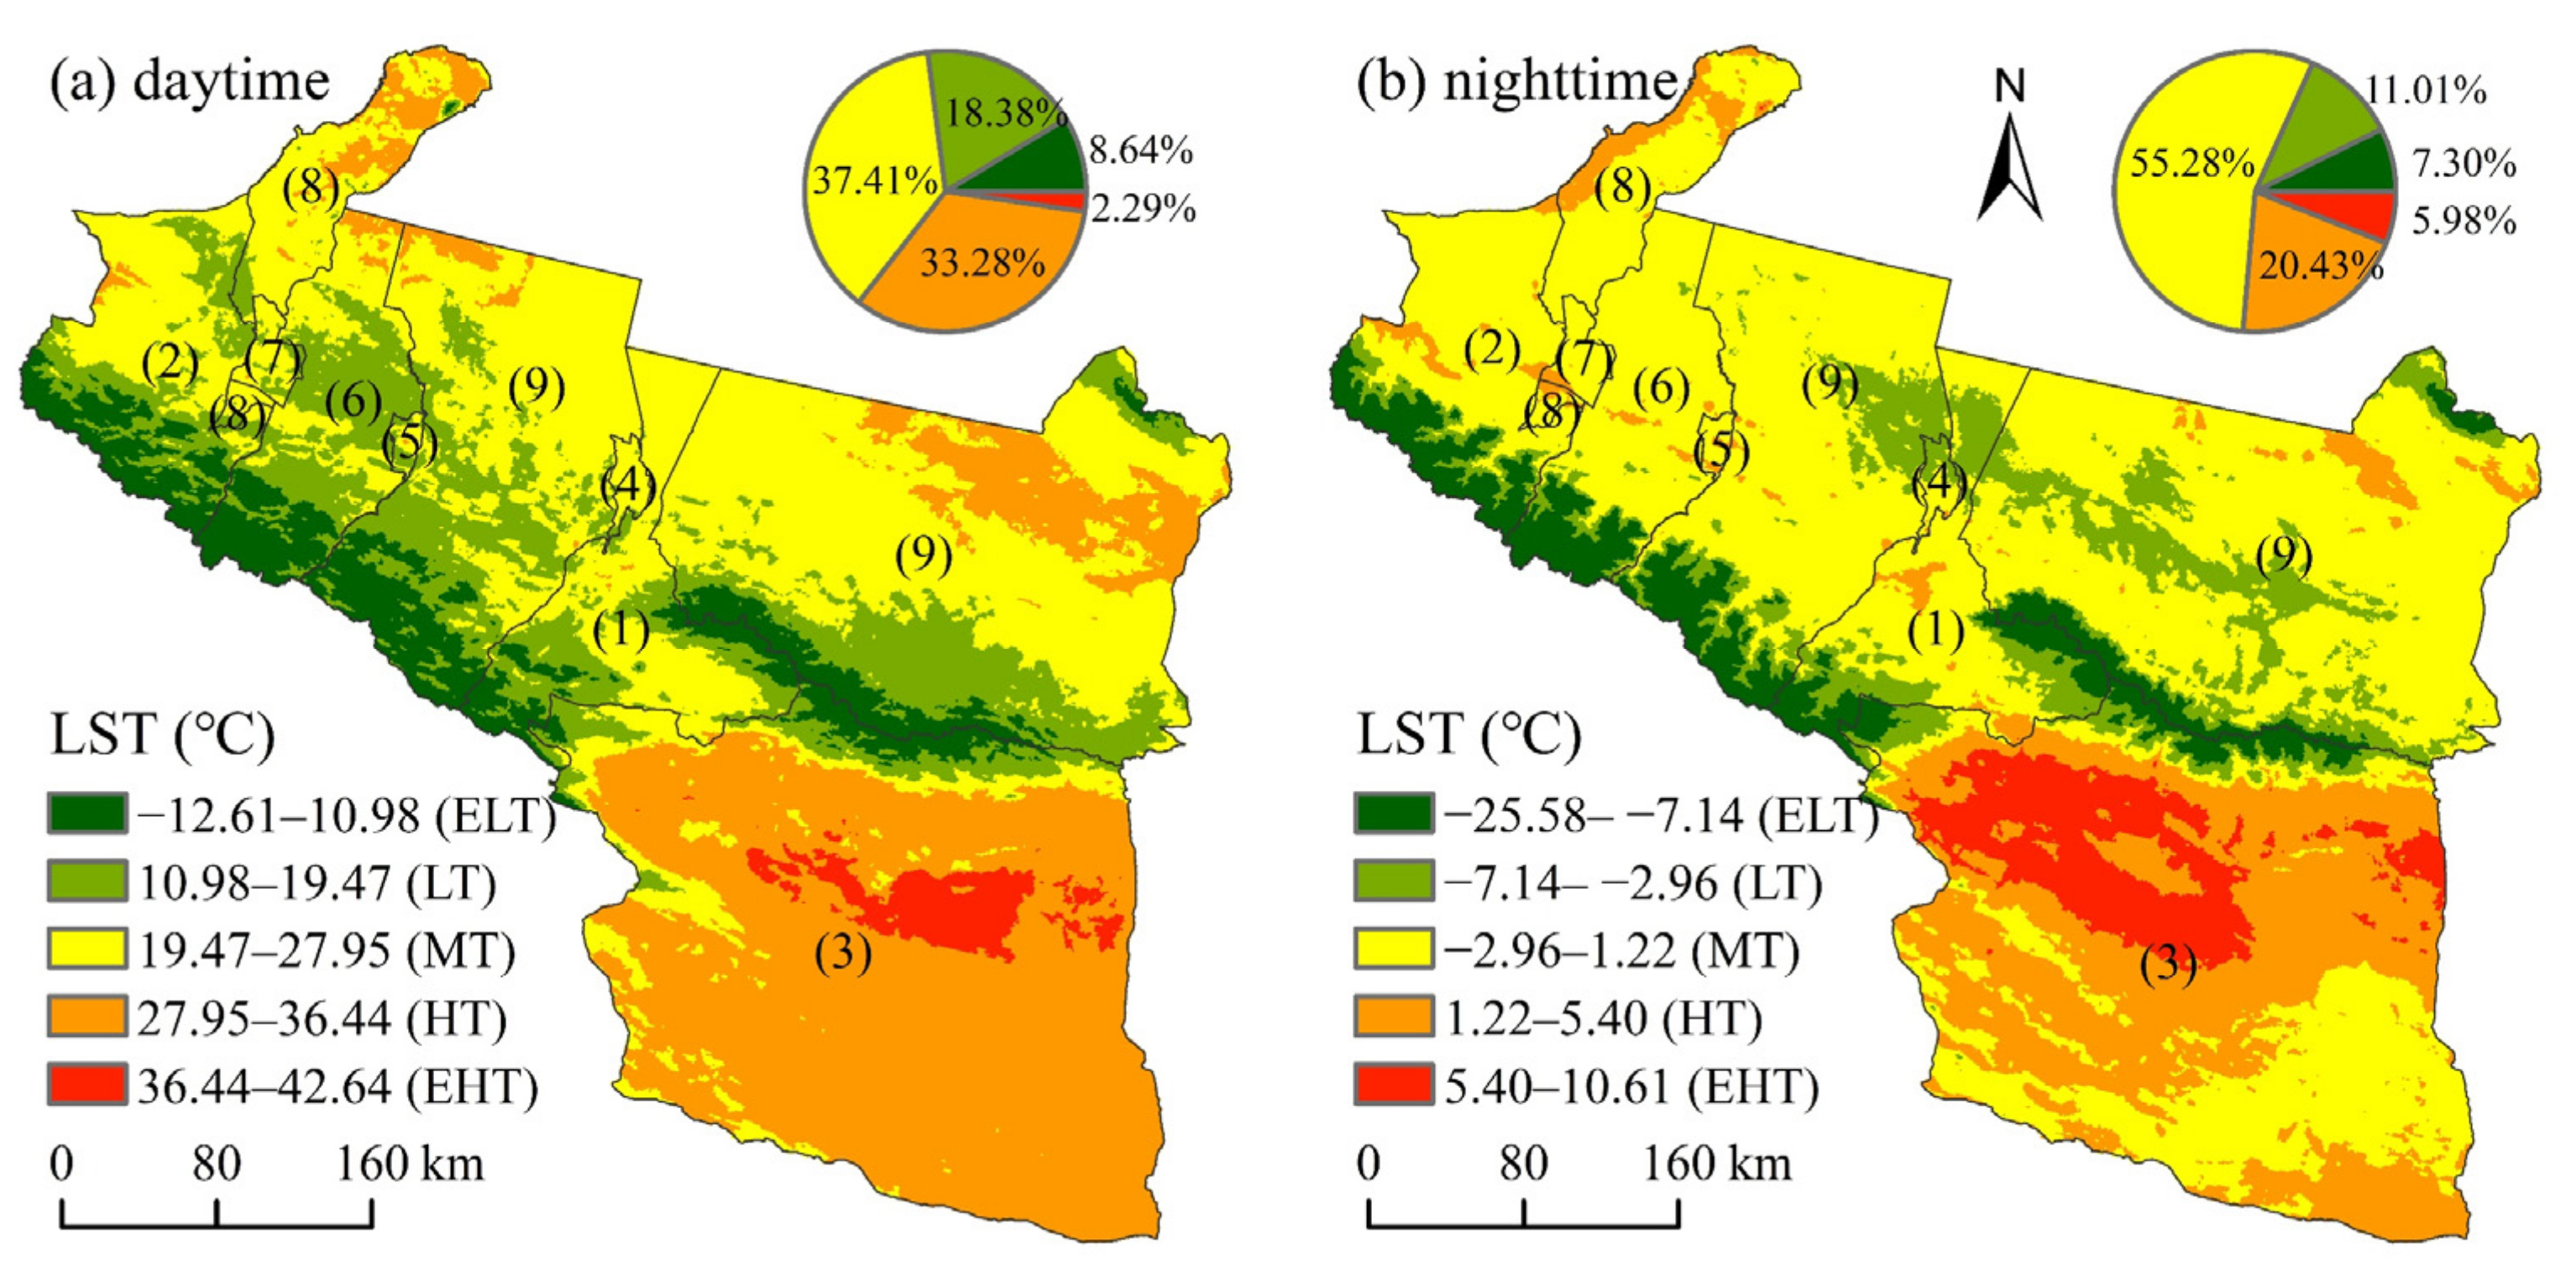
4.1. Spatial Distribution Pattern of LST
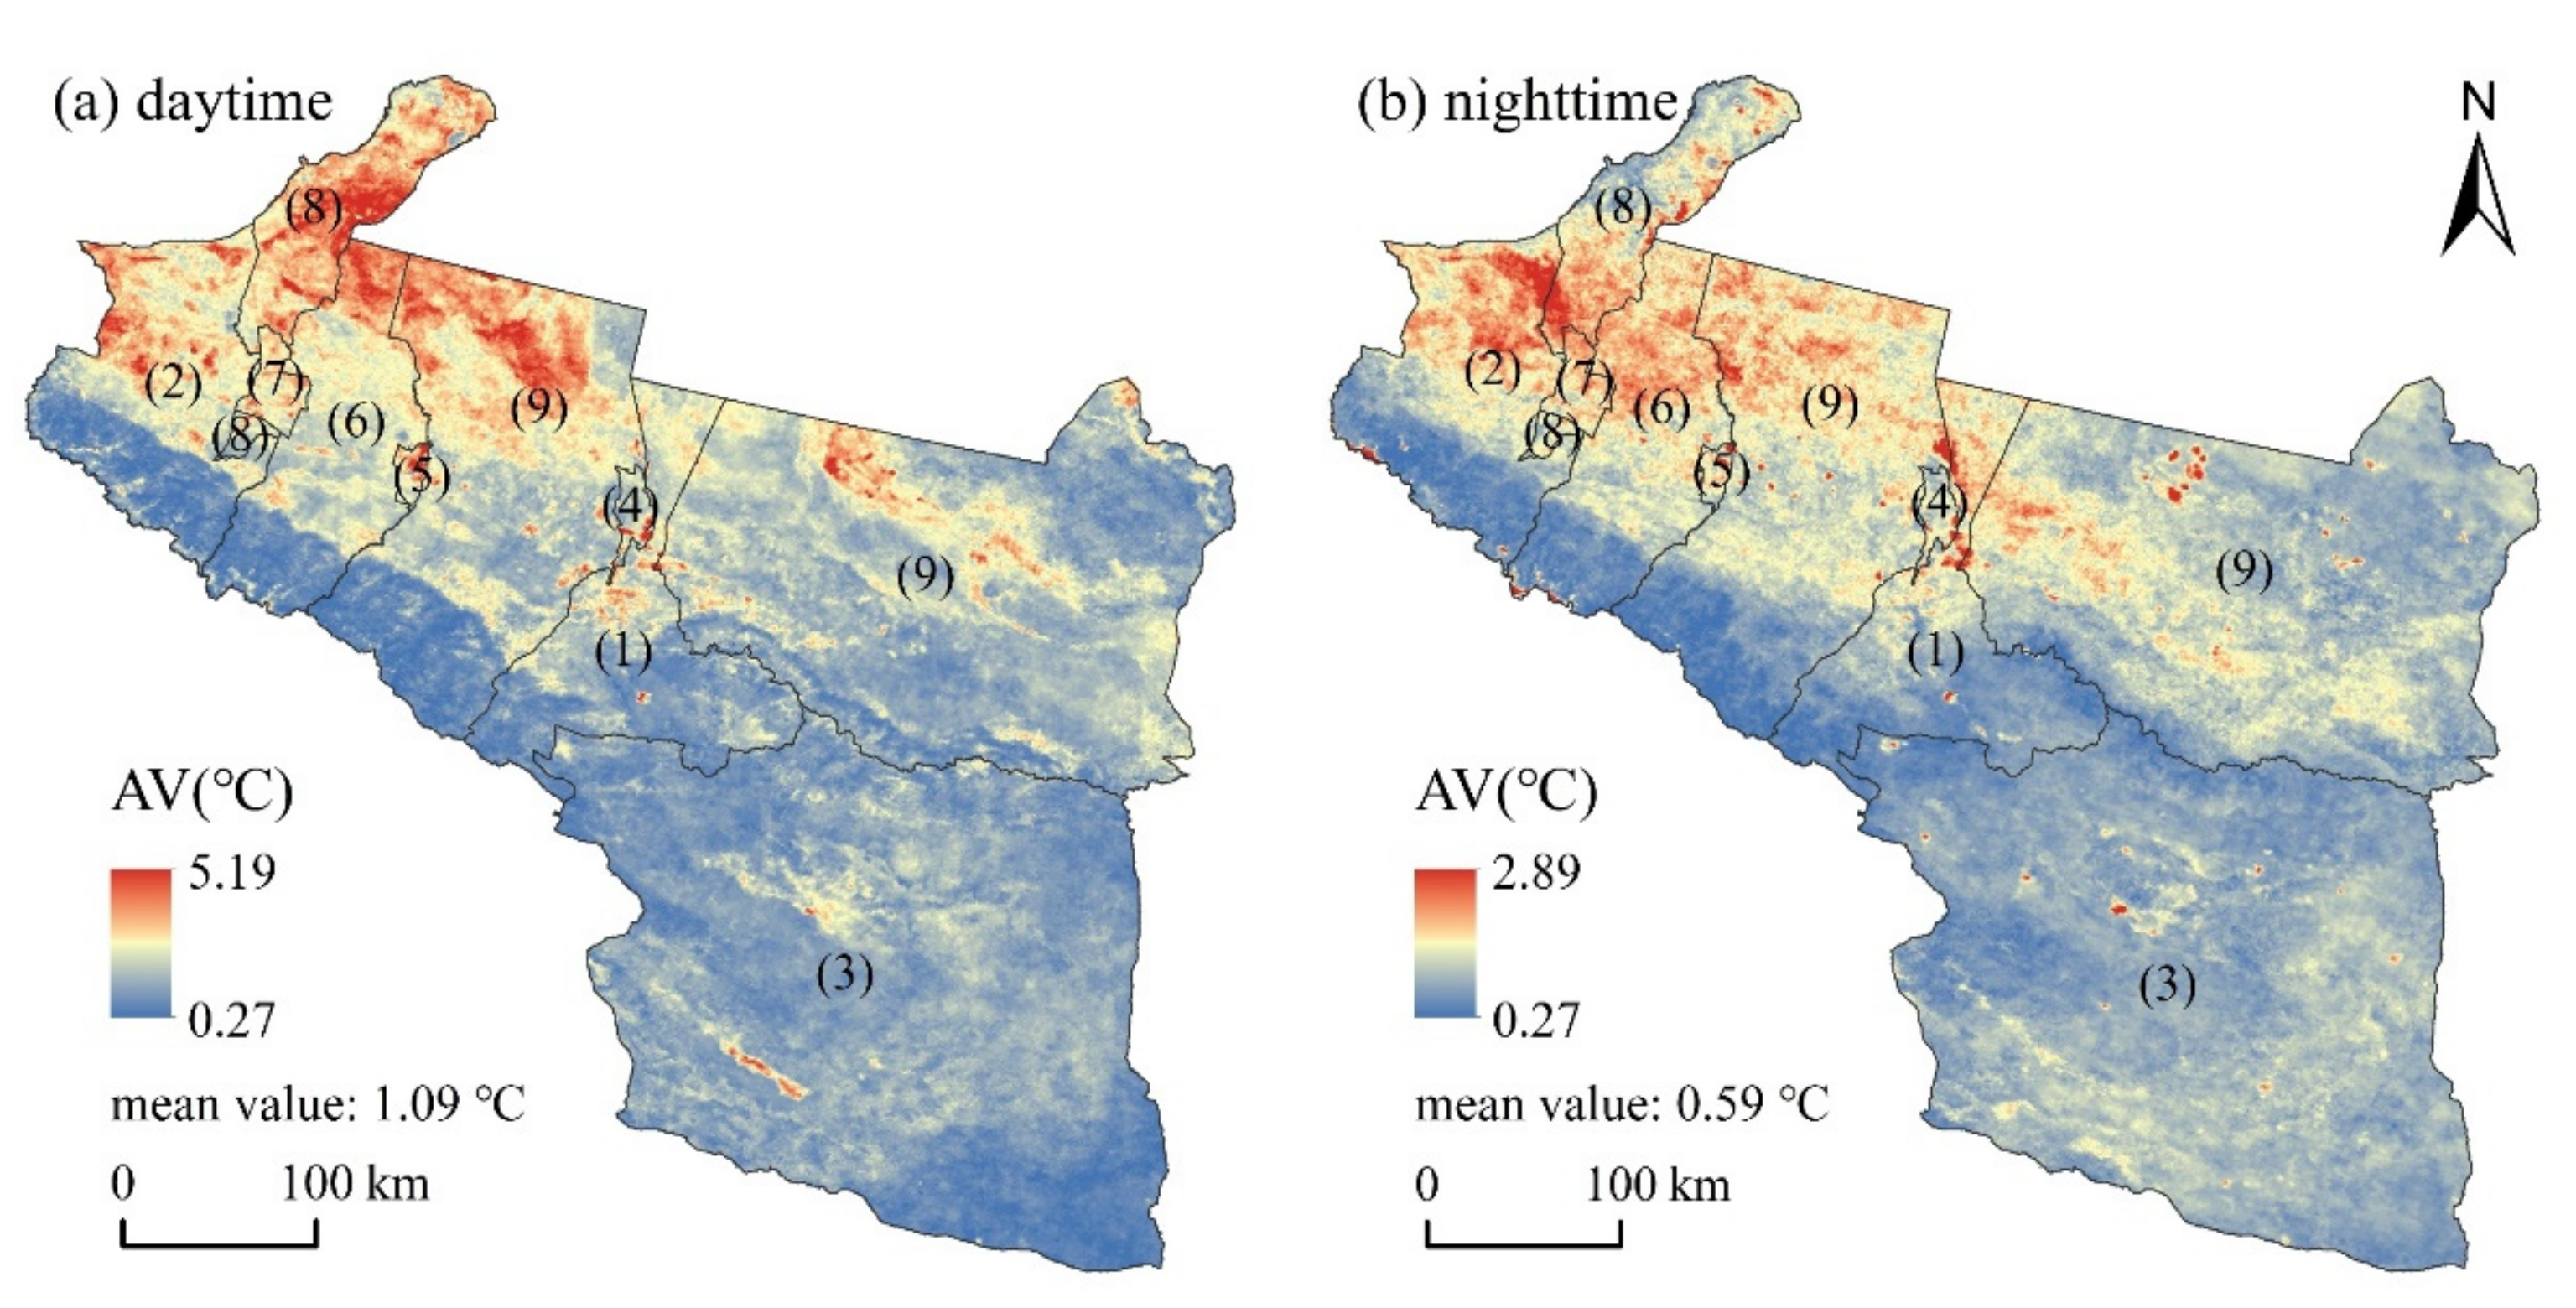
4.2. The Fluctuation Characteristics of LST
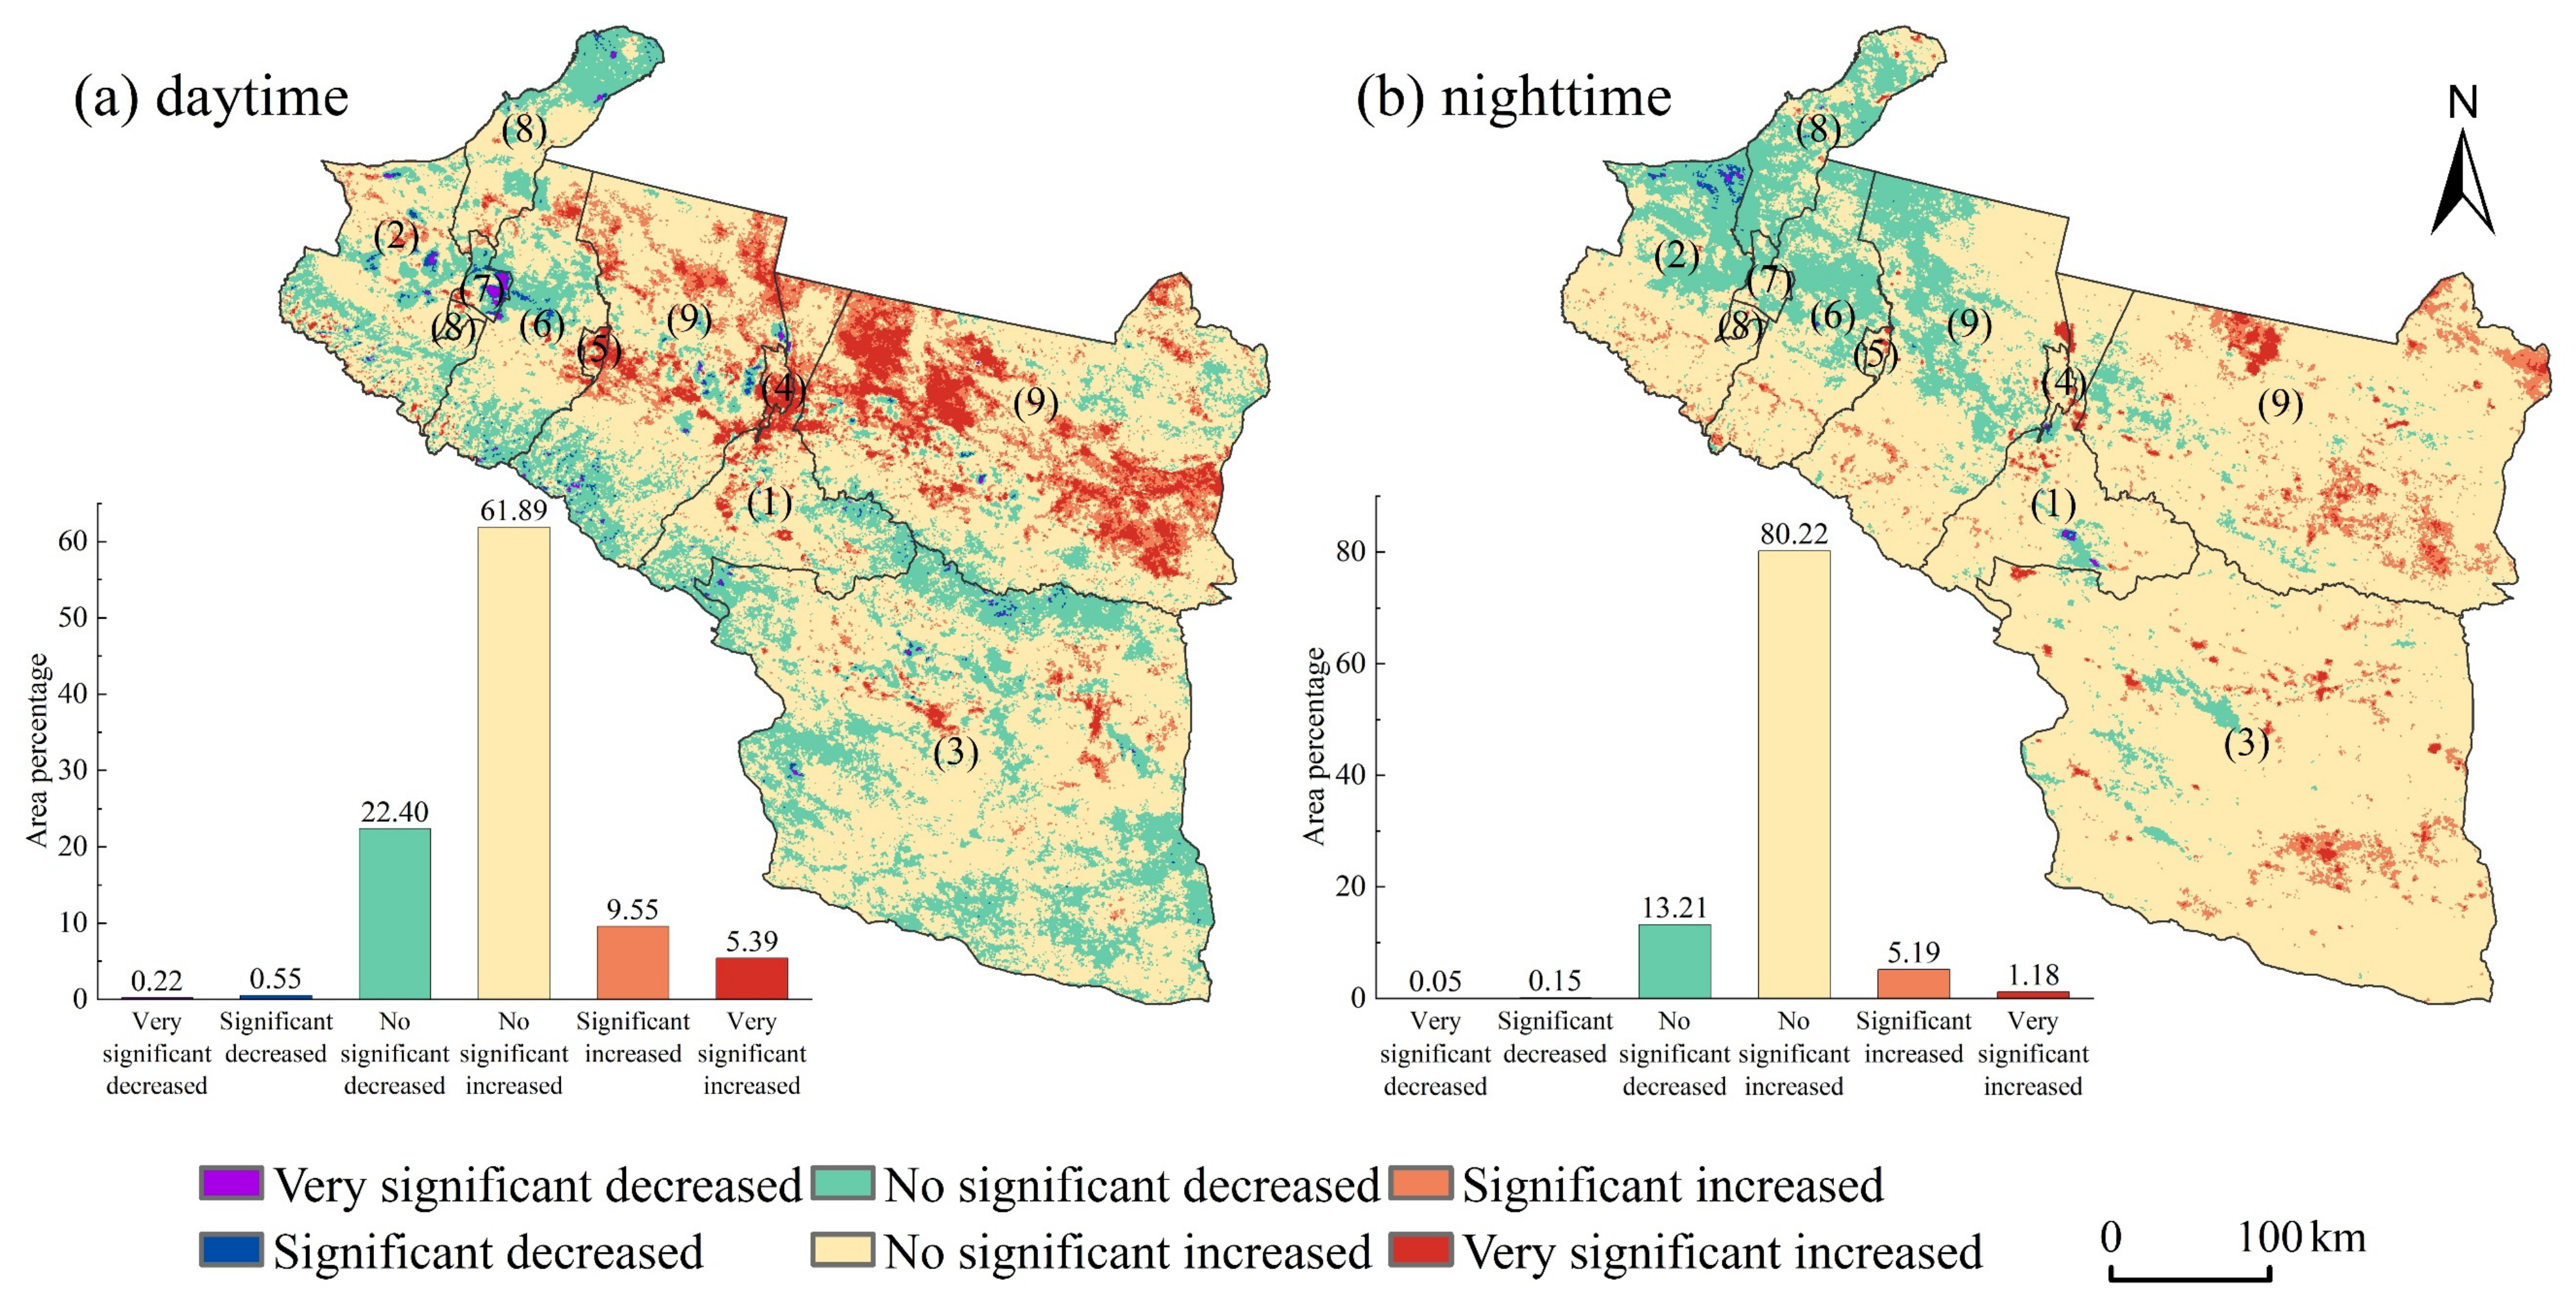
4.3. The Changing Trend of LST
4.3.1. The Changing Trend of LST from 2005 to 2019
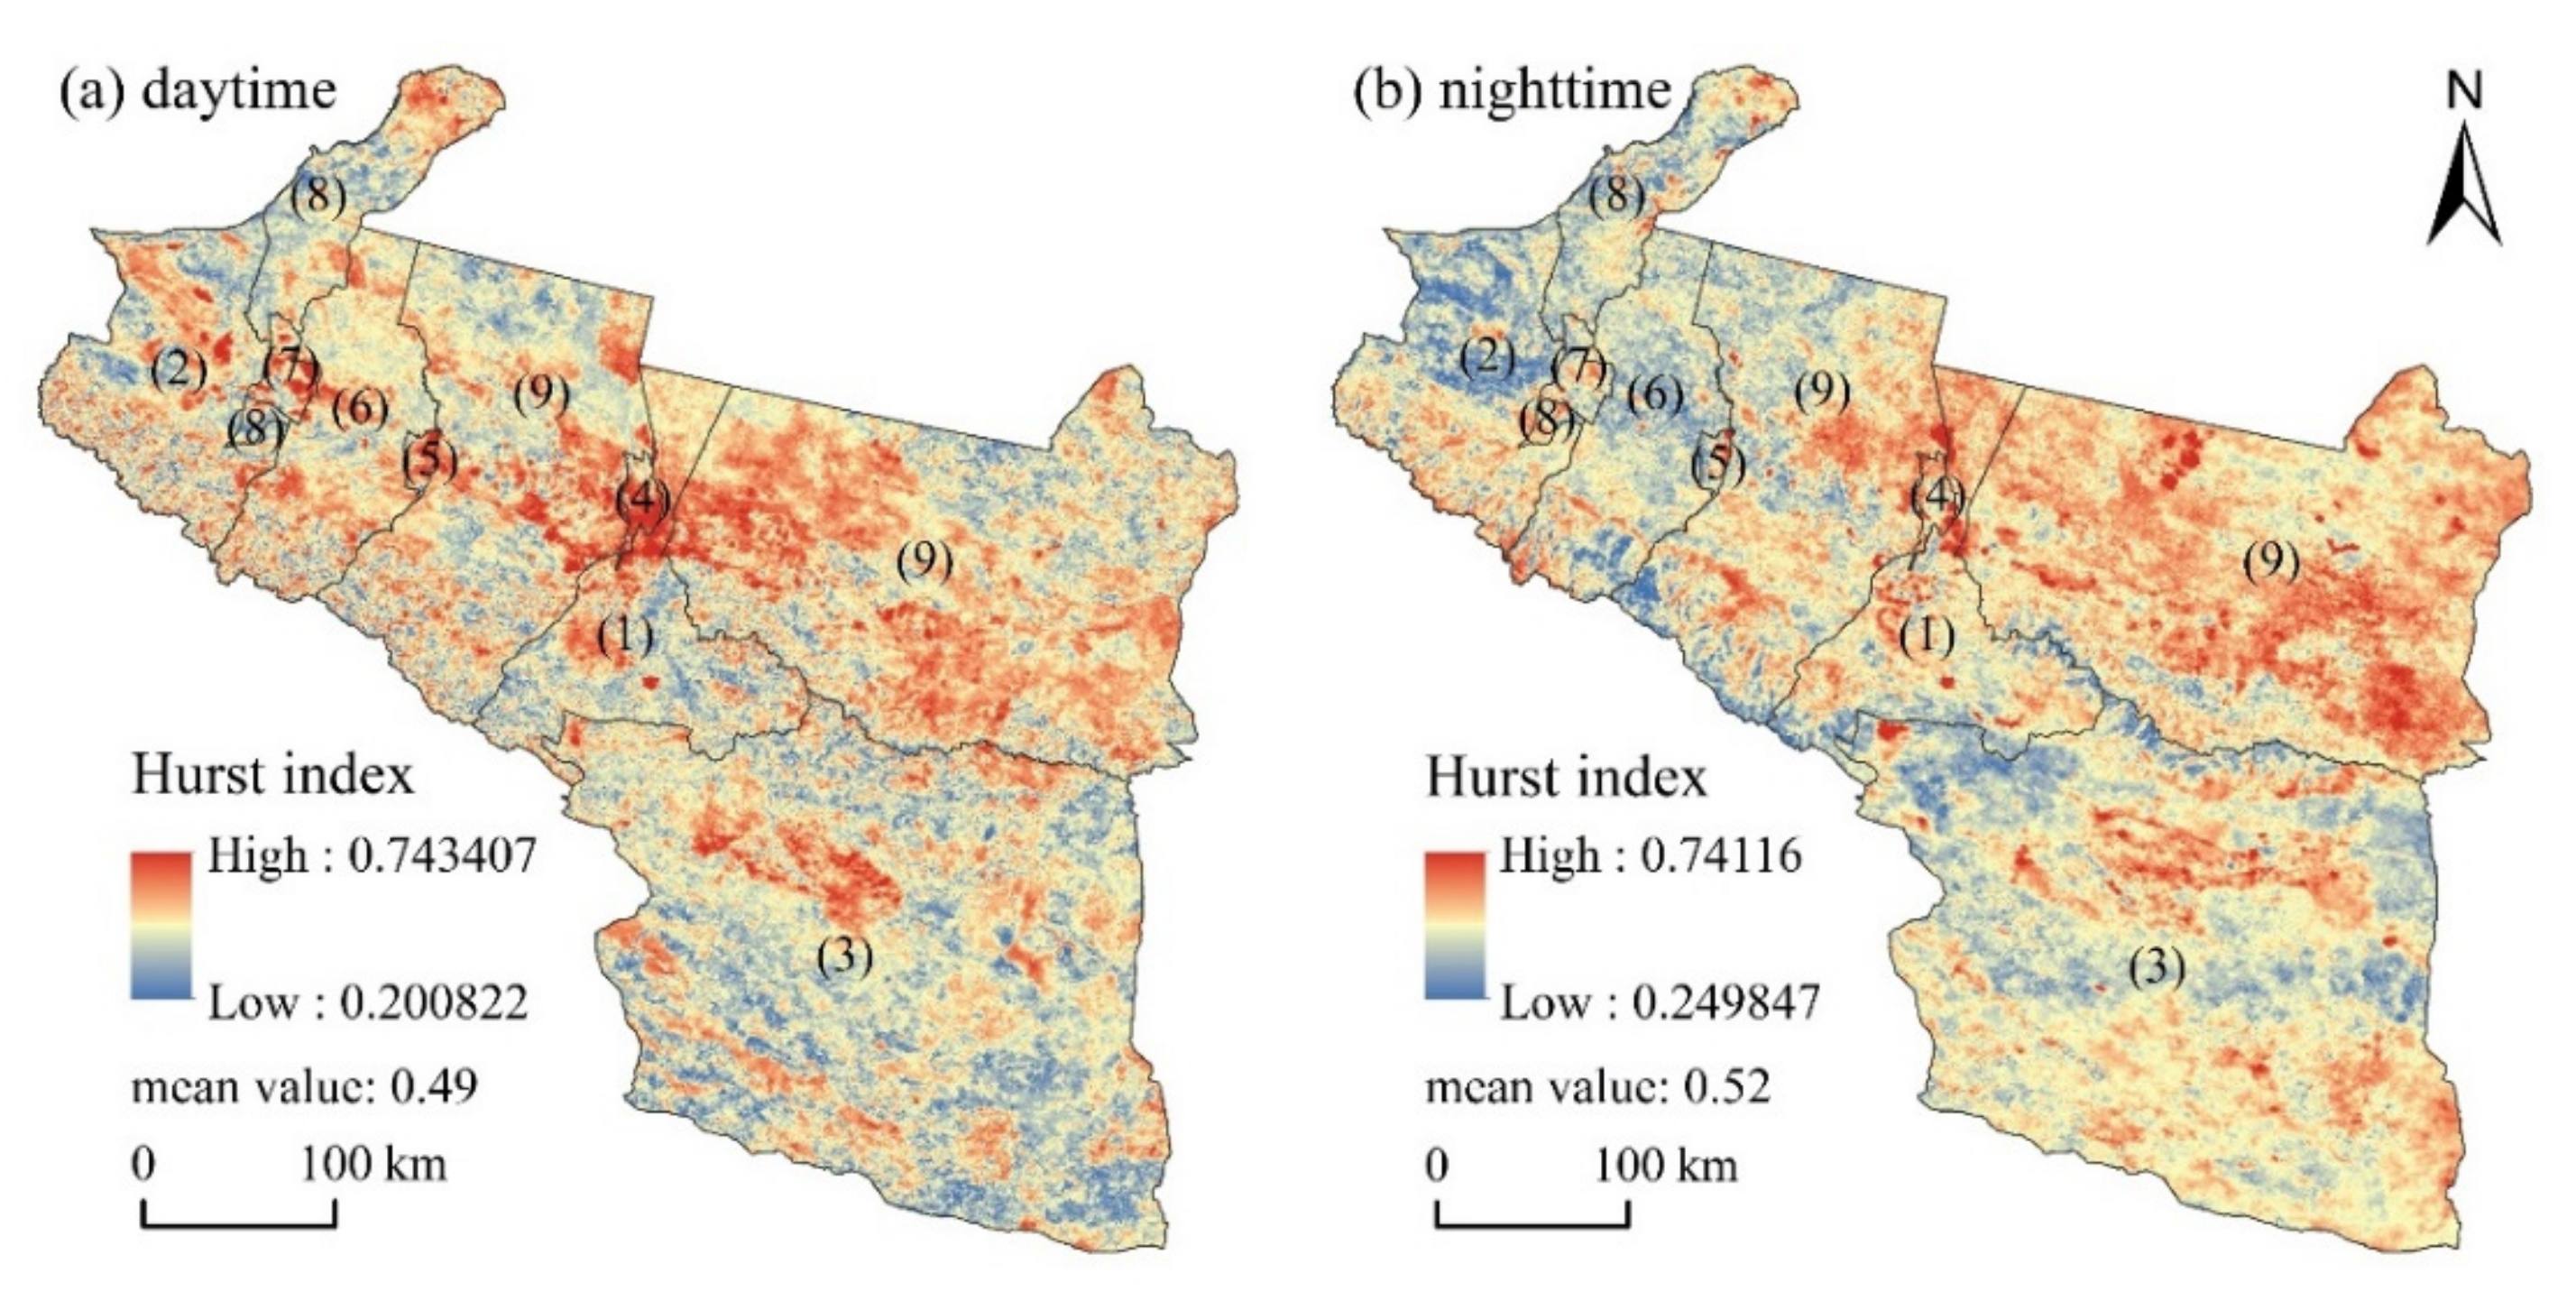
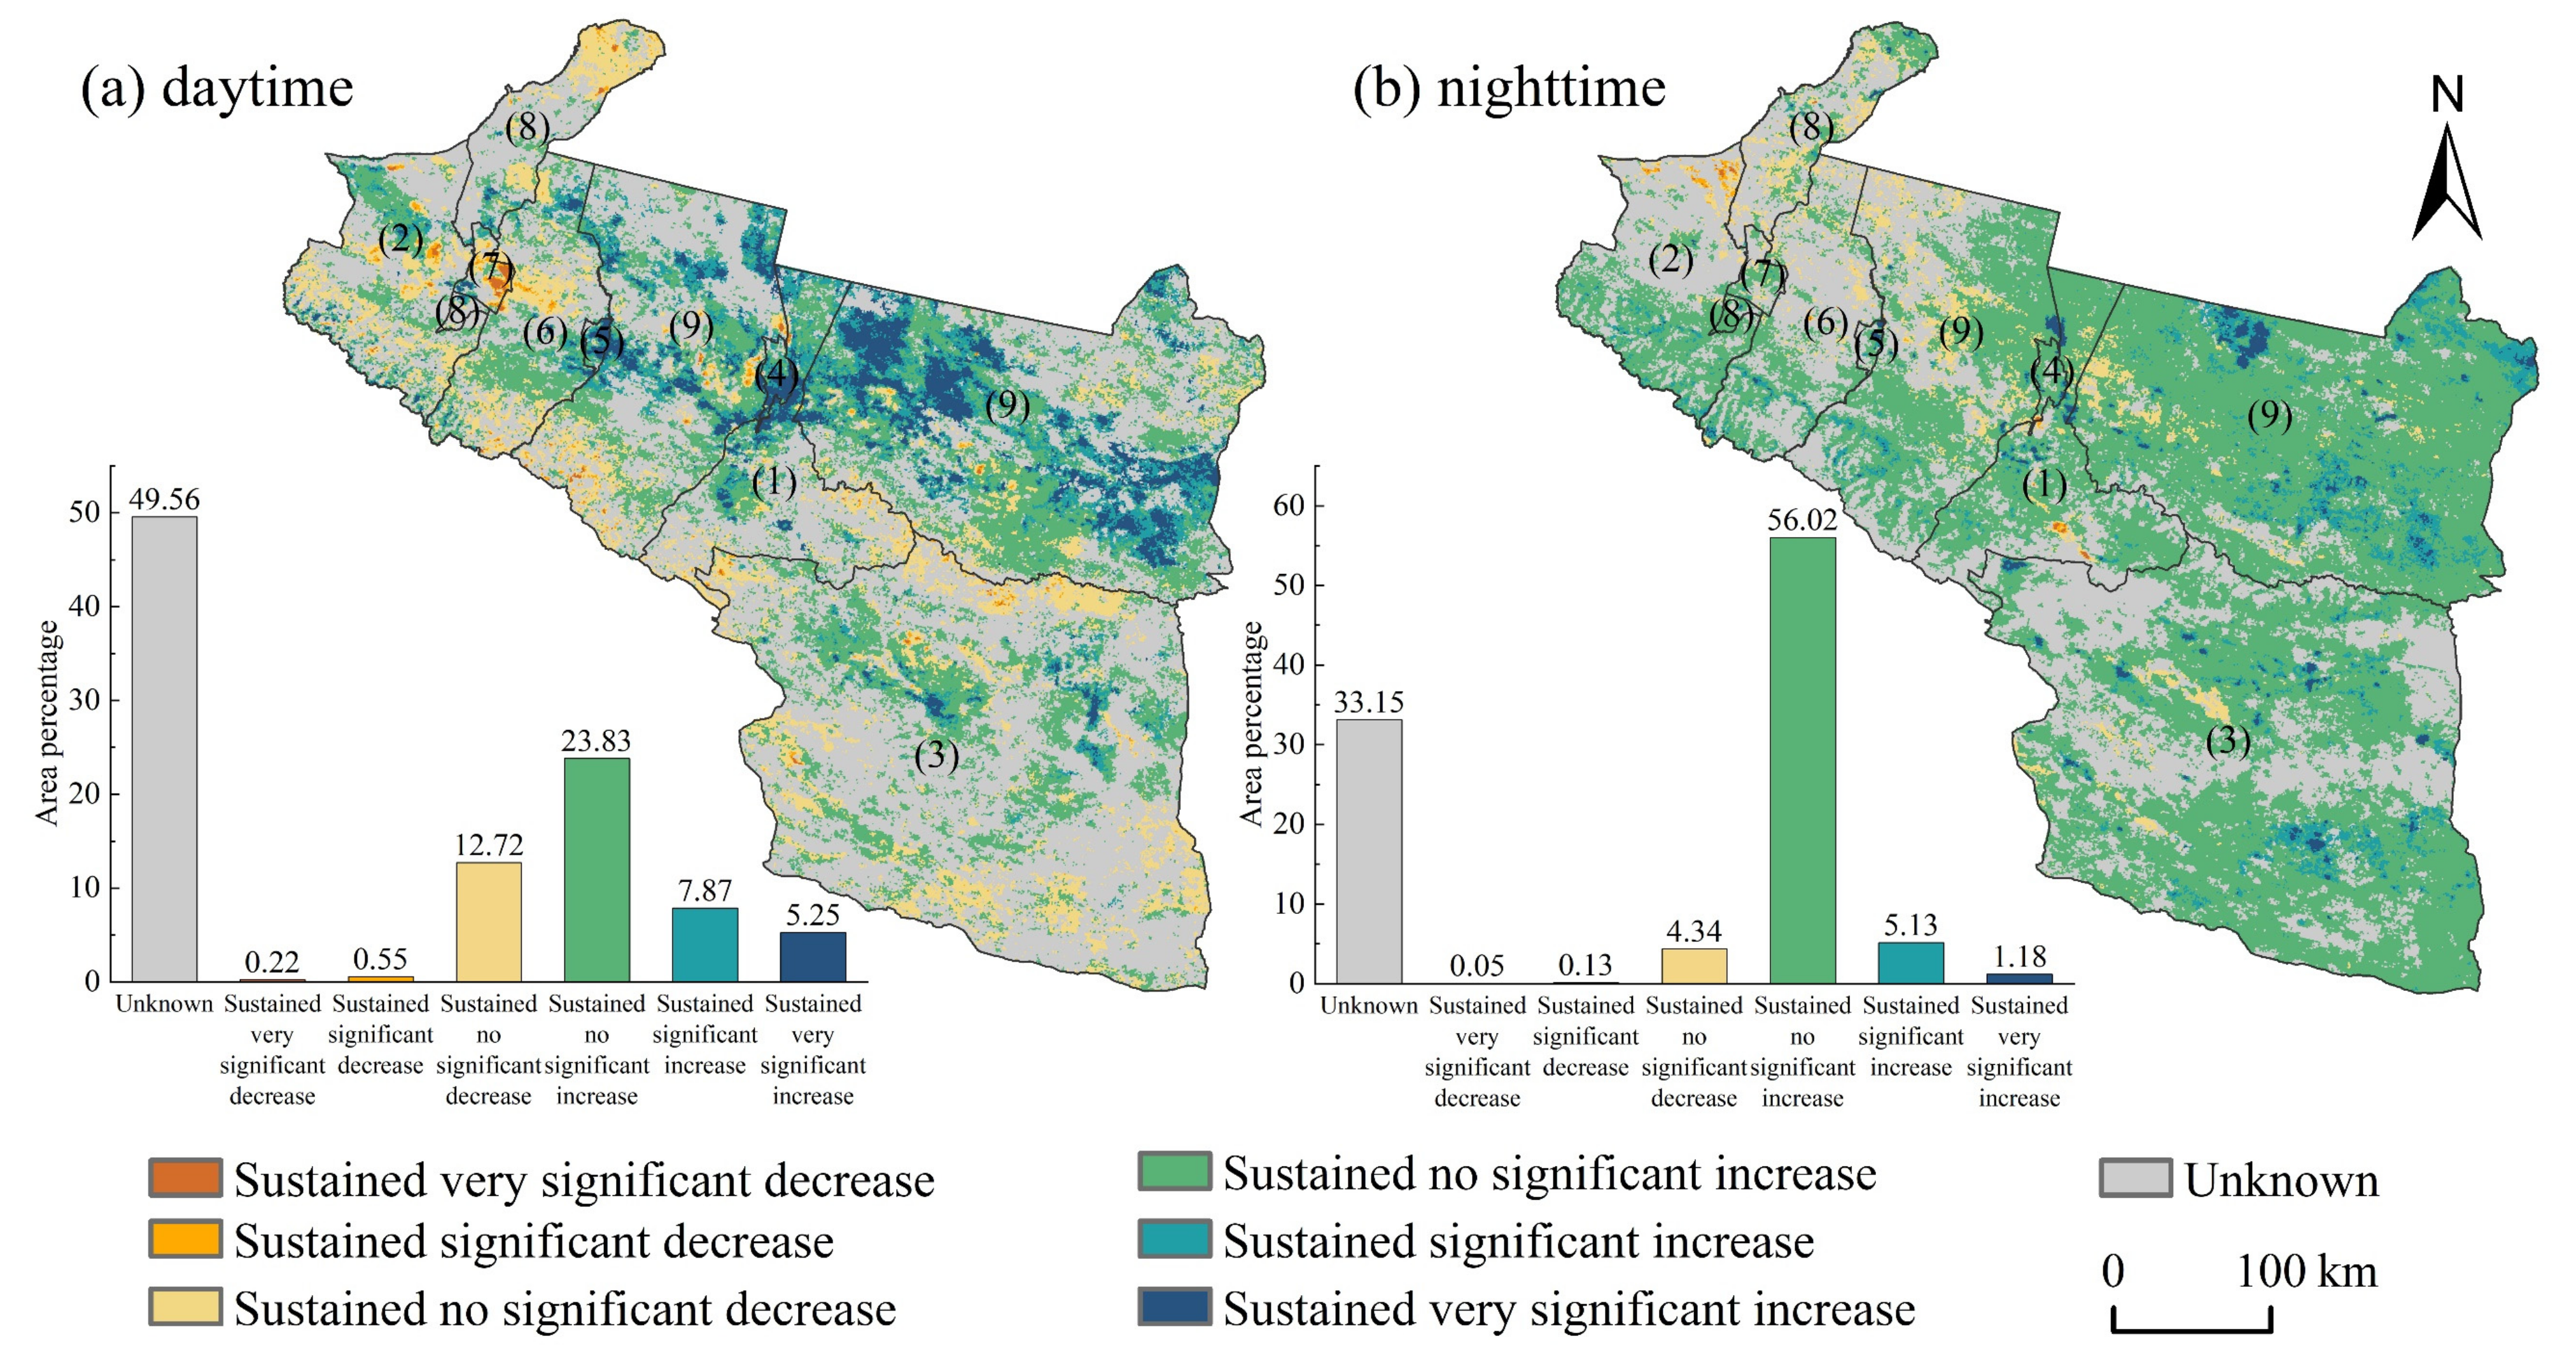
4.3.2. The Future Changing Trend of LST
4.4. Analysis of the Influencing Factors of LST
4.4.1. Discretization of Continuous Variables
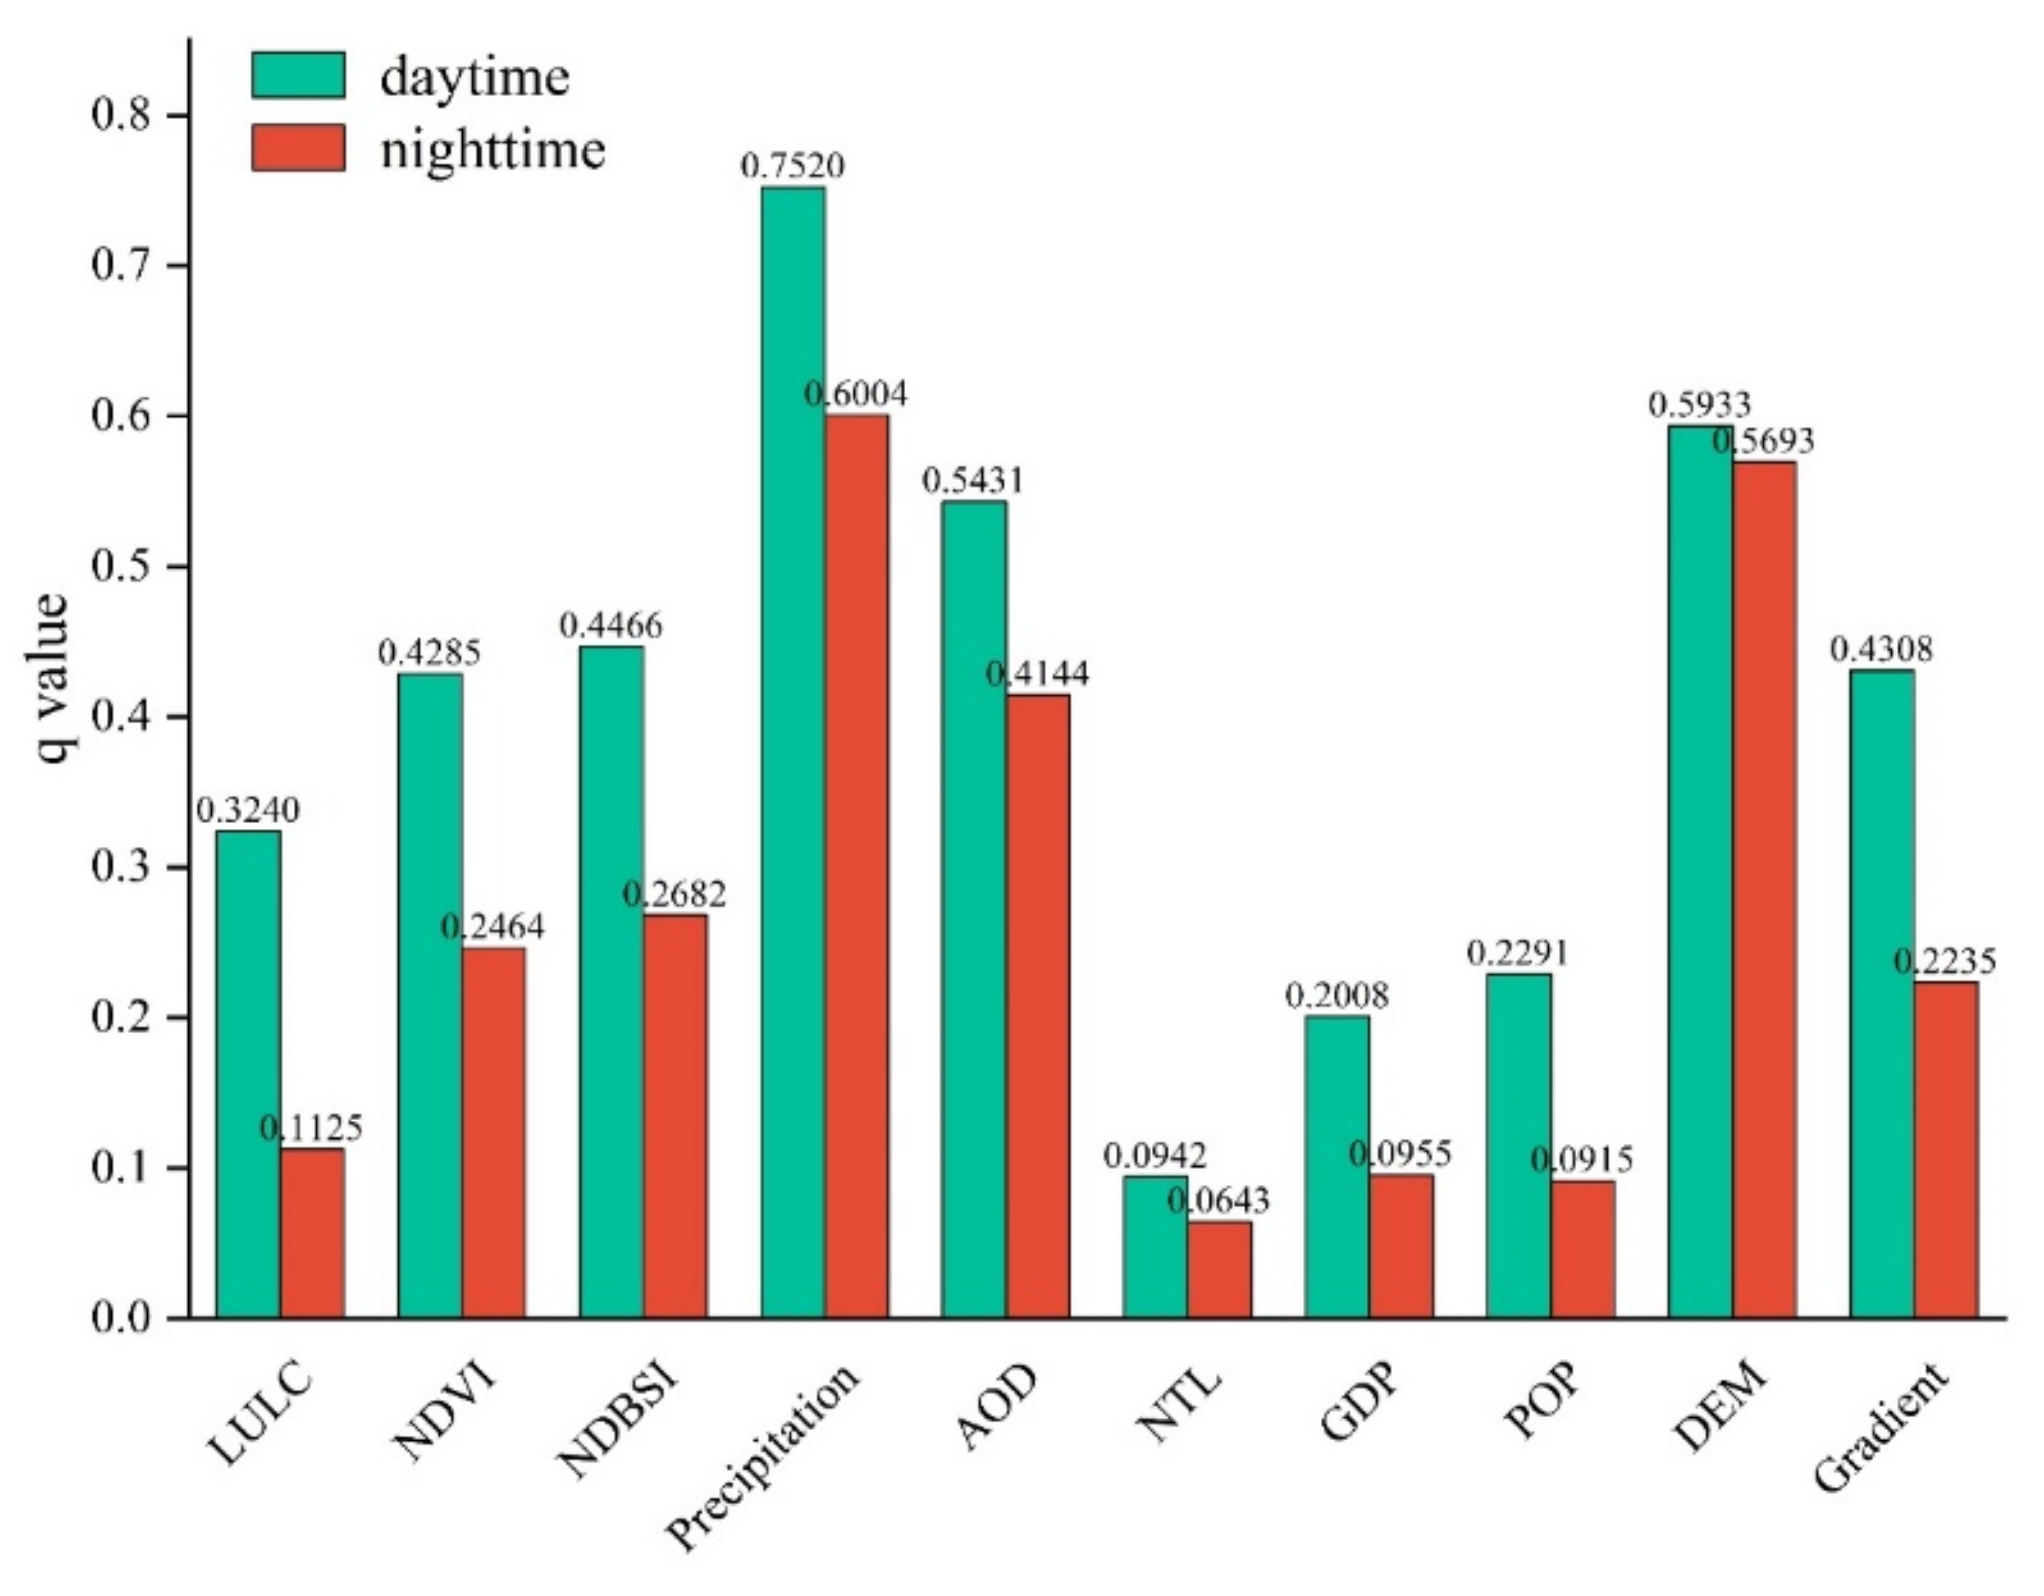
4.4.2. Impact of Each Influencing Factor on LST in the UANSTM
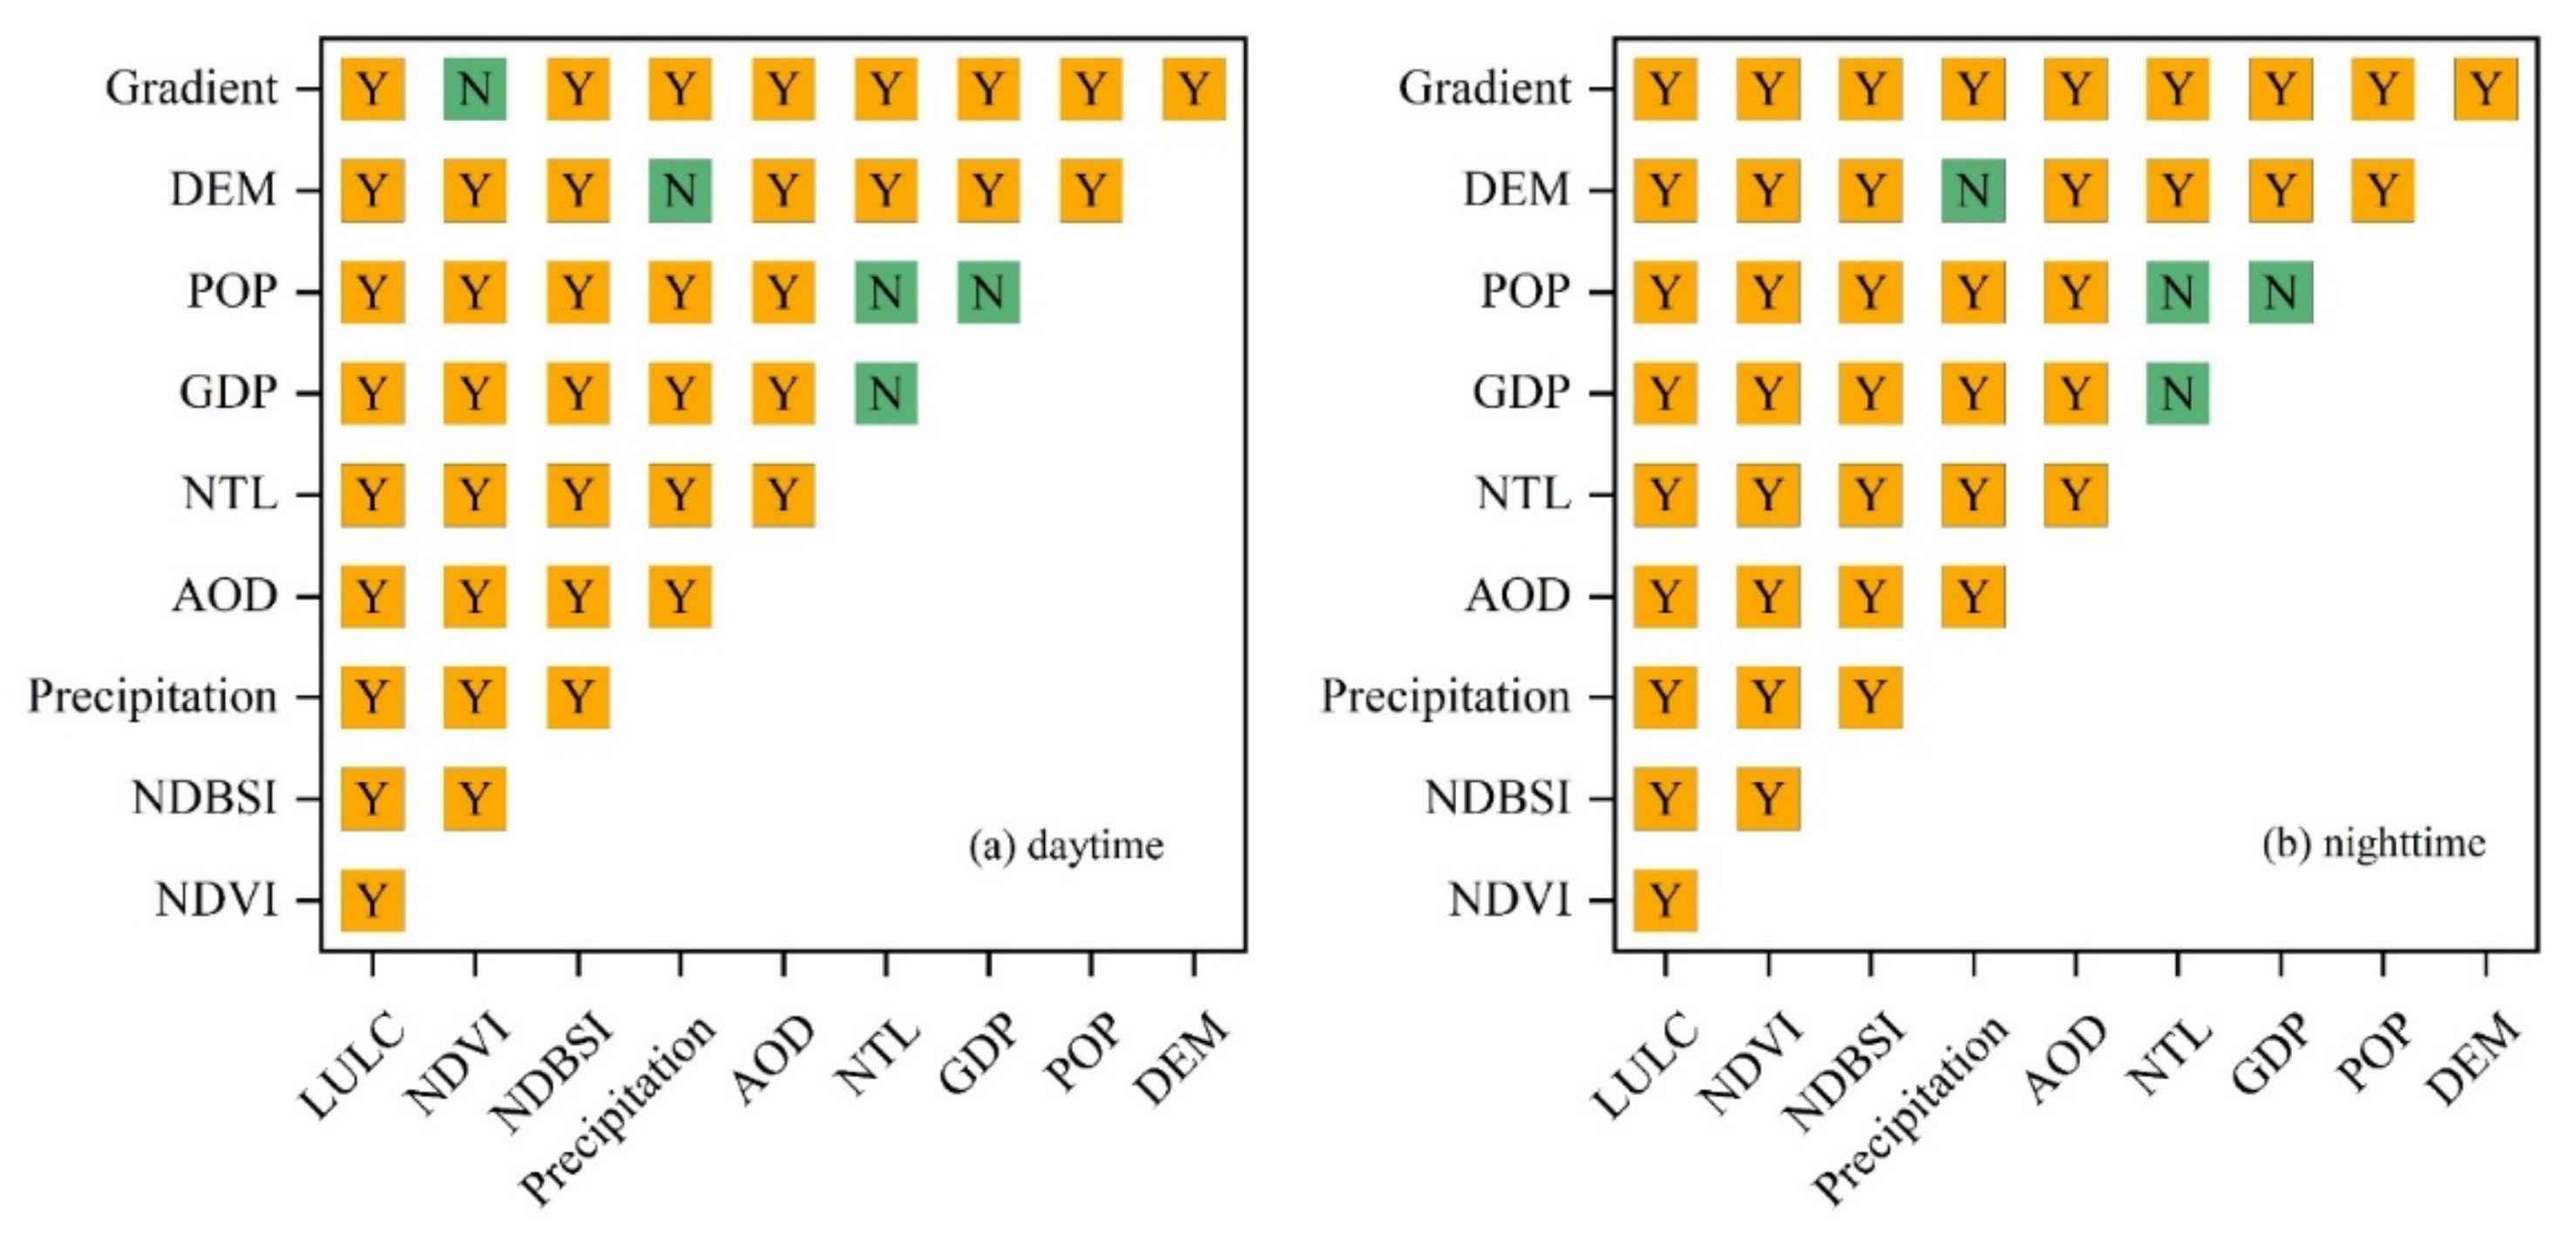
4.4.3. Interaction between Influencing Factors
4.4.4. Risk Interval Analysis of Each Influencing Factor
4.4.5. Differences in the Impact of Influencing Factors on LST
5. Discussion
5.1. Spatial Distribution Patterns and Changing Trend of LST
5.2. Influencing Factors of LST
5.3. Research Limitations and Future Work
6. Conclusions
- 1.
- In terms of the spatial distribution pattern, both daytime and nighttime, the LST classes of the UANSTM are dominated by MT and HT, with EHT and HT clustered in Turpan city. As far as the diurnal differences are concerned, in the oasis region, the cold island feature is observed during the daytime and the heat island feature is observed at night.
- 2.
- During 2005–2021, the northwestern part of the urban agglomeration on the northern slopes of the Tianshan Mountains fluctuated greatly, especially in Karamay and Usu. The LST showed an increasing trend in both the daytime and the nighttime, with an increase rate of 0.05 and 0.03 °C/yr−1, respectively. The increasing trend of LST in Urumqi, Changji Hui Autonomous Prefecture, Shihezi, and Wujiaqu was very significant during the daytime and still showed a significant increasing trend in the future, which needs to be investigated.
- 3.
- The climatic and topographic factors of precipitation, DEM, and AOD are the main factors affecting the LST of the UANSTM, and they all have q values above 0.5 during the daytime and above 0.4 during the nighttime. The effects of land cover factors (LULC, NDVI, and NDBSI) was the second most important, and socioeconomic factors (NTL, GDP, and POP) had the least influence on LST. The interactions between the influencing factors all showed enhancement types (nonlinear enhancement and bivariate enhancement), and one of the two influencing factors that showed the nonlinear enhancement type must be a socioeconomic factor.
- 4.
- Precipitation and DEM showed a negative linear correlation with LST, while AOD showed a positive linear correlation with LST. The mean LST values for each interval of precipitation and DEM decreased as the values within the interval increased, and the risk interval for precipitation and DEM occurred in the lowest value interval, while the mean LST values for each interval of AOD increased as the values within the interval increased, and the risk interval for AOD occurred in the highest value interval.
Author Contributions
Funding
Institutional Review Board Statement
Informed Consent Statement
Data Availability Statement
Acknowledgments
Conflicts of Interest
References
- Sobrino, J.A.; Jiménez-Muñoz, J. Minimum configuration of thermal infrared bands for land surface temperature and emissivity estimation in the context of potential future missions. Remote Sens. Environ. 2014, 148, 158–167. [Google Scholar] [CrossRef]
- Li, Z.; Tang, B.; Wu, H.; Ren, H.; Yan, G.; Wan, Z.; Trigo, I.F.; Sobrino, J.A. Satellite-derived land surface temperature: Current status and perspectives. Remote Sens. Environ. 2013, 131, 14–37. [Google Scholar] [CrossRef]
- Duan, S.; Li, Z.; Wu, H.; Leng, P.; Gao, M.; Wang, C. Radiance-based validation of land surface temperature products derived from Collection 6 MODIS thermal infrared data. Int. J. Appl. Earth Obs. Geoinf. 2018, 70, 84–92. [Google Scholar] [CrossRef]
- Grimm, N.B.; Faeth, S.H.; Golubiewski, N.E.; Redman, C.L.; Wu, J.; Bai, X.; Briggs, J.M. Global change and the ecology of cities. Science 2008, 319, 756–760. [Google Scholar] [CrossRef]
- Liu, G.; Zhang, Q.; Li, G.; Doronzo, D.M. Response of land cover types to land surface temperature derived from Landsat-5 TM in Nanjing Metropolitan Region, China. Environ. Earth Sci. 2016, 75, 1386. [Google Scholar] [CrossRef]
- Shen, H.; Huang, L.; Zhang, L.; Wu, P.; Zeng, C. Long-term and fine-scale satellite monitoring of the urban heat island effect by the fusion of multi-temporal and multi-sensor remote sensed data: A 26-year case study of the city of Wuhan in China. Remote Sens. Environ. 2016, 172, 109–125. [Google Scholar] [CrossRef]
- Chang, Y.; Xiao, J.; Li, X.; Middel, A.; Zhang, Y.; Gu, Z.; Wu, Y.; He, S. Exploring diurnal thermal variations in urban local climate zones with ECOSTRESS land surface temperature data. Remote Sens. Environ. 2021, 263, 112544. [Google Scholar] [CrossRef]
- Cao, Q.; Yu, D.; Georgescu, M.; Wu, J.; Wang, W. Impacts of future urban expansion on summer climate and heat-related human health in eastern China. Environ. Int. 2018, 112, 134–146. [Google Scholar] [CrossRef]
- Wilson, J.S.; Clay, M.; Martin, E.; Stuckey, D.; Vedder-Risch, K. Evaluating environmental influences of zoning in urban ecosystems with remote sensing. Remote Sens. Environ. 2003, 86, 303–321. [Google Scholar] [CrossRef]
- Fang, C.; Yu, D. Urban agglomeration: An evolving concept of an emerging phenomenon. Landsc. Urban Plann. 2017, 162, 126–136. [Google Scholar] [CrossRef]
- Fang, C. Important progress and future direction of studies on China’s urban agglomerations. J. Geogr. Sci. 2015, 25, 1003–1024. [Google Scholar] [CrossRef]
- Shen, Z.; Xu, X.; Xu, S.; Sun, D. A comparative study of land development patterns and regional thermal environments (RTEs) in typical urban agglomerations of China and America: A case study of Beijing-Tianjin-Hebei (BTH) and Boswash. Sci. Total Environ. 2022, 803, 149735. [Google Scholar] [CrossRef]
- Li, W.; Han, C.; Li, W.; Zhou, W.; Han, L. Multi-scale effects of urban agglomeration on thermal environment: A case of the Yangtze River Delta Megaregion, China. Sci. Total Environ. 2020, 713, 136556. [Google Scholar] [CrossRef]
- Yu, Z.; Yao, Y.; Yang, G.; Wang, X.; Vejre, H. Spatiotemporal patterns and characteristics of remotely sensed region heat islands during the rapid urbanization (1995–2015) of Southern China. Sci. Total Environ. 2019, 674, 242–254. [Google Scholar] [CrossRef]
- Liu, X.; Ming, Y.; Liu, Y.; Yue, W.; Han, G. Influences of landform and urban form factors on urban heat island: Comparative case study between Chengdu and Chongqing. Sci. Total Environ. 2022, 820, 153395. [Google Scholar] [CrossRef]
- Imhoff, M.L.; Zhang, P.; Wolfe, R.E.; Bounoua, L. Remote sensing of the urban heat island effect across biomes in the continental USA. Remote Sens. Environ. 2010, 114, 504–513. [Google Scholar] [CrossRef]
- Chen, L.; Wang, X.; Cai, X.; Yang, C.; Lu, X. Seasonal variations of daytime land surface temperature and their underlying drivers over Wuhan, China. Remote Sens. 2021, 13, 323. [Google Scholar] [CrossRef]
- Gao, Y.; Zhao, J.; Han, L. Exploring the spatial heterogeneity of urban heat island effect and its relationship to block morphology with the geographically weighted regression model. Sustain. Cities 2022, 76, 103431. [Google Scholar] [CrossRef]
- El Kenawy, A.M.; Hereher, M.; Robaa, S.M.; McCabe, M.F.; Lopez-Moreno, J.I.; Domínguez-Castro, F.; Gaber, I.M.; Al-Awadhi, T.; Al-Buloshi, A.; Al Nasiri, N. Nocturnal surface urban heat island over Greater Cairo: Spatial morphology, temporal trends and links to land-atmosphere influences. Remote Sens. 2020, 12, 3889. [Google Scholar] [CrossRef]
- Du, J.; Xiang, X.; Zhao, B.; Zhou, H. Impact of urban expansion on land surface temperature in Fuzhou, China using Landsat imagery. Sustain. Cities 2020, 61, 102346. [Google Scholar] [CrossRef]
- Niu, L.; Zhang, Z.; Peng, Z.; Liang, Y.; Liu, M.; Jiang, Y.; Wei, J.; Tang, R. Identifying surface urban heat island drivers and their spatial heterogeneity in China’s 281 cities: An empirical study based on multiscale geographically weighted regression. Remote Sens. 2021, 13, 4428. [Google Scholar] [CrossRef]
- Ivajnšič, D.; Kaligarič, M.; Žiberna, I. Geographically weighted regression of the urban heat island of a small city. Appl. Geogr. 2014, 53, 341–353. [Google Scholar] [CrossRef]
- Wu, Y.; Hou, H.; Wang, R.; Murayama, Y.; Wang, L.; Hu, T. Effects of landscape patterns on the morphological evolution of surface urban heat island in Hangzhou during 2000–2020. Sustain. Cities Soc. 2022, 79, 103717. [Google Scholar] [CrossRef]
- Ye, H.; Li, Z.; Zhang, N.; Leng, X.; Meng, D.; Zheng, J.; Li, Y. Variations in the effects of landscape patterns on the urban thermal environment during rapid urbanization (1990–2020) in megacities. Remote Sens. 2021, 13, 3415. [Google Scholar] [CrossRef]
- Lu, L.; Weng, Q.; Xiao, D.; Guo, H.; Li, Q.; Hui, W. Spatiotemporal variation of surface urban heat islands in relation to land cover composition and configuration: A multi-scale case study of Xi’an, China. Remote Sens. 2020, 12, 2713. [Google Scholar] [CrossRef]
- Gao, J.; Gong, J.; Yang, J.; Li, J.; Li, S. Measuring Spatial Connectivity between patches of the heat source and sink (SCSS): A new index to quantify the heterogeneity impacts of landscape patterns on land surface temperature. Landsc. Urban Plann. 2022, 217, 104260. [Google Scholar] [CrossRef]
- Zhou, W.; Qian, Y.; Li, X.; Li, W.; Han, L. Relationships between land cover and the surface urban heat island: Seasonal variability and effects of spatial and thematic resolution of land cover data on predicting land surface temperatures. Landsc. Ecol. 2014, 29, 153–167. [Google Scholar] [CrossRef]
- Kuang, W.; Yang, T.; Liu, A.; Zhang, C.; Lu, D.; Chi, W. An EcoCity model for regulating urban land cover structure and thermal environment: Taking Beijing as an example. Sci. China Earth Sci. 2017, 60, 1098–1109. [Google Scholar] [CrossRef]
- Farhadi, H.; Faizi, M.; Sanaieian, H. Mitigating the urban heat island in a residential area in Tehran: Investigating the role of vegetation, materials, and orientation of buildings. Sustain. Cities 2019, 46, 101448. [Google Scholar] [CrossRef]
- Wang, X.; Meng, Q.; Zhang, L.; Hu, D. Evaluation of urban green space in terms of thermal environmental benefits using geographical detector analysis. Int. J. Appl. Earth Obs. Geoinf. 2021, 105, 102610. [Google Scholar] [CrossRef]
- Peng, J.; Jia, J.; Liu, Y.; Li, H.; Wu, J. Seasonal contrast of the dominant factors for spatial distribution of land surface temperature in urban areas. Remote Sens. Environ. 2018, 215, 255–267. [Google Scholar] [CrossRef]
- Mushore, T.D.; Mutanga, O.; Odindi, J. Estimating urban LST using multiple remotely sensed spectral indices and elevation retrievals. Sustain. Cities Soc. 2022, 78, 103623. [Google Scholar] [CrossRef]
- Liu, W.; Meng, Q.; Allam, M.; Zhang, L.; Hu, D.; Menenti, M. Driving factors of land surface temperature in urban agglomerations: A case study in the pearl river delta, china. Remote Sens. 2021, 13, 2858. [Google Scholar] [CrossRef]
- Taripanah, F.; Ranjbar, A. Quantitative analysis of spatial distribution of land surface temperature (LST) in relation Ecohydrological, terrain and socio-economic factors based on Landsat data in mountainous area. Adv. Space Res. 2021, 68, 3622–3640. [Google Scholar] [CrossRef]
- Ma, Y.; Zhang, S.; Yang, K.; Li, M. Influence of spatiotemporal pattern changes of impervious surface of urban megaregion on thermal environment: A case study of the Guangdong–Hong Kong–Macao Greater Bay Area of China. Ecol. Indic. 2021, 121, 107106. [Google Scholar] [CrossRef]
- Yu, B.; Tang, M.; Wu, Q.; Yang, C.; Deng, S.; Shi, K.; Peng, C.; Wu, J.; Chen, Z. Urban built-up area extraction from log-transformed NPP-VIIRS nighttime light composite data. IEEE Geosci. Remote Sens. Lett. 2018, 15, 1279–1283. [Google Scholar] [CrossRef]
- Wang, Z.; Sun, D.; Hu, C.; Wang, Y.; Zhang, J. Seasonal contrast and interactive effects of potential drivers on land surface temperature in the Sichuan basin, China. Remote Sens. 2022, 14, 1292. [Google Scholar] [CrossRef]
- Cao, C.; Lee, X.; Liu, S.; Schultz, N.; Xiao, W.; Zhang, M.; Zhao, L. Urban heat islands in China enhanced by haze pollution. Nat. Commun. 2016, 7, 12509. [Google Scholar] [CrossRef]
- Huang, X.; Wang, Y. Investigating the effects of 3D urban morphology on the surface urban heat island effect in urban functional zones by using high-resolution remote sensing data: A case study of Wuhan, Central China. ISPRS J. Photogramm. Remote Sens. 2019, 152, 119–131. [Google Scholar] [CrossRef]
- Xiong, Y.; Zhang, F. Effect of human settlements on urban thermal environment and factor analysis based on multi-source data: A case study of Changsha city. J. Geogr. Sci. 2021, 31, 819–838. [Google Scholar] [CrossRef]
- Wang, J.F.; Li, X.H.; Christakos, G.; Liao, Y.L.; Zhang, T.; Gu, X.; Zheng, X.Y. Geographical detectors-based health risk assessment and its application in the neural tube defects study of the Heshun Region, China. Int. J. Geogr. Inf Sci. 2010, 24, 107–127. [Google Scholar] [CrossRef]
- Dong, Y.; Yin, D.; Li, X.; Huang, J.; Su, W.; Li, X.; Wang, H. Spatial–temporal evolution of vegetation NDVI in association with climatic, environmental and anthropogenic factors in the loess plateau, China during 2000–2015: Quantitative analysis based on geographical detector model. Remote Sens. 2021, 13, 4380. [Google Scholar] [CrossRef]
- Gao, Q.; Fang, C.; Liu, H.; Zhang, L. Conjugate evaluation of sustainable carrying capacity of urban agglomeration and multi-scenario policy regulation. Sci. Total Environ. 2021, 785, 147373. [Google Scholar] [CrossRef]
- Fang, C.; Gao, Q.; Zhang, X.; Cheng, W. Spatiotemporal characteristics of the expansion of an urban agglomeration and its effect on the eco-environment: Case study on the northern slope of the Tianshan Mountains. Sci. China Earth Sci. 2019, 62, 1461–1472. [Google Scholar] [CrossRef]
- Wei, Y.; Shi, Z.; Biswas, A.; Yang, S.; Ding, J.; Wang, F. Updated information on soil salinity in a typical oasis agroecosystem and desert-oasis ecotone: Case study conducted along the Tarim River, China. Sci. Total Environ. 2020, 716, 135387. [Google Scholar] [CrossRef]
- Wang, H.; Cai, Y.; Yang, Q.; Gong, Y.; Lv, G. Factors that alter the relative importance of abiotic and biotic drivers on the fertile island in a desert-oasis ecotone. Sci. Total Environ. 2019, 697, 134096. [Google Scholar] [CrossRef]
- Yan, Y.; Chai, Z.; Zibibula, S.; Yang, S. The temporal and spatial changes of the ecological environment quality of the urban agglomeration on the northern slope of Tianshan Mountain and the influencing factors. Ecol. Indic. 2021, 133, 108380. [Google Scholar]
- Li, C.; Wang, R.; Cui, X.; Wu, F.; Yan, Y.; Peng, Q.; Qian, Z.; Xu, Y. Responses of vegetation spring phenology to climatic factors in Xinjiang, China. Ecol. Indic. 2021, 124, 107286. [Google Scholar] [CrossRef]
- Ouyang, X.; Tang, L.; Wei, X.; Li, Y. Spatial interaction between urbanization and ecosystem services in Chinese urban agglomerations. Land Use Policy 2021, 109, 105587. [Google Scholar] [CrossRef]
- Wan, Z. New refinements and validation of the collection-6 MODIS land-surface temperature/emissivity product. Remote Sens. Environ. 2014, 140, 36–45. [Google Scholar] [CrossRef]
- Qiao, Z.; Tian, G.; Xiao, L. Diurnal and seasonal impacts of urbanization on the urban thermal environment: A case study of Beijing using MODIS data. ISPRS J. Photogramm. Remote Sens. 2013, 85, 93–101. [Google Scholar] [CrossRef]
- Wei, B.; Bao, Y.; Yu, S.; Yin, S.; Zhang, Y. Analysis of land surface temperature variation based on MODIS data a case study of the agricultural pastural ecotone of northern China. Int. J. Appl. Earth Obs. Geoinf. 2021, 100, 102342. [Google Scholar] [CrossRef]
- Song, Z.; Yang, H.; Huang, X.; Yu, W.; Huang, J.; Ma, M. The spatiotemporal pattern and influencing factors of land surface temperature change in China from 2003 to 2019. Int. J. Appl. Earth Obs. Geoinf. 2021, 104, 102537. [Google Scholar] [CrossRef]
- Yang, J.; Huang, X. The 30 m annual land cover dataset and its dynamics in China from 1990 to 2019. Earth Syst. Sci. Data 2021, 13, 3907–3925. [Google Scholar] [CrossRef]
- Yu, H.; Bian, Z.; Mu, S.; Yuan, J.; Chen, F. Effects of climate change on land cover change and vegetation dynamics in Xinjiang, China. Int. J. Environ. Res. Public Health 2020, 17, 4865. [Google Scholar] [CrossRef]
- Mahmood, R.; Jia, S. Assessment of hydro-climatic trends and causes of dramatically declining stream flow to Lake Chad, Africa, using a hydrological approach. Sci. Total Environ. 2019, 675, 122–140. [Google Scholar] [CrossRef]
- Mohammad, P.; Goswami, A. Temperature and precipitation trend over 139 major Indian cities: An assessment over a century. Model. Earth Syst. Environ. 2019, 5, 1481–1493. [Google Scholar] [CrossRef]
- Hurst, H.E. Long-term storage capacity of reservoirs. Trans. Am. Soc. Civ. Eng. 1951, 116, 770–799. [Google Scholar] [CrossRef]
- Mandelbrot, B.B.; Wallis, J.R. Robustness of the rescaled range R/S in the measurement of noncyclic long run statistical dependence. Resour. Res. 1969, 5, 967–988. [Google Scholar] [CrossRef]
- Yang, L.; Fu, R.; He, W.; He, Q.; Liu, Y. Adaptive thermal comfort and climate responsive building design strategies in dry–hot and dry–cold areas: Case study in Turpan, China. Energy Build. 2020, 209, 109678. [Google Scholar] [CrossRef]
- Pei, H.; Fang, S.; Lin, L.; Qin, Z.; Wang, X. Methods and applications for ecological vulnerability evaluation in a hyper-arid oasis: A case study of the Turpan Oasis, China. Environ. Earth Sci. 2015, 74, 1449–1461. [Google Scholar] [CrossRef] [Green Version]
- Oke, T.R. Boundary Layer Climates; Routledge: Abingdon-on-Thames, UK, 2002. [Google Scholar]
- Hao, X.; Li, W.; Deng, H. The oasis effect and summer temperature rise in arid regions-case study in Tarim Basin. Sci. Rep. 2016, 6, 35418. [Google Scholar] [CrossRef] [PubMed]
- Hao, X.; Li, W. Oasis cold island effect and its influence on air temperature: A case study of Tarim Basin, Northwest China. J. Arid Land 2016, 8, 172–183. [Google Scholar] [CrossRef]
- Han, S.; Yang, Z. Cooling effect of agricultural irrigation over Xinjiang, Northwest China from 1959 to 2006. Environ. Res. Lett. 2013, 8, 024039. [Google Scholar] [CrossRef]
- Zhu, X.; Liang, S.; Pan, Y. Observational evidence of the cooling effect of agricultural irrigation in Jilin, China. Clim. Change 2012, 114, 799–811. [Google Scholar] [CrossRef]
- Wen, K.; Ren, G.; Li, J.; Zhang, A.; Ren, Y.; Sun, X.; Zhou, Y. Recent surface air temperature change over mainland China based on an urbanization-bias adjusted dataset. J. Clim. 2019, 32, 2691–2705. [Google Scholar] [CrossRef]
- Solomon, S.; Rosenlof, K.H.; Portmann, R.W.; Daniel, J.S.; Davis, S.M.; Sanford, T.J.; Plattner, G.-K. Contributions of stratospheric water vapor to decadal changes in the rate of global warming. Science 2010, 327, 1219–1223. [Google Scholar] [CrossRef] [PubMed]
- Zhang, Y.; He, Y.; Li, Y.; Jia, L. Spatiotemporal variation and driving forces of NDVI from 1982 to 2015 in the Qinba Mountains, China. Environ. Sci. Pollut. Res. 2022, 29, 52277–52288. [Google Scholar] [CrossRef]
- Huang, C.; Yang, Q.; Zhang, H. Temporal and spatial variation of ndvi and its driving factors in qinling mountain. Water 2021, 13, 3154. [Google Scholar] [CrossRef]
- Ma, X.; Huang, G.; Cao, J. The significant roles of anthropogenic aerosols on surface temperature under carbon neutrality. Sci. Bull. 2022, 67, 470–473. [Google Scholar] [CrossRef]
- Choobari, O.A.; Zawar-Reza, P.; Sturman, A. The global distribution of mineral dust and its impacts on the climate system: A review. Atmos. Res. 2014, 138, 152–165. [Google Scholar] [CrossRef]
- Liu, J.; Ding, J.; Rexiding, M.; Li, X.; Zhang, J.; Ran, S.; Bao, Q.; Ge, X. Characteristics of dust aerosols and identification of dust sources in Xinjiang, China. Atmos. Environ. 2021, 262, 118651. [Google Scholar] [CrossRef]
- Lan, Y.; Zhan, Q.J.B. How do urban buildings impact summer air temperature? The effects of building configurations in space and time. Build. Environ. 2017, 125, 88–98. [Google Scholar] [CrossRef]
- Zhou, D.; Zhang, L.; Li, D.; Huang, D.; Zhu, C. Climate–vegetation control on the diurnal and seasonal variations of surface urban heat islands in China. Environ. Res. Lett. 2016, 11, 074009. [Google Scholar] [CrossRef]
- Yin, Z.; Wu, P.; Foody, G.M.; Wu, Y.; Liu, Z.; Du, Y.; Ling, F. Spatiotemporal fusion of land surface temperature based on a convolutional neural network. IEEE Trans. Geosci. Remote Sens. 2020, 59, 1808–1822. [Google Scholar] [CrossRef]
- Hutengs, C.; Vohland, M. Downscaling land surface temperatures at regional scales with random forest regression. Remote Sens. Environ. 2016, 178, 127–141. [Google Scholar] [CrossRef]
- Zhang, Y.; Liu, J.; Wen, Z. Predicting surface urban heat island in Meihekou city, China: A combination method of monte carlo and random forest. Chin. Geogr. Sci. 2021, 31, 659–670. [Google Scholar] [CrossRef]
- Chen, D.; Zhang, F.; Zhang, M.; Meng, Q.; Jim, C.Y.; Shi, J.; Tan, M.L.; Ma, X. Landscape and vegetation traits of urban green space can predict local surface temperature. Sci. Total Environ. 2022, 825, 154006. [Google Scholar] [CrossRef]
- Zhao, D.; Wang, J.; Zhao, X.; Triantafilis, J. Clay content mapping and uncertainty estimation using weighted model averaging. Catena 2022, 209, 105791. [Google Scholar] [CrossRef]


| Time | Maximum | Minimum | Average | Standard Deviation | Time | Maximum | Minimum | Average | Standard Deviation |
|---|---|---|---|---|---|---|---|---|---|
| 2005 daytime | 46.50 | −13.10 | 23.25 | 8.82 | 2013 nighttime | 10.57 | −25.12 | −0.25 | 4.09 |
| 2005 nighttime | 12.64 | −27.38 | −1.28 | 4.34 | 2014 daytime | 41.36 | −13.52 | 23.14 | 8.38 |
| 2006 daytime | 46.19 | −12.35 | 24.13 | 8.40 | 2014 nighttime | 9.59 | −25.68 | −1.41 | 4.18 |
| 2006 nighttime | 12.85 | −26.75 | −0.45 | 4.23 | 2015 daytime | 43.60 | −12.25 | 24.31 | 8.67 |
| 2007 daytime | 41.75 | −12.80 | 23.80 | 8.48 | 2015 nighttime | 10.92 | −22.72 | 0.19 | 4.16 |
| 2007 nighttime | 10.99 | −27.53 | −0.61 | 4.20 | 2016 daytime | 44.01 | −12.14 | 23.59 | 8.79 |
| 2008 daytime | 42.70 | −12.83 | 24.66 | 8.46 | 2016 nighttime | 12.72 | −28.19 | 0.03 | 4.21 |
| 2008 nighttime | 10.53 | −29.97 | −0.72 | 4.23 | 2017 daytime | 43.37 | −12.08 | 24.29 | 8.77 |
| 2009 daytime | 41.92 | −13.00 | 24.20 | 8.67 | 2017 nighttime | 13.84 | −28.11 | −0.04 | 4.38 |
| 2009 nighttime | 10.17 | −26.78 | −1.19 | 4.16 | 2018 daytime | 41.88 | −13.38 | 23.03 | 8.55 |
| 2010 daytime | 42.46 | −13.24 | 22.30 | 8.57 | 2018 nighttime | 9.87 | −29.60 | −1.67 | 4.07 |
| 2010 nighttime | 9.77 | −27.17 | −1.31 | 4.09 | 2019 daytime | 42.60 | −13.81 | 24.09 | 8.48 |
| 2011 daytime | 44.43 | −12.87 | 23.15 | 8.74 | 2019 nightime | 11.10 | −25.49 | −0.38 | 4.26 |
| 2011 nighttime | 9.86 | −27.21 | −1.38 | 4.20 | 2020 daytime | 43.61 | −12.30 | 24.45 | 8.41 |
| 2012 daytime | 44.03 | −14.09 | 23.07 | 8.87 | 2020 nighttime | 11.04 | −27.48 | −0.96 | 4.22 |
| 2012 nighttime | 10.37 | −28.24 | −1.76 | 4.30 | 2021 daytime | 43.25 | −12.73 | 24.63 | 8.65 |
| 2013 daytime | 46.35 | −12.54 | 24.63 | 8.60 | 2021 nighttime | 11.09 | −24.54 | −0.75 | 4.18 |
| Types of Influencing Factors | Factors | Initial Resolution/Resampling Resolution | Time | Access |
|---|---|---|---|---|
| Land cover factors | LULC | 1000 m/1000 m | 2019 | https://zenodo.org/, accessed on 19 April 2022 |
| NDVI | 1000 m/1000 m | 2019 | https://ladsweb.modaps.eosdis.nasa.gov/, accessed on 15 April 2022 | |
| NDBSI | 500 m/1000 m | 2019 | https://ladsweb.modaps.eosdis.nasa.gov/, accessed on 15 April 2022 | |
| Climatic factors | Precipitation | 1000 m/1000 m | 2019 | http://data.tpdc.ac.cn/, accessed on 16 April 2022 |
| AOD | 1000 m/1000 m | 2019 | https://ladsweb.modaps.eosdis.nasa.gov/, accessed on 15 April 2022 | |
| Socioeconomic factors | NTL | 500 m/1000 m | 2019 | https://eogdata.mines.edu/products/vnl/, accessed on 15 April 2022 |
| GDP | 1000 m/1000 m | 2019 | https://www.resdc.cn/, accessed on 15 April 2022 | |
| POP | 1000 m/1000 m | 2019 | https://www.resdc.cn/, accessed on 15 April 2022 | |
| Topographical factors | DEM | 30 m/1000 m | - | http://www.gscloud.cn/, accessed on 16 April 2022 |
| Gradient | 30 m/1000 m | - | http://www.gscloud.cn/, accessed on 16 April 2022 |
| LST Classes | LST Range |
|---|---|
| EHT | T > μ + 1.5 std |
| HT | μ + 0.5 std < T ≤ μ + 1.5 std |
| MT | μ − 0.5 std ≤ T < μ + 0.5 std |
| LT | μ − 1.5 std ≤ T < μ − 0.5 std |
| ELT | T < μ − 1.5 std |
| Slope and Z Value | Changing Trends | Slope, Z Value and Hurst Index | Future Changing Trends |
|---|---|---|---|
| Slope < 0, Z ≤ −2.58 | Very significantly decreased | Slope < 0, Z ≤ −2.58, H > 0.5 | Sustained very significant decrease |
| Slope < 0, −2.58 < Z ≤ −1.96 | Significantly decreased | Slope < 0, −2.58 < Z ≤ −1.96, H > 0.5 | Sustained significant decrease |
| Slope < 0, −1.96 < Z < 1.96 | Not significantly decreased | Slope < 0, −1.96 < Z < 1.96, H > 0.5 | Sustained no significant decrease |
| Slope > 0, 1.96 < Z < 1.96 | Not significantly increased | Slope > 0, 1.96 < Z < 1.96, H > 0.5 | Sustained no significant increase |
| Slope > 0, 1.96 ≤ Z < 2.58 | Significantly increased | Slope > 0, 1.96 ≤ Z < 2.58, H > 0.5 | Sustained significant increase |
| Slope > 0, Z ≥ 2.58 | Very significantly increased | Slope > 0, Z ≥ 2.58, H > 0.5 | Sustained very significant increase |
| – | – | H ≤ 0.5 | Unknown |
| Interaction Types | Judgment Standard |
|---|---|
| Weaken, nonlinear | q(X1∩X2) < Min(q(X1), q(X2)) |
| Weaken, univariate | Min(q(X1), q(X2)) < q(X1∩X2) < Max(q(X1), q(X2)) |
| Independent | q(X1∩X2) = q(X1) + q(X2) |
| Enhance bivariate | q(X1∩X2) > Max(q(X1), q(X2)) |
| Enhance, nonlinear | q(X1∩X2) > q(X1) + q(X2) |
| Continuous Variables | Daytime | Nighttime | ||
|---|---|---|---|---|
| Method | Number of Intervals | Method | Number of Intervals | |
| NDVI | standard deviation | 7 | standard deviation | 7 |
| NDBSI | natural breaks | 7 | standard deviation | 5 |
| Precipitation | natural breaks | 6 | natural breaks | 6 |
| AOD | standard deviation | 7 | standard deviation | 7 |
| NTL | quantile | 7 | quantile | 7 |
| GDP | quantile | 6 | quantile | 7 |
| POP | quantile | 7 | quantile | 7 |
| DEM | standard deviation | 7 | standard deviation | 5 |
| Gradient | standard deviation | 7 | standard deviation | 7 |
Publisher’s Note: MDPI stays neutral with regard to jurisdictional claims in published maps and institutional affiliations. |
© 2022 by the authors. Licensee MDPI, Basel, Switzerland. This article is an open access article distributed under the terms and conditions of the Creative Commons Attribution (CC BY) license (https://creativecommons.org/licenses/by/4.0/).
Share and Cite
Liang, H.; Kasimu, A.; Ma, H.; Zhao, Y.; Zhang, X.; Wei, B. Exploring the Variations and Influencing Factors of Land Surface Temperature in the Urban Agglomeration on the Northern Slope of the Tianshan Mountains. Sustainability 2022, 14, 10663. https://doi.org/10.3390/su141710663
Liang H, Kasimu A, Ma H, Zhao Y, Zhang X, Wei B. Exploring the Variations and Influencing Factors of Land Surface Temperature in the Urban Agglomeration on the Northern Slope of the Tianshan Mountains. Sustainability. 2022; 14(17):10663. https://doi.org/10.3390/su141710663
Chicago/Turabian StyleLiang, Hongwu, Alimujiang Kasimu, Haitao Ma, Yongyu Zhao, Xueling Zhang, and Bohao Wei. 2022. "Exploring the Variations and Influencing Factors of Land Surface Temperature in the Urban Agglomeration on the Northern Slope of the Tianshan Mountains" Sustainability 14, no. 17: 10663. https://doi.org/10.3390/su141710663
APA StyleLiang, H., Kasimu, A., Ma, H., Zhao, Y., Zhang, X., & Wei, B. (2022). Exploring the Variations and Influencing Factors of Land Surface Temperature in the Urban Agglomeration on the Northern Slope of the Tianshan Mountains. Sustainability, 14(17), 10663. https://doi.org/10.3390/su141710663