
Assessing Gridded Precipitation and Air Temperature Products in the Ayakkum Lake, Central Asia

 ,
, 

Abstract
:1. Introduction
2. Data and Methods
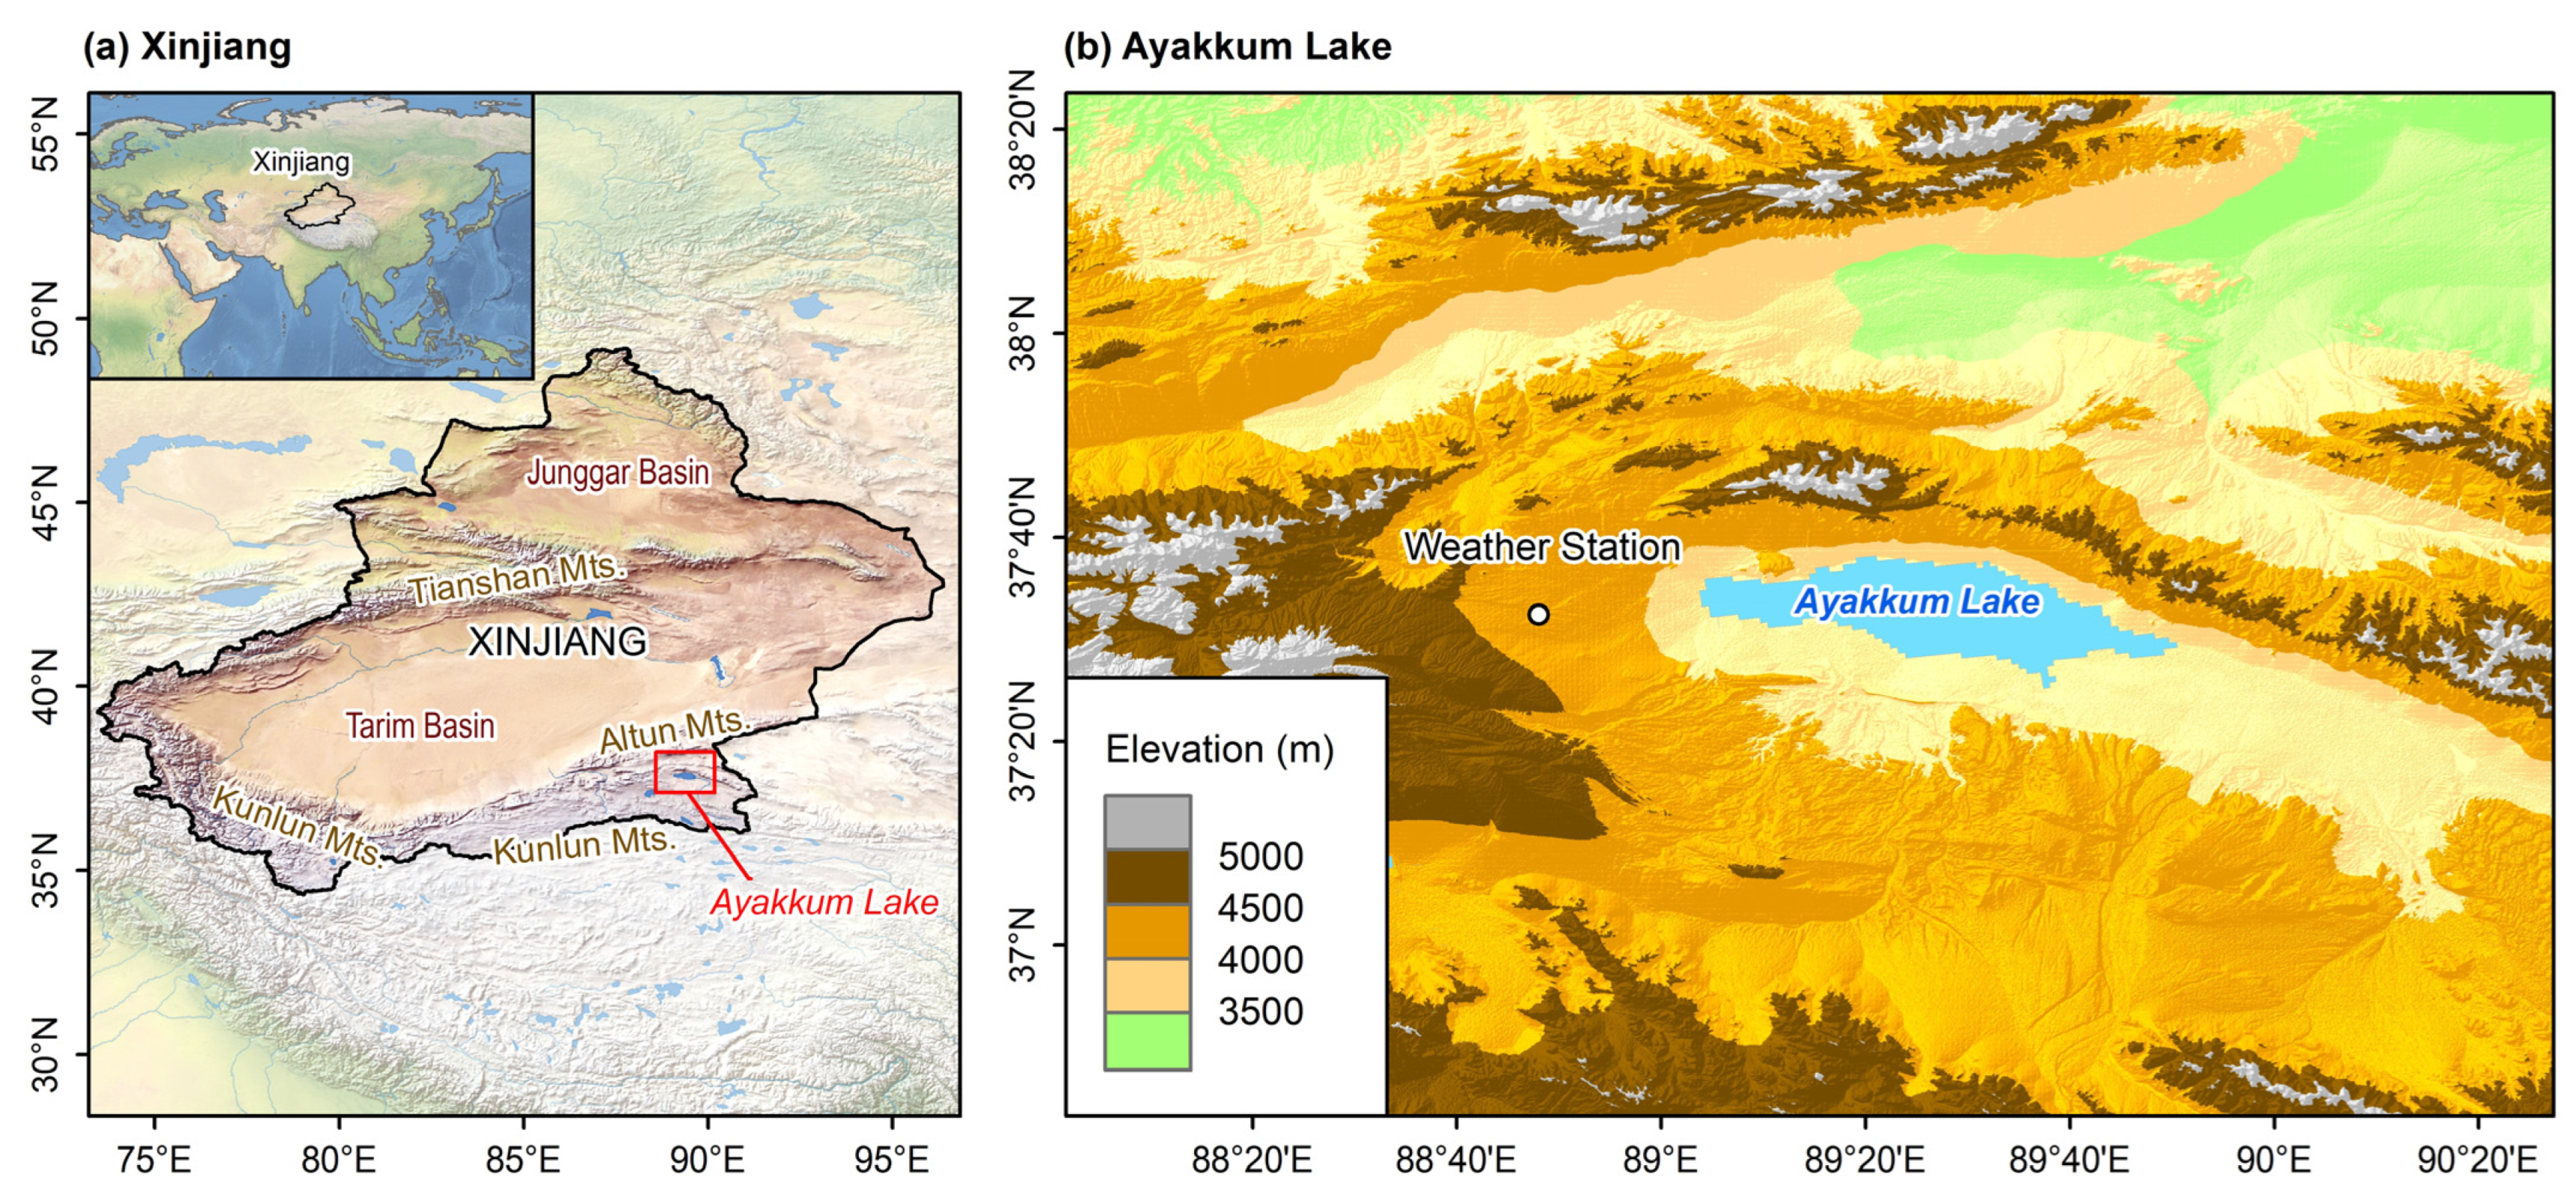
2.1. Study Area
2.2. Meteorological Observations
2.3. Gridded Climate Datasets
2.4. Methods
3. Results
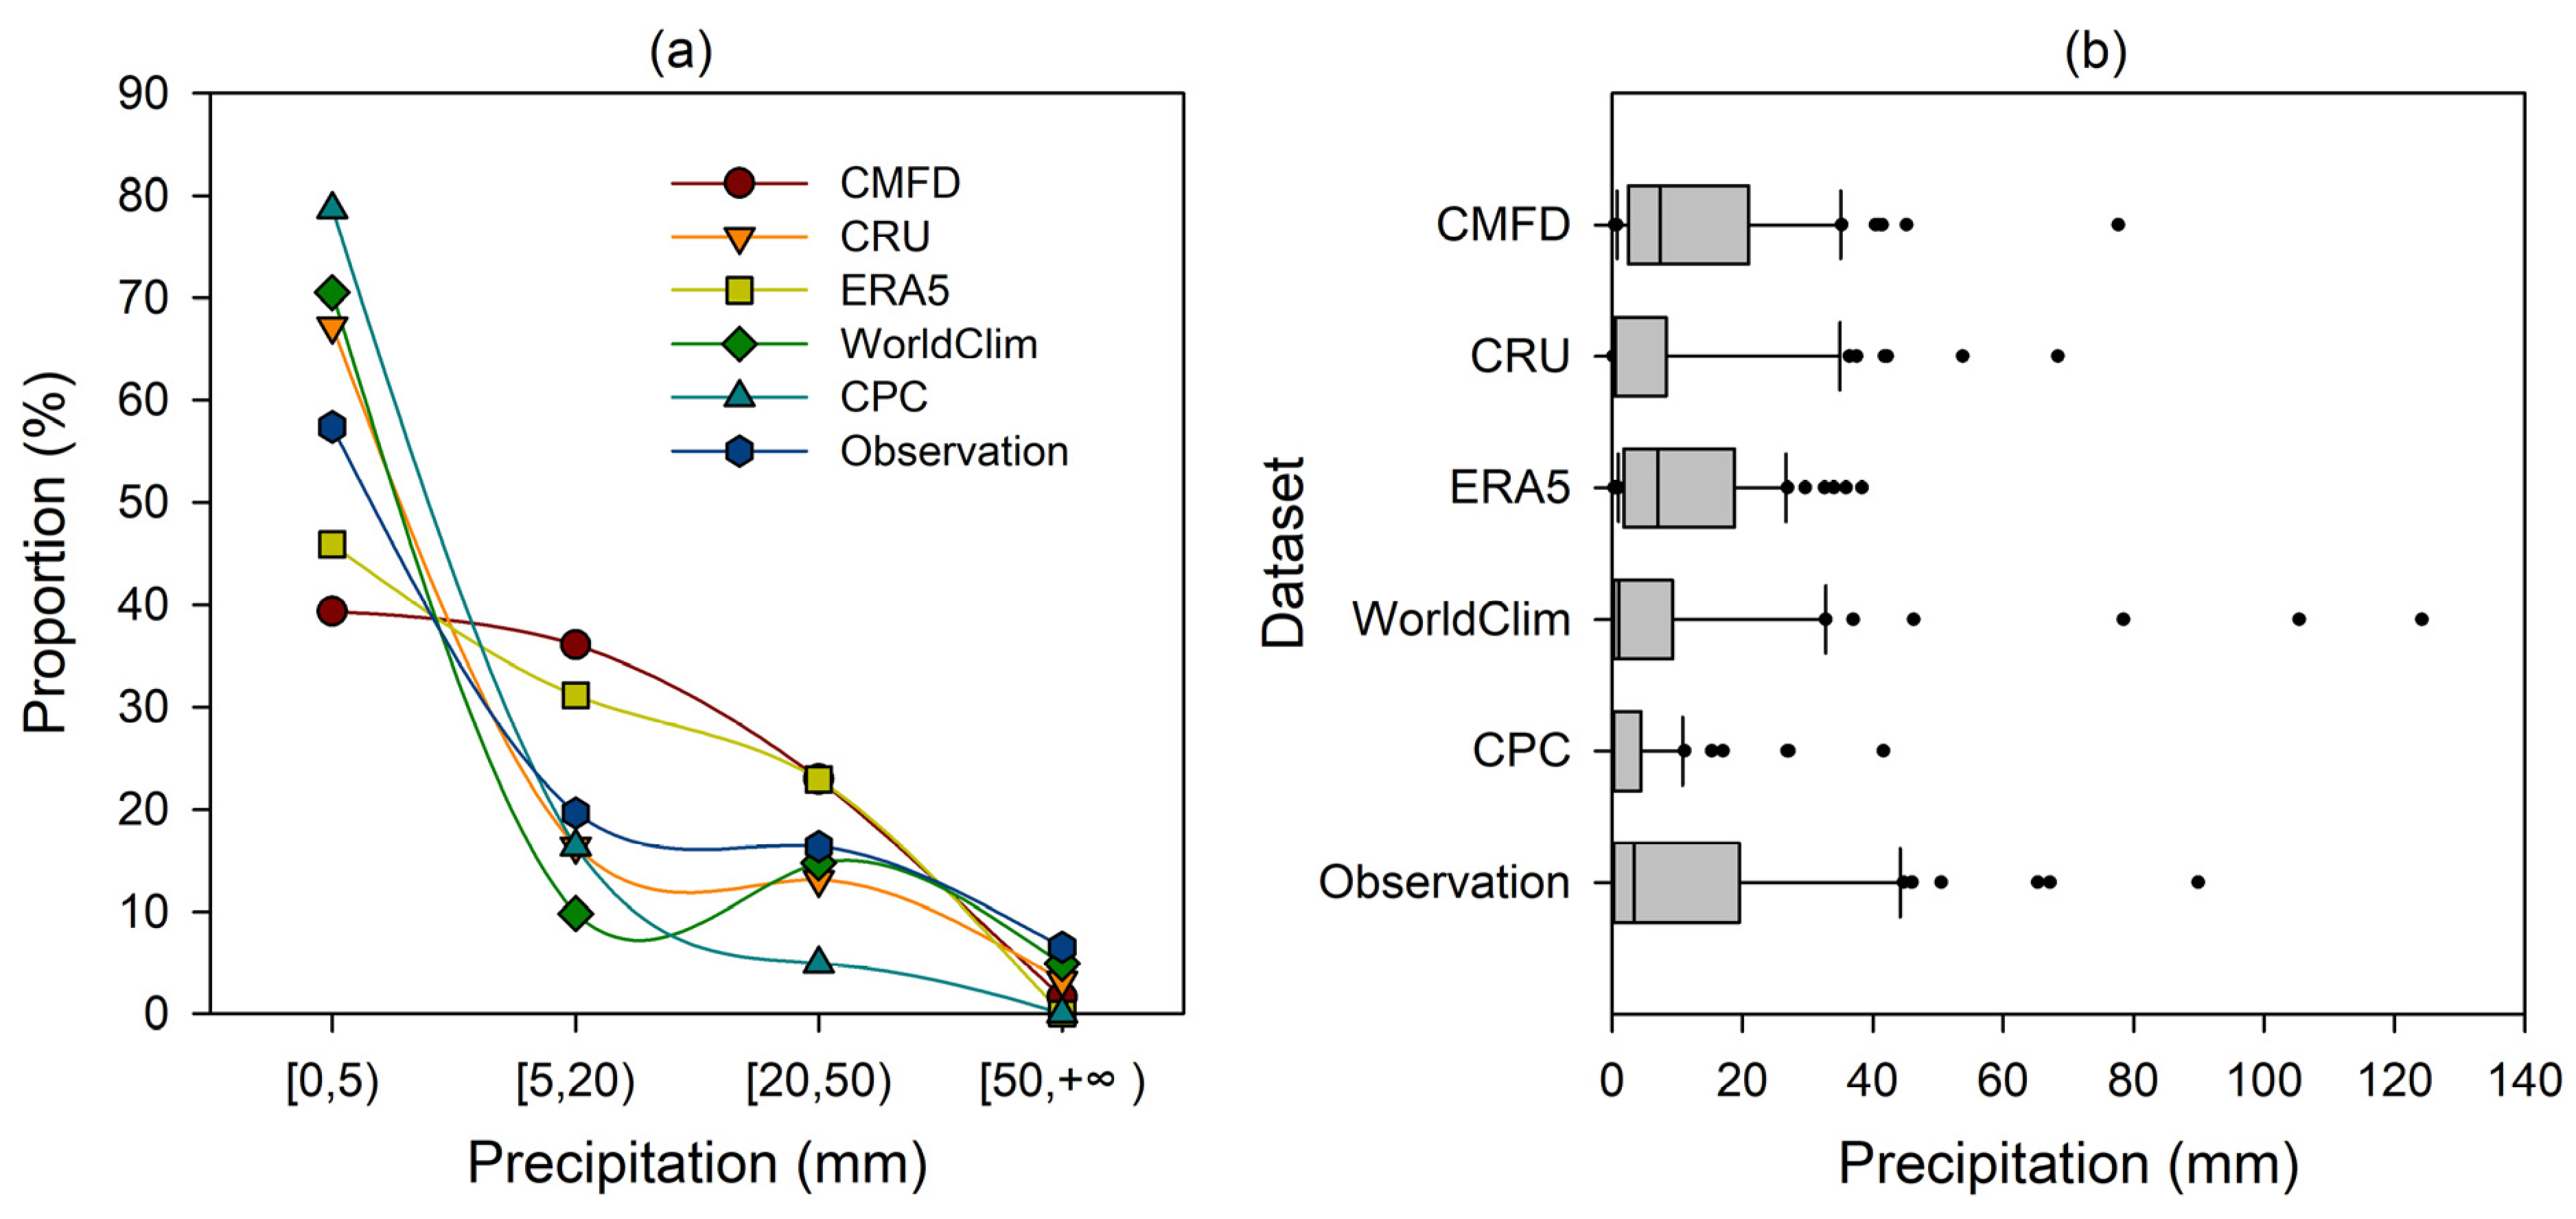
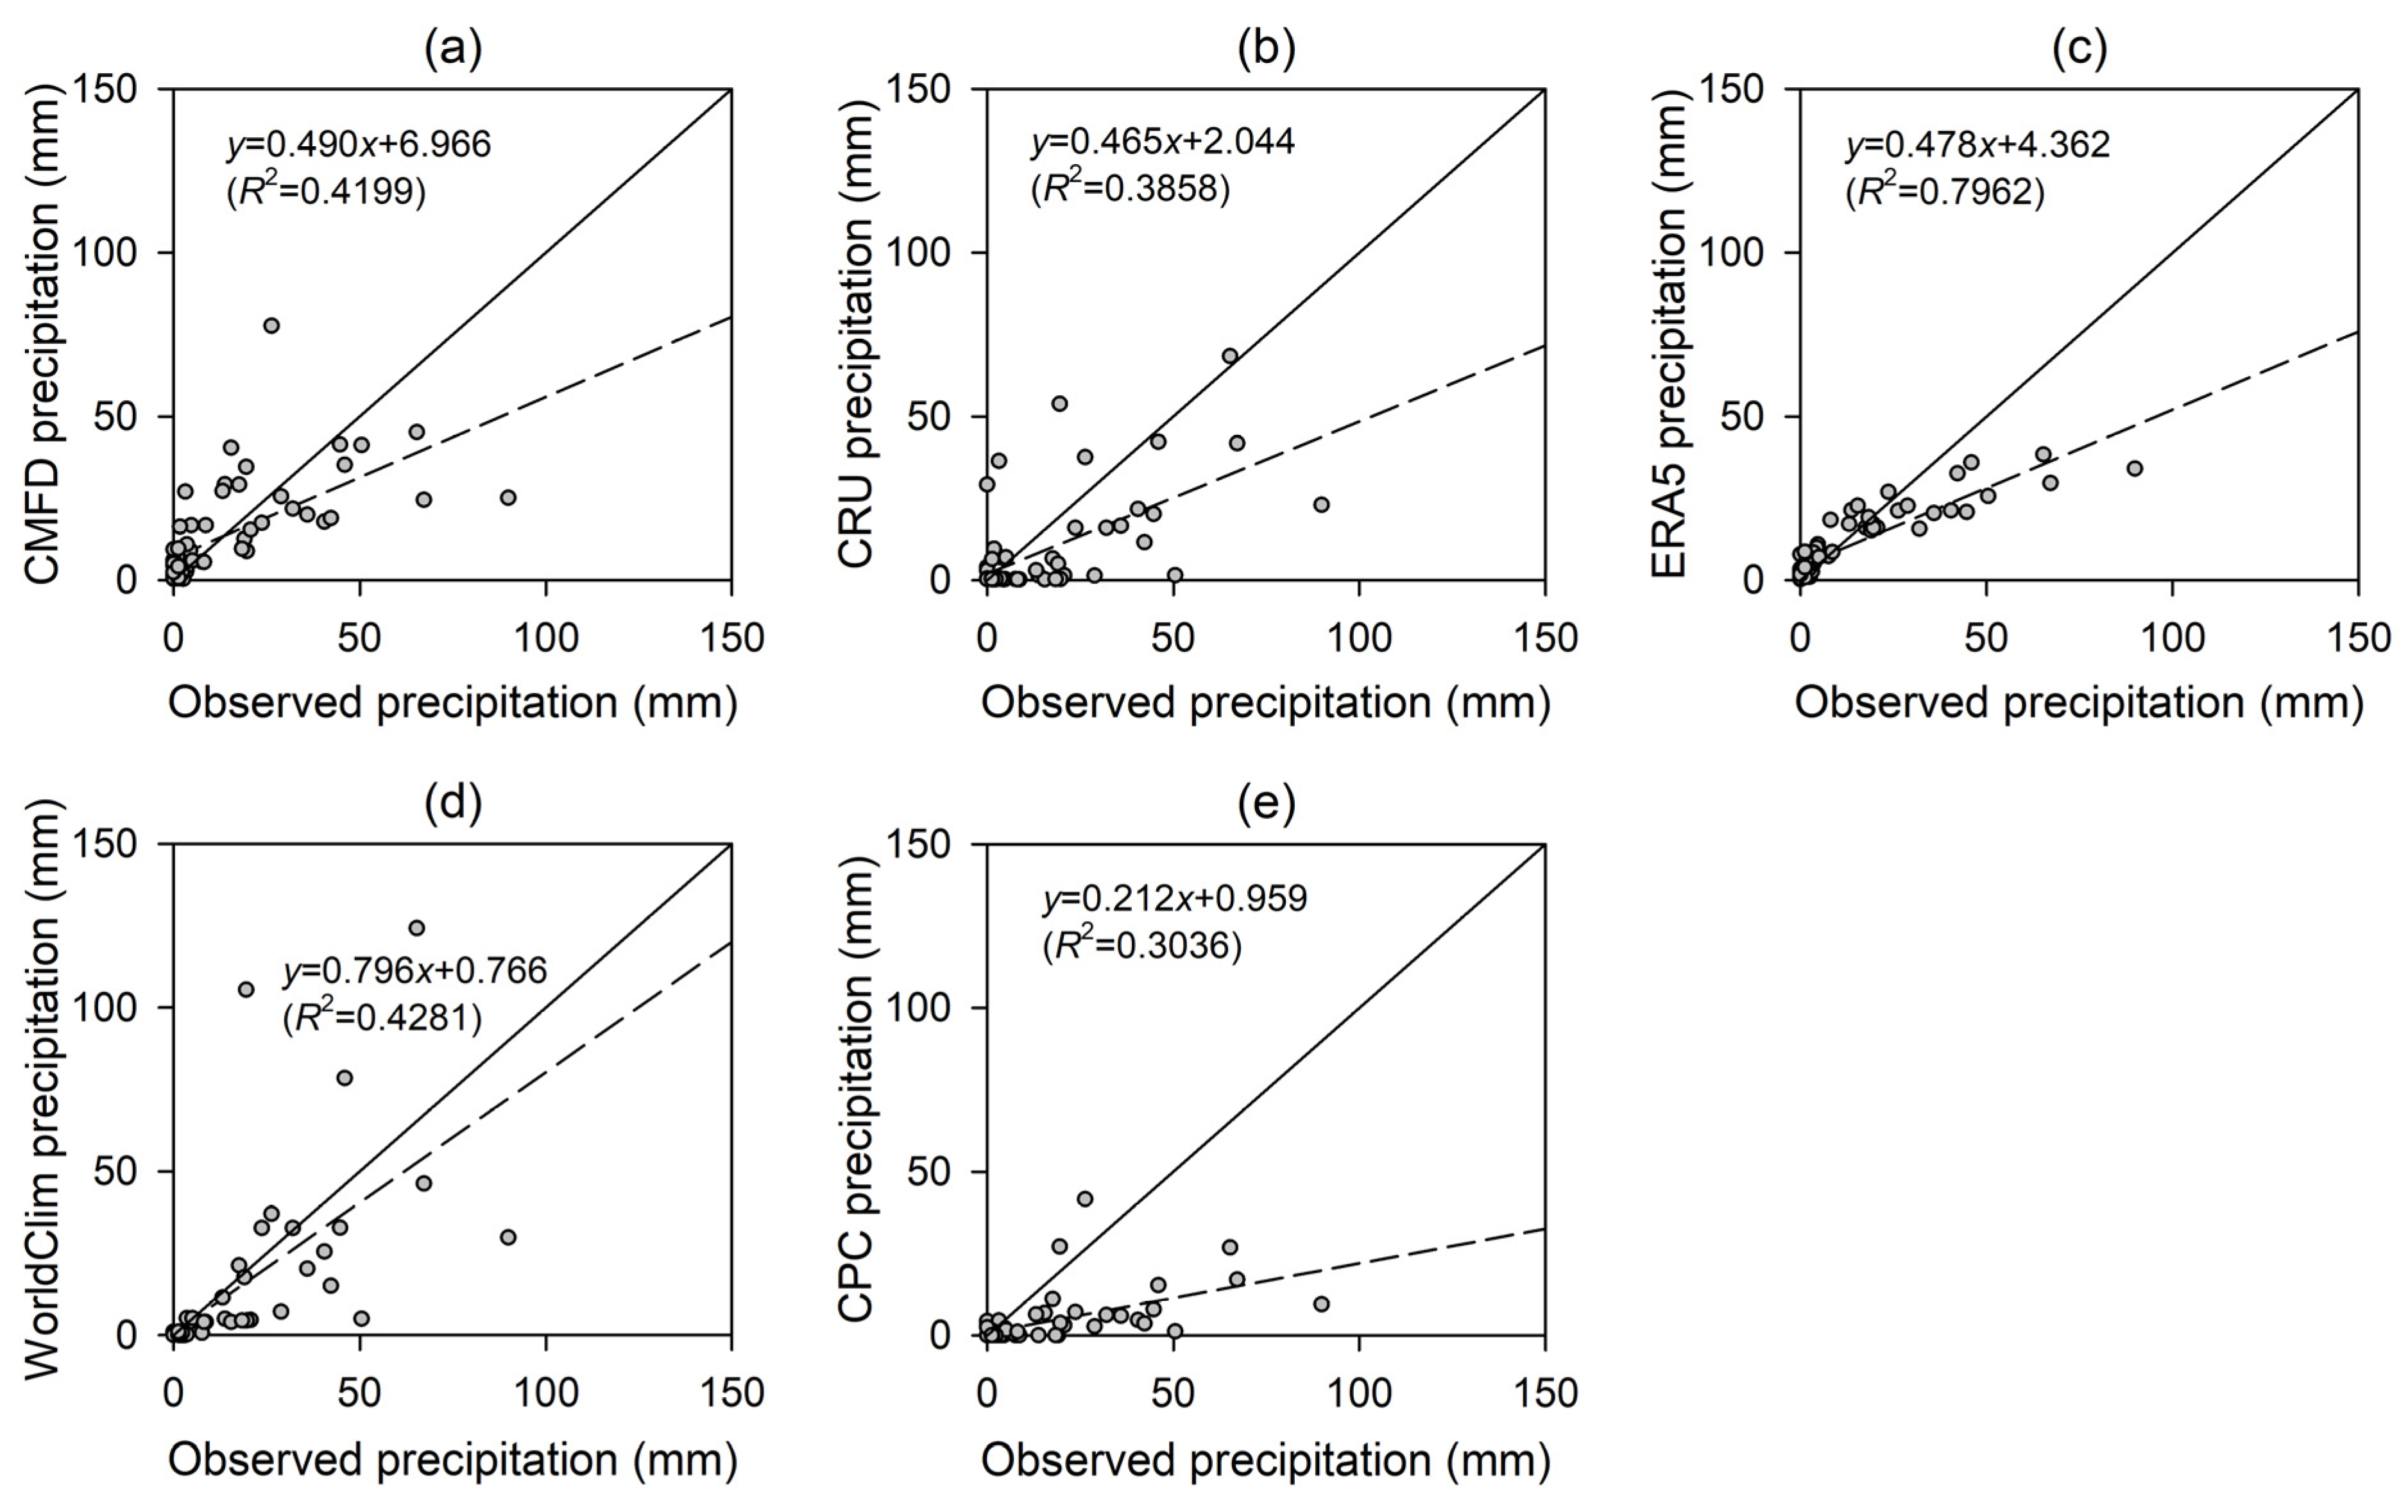
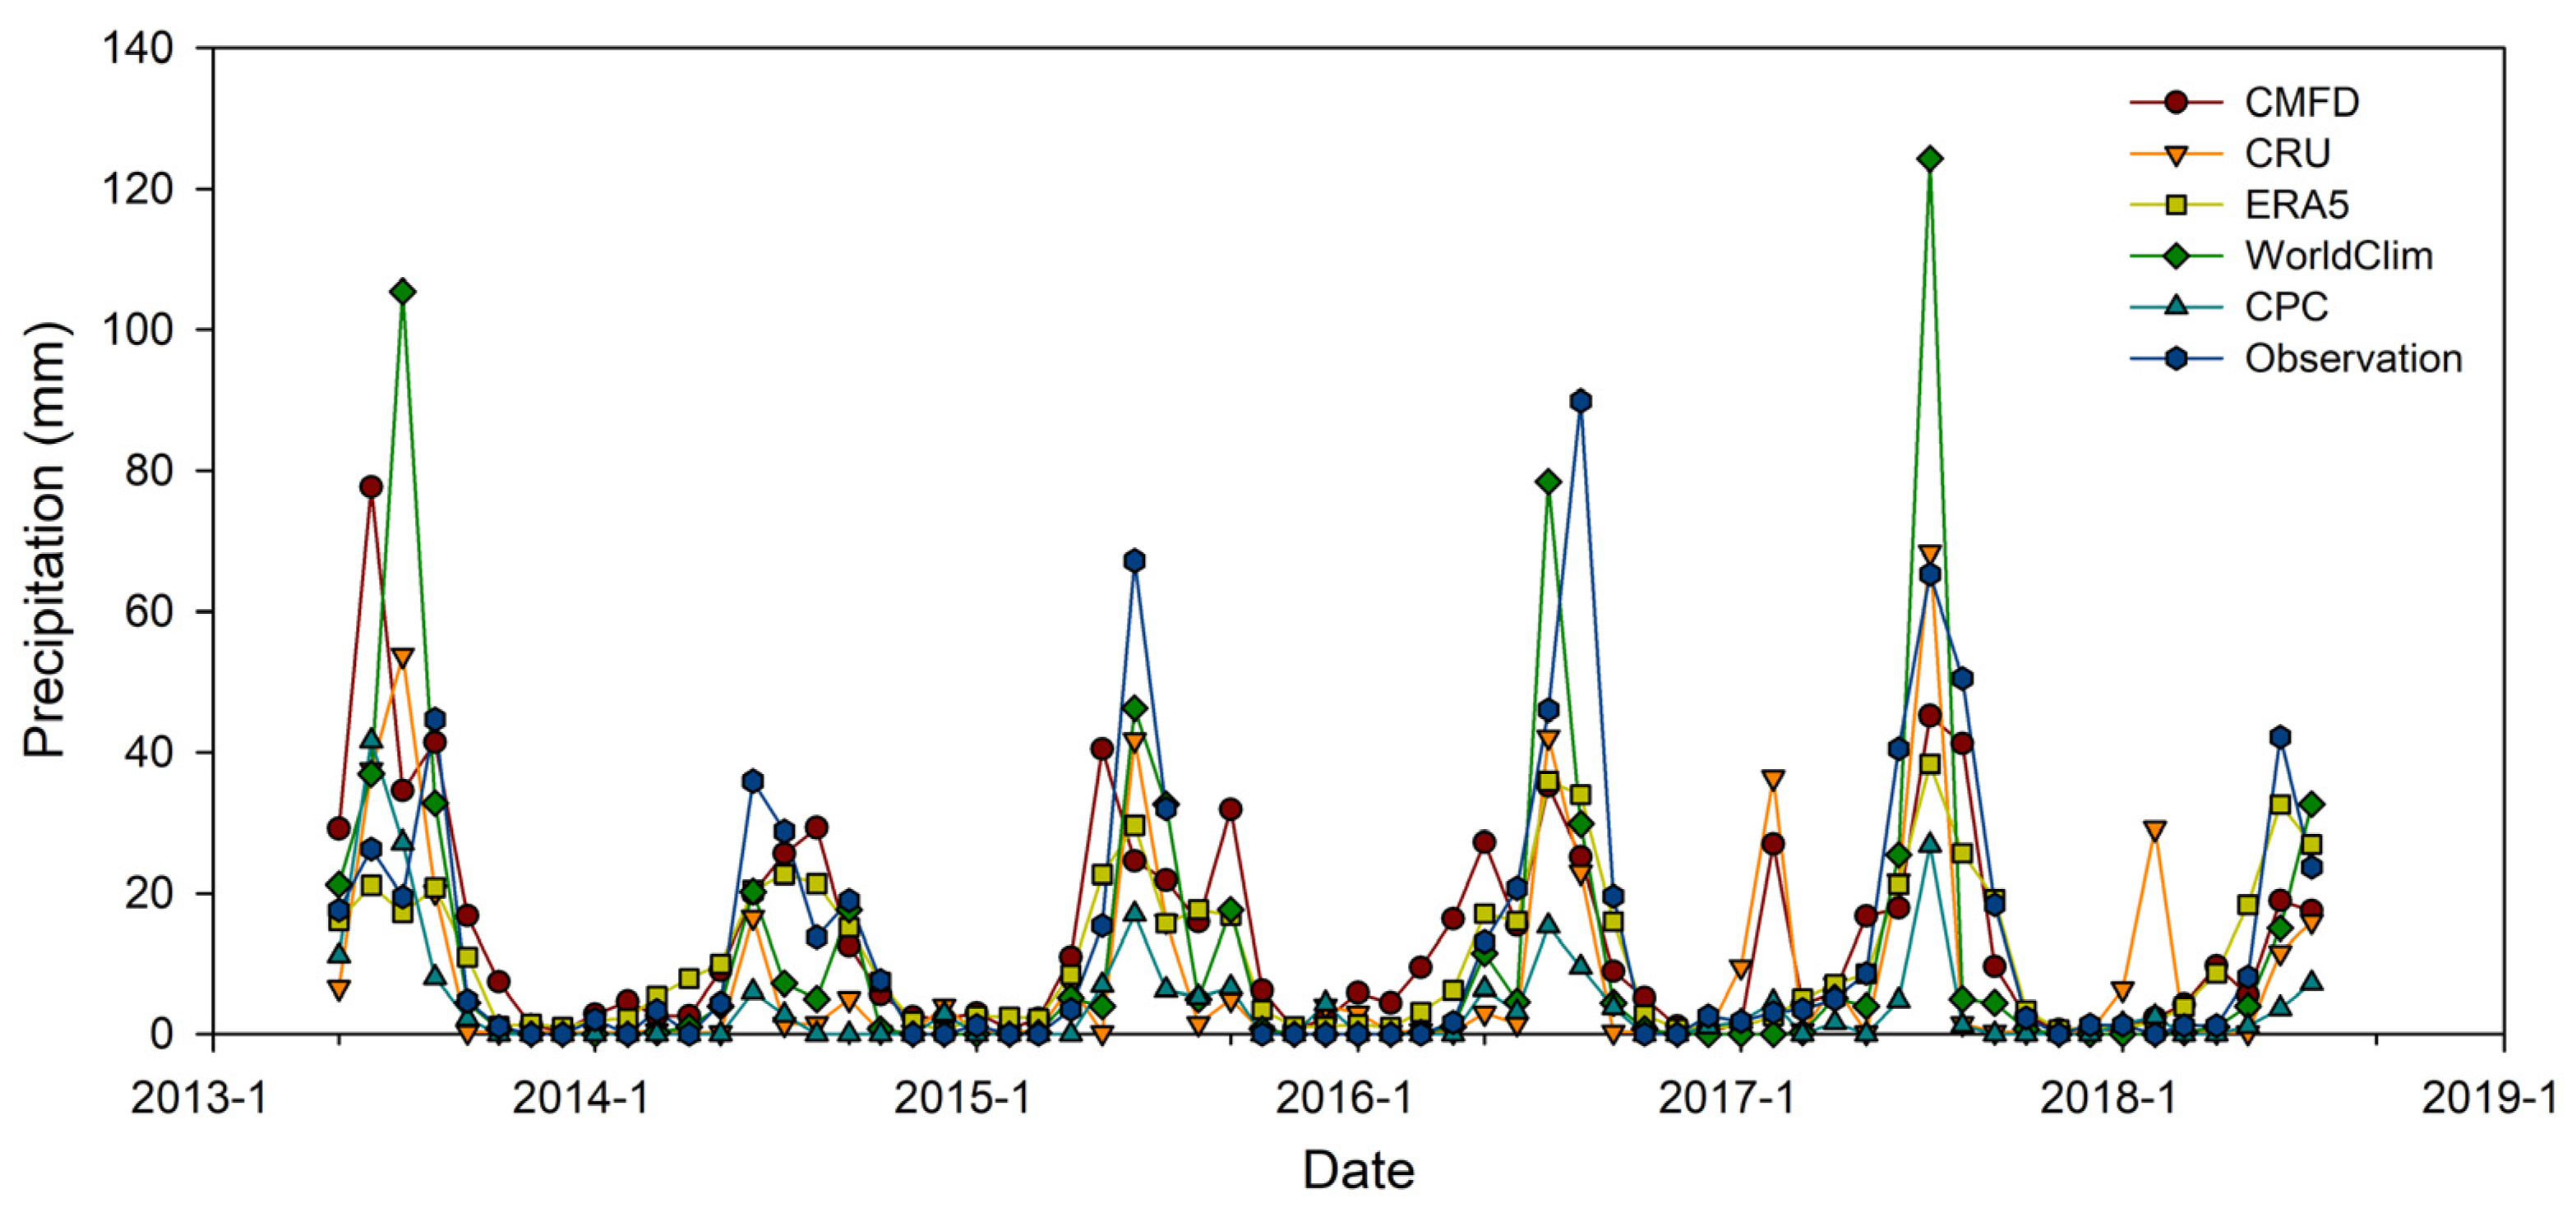
3.1. Comparison of Precipitation Products
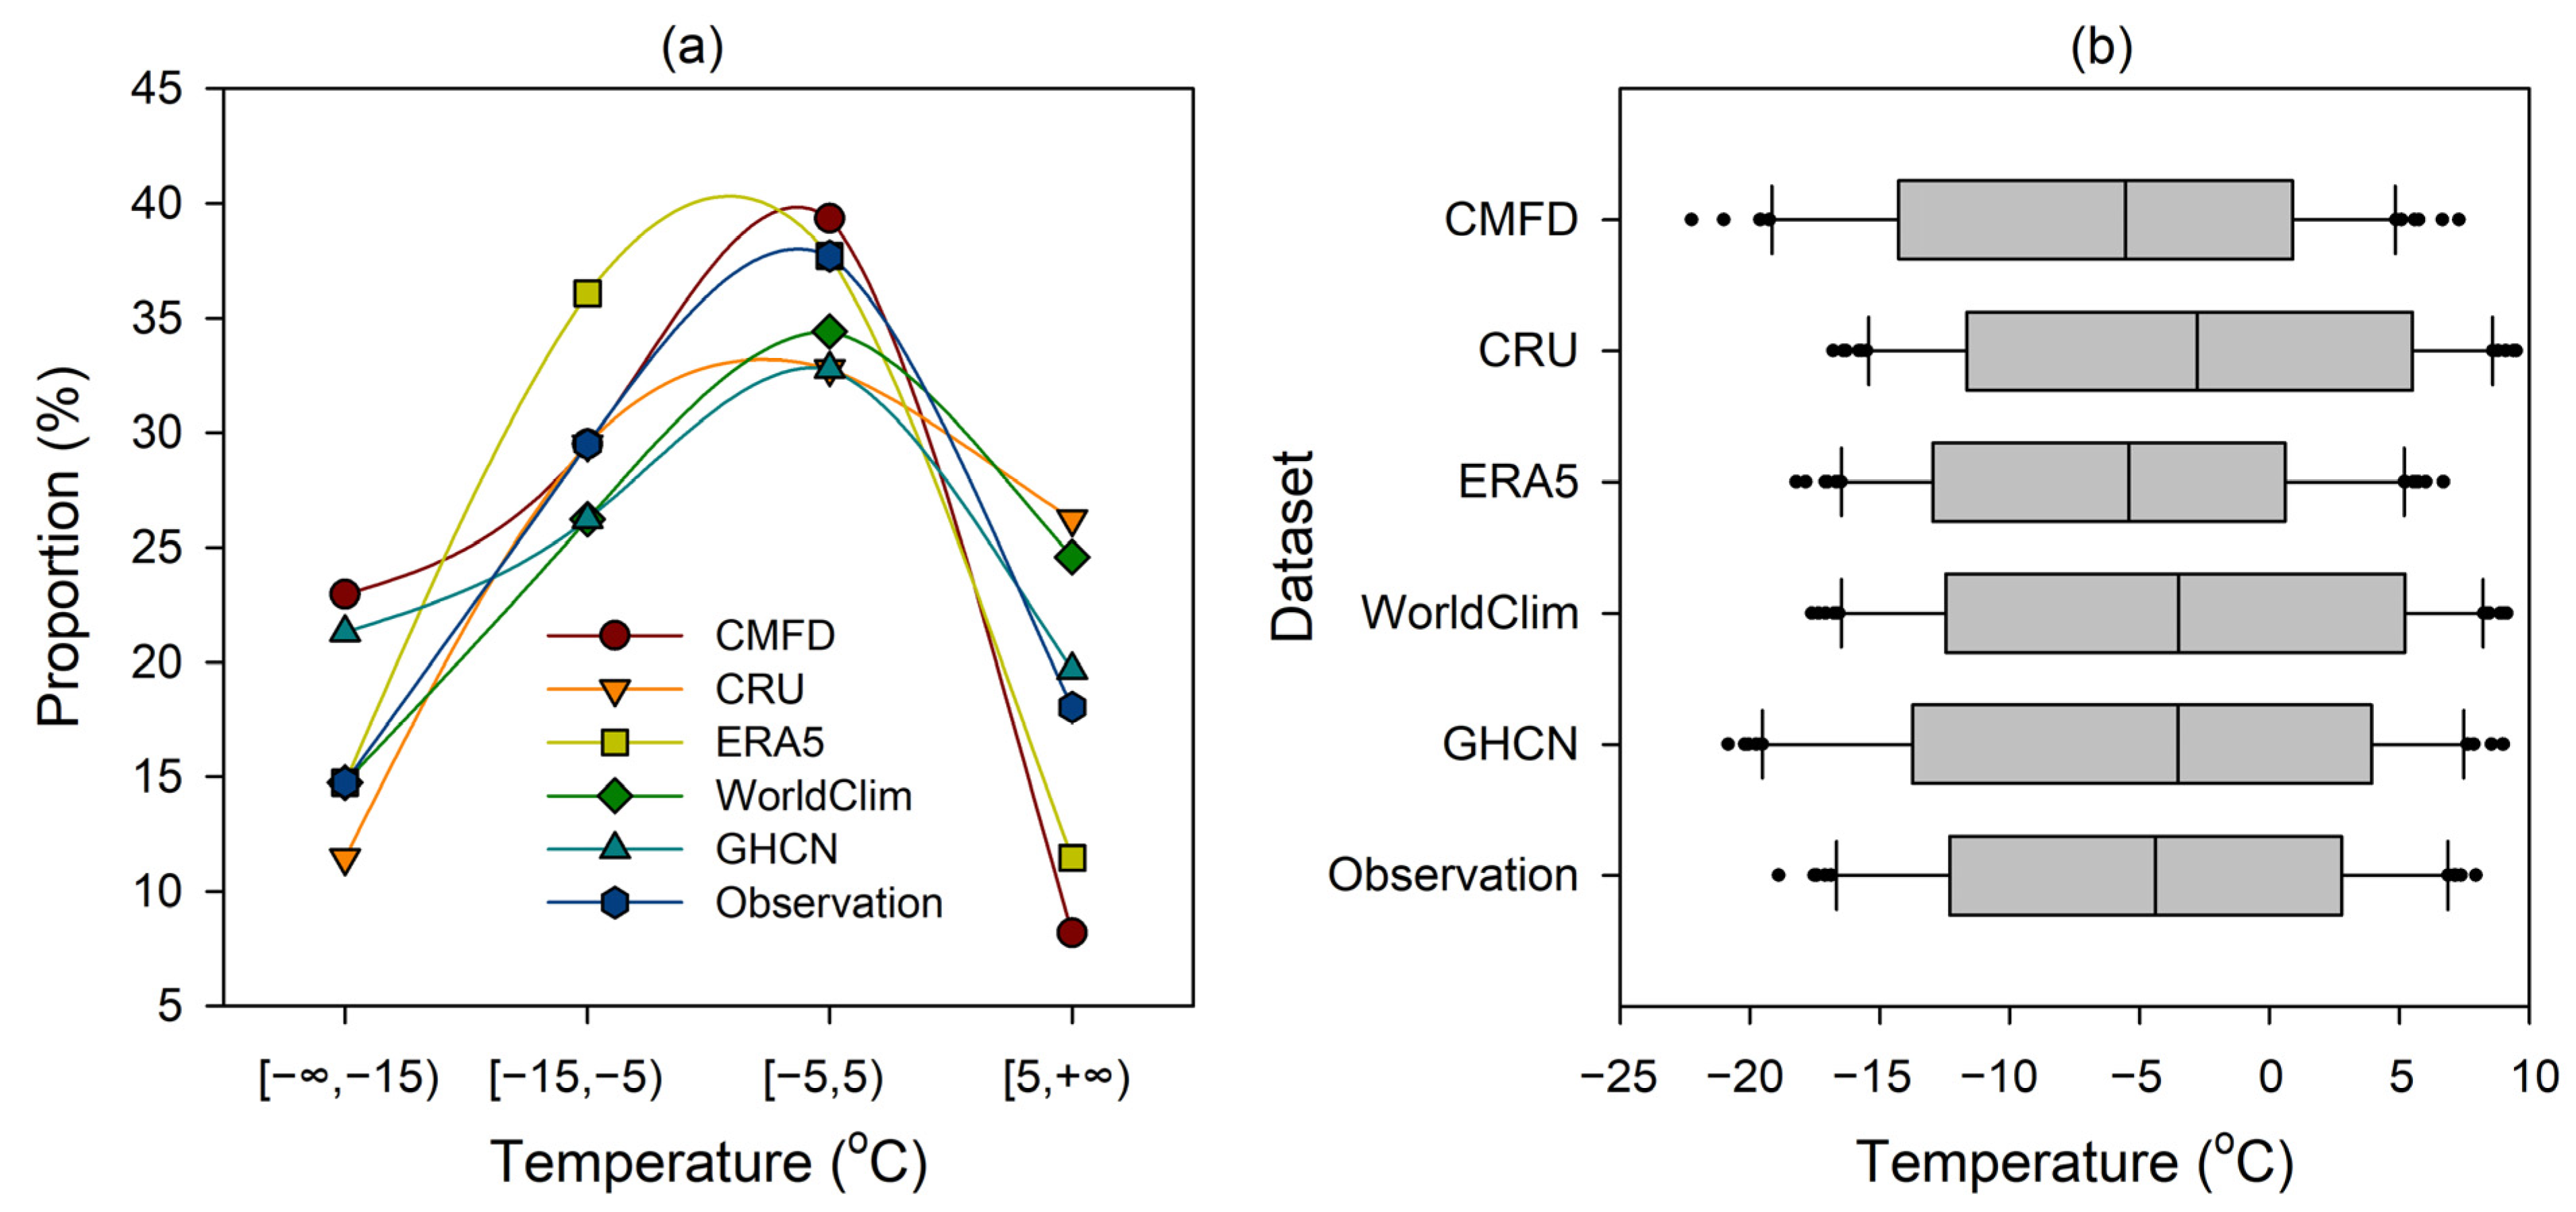
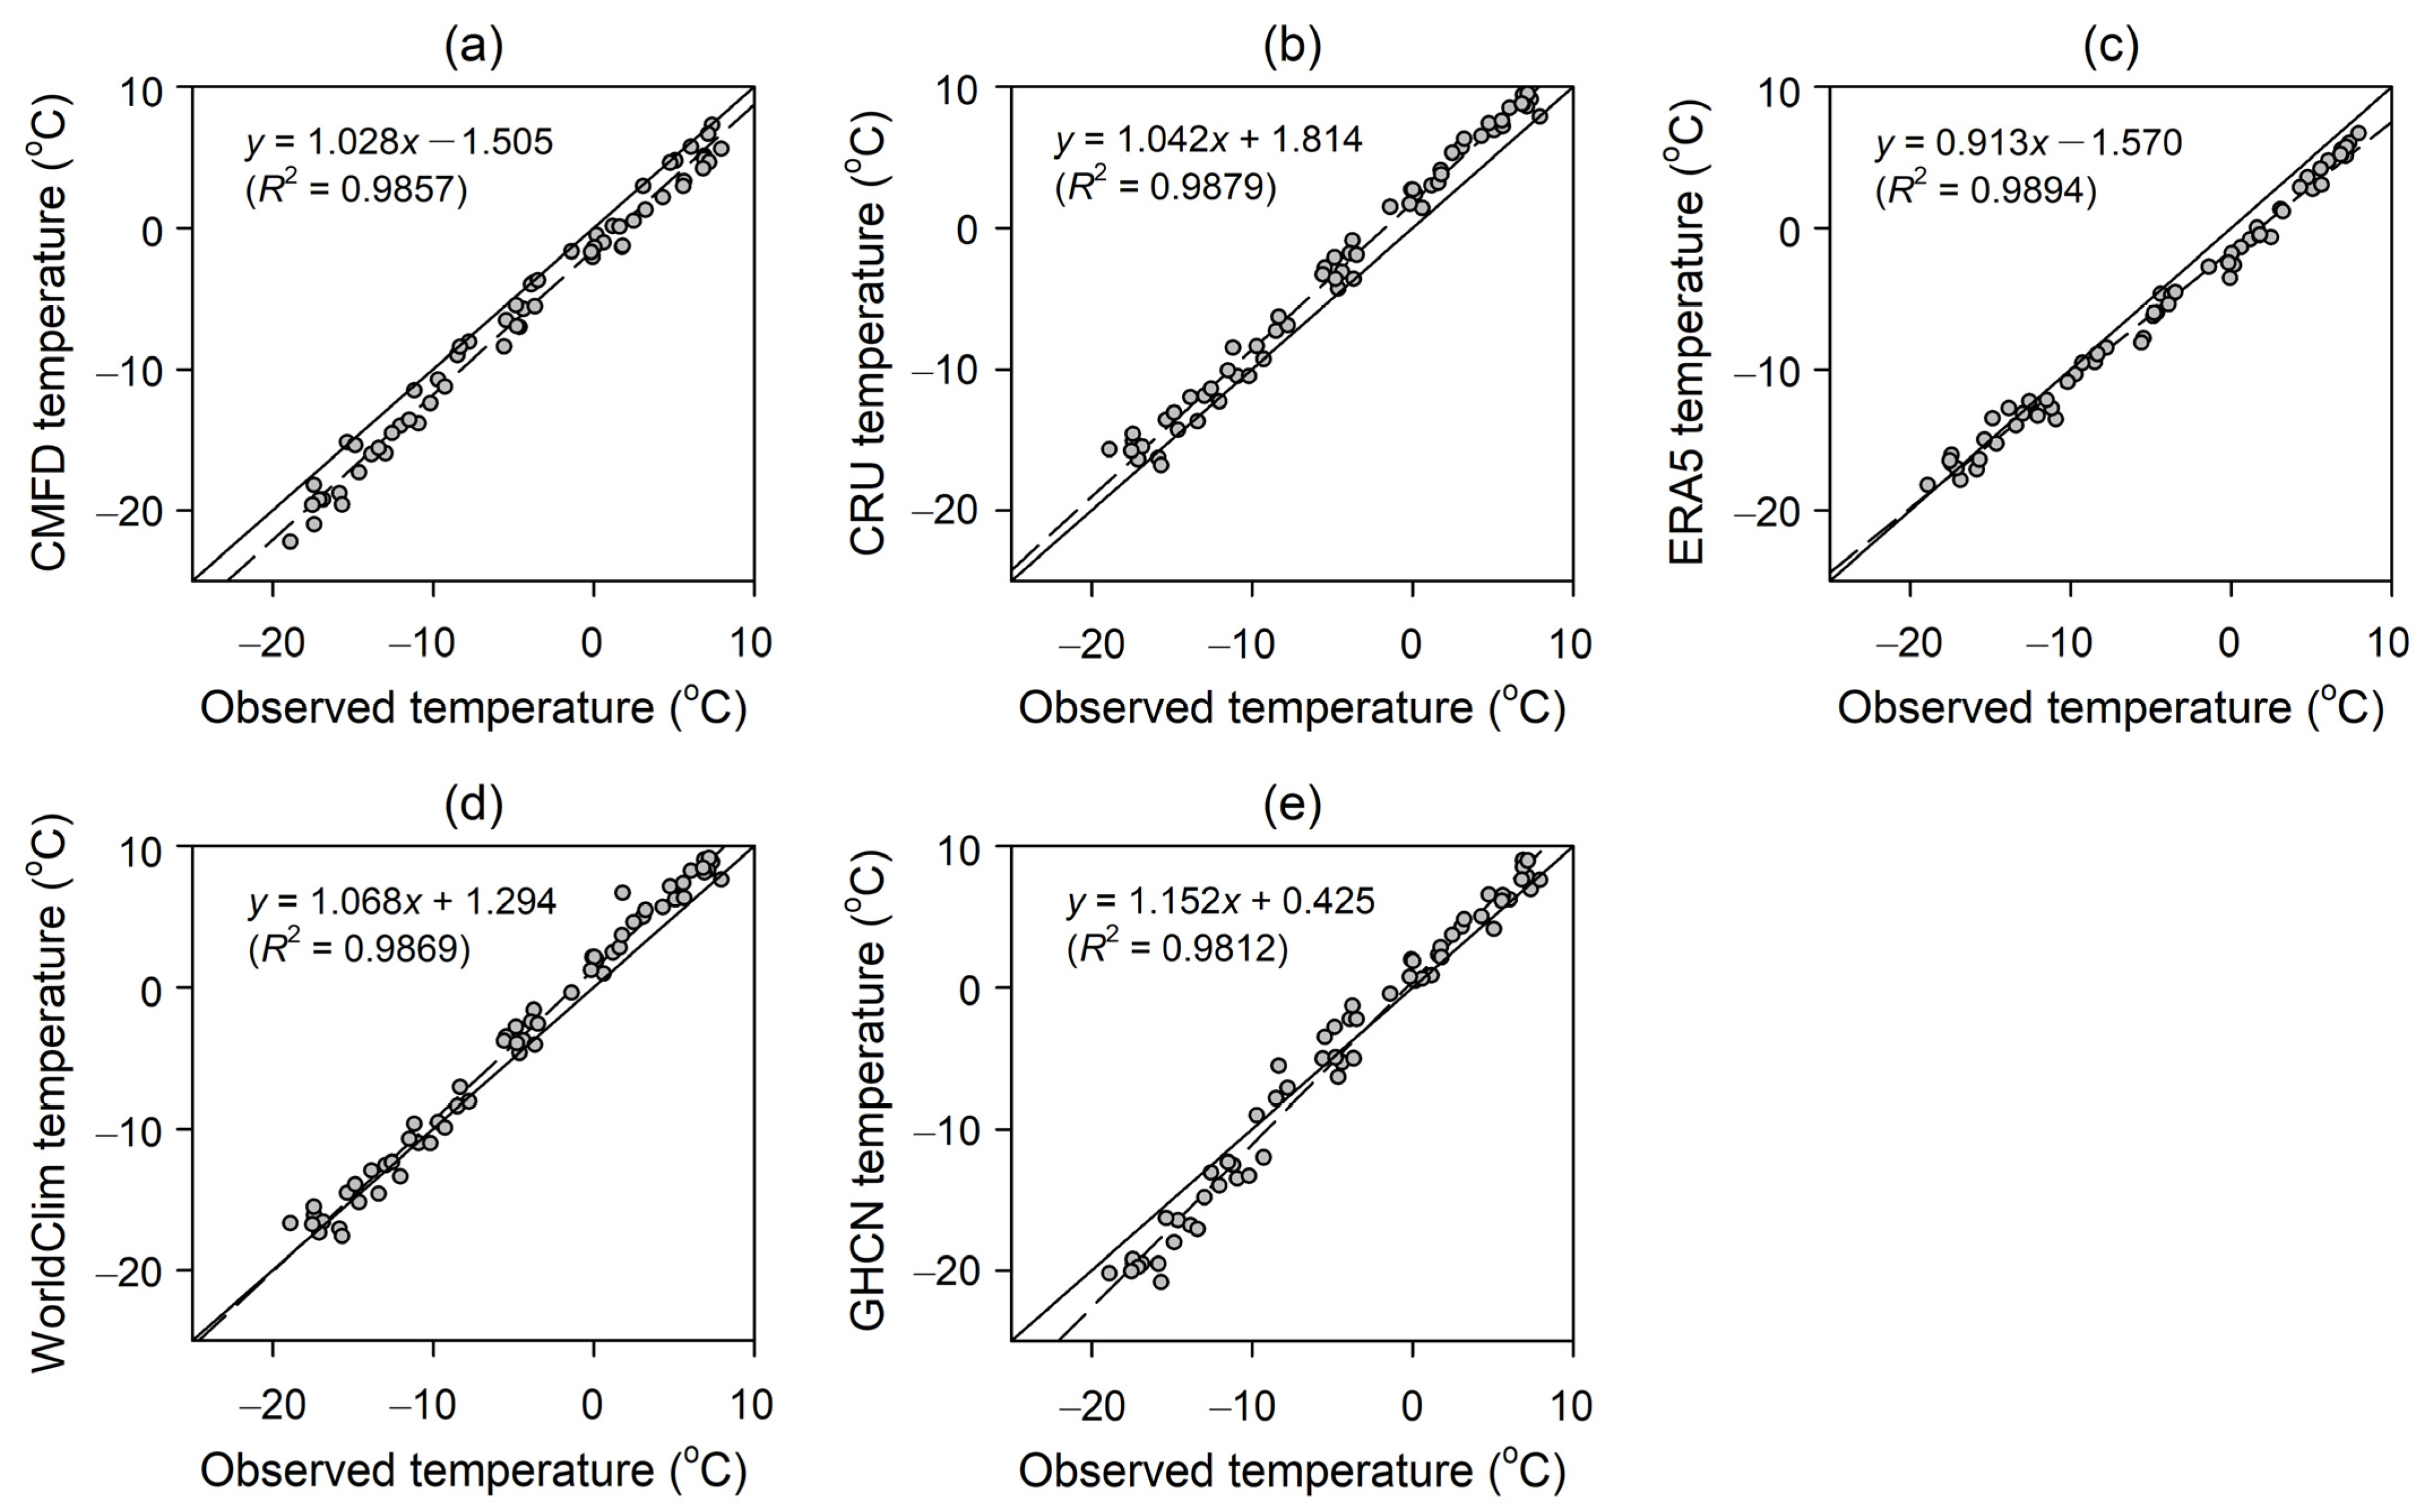
3.2. Comparison of Air Temperature Products
4. Discussions
4.1. Accuracy of Gridded Climate Products
4.2. Implications for Lake Water Budget Studies
5. Conclusions
Author Contributions
Funding
Data Availability Statement
Conflicts of Interest
References
- Yao, J.; Chen, Y.; Guan, X.; Zhao, Y.; Chen, J.; Mao, W. Recent climate and hydrological changes in a mountain–basin system in Xinjiang, China. Earth Sci. Rev. 2022, 226, 103957. [Google Scholar] [CrossRef]
- Shen, Y.-J.; Shen, Y.; Guo, Y.; Zhang, Y.; Pei, H.; Brenning, A. Review of historical and projected future climatic and hydrological changes in mountainous semiarid Xinjiang (northwestern China), central Asia. Catena 2020, 187, 104343. [Google Scholar] [CrossRef]
- Wang, Q.; Zhai, P.-M.; Qin, D.-H. New perspectives on ‘warming–wetting’ trend in Xinjiang, China. Adv. Clim. Change Res. 2020, 11, 252–260. [Google Scholar] [CrossRef]
- Yao, J.; Chen, Y.; Zhao, Y.; Guan, X.; Mao, W.; Yang, L. Climatic and associated atmospheric water cycle changes over the Xinjiang, China. J. Hydrol. 2020, 585, 124823. [Google Scholar] [CrossRef]
- Yao, S.; Jiang, D.; Zhang, Z. Lagrangian simulations of moisture sources for Chinese Xinjiang precipitation during 1979–2018. Int. J. Climatol. 2021, 41, E216–E232. [Google Scholar] [CrossRef]
- Gao, F.; Zhang, Y.; Chen, Q.; Wang, P.; Yang, H.; Yao, Y.; Cai, W. Comparison of two long-term and high-resolution satellite precipitation datasets in Xinjiang, China. Atmos. Res. 2018, 212, 150–157. [Google Scholar] [CrossRef]
- Li, F.; Li, Y.; Zhou, X.; Yin, Z.; Liu, T.; Xin, Q. Modeling and analyzing supply-demand relationships of water resources in Xinjiang from a perspective of ecosystem services. J. Arid Land 2022, 14, 115–138. [Google Scholar] [CrossRef]
- Zuo, Q.; Guo, J.; Ma, J.; Cui, G.; Yang, R.; Yu, L. Assessment of regional-scale water resources carrying capacity based on fuzzy multiple attribute decision-making and scenario simulation. Ecol. Indic. 2021, 130, 108034. [Google Scholar] [CrossRef]
- Luo, M.; Liu, T.; Meng, F.; Duan, Y.; Bao, A.; Xing, W.; Feng, X.; De Maeyer, P.; Frankl, A. Identifying climate change impacts on water resources in Xinjiang, China. Sci. Total Environ. 2019, 676, 613–626. [Google Scholar] [CrossRef]
- Zhang, M.; Chen, Y.; Shen, Y.; Li, B. Tracking climate change in Central Asia through temperature and precipitation extremes. J. Geogr. Sci. 2019, 29, 3–28. [Google Scholar] [CrossRef] [Green Version]
- He, B.; Chang, J.; Wang, Y.; Wang, Y.; Zhou, S.; Chen, C. Spatio-temporal evolution and non-stationary characteristics of meteorological drought in inland arid areas. Ecol. Indic. 2021, 126, 107644. [Google Scholar] [CrossRef]
- Yao, J.; Zhao, Y.; Chen, Y.; Yu, X.; Zhang, R. Multi-scale assessments of droughts: A case study in Xinjiang, China. Sci. Total Environ. 2018, 630, 444–452. [Google Scholar] [CrossRef]
- Lu, X.; Tang, G.; Wei, M.; Yang, L.; Zhang, Y. Evaluation of multi-satellite precipitation products in Xinjiang, China. Int. J. Remote Sens. 2018, 39, 7437–7462. [Google Scholar] [CrossRef]
- Zhu, X.; Zhang, M.; Wang, S.; Qiang, F.; Zeng, T.; Ren, Z.; Dong, L. Comparison of monthly precipitation derived from high-resolution gridded datasets in arid Xinjiang, central Asia. Quatern. Int. 2015, 358, 160–170. [Google Scholar] [CrossRef]
- Hu, Z.; Hu, Q.; Zhang, C.; Chen, X.; Li, Q. Evaluation of reanalysis, spatially interpolated and satellite remotely sensed precipitation data sets in central Asia. J. Geophys. Res. Atmos. 2016, 121, 5648–5663. [Google Scholar] [CrossRef]
- Yao, J.; Chen, Y.; Yu, X.; Zhao, Y.; Guan, X.; Yang, L. Evaluation of multiple gridded precipitation datasets for the arid region of northwestern China. Atmos. Res. 2020, 236, 104818. [Google Scholar] [CrossRef]
- Wang, S.; Zhang, M.; Sun, M.; Wang, B.; Huang, X.; Wang, Q.; Feng, F. Comparison of surface air temperature derived from NCEP/DOE R2, ERA-Interim, and observations in the arid northwestern China: A consideration of altitude errors. Theor. Appl. Climatol. 2015, 119, 99–111. [Google Scholar] [CrossRef]
- Tan, C.; Guo, B.; Kuang, H.; Yang, H.; Ma, M. Lake area changes and their influence on factors in arid and semi-arid regions along the silk road. Remote Sens. 2018, 10, 595. [Google Scholar] [CrossRef]
- Zhao, W.; Xiong, D.; Wen, F.; Wang, X. Lake area monitoring based on land surface temperature in the Tibetan Plateau from 2000 to 2018. Environ. Res. Lett. 2020, 15, 084033. [Google Scholar] [CrossRef]
- Liu, H.; Chen, Y.; Ye, Z.; Li, Y.; Zhang, Q. Recent lake area changes in Central Asia. Sci. Rep. 2019, 9, 16277. [Google Scholar] [CrossRef] [Green Version]
- Chen, J.; Wang, Y.; Zheng, J.; Cao, L. The changes in the water volume of Ayakekumu Lake based on satellite remote sensing data. J. Nat. Resour. 2019, 34, 1345–1356. [Google Scholar] [CrossRef]
- Zhang, G.; Li, J.; Zheng, G. Lake-area mapping in the Tibetan Plateau: An evaluation of data and methods. Int. J. Remote Sens. 2017, 38, 742–772. [Google Scholar] [CrossRef]
- Abudousaimaiti, A.; Li, Z. Preliminary analysis of the summer and w inter meteorological conditions in Altun Mountain National Nature Reserve. J. Glaciol. Geocryol. 2014, 36, 1465–1470. [Google Scholar]
- Dong, S.; Zhang, X.; Liu, S.; Shi, J.; Li, X. Ecological Monitoring and Integrated Management of Aerjin Mountain National Nature Reserve; China Environmental Press: Beijing, China, 2015; pp. 1–308. [Google Scholar]
- Zhao, L.; Zou, D.; Hu, G.; Wu, T.; Du, E.; Liu, G.; Xiao, Y.; Li, R.; Pang, Q.; Qiao, Y.; et al. A synthesis dataset of permafrost thermal state for the Qinghai-Tibet (Xizang) Plateau, China. Earth Syst. Sci. Data. 2021, 13, 4207–4218. [Google Scholar] [CrossRef]
- Wang, S. Book of Rivers and Lakes in Xinjiang, China; China Water and Power Press: Beijing, China, 2010; pp. 1–416. [Google Scholar]
- Zheng, X.; Zhang, M.; Xu, C.; Li, B. China Salt Lake Log; Science Press: Beijing, China, 2002; pp. 1–415. [Google Scholar]
- He, J.; Yang, K.; Tang, W.; Lu, H.; Qin, J.; Chen, Y.; Li, X. The first high-resolution meteorological forcing dataset for land process studies over China. Sci. Data 2020, 7, 25. [Google Scholar] [CrossRef]
- Yang, K.; He, J. China Meteorological Forcing Dataset (1979–2018); National Tibetan Plateau Data Center: Beijing, China, 2021. [Google Scholar] [CrossRef]
- Harris, I.; Osborn, T.J.; Jones, P.; Lister, D. Version 4 of the CRU TS monthly high-resolution gridded multivariate climate dataset. Sci. Data 2020, 7, 109. [Google Scholar] [CrossRef]
- Hersbach, H.; Bell, B.; Berrisford, P.; Hirahara, S.; Horányi, A.; Muñoz-Sabater, J.; Nicolas, J.; Peubey, C.; Radu, R.; Schepers, D.; et al. The ERA5 global reanalysis. Quart. J. Royal Meteorol. Soc. 2020, 146, 1999–2049. [Google Scholar] [CrossRef]
- Fick, S.E.; Hijmans, R.J. WorldClim 2: New 1-km spatial resolution climate surfaces for global land areas. Int. J. Climatol. 2017, 37, 4302–4315. [Google Scholar] [CrossRef]
- Chen, M.; Shi, W.; Xie, P.; Silva, V.B.; Kousky, V.E.; Wayne Higgins, R.; Janowiak, J.E. Assessing objective techniques for gauge-based analyses of global daily precipitation. J. Geophys. Res. Atmos. 2008, 113, D04110. [Google Scholar] [CrossRef]
- Fan, Y.; van den Dool, H. A global monthly land surface air temperature analysis for 1948–present. J. Geophys. Res. Atmos. 2008, 113, D01103. [Google Scholar] [CrossRef]
- Hu, Z.; Chen, X.; Zhou, Q.; Chen, D.; Li, J. DISO: A rethink of Taylor diagram. Int. J. Climatol. 2019, 39, 2825–2832. [Google Scholar] [CrossRef]
- Zhou, Q.; Chen, D.; Hu, Z.; Chen, X. Decompositions of Taylor diagram and DISO performance criteria. Int. J. Climatol. 2021, 41, 5726–5732. [Google Scholar] [CrossRef]
- Yin, W.; Yang, S.; Hu, L.; Tian, S.; Wang, X.; Zhao, R.; Li, P. Improving understanding of spatiotemporal water storage changes over China based on multiple datasets. J. Hydrol. 2022, 612, 128098. [Google Scholar] [CrossRef]
- Longo-Minnolo, G.; Vanella, D.; Consoli, S.; Pappalardo, S.; Ramírez-Cuesta, J.M. Assessing the use of ERA5-Land reanalysis and spatial interpolation methods for retrieving precipitation estimates at basin scale. Atmos. Res. 2022, 271, 106131. [Google Scholar] [CrossRef]
- Xu, J.; Ma, Z.; Yan, S.; Peng, J. Do ERA5 and ERA5-land precipitation estimates outperform satellite-based precipitation products? A comprehensive comparison between state-of-the-art model-based and satellite-based precipitation products over mainland China. J. Hydrol. 2022, 605, 127353. [Google Scholar] [CrossRef]
- Jiang, Q.; Li, W.; Fan, Z.; He, X.; Sun, W.; Chen, S.; Wen, J.; Gao, J.; Wang, J. Evaluation of the ERA5 reanalysis precipitation dataset over Chinese Mainland. J. Hydrol. 2021, 595, 125660. [Google Scholar] [CrossRef]
- Zhang, Y.; An, C.; Liu, L.; Zhang, Y.; Lu, C.; Zhang, W. High mountains becoming wetter while deserts getting drier in Xinjiang, China since the 1980s. Land 2021, 10, 1131. [Google Scholar] [CrossRef]
- Wei, L.; Jiang, S.; Ren, L.; Wang, M.; Zhang, L.; Liu, Y.; Yuan, F.; Yang, X. Evaluation of seventeen satellite-, reanalysis-, and gauge-based precipitation products for drought monitoring across mainland China. Atmos. Res. 2021, 263, 105813. [Google Scholar] [CrossRef]
- Li, Y.; Qin, X.; Liu, Y.; Jin, Z.; Liu, J.; Wang, L.; Chen, J. Evaluation of long-term and high-resolution gridded precipitation and temperature products in the Qilian Mountains, Qinghai–Tibet Plateau. Front. Environ. Sci. 2022, 10, 906821. [Google Scholar] [CrossRef]
- Yang, J.; Huang, M.; Zhai, P. Performance of the CRA-40/Land, CMFD, and ERA-Interim datasets in reflecting changes in surface air temperature over the Tibetan Plateau. J. Meteorol. Res. 2021, 35, 663–672. [Google Scholar] [CrossRef]
- He, Q.; Yang, J.; Chen, H.; Liu, J.; Ji, Q.; Wang, Y.; Tang, F. Evaluation of extreme precipitation based on three long-term gridded products over the Qinghai-Tibet Plateau. Remote Sens. 2021, 13, 3010. [Google Scholar] [CrossRef]
- Ma, Q.; Zhang, J.; Game, A.T.; Chang, Y.; Li, S. Spatiotemporal variability of summer precipitation and precipitation extremes and associated large-scale mechanisms in Central Asia during 1979–2018. J. Hydrol. X 2020, 8, 100061. [Google Scholar] [CrossRef]
- Zou, S.; Duan, W.-L.; Christidis, N.; Nover, D.; Abuduwaili, J.; de Maeyer, P.; van de Voorde, T. An extreme rainfall event in summer 2018 of Hami city in eastern Xinjiang, China. Adv. Clim. Change Res. 2021, 12, 795–803. [Google Scholar] [CrossRef]
- Zhang, L.; Liu, Y.; Zhan, H.; Jin, M.; Liang, X. Influence of solar activity and El Niño-Southern Oscillation on precipitation extremes, streamflow variability and flooding events in an arid-semiarid region of China. J. Hydrol. 2021, 601, 126630. [Google Scholar] [CrossRef]
- Zhou, Y.; Xie, Z.; Liu, X. An analysis of moisture sources of torrential rainfall events over Xinjiang, China. J. Hydrometeorol. 2019, 20, 2109–2122. [Google Scholar] [CrossRef]
- Ning, G.; Luo, M.; Zhang, Q.; Wang, S.; Liu, Z.; Yang, Y.; Wu, S.; Zeng, Z. Understanding the mechanisms of summer extreme precipitation events in Xinjiang of arid Northwest China. J. Geophys. Res. Atmos. 2021, 126, e2020JD034111. [Google Scholar] [CrossRef]
- Yao, S.; Jiang, D.; Zhang, Z. Moisture sources of heavy precipitation in Xinjiang characterized by meteorological patterns. J. Hydrometeorol. 2021, 22, 2213–2225. [Google Scholar] [CrossRef]
- Li, J.; Bai, J.; Wang, Y. Time series area of the Ayakkum Lake and its response to climate change. Arid Zone Res. 2018, 35, 85–95. [Google Scholar]
- Wang, S.; Jin, X.; Gao, M.; Liu, W. Dynamic change of Ayakekumu Lake and its response to glaciers melting. Yellow River 2016, 38, 64–67. [Google Scholar]


| Product | Parameter | Period | Spatial Resolution | Spatial Coverage |
|---|---|---|---|---|
| CMFD | Precipitation and temperature | 1979–2018 | 6′ × 6′ | China |
| CRU | Precipitation and temperature | 1901–2021 | 30′ × 30′ | Globe |
| ERA5 | Precipitation and temperature | 1950–2022 | 6′ × 6′ | Globe |
| WorldClim | Precipitation and temperature | 1960–2018 | 2.5′ × 2.5′ | Globe |
| CPC | Precipitation | 1979–2022 | 30′ × 30′ | Globe |
| GHCN | Temperature | 1948–2022 | 30′ × 30′ | Globe |
| Product | MBE (mm) | MAE (mm) | RMSE (mm) | R2 | DISO | n |
|---|---|---|---|---|---|---|
| CMFD | 0.12 | 9.06 | 15.09 | 0.42 | 1.18 | 61 |
| CRU | –5.14 | 9.90 | 16.40 | 0.39 | 1.33 | 61 |
| ERA5 | –2.65 | 6.23 | 11.59 | 0.80 | 0.89 | 61 |
| WorldClim | –1.97 | 8.73 | 18.60 | 0.43 | 1.43 | 61 |
| CPC | –9.63 | 10.76 | 19.27 | 0.30 | 1.66 | 61 |
| Product | MBE (°C) | MAE (°C) | RMSE (°C) | R2 | DISO | n |
|---|---|---|---|---|---|---|
| CMFD | –1.64 | 1.64 | 1.94 | 0.99 | 0.55 | 61 |
| CRU | 1.62 | 1.70 | 1.91 | 0.99 | 0.54 | 61 |
| ERA5 | –1.17 | 1.39 | 1.58 | 0.99 | 0.42 | 61 |
| WorldClim | 0.98 | 1.28 | 1.52 | 0.99 | 0.39 | 61 |
| GHCN | –0.28 | 1.54 | 1.85 | 0.98 | 0.40 | 61 |
Publisher’s Note: MDPI stays neutral with regard to jurisdictional claims in published maps and institutional affiliations. |
© 2022 by the authors. Licensee MDPI, Basel, Switzerland. This article is an open access article distributed under the terms and conditions of the Creative Commons Attribution (CC BY) license (https://creativecommons.org/licenses/by/4.0/).
Share and Cite
Wang, S.; Li, H.; Zhang, M.; Duan, L.; Zhu, X.; Che, Y. Assessing Gridded Precipitation and Air Temperature Products in the Ayakkum Lake, Central Asia. Sustainability 2022, 14, 10654. https://doi.org/10.3390/su141710654
Wang S, Li H, Zhang M, Duan L, Zhu X, Che Y. Assessing Gridded Precipitation and Air Temperature Products in the Ayakkum Lake, Central Asia. Sustainability. 2022; 14(17):10654. https://doi.org/10.3390/su141710654
Chicago/Turabian StyleWang, Shengjie, Hongyang Li, Mingjun Zhang, Lihong Duan, Xiaofan Zhu, and Yanjun Che. 2022. "Assessing Gridded Precipitation and Air Temperature Products in the Ayakkum Lake, Central Asia" Sustainability 14, no. 17: 10654. https://doi.org/10.3390/su141710654
APA StyleWang, S., Li, H., Zhang, M., Duan, L., Zhu, X., & Che, Y. (2022). Assessing Gridded Precipitation and Air Temperature Products in the Ayakkum Lake, Central Asia. Sustainability, 14(17), 10654. https://doi.org/10.3390/su141710654