Article

Does Resilience Exist in China’s Tourism Economy? From the Perspectives of Resistance and Recoverability

1
School of Business Administration and Tourism Management, Yunnan University, Kunming 650500, China
2
College of Public Administration, Nanjing Agricultural University, Nanjing 210000, China
3
School of Geography and Information Engineering, China University of Geosciences, Wuhan 430074, China
4
Faculty of Arts and Communication, Kunming University of Science and Technology, Kunming 650500, China
5
School of Political Science and Public Administration, Henan Normal University, Xinxiang 453007, China
6
College of Tourism, Xinyang Normal University, Xinyang 464000, China
*
Authors to whom correspondence should be addressed.
Sustainability 2022, 14(17), 10641; https://doi.org/10.3390/su141710641
Submission received: 21 July 2022 / Revised: 17 August 2022 / Accepted: 23 August 2022 / Published: 26 August 2022
(This article belongs to the Special Issue Resilience and Recovery of Tourism)

Abstract

:
Since the 21st century, crisis events have been frequent and normalized globally, and improving resilience has become the key for the tourism industry to cope with various uncertainty risks. To reveal the reality of the economic resilience of tourism in China, this study employed the autoregressive integrated moving average model (ARIMA) to construct a counterfactual function and integrated with the peaks-over-threshold (POT) model and geographical detector model to evaluate the spatiotemporal evolution and influencing factors of the economic resilience of tourism in China from the resistance and recoverability perspective, with a view to providing a reference for consolidating the resilience of the economic system of tourism in China and promoting the sustainable development of its tourism economy. The results showed that the economic resilience of tourism in China can be divided into four types—robust, self-reliant, laissez-faire, and fragile—based on a baseline resistance of −0.361 and recoverability of 0.342. Under different contraction–recovery cycles, the resistance and recoverability of China’s tourism economy have been progressively improved, transforming from the centralized model to the discrete model, from a fragile to a self-reliant type. The type of economic resilience of tourism in China exhibited a clustered contiguous development trend, with obvious zonal distribution characteristics and self-reliant tourism economic resilience areas dominating, but most areas have not yet formed stable economic resilience in their tourism sector. The ecological environment quality, government management ability, and technological innovation level were the main factors affecting the economic resilience of tourism in China. The interactions between different influencing factors were more significant in strengthening the tourism economic resilience.

1. Introduction

The COVID-19 epidemic spread around the world in 2020, and this public health emergency had a huge and far-reaching impact on the socioeconomic development of all countries, especially the tourism industry [1]. Due to lockdown measures, travel restrictions, economic recession, and other impacts, global tourism activities have declined unprecedentedly, tourism economic benefits have been reduced across the board, and the unemployment rate is increasing, facing unprecedented threats and challenges [2]. According to the World Tourism Economy Trends Report (2022) released by the World Tourism Cities Federation and the Tourism Research Center of the Chinese Academy of Social Sciences, the total number of global tourist trips in 2021 reached 6.60 billion, and the total revenue of global tourism reached USD 3.3 trillion, only 53.7% and 55.9% of those in 2019, respectively [3]. Tourism has a strong comprehensiveness and sensitivity. Political, economic, and natural disasters as well as other external environmental changes often have a direct impact on tourism, so it shows more nonlinear fluctuations and periodic evolution [4,5]. Historically, China’s tourism industry suffered from several major emergencies, such as the Asian financial crisis, SARS, Wenchuan earthquake, and global economic crisis, often accompanied by negative impacts such as the loss of economic benefits, decline in tourism arrivals, destruction of infrastructure, and negative tourism image [6]. Although tourism statistics fluctuate greatly in the short term, China’s tourism economy still maintains stable growth in the long term. A single shock has not imposed a permanent impact on the growth trend of China’s tourism economy, which always manages to bottom out and regain some sort of equilibrium or steady state [7]. As the largest consumer of outbound tourism in the world, China is also an important tourist destination and source market in the world, occupying an important position in the global tourism pattern. It is vital to promote the sustainable and healthy development of China’s tourism economy. Since the 21st century, faced with increasingly frequent and normalized crisis events around the world, economic theories have advocated a shift from risk mitigation strategies to prioritizing economic resilience [8]. Therefore, resilience provides a new development concept for the tourism economy to effectively cope with various emergencies and challenges and maintain and improve economic vitality. On this basis, this study aims to conduct research on the following questions: (1) Does resilience exist in China’s tourism economy? (2) How does the resilience of China’s regional tourism economy change in different contraction–recovery cycles? What are the characteristics? (3) What are the main factors affecting the resilience of the tourism economy?

2. Literature Review

2.1. Economic Resilience

Resilience, originating in physics, refers to the ability of a system to maintain its stability and recovery after disturbance [9]. Since the 1970s, resilience has been introduced into the fields of ecology, economics, and others. Concepts such as engineering resilience, ecological resilience, and economic resilience have evolved [10]. Resilience theory provides a new research perspective for maintaining stability and improving the adaptability of the economic system, which has practical guiding significance for economic recovery under the impact of major emergencies [11]. Most scholars have discussed economic resilience from different perspectives, mainly focusing on the concept, evaluation method, and influencing factors.

2.1.1. Concept

Initially, there was no theory related to “resilience” in mainstream economics until Reggiani (2002) introduced the concept of resilience into the study of spatial economics, after which economic resilience was widely used as an analytical concept [12]. Early studies mostly emphasize the resistance and recoverability of economies to external shocks. For example, Pike et al. (2010) define economic resilience as the ability of a regional economy to maintain a pre-existing state (typically assumed to be an equilibrium state) in the presence of some type of exogenous shock [13]. With the intervention of evolutionary economic geography, the dynamic evolutionary capacities of economies in crisis arouse the attention of scholars. For example, Simmie (2010), Shaw et al. (2013), and Boschma et al. (2015) all argue that resilience includes not only the successful recovery of the economy from shocks but also the change in its original growth path and the finding of a new growth path, which is a kind of transformation and upgrading ability [14,15,16]. Conversely, Martin et al. (2015) believe that economic resilience is an adaptive resilience, which is the dynamic adjustment ability of economic adaptability [17]. It is evident that there is no uniform concept of economic resilience in academia, but there is a general consensus on three important capabilities it possesses, namely the ability to withstand external shocks, the ability to respond positively to shocks, and the long-term adaptability to forge new development paths [18].

2.1.2. Evaluation Method

The existing evaluation system on economic resilience can be roughly divided into two categories [19]. One is the comprehensive evaluation of economic resilience by constructing an indicator system [20]. Some scholars believe that economic resilience is a composite concept involving many aspects, which needs to be measured by constructing an indicator system [21]. For example, Briguglio (2009) was the first to construct an economic resilience evaluation indicator system that includes four aspects—economic stability, market efficiency, economic governance, and social development—based on the understanding that the resilience of a country’s economy depends on its own resistance and external policy guidance [22]. Wang et al. (2021) started from the concept of economic resilience and evaluated regional economic resilience from three dimensions: resistance capacity, adjustment capacity, and response capacity [23]. As the selection of related indicators has not been unified, the construction of indicator systems varies greatly, and the measurement results are always controversial [24]. The other is to measure economic resilience by constructing a correlation index [25]. Usually, a core variable is selected to represent its change in the face of shock disturbance and the change degree of this core variable before and after shock is compared with the frontier explanatory model. For example, Martin et al. (2016) use the national employment growth rate to calculate the expected employment level of a region and measure the regional economic resilience using the difference between the expected and actual values. The measure reflects the resilience of the economic system in response to short-term shocks [26], which has been widely recognized by the academic community [27,28].

2.1.3. Influencing Factors

The resilience improvement in the economic system is driven by a combination of factors [29]. Based on empirical studies, scholars have discussed the factors affecting the economic resilience of several countries in Europe and the United States, arguing that external shocks such as economic crises, business failures, and internal disturbances such as industrial recession and climate change are important factors in regional resilience changes [30]. It is also pointed out that the regional ability to sustain professional technical knowledge innovation, a good institutional environment, and a diversified supply chain network exert a positive impact on regional economic resilience [31,32,33]. On this basis, Capello et al. (2015) emphasize that changes in location conditions, the agglomeration effect of growth poles, innovation system, and city scale and function will have an impact on regional economic resilience [34]. Sensier et al. (2016) believe that the improvement in research and development (R&D) and technological innovation is conducive to resisting economic crises [35]. Martin (2016) further put forward the analysis framework of influencing factors of regional economic resilience comprehensively from the perspectives of industrial structure, labor force, finance, and institutions [26].

2.2. Tourism and Resilience

The tourism industry has become one of the industries with the strongest development momentums and largest scale in the global economy, as well as one of the most labor-intensive industries, directly and indirectly driving large-scale employment worldwide [36]. However, the risks associated with environmental uncertainty have led to a slowdown in the tourism industry, especially with the outbreak of COVID-19, which has brought the global tourism industry to a prolonged “standstill”, shrinking employment opportunities, plummeting employment rates, and reversing sustainable development progress [37]. However, some studies have also proved that the tourism industry can often rebound quickly after a shock, or even “turn crisis into opportunity”, which fits the concept of resilience [7]. Since the mid-1990s, the concept of resilience has been gradually extended to the field of tourism as global environmental change and sustainable development ideas continue to advance, forging a new path for academics to study complex tourism systems [38]. As an ever-evolving complex system, the tourism industry has a high degree of industrial relevance and a more complex state of regional resilience [39]. Most studies on resilience in the tourism field are based on crisis management and posit that the system has the ability to adapt, respond, and evolve [40,41]. Meanwhile, as a social ecosystem, the tourism industry often faces different crisis situations in its development, which breaks the original development of the tourism economic system, making it enter a recessionary trajectory or successfully adapt to transformation to a new form of prosperity. That is, the resilience of the economic system of tourism constantly migrates as the crisis situation changes [42], and whether this migration is good or bad, most scholars believe that it depends mainly on the resistance and recoverability of system functions and structures [26,43]. Based on a comprehensive review of studies on resilience, Wang et al. (2021) propose that tourism destination resilience is the ability of tourism destinations to resist, adapt, and self-organize against interference [44], which further proves the point. Roberto et al. (2015) establish a composite index from the perspective of demand side and supply side to discuss the economic performance of Italian tourism under the influence of the financial crisis [45]. Sheppard et al. (2016) find that individual resilience would affect the resilience of tourism communities, and enhanced factors, such as cognitive ability, emotional motivation, physical health status, and emotional management ability based on individual resilience, would also affect the resilience of tourism communities [46]. King et al. (2021) believe that livelihood capital is an important factor affecting the resilience of tourism destinations [47]. Stefan (2015) proposes that tourism areas are complex and potential adaptive systems based on the theory of complex adaptive systems, and diversity is a key condition for tourism areas to develop adaptive capacity [48].
To sum up, the current studies on tourism resilience mainly focus on tourism destinations, including community resilience [38,49,50,51,52,53], environmental resilience [54], and socio-ecological resilience [52,55]. There are few studies on the resilience of the economic system of tourism. In addition, the analysis of tourism resilience mainly focuses on small- and medium-sized scales, such as provinces [54,56], urban agglomerations [57], and cities [58,59], while there are few large-scale studies at the national level. From the perspective of research methods, most research methods on tourism resilience are qualitative research, employing case analyses [60,61], questionnaire surveys [62], and semi-structured interviews [46,63], while quantitative research is relatively rare. Studies on influencing factors of tourism resilience tend to focus on a specific field, lacking quantitative analysis on the size of influencing factors [64].
The resilience level has become a key indicator to measure the development of the tourism economy and an important guarantee for the sustainable development of China’s tourism industry [65]. This study intends to carry out research from the following three aspects to scientifically measure the resilience of China’s tourism economy and put forward targeted countermeasures and suggestions. First, based on the perspective of resistance and recoverability, the core variable method was selected to measure the resilience of China’s tourism economy, and on this basis, the types were divided with the peaks-over-threshold (POT) model. Second, the temporal evolution and spatial difference of resilience of China’s tourism economy were discussed through stage division and spatial analysis. Third, the geographical detector model was used to identify the main factors influencing the resilience of China’s tourism economy and to clarify the interaction between different factors.

3. Research Design

3.1. Data Sources

China has long adhered to the strategic policy of striving to develop tourism. Domestic tourism, inbound tourism, and outbound tourism have developed rapidly, most notably inbound tourism, which has experienced the development process from scratch, from small to large. Figure 1 shows the statistics of China’s inbound and domestic tourism revenue. Although both have achieved substantial growth, the non-linear growth characteristics of inbound tourism revenue are obvious and cyclical fluctuations are strong, indicating that inbound tourism is more significantly affected by major emergencies. Moreover, the level of inbound tourism development, as an important part of the tourism economy, is an important indicator to evaluate the competitiveness of a country’s tourism. Therefore, to explore China’s tourism economic resilience under the impact of major events and the influencing factors, it is more meaningful and challenging to choose inbound tourism. Based on the availability and objectivity of data, the number of inbound tourists is selected as the evaluation variable of tourism economic resilience. The time period of this study is 2000–2019, and the data were mainly obtained from the China Tourism Statistical Yearbook, Drcnet Statistical Database System (data.drcnet.com.cn, accessed on 20 August 2022), and the statistical bulletins of national economic and social development of provinces and cities.

3.2. Method

3.2.1. Basic Model

This study adopted the core variable method that achieved certain consensus [27,28]. This method is not only widely used to test the resilience of the economic system to short-term shocks but also to comprehensively investigate the dynamic evolution trend in the tourism economic system and its components. Referring to the relevant research of Martin et al. (2015), this study evaluated the resilience of China’s tourism economy from two dimensions of resistance and recoverability [17]. To make the measurement results more stable, the autoregressive integrated moving average model (ARIMA) was adopted as an instrument to measure the impact of major emergencies on the tourism economy.
The ARIMA model is an integrated model of auto-regressive (AR) and moving average model (MA) and is the most effective tool for short- and medium-term forecasting [66]. Its principle is to use differential methods to eliminate seasonal effects and integrate the combined effects of multiple factors into time-series variables to accurately simulate and predict the dynamics of practical problems [67]. Jiang et al. (2022) used the ARIMA model to predict GDP growth trends in China in an epidemic-free state and compared actual and predicted values to verify the important role of strong economic resilience in the country’s response to major shocks [68]. This method is able to circumvent shocks and disturbances caused by emergencies, accurately simulate the inherent trend in economic development, and reflect resilience characteristics by comparing inherent trends with actual performance. Therefore, this study draws on this in-sample forecasting approach. Its function model is as follows:
1 i = 1 p Φ i L i ( 1 l ) d X t = 1 + i = 1 q φ i L i σ t
where L is the lag term; P and Φ are the number terms and coefficients of AR, respectively; q and φ are the number terms and coefficients of MA, respectively; d represents the difference orders to eliminate non-stationary; and σ means the disturbance terms.
Martin et al. (2016) propose that under the impact of crisis events, the economic growth path exhibits four characteristics, namely vulnerability, resistance, adaptability, and recoverability [26]. Vulnerability and resistance reflect the same aspect of resilience characteristics of tourism economies; economies that can effectively resist external disturbances tend to have low vulnerability. Adaptability and recoverability are also interrelated; tourism economies that can quickly adapt to the environment after a shock and adjust to maintain efficient operation of the system tend to have better adaptability and recoverability [69]. Considering the above, this study evaluated the resilience of China’s tourism economy from two dimensions: resistance and recoverability. Resistance is the ability of the tourism economic system to resist when hit by emergencies, while recoverability is the ability of the tourism economic system to gradually recover and sustain itself from the crisis after the initial shocks [17]. The calculation equations are as follows [26]:
R e s i s r = Δ E r c o n t r a c t i o n Δ E r c o n t r a c t i o n expect Δ E r c o n t r a c t i o n expect
Recov r = Δ E r recovery Δ E r recovery expect Δ E r recovery expect
where Δ E r c o n t r a c t i o n and Δ E r r e c o v e r y are the decrease or increase in the amount of inbound tourism during the contraction and expansion periods, respectively; ( Δ E r c o n t r a c t i o n )expect and ( Δ E r r e c o v e r y )expect are, respectively, the loss or gain of the number of inbound tourists fitted by ARIMA model in accordance with the inherent trend in tourism development in the contraction period and expansion period; and Resisr and Recovr represent the resistance and recoverability of the regional tourism economic system, respectively.

3.2.2. Peaks-over-Threshold Model

There is a scholarly consensus on the approach to classifying resilience types by threshold [26,70]. This study attempted to determine the baseline of the resilience of the tourism economy through the POT and used it to classify the types of resilience. The POT model can make full use of extremum information to find the range of system resilience thresholds and establish resilience baselines [71]. The specific model is as follows:
Let X1, X2, …, Xu be an independent random variable with the same distribution function, for a sufficiently large threshold u; if Xi > u, the excess value Y = Xiu obeys the Generalized Pareto Distribution (GPD), and the distribution function is as follows:
G x = 1 1 + ξ x δ 1 ξ
where G(x) is the distribution expression of GPD, δ is the scale parameter, and ξ is the shape parameter.
The basic idea of the POT model based on tourism economic resistance and recoverability is that, when resistance (or recoverability) ≥ u, the tourism economic resistance (or recoverability) is close to or equal to the inherent growth trend. The tourism economic system can achieve adaptive development through self-adjustment after an emergency, and the emergency shock becomes an opportunity for tourism to adjust its development trajectory. If the resistance (recoverability) ≤ u, the resistance (or recoverability) of the tourism economy deviates from the inherent growth trend and is deeply negatively affected by emergencies. The development of the tourism economy will experience negative growth in the short term, making it difficult for the system to maintain growth through self-adjustment or to quickly recover to the pre-crisis growth level.

3.2.3. Geographical Detector Model

The geographical detector model can detect and explain the main influencing mechanism behind spatial differentiation. Its core principle is that if there is a causal relationship between two variables, the spatial distribution state of the two variables should also tend to be consistent [72]. The geographical detector model is mainly composed of four detectors, including the factor detector, interactive detector, ecological detector, and risk detector [72]. The factor detector and interactive detector are selected to analyze the influencing factors of China’s tourism economic resilience in this study. The specific model is as follows:
(1)
Factor detector
q = 1 i = 1 L n i σ i 2 n σ 2 = 1 S S W S S T
where q is the explanatory power of the detection factor to the evaluation value of tourism economic resilience, and the value ranges from 0 to 1. The larger the value, the higher the degree of influence of detection factors on tourism economic resilience. ni and n are the sample sizes of layer i and the whole region, respectively. σ i 2 and σ2 are the variance of layer i and the whole region. L is the number of categories, while SSW and SST are the sum of the variance within the layer and the total variance of the whole region, respectively.
(2)
Interactive detector
The interaction detector can identify the interaction between different tourism economic resilience and different influencing factors. The factor contribution rate under the interaction is expressed by q(X1X2), which is compared with the influencing factors q(X1) and q(X2) to judge the explanatory power of the interaction of the influencing factors. The interaction types are shown in Table 1.

4. Results

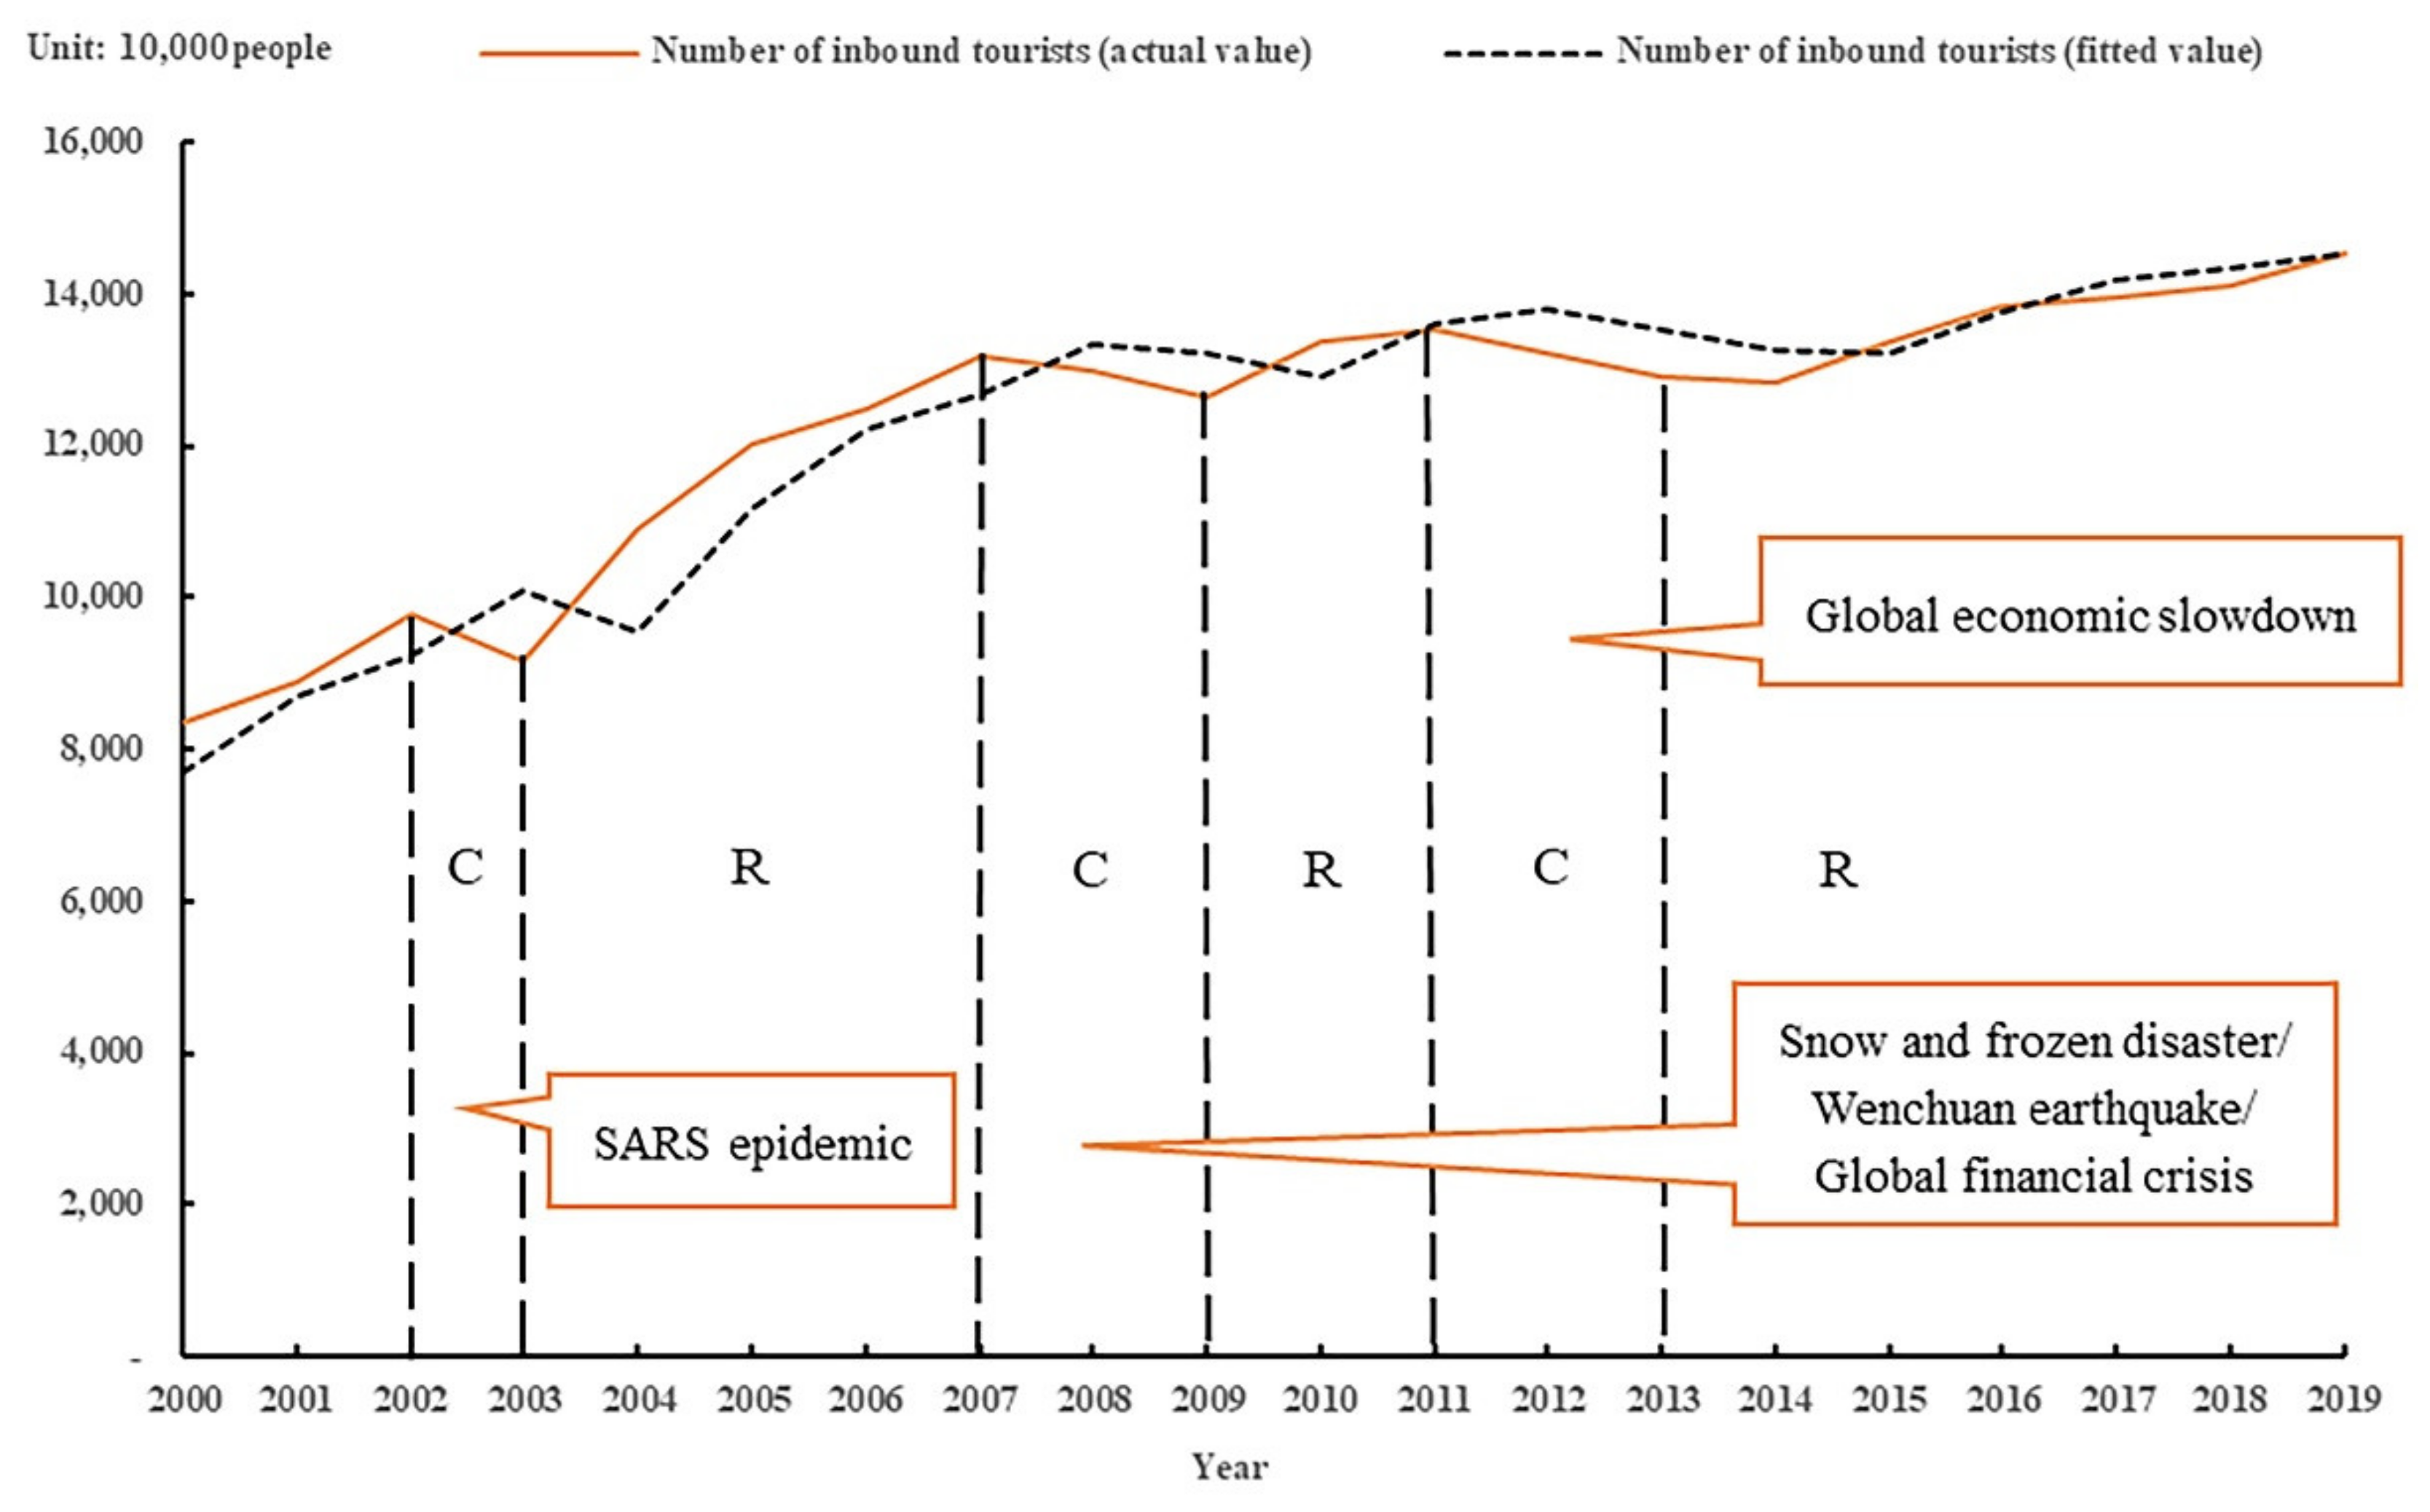
4.1. Cycle Division of Tourism Economic Resilience

The ARIMA model is established by Stata16, and the ideal value of the number of Chinese inbound tourists can be predicted without major emergencies. According to Figure 2, the fitting growth curve of the amount of inbound tourism largely matches with the actual growth curve, indicating that the fitting effect is excellent. Among them, the interval in which the dashed line is above the solid line (loss occurrence interval) indicates that the theoretical value of the inbound tourism number is greater than the actual value, and the difference is the amount of loss. Judging from the changes in the interval of loss, the intensity and periodicity on the tourism economy varies in terms of the different nature, scope, and duration of crisis events. Therefore, this study first examined and delineated the cyclical boundaries of China’s tourism economy to identify the economic contraction and recovery intervals under the crisis shocks. To accurately reflect and observe the fluctuations and resilience of the tourism economy in its long-term development, this study took 2000–2019 as the research interval and divided the cyclical fluctuation trend in China’s tourism economy in 20 years according to the peak method. As shown in Figure 2, from 2000 to 2019, China’s tourism economy as a whole experienced shock contraction periods from 2002 to 2003 and 2007 to 2009, recovery expansion periods from 2004 to 2007 and 2009 to 2011, adjusted contraction periods from 2011 to 2013, and a developmental adaptation period from 2013 to 2019.
As can be seen from Figure 2, the first shock contraction period was mainly due to the outbreak of SARS. In 2003, to prevent the spread of the epidemic, the Chinese government explicitly banned tourism activities, and China’s tourism economy suffered heavy losses due to restrictions on outbound travel. Among them, the number of inbound tourists decreased by 6.38% year-on-year, 9.1902 million less than expected, and the loss rate was 9.11%. However, due to the relatively short impact of the SARS epidemic, China’s tourism industry experienced a rapid rebound in 2004. The second shock contraction period was due to the impact of several major crisis events in 2008, most notably the outbreak of the global financial crisis, which greatly affected China’s tourism economy. The number of inbound tourists decreased by 3.5104 million compared to expectations, with a loss rate of 2.63%. In 2009, facing severe international and domestic situations, China launched a series of economic stimulus plans to cope with the crisis, and the tourism economy took the lead to achieve growth recovery out of the recession haze. However, this recovery period only lasted two years. In 2011, China’s tourism economy exhibited a downward trend again, ushering in the third shock contraction period. The reason is not only that the impact of the external financial crisis on the economy has not been fully resolved but also that the Chinese government took the initiative to adjust tourism development policy from the pursuit of speed to quality. In the short term, the growth rate of the tourism economy began to slow down. From 2013 to 2019, the upgrading effect of China’s tourism industry was prominent, and it began to enter a long-term stable development and adaptation period.
Drawing on the above study, it is found that China’s tourism economy has fallen to different degrees due to the impact of major crisis events, but this impact is periodic. The development of the economic growth of tourism in China still presents a long-term trend, a temporary crisis could not prevent the development of tourism [73], indicating that the short-term fluctuations do not change the long-term positive trend, and China’s tourism economy has a certain resilience.

4.2. Evaluation of Tourism Economic Resilience

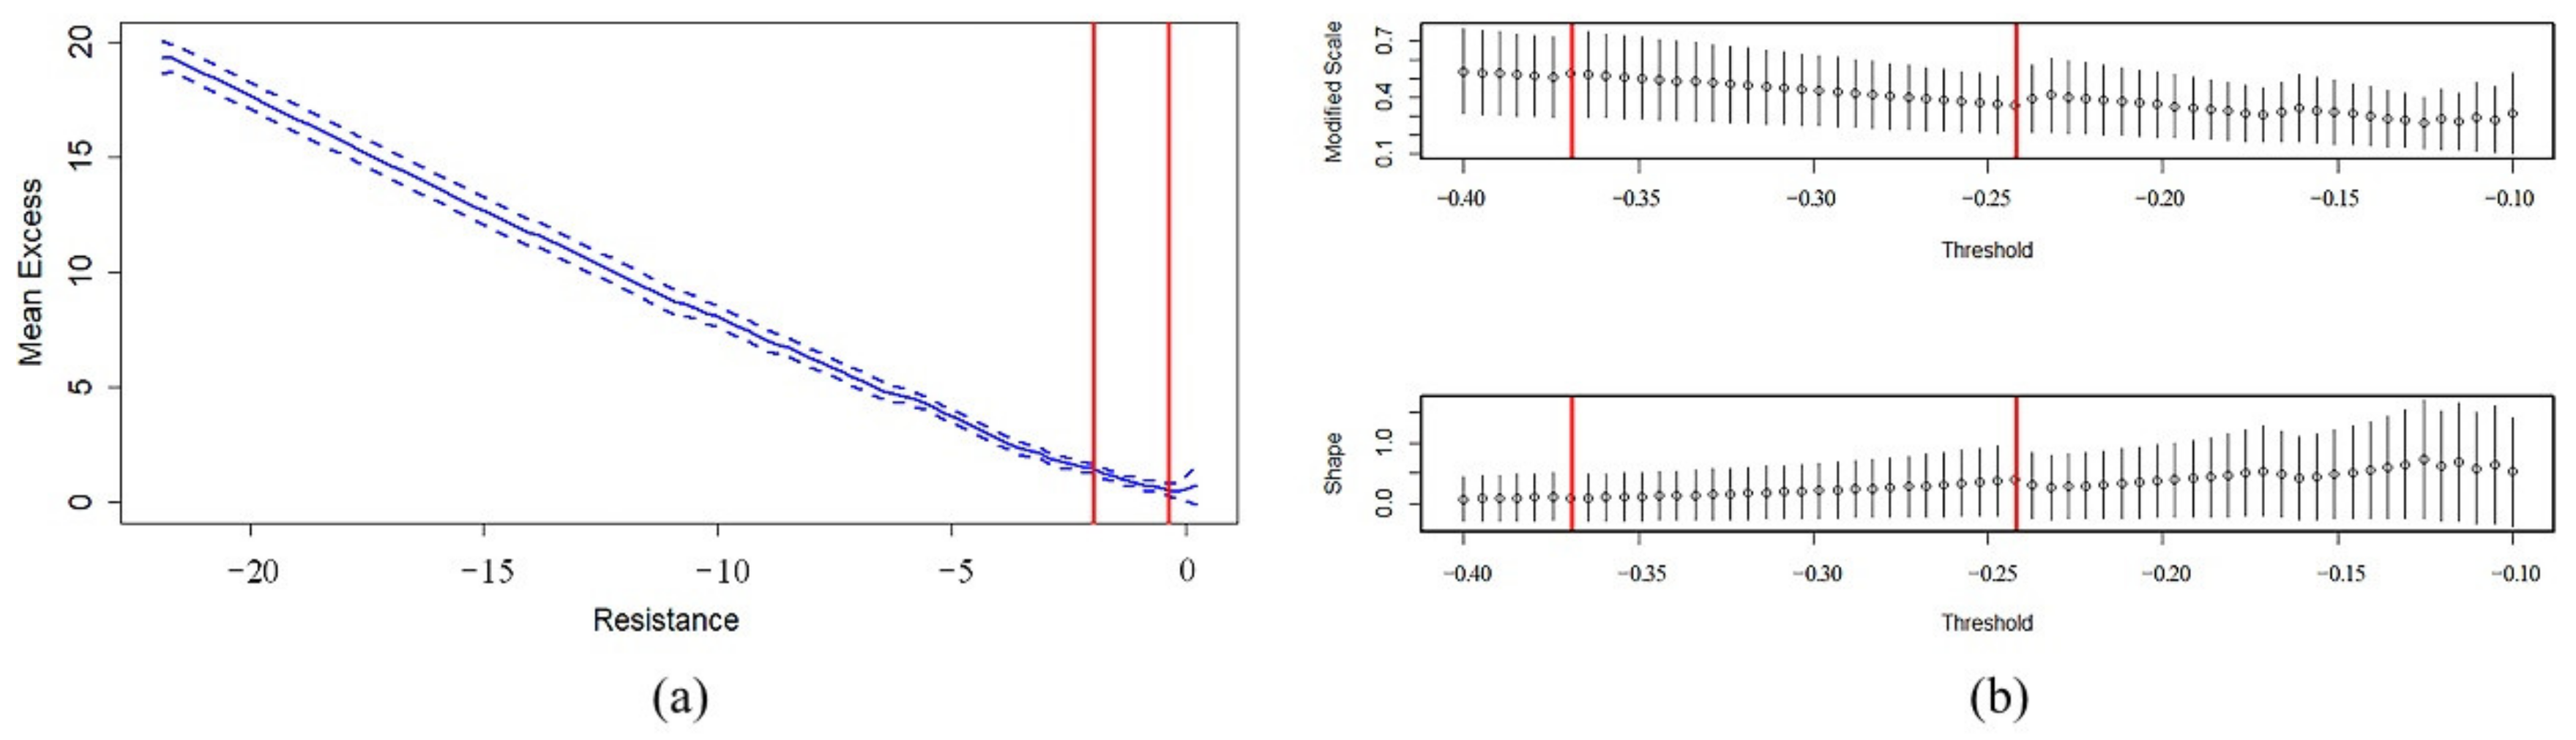
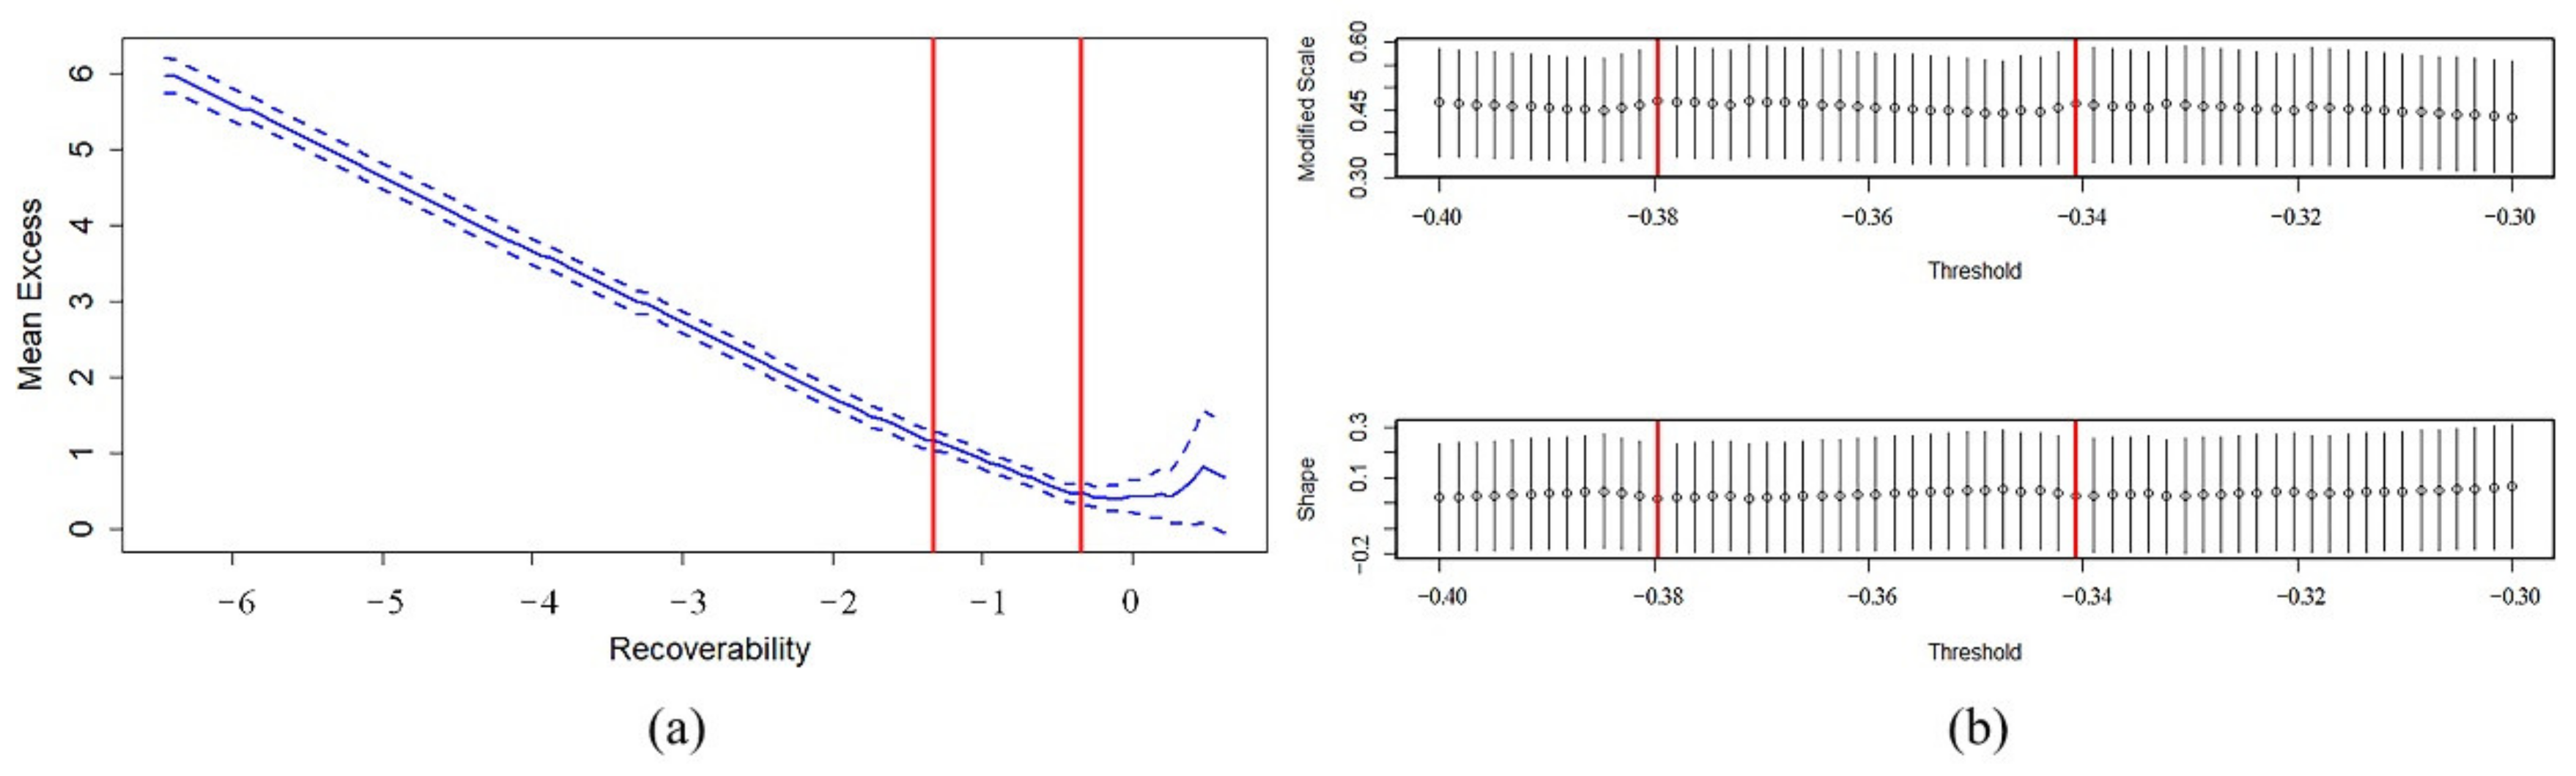
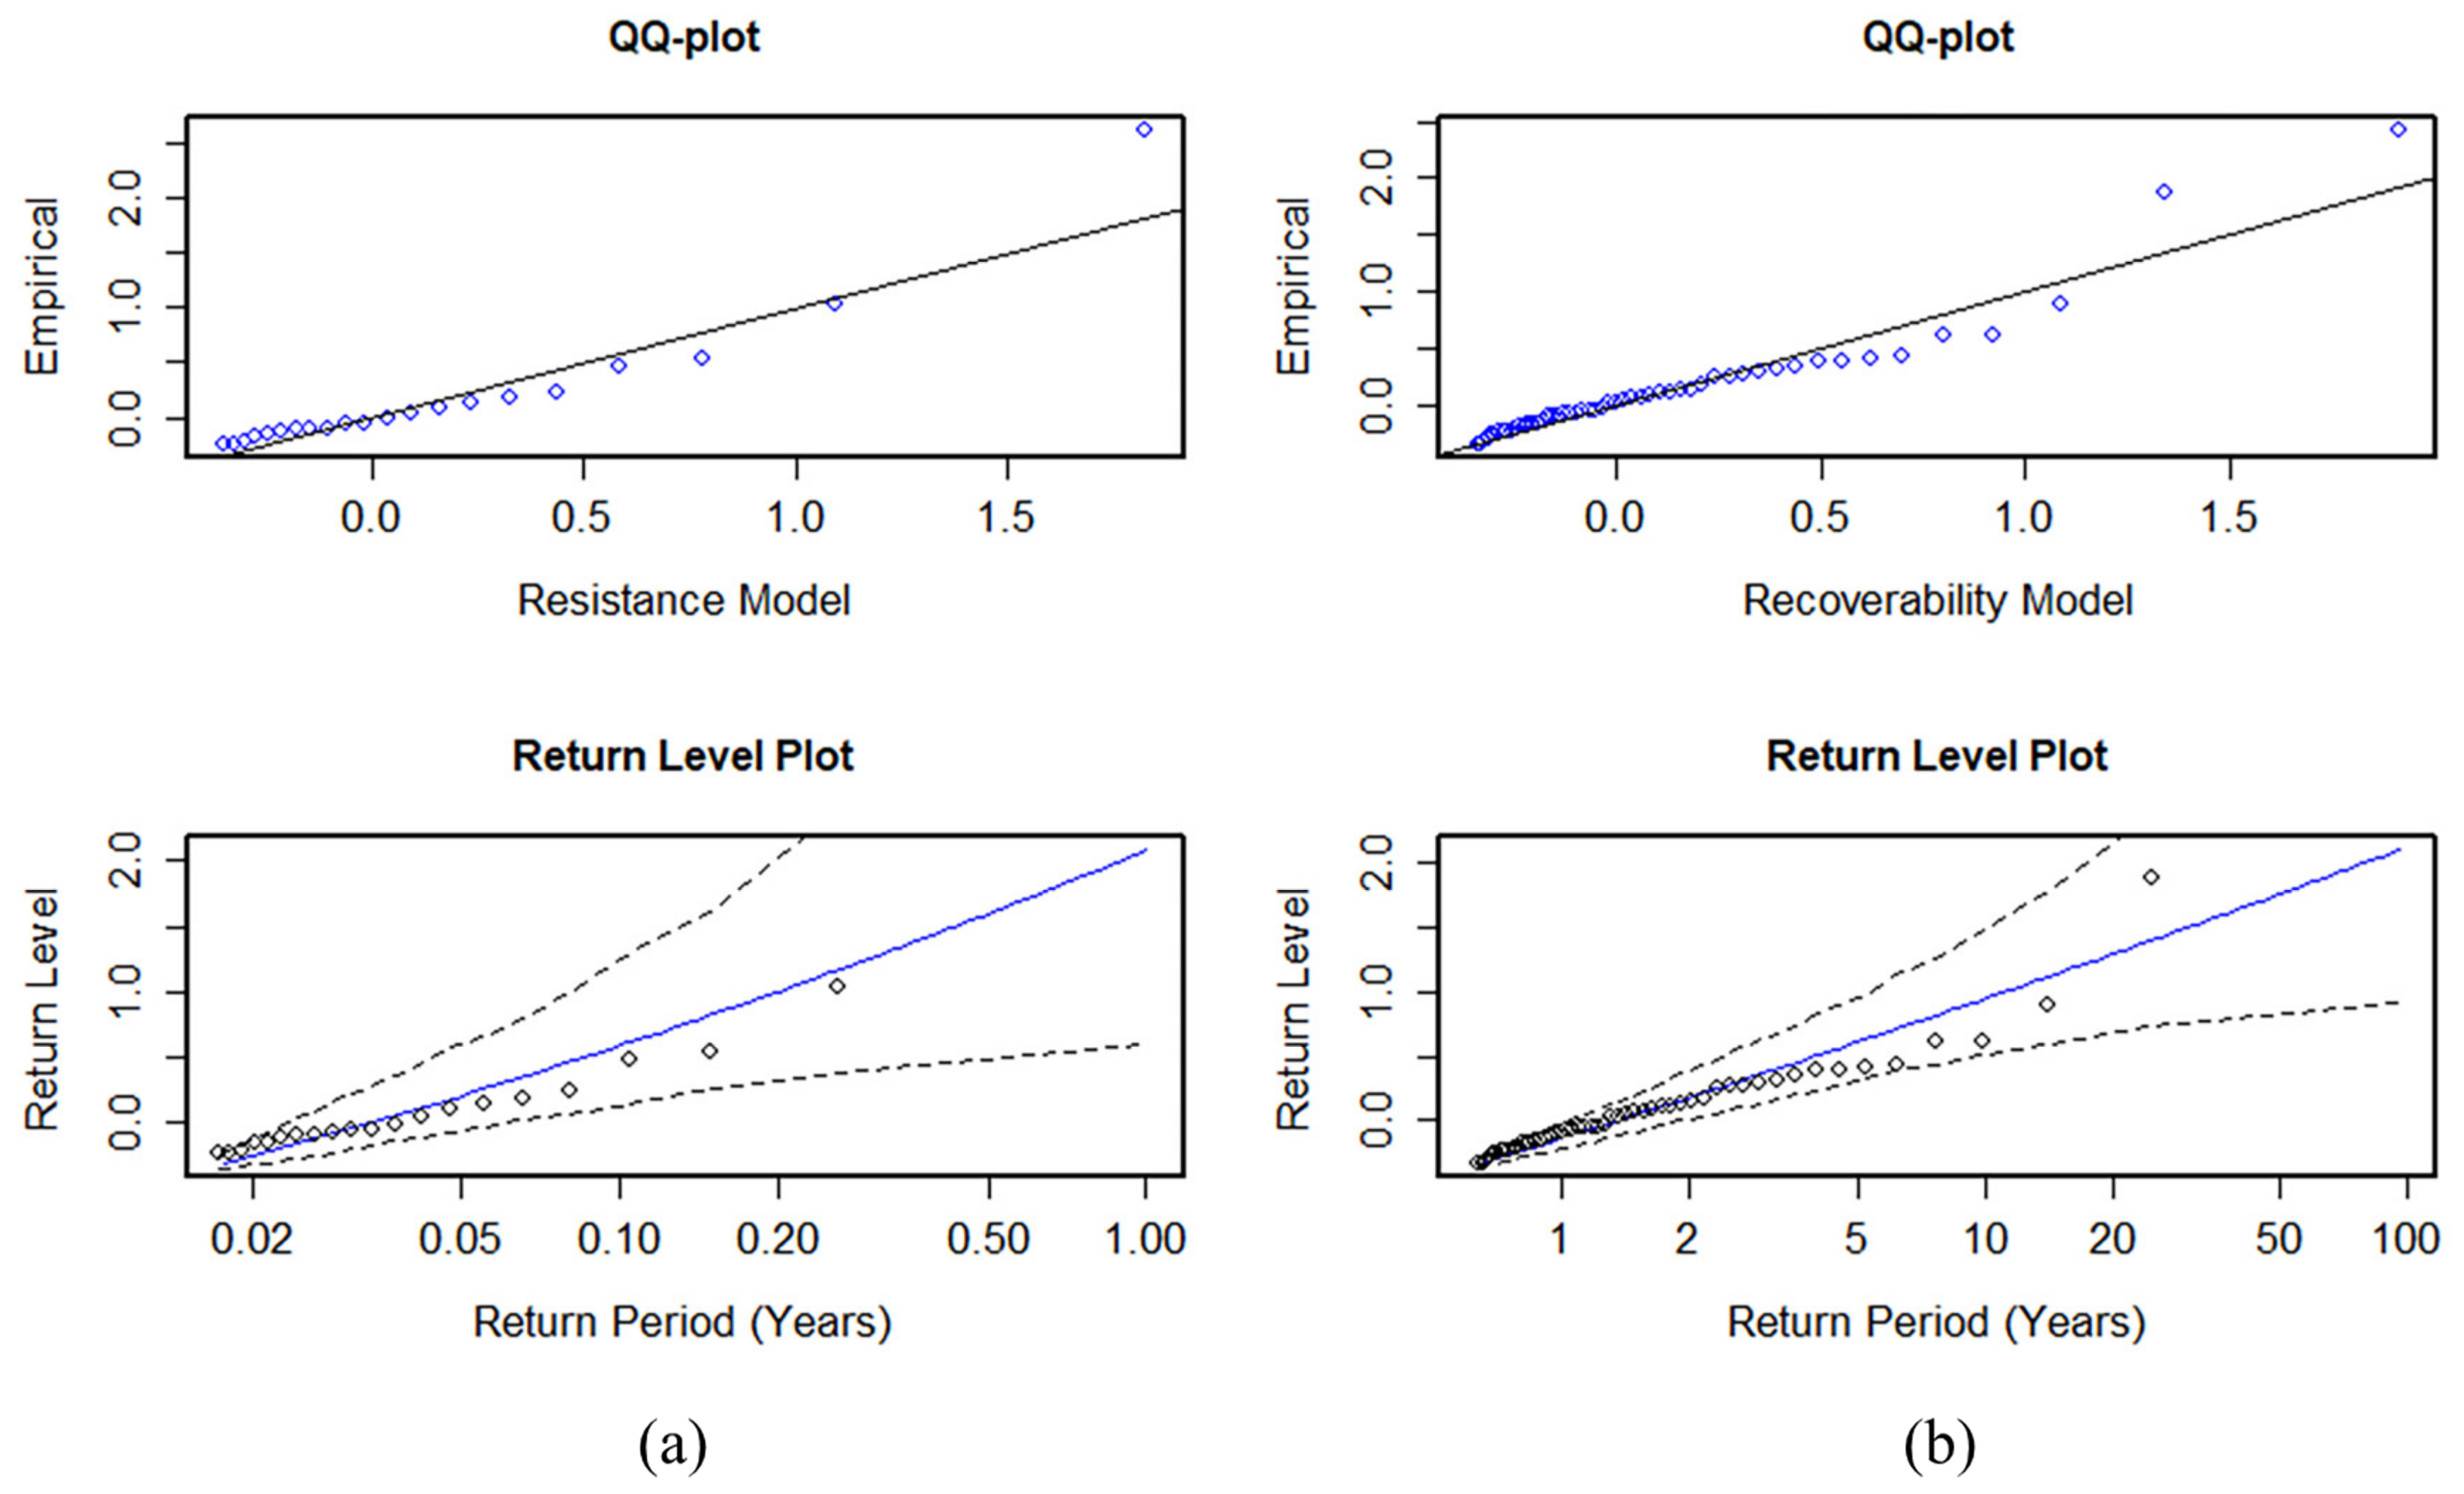
4.2.1. Establishment of Resilience Baseline for Tourism Economy

According to the research on the equilibrium state and resilience category of the economic system summarized by Martin (2012), the tourism economic system will transfer from the existing path to another equilibrium or state after external shocks or disturbance that break the threshold and recover and develop on the new path [46]. Therefore, establishing a resilience baseline based on the threshold is conducive to grasping and discovering the development direction of the tourism economy, which is essential for the tourism economic system to effectively prevent and control major risks, maintain system stability, and ensure sustainable development.
Choosing a reasonable threshold is the key to establishing a baseline for tourism economic resilience. Based on Equations (1)–(3), this study measured the resistance and recoverability of the three contraction–recovery cycles of China’s tourism economy and used the mean residual life plot to determine the threshold selection range R1, then used the threshold stability plot to determine the threshold stability range R2. The two ranges are taken to intersect: R = R1R2, and the upper bound u+ of R is the final threshold. Due to the significant negative correlation between resistance and recoverability, a negative mapping of resilience was taken before threshold selection.
According to Figure 3, the threshold selection range of resistance is R resist 1 = (−1.987, −0.361), the threshold stability range is R resist 2 = (−0.369, −0.242), the threshold range is Rresis = R resist 1 R resist 2 = (−0.369, −0.361), and finally, the threshold was determined as resistance = −0.361.
Similarly, it can be obtained from Figure 4 that − R resist 1 = (−1.325, −0.342), − R recov 2 = (−0.378, −0.341), Rrecov = R recov 1 R recov 2 = (−0.378, −0.342), and finally, the threshold is determined as the recoverability = 0342.
As can be seen from Figure 5a,b, although some points in the figure deviate from the fitted straight line, the predicted reproduction level is within the 95% confidence interval from the reproduction level figure, indicating that the resistance and recoverability models still fit well.
According to the meaning of the threshold, this study sets the tourism economic resistance at −0.361 and recoverability at 0.342 as the baseline for tourism economic resilience. It is worth noting that the baseline set in this study is a relative baseline rather than an absolute one.

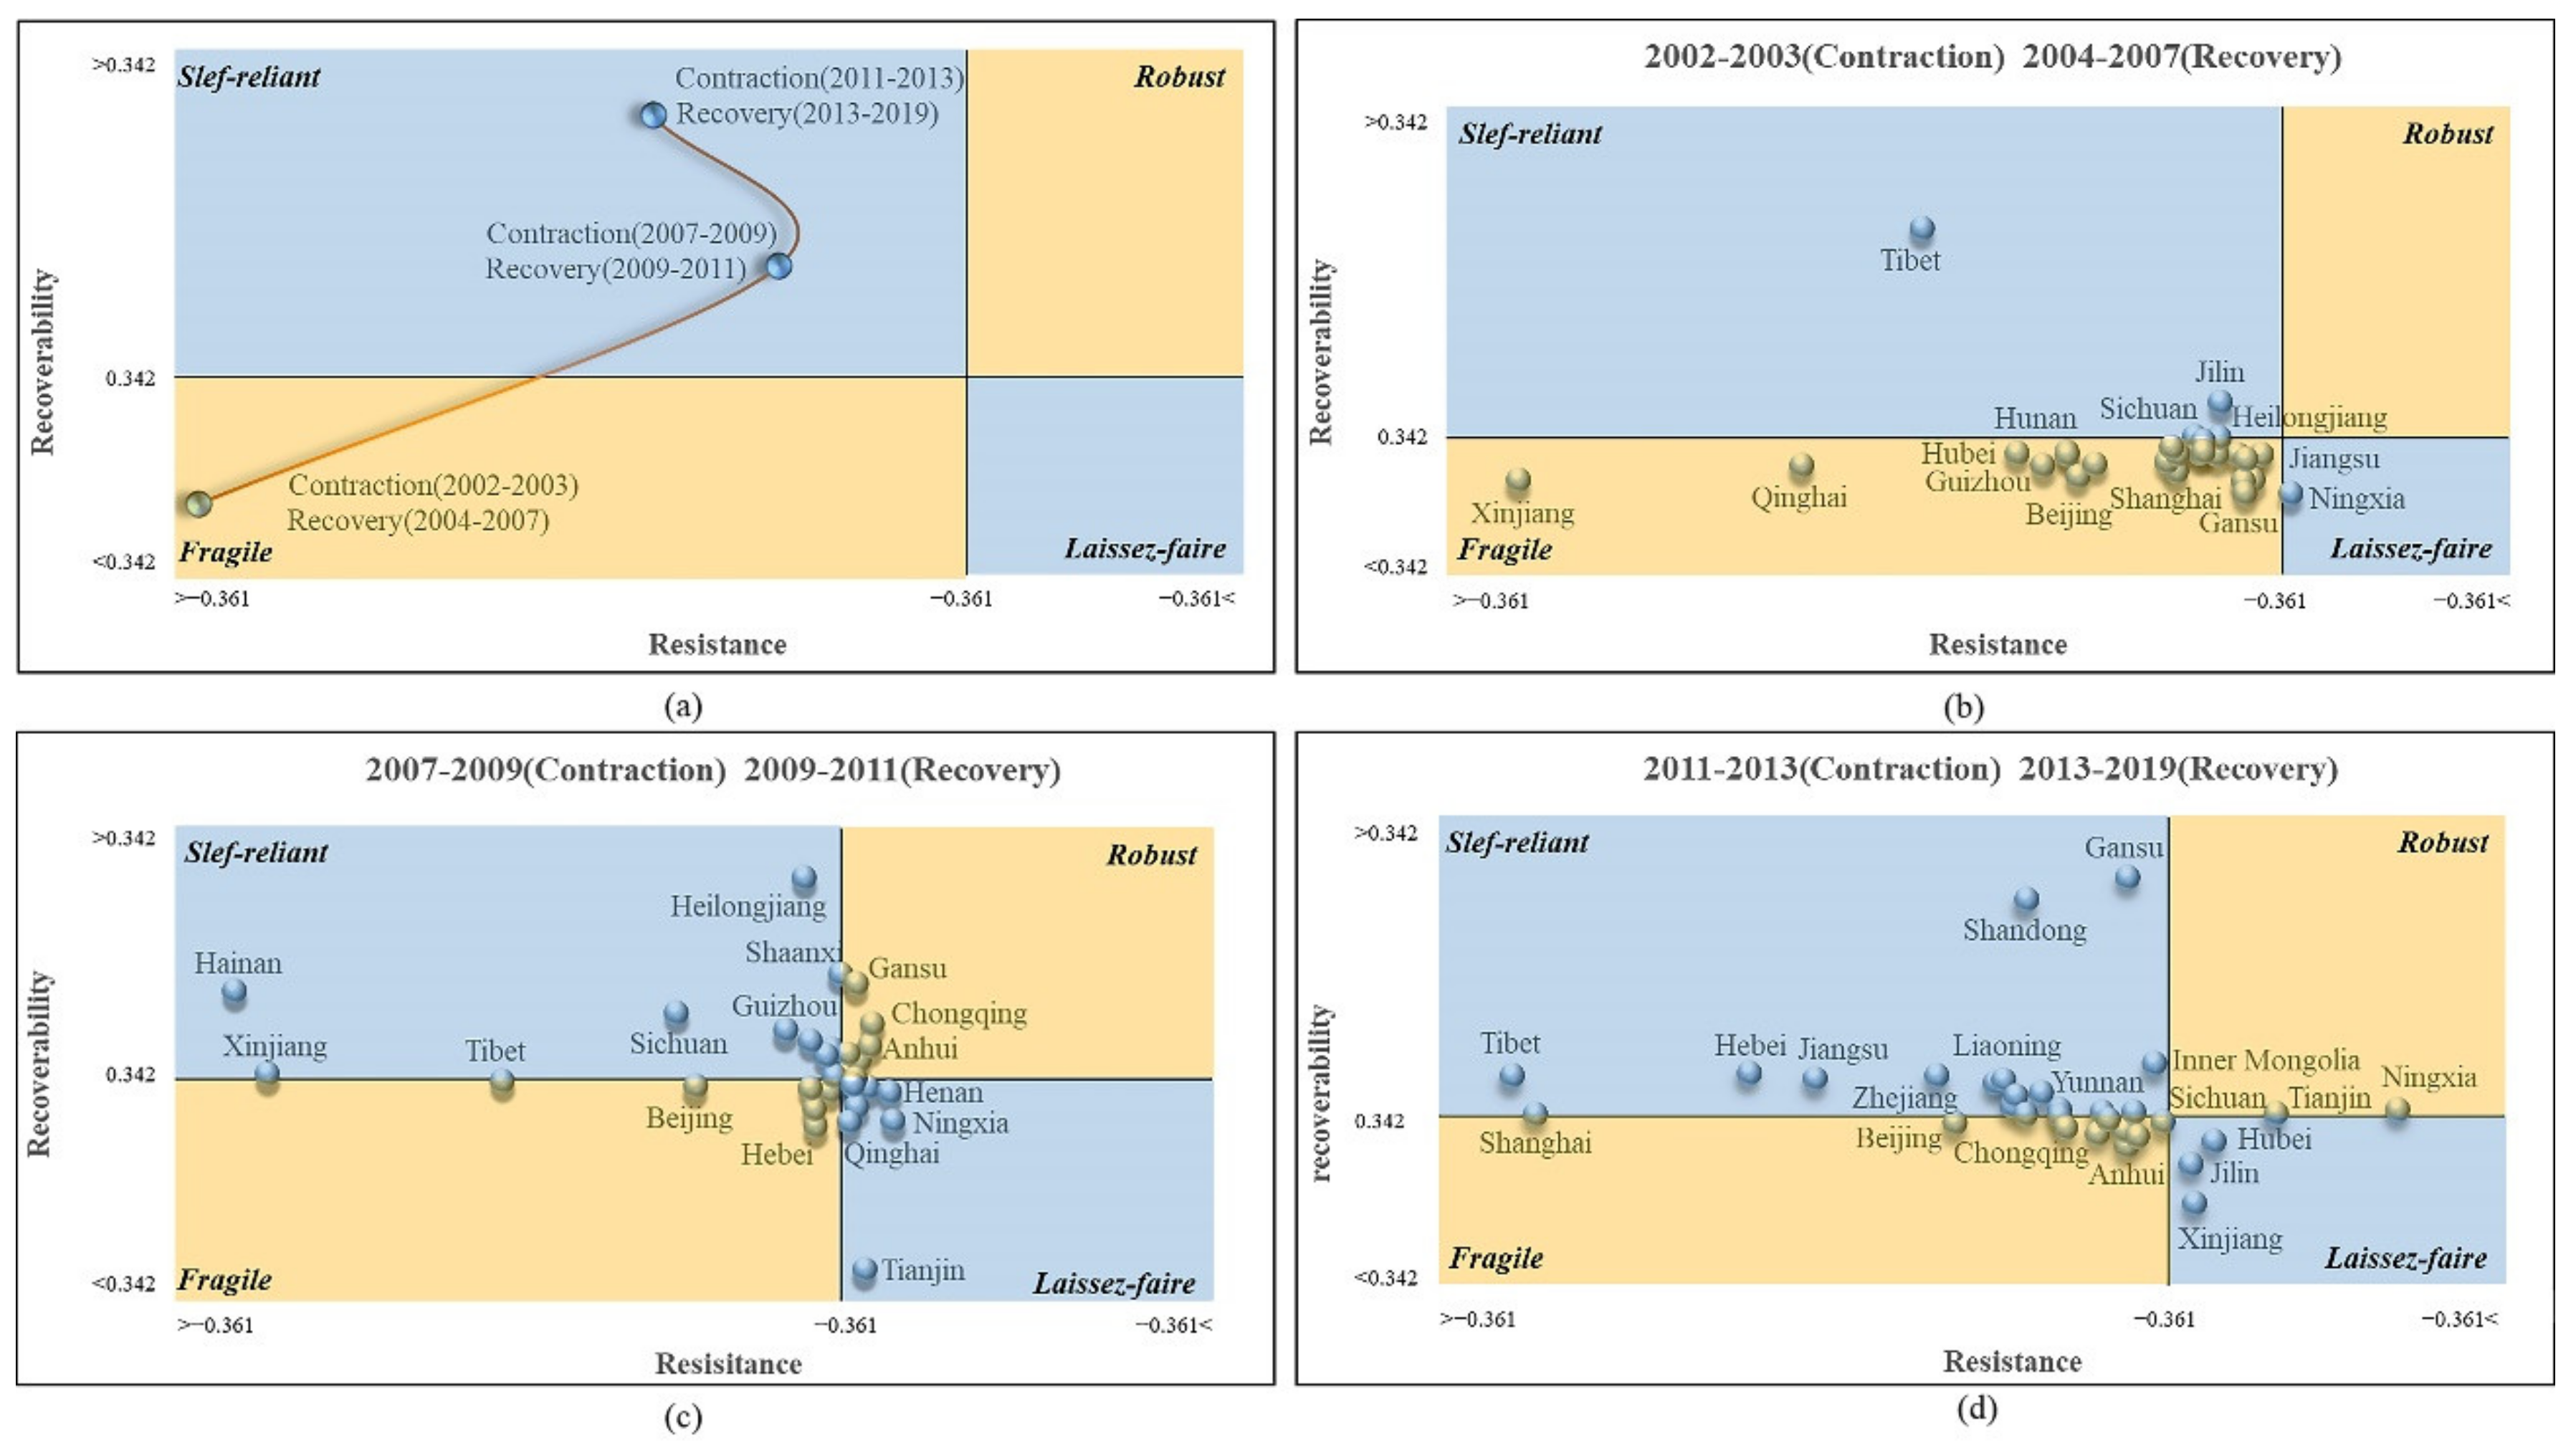
4.2.2. Types of Tourism Economic Resilience

In the study of economic resilience, Martin (2016) combined the results of the two dimensions of resistance and recoverability and took 0 as the baseline for resistance and recoverability [26]. On this basis, the academic community further used 1 and 0 as the baseline for resistance and recoverability and as the criteria for classifying economic resilience [74]. Since the tourism economy has its own development trajectory and characteristics, there exists a certain threshold range and baseline of resilience [75]. Referring to the classification ideas of relevant scholars [26,74,75], this study combined the resilience baselines found by the POT model with extreme value information and divided tourism economic resilience into four types (Table 2).
Among them, the robust type performs the strongest resistance and recoverability, showing the best resilience state. The regions belonging to this type can not only effectively resist the shocks of major emergencies but also effectively recover and adjust the impact through emergency measures [70], which is often best able to turn crisis into opportunity, thus promoting the transformation and upgrade of regional tourism economy and achieving sustainable development [26]. The fragile type performs the weakest resistance and recoverability, showing the worst resilience state. The regions belonging to this type often have difficulty resisting the shocks of major emergencies and find it difficult to quickly recover and adjust, exhibiting the characteristics of fragile. This type of region, especially, should be given high priority. If left unchecked, the tourism economy may fall into permanent contraction and embark on a recessionary trajectory [75]. The self-reliant and the laissez-faire types perform the characteristics between the first two. Although the former struggles to resist the shocks of major emergencies, it can be effectively restored and adjusted by adopting appropriate emergency response mechanisms, while the latter lacks effective emergency measures, making it more difficult to restore and adjust the tourism economy [76].

4.2.3. Temporal Evolution of Tourism Economic Resilience

According to the resistance and recoverability of the tourism economy, provinces in China were divided into the following four types of tourism economy resilience regions (Figure 6a–d). Overall, the resilience of China’s tourism economy varied greatly during the study period. Significant differences in tourism economic resistance and recoverability in different contraction–recovery cycles could be observed, from a centralized to discrete pattern, and from the fragile type to the self-reliant one. These findings indicate that the economic resilience of tourism in China has improved in stages over the past two decades, with stronger resistance to shocks from external crises and a stronger ability to recover.
Specifically, during the first contraction–recovery period from 2002 to 2007, the resistance and recoverability of most parts of the country were lower than the resilience baseline, showing fragile characteristics. There are two main reasons. First, the early inbound tourism economy is smaller in scale and more vulnerable to serious recession and landslide when exposed to major emergencies. Second, the sudden public health event represented by SARS devastated the tourism industry, requiring a longer time period to fully restore tourists’ confidence in visiting. However, in general, the absolute value of resilience index in this stage was greater than that of resistance index, indicating that the recovery rate of China’s tourism economy in the shocks in this phase rose significantly more than the contraction of the decline, and the economic resilience rebounded faster. In the two contraction–recovery cycles from 2007 to 2019, resistance and recoverability began to spread upwards towards the self-reliant and robust types of tourism economic resilience. The majority of provinces were self-reliant types, indicating that most provinces failed to form strong resistance in the face of the shocks of major emergencies and were susceptible to fluctuations caused by crisis events and lacked resistance shaping. However, after taking positive emergency response measures, the tourism economy could quickly return to its original development trajectory and even usher in development opportunities, and major emergencies not only do not weaken the potential momentum of tourism economic operation but also re-energize the tourism economy for sustained growth. Among them, during the contraction–recovery cycle from 2007 to 2011, the shock resistance of most provinces in China was between zero and resilience baseline. However, in the subsequent expansion period, they showed strong recovery and development ability, reflecting that the international financial crisis had a great but balanced impact on China’s tourism economy in this stage. It also verified that the precise and effective national macro-control can significantly inhibit the recession effect. The strong resilience of some western regions may be caused by the indirection and lag of the impact of the international financial crisis on western regions, which is particularly obvious in the subsequent contraction-recovery cycle.

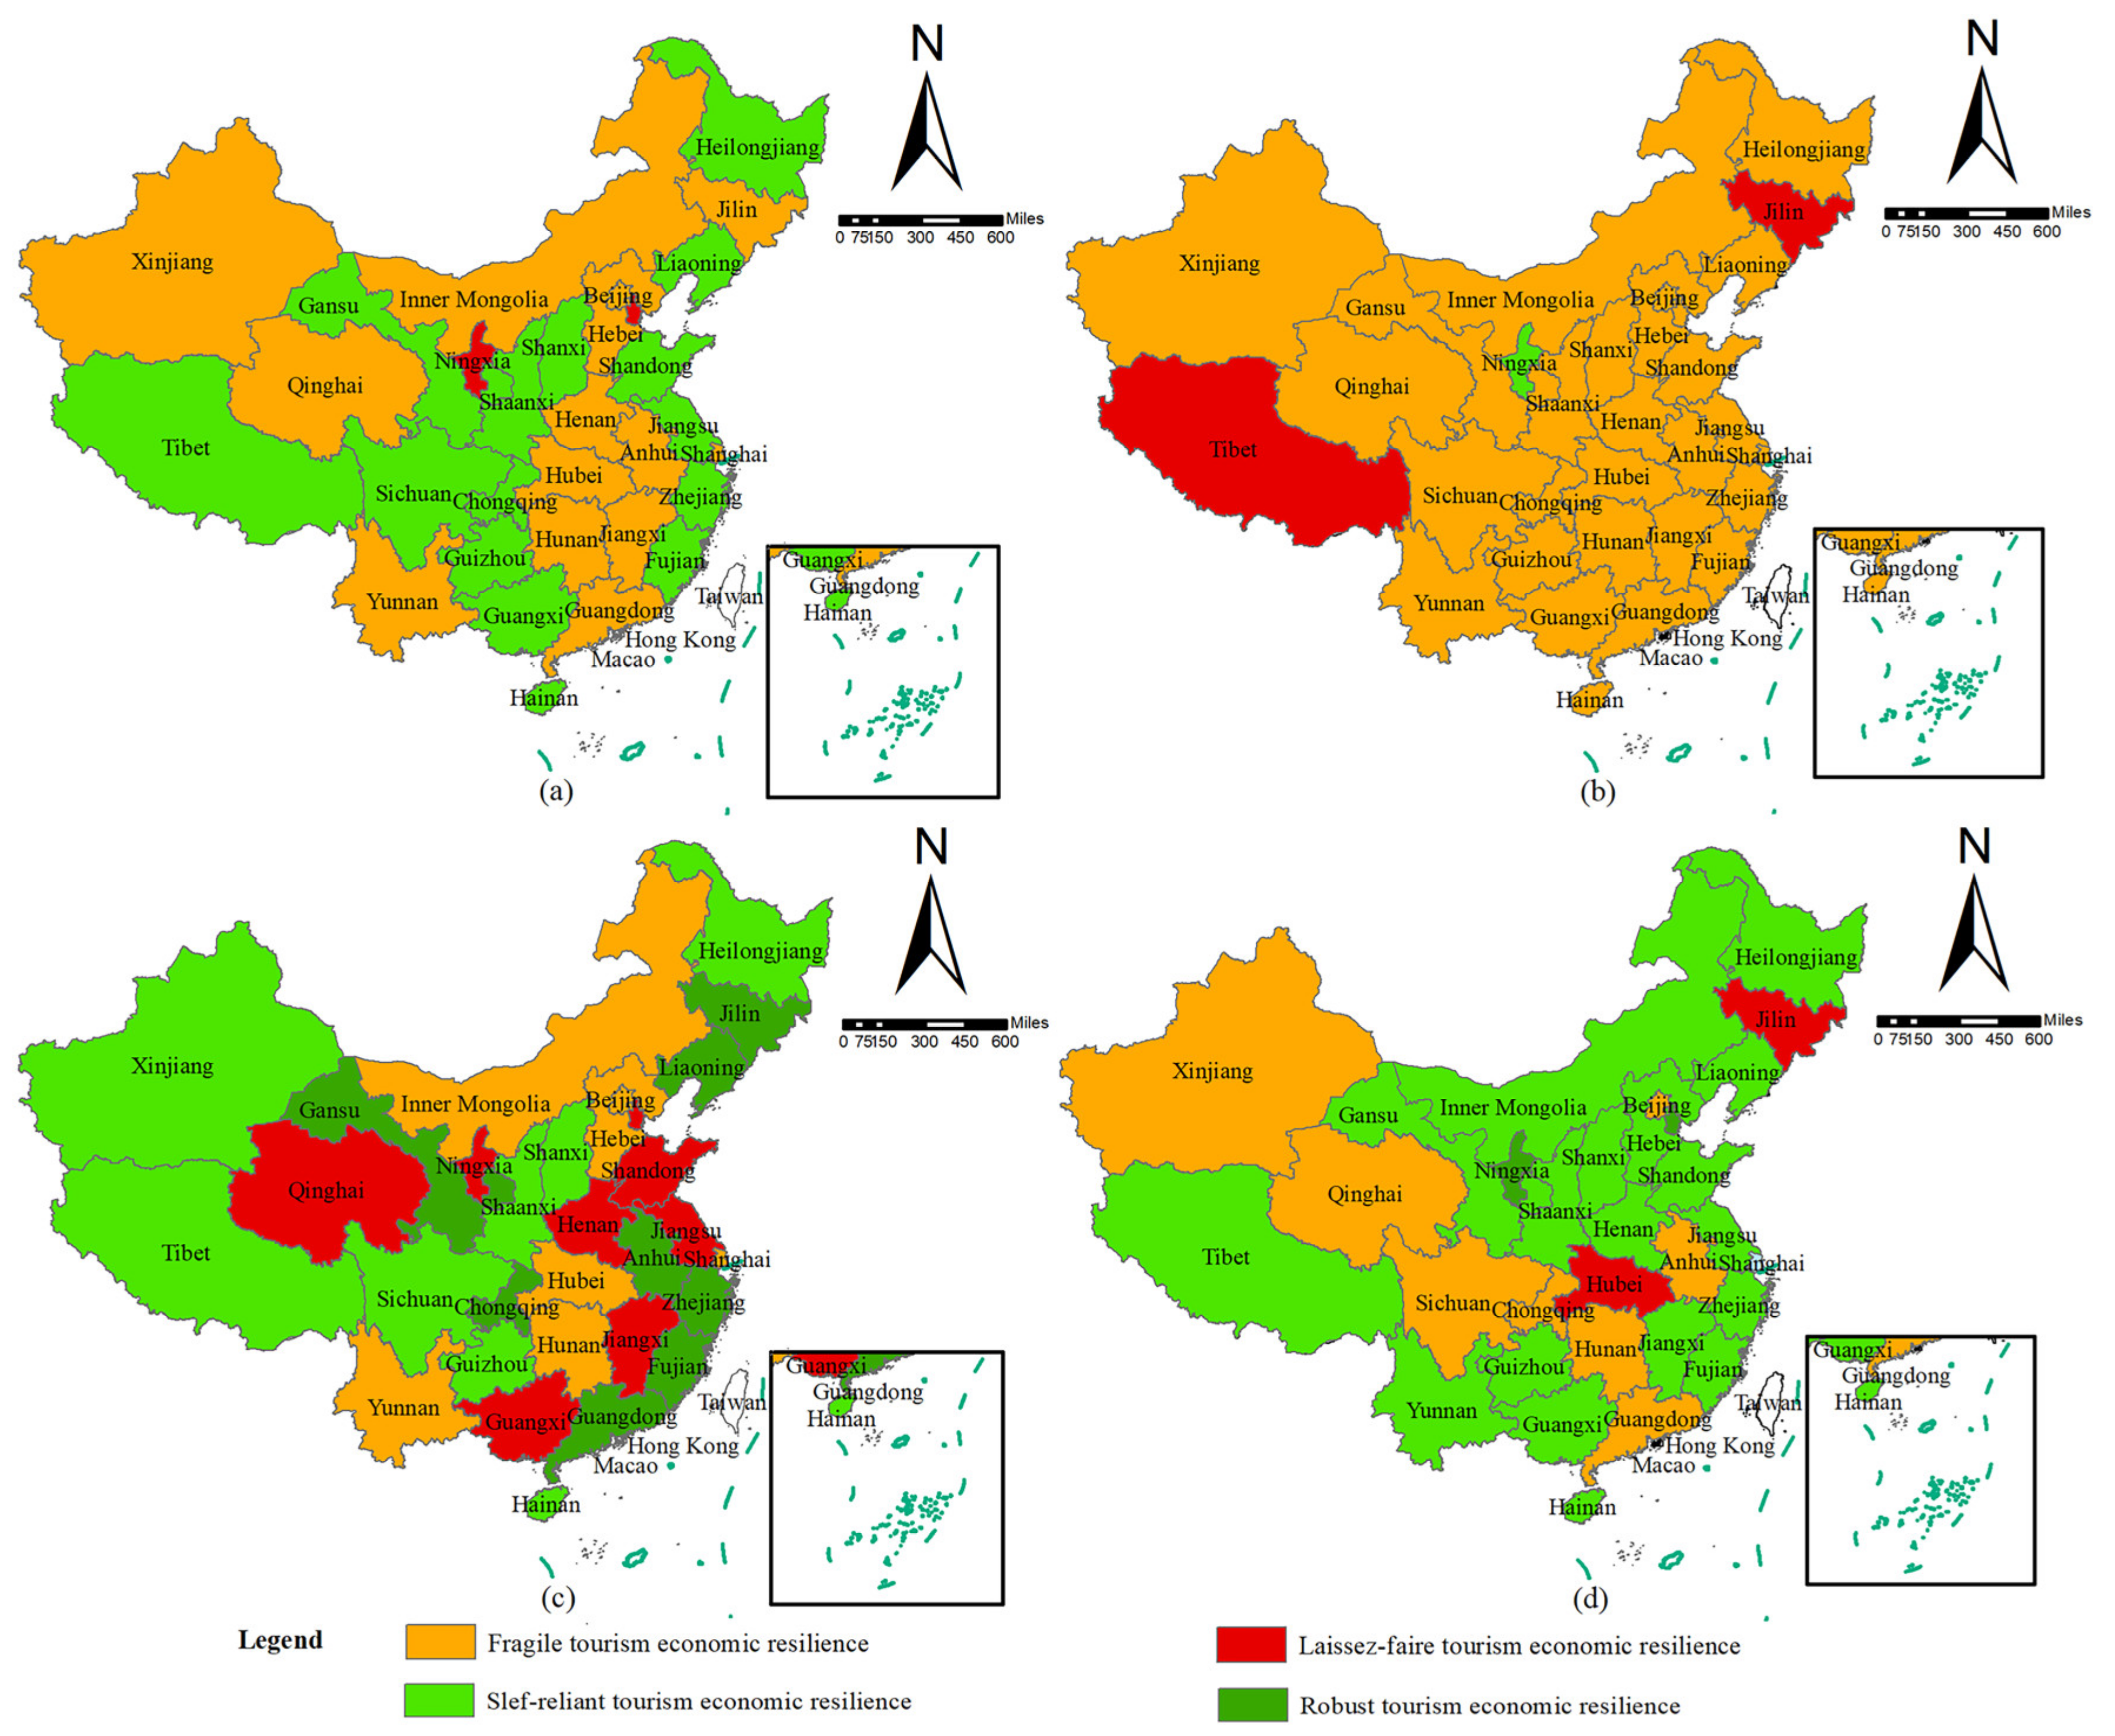
4.2.4. Spatial Differences in Tourism Economic Resilience

To reveal the spatial pattern and evolution trend in the economic resilience of tourism in China, three contraction–recovery cycles and their average values of 31 provincial administrative regions in mainland China over the past 20 years were visualized and analyzed (Figure 7). On the whole, China’s tourism economy resilience type areas were mainly developed in agglomeration and contiguous, with obvious regional distribution characteristics. There were only eight robust type regions, with distinct differences among them. Chongqing, Guangdong, Fujian, Anhui, and other provinces mainly benefit from their good coordination and promotion ability and socioeconomic development foundation, which enables them to quickly adjust their tourism development strategies during the shocks of crisis events and form a development pattern that takes into account both resistance and recoverability. Qinghai, Ningxia, Jilin, Liaoning, and other provinces are mainly affected by the marginalization of their geographical locations, making them less affected and more vigorous in recovery. Second, self-reliant tourism economic resilience areas were dominant, mainly distributed in the western border and eastern coastal areas, with obvious edge encirclement characteristics. Among them, Tibet, Heilongjiang, and other provinces had relatively stable development, while the rest of the provinces were between self-reliant and fragile types. If the resilient region of a self-reliant tourism economy lacks insight or response sensitivity to the shocks of major emergencies, it is easy to make its economic development difficult to recover and adjust quickly, and ultimately turning to the fragile type. Thirdly, the Laissez-faire type was scattered, and these regions oscillated back and forth among the four tourism economic resilience types. On the one hand, they may be affected by major emergencies and fluctuate greatly. On the other hand, they may lack effective emergency measures, leading to increased difficulty in the recovery and adjustment of the tourism economy. This also shows that the development of the tourism economic resilience is a dynamic evolution and complex adjustment. Only by fully maintaining the sensitivity to the shocks of the crisis can we always maintain a good development trend. Finally, fragile-tourism-economic-resilience areas always exist but gradually decrease over time, showing a trend of continuous optimization. Most areas have changed between self-reliant and fragile types, which fully shows that regions should establish a sense of crisis and continuously improve the ability to adjust and respond.

4.3. Influencing Factor Detection

4.3.1. Indicator Selection

The tourism economic system is a complex adaptive system. Tourism economic resilience in the face of major emergencies is affected by many factors, which jointly affect the resistance, recoverability, and adaptability of the regional tourism industry to external disturbances. Cochrane et al., (2010) argue that tourism system resilience is influenced by three basic elements of market power, cohesion, and leadership [77], emphasizing the importance of markets, governments, and various stakeholders. Martin (2015) classifies the factors affecting regional economic resilience into three types of constituent, common, and environmental factors [17], highlighting the importance of industrial structure, government management, and ecological environment. To reflect the scientific and innovative selection of indicators, this study drew on the above viewpoints and combined the status quo of tourism economic development to determine the factors affecting the tourism economic resilience. On the premise of passing the significance test, this study finally assumed that the main indicators affecting the tourism economic resilience were as follows. (1) Tourism market scale (X1): the scale advantage possessed by the region is the basis for resisting external disturbances and recovering quickly [78], using total tourism arrivals as the descriptive indicator. (2) Regional economic strength (X2): regional economic strength reflects the essential factors support capability that a region can provide for the development of tourism. The difference in economic resilience between regions is often related to the level of regional economic development [79,80]. The indicators were selected as per capita GDP and location conditions [58], in which the location conditions were drawn from the research of Tan et al., (2020), with a regional division method to characterize the assignments [81]. (3) Tourism industry structure (X3): industrial structure optimization is a key factor influencing regional economic resilience [69]. Starting from the four aspects of technology structure, employment structure, tourist source structure, and consumption structure, the contribution of tourism income per tourism employee, the proportion of tourism employment to total employment, the proportion of inbound tourism trips to total tourism trips, and the resident tourism consumption index are measured. (4) Ecological environment quality (X4): the ecological environment quality is highly correlated with the development of tourism economy, and is measured by forest coverage rate and per capita park green area. (5) Technological innovation level (X5): scientific and technological innovation has forged the tourism economy system resilience and provides development momentum for tourism economy [36,82]. The total import and export of high technology industry and main business income of high-tech industry are selected as indicators to measure. (6) Government management capacity (X6): government management capacity is an important guarantee for tourism economic development to obtain relief [83], and this study chooses per capita local fiscal expenditure and per capita total fixed asset investment to reflect government relief capacity. (7) Tourism reception capacity (X7): the strength of tourism reception capacity reflects the ability of a region to deal with emergencies, and the number of star hotels and total number of travel agencies are selected as the indicators.

4.3.2. Detection Results of Influencing Factors

Based on the hypothesis of the indicator selection mentioned above, this study used geographical detectors to analyze the influencing factors of tourism economic resilience. First, the K-means clustering method was introduced to classify the continuous detection factors. Secondly, the factor detector was used to quantitatively measure the explanatory power q value of each detection factor on tourism economic resistance and recoverability (Table 3). Currently, there is no unified standard for the change in q value, and requirements are varied in different disciplines [72]. Drawing on the research of Ma et al. (2021) [84], this study divided q∈[0.5,1] into the core influencing factor with strong effect, q∈[0.4,0.5) into the important influencing factor with a relatively strong effect, and q∈[0,0.4) into the general influencing factor with a weak effect.
From the perspective of resistance, the explanatory power of the ecological environment quality (0.634), technological innovation level (0.611), and tourism industry structure (0.505) were significantly higher than other influencing factors, becoming the core influencing factors. Among them, the explanatory power of ecological environment quality was the strongest, indicating that the stability of ecological system can provide natural barriers for tourism destinations, and is often better able to digest and resist the adverse effects of natural disasters and other shocks. Therefore, China’s tourism economic development should adhere to the principle of “ecological priority, green development”, reduce resource consumption and environmental damage in the process of tourism development, and vigorously advocate sustainable development models such as eco-tourism to enhance the resistance of tourism economic resilience.
From the perspective of recoverability, the government management capability (0.543) and technological innovation capability (0.527) had significant explanations and became the core influencing factors. It indicated that the improvement in the government management capability and technological innovation level was conducive to the tourism industry to actively respond to various challenges, to create a favorable environment and sufficient space for boosting the tourism economy and maintain the vitality of the tourism economy. Among them, government management ability, as the core factor with the strongest explanatory power, played an indispensable key role in promoting the adjustment and recovery of regional tourism economy and was the leading force to maintain the normal operation of tourism economy. Therefore, after a major emergency, the government should actively deploy to promote tourism confidence, tourism image, and tourism market recovery through scientific and effective management and organizational capabilities.
From the average value, the explanatory power of all factors was ranked as follows: technological innovation level > ecological environment quality > government management capacity> tourism industry structure > tourism reception capacity > tourism market scale > regional economic strength. It can be seen that the level of technological innovation can explain 57% of tourism economic resilience, the strength of which is the key to a region’s resistance and recoverability. Therefore, the Internet, big data, artificial intelligence, virtual reality technology [85], and other technological innovations to empower tourism can bring new momentum to tourism economic growth.
Additionally, although individual variables such as the regional economic strength, tourism market scale, and tourism reception capacity were weak in explaining tourism economic resilience and did not have any decisive role, they were also an indispensable part of tourism economic development and were crucial to withstand unexpected events and promote tourism economic recovery. In particular, the tourism economy scale laid a material foundation for tourism economic resilience. Undoubtedly, China has the largest tourism market in the world, and its strong domestic market guarantees the self-recycling ability of the tourism economy, which is the key to the tourism industry’s resilience to risks and post-disaster recovery. Facing the fact that the uncertainty of the external environment has increased, firmly grasping the domestic tourism market is not only needed to accelerate the construction of a new development pattern with the domestic cycle as the main body and the domestic and international dual cycles promoting each other at the macro level but also in line with the characteristics of the tourism market itself.
To further explore whether the combination of the influencing factors has an impact on the tourism economic resilience, the intensity of the pairwise interaction between the influencing factors was tested by means of interaction detection. Referring to the classification method in Table 1, the factor interactions were divided into five types. The results showed that the interaction of influencing factors would enhance the interpretation of tourism economic resilience, indicating that under the impact of major emergencies, tourism economic resilience will not only be affected by a single factor but also by the joint effect of multiple factors. It was mainly manifested as dual-factor enhancement and nonlinear enhancement. Among them, the effect intensity of nonlinear enhancement was significantly higher than that of dual-factor enhancement, and the dominant interaction of different dimensions was different. This study focused on the statistics and analysis of the top 10 interaction modes of resistance and recoverability explanatory power (Table 4).
From the dimension of resistance, the interactions between the ecological environment quality and other factors all showed an enhancement effect, which was a significant control factor in this dimension, with an explanatory power higher than 90%. Among them, the interaction between ecological environment quality and regional economic strength (0.986) changed the most significantly. The explanatory power of regional economic strength increased from 24% to 99%, indicating that the coordinated development of ecological environment and regional economy is the cornerstone of the tourism industry resisting major emergencies, and the interaction of environmental protection and economic development overlap to play the greatest role. In addition, the interaction results of the tourism industry structure and other factors also showed a significant enhancement effect, indicating that the superposition between the tourism industry structure and other factors can enhance the explanation of single-factor variables on tourism economic resistance. To give full play to the positive effects of the tourism industry structure, the optimization of the tourism industry structure should be promoted, which is the key port to enhance tourism economic resistance and also fits the inherent requirement of high-quality economic development.
From the dimension of recoverability, nonlinear enhancement was dominant, and the interaction and superposition of the tourism industry structure and other single factors were the most significant. The interaction contribution rates were all above 89%, which was the core controlling factor affecting the tourism economic resilience. Among them, the interaction between the tourism industry structure and government management ability (0.992) ranked first, again verifying the importance of structural adjustment and government management. Government management was the inexhaustible driving force leading the reform and innovation of China’s tourism industry. When uncertain short-term shocks occur, it can effectively alleviate the trend spread of the short-term shocks of tourism economy and block the spillover effect of risks across the system. Thereby, it can promote the steady progress of the structural transformation and upgrade of tourism industry to seek a better development path. Moreover, after the interaction of the tourism reception capacity with other factors, the explanatory strength changed the most, leaping from 27% to more than 92%, indicating that the development of the regional tourism reception capacity often needs to rely on other factors to exert its maximum effect.

5. Discussion

5.1. Explanation of Findings

Since the 21st century, the status and role of the tourism economy has become increasingly important. Considering the influence of natural, social, economic, political, and other factors, it has brought huge challenges and uncertainties to the development of the tourism economy. However, China’s tourism economy has shown a certain resilience and self-healing ability under the impact of several major emergencies. Therefore, it is of great theoretical and practical significance to objectively identify the tourism economic resilience. Based on Chinese provincial data from 2000 to 2019, this study delineated the contraction–recovery cycle of China’s tourism economy, on the basis of which the tourism economic resilience was evaluated in two dimensions of resistance and recoverability and the influencing factors were analyzed. The results showed that: (1) Based on the baseline of resistance = −0.361 and recoverability = 0.342, the tourism economic resilience could be divided into four types: robust, self-reliant, laissez-faire, and fragile. (2) In terms of temporal evolution, the resistance and recoverability of the different contraction–recovery cycles of China’s tourism economic resilience were significantly differentiated but improved in stages, constantly shifting from a concentrated to a discrete pattern and from a fragile to a self-reliant type. (3) From the spatial analysis, China’s tourism economic resilience type areas were mainly clustered and contiguous development, with obvious zonal distribution characteristics. The self-reliant tourism economic resilience areas dominated, but most provinces shifted back and forth between self-reliant and fragile types, without forming a stable tourism economic resilience. (4) In terms of influencing factors, the technological innovation level, ecological environment quality, government management ability, and tourism industry structure played a significant role in tourism economic resilience. Among them, the comprehensive explanation strength of the technological innovation level on the tourism economic resilience was 57%, which was a key factor affecting the recoverability and resistance of a region. In the interaction detection analysis, the interaction of combination factors could enhance the explanatory power of tourism economic resilience, in which ecological environment quality and tourism industry structure were the core controlling factors under the interaction. The tourism reception capacity had the largest increase in explanatory power after the interaction.

5.2. Policy Implications

Based on the above research conclusions, this study proposes the following policy implications. First, it is necessary to synergistically integrate resistance and recoverability, both of which are effective ways for the tourism economy to respond to external disturbances. In the process of shaping the resilience of the tourism economy, we must not just focus on recoverability while ignoring resistance. The resilience of the regional tourism economy should be assessed in relation to the types of tourism economic resilience, and the resistance shaping and recoverability enhancement should be organically combined to form a robust tourism economic resilience. Second, it is necessary to coordinate the development of regional tourism economic resilience. Regions should not only make up the shortcomings according to the resilience type but also strengthen regional cooperation through mutual supply of tourists, information sharing, integration, and other ways to enhance the spatial relevance of tourism economy. In this way, they can realize complementary advantages and improve the overall resilience level of the region. Additionally, it is necessary to continuously enhance the intrinsic dynamics of China’s tourism economic resilience, including promoting the digital transformation and green development of the tourism industry, improving the government’s tourism governance capabilities, and optimizing the tourism industry structure. In the face of the increasingly complicated external environment, this can be achieved through the adoption of a series of effective measures to improve the toughness of the tourism industry. In the face of an increasingly complex external environment, the resilience of the tourism industry has been continuously enhanced through the adoption of a series of effective measures.

5.3. Limitations and Future Prospects

The contribution of this study is mainly reflected in the following two aspects. First, it enriches the economic resilience theory, extends the resilience theory to the field of tourism economy, and constructs an evaluation method of tourism economic resilience under external shocks. Second, it expands the micro perspective of traditional community tourism resilience to the macro perspective of tourism economic resilience. Additionally, it systematically analyzes the influencing factors of tourism economic resilience from two dimensions—resistance and recoverability—which have important guiding significance for the high-quality development of the tourism economy in the new era. Meanwhile, two shortcomings can also be observed in this study. One is that, in the process of evaluating the tourism economic resilience under the shocks of major emergencies, the types of emergencies are not strictly distinguished. Moreover, the size of the tourism economic resilience and its influencing factors under the impact of different types of emergencies may be explored in the future, or similar emergencies may be selected for comparative analysis of tourism economic resilience. Second, tourism economic resilience is subject to the comprehensive effect of many factors. However, due to the limitation of data acquisition, this study only researched the influencing factors from seven aspects. In the future, the influence of other related factors on tourism economic resilience can be further explored.

Author Contributions

Conceptualization, P.Z. and Y.H.; methodology, P.Z. and Y.H.; software, P.Z. and Y.H.; validation, W.C. and S.P.; formal analysis, W.C. and S.P.; resources, P.Z. and Y.H.; data curation, M.Z. and Y.H.; writing—original draft preparation, H.Z. and N.X.; writing—review and editing, W.C. and S.P. All authors have read and agreed to the published version of the manuscript.

Funding

This research was funded by the National Social Science Fund of China, Grant number 20CJY049. The project was also supported by Scientific research fund project of Yunnan Provincial Department of Education (2021Y139).

Institutional Review Board Statement

Not applicable.

Informed Consent Statement

Not applicable.

Data Availability Statement

The datasets used in this research are available upon request.

Acknowledgments

We thank all the participants involved in the projects for their contribution in our research data.

Conflicts of Interest

The authors declare no conflict of interest. The funders had no role in the design of the study; in the collection, analyses, or interpretation of data; in the writing of the manuscript; or in the decision to publish the results.

References

  1. Singh, S. ‘Quixotic’ tourism? Safety, ease, and heritage in post-COVID world tourism. J. Herit. Tour. 2020, 16, 716–721. [Google Scholar] [CrossRef]
  2. Gössling, S.; Scott, D.; Hall, C.M. Pandemics, tourism and global change: A rapid assessment of COVID-19. J. Sustain. Tour. 2020, 29, 1–20. [Google Scholar] [CrossRef]
  3. World Tourism Cities Federation. World Tourism Economic Trends Report. Available online: http://media.wtcf.org.cn/M00/02/5B/-rBFBuGIlfdOALaUGAFgS0N2EI7c480.pdf (accessed on 2 March 2022).
  4. Jin, X.; Qu, M.Y.; Bao, J.G. Impact of crisis events on Chinese outbound tourist flow: A framework for post-events growth. Tour. Manag. 2019, 74, 334–344. [Google Scholar] [CrossRef] [PubMed]
  5. Watson, P.; Deller, S. Tourism and economic resilience. Tour. Econ. 2021, 28, 5. [Google Scholar] [CrossRef]
  6. Xie, W.; Rose, A.; Li, S.T.; He, J.W. Dynamic economic resilience and economic recovery from disasters: A quantitative assessment. Risk Anal. 2018, 38, 1306–1318. [Google Scholar] [CrossRef]
  7. Pascariu, G.C.; Ibănescu, B.-C.; Nijkamp, P.; Kourtit, K. Tourism and Economic Resilience: Implications for Regional Policies; Springer: Singapore, 2021. [Google Scholar]
  8. Betts, T.; Buzzanell, P.M. Enacting economic resilience: A synthesis of economic and communication frameworks. J. Risk Financ. Manag. 2022, 15, 178. [Google Scholar] [CrossRef]
  9. Holling, C.S. Resilience and stability of ecological systems. Annu. Rev. Ecol. Syst. 1973, 4, 1–23. [Google Scholar] [CrossRef]
  10. Folke, C. Resilience: The emergence of a perspective for social-ecological systems analyses. Glob. Environ. Chang. 2006, 16, 253–267. [Google Scholar] [CrossRef]
  11. Tobias, L.; Romano, W. Assessing and planning resilience in tourism. Tour. Manag. 2014, 44, 161–163. [Google Scholar]
  12. Reggiani, A.; Graaff, T.D.; Nijkamp, P. Resilience: An evolutionary approach to spatial economic systems. Netw. Spat. Econ. 2002, 2, 211–229. [Google Scholar] [CrossRef]
  13. Pike, A.; Dawley, S.; Tomaney, J. Resilience, adaptation and adaptability. Camb. J. Reg. Econ. Soc. 2010, 3, 59–70. [Google Scholar] [CrossRef]
  14. Simmie, J.; Martin, R. The economic resilience of regions: Towards an evolutionary approach. Camb. J. Reg. Econ. Soc. 2010, 3, 27–43. [Google Scholar] [CrossRef]
  15. Boschma, R. Towards an evolutionary perspective on regional resilience. Reg. Stud. 2015, 49, 733–751. [Google Scholar] [CrossRef]
  16. Shaw, K.; Maythorne, L. Managing for local resilience: Towards a strategic approach. Public Policy Admin. 2013, 28, 43–65. [Google Scholar] [CrossRef]
  17. Martin, R.; Sunley, P.; Tyler, P. Local growth evolutions: Recession, resilience and recovery. Camb. J. Reg. Econ. Soc. 2015, 8, 141–148. [Google Scholar] [CrossRef]
  18. Davies, S. Regional resilience in the 2008–2010 downturn: Comparative evidence from European countries. Camb. J. Reg. Econ. Soc. 2011, 4, 369–382. [Google Scholar] [CrossRef]
  19. Yu, H.C.; Liu, Y.; Liu, C.L.; Fan, F. Spatiotemporal Variation and Inequality in China’s Economic Resilience across Cities and Urban Agglomerations. Sustainability 2019, 10, 4754. [Google Scholar] [CrossRef]
  20. Tan, J.T.; Zhang, P.Y.; Lo, K.; Li, J.; Liu, S.W. Conceptualizing and measuring economic resilience of resource-based cities: Case study of Northeast China. Chin. Geogr. Sci. 2017, 27, 471–481. [Google Scholar] [CrossRef]
  21. Liu, Y.; Ji, J.; Zhang, Y.; Yang, Y. Economic resilience and spatial divergence in the Guangdong-Hong Kong-Macao Greater Bay Area in China. Geogr. Res. 2020, 39, 2029–2043. [Google Scholar]
  22. Briguglio, L.; Cordina, G.; Farrugia, N.; Vella, S. Economic vulnerability and resilience: Concepts and measurements. Oxf. Dev. Stud. 2009, 37, 229–247. [Google Scholar] [CrossRef]
  23. Wang, W.L.; Wang, J.L.; Wulaer, S.; Chen, B.; Yang, X.D. The effect of innovative entrepreneurial vitality on economic resilience based on a spatial perspective: Economic policy uncertainty as a moderating variable. Sustainability 2021, 13, 10677. [Google Scholar] [CrossRef]
  24. Brakman, S.; Garretsen, H.; Van Marrewijk, C. Regional resilience across Europe: On urbanization and the initial impact of the Great Recession. Camb. J. Reg. Econ. Soc. 2015, 2, 309–312. [Google Scholar] [CrossRef] [Green Version]
  25. Cellini, R.; Torrisi, G. Regional resilience in Italy: A very long-run analysis. Reg. Stud. 2014, 48, 1779–1796. [Google Scholar] [CrossRef]
  26. Martin, R.; Sunley, P.; Gardiner, B.; Tyler, P. How regions react to recessions: Resilience and the role of economic structure. Reg. Stud. 2016, 50, 561–585. [Google Scholar] [CrossRef]
  27. Nystrom, K. Regional resilience to displacements. Reg. Stud. 2017, 52, 1–19. [Google Scholar] [CrossRef]
  28. Doran, J.; Fingleton, B. Us metropolitan area resilience: Insights from dynamic spatial panel estimation. Environ. Plan. A 2018, 50, 111–132. [Google Scholar] [CrossRef]
  29. Klimanov, V.V.; Kazakova, S.M.; Mikhaylova, A.A. Regional resilience: Theoretical basics of the question. Ekon. Polit. 2019, 13, 164–187. [Google Scholar]
  30. Pendall, R.; Foster, K.A.; Cowell, M. Resilience and regions: Building understanding of the metaphor. Camb. J. Reg. Econ. Soc. 2010, 3, 71–84. [Google Scholar] [CrossRef]
  31. Di Caro, P.; Fratesi, U. Regional determinants of economic resilience. Ann. Reg. Sci. 2018, 60, 235–240. [Google Scholar] [CrossRef]
  32. Courvisanos, J.; Jain, A.; Marcdaneh, K.K. Economic resilience of regions under crises: A study of the Australian economy. Reg. Stud. 2015, 50, 1–15. [Google Scholar] [CrossRef]
  33. Blland, P.A.; Rigby, D.; Boschma, R. The technological resilience of US cities. Camb. J. Reg. Econ. Soc. 2015, 8, 167–184. [Google Scholar] [CrossRef]
  34. Capello, R.; Caragliu, A.; Fratesiu, U. Spatial heterogeneity in the costs of the economic crisis in Europe: Are cites sources of regional resilience? J. Econ. Geogr. 2015, 15, 951–983. [Google Scholar] [CrossRef]
  35. Senser, A.M.; Gilian, B.; Adrian, H. Measuring regional economic resilience across Europe: Operationalizing a complex concept. Spat. Econ. Anal. 2016, 11, 128–151. [Google Scholar] [CrossRef]
  36. Sharma, G.D.; Thomas, A.; Paul, J. Reviving tourism industry post-COVID-19: A resilience-based framework. Tour. Manag. Perspect. 2021, 37, 100786. [Google Scholar] [CrossRef] [PubMed]
  37. World Tourism Organization. International Tourism Numbers Could Fall 60–80% in 2020. Available online: https://www.unwto.org/news/covid-19-international-tourist-numbers-could-fall-60-80-in-2020 (accessed on 7 May 2020).
  38. Espiner, S.; Orchiston, C.; Higham, J. Resilience and sustainability: A complementary relationship? Towards a practical conceptual model for the sustainability-resilience nexus in tourism. J. Sustain. Tour. 2017, 25, 385–1400. [Google Scholar]
  39. Farrell, B.; Twining-Ward, L. Seven steps towards sustainability: Tourism in the context of new knowledge. Sustainability 2005, 13, 109–122. [Google Scholar] [CrossRef]
  40. Prayag, G. Symbiotc relationship or not? Understanding resilience and crisis management in tourism. J. Tour. Manag. Perspect. 2018, 25, 133–145. [Google Scholar]
  41. Lew, A.A. Scale, change and resilience in community tourism planning. Tour. Geogr. 2014, 16, 14–22. [Google Scholar] [CrossRef]
  42. Linnenluecke, M.K. Resilience in Business and Management Research: A Review of Influential Publications and a Research Agenda. Int. J. Manag. Rev. 2017, 19, 4–30. [Google Scholar] [CrossRef]
  43. Tan, J.T.; Lo, K.; Qiu, F.D.; Zhang, X.L.; Zhao, H.B. Regional economic resilience of resource-based cities and influential factors during economic crises in China. Growth Chang. 2020, 51, 362–381. [Google Scholar] [CrossRef]
  44. Wang, T.; Yang, Z.P.; Chen, X.D.; Han, F. Bibliometric analysis and literature review of tourism destination resilience research. Int. J. Environ. Res. Public Health 2022, 19, 5562. [Google Scholar] [CrossRef]
  45. Roberto, C.; Tiziana, C. The economic resilience of tourism industry in Italy: What the ‘great recession’ data show. Tour. Manag. Perspect. 2015, 16, 346–356. [Google Scholar]
  46. Sheppard, V.A.; Williams, P.W. Factors that strengthen tourism resort resilience. J. Hosp. Tour. Manag. 2016, 28, 20–30. [Google Scholar] [CrossRef]
  47. King, C.; Iba, W.; Clifton, J. Reimagining resilience: COVID-19 and marine tourism in Indonesia. Curr. Issues Tour. 2021, 24, 2784–2800. [Google Scholar] [CrossRef]
  48. Stefan, H. Towards adaptive tourism areas? A complexity perspective to examine the conditions for adaptive capacity. J. Sustain. Tour. 2016, 24, 299–314. [Google Scholar]
  49. Yang, E.J.; Kim, J.; Pennington-Gray, L.; Ash, K. Does tourism matter in measuring community resilience? Ann. Tour. Res. 2021, 89, 103222. [Google Scholar] [CrossRef]
  50. Schmude, J.; Zavareh, S.; Schwaiger, K.M.; Karl, M. Micro-level assessment of regional and local disaster impacts in tourist destinations. Tour. Geogr. 2018, 20, 290–308. [Google Scholar] [CrossRef]
  51. Strickland-Munro, J.; Moore, S. Exploring the impacts of protected area tourism on local communities using a resilience approach. Koedoe 2014, 56, 1–10. [Google Scholar] [CrossRef]
  52. Wakil, M.A.; Sun, Y.; Chan, E.H.W. Co-flourishing: Intertwining community resilience and tourism development in destination communities. Tour. Manag. Perspect. 2021, 38, 100803. [Google Scholar] [CrossRef]
  53. Tsai, C.H.; Wu, T.C.; Wall, G. Perceptions of tourism impacts and community resilience to natural disasters. Tour. Geogr. 2016, 18, 152–173. [Google Scholar] [CrossRef]
  54. Yang, X.P.; Zhang, D.C.; Liu, L.L.; Niu, J.; Zhang, X.B. Development trajectory for the temporal and spatial evolution of the resilience of regional tourism environmental systems in 14 cities of Gansu Province, China. Environ. Sci. Pollut. Res. 2021, 28, 65094–65115. [Google Scholar] [CrossRef] [PubMed]
  55. Ruiz-Ballesteros, E.; Tejedor, A.D. Community-based tourism as a factor in socio-ecological resilience. economic diversification and community participation in Floreana (Galapagos). Sustainability 2020, 12, 4724. [Google Scholar] [CrossRef]
  56. Li, C.; Jun, Z. ls tourism development a catalyst of economic recovery following natural disaster? An analysis of economic resilience and spatial variability. Curr. Issues Tour. 2020, 23, 2602–2623. [Google Scholar]
  57. Cui, W.J.; Chen, J.; Xue, T.; Shen, H. The economic resilience cycle evolution and spatial-temporal difference of tourism industry in Guangdong-Hong Kong-Macao Greater Bay Area from 2000 to 2019. Sustainability 2021, 13, 12092. [Google Scholar] [CrossRef]
  58. Hu, H.S.; Qiao, X.Z.; Yang, Y.; Zhang, L. Developing a resilience evaluation index for cultural heritage site: Case study of Jiangwan Town in China. Asia Pac. J. Tour. Res. 2021, 26, 15–29. [Google Scholar] [CrossRef]
  59. Dai, S.S.; Xu, H.G.; Chen, F.F. A hierarchical measurement model of perceived resilience of urban tourism destination. Soc. Indic. Res. 2019, 145, 777–804. [Google Scholar] [CrossRef]
  60. Linderova, I.; Scholz, P.; Almeida, N. Attitudes of local population towards the impacts of tourism development: Evidence from Czechia. Front. Psychol. 2021, 12, 684773. [Google Scholar] [CrossRef]
  61. Partanen, M. Social innovations for resilience-local tourism actor perspectives in Kemi, Finland. Tour. Plan. Dev. 2021. [Google Scholar] [CrossRef]
  62. Leon, C.J.; Giannakis, E.; Zittis, G.; Serghides, D.; Lam-Gonzalez, Y.E.; Garcia, C. Tourists’ preferences for adaptation measures to build climate resilience at coastal destinations. evidence from Cyprus. Tour. Plan. Dev. 2021. [Google Scholar] [CrossRef]
  63. Tsao, C.Y.; Ni, C.C. Vulnerability, resilience, and the adaptive cycle in a crisis-prone tourism community. Tour. Geogr. 2016, 18, 80–105. [Google Scholar] [CrossRef]
  64. Bui, P.T.B.; Ngo, T.P.Q. Factors impacting on tourism resilience during the COVID-19 pandemic: An empirical study from Vietnam. J. Asian Financ. Econ. Bus. 2022, 9, 213–218. [Google Scholar]
  65. Wang, Q.; Zhao, L.; Yu, W.; Li, J.; Wang, L.F. Spatial-Temporal evolution characteristics and influencing factors of resilience of tourism economic system in China. Geog. Geo-Inf. Sci. 2020, 36, 113–118. (In Chinese) [Google Scholar]
  66. Zhu, Y.Q.; Wang, Y.; Liu, T.X.; Sui, Q. Assessing macroeconomic recovery after a natural hazard based on ARIMA-a case study of the 2008 Wenchuan earthquake in China. Nat. Hazards 2018, 91, 1025–1038. [Google Scholar] [CrossRef]
  67. Xie, W.; Deng, Z.; Yang, X. ARIMA Model Based Residual Quantity Predicted Commodity Code Registration Method, Involves Utilizing ARIMA Model to Fit Commodity Bar Code Registration Sequence, and Judging whether Established ARIMA Model is Reasonable. China Patent CN106372960-A, 1 February 2017. [Google Scholar]
  68. Jiang, D.Y.; Wang, X.Y.; Zhao, R. Analysis on the Economic Recovery in the Post-COVID-19 Era: Evidence from China. Front. Public Health 2022, 9, 787190. [Google Scholar] [CrossRef]
  69. Li, L.G.; Zhang, P.Y.; Li, X. regional economic resilience of the old industrial bases in China: A case study of Liaoning province. Sustainability 2019, 11, 723. [Google Scholar] [CrossRef]
  70. Zhang, Y.; Zhang, J.; Wang, K.; Wu, X. An empirical perception of economic resilience responded to the COVID-19 epidemic outbreak in Beijing-Tianjin-Hebei urban agglomeration, China: Characterization and interaction. Int. J. Environ. Res. Public Health 2021, 18, 10532. [Google Scholar] [CrossRef]
  71. Zheng, L.; Ismail, K.; Meng, X.H. Freeway safety estimation using extreme value theory approaches: A comparative study. Accid. Anal. Prev. 2014, 62, 32–41. [Google Scholar] [CrossRef]
  72. Wang, J.F.; Xu, C.D. Geodetector: Principle and prospective. Acta Geogr. Sin. 2017, 72, 116–134. (In Chinese) [Google Scholar]
  73. Bao, J.G. The Impact of COVID-19: How will tourism situation in China at the post-pandemic stage? J. Glob. Chang. Data Disc. 2020, 4, 11–15. (In Chinese) [Google Scholar]
  74. Oliva, S.; Lazzereti, L. Measuring the economic resilience of natural disasters: An analysis of major earthquakes in Japan. City Cult. Soc. 2018, 15, 53–59. [Google Scholar] [CrossRef]
  75. Martin, R. Regional economic resilience, hysteresis and recessionary shocks. J. Econ. Geogr. 2012, 12, 1–32. [Google Scholar] [CrossRef]
  76. Zeng, B. Evaluation of China’s Provincial Economic Resilience Under the Impact of COVID-19 Epidemic. J. Ind. Tech. Ecol. 2021, 40, 127–133. (In Chinese) [Google Scholar]
  77. Cochrane, J. The Sphere of Tourism Resilience. Tour. Rec. Res. 2010, 35, 173–185. [Google Scholar] [CrossRef]
  78. Chistopherson, S.; Michie, J.; Tyler, P. Regional resilience: Theoretical and empirical perspectives. Camb. J. Reg. Econ. Soc. 2010, 3, 3–10. [Google Scholar] [CrossRef]
  79. Petrakos, G.; Psycharis, Y. The spatial aspects of economic crisis in Greece. Camb. J. Reg. Econ. Soc. 2015, 9, 137–152. [Google Scholar] [CrossRef]
  80. Palaskas, T.; Psycharis, Y.; Rovolis, A.; Stoforos, C. The asymmetrical impact of the economic crisis on unemployment and welfare in Greek urban economies. J. Econ. Geogr. 2015, 15, 973–1007. [Google Scholar] [CrossRef]
  81. Tan, J.T.; Zhao, H.B.; Liu, W.X. Regional economic resilience and influential mechanism during economic crises in China. Sci. Geogra. Sin. 2020, 40, 173–181. (In Chinese) [Google Scholar]
  82. Chapple, K.; Lester, T. The resilient regional labour market? The US case. Reg. Stud. 2010, 3, 85–104. [Google Scholar] [CrossRef]
  83. Eraydin, A. Attributes and characteristics of regional resilience: Defining and measuring the resilience of Turkish regions. Reg. Stud. 2016, 50, 600–614. [Google Scholar] [CrossRef]
  84. Ma, X.F.; Tan, J.X.; Huang, J. Study on the agglomeration process and influencing factors of regional tourism industry: A case of the western hunan. Tour. Trib. 2021, 36, 13–27. (In Chinese) [Google Scholar]
  85. Raju, V. Implementing flexible systems in doctoral viva defense through virtual mechanism. Glob. J. Flex. Syst. Manag. 2021, 22, 127–139. [Google Scholar] [CrossRef]
Figure 1. Domestic and inbound tourism revenue in China from 2000 to 2019. Notes: The data come from the 2000–2019 China Statistical Yearbook.
Sustainability 14 10641 g001
Figure 2. Contraction–recovery cycle of the number of tourists in China from 2000 to 2019. Notes: C represents contraction period and R represents recovery period. The data come from statistical bulletins of national economic and social development from 2000 to 2019, calculated through the ARIMA model.
Sustainability 14 10641 g002
Figure 3. Mean residual life pot and threshold stability plot of tourism economic resistance. Notes: (a) Mean residual life plot; (b) threshold stability plot. The data come from the calculation of the POT model.
Sustainability 14 10641 g003
Figure 4. Mean residual life pot and threshold stability plot of tourism economic recoverability. Notes: (a) Mean residual life plot; (b) threshold stability plot. The data come from the calculation of the POT model.
Sustainability 14 10641 g004
Figure 5. Peaks-over-threshold model test chart. Notes: (a) Resistance; (b) recoverability. The data come from the calculation of the POT model.
Sustainability 14 10641 g005
Figure 6. Contraction–recovery performance and mean trajectory of China’s tourism economy at different stages from 2000 to 2019. Notes: (a) Mean trajectory of three contraction–recovery cycles; (b) contraction–recovery cycle 2002–2007; (c) contraction–recovery cycle 2007–2011; (d) contraction–recovery cycle 2011–2019. The data are calculated from the basic model.
Sustainability 14 10641 g006
Figure 7. Spatial distribution of China’s tourism economic resilience in different contraction–recovery cycles from 2000 to 2019. Notes: (a) Contraction–recovery cycle 2000–2019; (b) contraction–recovery cycle 2002–2007; (c) contraction–recovery cycle 2007–2011; (d) contraction–recovery cycle 2011–2019. The data are calculated from the basic model.
Sustainability 14 10641 g007
Table 1. Types of interactions between influencing factors.
CriterionsFunction Types
q(X1X2) < Min(q(X1),q(X2))Non-linear attenuation
Min(q(X1)∩q(X1)) < q(X1X2) < Max(q(X1),q(X2))One-factor non-linear attenuation
q(X1X2) > Max(q(X1),q(X2))Dual-factor enhancement
q(X1X2) = q(X1) + q(X2)Independence
q(X1X2) > q(X1) + q(X2)Non-linear enhancement
Table 2. Types of tourism economic resilience.
Types of Tourism Economic ResilienceClassification CriteriaCharacteristics
RobustResistance > −0.361 and recoverability > 0.342Best state of resilience
Self-reliantResistance < −0.361 and recoverability > 0.342Good resilience, weak resistance
Laissez-faireResistance > −0.361 and recoverability<0.342Good resistance, difficult to recover and adjust
FragileResistance < −0.361 and recoverability < 0.342Worst state of resilience
Table 3. Detection results of influencing factors of China’s tourism economic resilience.
CodeInfluencing FactorsSpecific IndicatorsResistanceRecoverabilityAverage
X1Tourism market scaleTotal number of arrivals (10,000 person-times)0.2200.1700.195
X2Regional economic strengthPer capita GDP (CNY)0.2350.1000.168
Location conditions
X3Tourism industry structureContribution of tourism income per tourism employee (CNY)0.5050.3330.419
Proportion of tourism employment to total employment (%)
Proportion of inbound tourism trips to total tourism trips (%)
Resident tourism consumption index
X4Ecological environment qualityForest coverage rate (%)0.6340.4100.522
Per capita park green area (m2)
X5Technological innovation levelTotal import and export of high technology industry (USD 1 million)0.6110.5270.569
Main business income of high-tech industry (CNY 100 million)
X6Government management capacityPer capita local fiscal expenditure (CNY 100 million)0.3280.5430.436
Per capita total fixed asset investment (CNY)
X7Tourism reception capacityTotal number of star hotels0.2820.2700.276
Total number of travel agencies
Table 4. Detection results of dominant interaction of influencing factors of China’s tourism economic resilience.
DimensionResistanceRecoverability
Dominant interaction 1X1∩X4X3∩X5X1∩X3X3∩X7
q0.9730.9590.9620.973
Dominant interaction 2X2∩X3X3∩X7X2∩X3X4∩X5
q0.9950.8620.9470.970
Dominant interaction 3X2∩X4X4∩X5X3∩X4X4∩X6
q0.9890.9960.8920.968
Dominant interaction 4X2∩X6X4∩X6X3∩X5X5∩X6
q0.8890.9470.9320.936
Dominant interaction 5X3∩X4X4∩X7X3∩X6X6∩X7
q0.9790.9140.9920.924
Publisher’s Note: MDPI stays neutral with regard to jurisdictional claims in published maps and institutional affiliations.

