Article

A Study and Assessment of the Status of Energy Efficiency and Conservation at School Buildings

1
Department of Mechanical Engineering, American University of Sharjah, Sharjah 26666, United Arab Emirates
2
Vocational School of Yenişehir Ibrahim Orhan, Bursa Uludağ University, Bursa 16900, Turkey
3
Department of Mechanical Engineering, University of Jordan, Amman 11492, Jordan
*
Author to whom correspondence should be addressed.
Sustainability 2022, 14(17), 10625; https://doi.org/10.3390/su141710625
Submission received: 13 April 2022 / Revised: 1 August 2022 / Accepted: 17 August 2022 / Published: 26 August 2022

Abstract

:
The building sector consumes a significant portion of global energy use. In this regard, this work was undertaken to study the status of energy efficiency and conservation at a large school building in the northern part of United Arab Emirates (UAE). The annual electrical consumption at the school was analyzed and an awareness survey among the students and teachers was conducted to measure the level of awareness as well as to assess the current energy consumption practices. In order to identify energy saving opportunities, an energy audit was carried out wherein the school energy consuming systems, particularly the lighting and air-conditioning systems, were assessed. Furthermore, thermography scanning of the school building envelope was conducted to examine the building insulation and identify air leakage locations. The building electricity supply and distribution systems were assessed using power analyzer and thermography devices. The energy conservation measures identified include removing the extra lighting, installing motion sensors in classrooms and labs, as well as integrating a Networked Optimization Software with the current HVAC (heating, ventilating and air conditioning) system. The methodology consists of seven fundamental steps: (1) case study data collection (analysis of buildings and utility data); (2) survey of real operation conditions; (3) understanding of building behavior; (4) analysis of energy conservation measures; (5) estimation of energy-saving potential; (6) economic assessment; and (7) proposing Energy Conservation Measures (ECMs). In this regard, the school energy consuming systems (lighting, building envelope, and air conditioning (AC)) were examined to identify possible ways to reduce the school energy consumption. The results indicate that the cost of installing motion sensors in classrooms, and labs is approximately AED 20,000 (United Arab Emirates Dirham), which yields an annual energy saving of AED 93,691. Furthermore, with all energy saving measures, a total annual saving of AED 364,000 is anticipated, which is approximately 16% of the annual electricity bill.

1. Introduction

Population growth and industrial developments have resulted in increased energy consumption and depletion of fossil fuel resources. Sustainable energy utilization is crucial for prolonging the life of limited fuel resources and improving the environment. The building sector consumes over 40% of the energy consumed worldwide [1]. This calls for devising ways and means to reduce the energy consumption by increasing the efficiency of power generation and consuming equipment and energy conservation through proper system design and utilization.
Energy conservation is considered the fifth fuel after oil, gas, coal, and nuclear [2]. Therefore, the drive for green building has resulted in development of new construction standards that address energy efficiency and conservation, as well as carbon footprint, as being important facets that need to be addressed and adhered to. Based on the existing literature, some authors estimate that the energy-saving potential of occupant behavior is in the range of 10–25% for residential buildings and 5–30% for commercial buildings [3]. Schools are considered as one of the most important places for applying energy efficiency and conservation to reduce the operating cost, as well as having the opportunity to teach the students how to become energy efficient citizens [4].
It is vital that schools set a good example for efficient use of energy. Furthermore, as a result of energy conservation measures, the saved resources can be redirected to education [5]. Global energy consumption forecast indicated an alarming projected increase by 71% from 2003 to 2030. With the world population projected to reach eight billion by 2030, the consumption of energy, water, and food will also rise by 40 to 50% [6]. The increased use of energy could result in the depletion of the world’s limited fossil fuel resources and contribute to global warming, air pollution, and environmental damage. Several initiatives have been recently launched by UAE such as the Building Insulation Program in Dubai and the Energy Efficiency Standardization and Labelling, the establishment of Energy Award, Dubai Integrated Energy Strategy 2030, and Dubai CFL Initiative amongst others [7].
It is well-known that energy efficiency and energy conservation are two crucial elements in achieving energy sustainability. In fact, energy efficiency was considered by the European Commission as a key element for the transition towards a resource-efficient economy [8]. According to the U.S. Department of Energy (DOE), the buildings in the US account for more than 70% of total electricity use, which is estimated to cost USD 400 billion per year (about 40% of the US total energy bill). Thus, a 20% saving due to energy efficiency and conservation could save an estimated USD 80 billion annually. The investment in energy-efficient building costs about USD 300 per kW saved while building a new power plant can cost over USD 2000 per kW generated [9]. The strategies to achieve energy sustainability should be based on analyses of actual data on energy consumption patterns of different energy consuming areas.
In order to reduce the facility operating cost and improve energy efficiency, an effective energy management program should be designed, and as such, the first task of any effective program should be the Energy Audit [10]. The audit examines how energy is used in the facility; the analysis provides a clear picture of current energy consumption, and the cost of this energy. The audit should also recommend ways to reduce energy consumption by changing the operational practices and/or equipment/technology based on the findings. If these questions are answered properly, opportunities to improve energy efficiency can be identified. The effectiveness of any energy management program can be verified after the audit analysis [11].
Thermal imaging is an effective tool in the energy audit. Thermography is an objective image-giving measuring method, with which the surface temperature can be determined without contact [12]. Thermography can make significant contributions in assessing the state of the building envelope, and towards identifying the role that building defects may play in any existing energy performance gaps [13]. Infrared thermography, involving an analysis of surface temperatures, makes it possible to identify anomalies, especially the presence of moisture on the surface of materials, since the heat transport is affected by the presence of flaws, moisture and other occurrences [14]. Weak points of electrical installations can be detected in a very short time. Furthermore, loose insulation in a building wall and infiltration of air into and out of the building can be easily identified. The measuring tool used for thermography receives an emission, which is not visible to the human eye and converts this into visibly thermal images [15]. A qualified evaluation of these images delivers important information for the operator. Electromagnetic waves are emitted from any object with a temperature greater than absolute zero. The radiation is caused by the kinetic movement of the matter’s charged particles. The temperature and the amount of emitted radiation are directly proportional. The thermal emission is captured and processed by thermal imaging cameras. It is recommended to perform an initial inspection for new installations components to detect installation faults as potential malfunction sources, as well as periodic inspections of the electrical installations. The inspection interval depends on the load of the system, environmental influences, as well as the results of former thermography inspections.
There is an increasing awareness everywhere in the world with regard to promoting sustainable solutions in schools, including the use of more efficient technologies and strategies [16]. In this context, some current studies in the literature are as follows: A complex thermal modernization of a Polish school building was presented by Michalak et al. [17], which resulted in a noticeable reduction in energy demand for space heating from 464.78 to 168.73 GJ [17]. According to another study by Kim et al. [18] on the energy consumption of middle school facilities, energy consumption in Korean schools is increasing. The total annual energy consumption in each school is estimated to be 400–1750 [MWh/yr], which varies between schools depending on the scale. Electric power consumption accounted for approximately 82% of the total energy consumption in schools [18]. Another study on energy consumption analysis of Canadian school buildings showed that middle-aged schools were the largest energy consumers [19]. A cost-optimal solution has reduced primary energy consumption by 85% and gas emissions by 82–83% for some building situated in the Mediterranean area [20]. Berardi et al. [21] showed that the phase change materials can be used to reduce the energy demand of a school in Spain. Neustroev and Arinushkina [22] addressed the challenge of high energy intensity of the public organization in Russia. In particular, they aimed to investigate the key aspects of energy efficiency and energy saving policies in public schools, which have been adopted at the federal level and implemented in the regions of Russia [22]. The energy consumption of some Dutch primary schools, and its relationships with school building characteristics and teachers’ actions in classrooms was investigated by Zang and Bluyssen [23]. The statistically significant relationship found between the measured illuminance in the classrooms and energy consumption in the schools might indicate a possible way to save energy through light control [23]. A case study of energy consumption in selected school buildings in temperate climatic conditions of the Central Europe region was performed by Mohelníková et al. [24]. The studied buildings were representatives of various school premises constructed throughout the last century [24]. In Italy and other European countries, many historic buildings are reused as school buildings, changing their original function. This process of adaptive reusing is one method for conserving heritage buildings, however sometimes this process sacrifices the quality of daylight and well-being of pupils. It has therefore become apparent that it is difficult to reconcile the cultural value of historic buildings with comfort standards [25]. Given the importance of reducing global energy consumption in order to minimize climate change, the critical influence of lighting design on students’ learning and on schools’ energy costs means that all aspects should be investigated thoroughly. In Turkey, a case study of a school building showed that reductions of 15–18% in electricity consumption can be obtained by choosing an appropriate design, whereas the energy required for heating can only be reduced by 8.5% [26].
A lot of organizations try to enforce the culture of green environment by reducing their energy consumption and saving natural resources. The role of social interactions, mass media, and school profile on youth knowledge and awareness of measures to conserve energy was studied by Zyadina et al. [27]. They surveyed 16-year old school students (a total of 617 responses) from two different geographical regions in Jordan. Devising proper outreach and energy saving campaigns targeting parents through mass media and the community-based initiative was recommended in addition to conducting an energy saving campaign (including renewable energy) at public schools within the domain of school curricula and school activities. Abu Dhabi Educational Council (ADEC) recognized the importance of developing greener schools, and with this in mind, have been building new schools all over Abu Dhabi with the intention of minimizing the use of energy and water. Yet, there is still a shortage in the number of UAE schools which took this initiative.
There are many studies presenting Energy Conservation Measures (ECMs) in the different typologies of buildings, but there is a lack of studies presenting the case of educational buildings, particularly in the UAE. Thus, the objective of this study is to fill this gap by providing a specific case study based on a school building survey located in the UAE. In this regard, we aim to study the energy consumption at the school building and identify the status of the building with respect to energy efficiency and energy conservation. Furthermore, we aim to develop the means to save energy and reduce bills.

2. Materials and Methods

The methodology consists of seven fundamental steps: (1) case study data collection (analysis of buildings and utility data); (2) survey of real operation conditions; (3) understanding of building behavior; (4) analysis of energy conservation measures; (5) estimation of energy-saving potential; (6) economic assessment; and (7) proposing ECMs.
The methodology used in the audit started with collecting and measuring data that were valuable for the energy and power assessment of the campus. The building location, the weather and environment, the area of the campus, the wall material, the type of windows, the type of air conditioning system, the type and number of light bulbs, and other information were all considered when performing and forming the energy consumption profile of the campus. Such information is very important and cannot be ignored if one is aiming for proper and valid outcomes. The main purpose was to conduct an initial energy survey and identify operation and maintenance procedures that would help in describing and assessing current energy consumption, identifying the possible energy improvements, and offering an energy management plan of action. The observed and measured data collected during the energy audit had to describe the energy demand of the campus, which is mainly affected by the building use and building envelope, as well as the energy consumption.
As a part of the energy audit, a survey on Energy Awareness that focused on the use of electrical energy during normal school operational hours was conducted on staff and students. The survey questionnaire is provided in Appendix A. The main purpose of conducting the survey is to gather data and provide feedback to understand the level of awareness among the campus, as well as assessing the behavior and attitude towards energy related issues. The results of the survey are intended to form conclusions about consumption of electrical energy at the campus and to have an idea about the right measures to be taken to cultivate the school towards a greener environment. Survey results and data analysis are demonstrated in the following section. In order to collect data about the school energy use, a survey was designed through an online questionnaire data collection tool. The questionnaire link was emailed to all the students and staff. Most questions were closed-ended, but students and staff were given a space to provide unstructured responses.
A total of 244 students and staff completed the questionnaire out of a target population of 300. The survey was designed to set a base reference regarding the energy efficiency awareness as well as the current practices in the school to establish strategies and policies to promote energy efficiency. The survey includes questions to check energy consumption awareness from different viewpoints.
The survey starts with demographic questions to understand the background of the respondents in addition to their position in the school. As such, 53% of respondents (the majority) were female students, while 21% were male students. The staff represents 26% of respondents’; 19% teaching staff and 7% admin staff.
Furthermore, the survey shows that the campus members were mostly located on the girls’ side, which is due to the higher number of female students. However, 3% of the members, all of whom were staff, were spending an almost equal amount of time on both sides and they represent 12.5% of staff.
The level of education is an important parameter in the survey. Later in the report, the level of education will be related to particular findings. The rationale behind this is to understand whether respondents are unaware or ignorant of energy consumption. However 74%, the majority of respondents, were high school students while 15% were bachelor, 10% masters, 1% secondary degree students.

2.1. Case Study: School Overview

The school is located in a hot desert climate, with warm winters and extremely hot and humid summers. Rainfall is generally light and erratic, and occurs almost entirely from November to April. About two-thirds of the year’s rain falls in the months of February and March. The emirate basks in more than 3500 h of sunshine a year, with an average annual rainfall of just over 100 mm. During the milder months, from November to April, average daytime highs range from 25 °C to 35 °C. It is hot and humid from June to September, with highs of 41–43 °C.
The campus is divided into nine blocks labeled A, B, C till I, as shown in Figure 1. Blocks A, B, C and D have mainly classrooms. Blocks E and F have most of the science and engineering labs, while all the engineering workshops are in Blocks G. Finally, all the academic and admin staff are in Blocks I, and the cafeterias and libraries are in Block H.
All rooms share a single labeling pattern given by the block name followed by dash, the floor level, and a three-digit number. For example, in block A, the classrooms are named A-G004 and up to A-G025. The total number of classrooms is 42; 23 in the girls section and the rest in the boys. Furthermore, there is a total number of 49 Science and Engineering labs and workshops that are distributed between the boys’ and the girls’ sections. More details are given in Table 1. Block H includes two cafeterias and two libraries for the girls and boys, separately.
The campus uses a primary-secondary chilled water system for cooling. The primary loop pumps are set to a constant speed and provide constant flow to the chillers, as shown in Figure 2, and the chillers and pumps are connected in parallel so that they are working according to the required cooling load. The secondary loop is responsible for the distribution, and it includes the variable speed pumps and terminal units (Air handling units, fan-coils, and control valves). The speed of the secondary pumps is determined by a controller measuring differential pressure [28].
The suction header of the secondary loop and the suction header of the primary loop are connected by a de-coupling pipe, which separates the primary loop and the secondary loop. The system uses 2-way valves in the air handlers that control the flow rate according to the load conditions. In case of light load conditions, the 2-way valve will partially or fully close resulting in a pressure rise in the secondary loop. A differential pressure sensor measures the pressure difference and signals and alters the speed of the variable pumps in the secondary loop [28]. The primary-secondary variable flow system used is considered as an energy efficient system when compared to the constant-flow system used in similar applications as the variable speed pumps work only according to the cooling load demand.
The HVAC system available in the campus is automated so the chillers, primary and secondary pumps work according to the load capacity. All the rooms are equipped with programmable thermostats. The four chillers used are York Model YVAA Air-Cooled Screw Compressor Liquid Chillers with Variable Speed Drive [29]. The Opti Speed variable-speed drive was developed to reduce the annual energy consumption by 30%.
Figure 3 shows the percentage of annual savings when a variable speed drive model is used [29]. A summary of the equipment used in the system and the total power capacity is listed in Table 2.
The campus has the state of the art lighting system for the classrooms, corridors and the whole facility. All the lamps used are high efficiency LED energy saver lamps. The lighting inventory is shown in Appendix D.

2.2. Energy Audit Plan of Actions

An energy audit at the campus is conducted to measure energy consumption at the school and therefore reduce the operational energy expenses and provide an energy efficient environment. The first step in the audit is to collect information about the facility, age, past record of utility bills, type of operation, operational hours, and all schematics/drawings (if possible) to get an idea how the facility is using energy. The second step is to identify the areas considered to waste energy to find potential solutions to reduce the energy cost.
In the current work; an Energy Audit is conducted at the campus to develop Energy Conservation Measures (ECMs) and to quantify energy uses and losses through different testing and measuring processes. The Audit will include the following main procedures:
Energy awareness survey to assess the attitude and behavior towards energy conservation.
Electrical consumption data analysis.
Walk-through audit to observe any possible waste of energy.
Measuring the light illumination levels and compare it with international standards.
Thermography survey for the building envelope and the distribution boards.
Power consumption analysis.

3. Results and Discussion

3.1. Energy Audit

The survey indicates that above 90% of participants understand that it is important to save energy, while 8% partially agree. However, 2% do not think it is important to save energy. These results suggest high potential in approaching 98% of the campus population when any action in this regard will be taken. The majority of participants (88%) agree that saving energy produces a cleaner environment, which is aligned with the 90% who agree with the importance of saving energy in general.
The pie chart shown in Figure 4 demonstrates the diversity in responses shown in the chart above and it clearly shows that no one thinks it is his/her own responsibility to switch off the lights. The bar chart also demonstrates the differences in opinion regarding who is responsible for switching off the lights. The survey clearly shows that no one thinks it is his/her own responsibility to switch off the lights. Only 37% of teachers believe that it is their responsibility and only 18% of students think it is their responsibility. However, the highest percentage among all 30% of the respondents preferred to answer “I don’t know”.
The survey demonstrates the differences of opinion when it comes to turning off the projectors in the lab/classrooms, as 50% of the respondents think it is teachers’ responsibilities. Around 45% of teaching staff think it is their own responsibility, while 50% of the students think that it is the teachers’ responsibility. Furthermore, 23% do not know who is responsible for this action.
The survey shows that 88% of the survey respondents agree that saving energy should be rewarded. This indicates that the members of the campus wait for a type of recognition to save energy. Moreover, around 86% of the members believe that they need a reminder (signs to turn off lights/equipment) to do the right thing. However, 77% of respondents considered alternative methods to decrease their electricity bill in their home. The purpose of this question (Have you considered ways to decrease your electricity bill in your home?) is to relate to the respondent conscience towards saving energy, is it to save money? Or to save energy? The results suggest that 47% of respondents think of it, although only 30% think of it often. Although 90% of the participants are aware that saving energy is important, only 77% are considering saving energy at their homes.
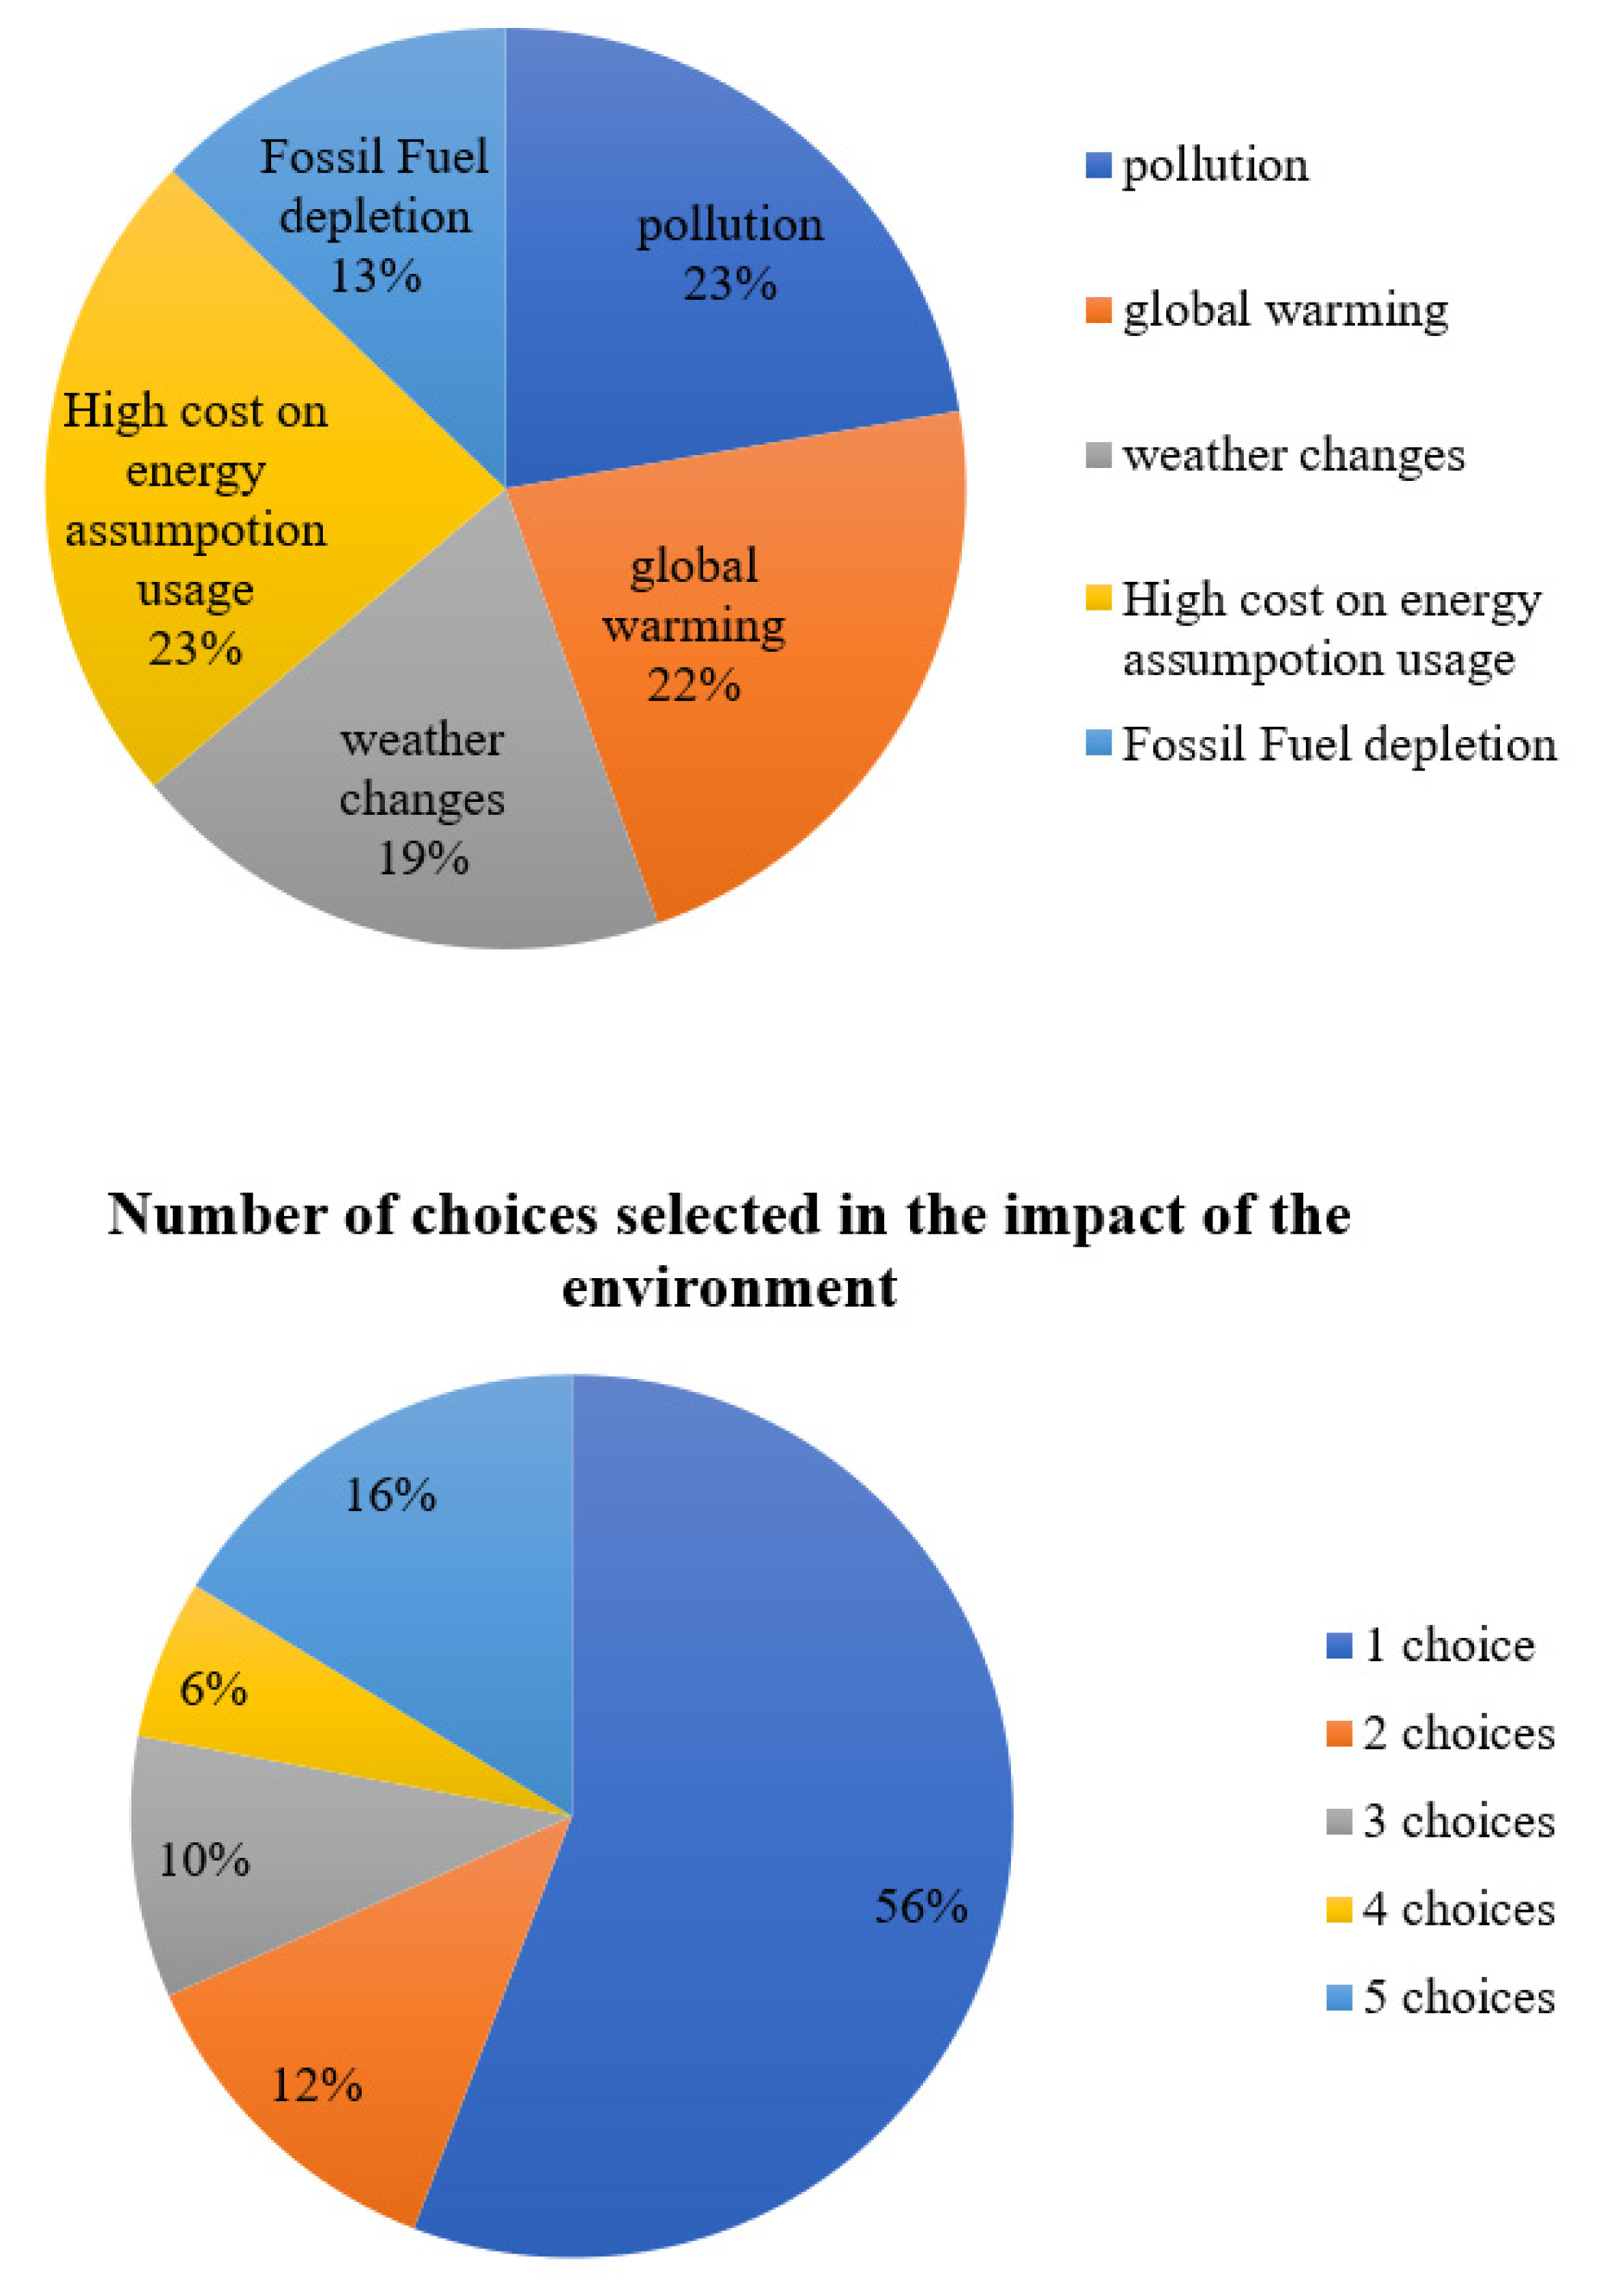
Energy reducing strategies percentage is given in Figure 5. According to Figure 5 26% of members believe that turning off the light is a useful strategy to reduce energy consumption. The data above suggest recycling is the least chosen way of reducing energy usage, which indicates a lack of recycling awareness among the campus population. Moreover, most of the responses were towards turning off lights and unused equipment, yet it is worth mentioning that only 18% of the whole population (44 respondents) selected all five options, as shown in the below chart.
Figure 6 shows the impact on the environment. Although around 88% of the participants highlighted the importance of saving energy for a cleaner environment, only 16% selected the five choices and 56% selected one choice only. The survey shows that 80% of the school members are not aware of any energy waste. It also suggests that 57% of the school members think that the school is applying energy saving strategies while 36% are saying NO.
Based on the literature, the highest consumption of electricity in The Gulf Cooperation Council (GCC) is due to the air-conditioning. It is normal in a very hot climate such as the GCC to use AC most of the time [30]. Comparing the electricity bill in March and September, a huge increase is noticed. Therefore, it was important to investigate the perception and usage of AC.
Figure 7a shows that the majority of the participants felt cold inside the classroom due to the AC. Most of the participants open the window sometimes as a result of the cold conditions. According to Figure 7b, 86% of the responses shows that the temperature is set between 16 °C and 22 °C, and only 14% of the campus population is setting the temperature between 24 °C and 25 °C.
The survey was intended to target certain areas, members’ awareness, and sense of responsibility and their usage of the AC. The survey started with demographic questions to get to know participants’ positions, function in the school and their level of education. The reason behind the questions on educational level was to test if there is a relationship between the level of education and level of awareness, however the data did not show any clear pattern to help form a conclusion in this area.
The data demonstrates that the majority of the campus staff and students spend more time in the girls’ sections. Moreover, the results suggest that the campus members are aware of the importance of saving energy and its high relevance to a cleaner environment. Despite the level of awareness; the members expect rewards for energy saving.
Furthermore, the responses show that the members have a preference for the display or visible signage that reminds them to switch off the lights and other electrical appliances. Moreover, when it comes to responsibilities, the opinions are scattered as to who’s responsibility is to do different tasks that save energy, as only few think it is his/her responsibility to do so. The idea that is formed by the culture of the campus detects that there is a level of ignorance or laziness towards saving energy.
The point is emphasized by 77% of the participant responses that show their willingness to consider ways of reducing energy consumption at home, however, in school they show some ignorance. This was also clear in the AC usage, where most of the responses considered opening the window due to cold conditions despite the fact that 86% set the temperature between 16 °C and 22 °C. This could relate to who is paying the bill, and it might suggest that saving energy is only to save money rather than being to reduce the negative environmental impacts.
Moreover, the participants were asked two questions where they can have more than one answer. One question was about ways to reduce energy-wasting and the other was about the impact of wasting energy. Almost 50% of the participants chose only one choice despite the option of choosing more. This indicates the participants lack awareness. In both, cases a corrective action needs to be taken to increase awareness.
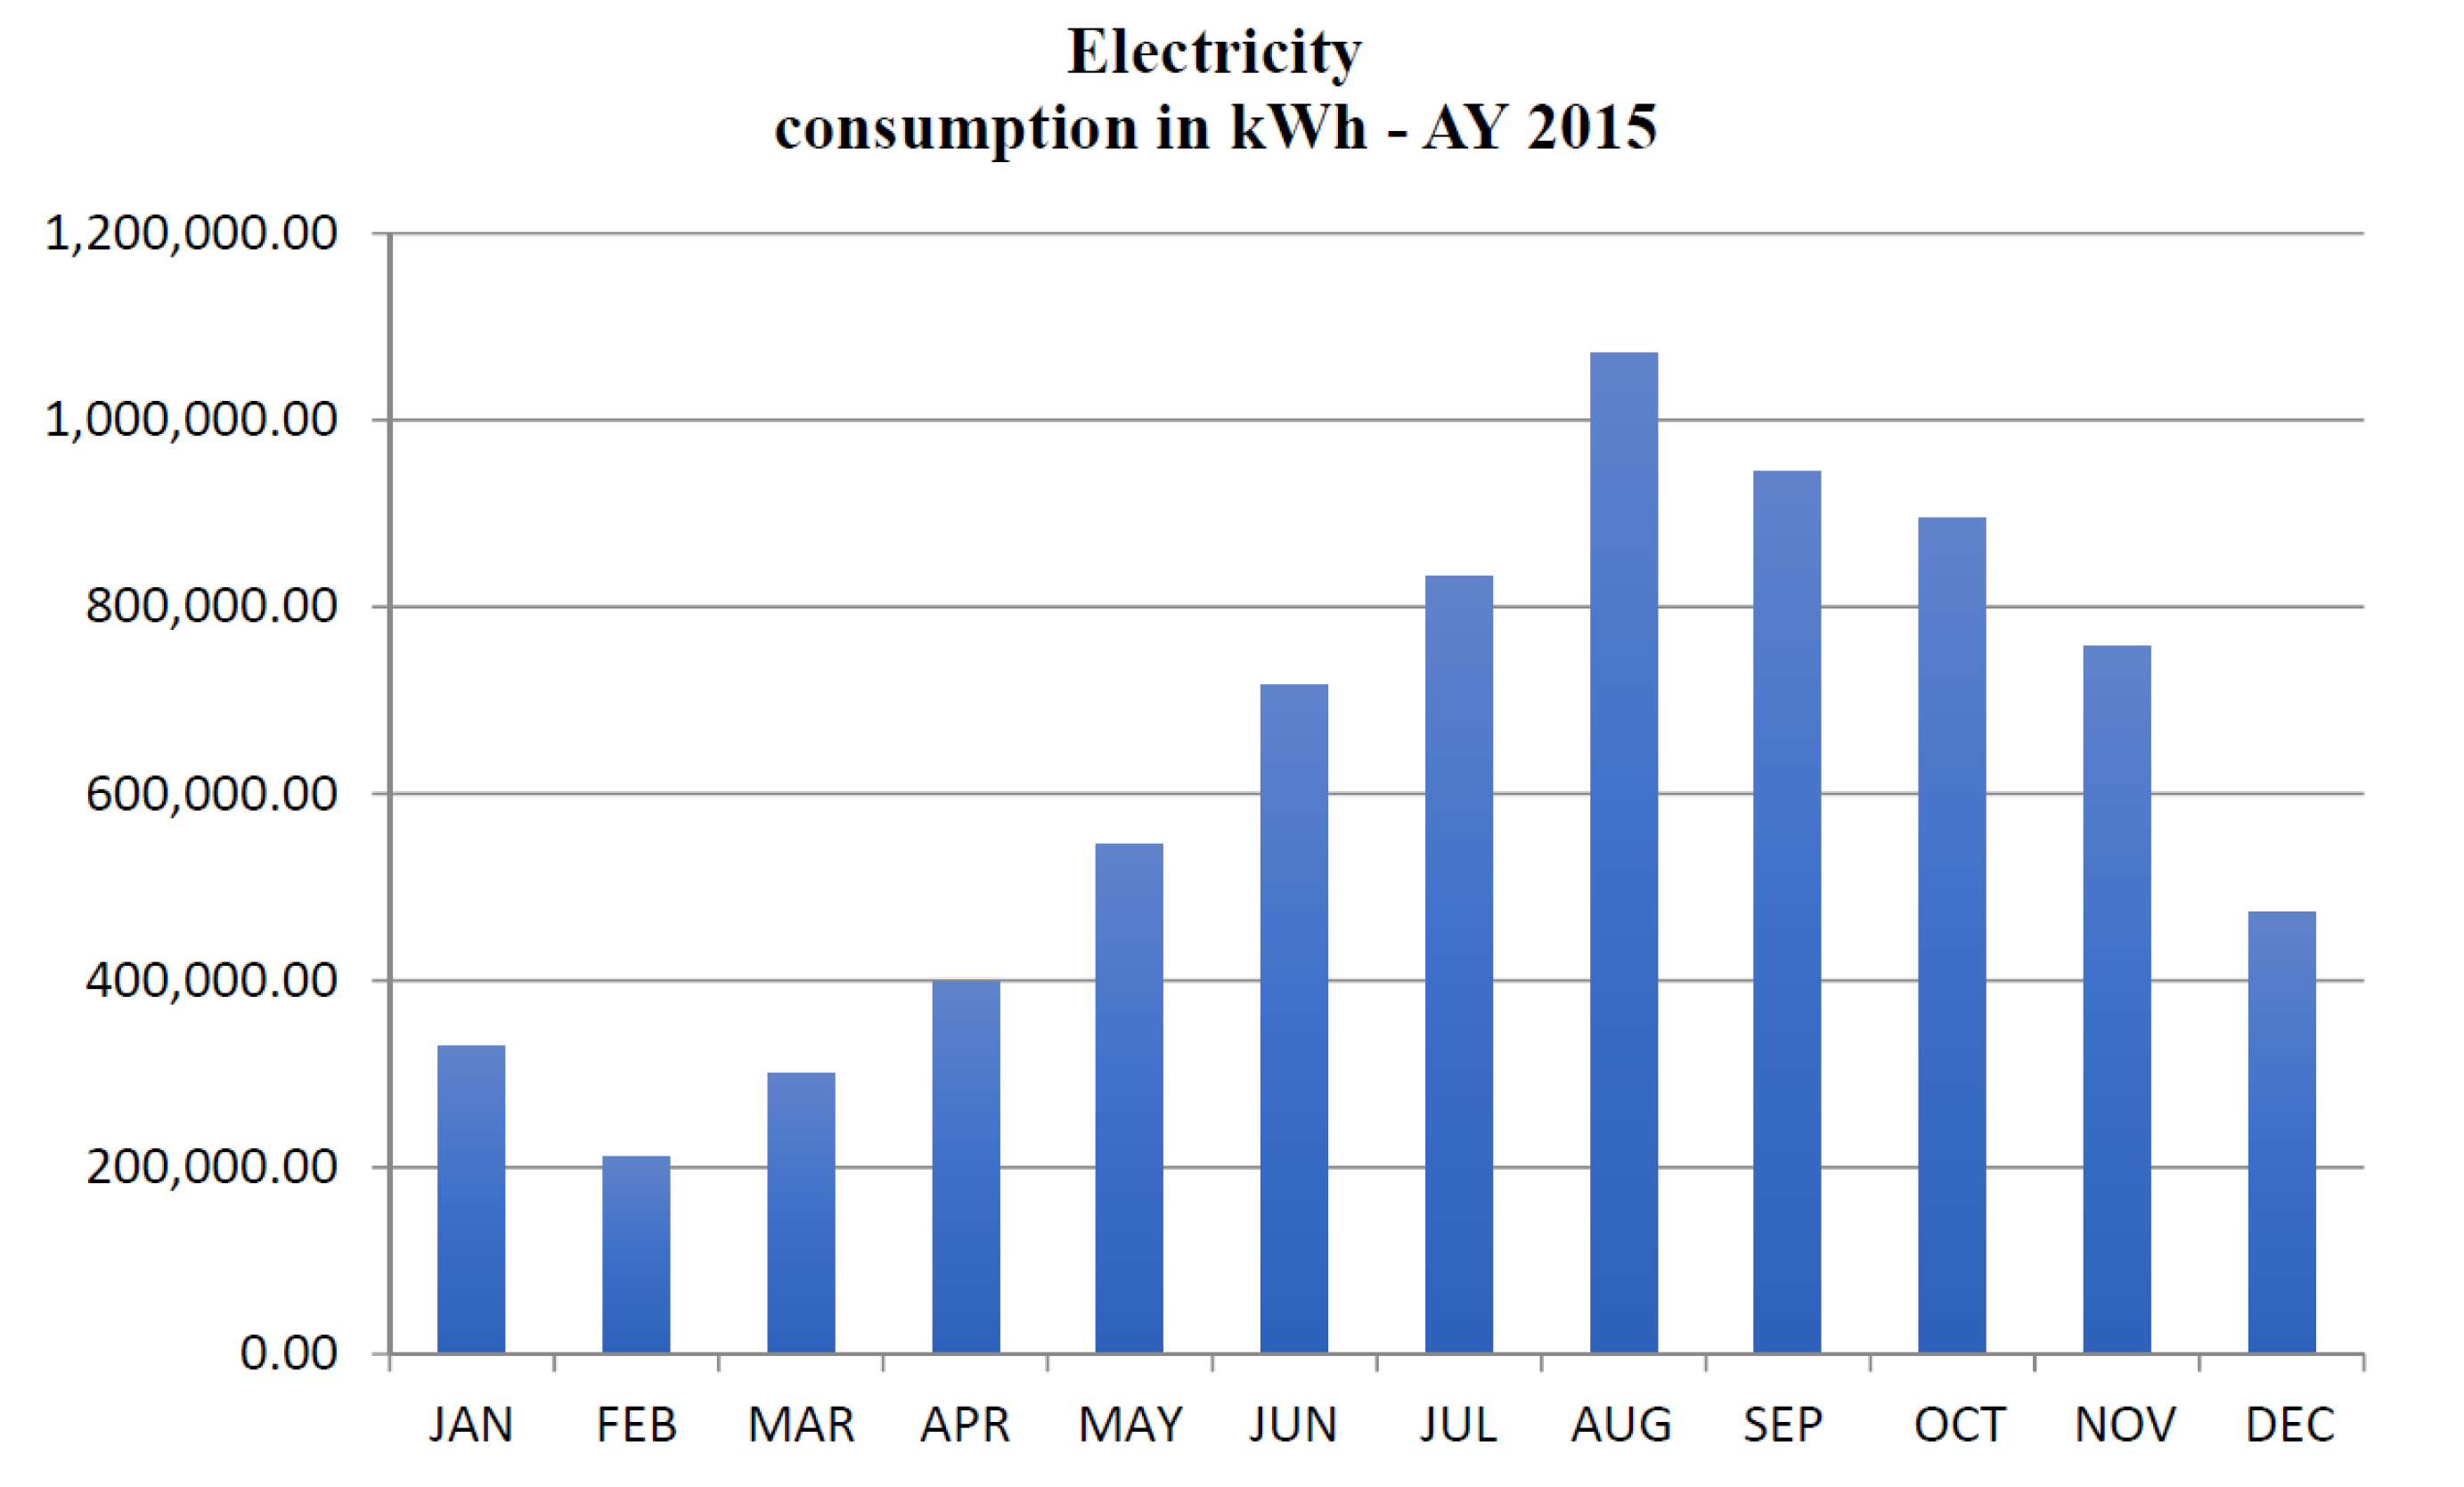
As any normal school, the campus receives its electricity bills on a monthly bases. Due to the size of the campus it was assumed that the electrical bill is normal. However, as time passed, the bill increased dramatically to reach its peak in August (2015), which is a month when the school is only considered to be fully operational for two weeks. The energy usage in GCC usually takes a bell shape, as illustrated by the school monthly consumption shown in Figure 8.
In an attempt to understand whether the energy cost of the campus is realistic or overrated, we tried to compare the results with other schools in the UAE or the Middle East who are similarly studying their energy consumption. Unfortunately, it was very hard to find data for the Middle East, and therefore, the search was expanded to the US where some useful data were found to help in benchmarking the electricity consumption. The US government has started an initiative by launching an Energy Star website to encourage all types of building units to conserve energy by providing a benchmark and rewards for best practice by comparing similar units and weather conditions together, and each good practice is rewarded with a star. Using the Energy Star website, the annual electricity consumption data and area were plugged, and the website compared the consumption with the rest of schools with similar conditions in the data base. The Energy Use Intensity (EUI) is a unified measure to compile all types of energy consumption including water and natural gas.
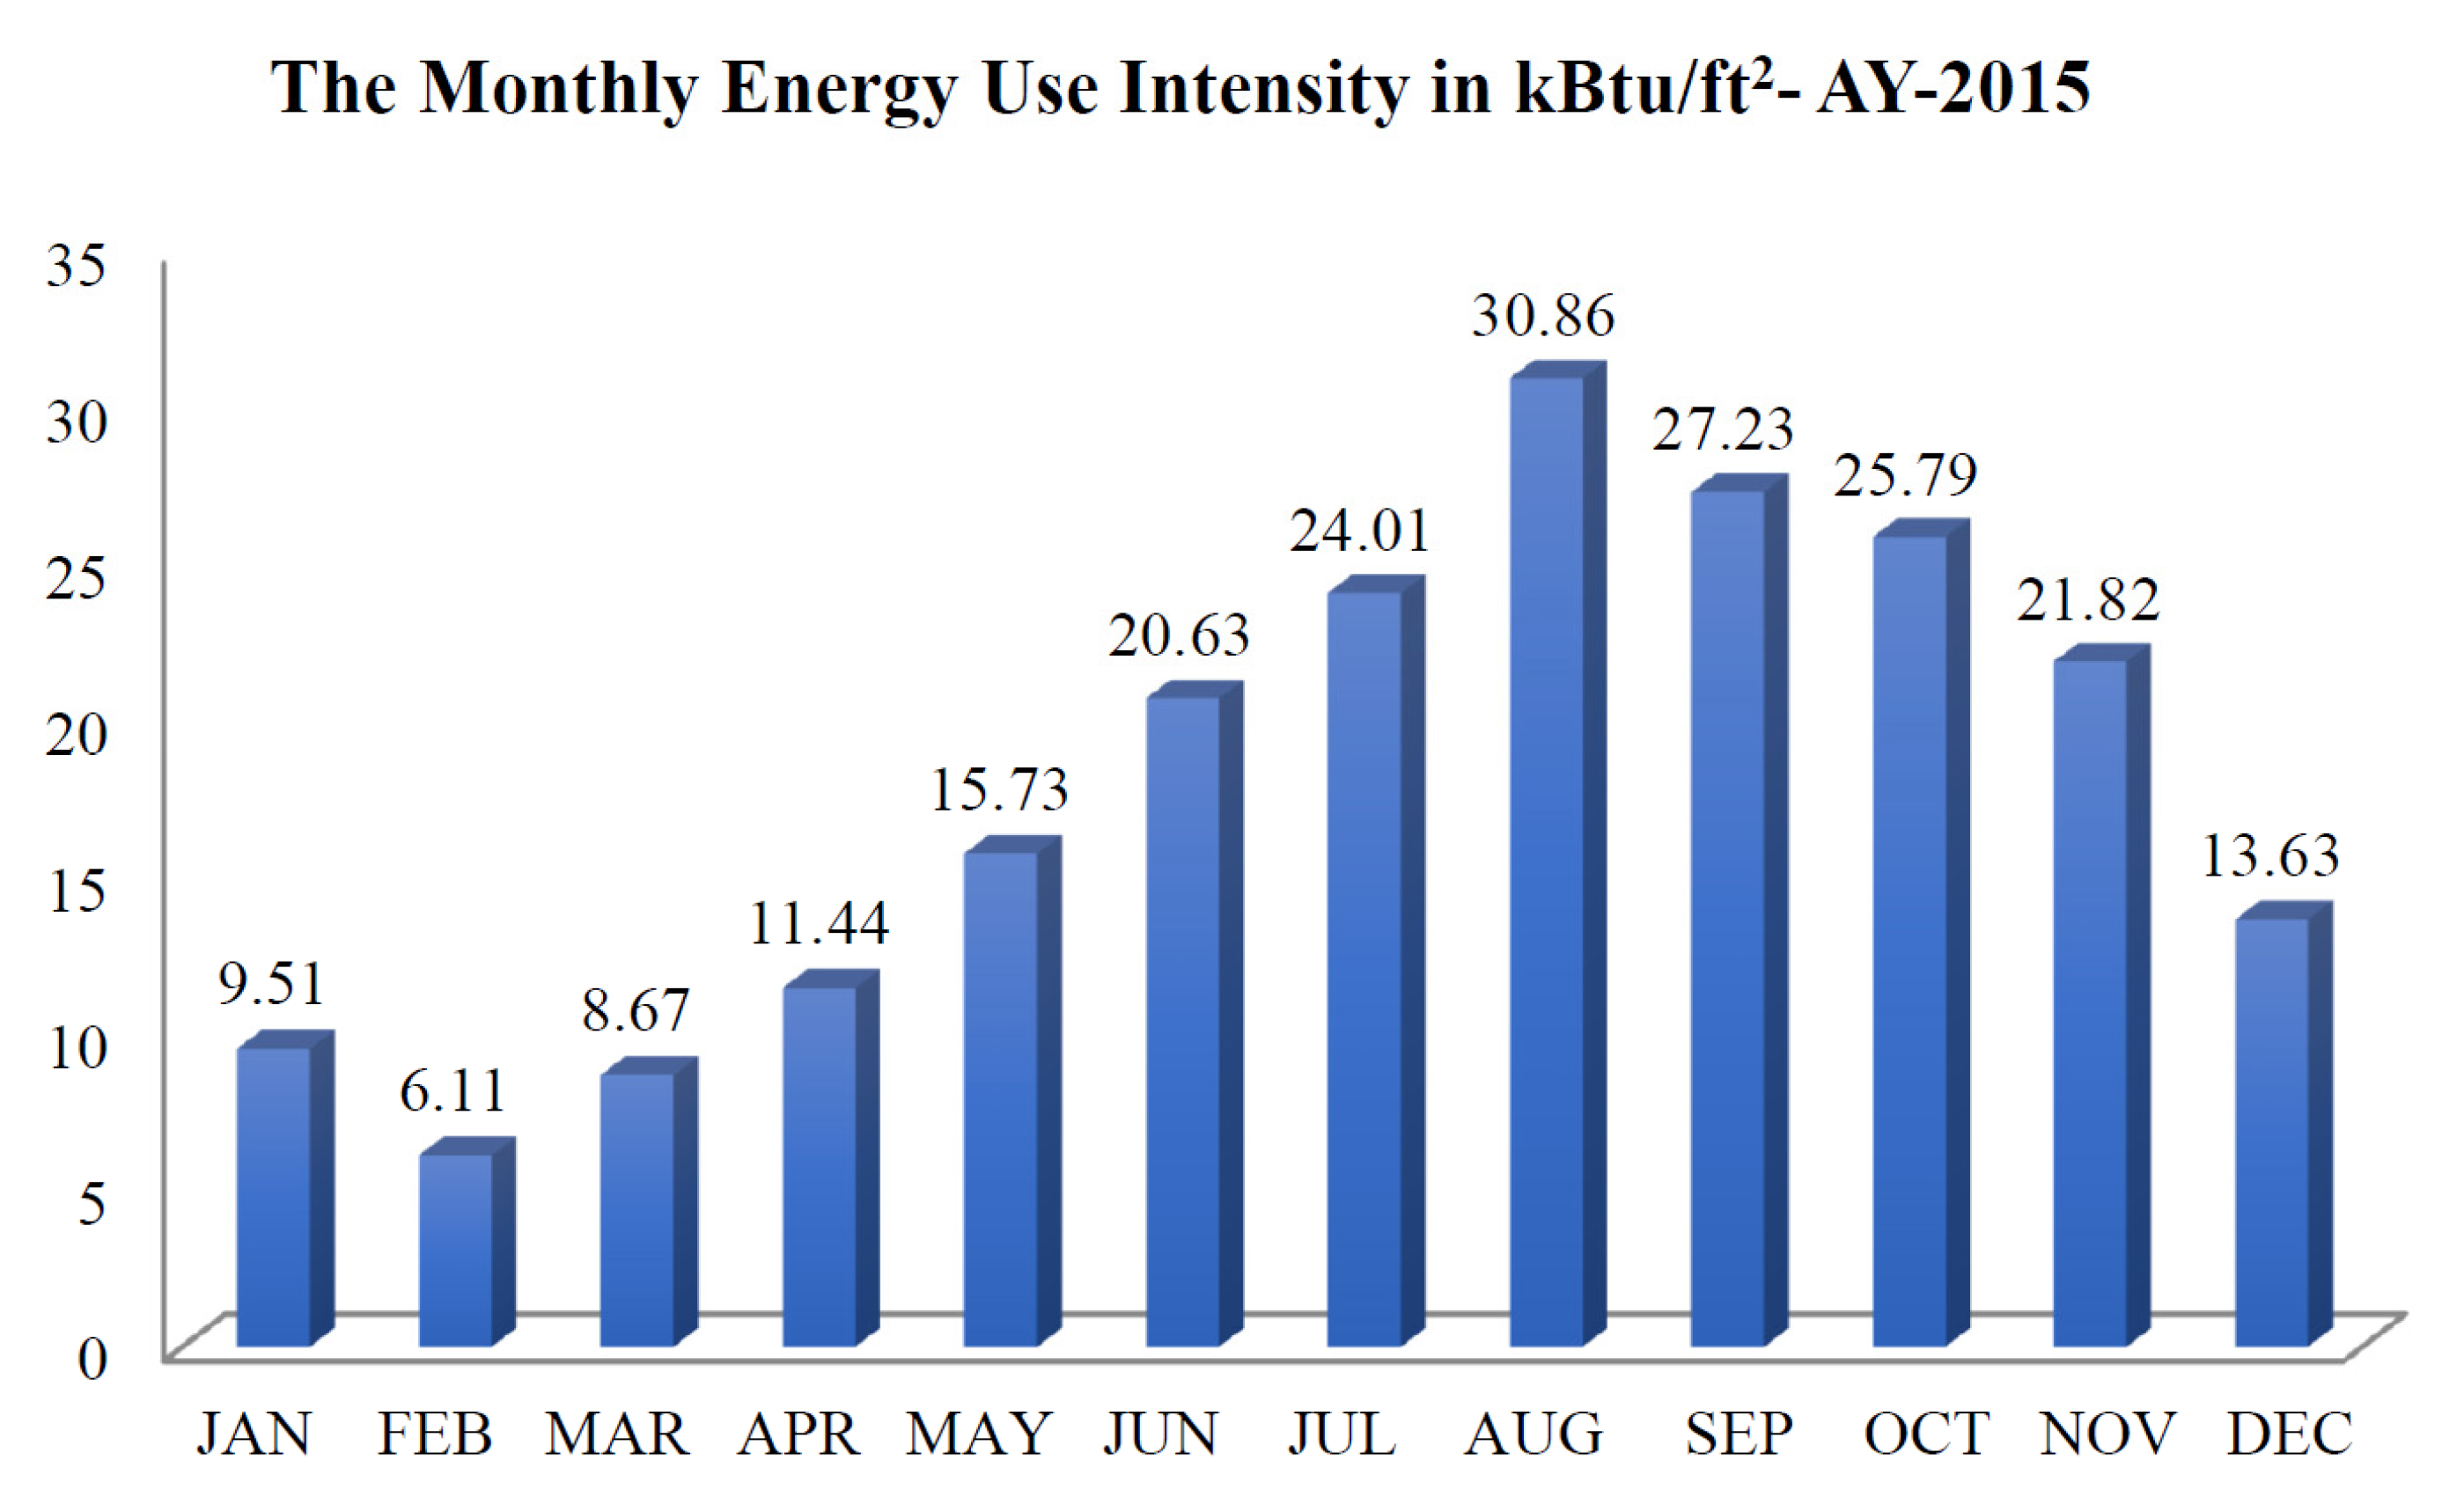
The school Energy Use Intensity (EUI) was first calculated from energy consumption by using the monthly consumption data and the school’s total area (the area is the total conditioned area). The units were converted to kBtu/ft2, as shown in Figure 9, in order to compare the data. The annual EUI was found to be 215.43 kBtu/ft2. As shown in the graph, when the campus is compared with the median it is way above the average of other similar buildings. It is worth mentioning that the annual site EUI provided by the Energy Star web site is 215.4 kBtu/ft2, which is similar to the value obtained by calculations 215.43 kBtu/ft2.
The energy star initiative is a good measure of any energy usage, when compared with others. Therefore, using it to benchmark our school is very meaningful. The data shown in Figure 9 for the comparison conducted using the Energy Star website, indicates that the school is in an immediate need of an energy audit.
As part of the energy audit, a walk-through of the whole campus was conducted to give the means of identifying and evaluating energy use and pinpoint areas for possible energy-saving improvements. In the campus, the main two parts to look for were the lighting and HVAC system (air-conditioning mainly).
As for lighting, the inventory showed that the classrooms in the campus have excessive lighting, even when no students are there or it is sunny enough outdoors. In addition, the lights in the main corridors are always switched ON despite the presence of students or staff, even though most of the corridors do not need lighting as the sunbeams can easily get inside. The last observation is about the lighting in the libraries, where it was found to be poor for reading.
Air conditioning is believed to be a cause of energy waste in the campus, and the walk-through conducted was evidence of this. It was observed that the prayer room (mainly girls’ side), corridors “C” and “D” are cold all the time. Further inspection by the maintenance team showed that the 2-way valve in the air-handling unit is not working properly and has to be replaced for the corridors, however in the prayer room the AC programmable thermostat unit was not working properly according to the set temperature.
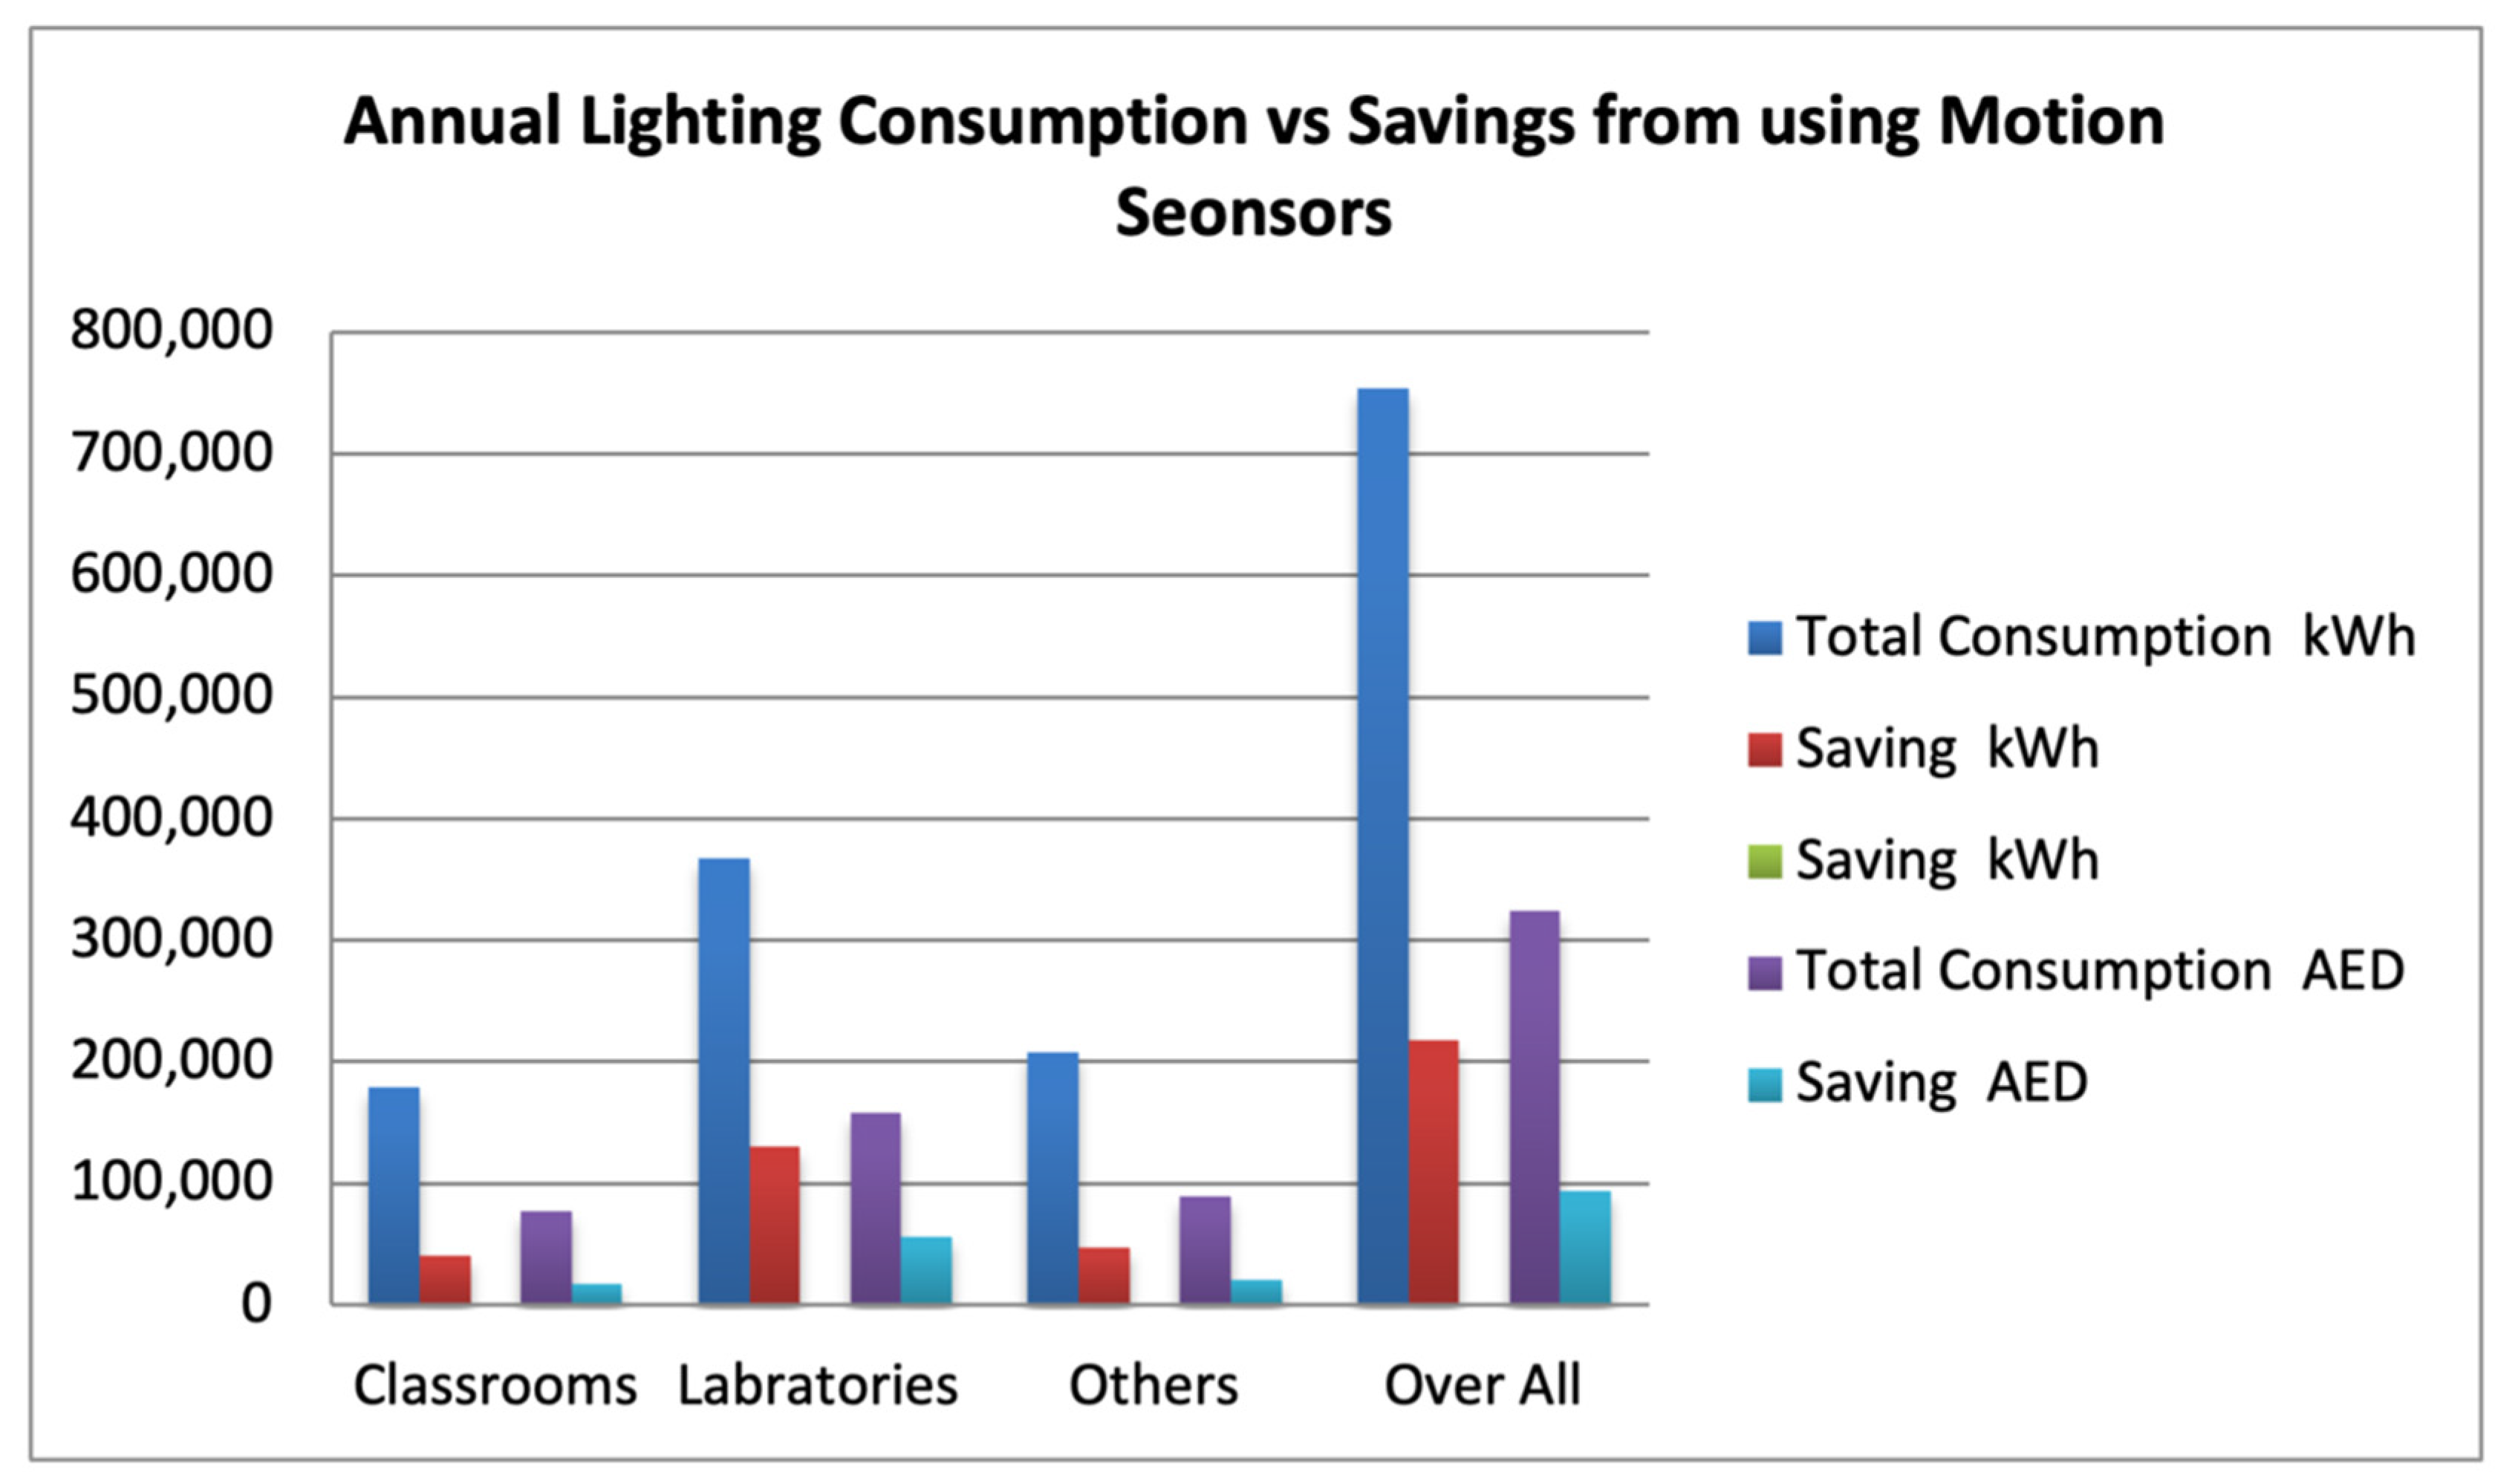
It was noticed from the walk-through observations that many locations have the lights switched on while the place is not occupied. Installing a motion sensor in all classrooms, and labs could help to reduce the amount of energy consumed and eventually the school electricity bill. The cost of installing motion sensors in the whole school facility will be approximately AED 20,000, and the savings are expected to be around AED 93,691 annually. Accordingly, the payback period is around 2.6 months. Figure 10 is a bar chart showing the expected savings in kWh and AED.
The school lighting system constitutes a significant part of the school’s overall electrical power consumption. For this reason, a thorough study was performed to explore the different areas where energy can be saved from this component. There are many elements in the lighting system that have an impact on the electrical consumption, such as controlling when lights are turned on or off, choosing the appropriate lighting level, and the type of lamps used in schools.
Light intensity in a room or “Light Quantity” is the amount of light provided to a room. It is usually expressed in three types of units: watts; lumens; and foot-candles (FC) [31]. The number of lumens describes how much light is being produced by the light system. Finally, the number of foot-candles shows how much light is actually reaching the workplace (desk level). The light intensity was measured using a light meter placed on the desk level where tasks are performed. Different locations were visited, the measurements were taken at 7:30 a.m., 11:00 a.m., and 1:30 a.m., and the results were averaged for each location. The results collected were compared to the standard amount of foot-candles in schools.
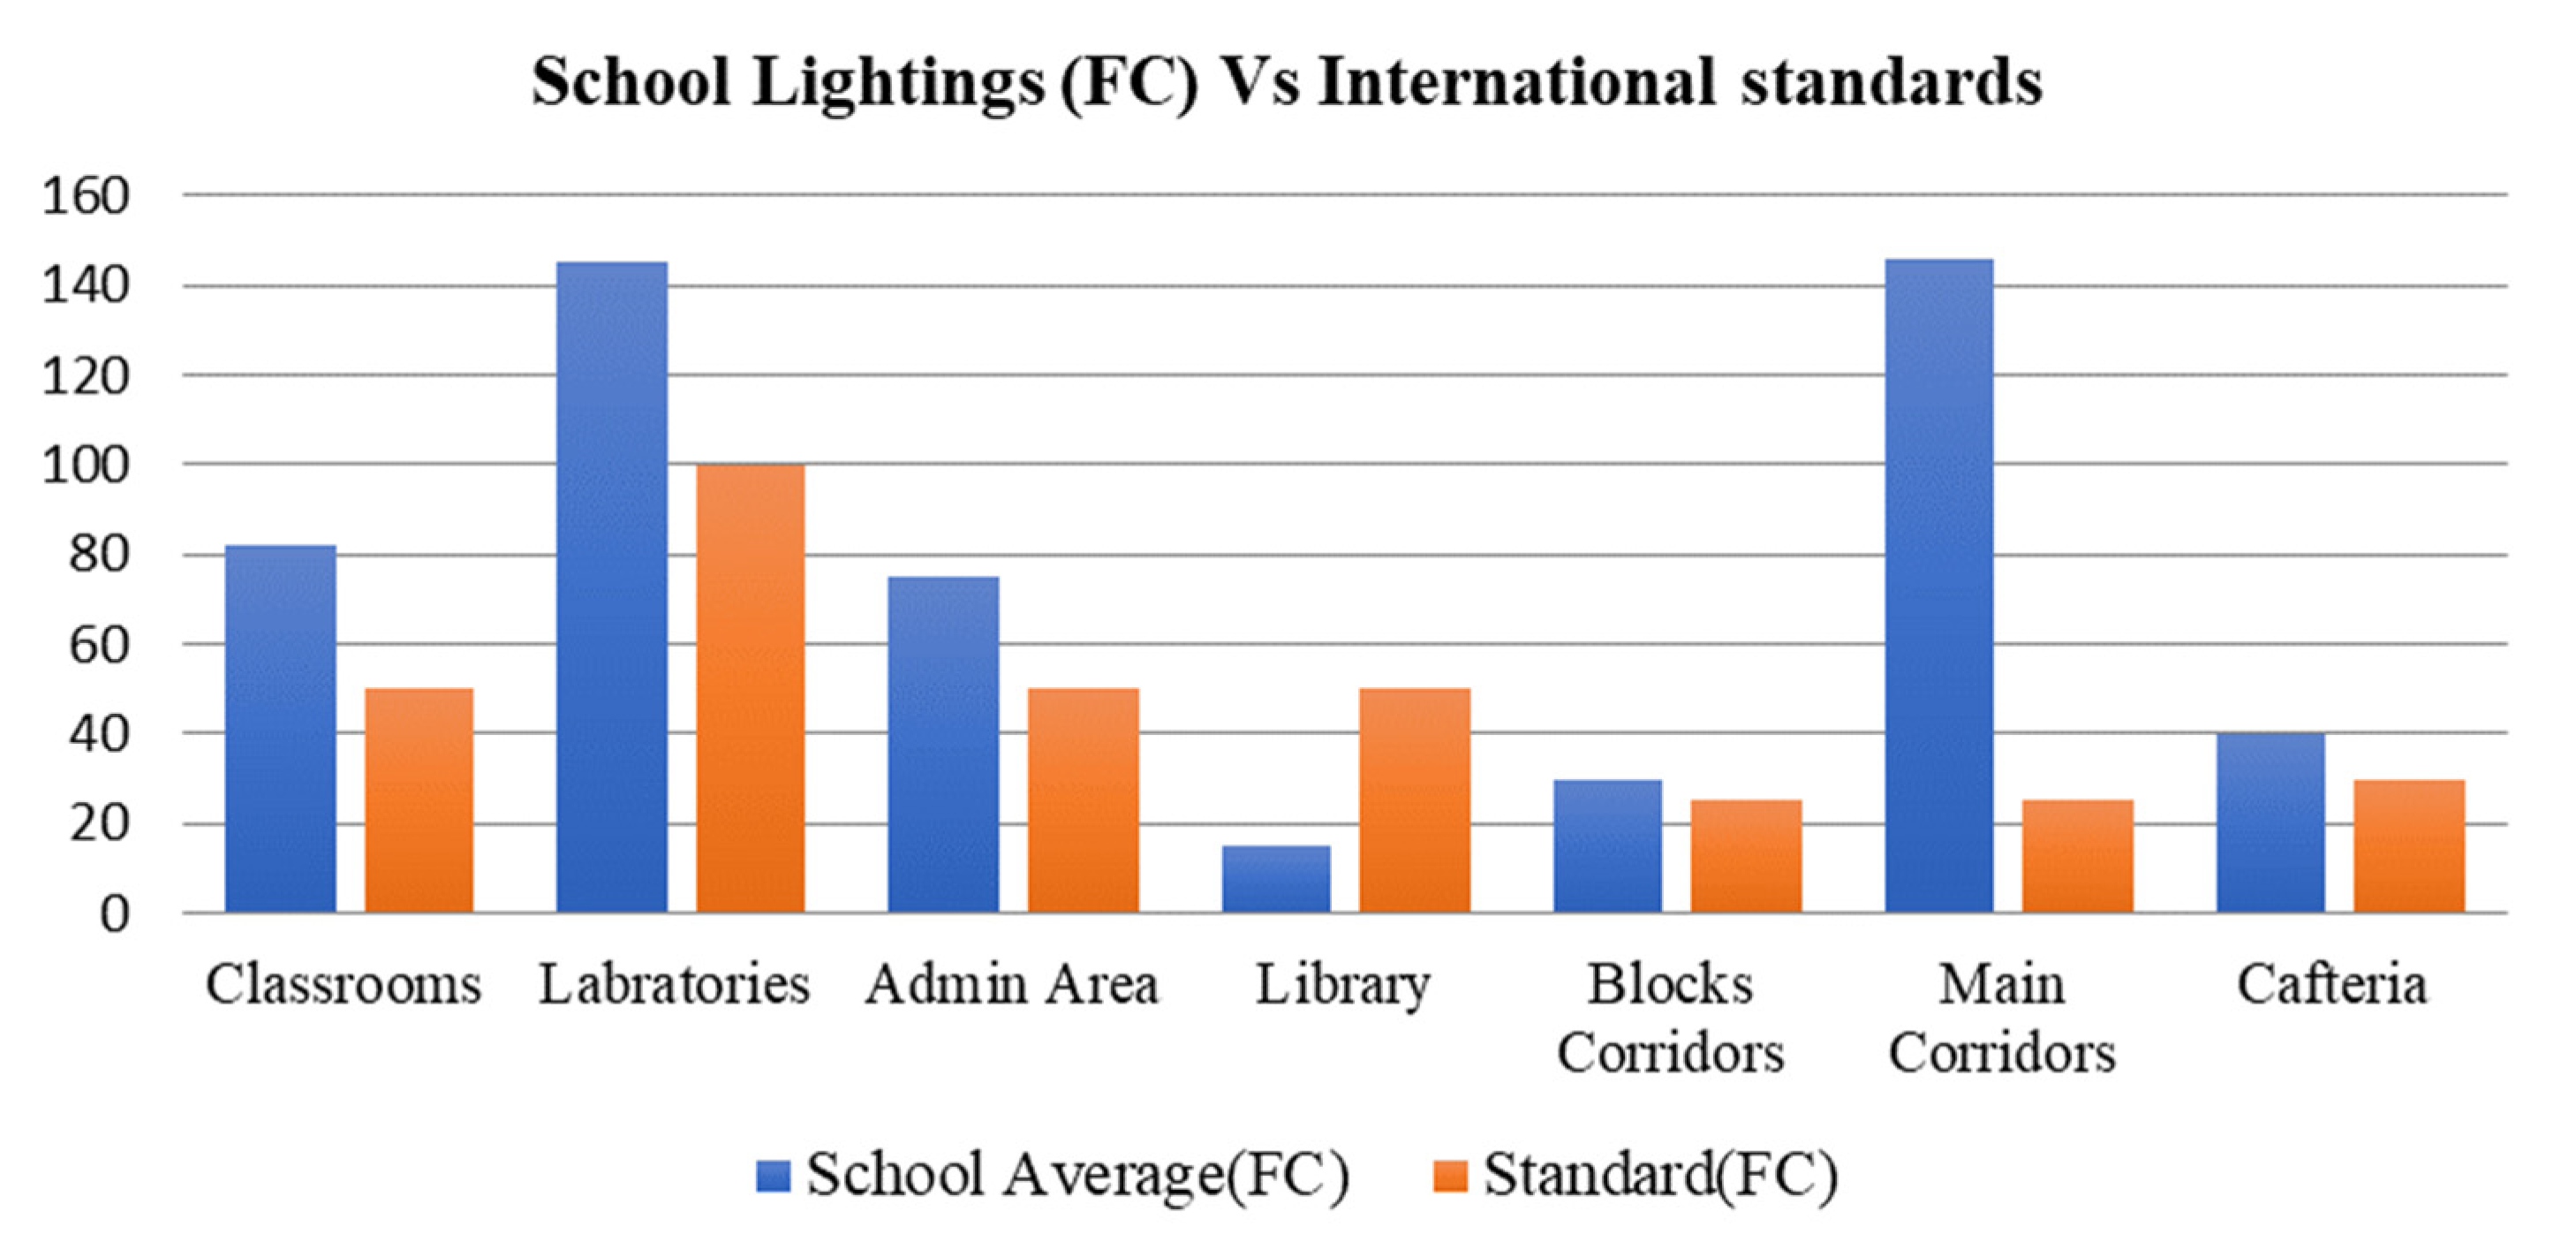
Figure 11 shows a comparison of the average school lighting compared to the international standards. It is obvious from the bar chart that except for the library, the illumination level in the school facilities exceeds international standards.
It was noticed that most classrooms has excessive lighting. Table A15 in Appendix D presents light intensity measured in Foot Candles (FC) compared to standard lightning. According to the table, the classrooms require a lighting of 50 FC for reading and writing, while the classrooms have a light intensity reading on average of 82 FC depending on the class size and sun exposure. The lights are controlled by three switches, and accordingly if one switch is turned off the light intensity measurement is 54–68 FC, which is above the standard.
In the observations for the school body practices it was noticed that all lights were on. Additionally, while measuring the light intensity in the reception corridor, an average value of 180 FC was recorded, while the standard is 20–30 FC. The reason for this is that the main hallways are exposed to direct sunlight during day hours, which indicates that there is no need for the lights to be on during daytime, yet with the observations it was noticed that the light is always on at all times.
Moreover, with most of the campus being over lamped, most classrooms can save energy on lighting, especially those with direct exposure to sunlight. On the other hand, in the library the standard lighting should be 50 FC, however the library recorded measurements at 10–19 FC. This should be taken into consideration for the safety of students and staff.
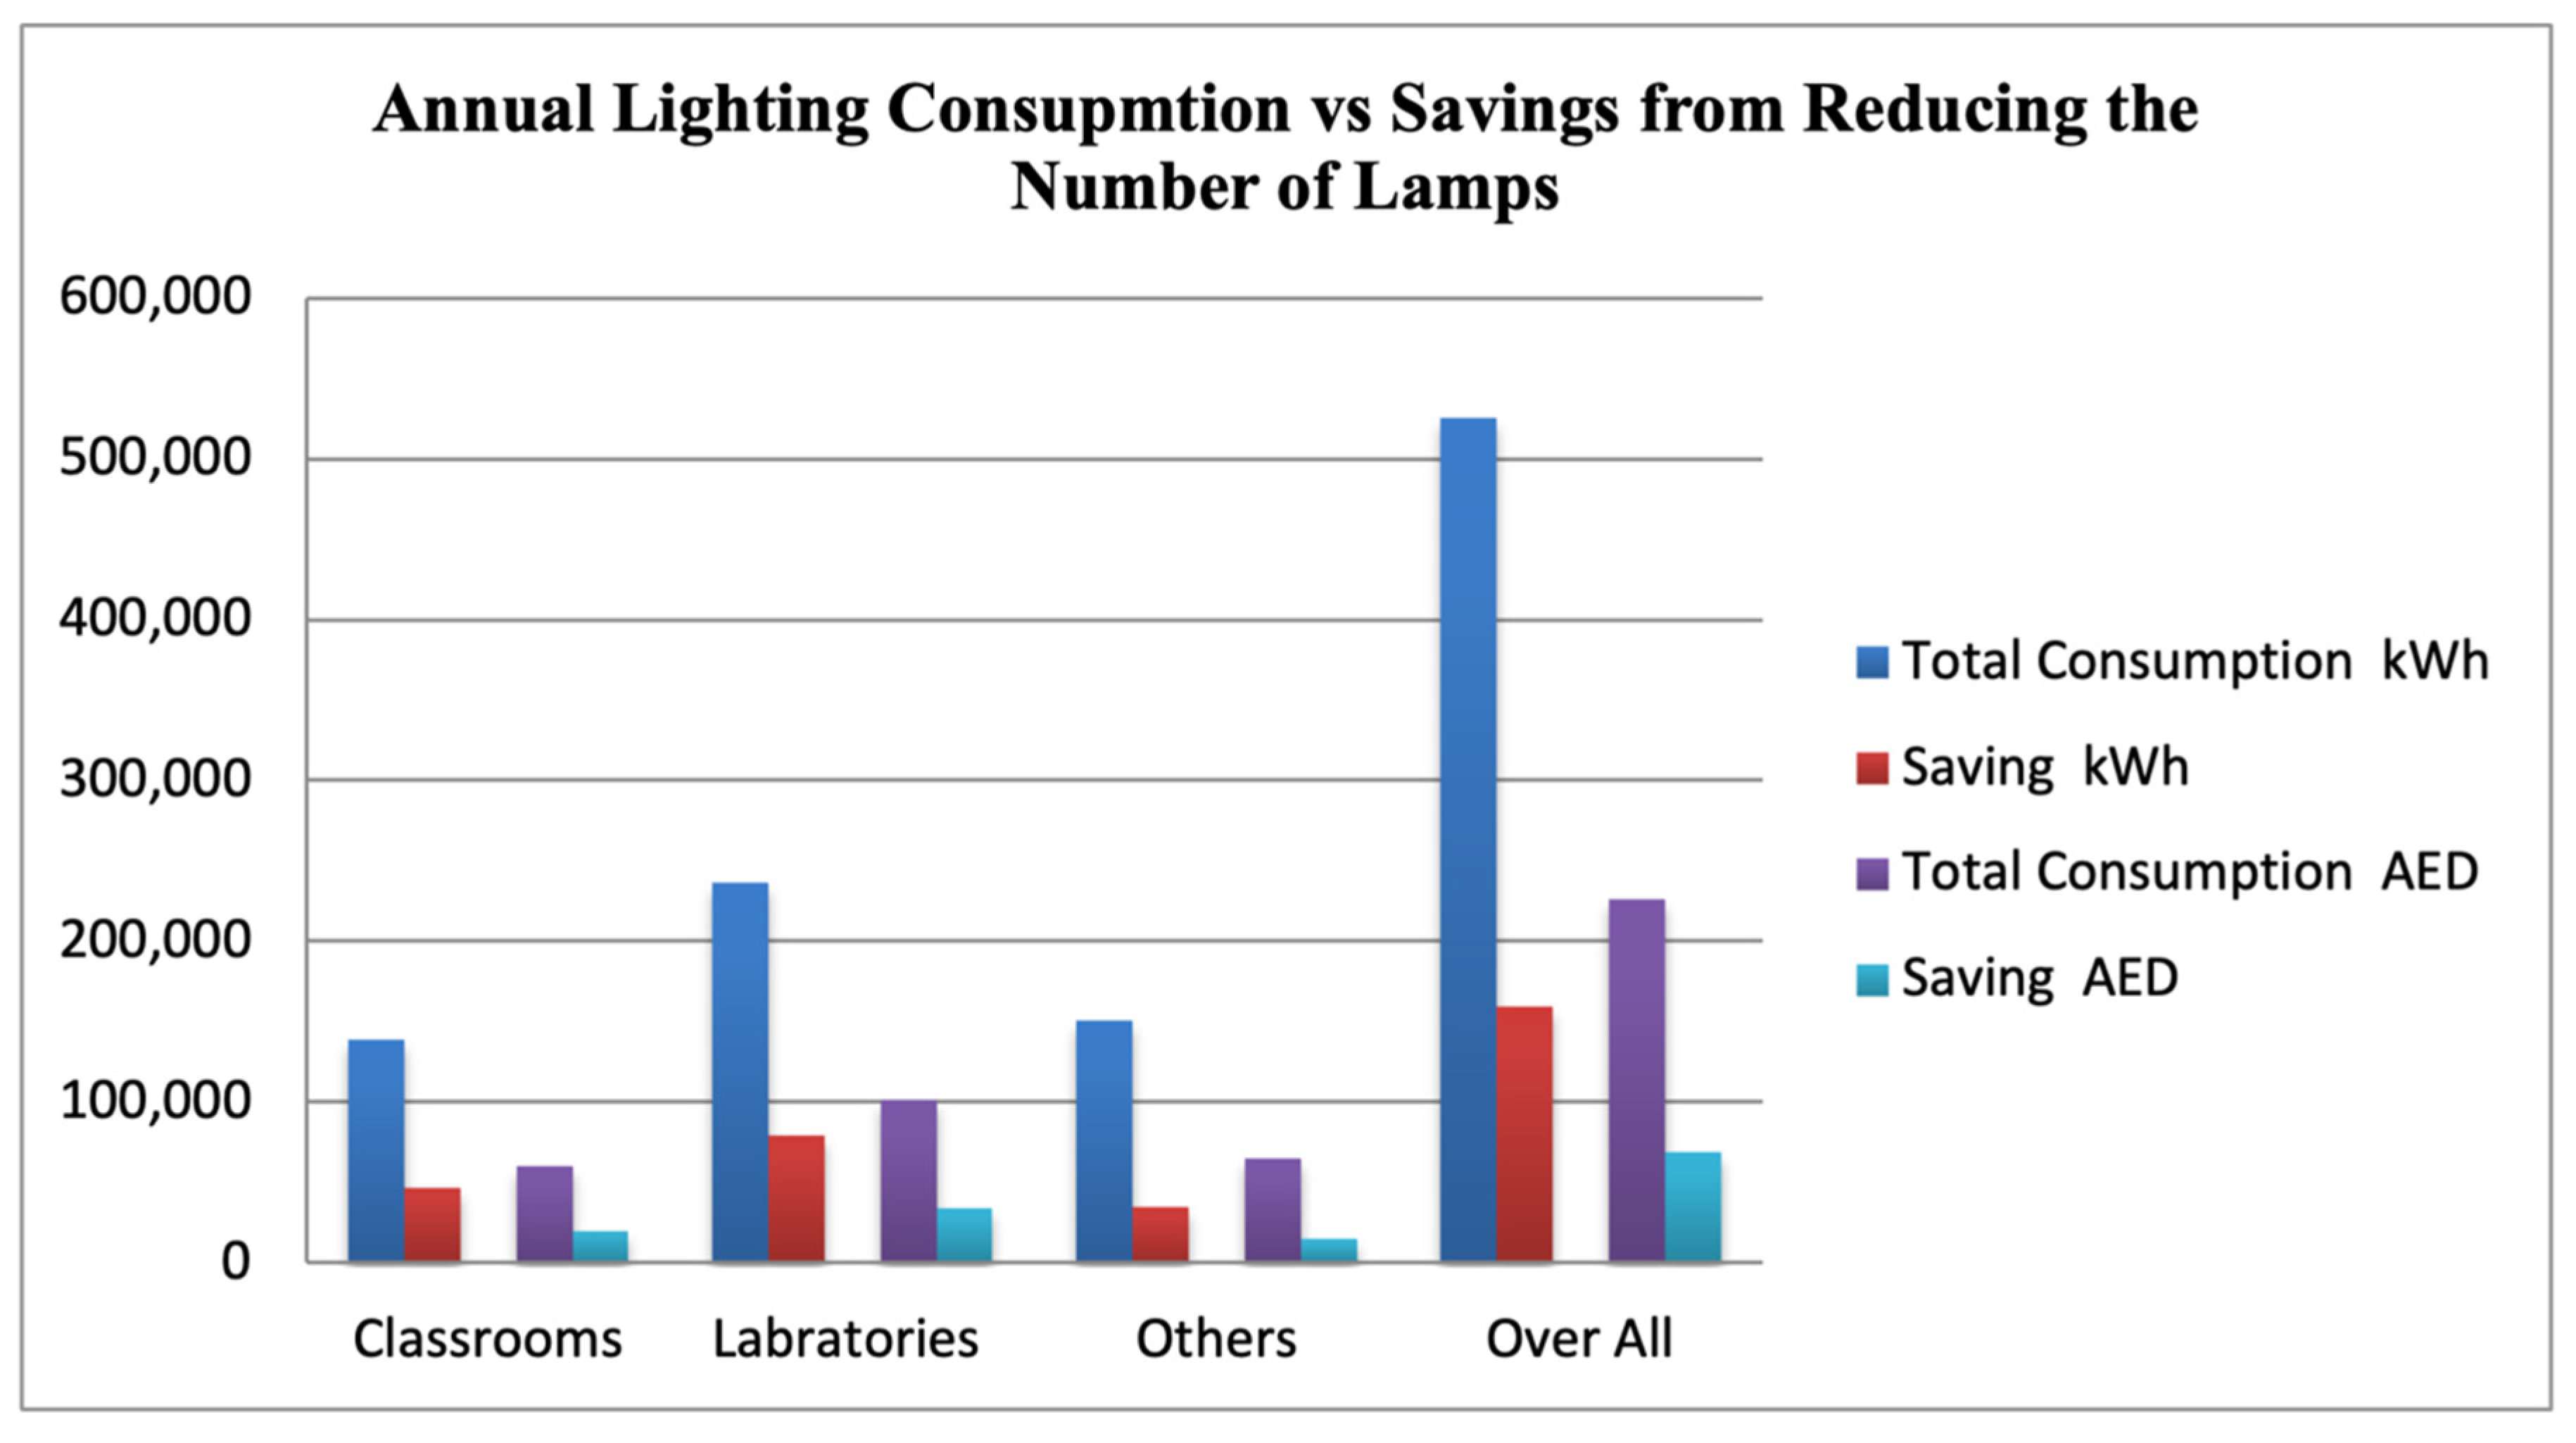
The electricity consumption from lighting can be easily reduced by 33.3% in the classrooms, laboratories, and workshops by removing 1/3 of the lamps or switching them off during operational hours. The lighting in the reception area and main corridors can be reduced by 100% during day light hours (school hours) as the readings shows an average light intensity of 140 FC with all the lights being switched off.
In order to calculate the total saving, the lighting inventory data shown in Table A14, Appendix D were used to calculate the total electricity consumption from lighting based on averaging the number of hours used annually in normal operational days (200 days) and the leave days (165 days including weekends). Figure 12 shows the annual lighting consumption and savings.
A summary of the calculations shown in Table 3 indicates that 159,548 kWh could be easily saved by switching off one third of the lights with a total annual saving of AED 68,606.
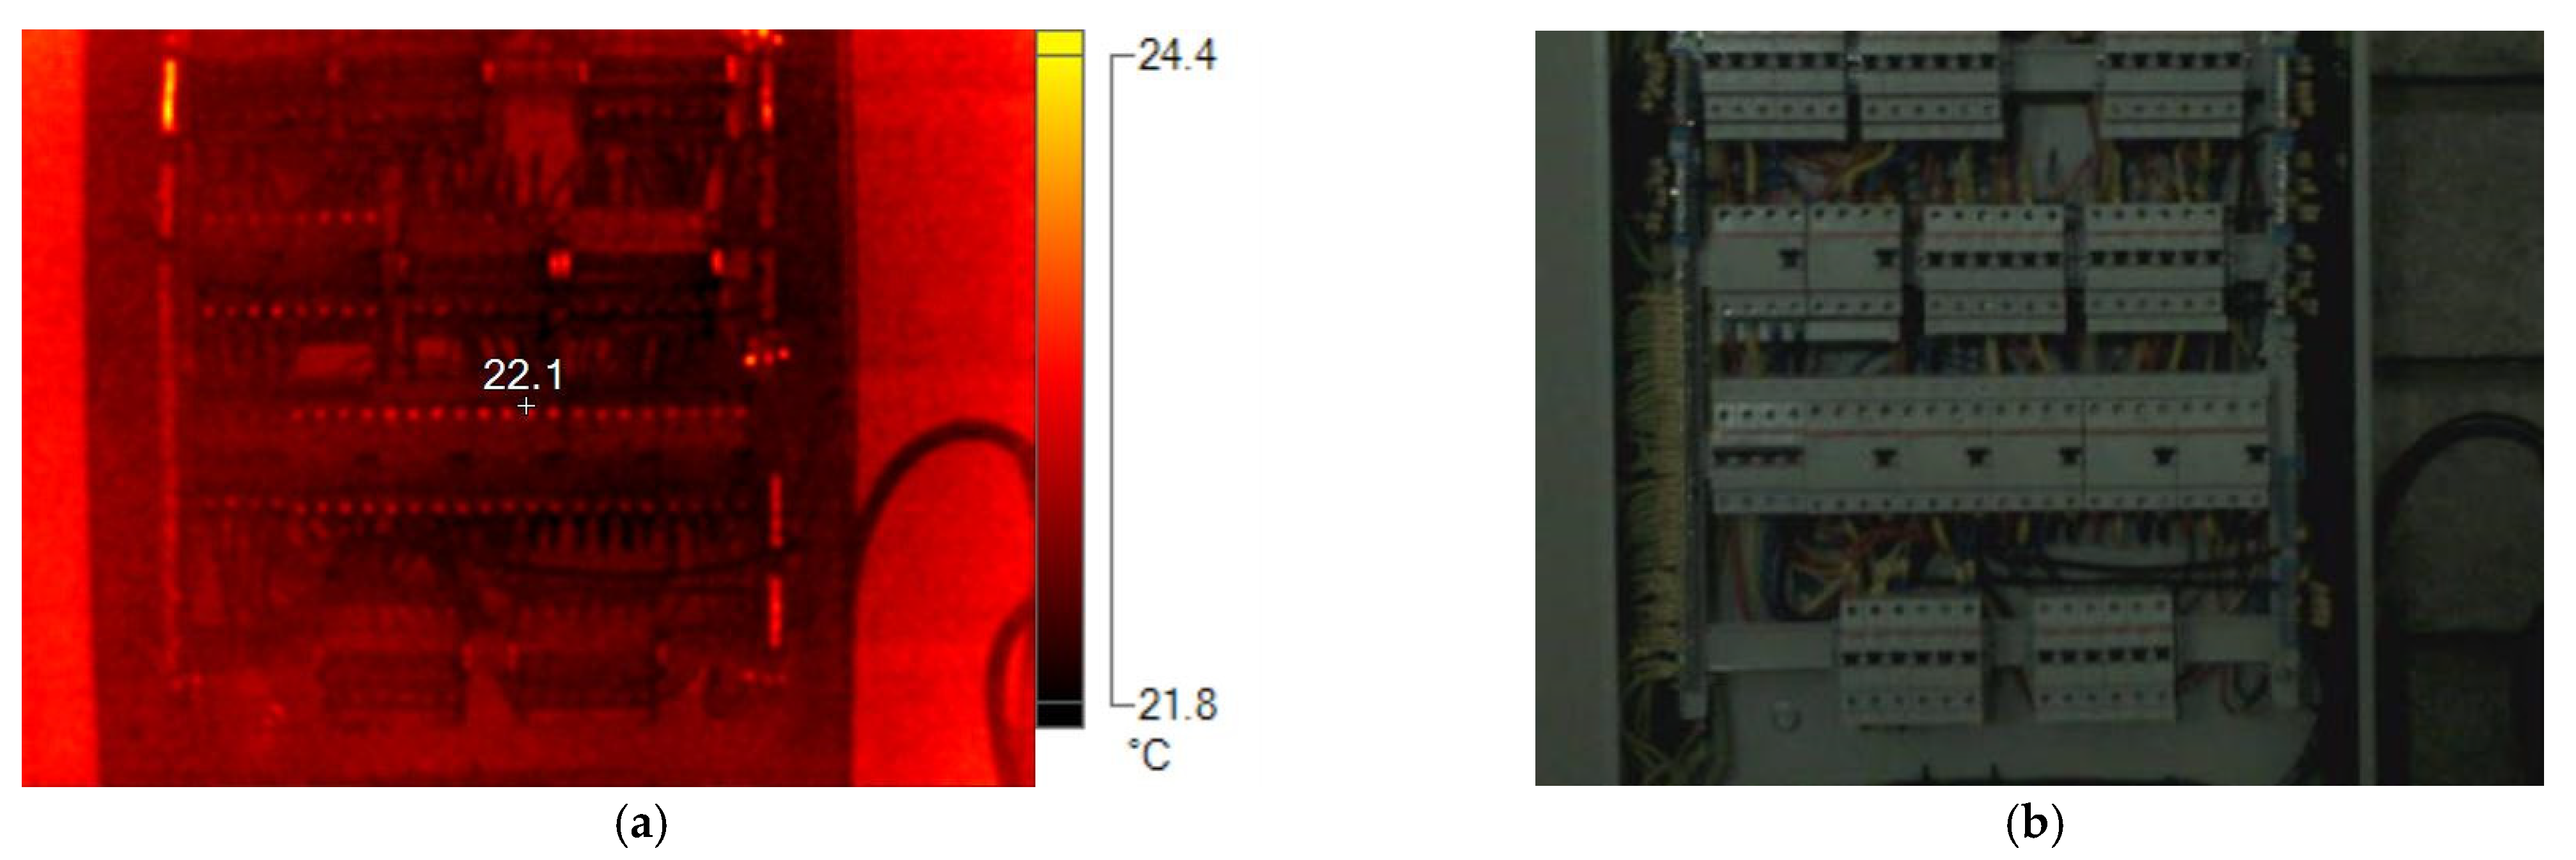
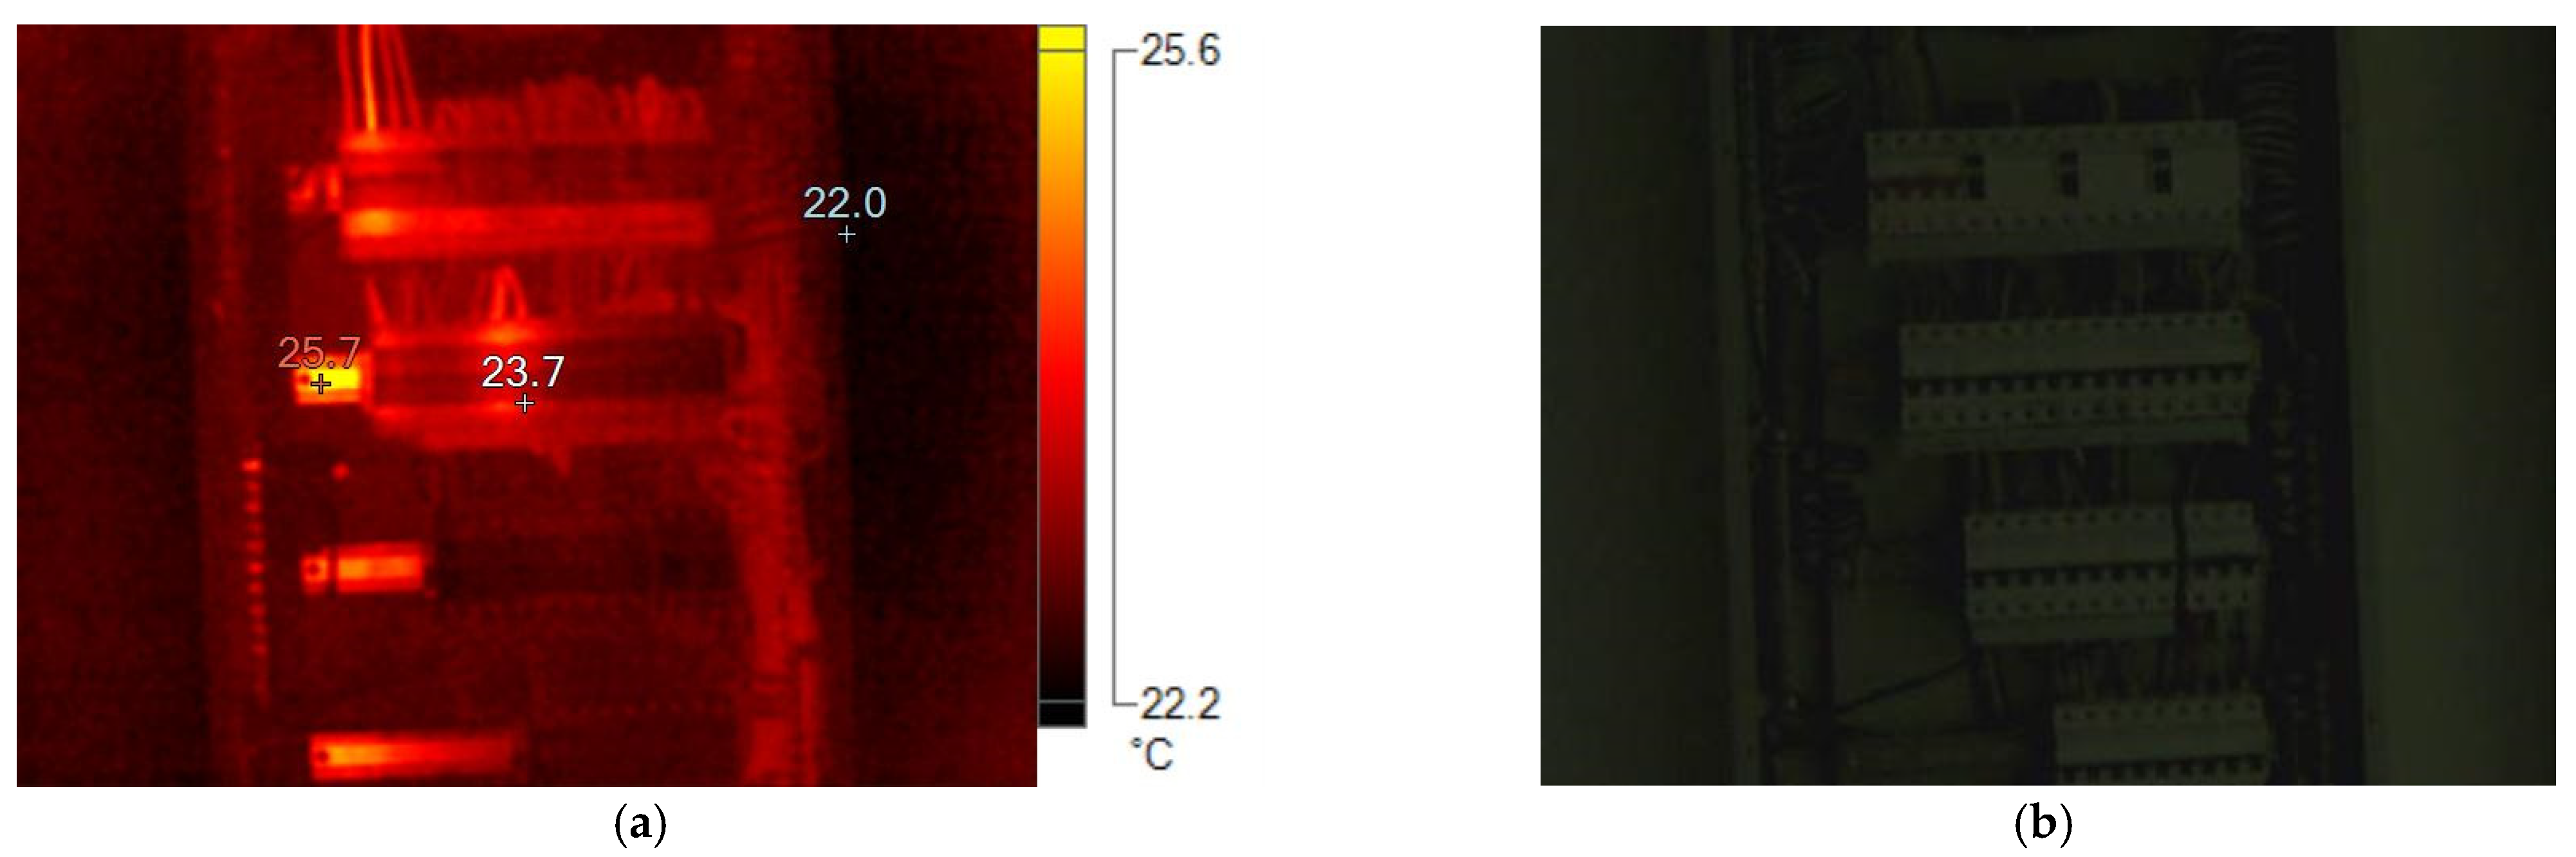
3.2. Thermography

In the study, thermography analysis was made on 16 April 2016 and the other surveys were also made around this time. The Fluke Ti200 camera [32] was used to perform the work in this survey. To classify the severity of the thermal anomalies, the temperature difference between similar distribution boards was used. Temperature from the distribution board is likely to vary based on the electrical load consumed by the equipment at that time, the ambient temperature, and its emissivity value. In general, approximately 70 distribution boards were inspected and they appeared to be in good working condition. The electrical distribution boards showed a minor temperature difference (2–3 °C) due to the load conditions. Accordingly there is no energy saving opportunity in this area.
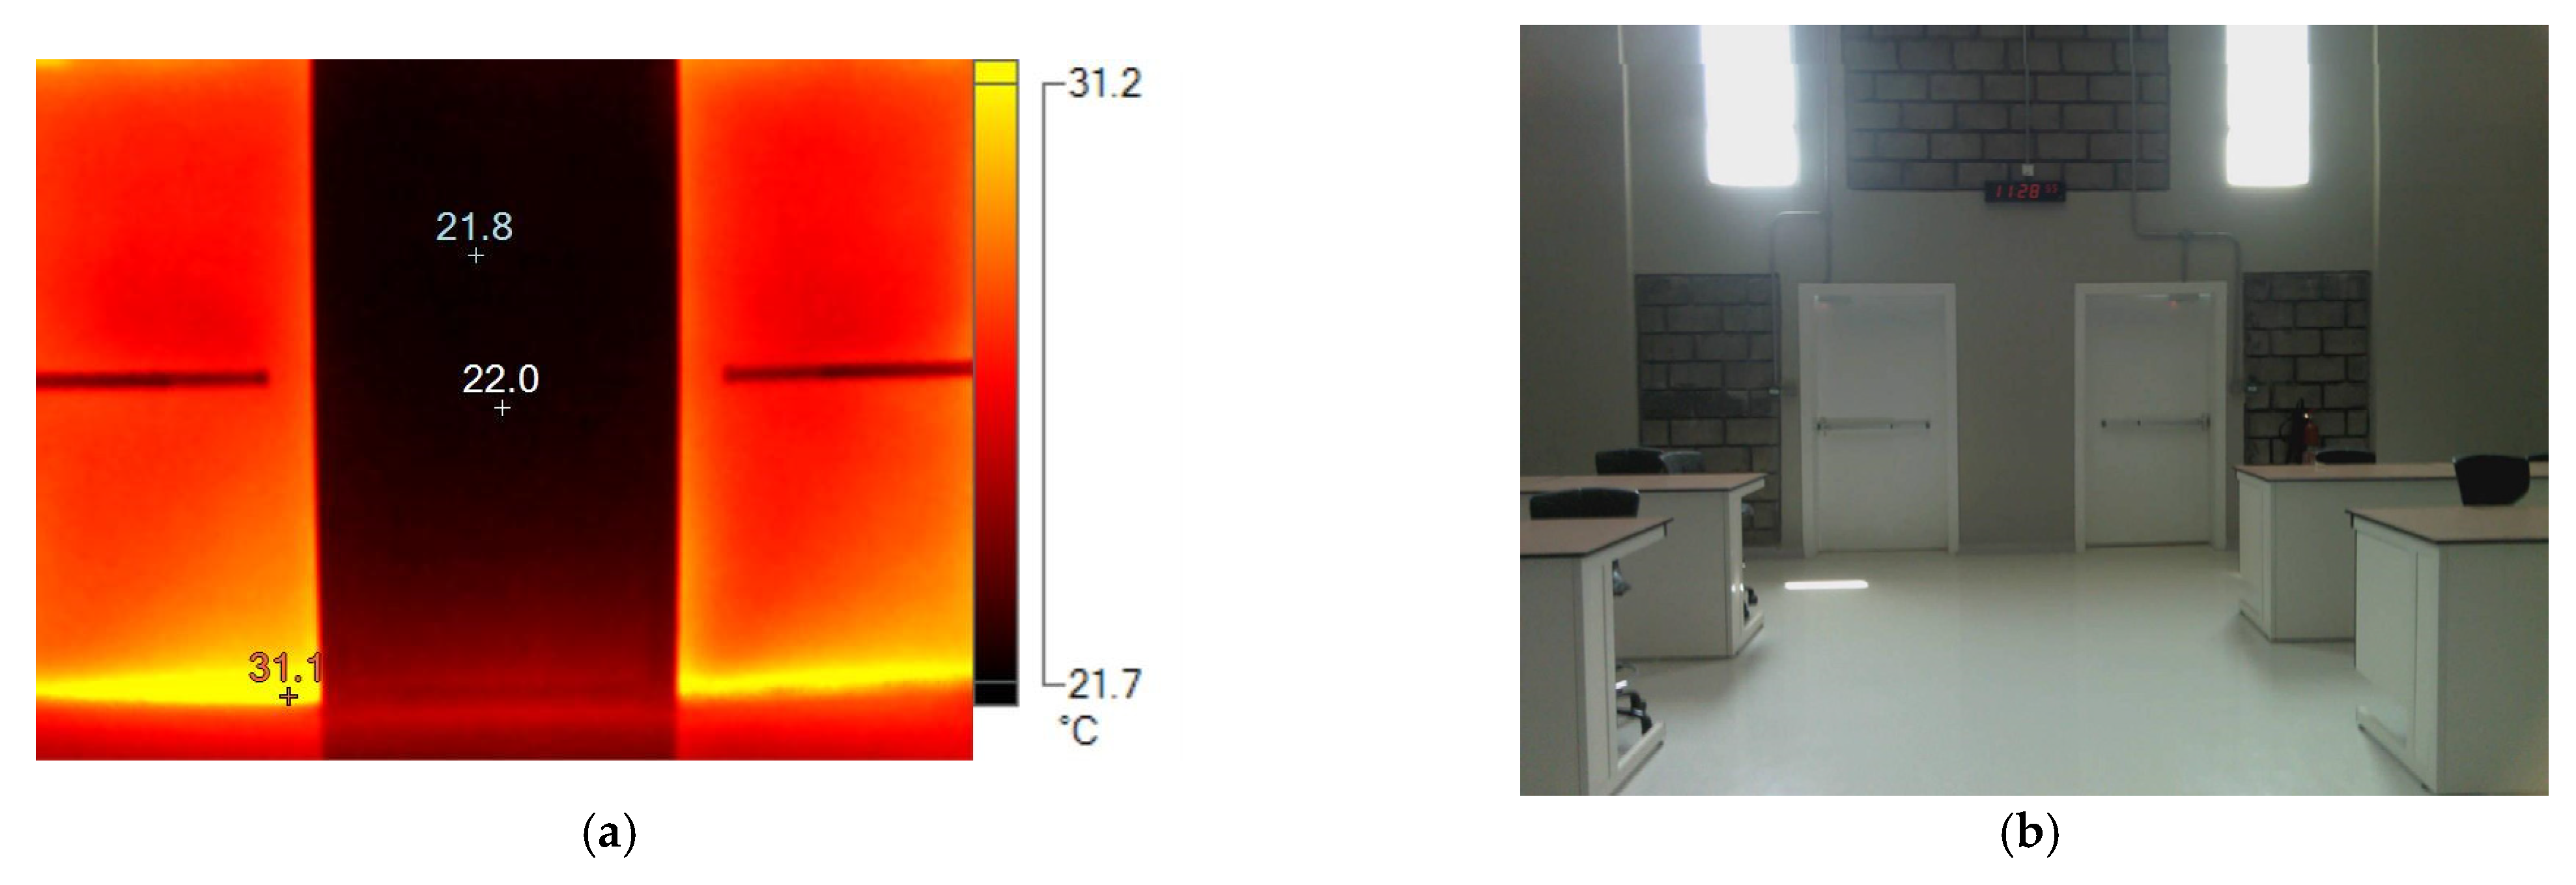
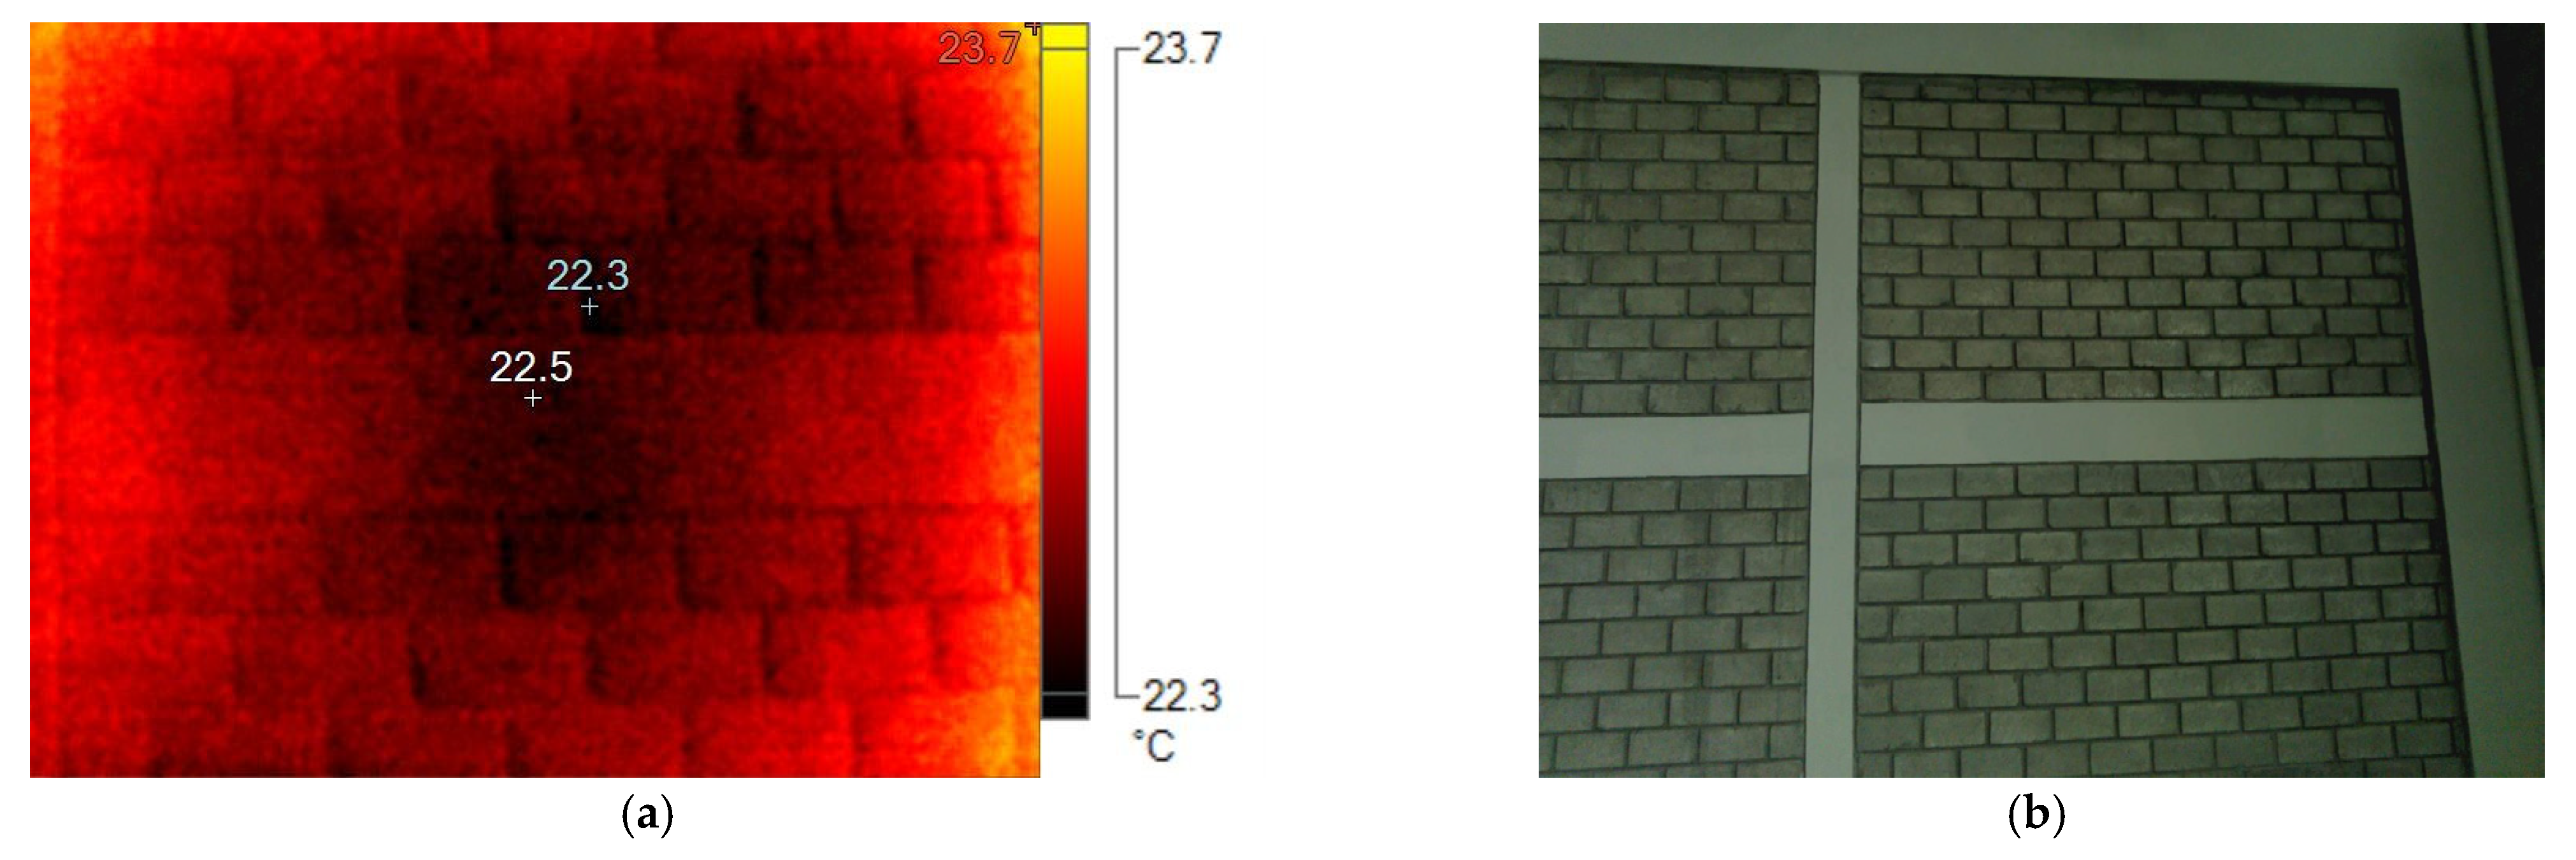
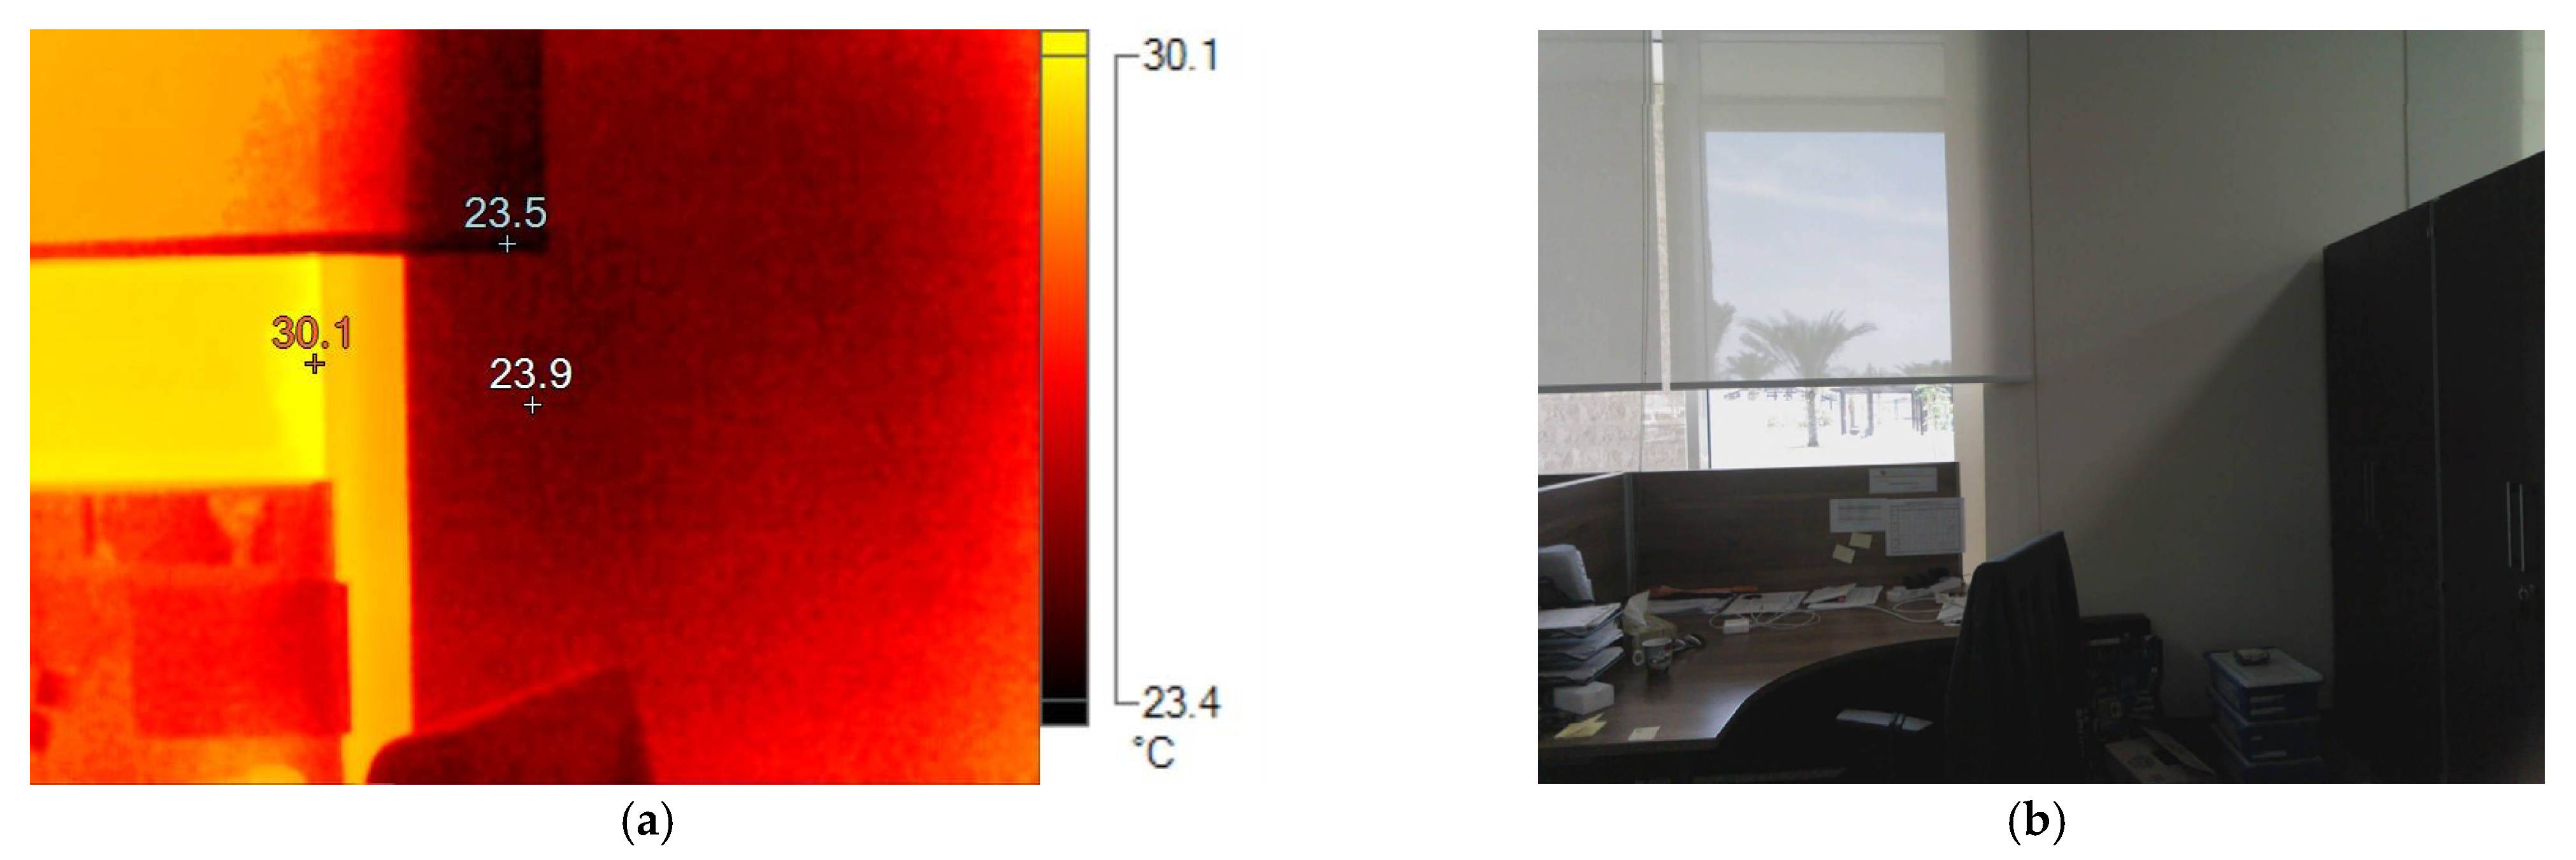
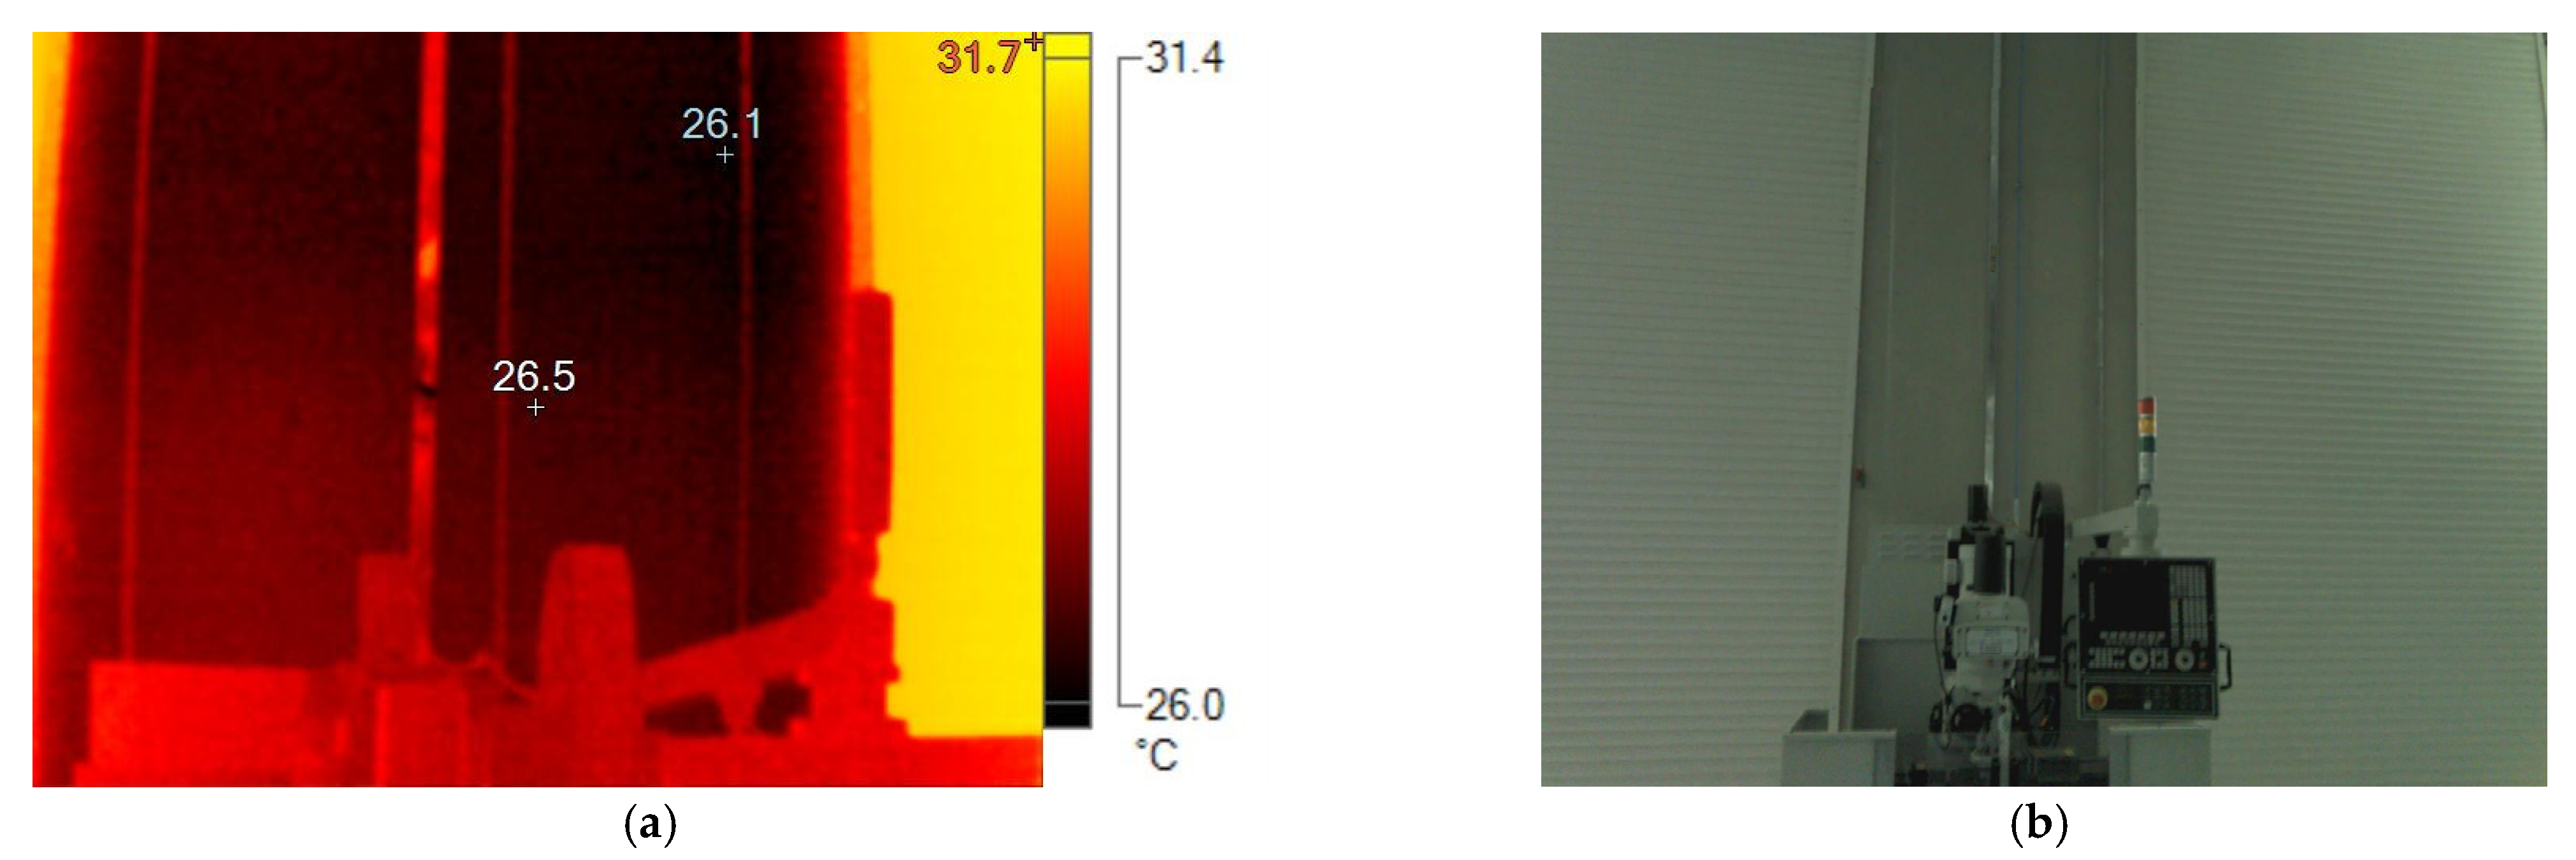
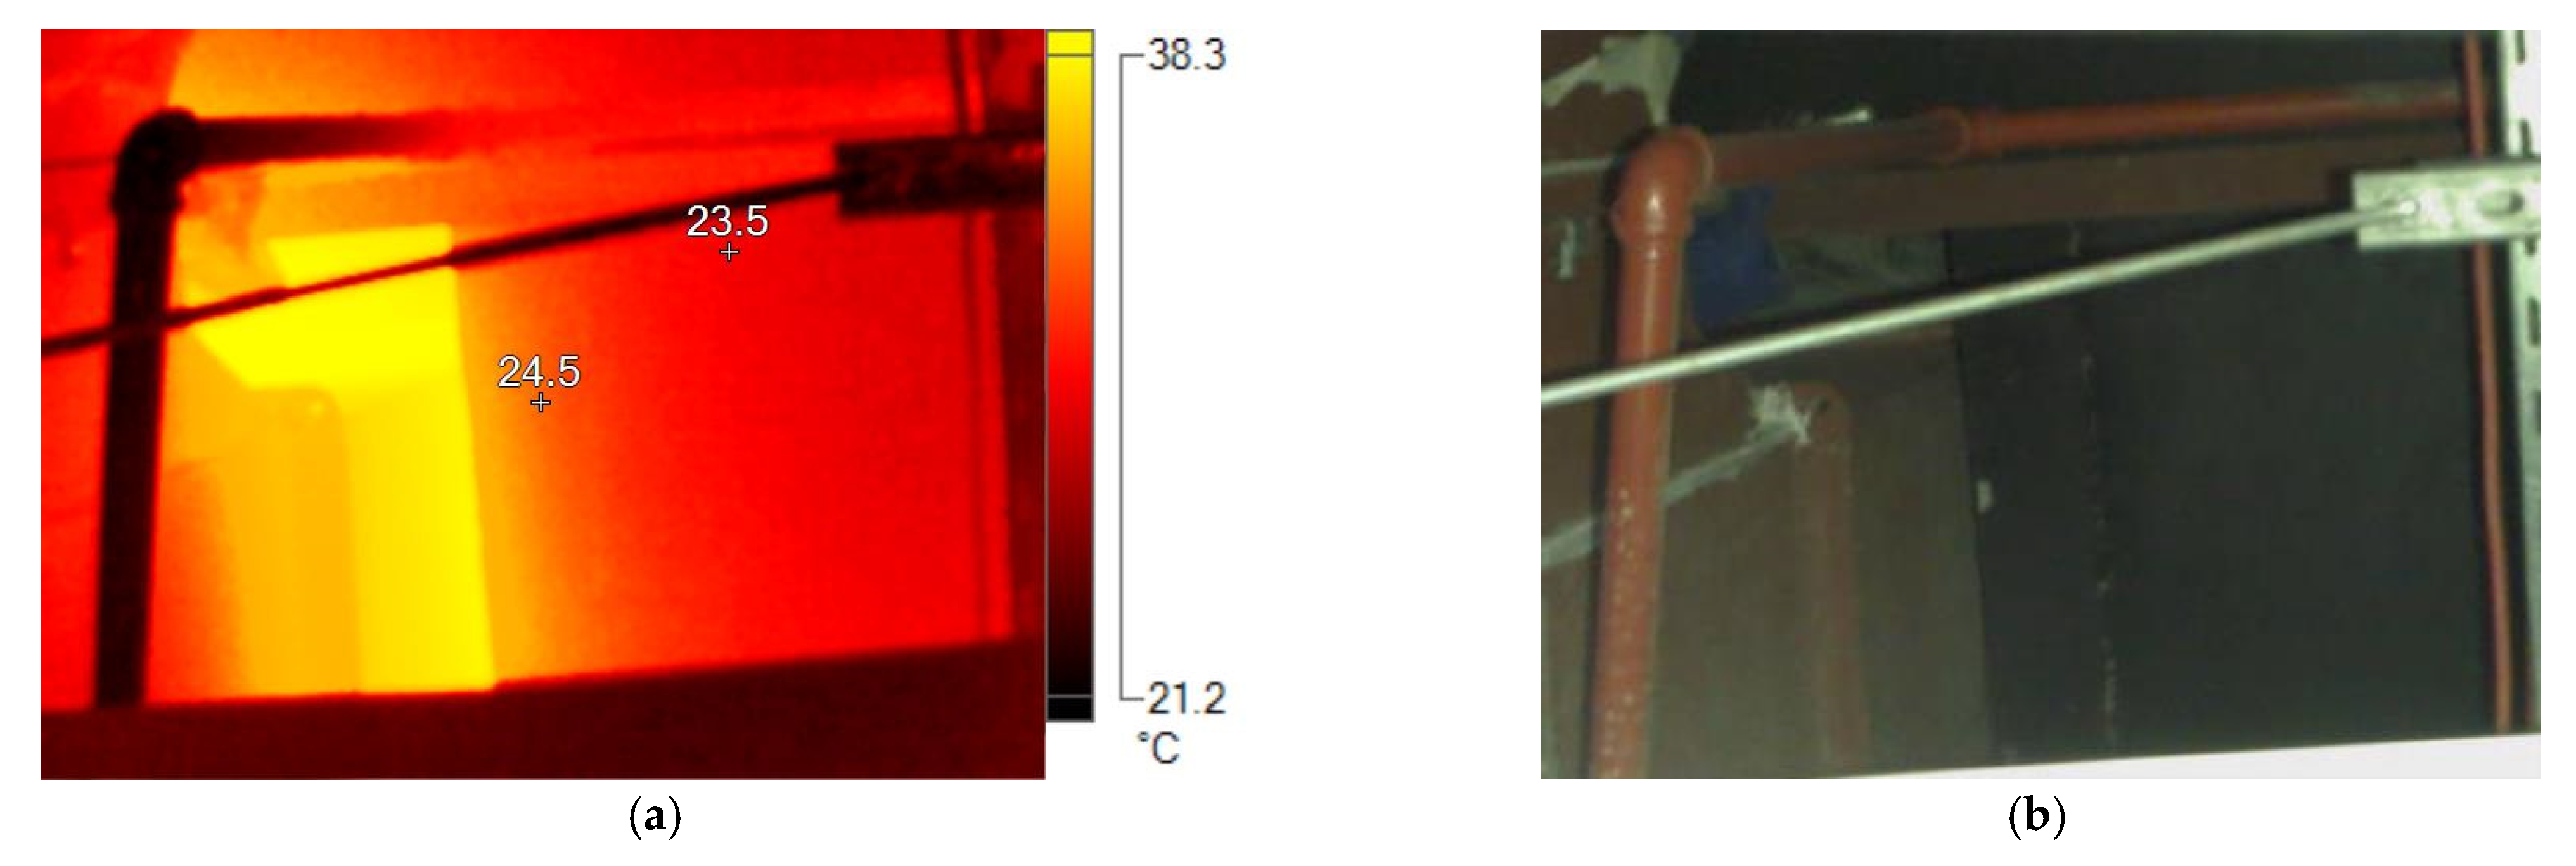
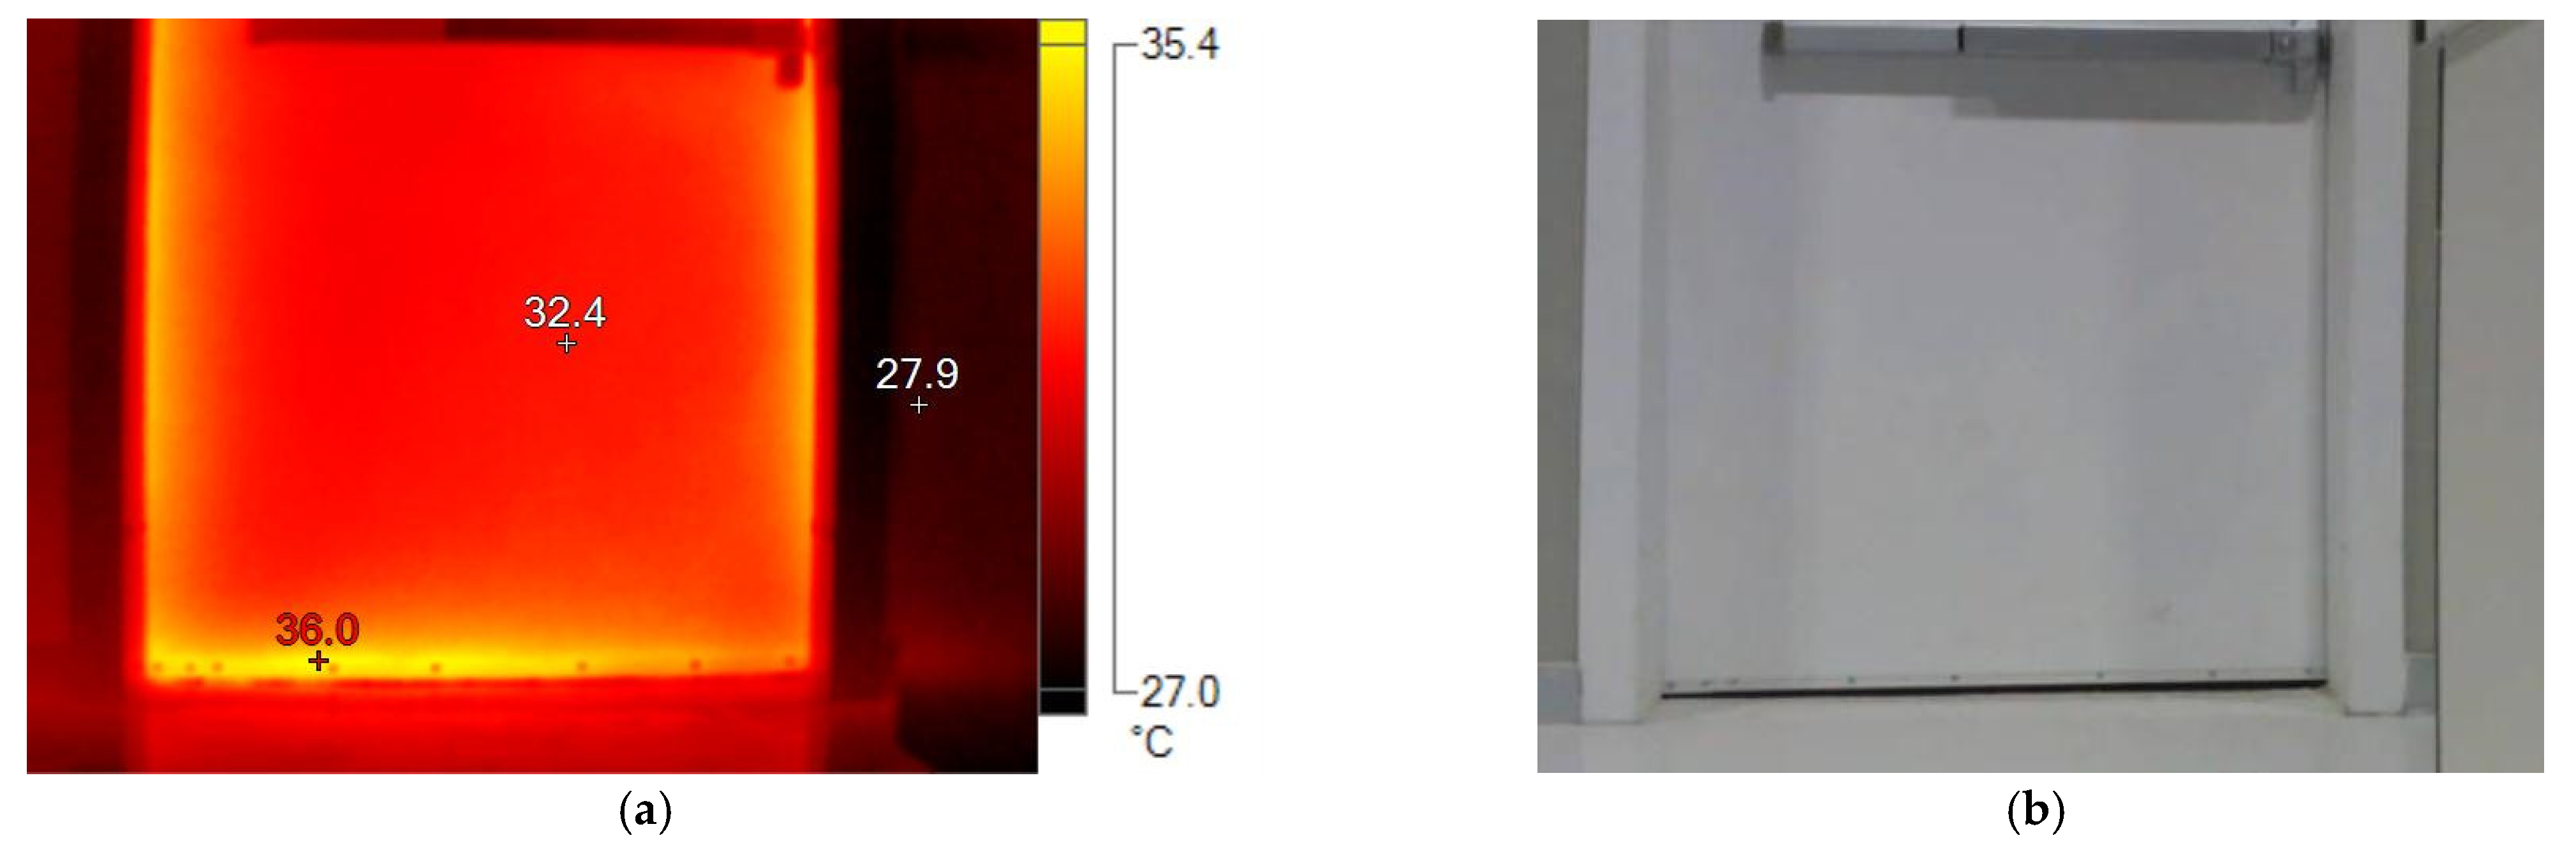
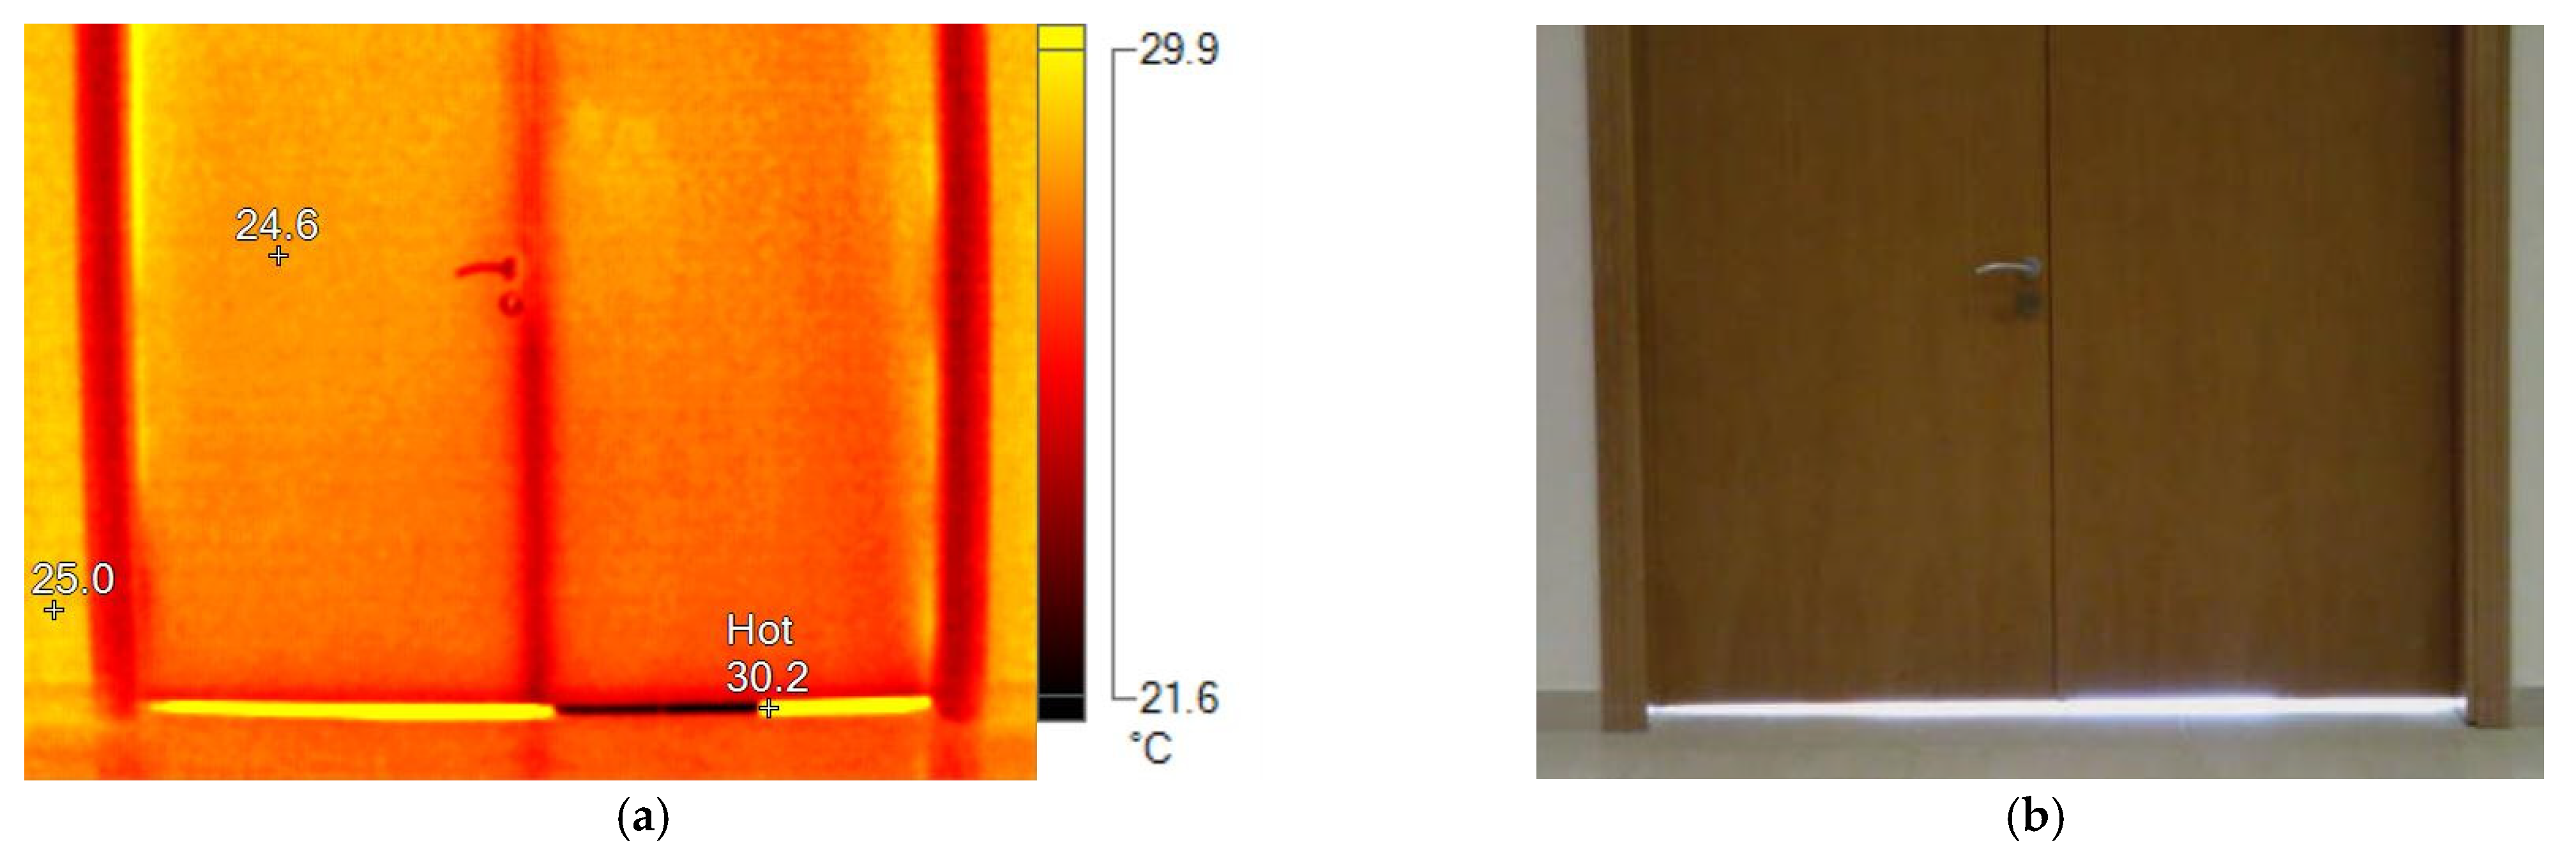
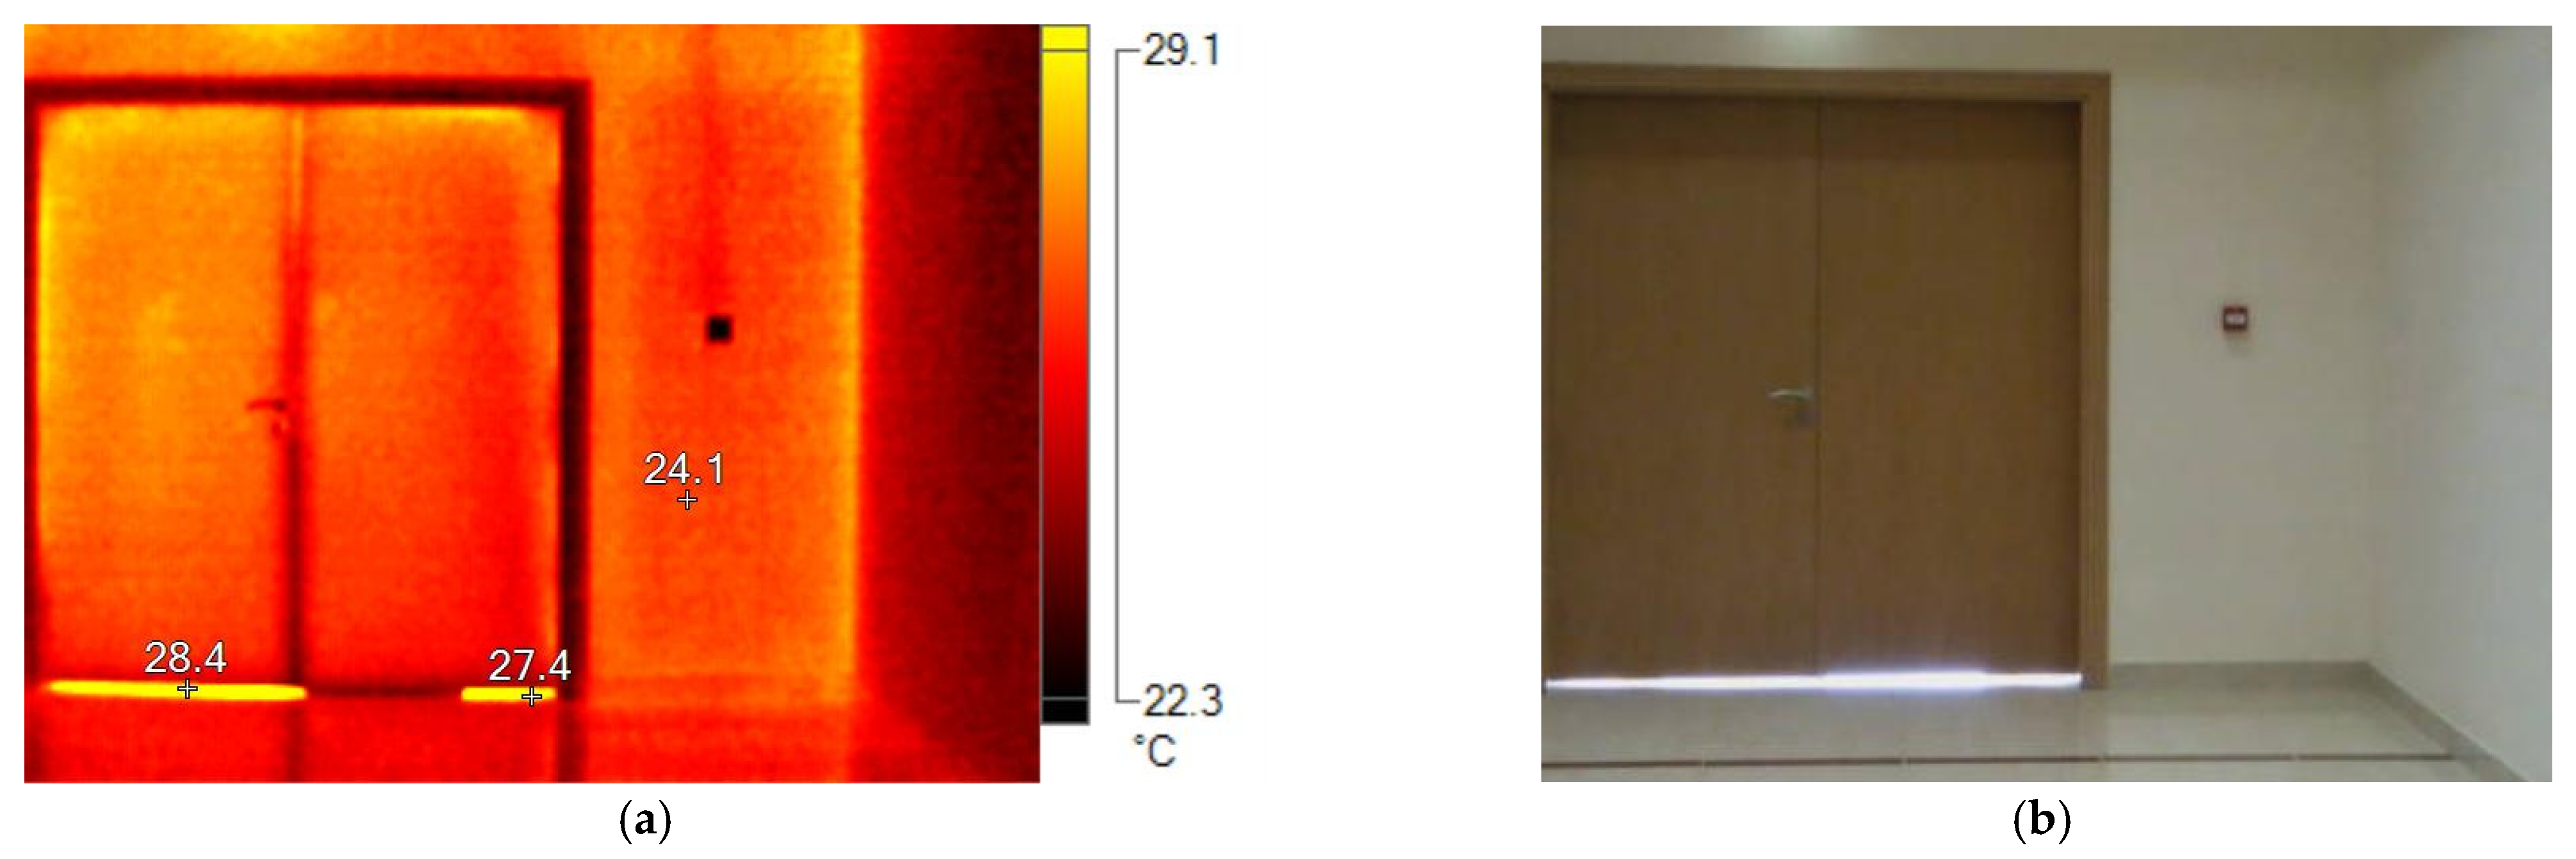
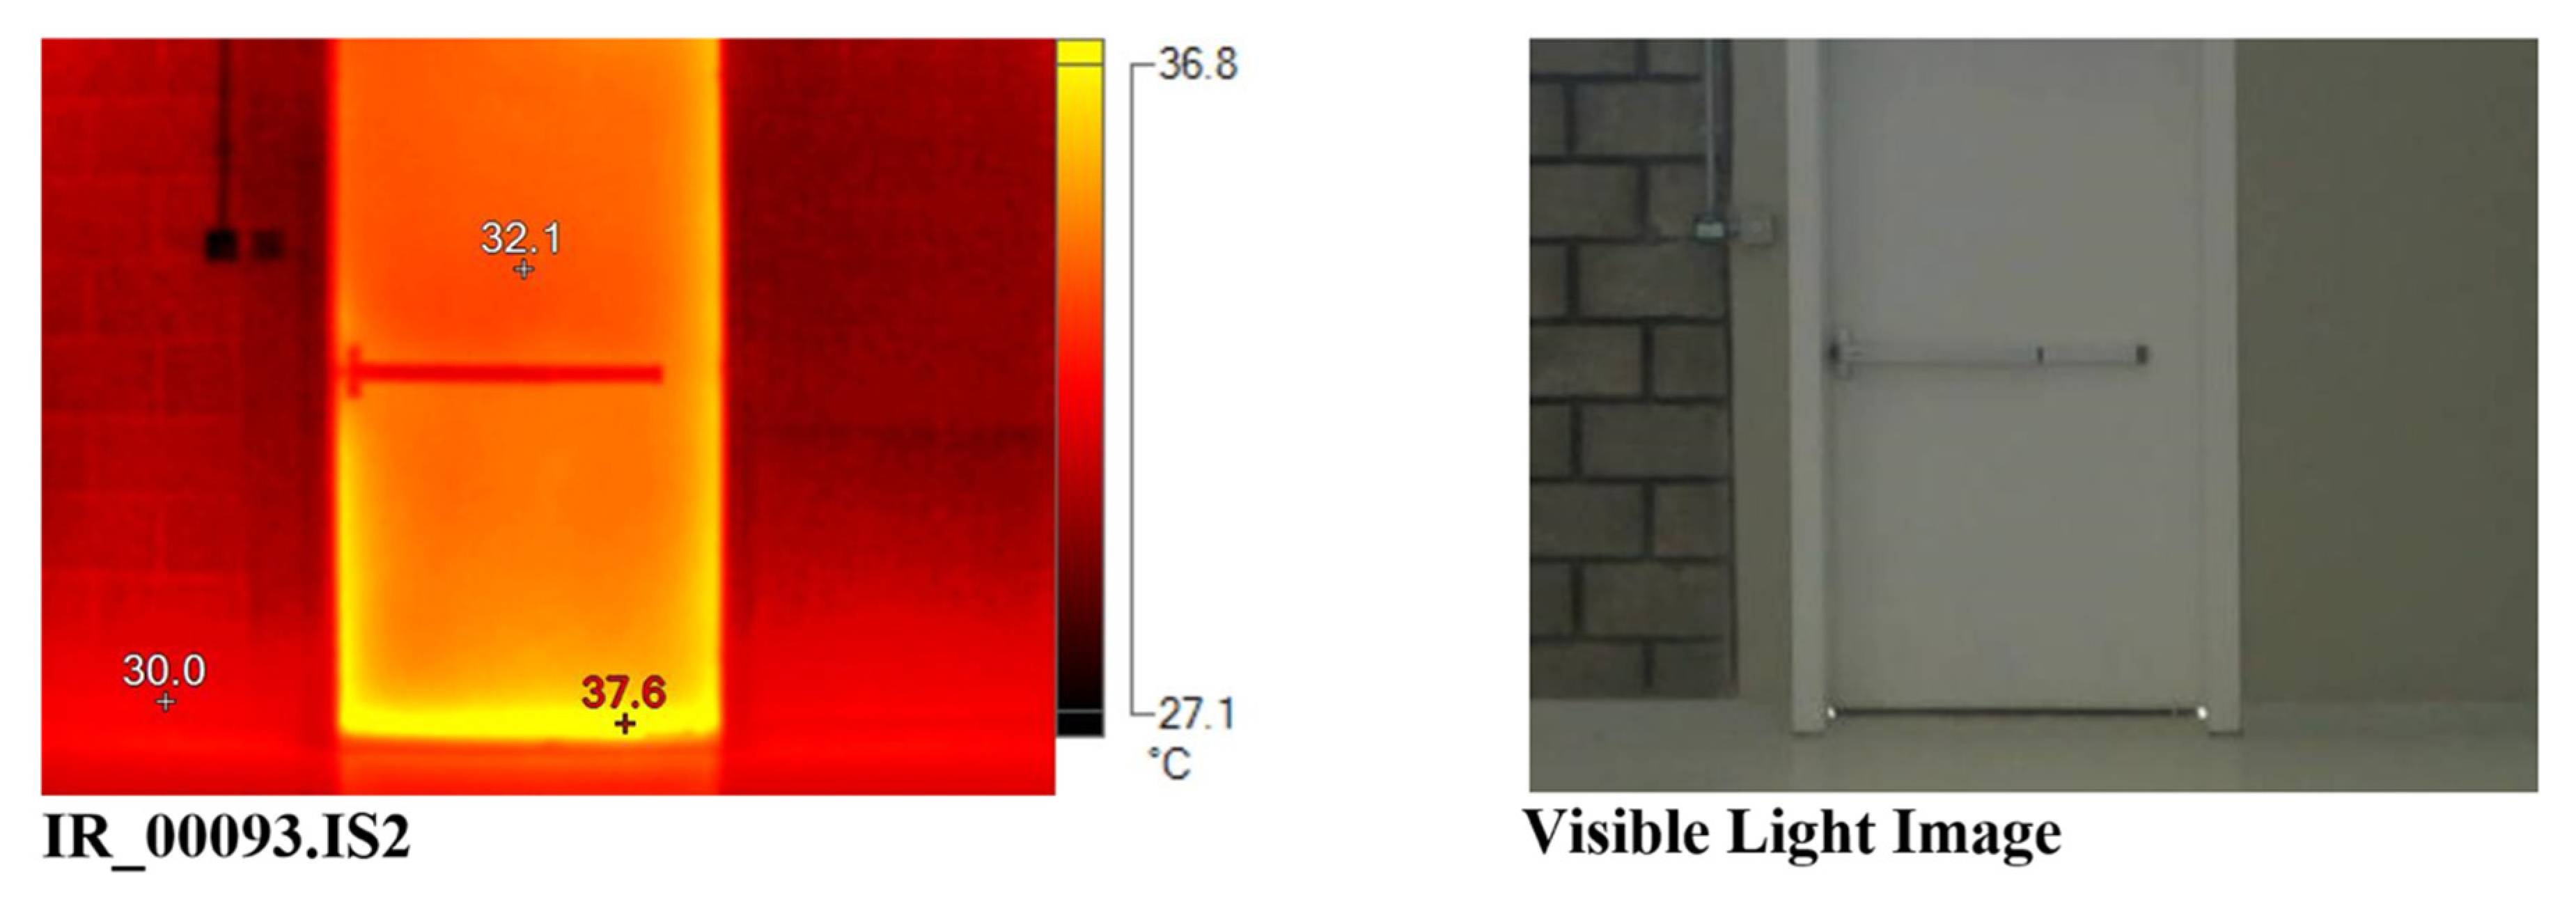
Thermography greatly helps detecting energy losses of buildings. It is applied to large buildings to help identify air leaks, insulation defects, voids within materials, moisture accumulation, and fungi formation leading to indoor air quality problems. Some Information about the buildings construction, type of roof insulation system, the location of water leaks, and other problems in the building are fundamental information that is necessary to perform an effective inspection. The building under inspection is new, the walls are insulated with a 40 mm foam board with thermal conductivity value k = 0.0227 W/mk. The roofs are insulated with a 70 mm thickness of the same material. The glass used in the envelope and windows is ASTM C1048-FTheat-strengthened and fully tempered flat glass, 6 mm thick blue from outside for shading, 16 mm air spacing, and 6 mm clear from inside (6 + 16 + 6 = 28 mm double glazing), which minimizes the heat transfer rate through the glass. Inspections are conducted at day time to ensure a minimum temperature difference between internal and external temperatures of at least 10 °C. For the building envelope, an internal inspection was performed for about 40 locations, which include interior and exterior walls, doors, and ceilings. The walls and ceilings inspected showed no noticeable temperature difference, which indicates proper insulation. However, some anomalies were found in doors. An example of these anomalies is shown in Table 4 and Figure 13. The Appendix B section of this report includes all the building envelope thermographs and doors, and Appendix C includes the distribution boards’ thermographs. Figure 13 shows that the door is not sealed properly from the bottom and the sides as they show higher temperature than the wall. The door’s body shows higher temperature than the wall due to heat conduction.
The power consumption in one of the Distribution Boards (DBs) in the campus over one week is analyzed. The analysis took place from 30 April to 7 May and Fluke power analyzer was used to read the data. The results were expected to help us understand the power distribution and energy loss between work days and weekends, and between morning and night shifts as the DB was limited to the air handling units. However, the data could not be interpreted in such a way as to explain the main reasons for the huge power consumption in the school. The school, just like others, utilizes a three-phase power system. In a three-phase power supply system; three conductors are present and each one carries an alternating current of the same frequency and voltage amplitude relative to a common reference, but with a phase difference of one-third the period. The common reference is usually connected to ground and often to a current-carrying conductor called the neutral. Due to the phase difference, the voltage on any conductor reaches its peak at one third of a cycle after one of the other conductors and one third of a cycle before the remaining conductor. This phase delay gives constant power transfer to a balanced linear load.
Fluke analyzer offers an extensive and powerful set of measurements to check power distribution systems. Some give a general impression of power system performance and others are used to investigate specific details. In our testing, we used the analyzer to read the power in watts of one DB by properly connecting the analyzer and DB. The DB used in the testing controls two air handling units that are always running, morning and night every day, thus the trend of the power over all days was found to be almost the same.
Fluke analyzer measures some of the important power parameters and displays the power trending as changes over time for all the measuring values. The power calculations are based on the Unified Method developed at the Polytechnical University of Valencia, and build upon the IEEE1459 standard. Furthermore, the calculations are conducted for the Fundamental and Full frequencies. The Fundamental considers voltage and current only at the fundamental frequency (50 Hz in our case) for power calculations, whereas Full uses the full frequency spectrum (including harmonics and noise). In the experiment, only the total fundamental power was analyzed.
The averaged power consumed over the week (30 April–7 May) was around 9.5 kW and it goes up to 10 kW in the worst case scenario. To fully analyze and differentiate between the amount of power consumed during different time intervals, we have split the data into two periods. The first period belongs to the weekdays with an average power consumption of 9.487 kW, while the other one is for the weekends with an average of 9.3 kW.
The goal of this task was to identify, in order to optimize, some of the largest loads in our campus, where the most obvious one out of these loads is the air-conditioning system. Unfortunately, we could not use the main DB due to safety concerns and substituted our testing with a smaller one. Since the tested DB controls air handling units, which is always operating, the trend of the power consumption during weekdays and weekends was almost the same, and no obvious drift was found.

3.3. Energy Conservation Measures (ECM) and Economic Analysis

The energy audit conducted includes a comparison with benchmarked consumption rates at other similar facilities, and conducts a walk-through to visually identify energy savings and non-savings trends. A better understanding of the energy consumption pattern should lead to easier identification of more viable and cost-effective energy conservation measures, thus reducing operation costs in the long run. The recommendations and Energy Conservation Measures suggested in this report are based on the analysis of the school facility systems as well as the current practices of the staff and students.
ECM-1: Installing motion sensors in all the classrooms and labs. Installing a motion sensor in all classrooms, and labs, could help in reducing the amount of energy consumed and eventually the school electricity bill. The cost of installing motion sensors in classrooms, and labs will be approximately AED 20,000 the savings are expected to be AED 93,691 annually. Accordingly, the payback period is 2.6 months.
ECM-2: Remove the extra lamps as only 2/3 of all the classrooms and labs lights should be used during the school day. This could be achieved by removing 1/3 of the lamps or adjusting the control so that only 2/3 of lamps are switched on. The school lighting survey showed that most of the facility is over-lit when compared with international standards. The lighting economic analysis showed that an annual saving of AED 68,606 could be achieved by adjusting the light intensity to match international standards.
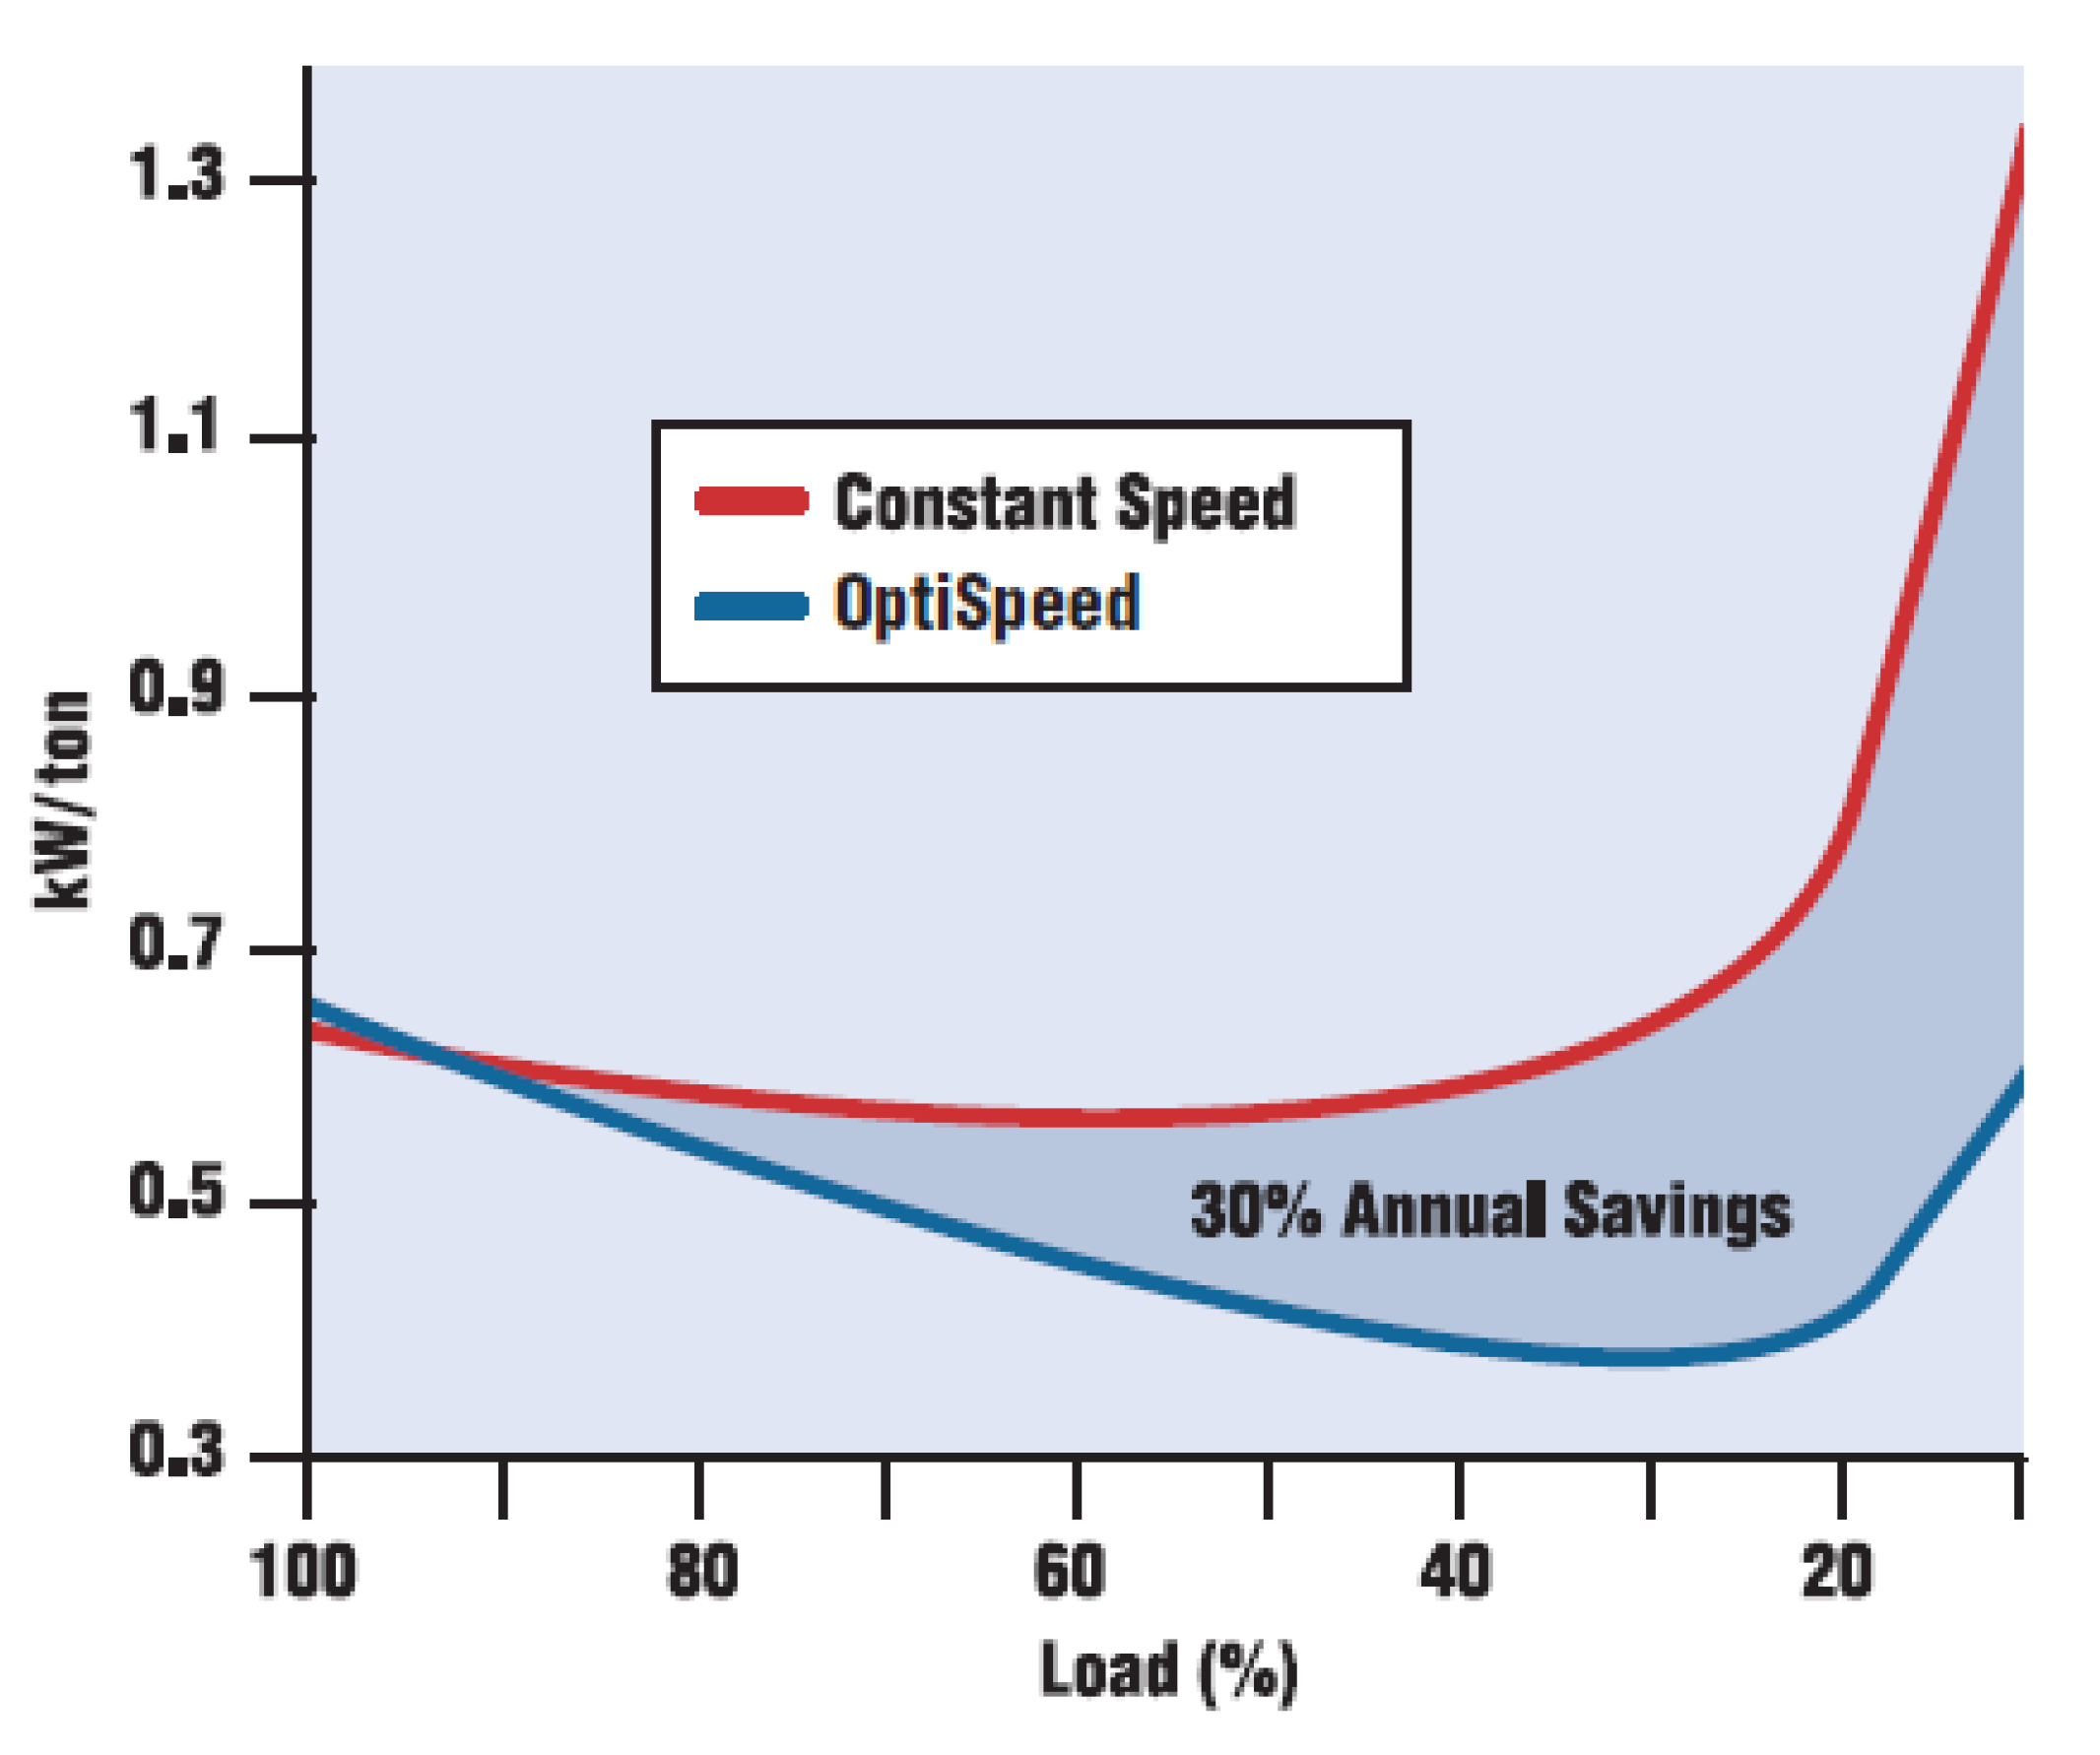
ECM-3: Integrating the Networked Optimization Software with the current HVAC automation system. In order to optimize the HVAC system consumption, it is recommended to use a Networked Optimization Software that can be integrated with the current automated system. The optimization software is developed by Johnson Control so it can be fully integrated with the current HVAC system for central plant optimization. The optimization software offers a relational control algorithm so that the control set points are calculated based on real time building load inputs received from the building automation system. A minimum of 10% savings could be achieved by utilizing the optimization software solution [33]. As per the current HVAC system annual consumption calculations, approximately 469,000 kWh could be saved annually, which is around AED 202,000. The software installation and commissioning cost is AED 90,000 and, accordingly, the payback period is approximately 5.4 months.
ECM-4: Both wooden and shuttle doors in the workshop to be checked and sealed, and it is recommended to add sweepers to all the exterior wooden doors. The thermography survey for the building envelope shows that the envelope is well insulated (roof and walls) based on the captured thermographs. The glass used in the envelope and windows is ASTM C1048-FT heat-strengthened and fully tempered flat glass, 6 mm thick blue from outside for shading, 16 mm air spacing, and 6 mm clear from inside (6 + 16 + 6 = 28 mm double glazing), which minimizes the heat transfer rate through the glass. The exterior wooden doors and the shutter doors in the workshop area are not sealed properly as shown in Appendix B, and the doors do not have sweepers, which leads to infiltration and waste of energy.
ECM-5: The temperature has to be set at 24 °C in all the campus facilities, and all stakeholders are to monitor the implementation of this measure and report any misuse to reduce the energy waste in the campus. The current practice in the campus, based on the survey findings, is that most of the teachers and students are setting the temperature between 18 °C and 22 °C and the majority felt the cold conditions and opened the windows due to coolness.
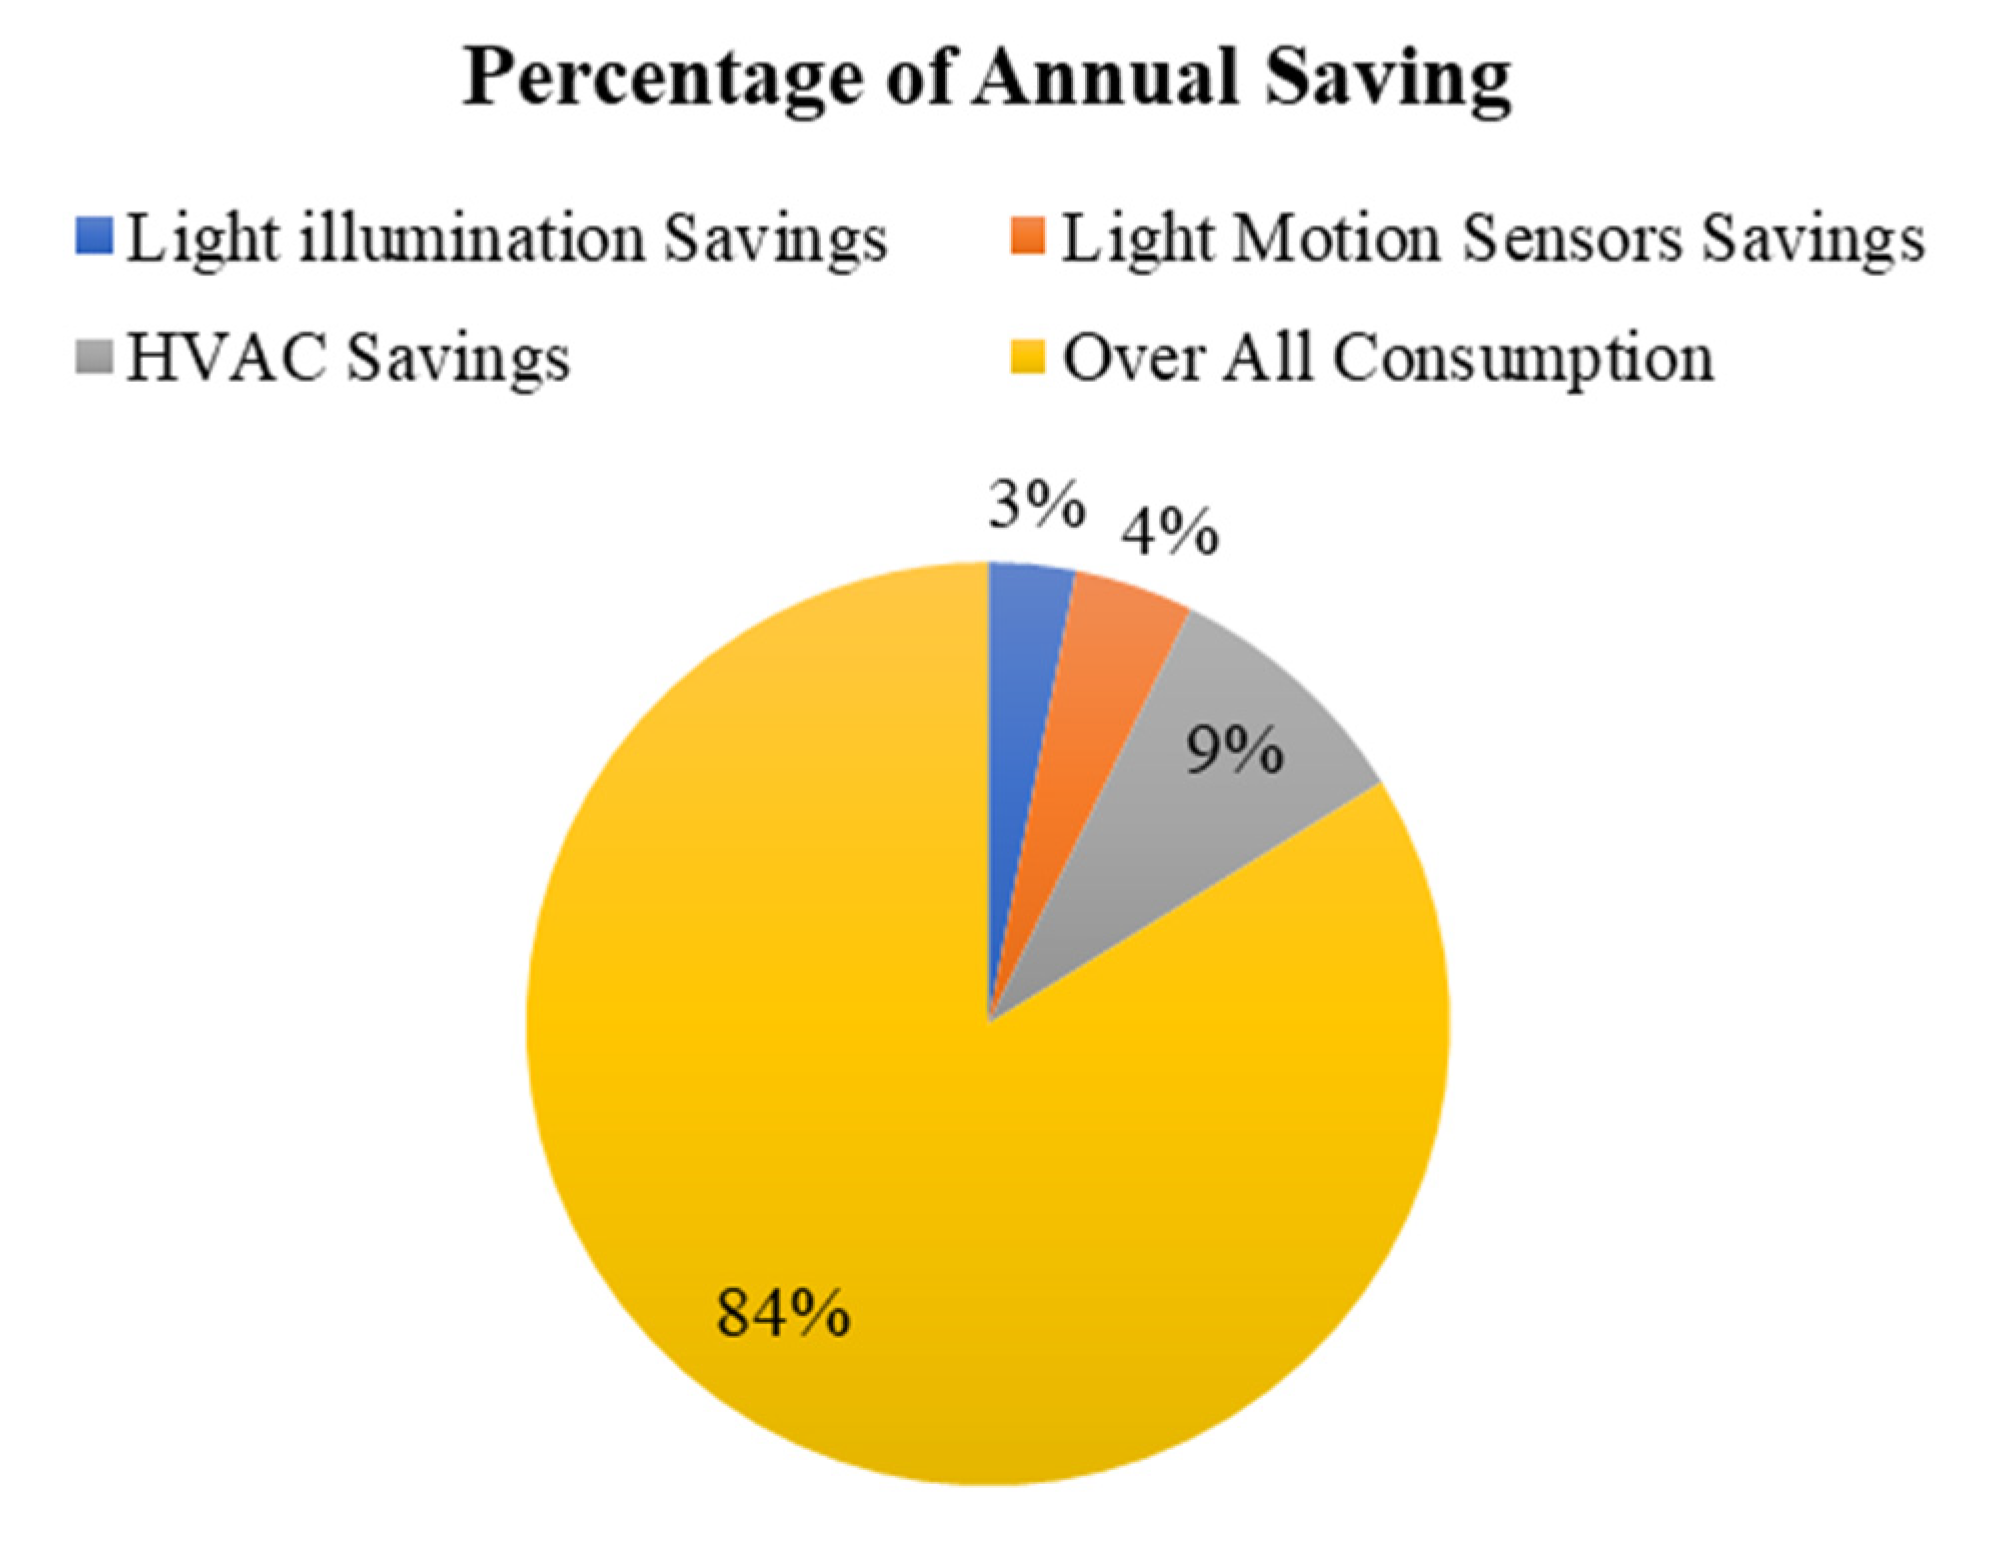
Figure 14 shows the expected savings in kWh and AED if ECMs 1–3 are to be considered. A total savings of AED 364,000 could be achieved. Figure 15 shows a pie chart of the total saving percentage from each ECM.
Based on the survey, walk-through observations and the investigation of current practices, further savings could be achieved by considering ECMs4 and 5. However in order to quantify the savings, the energy consumption should be monitored for one year starting from implementation.

4. Conclusions

In this paper, the work conducted to study the status of energy efficiency and conservation at a school building is reported. Energy audit supplemented by thermography and power analyzer measurements was described and an awareness survey of school population was conducted. The energy audit on the school building was considered to study the energy consumption levels and set policies and strategies to reduce those levels. The annual electrical consumption at the school was analyzed and compared with similar school buildings in the US. The school lighting survey showed that most of the facility is over-lit when compared with international standards. The lighting economic analysis showed that an annual saving of AED 68,606 could be achieved by adjusting the light intensity to match international standards. Installing motion sensors in all classrooms, and labs, was proposed to reduce the amount of energy consumed and eventually the school electricity bill. The cost of installing motion sensors in classrooms, and labs is approximately AED 20,000 and the savings are expected to be AED 93,691 annually. The payback period for installing motion sensors is approximately 2.6 months. In order to optimize the HVAC system consumption, it was recommended to use a Networked Optimization Software that can be integrated with the current automated system. The cost of the software is AED 90,000 and the anticipated annual saving is approximately 469,000 kWh, which is around AED 202,000 and, accordingly, the payback period is approximately 5.4 months. The thermography survey for the building envelope shows that the envelope is well insulated (roof and walls) based on the captured thermographs with heat tempered double glazed windows. Some exterior wooden doors as well as the shutter doors in the workshop area were found to be leaking air, which leads to infiltration and waste of energy and, accordingly, proper sealing by using sweepers is recommended. An awareness survey among the students and teachers was conducted to measure the level of awareness as well as assessing the current practices. Based on the survey results, an energy awareness campaign for all the staff and students was recommended as well as starting an energy education program where students investigate all aspects of the school energy consumption. It is also recommended that the school administration nominate a student from each class to be the energy conservation leader. An Energy conservation team from each grade level can investigate the current practices, develop with the teachers’ support for an energy conservation plan to be implemented in the campus and monitor the effectiveness of the plan by analyzing the energy consumption. The total savings anticipated from applying the Energy Conservation Measures is approximately AED 364,000, which is about 16% of the annual electricity bill.

Author Contributions

Writing—original draft, K.M.R.; Writing—review & editing, M.F.O., K.S. and Y.Z. All authors have read and agreed to the published version of the manuscript.

Funding

This research received no external funding.

Informed Consent Statement

Informed consent was obtained from all subjects involved in the study.

Acknowledgments

The work in this paper was supported, in part, by the Open Access Program from the American University of Sharjah. This paper represents the opinions of the author(s) and does not mean to represent the position or opinions of the American University of Sharjah.

Conflicts of Interest

The authors declare no conflict of interest.

Appendix A. Awareness Survey

  • Demographics
    • Your profession at the school?
      Student at the boys section
      Student at the girls section
      Admin
      Teaching staff
    • Where do you spend most of your time at school?
      Boys Section
      Boys Section/Girls Section
      Girls Section
    • Your level of education?
      I’m a high school student
      Secondary certificate
      Bachelor
      Master/PhD
  • Testing Energy Conscience
    • Do you think it is important to save energy?
      Mostly no
      Mostly yes
      Not important at all
      Somewhat important
    • Have you considered ways to decrease your electricity bill in your home?
      No, I haven’t thought about it
      Rarely
      Yes, often
      Yes, sometimes
    • How would you rate the following statement? “Energy efficiency is important for increasing the production”
      Fairly important
      Important
      No opinion
      Not at all important
      Very important
    • What would you do to reduce energy usage? (Please select all that apply)
      Turn off the lights
      Turn off unused equipment
      Save water by not letting it run
      Change your behavior toward energy consumption
      Recycle
    • Do you think that saving energy should be rewarded?
      No
      Yes
    • How would you rate the following statement? “Saving energy results in a cleaner environment”?
      Important
      No opinion
      Not at all important
      Very important
  • Air conditioning system Usage
    • Do you feel cold during classes or inside your workplace because of the AC?
      No
      Sometimes
      Yes
    • Do you need to open the window because of the cold conditions during classes?
      No
      Sometimes
      Yes
    • Are you aware of any energy waste at the school environment?
      No
      Yes
    • Who is responsible for switching off the lights at your class/ lab at the end of the day?
      Cleaning staff
      I don’t know
      Security
      Students
      Teachers
    • Do you think that signs to remind people to turn off the lights or turn off electrical equipment after usage will help reduce electricity consumption?
      No
      Yes
    • Who is responsible for turning off the projectors at the classes/labs?
      Cleaning staffing
      I don’t know
      Security
      Students
      Teachers
    • Do you think the school is applying energy saving strategies?
      I don’t know
      No
      Yes
    • Do you need to open the window because of the cold conditions during classes/labs?
      No
      Sometimes
      Yes
    • What is the set temperature of the AC in your class/workshop?
      16 °C
      18 °C
      20 °C
      22 °C
      24 °C
      25 °C

Appendix B. Thermography Analysis-Building Envelope

Table A1. Thermography Inspection-GG019-Wall 2.
Inspection Date:16 April 2016 11:26:51 a.m.LocationG-G019
DescriptionExterior doorsWeather Conditions:40 °C
ProblemDoors are not sealed properlyRepair Priority:-
Emissivity:0.94Reflected Temperature:25.0 °C
Camera ManufacturerFluke ThermographyCamera:Ti200-16010153
Figure A1. Infrared thermograph-GG019—Both doors are not sealed properly. (a) IR_00085.IS2, (b) Visible Light Image.
Sustainability 14 10625 g0a1
Table A2. Thermography Inspection-GG019-Wall 4.
Inspection Date:16 April 2016 11:27:36 a.m.LocationG-G019
DescriptionNear AC grill “Air flow”Weather Conditions:40 °C
ProblemNoneRepair Priority:-
Emissivity:0.94Reflected Temperature:25.0 °C
Camera ManufacturerFluke ThermographyCamera:Ti200-16010153
Figure A2. Infrared thermograph-GG019—The dark color is not a problem, it indicates that there’s an air flow; as the wall is near an AC grill. (a) IR_00086.IS2, (b) Visible Light Image.
Sustainability 14 10625 g0a2
Table A3. Thermography Inspection-IG004-Wall 1.
Inspection Date:16 April 2016 12:17:19 p.m.LocationI-G004
DescriptionExterior Wall/WindowWeather Conditions:40 °C
ProblemNoneRepair Priority:-
Emissivity:0.94Reflected Temperature:25.0 °C
Camera ManufacturerFluke ThermographyCamera:Ti200-16010153
Figure A3. Infrared thermograph-IG004-Wall 1. Good insulation conditions. (a) IR_00097.IS2, (b) Visible Light Image.
Sustainability 14 10625 g0a3
Table A4. Thermography Inspection-GG012-Wall 2.
Inspection Date:16 April 2016 2:04:56 p.m.LocationG-G012
DescriptionExterior Shutter doorsWeather Conditions:40 °C
ProblemAre not sealed properlyRepair Priority:-
Emissivity:0.94Reflected Temperature:25.0 °C
Camera ManufacturerFluke ThermographyCamera:Ti200-16010153
Figure A4. Infrared thermograph-GG012-Wall 2—Shutter doors are not sealed properly. (a) IR_00109.IS2, (b) Visible Light Image.
Sustainability 14 10625 g0a4
Table A5. Thermography Inspection-Block F/Boys/Corridor-Ceiling.
Inspection Date:16 May 2016 12:27:42 p.m.LocationBlock F-Boys-Corridor
DescriptionCeilingWeather Conditions:40 °C
ProblemNoneRepair Priority:-
Emissivity:0.94Reflected Temperature:25.0 °C
Camera ManufacturerFluke ThermographyCamera:Ti200-16010153
Figure A5. Infrared thermograph-Block F/Boys/Corridor-Ceiling—Good insulation conditions. (a) IR_00283.IS2, (b) Visible Light Image.
Sustainability 14 10625 g0a5
Table A6. Thermography Inspection-Block F/Girls/Corridor-Ceiling.
Inspection Date:16 May 2016 12:44:24 p.m.LocationBlock F-Girls-Corridor
DescriptionCeilingWeather Conditions:43 °C
ProblemNoneRepair Priority:-
Emissivity:0.94Reflected Temperature:28.0 °C
Camera ManufacturerFluke ThermographyCamera:Ti200-16010153
Figure A6. Infrared thermograph-Block F/Girls/Corridor-Ceiling. Good insulation conditions. (a) IR_00285.IS2, (b) Visible Light Image.
Sustainability 14 10625 g0a6
Table A7. Thermography Inspection—GG010-Wall 2.
Inspection Date:16 April 2016 2:04:30 p.m.LocationG-G010
DescriptionExterior doorWeather Conditions:40 °C
ProblemDoor is not sealed properlyRepair Priority:-
Emissivity:0.94Reflected Temperature:25.0 °C
Camera ManufacturerFluke ThermographyCamera:Ti200-16010153
Figure A7. Infrared anomaly—GG010-Wall 2—The door is not sealed properly from the bottom. (a) IR_00108.IS2, (b) Visible Light Image.
Sustainability 14 10625 g0a7
Table A8. Thermography Inspection—Block D/Exit Gate-Wall 2.
Inspection Date:16 April 2016 2:15:56 p.m.LocationBlock D-Exit Gate
DescriptionExterior DoorWeather Conditions:40 °C
ProblemDoor not sealed properlyRepair Priority:-
Emissivity:0.94Reflected Temperature:25.0 °C
Camera ManufacturerFluke ThermographyCamera:Ti200-16010153
Figure A8. Infrared anomaly Block D/Exit gate-Wall 2. (a) IR_00120.IS2, (b) Visible Light Image.
Sustainability 14 10625 g0a8
Table A9. Thermography Inspection-Block C/Exit Gate-Wall 2.
Inspection Date:16 April 2016 2:15:56 p.m.LocationBlock C-Exit Gate
DescriptionExterior DoorWeather Conditions:40 °C
ProblemDoor not sealed properlyRepair Priority:-
Emissivity:0.94Reflected Temperature:25.0 °C
Camera ManufacturerFluke ThermographyCamera:Ti200-16010153
Figure A9. Infrared anomaly—Block C/Exit gate-Wall 2. (a) IR_00120.IS2, (b) Visible Light Image.
Sustainability 14 10625 g0a9
Table A10. Thermography Inspection-DG025-Wall 4.
Inspection Date:16 April 2016 12:07:44 p.m.LocationD-G025
DescriptionInterior DoorsWeather Conditions:40 °C
ProblemDoor Not sealed ProperlyRepair Priority:-
Emissivity:0.94Reflected Temperature:25.0 °C
Camera ManufacturerFluke ThermographyCamera:Ti200-16010153
Figure A10. Infrared anomaly—DG025-Wall 4. (a) IR_00093.IS2, (b) Visible Light Image.
Sustainability 14 10625 g0a10

Appendix C. Thermography Analysis-Electrical Distribution Boards

Table A11. Thermography inspection—G-G006/DB1.
Inspection Date:11 April 2016 11:36:08 a.m.LocationG-G006
EquipmentDistribution BoardEquipment Name:DB 1
Emissivity:0.95Reflected Temperature:25.0 °C
Exception Temperature: Potential ProblemNone
Recommended ActionNoneRepair Priority:None
Camera ManufacturerFluke ThermographyCamera:Ti200-16010153
Figure A11. Infrared Thermograph- G-G006 DB1 doesn’t show any temperature difference. 29.9 °C is a metal reflection. (a) IR_00015.IS2, (b) Visible Light Image.
Sustainability 14 10625 g0a11
Table A12. Thermography inspection—G-G019/DB1.
Inspection Date:12 April 2016 11:06:27 a.m.LocationG-G019
EquipmentDistribution BoardEquipment Name:DB1
Exception Temperature: Potential ProblemNone
Recommended ActionNoneRepair Priority:None
Emissivity:0.95Reflected Temperature:25.0 °C
Camera ManufacturerFluke ThermographyCamera:Ti200-16010153
Figure A12. Infrared Thermograph- G-G019 DB1 doesn’t show any temperature difference. (a) IR_00023.IS2, (b) Visible Light Image.
Sustainability 14 10625 g0a12
Table A13. Thermography inspection—D-G021/DB7.
Inspection Date:15 April 2016 11:30:30 a.m.LocationD-G021
EquipmentDistribution BoardEquipment Name:DB7
Exception Temperature: Potential ProblemLoad is little high
Recommended ActionNoneRepair Priority:None
Emissivity:0.95Reflected Temperature:25.0 °C
Camera ManufacturerFluke ThermographyCamera:Ti200-16010153
Figure A13. Infrared Thermograph-D-G021 DB 7 shows temperature differences which is due to loading. (a) IR_00078.IS2, (b) Visible Light Image.
Sustainability 14 10625 g0a13

Appendix D. Lighting

Table A14. Lighting Inventory.
IDBuilding TypeLamp TypeLamp Wattage# of Lamps/FixtureNo. of FixturesTotal Power Kw
AClass-roomLED-SLC42155023.1
LED-DL1912274.3
BClass-roomLED-SLC421602.5
LED-DL191270.5
LabLED-SLC42126711.2
LED-DL191931.8
Prayer RoomLED-SLC421803.4
LED-DL191130.2
AdminLED-SLC421803.4
LED-DL191130.2
CClass-roomLED-SLC4211807.6
LED-DL191801.5
LabLED-SLC4211004.2
LED-DL191270.5
Prayer RoomLED-SLC421803.4
LED-DL191200.4
AdminLED-SLC421803.4
LED-DL191130.2
DClass RoomLED-SLC42156023.5
LED-DL1912274.3
ELabLED-SLC42164026.9
LED-DL1911472.8
FLabLED-SLC42164026.9
LED-DL1911472.8
GWorkshop BLED-HBL132121328.1
Workshop GLED-HBL132120026.4
LED-CM222672.9
HLibrary—BoysLED-SLC421331.4
LED-DL1513575.4
Library—GirlsLED-SLC421331.4
LED-DL1513575.4
Cafeteria—BoysLED-HIL61400.2
LED-PL201871.7
LED-DL1513835.7
Cafeteria—GirlsLED-HIL61400.2
LED-PL201871.7
LED-DL1513835.7
IAdmin-ALED-SLC4212138.9
LED-DL1512073.1
LED-DL201771.5
Admin-BLED-SLC42127711.6
LED-DL1512874.3
LED-DL201170.3
Rep. CorridorLED-DL2011152.3
Total277.5
SLC: Square Light Ceiling/DL: Down Light/HBL: High Bay Light/ceiling mounted/HIL: High intensity Light/PL: Pendant Light.
Table A15. Light intensity measured in Foot Candles compared to standard lightning.
LocationGirlsBoysStandard Light
Intensity in Schools in “Foot-Candle”
AverageAverage
Classroom G004848750
Classroom G005788350
Classroom G006808450
Classroom G007827950
Classroom G008788250
Classroom G009768750
Classroom G010808550
Classroom G011819050
Classroom G012758850
Classroom G013798250
Classroom G016857550
Classroom G017877450
Classroom G018857750
Classroom G019817950
Classroom G020808050
Classroom G021837650
Classroom G022887550
Classroom G023897950
Classroom G024877750
Classroom G025998450
Classroom G026958250
Electrical Circuit Lab.144142100
Physics Lab145144100
Physics Lab149150100
Cool Tool Lab.139140100
Lab.147143100
Lab.142142100
Lab.144148100
Science lab149146100
Science lab151149100
AutoCAD/ICT Lab.145146100
ICT Lab.142148100
Electrical Circuit Lab.149150100
Main Corridor18218550
Cafeteria384130
Prayer room706830
Library171250
Teacher room756450
Block A/D Corridor303130
Block B/C Corridor312930
Block E/F Corridor293030
Block G Corridor303130
Admin Area757750
Reception Corridor18030

References

  1. Cao, X.; Dai, X.; Liu, J. Building energy-consumption status worldwide and the state-of-the-art technologies for zero-energy buildings during the past decade. Energy Build. 2016, 128, 198–213. [Google Scholar] [CrossRef]
  2. Maulud, A.L.; Saidi, H. The Malaysian Fifth Fuel Policy: Re-strategising the Malaysian Renewable Energy Initiatives. Energy Policy 2012, 48, 88–92. [Google Scholar] [CrossRef]
  3. Zhang, Y.; Bai, X.; Mills, F.P.; John, C.V.; Pezzey, J.C.V. Rethinking the role of occupant behavior in building energy performance: A review. Energy Build. 2018, 172, 279–294. [Google Scholar] [CrossRef]
  4. Chung, M.; Rhee, E. Potential opportunities for energy conservation in existing buildings on university campus. Energy Build. 2014, 78, 176–182. [Google Scholar] [CrossRef]
  5. Krarti, M. Energy Audit of Building Systems—An Engineering Approach, 2nd ed.; CRC Press: Boca Raton, FL, USA, 2011; pp. 10–40. [Google Scholar]
  6. Radan, S. Energy, water, food issues cannot be dealt separately-Experts. Khaleej Times, 18 October 2014. [Google Scholar]
  7. Zafar, S. Energy efficiency perspectives for UAE. EcoMENA, 17 December 2013. [Google Scholar]
  8. Brunke, J.; Johansson, M.; Thollander, P. Empirical investigation of barriers and drivers to the adoption of energy conservation measures, energy management practices, and energy services in the Swedish iron and steel industry. J. Clean. Prod. 2014, 84, 509–525. [Google Scholar] [CrossRef]
  9. Cerrito, E. Energy Codes & Smart Energy. Neural Energy Consulting, 15 July 2015. [Google Scholar]
  10. Atikol, U. Energy Audit. Available online: https://staff.emu.edu.tr/uguratikol/Documents/MENG547/ME547-UA-CH3-Energy%20Audit-2015.pdf (accessed on 10 January 2000).
  11. Husseini, A. Energy audits create value any size facility can manage use and reduce costs. Canadian Industrial Machinery, 14 August 2015. [Google Scholar]
  12. FLIR. Thermal Imaging Guidebook for Industrial Applications; FLIR: Wilsonville, OR, USA, 2011. [Google Scholar]
  13. Rakha, T.; El Masri, Y.; Chen, K.; Panagoulia, E.; De Wilde, P. Building envelope anomaly characterization and simulation using drone time-lapse thermography. Energy Build. 2022, 259, 111754. [Google Scholar] [CrossRef]
  14. Barbosa, M.T.G.; Rosse, V.J.; Laurindo, N.G. Thermography evaluation strategy proposal due moisture damage on building facades. J. Build. Eng. 2021, 43, 102555. [Google Scholar] [CrossRef]
  15. Pixel Thermographics Ltd. Commercial Building Thermographic Surveys Sample Report; Pixel Thermographics Ltd.: Macclesfield, UK, June 2011; pp. 1–13. [Google Scholar]
  16. Rao, K.; Vikram, K.; Mathrusri, K. Energy conservation, generation, utilization. Int. J. Adv. Trends Comput. Sci. Eng. 2014, 3, 73–80. [Google Scholar]
  17. Michalak, P.; Szczotka, K.; Szymiczek, J. Energy Effectiveness or Economic Profitability? A Case Study of Thermal Modernization of a School Building. Energies 2021, 14, 1973. [Google Scholar] [CrossRef]
  18. Kim, T.; Kang, B.; Kim, H.; Park, C.; Hong, W. The study on the Energy Consumption of middle school facilities in Daegu, Korea. Energy Rep. 2019, 5, 993–1000. [Google Scholar] [CrossRef]
  19. Ouf, M.M.; Issa, M.H. Energy consumption analysis of school buildings in Manitoba, Canada. Int. J. Sustain. Built Environ. 2017, 6, 359–371. [Google Scholar] [CrossRef]
  20. Congedo, P.M.; D’Agostino, D.; Baglivo, C.; Tornese, G.; Zacà, I. Efficient Solutions and Cost-Optimal Analysis for Existing School Buildings. Energies 2016, 9, 851. [Google Scholar] [CrossRef]
  21. Berardi, U.; Manca, M.; Casaldaliga, P.; Aguilera, F.P. From high-energy demands ton ZEB: The retrofit of a school in Catalonia, Spain. In Proceedings of the AiCARR 50th International Congress, Matera, Italy, 10–17 May 2017. [Google Scholar]
  22. Neustroev, S.S.; Arinushkina, A.A. Energy Efficiency and Energy Saving in Public Schools: Federal Policy and Regional Perspectives from Russia. Int. J. Energy Econ. Policy 2019, 9, 535–541. [Google Scholar] [CrossRef]
  23. Zhang, D.; Bluyssen, P.M. Energy consumption, self-reported teachers’ actions and children’s perceived indoor environmental quality of nine primary school buildings in the Netherlands. Energy Build. 2021, 235, 110735. [Google Scholar] [CrossRef]
  24. Mohelníková, J.; Novotný, M.; Mocová, P. Evaluation of School Building Energy Performance and Classroom Indoor Environment. Energies 2020, 13, 2489. [Google Scholar] [CrossRef]
  25. Nocera, F.; Faro, A.L.; Costanzo, V.; Raciti, C. Daylight Performance of Classrooms in a Mediterranean School Heritage Building. Sustainability 2018, 10, 3705. [Google Scholar] [CrossRef]
  26. Ashrafiana, T.; Moazzen, N. The impact of glazing ratio and window configuration on occupants’ comfort and energy demand: The case study of a school building in Eskisehir, Turkey. Sustain. Cities Soc. 2019, 47, 101483. [Google Scholar] [CrossRef]
  27. Zyadin, A.; Puhakka, A.; Halder, P.; Ahponen, P.; Pelkonen, P. The relative importance of home, school, and traditional mass media sources in elevating youth energy awareness. Appl. Energy 2014, 114, 409–416. [Google Scholar] [CrossRef]
  28. Nonnenmann, J.; Stanley, P. Chilled water plant pumping schemes. ITT Fluid Technol. Corp. 1996, 2, 8–12. [Google Scholar]
  29. Johnson Control. The Opti Speed Variable-Speed Drive; Johnson Control: York, PA, USA, 2008. [Google Scholar]
  30. Dubey, K. Buildings Sector: Energy Productivity in the GCC. 2016. Available online: https://unece.org/fileadmin/DAM/energy/se/pp/eneff/7th_IFESD_Baku_Oct.2016/3GEEE_ee_build/KankanaDubey.pdf (accessed on 18 May 2022).
  31. Turner, W.; Doty, S. Energy Management Handbook, 6th ed.; Fairmont Press: Fairmont, MN, USA, 2006; pp. 308–319. [Google Scholar]
  32. Fluke. The Three Phase Energy and Power Quality Analyzer User Manual; Fluke 434-II/435-II/437-II Series; Fluke: Everett, WA, USA, January 2012. [Google Scholar]
  33. Klee, D.; Gigot, G. Seven Steps to Maximizing Central Plant Efficiency by Johnson Controls; White Paper; Johnson Controls: Cork, Ireland, 2011. [Google Scholar]
Figure 1. Layout of school buildings in the campus.
Sustainability 14 10625 g001
Figure 2. Primary-Secondary chilled water system [28].
Sustainability 14 10625 g002
Figure 3. Energy savings using the variable speed drive.
Sustainability 14 10625 g003
Figure 4. Responsibility for switching the lights off at the end of the day (top) and distribution of opinions (bottom).
Sustainability 14 10625 g004
Figure 5. Energy reducing strategies.
Sustainability 14 10625 g005
Figure 6. Impact on the environment.
Sustainability 14 10625 g006
Figure 7. Setting AC temperature. (a) Coldness inside the classrooms and opening windows. (b) T AC temperature in the classes/labs.
Sustainability 14 10625 g007
Figure 8. Monthly electricity consumption.
Sustainability 14 10625 g008
Figure 9. Monthly EUI in kBtu/ft2.
Sustainability 14 10625 g009
Figure 10. Bar chart showing the savings in each school facility by using motion sensors.
Sustainability 14 10625 g010
Figure 11. Bar chart showing the excessive lighting in the school.
Sustainability 14 10625 g011
Figure 12. The annual lighting consumption and expected savings from reducing the number of lamps.
Sustainability 14 10625 g012
Figure 13. Infrared anomaly—GG021-Wall 2-The door is not sealed properly.
Sustainability 14 10625 g013
Figure 14. Total savings from each ECM.
Sustainability 14 10625 g014
Figure 15. The total savings percentage from each ECM.
Sustainability 14 10625 g015
Table 1. School capacity.
CampusClassroomsLabsWorkshops
Boys23148
Girls19189
Total423217
Table 2. Summary of the HVAC system in the campus.
DescriptionMakeQuantityPower (kW)
ChillerA42192
Chiller pumpsB10354
Air handling unitsA223573
Fan coil unitsA1872904
Exhaust FansC3763
Supply FanC49
Smoke FanC999
Total9193
Table 3. Annual savings from lighting.
Total Cons. kWhSavings kWhTotal Cons. AEDSavings AED
Classrooms138,85546,23959,70819,883
Laboratories236,19378,790101,56333,880
Others150,62334,51964,76814,843
Overall525,671159,548226,03868,606
Table 4. Thermography Inspection-G-G021-Wall 2.
Inspection Date:16 April 2016 12:07:44 p.m.LocationG-G021
DescriptionExterior DoorsWeather Conditions:40 °C
ProblemDoor Not sealed ProperlyRepair Priority:-
Emissivity:0.94Reflected Temperature:25.0 °C
Camera ManufacturerFluke ThermographyCamera:Ti200-16010153
Publisher’s Note: MDPI stays neutral with regard to jurisdictional claims in published maps and institutional affiliations.

