Article

Study on the Carbon Emission Spillover Effects of Transportation under Technological Advancements

School of Economics and Management, Chongqing Jiaotong University, Chongqing 400074, China
*
Author to whom correspondence should be addressed.
Sustainability 2022, 14(17), 10608; https://doi.org/10.3390/su141710608
Submission received: 30 June 2022 / Revised: 21 August 2022 / Accepted: 22 August 2022 / Published: 25 August 2022
(This article belongs to the Section Sustainable Transportation)

Abstract

:
Regional transportation emissions reduction is the key to realizing deep emission reduction and the neutralization of transportation. Transportation development is accompanied by technological progress, and inter-regional transportation technological progress and carbon emission spillover effects are issues worthy of study. Based on the 2011–2020 provincial data of 30 provinces and cities in China, a spatial Durbin model was constructed to explore the impact of technological progress on regional spillovers of carbon emissions and the driving effect of emissions reduction. The conclusions show that the “community effect” causes direct interactions between transportation carbon emissions reduction practices in various provinces; the “acquired effect” and “leakage effect” drive technological progress between regions and cause indirect interactions between transportation carbon emissions reduction practices; transportation technology progress is more likely to occur between regions with similar transportation development. Finally, some suggestions are put forward in terms of establishing a mechanism for the coordinated reduction of regional carbon emissions, strengthening the interactions and economic connections between inter-regional transportation technologies, optimizing the spatial layout of transportation infrastructure, and building a low-carbon transportation system, so as to lay a solid foundation for the coordinated reduction of regional transportation carbon emissions.

1. Introduction

Climate change is the greatest environmental challenge affecting human communities, natural resources, and biodiversity in the 21st century [1]. Transportation is one of the three largest emitting sectors [2,3,4] and transportation carbon emissions are characterized by their large contribution and rapid growth rate [5]. Carbon emissions from the transportation sector not only put great pressure on resources and the environment and have high social costs, but also affect the efficiency of social and economic operations [6]. However, the environmental effects of technological advances have aroused the attention of scholars [7], and the inhibitory effect of energy efficiency on carbon emissions in the transportation sector increases with the improvement of energy efficiency (Wei et al., 2021) [8]. New technologies play an important role in the low-carbon transition of energy systems, climate governance and sustainable development pathways [9], and the use of new technologies can achieve the synergistic benefits of carbon reduction and air pollution control [10,11], but the cross-regional effects of technological advances on transportation have been less studied. In this paper, we consider the impact of technological advances and establish a spatial Durbin model using panel data on 31 provinces across China from 2012 to 2020 to analyze the impact of the diffusion of transportation technological advances on the regional association of transportation carbon emissions, and examine the spatial spillover effects of transportation technological advances that contribute to carbon emission abatement in transportation using different weighting matrices. Cross-regional traffic emissions require cross-regional collaborative governance.

2. Literature Review

2.1. Transportation Carbon Emission Influencing Factors

Many scholars have found that there are many factors that contribute to increases in transportation carbon emissions, such as economic growth [12,13,14], urbanization [15,16,17], energy intensity [18,19,20] and transportation mileage [21,22]. In recent years, many scholars have started to study the impact of technological progress on transportation carbon emissions. Authors such as [23] have pointed out that R&D investment has a positive impact on transportation CO2, and the impact of technological progress channels on carbon emissions in different industries all show spatial correlation and variability. Authors such as [24] have analyzed total transportation productivity and total transportation productivity through dynamic and cross-regional comparisons of total transportation. Authors such as [25] have analyzed the direct impact of technological progress on carbon efficiency and the interaction between technological progress and energy intensity on carbon efficiency, and then evaluated the carbon efficiency of 59 countries during 1998–2016 using the super SBM model. Authors such as [26] have used panel data from 30 Chinese provinces from 2009–2018 to construct a dynamic spatial panel data model based on the spatial Durbin model (SDM) for specific technological progress to analyze the impact of new energy vehicle industrial policies on carbon emissions in China’s transportation industry. It can be seen that technological progress is an important factor leading to the differentiation of regional transportation carbon emissions.

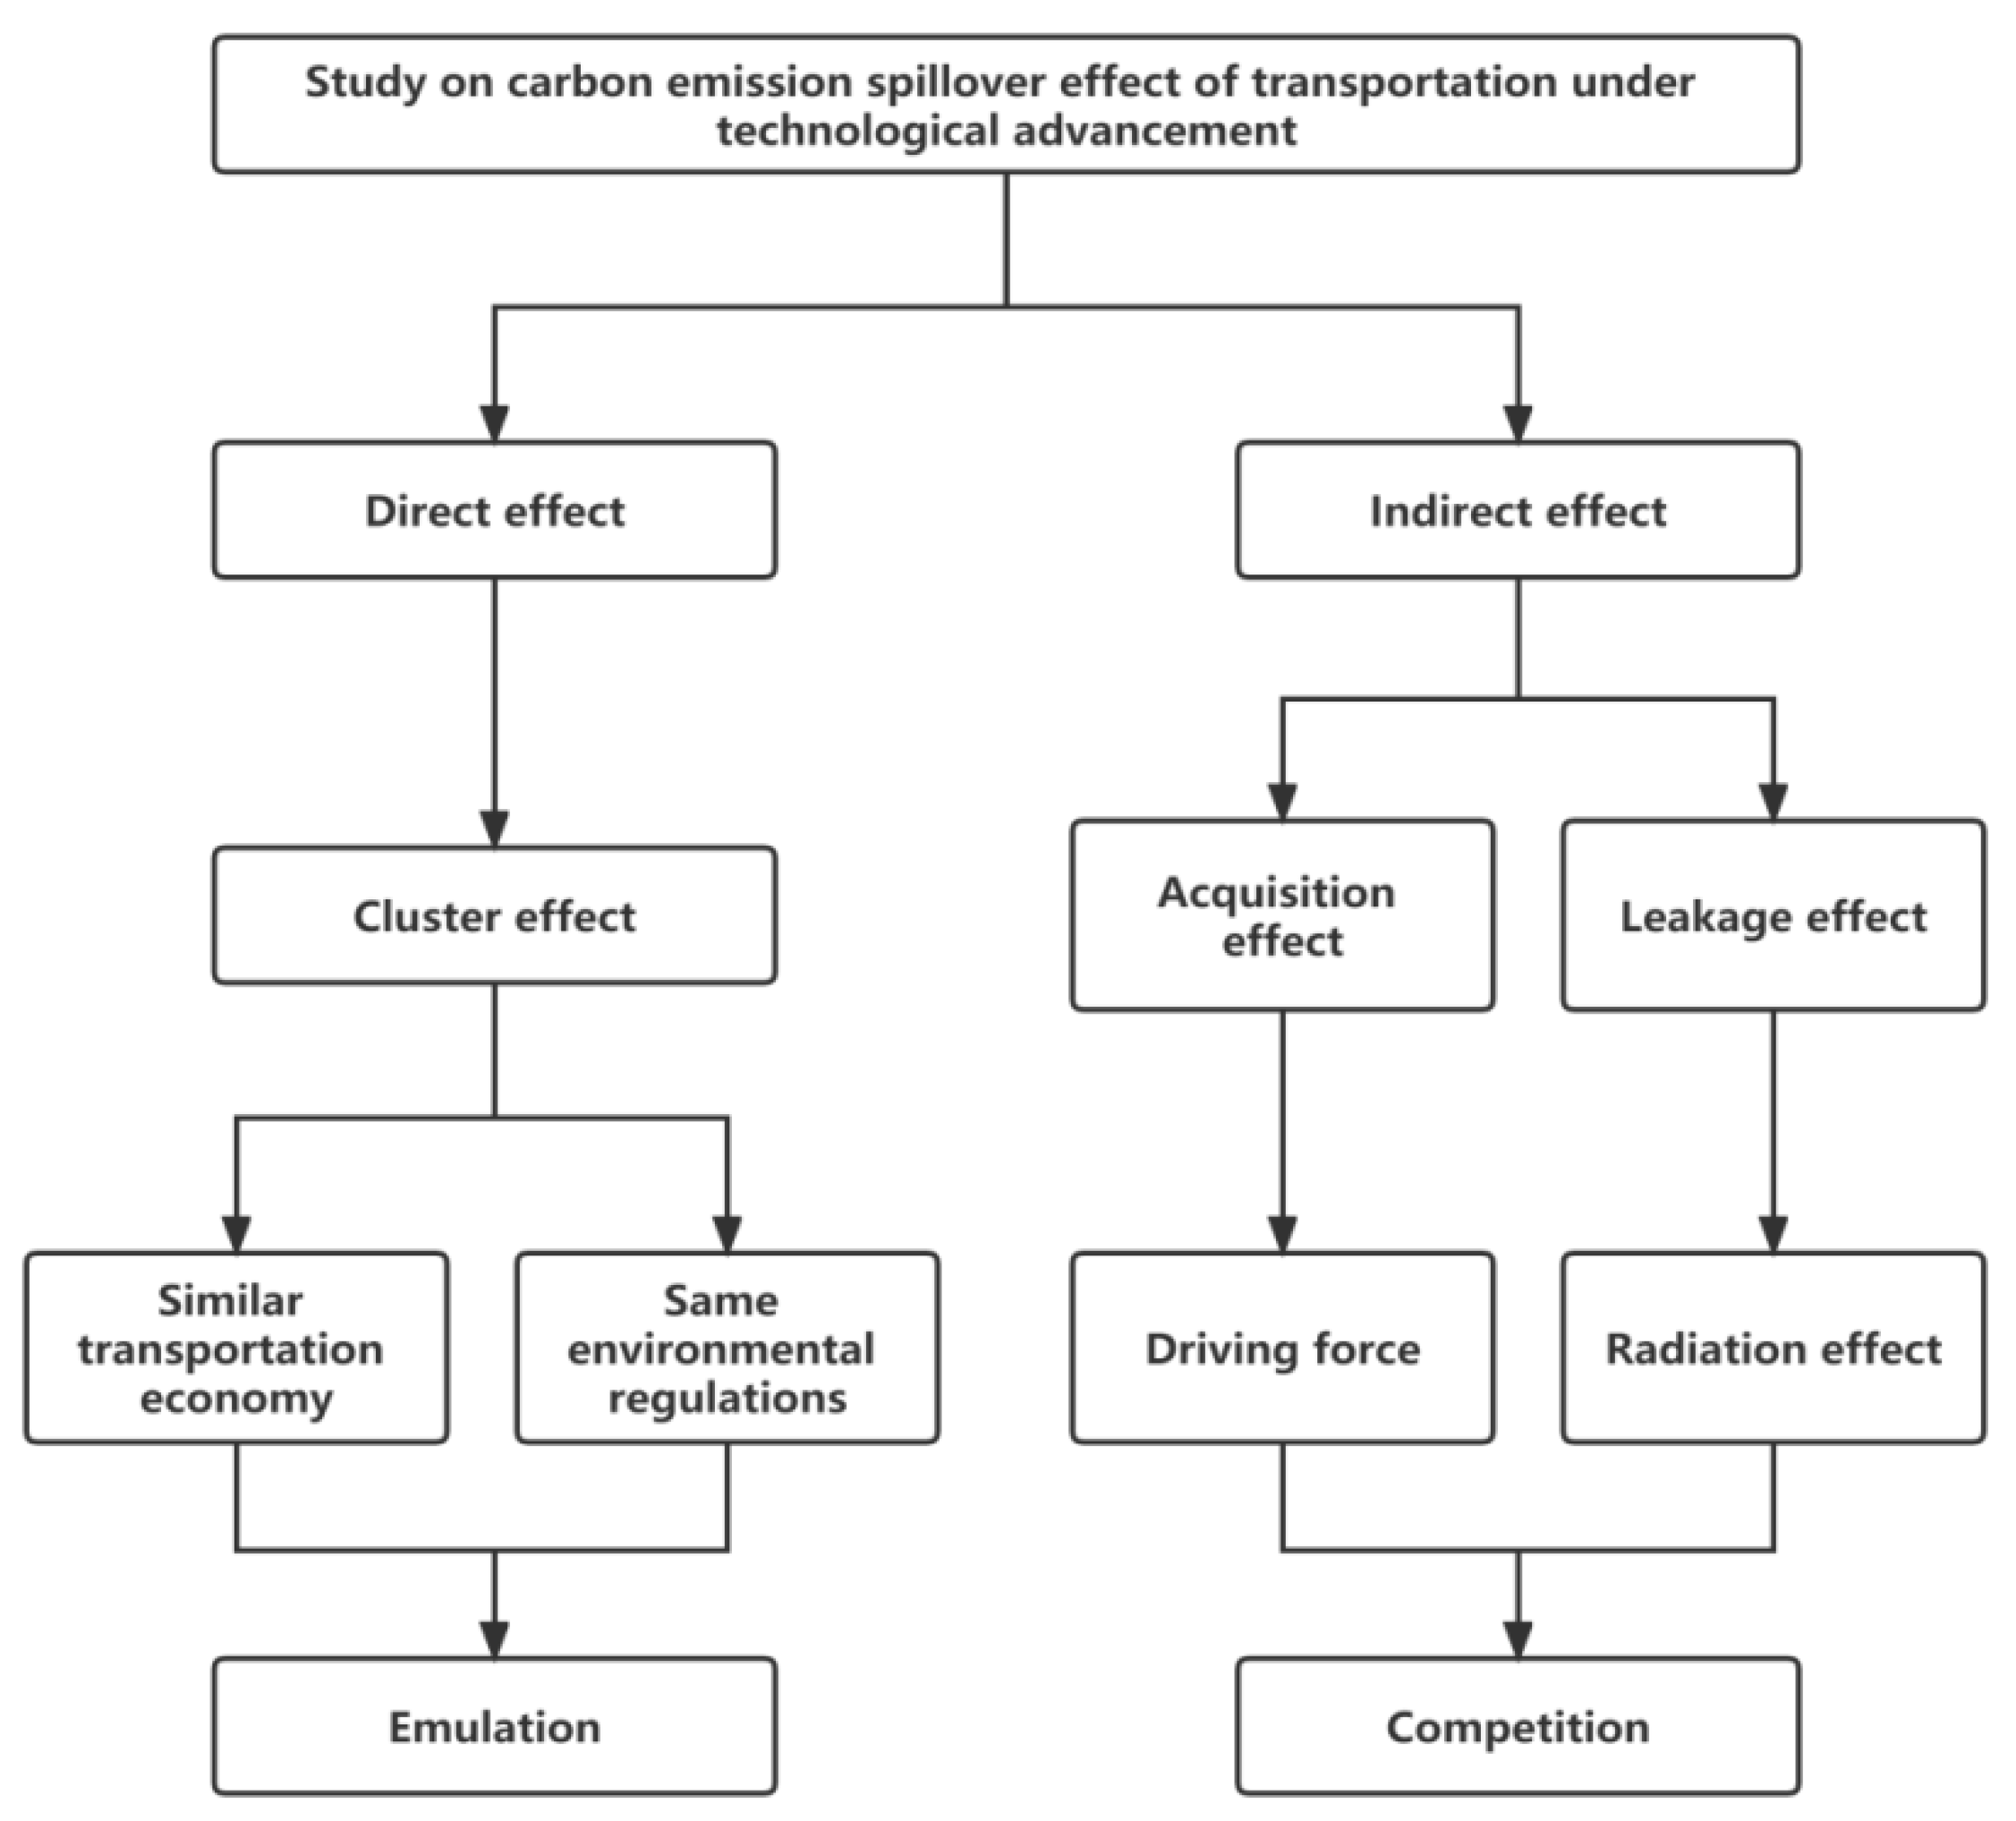
2.2. The Direct and Indirect Nature of Cross-Regional Spillover Effects

In the current study, the spillover effects of carbon emissions included direct and indirect effects [27]. First are direct effects; scholars such as [28] studied the assessment of climate action in three small cities in British Columbia and identified similarities in air pollution in neighboring cities. The reduction of transportation carbon emissions in a region serves as a reference for reductions in carbon emissions in surrounding areas, and this effect is called the “cluster effect” [29,30]. The transportation and economic development, emission status and emission reduction potential of adjacent areas were found to be similar [31]. Generally, geographically adjacent areas are subject to the same environmental regulation by the central government in terms of regional development [32]. As a result, neighboring regions will follow each other’s lead and make similar decisions about emissions and emissions reduction [33]. Second are indirect effects; transportation has cross-regional mobility, and technological progress leads to indirect interactions between transportation carbon emission reduction processes between regions. Technology is an important tool for transportation carbon emissions reduction. Technologically advanced areas will drive surrounding areas that have backward technology [34]. This “acquisition effect” promotes coordinated emissions reduction for regional transportation [35,36]. Resources, equipment and technical methods are radiated to surrounding areas, resulting in a “leakage effect”. The spillover effect of technological progress is more significant in adjacent regions because adjacent regions have convenient transportation and close economic relations, thus bringing about economic and environmental competition between regions [37,38]. In summary, the theoretical framework of this paper is shown in Figure 1.

2.3. Spatial Overflow Model

Transportation infrastructure and traffic flows have spatial properties, many of which are cross-regional and have spatial spillover effects [39,40]. Therefore, CO2 emissions from transport in each province are likely to be spatially interrelated rather than spatially independent. That is, the transport CO2 emissions of a province depend not only on local influences but also on those of neighboring provinces, which means that the spatial spillover effects of factors affecting transport carbon emissions cannot be ignored. Many scholars have studied the spatial spillover models of carbon emissions—for example, in [41], the authors used a tri-regional model of spillover and feedback effects (SFE) to calculate the interactions and relationships between regional and sectoral carbon emissions and pointed out that transportation has higher intra- and inter-regional emission multipliers because of its higher carbon emissions per unit of output. Authors such as [42] have used an adapted three-dimensional ecological footprint model (EF3D) to assess regional sustainable development and combined the STIRPAT model and spatial econometric model with transportation networks to provide insight into the drivers and spatial impacts of transportation networks on EF. Authors such as [43] have used an ε-based metric with a poor output data envelopment analysis model to estimate TSCDEE for 30 Chinese provinces from 2010 to 2016 and also analyzed its influencing factors using a spatial Durbin model, which indicated that factors such as traffic structure, level of transportation infrastructure and technological progress had a significant, positive impact on TSCDEE, while both urbanization level and urban population density had a significantly negative impact on TSCDEE. Authors such as [44] have used a three-region input–output model to analyze the emission spillover-feedback effects in the eastern, central, and western regions of China, stating that interregional trade has important spillover effects (SEs) on emissions in each region—especially in the central and western regions—but fewer feedback effects.

3. Research Methods and Data Sources

3.1. Calculation of Transportation Carbon Emissions

Two types of carbon emission measurements have been studied—one based on miles traveled via transportation [45,46] and the other based on energy consumption [47,48]. Considering the availability of the data, the second method was chosen in this paper to calculate the transportation carbon emissions of 30 provinces and cities. Motor vehicle emissions include direct and indirect emissions, with direct emissions coming from tailpipe emissions from the combustion of internal combustion engine vehicle fuels such as gasoline and diesel, and indirect emissions coming from emissions caused by the consumption of electric energy by electric vehicles. The calculation formula is as follows:
CT = EC × EF + i = 1 9 ALC i × FC i × C i × R i × 44 12
where C T denotes the total provincial transportation carbon emissions, kgCO 2 ; i denotes fuel type; E C denotes electricity consumption, kg ; E F denotes the electricity carbon emission factor, kgCO 2 / kWh ; A L C denotes the average energy low calorific value, kJ / kg F C denotes fossil fuel consumption, kg ; C denotes carbon content, t / TJ ; and R denotes the carbon oxidation rate, % . In this paper, the standard values of different carbon emission factors were used for calculations; their values are shown in Table 1 and Table 2. The data were obtained from the China Energy Statistical Yearbook 2011–2020.
The carbon emission factors for electricity production and fuel consumption are influenced by the amount of fuel; the carbon emission factors for electricity production and fuel consumption are relatively stable in the short term as they are influenced by the amount of fuel and the level of technology used for consumption. Since there are no annual data on carbon emission factors for electricity production and fuel consumption in China, this study used carbon emission factors. Standard values of carbon emission coefficients were used in this study. The carbon content of fossil fuels, the carbon content of carbon and the carbon content of fuel consumption in China were calculated using the standard values of carbon emission factors. The carbon content of fossil fuels, carbon oxidation rate (Table 1) and carbon emission factor of electricity (Table 2) were obtained from the Guide to Provincial Greenhouse Gas Inventories (Trial) [49], and the data on fossil fuel consumption, electricity consumption and average low calorific value of energy were obtained from the China Energy Statistical Yearbook [50,51,52,53,54,55,56,57,58,59].

3.2. Measurement of Traffic Technology Progress

The current development of transportation technology is characterized by the “integrated development of multiple technologies” and the intelligent and informative evolution formed by the integration of various technologies. For example, the concept of sharing, additive manufacturing technology to promote changes in the supply and demand model, reducing the scale of transport system development, artificial intelligence technologies to improve the efficiency and safety of transport and big data technology can improve the level of transport services, etc. These technologies improve the efficiency of the flow of goods and capital, promote urbanization and transport development and make urban and rural communication easier, but also change the demand for transport industry practitioners. In addition, these technological advances drive the transportation economy and also change transportation emissions. The level of technological progress in transportation was measured by the data envelopment analysis method [60]. Freight turnover, passenger turnover and the number of employees in the transportation industry were selected as the three input indicators, the added value of transportation was used as the desired output and the carbon emission of transportation was used as the undesired output. The Malmquist productivity index method was used for cumulative transformation to find the level of technological progress in transportation.
The data envelopment analysis method was selected to measure the level of traffic technology and the indicators were selected in Table 3.

3.3. Spatial Correlation Test

The overall and local regional associations of transportation carbon emissions were examined using the global spatial Moran index and the local spatial Moran index. The Moran index is widely used to study the spatial autocorrelation of transportation carbon emissions and the formula used here refers to the literature [61]. The Moran index is in the range of [−1, 1]; when its value is greater than 0, the variables are positively correlated spatially and there is spatial aggregation; when its value is less than 0, the variables are negatively correlated spatially; when its value is close to 0, the variables are randomly distributed.

3.4. Transportation Technology Spillover Channels

3.4.1. Geographical Distance

Regional transportation technology spillover is influenced by geographical location—the closer the geographical location between regions, the more transportation technology spillover; therefore, a spatial matrix of geographical distance is established.
ω i j g = 1 / d 2       ( i j ) 0                         ( i = j )

3.4.2. Economic Distance

Regional economic linkages affect transportation technology spillovers and greater economic distances inhibit the exchange of technological knowledge for transportation, thus creating a spatial matrix of economic distances.
ω i j e 1 n m = 1 n 1 T A V i T A V j                 ( i j ) 0                                                                                             ( i = j )

3.5. Spatial Durbin Model

Considering the econometric model to include the lagged terms of the spatially dependent variables, the lagged terms of the spatially independent variables were also included. Therefore, the spatial Durbin model was chosen.
ln ( y n t ) = τ n α + ρ ω ln ( y n t ) + β ln ( x n t ) + θ ω ln ( x n t ) + μ n + υ t + ε n t ε n t N ( 0 , σ 2 I n )
where ρ , β , θ is the coefficient to be estimated, y n t , x n t denote the independent and dependent variables, respectively, and the model variables are shown in Table 4; τ n is the n × 1 unit matrix, ε n t denotes the random perturbation factor, and μ n and υ t denote the individual and time fixed effects, respectively.

4. Empirical Analysis

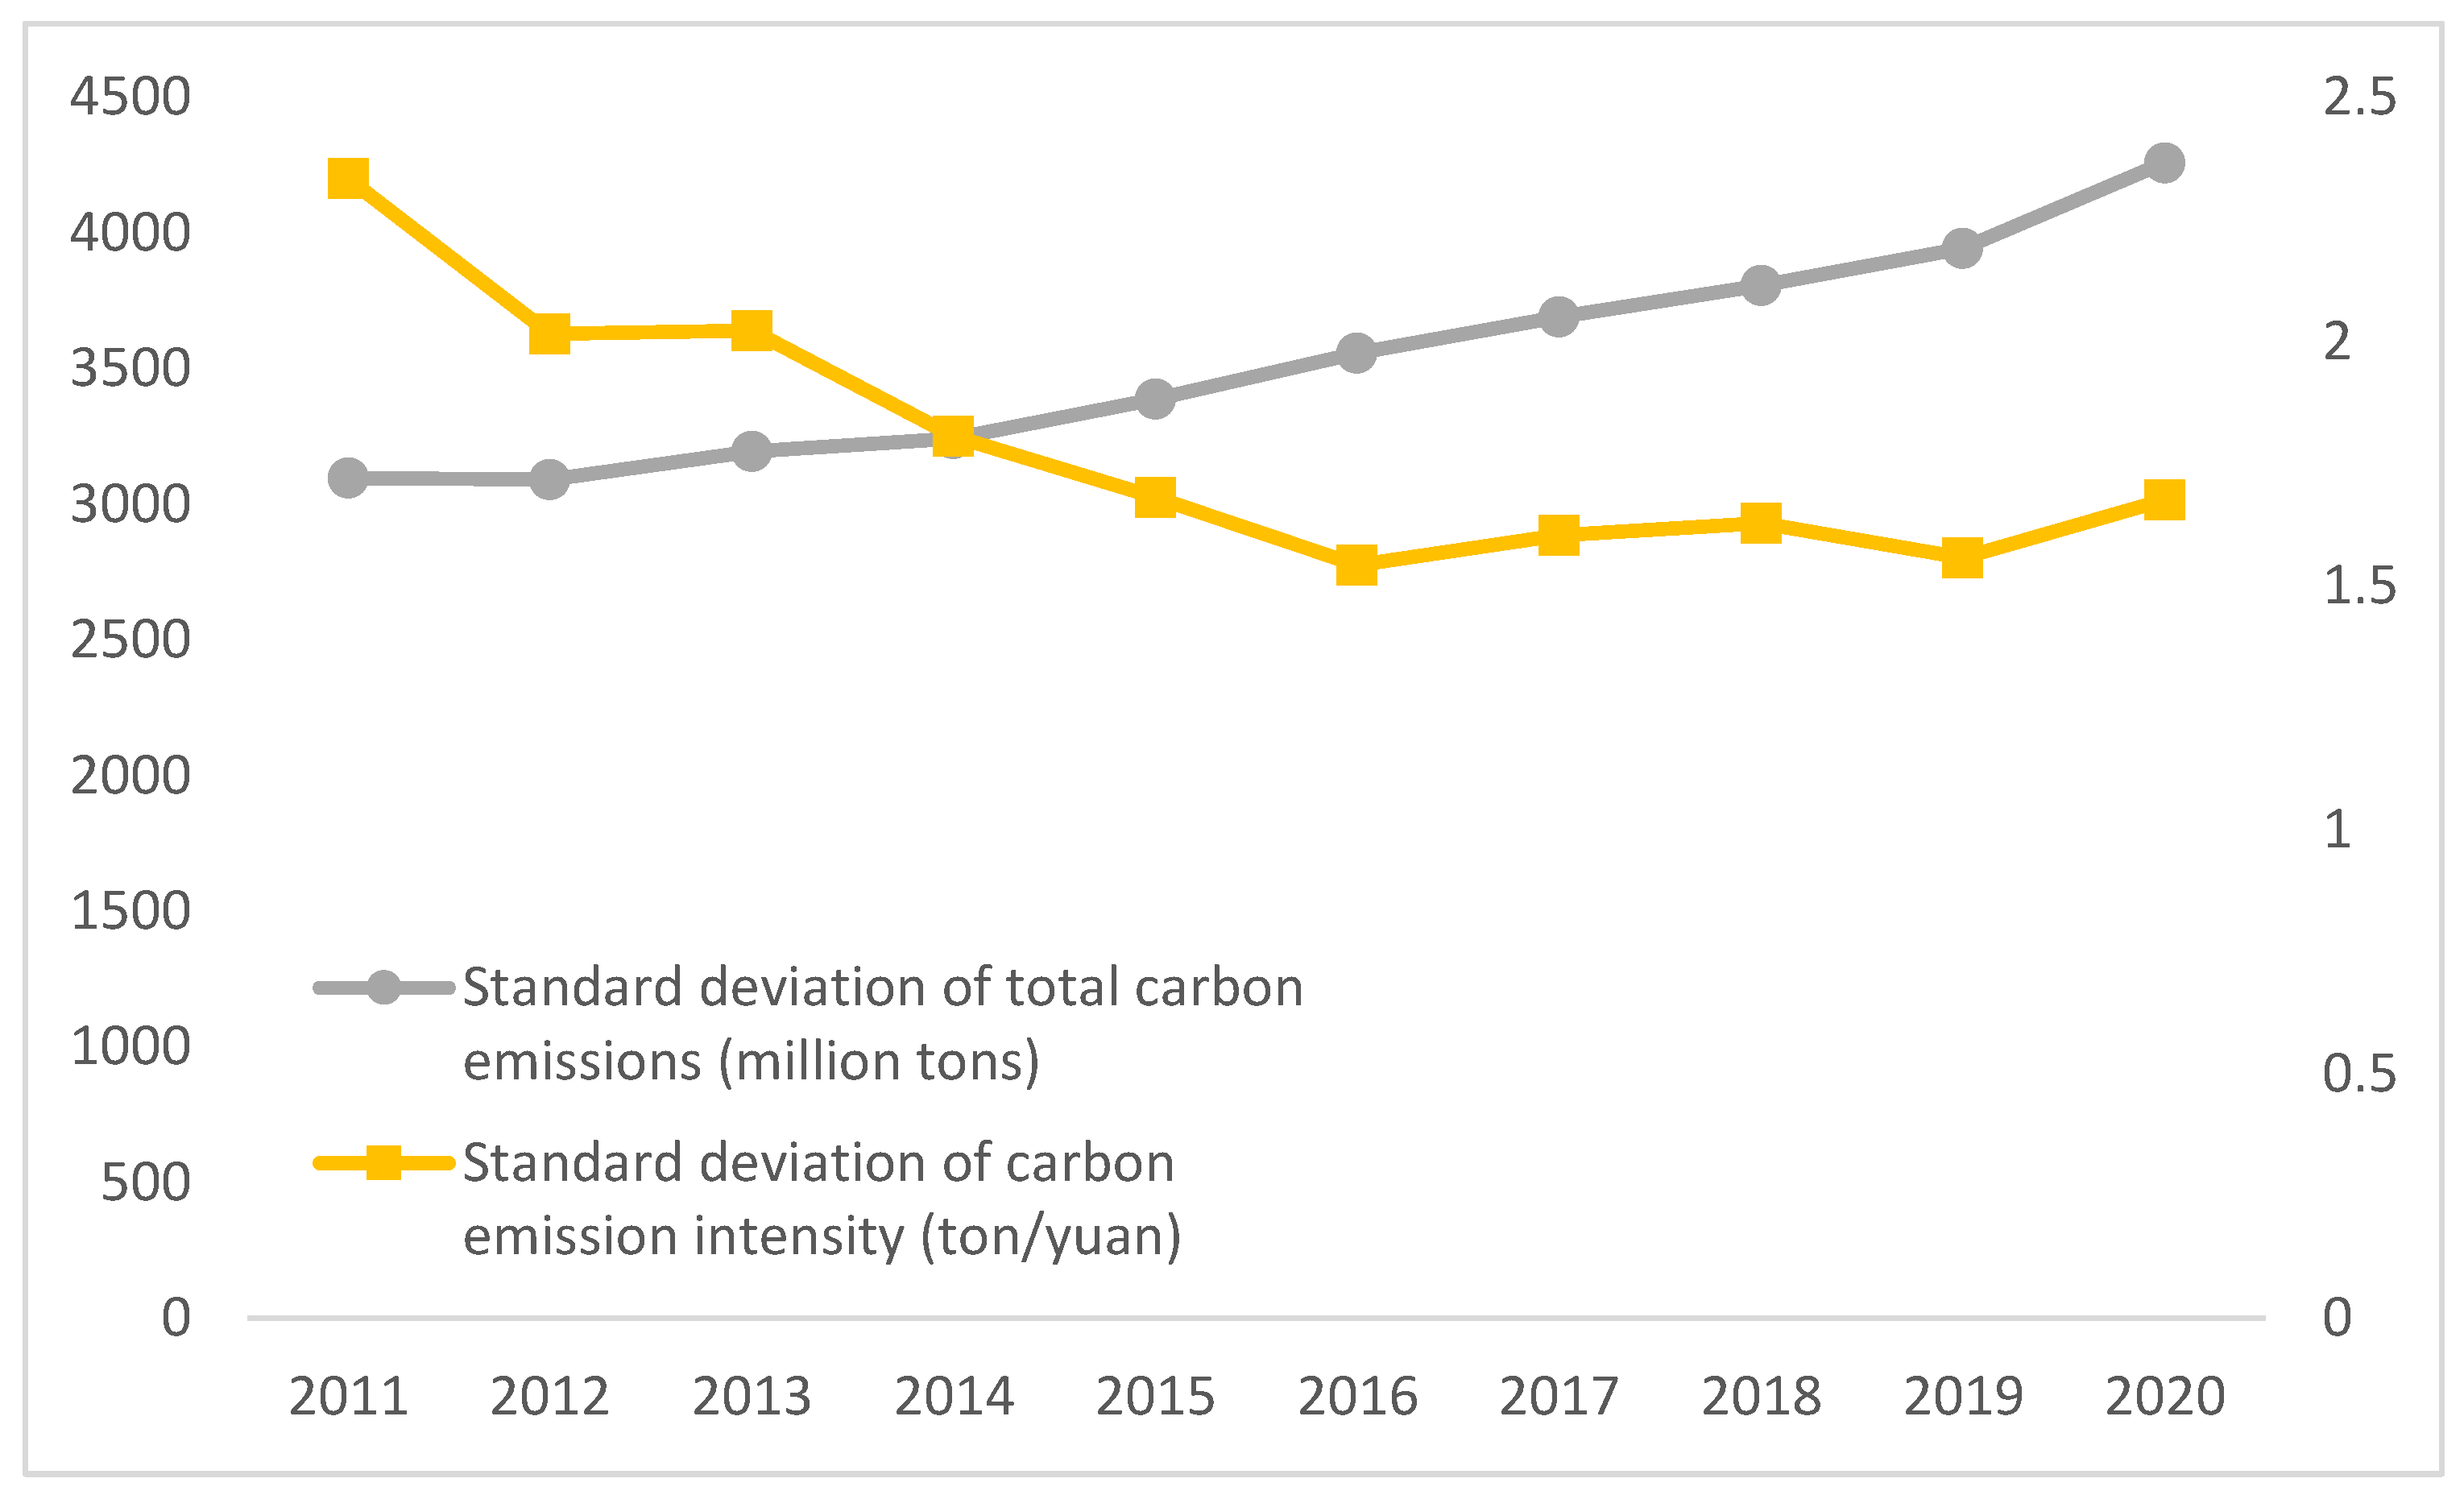
4.1. Provincial Distribution Characteristics of the Total and Intensity of the Transportation Carbon Emissions

As shown in Figure 2, the transportation carbon emissions were higher in coastal cities such as Liaoning, Shanghai, Jiangsu, Beijing and Guangdong, which had a higher level of transportation development and a large added transportation value—the annual average share of added transportation value in the five provinces was 26% of the national transportation value added from 2011–2020—while Tianjin, Jilin, Sichuan and Guizhou mainly developed primary industries and had large agricultural production; thus, the total amount of transportation carbon emissions was low. The regions with a higher transportation carbon emission intensity were Heilongjiang, Liaoning, Beijing, Shanghai and other provinces and cities, and the provinces and cities with lower transportation carbon emission intensities were Zhejiang, Fujian, Jiangsu and other provinces and cities, which shows the regional characteristics of high total transportation carbon emissions and low carbon emission intensity in the east and west, respectively. And from Figure 3, we can know that the standard deviation of total transportation carbon emissions between provinces in 2011–2020 is increasing year by year, while the standard deviation of carbon emission intensity in each province is decreasing year by year.

4.2. Testing the Spatial Effects of Transportation Carbon Emissions

As shown in Table 5, the global Moran indices of traffic carbon emissions from 2011 to 2020 were all positive, indicating that traffic carbon emissions showed a positive correlation between regions. The p-value is less than 0.05, which passes the 95% confidence test, indicating that traffic carbon emissions showed a significant spatial clustering characteristic. The global Moran index increased from 0.119 in 2011 to 0.168 in 2020, indicating that the spatial correlation of traffic carbon emissions gradually increased with time.
The local Moran index was calculated to explore the characteristics of local agglomeration of transportation carbon emissions. As shown in the scatter plots of Figure 4 the traffic carbon emissions showed the characteristics of high values adjacent to high values and low values adjacent to low values, and the number of provinces with positive spatial correlations increased from four in 2011 to seven in 2020. With the implementation of China’s integrated regional transportation development strategy, the cross-regional effect of transportation carbon emissions became more obvious as inter-regional transportation collaboration continued to deepen. Provinces and cities such as Shanghai, Jiangsu, Zhejiang, Hubei and Guangdong are adjacent and had higher transportation carbon emissions, while provinces and cities such as Guizhou, Yunnan, Gansu, Qinghai and Ningxia are adjacent and had lower transportation carbon emissions.

4.3. Analysis of the Cross-Regional Effects of Transportation Technology Progress

First, the Hausman test was used to determine whether the spatial Durbin model was a fixed-effect or random-effect model, and the results showed that the test value was 10.31 with a p-value of zero at the 5% significance level; so, the original hypothesis was rejected and the fixed-effect model was chosen. Next, the LR test and Wald test were carried out; the test results were as follows.
From Table 6, the results of the two tests rejected the original hypothesis at the 5% significance level, wherein the spatial Durbin model cannot be transformed into a spatial lag model with a spatial error model; therefore, the individual fixed-effect spatial Durbin model was selected.
From Table 7, the spatial regression coefficients and the spatial lag coefficients of the level of transportation technology progress were positive and significant for both the distance matrix and the economic matrix of the model. The positive value of the spatial regression coefficient indicates that there was a “cluster effect” of transportation carbon emissions between regions, and the behavior of transportation carbon emissions was similar in regions with a close geographical distance and close transportation economic development level. The estimated coefficient of the total factor productivity of transportation was negative, which indicates the “acquisition effect” and “leakage effect” of inter-regional transportation carbon emissions—indicating that the technological progress of transportation in one region leads to the reduction of transportation carbon emissions in neighboring regions. The spatial autoregressive coefficient was 0.311 when the distance matrix was used, which is larger than the spatial autoregressive coefficient when the economic matrix was used.
For the spatial effect of transportation technology progress, the estimated spatial coefficient of transportation technology progress was 0.101—higher under the effect of economic weight than under the effect of geographical weight—and the value of the statistic increased by 0.08. This is because, on the one hand, with the improvement of regional transportation infrastructure and the development of information technology, the spillover effect of interregional geographical distance on transportation technology and the spillover effect of economic distance on regional transportation technology gradually weaken. On the other hand, regions with different levels of transportation economy have different absorption capacities for transportation technology, and regions with close transportation economies are more conducive to learning from each other and spreading advanced technologies.
To further explore the relationship between the independent and dependent variables of the spatial Durbin model, the spatial effects were decomposed, and the results are shown in Table 8.
As seen in Table 8, both the direct and indirect effects of transportation technology progress passed the 5% significance test, with positive direct effects and negative indirect effects, indicating that transportation technology progress has positive and negative externalities. On the one hand, transportation technology progress promotes transportation development, increases transportation demand and increases carbon emissions; on the other hand, technology progress makes transportation travel greener and more efficient, reducing carbon emissions to a certain extent.
The total effect and direct effect of transportation labor input level were not significant, but the indirect effect was significant under economic weights—indicating that the regional association of transportation carbon emissions is related to transportation labor transfer and that labor transfer is influenced by transportation economic development. The total effect, direct effect and indirect effect of traffic travel levels and transportation production levels all passed the 1% significance test, indicating that traffic travel and transportation production are constrained by geography and economy and all have significant spatial effects. As the traffic travel and transportation production levels of a region increase, the areas geographically close to it or close to its economic level also increase accordingly; thus, their traffic carbon emissions increase at the same time.

5. Conclusions and Recommendations

5.1. Conclusions

This paper constructed a spatial Durbin model to explore the impact of technological progress on carbon emission regional spillover and the driving effects of emission abatement. The conclusions show that (1) the behavior of transportation carbon emissions is similar among regions with a close geographical distance and close transportation economic development level. The regions with a higher transportation carbon emission intensity were Heilongjiang, Liaoning, Beijing, Shanghai and other provinces and cities and the provinces and cities with lower transportation carbon emission intensities were Zhejiang, Fujian, Jiangsu and other provinces and cities; the total transportation carbon emission and carbon emission intensity showed the regional characteristics of being high in the east and low in the west. In other words, the emission decision of a region is not only influenced by its own transportation and economic development status and emission reduction potential, but is also influenced by the emission decisions of neighboring regions and regions with similar transportation and economic development levels, so that the emission behavior of each region is relatively similar. The “cluster effect” is more pronounced among geographically proximate regions than among economically proximate regions. (2) Inter-regional transportation carbon emissions have an “acquisition effect” and “leakage effect”. With the improvement of regional transportation infrastructure and the development of information technology, the spillover effect of regional geographical distance on transportation technology gradually weakens, while the spillover effect of economic distance on regional transportation technology gradually strengthens, and the “leakage effect” becomes prominent. (3) The progress of transportation technology has positive and negative externalities, and the regional association of transportation carbon emissions is related to the transfer of transportation labor; transportation travel and transportation production are subject to geographical and economic constraints, which have obvious spatial effects. Traffic travel and transportation production are constrained by geography and economy, and there are obvious spatial effects. When the level of traffic travel and transportation production in a region increases, the areas near or close to that region’s economic level also increase accordingly; thus, their transportation carbon emissions increase at the same time.

5.2. Suggestions

First, establish a mechanism for regional carbon emission synergy reduction and improve mechanisms for the promotion of the green development of transportation. Second, promote the application of new technologies, strengthen the interactive exchange of transportation technologies and economic ties between regions, build a low-carbon transportation system, give full play to the radiation effect and learning effect between regions and achieve the maximum emission reduction in the field of transportation. Third, promote changes in the spatial layout of transportation infrastructure, the construction of green transportation infrastructure, the strengthening of inter-regional transportation technology cooperation and the realization of inter-regional synergistic emission reduction.

Author Contributions

Y.L. proposed the idea of writing the article, thought about and verified the methods used in the article and organized the hand collection and organization of the data. L.C. was responsible for the collection and organization of the receipts and was responsible for solving the model with software and writing a paper on the results of the analysis. C.H. proofread the paper and corrected errors in the detailed parts of the paper to ensure the rigor of the article. At the time of funding acquisition, all authors had read and agreed to the published version of the manuscript. All authors have read and agreed to the published version of the manuscript.

Funding

This research was funded by National Social Science Foundation of China (21BJY038).

Informed Consent Statement

Informed consent was obtained from all subjects involved in the study. Written informed consent was obtained from the patient(s) to publish this paper.

Data Availability Statement

The statistical data are from China Statistical Yearbook and Provincial Statistical Yearbook.

Conflicts of Interest

The authors declare no conflict of interest.

References

  1. Oreggioni, G.D.; Ferraio, F.M.; Crippa, M.; Muntean, M.; Schaaf, E.; Guizzardi, D.; Solazzo, E.; Duerr, M.; Perry, M.; Vignati, E. Climate change in a changing world: Socio-economic and technological transitions, regulatory frameworks and trends on global greenhouse gas emissions from EDGAR v.5.0. Glob. Environ. Change 2021, 70, 102350. [Google Scholar] [CrossRef]
  2. Cai, L.; Duan, J.; Lu, X.; Luo, J.; Yi, B.; Wang, Y.; Jin, D.; Lu, Y.; Qiu, L.; Chen, S.; et al. Pathways for electric power industry to achieve carbon emissions peak and carbon neutrality based on LEAP model: A case study of state-owned power generation enterprise in China. Comput. Ind. Eng. 2022, 170, 108334. [Google Scholar] [CrossRef]
  3. Li, W.; Zhang, S.; Lu, C. Research on the driving factors and carbon emission reduction pathways of China’s iron and steel industry under the vision of carbon neutrality. J. Clean. Prod. 2022, 357, 131990. [Google Scholar] [CrossRef]
  4. Liu, M.; Zhang, X.; Zhang, M.; Feng, Y.; Liu, Y.; Wen, J.; Liu, L. Influencing factors of carbon emissions in transportation industry based on CD function and LMDI decomposition model: China as an example. Environ. Impact Assess. Rev. 2021, 90, 106623. [Google Scholar] [CrossRef]
  5. Albuquerque, F.D.; Maraqa, M.A.; Chowdhury, R.; Mauga, T.; Alzard, M. Greenhouse gas emissions associated with road transport projects: Current status, benchmarking, and assessment tools. Transp. Res. Procedia 2020, 48, 2018–2030. [Google Scholar] [CrossRef]
  6. Li, R.; Li, L.; Wang, Q. The impact of energy efficiency on carbon emissions: Evidence from the trans-portation sector in Chinese 30 provinces. Sustain. Cities Soc. 2022, 82, 103880. [Google Scholar] [CrossRef]
  7. Yao, X.; Fan, Y.; Zhao, F.; Ma, S.C. Economic and climate benefits of vehicle-to-grid for low-carbon transi-tions of power systems: A case study of China’s 2030 renewable energy target. J. Clean. Prod. 2022, 330, 129833. [Google Scholar] [CrossRef]
  8. Wei, F.; Zhang, X.; Chu, J.; Yang, F.; Yuan, Z. Energy and environmental efficiency of China’s transportation sectors considering CO2 emission uncertainty. Transp. Res. Part D Transp. Environ. 2021, 97, 102955. [Google Scholar] [CrossRef]
  9. Davis, S.J.; Lewis, N.S.; Shaner, M.; Aggarwal, S.; Arent, D.; Azevedo, I.L.; Benson, S.M.; Bradley, T.; Brouwer, J.; Chiang, Y.M.; et al. Net-zero emissions energy systems. Science 2018, 360, eaas9793. [Google Scholar] [CrossRef]
  10. Yi, H.; Zhao, L.; Qian, Y.; Zhou, L.; Yang, P. How to achieve synergy between carbon dioxide mitigation and air pollution control? Evid. China Sustain. Cities Soc. 2022, 78, 103609. [Google Scholar] [CrossRef]
  11. Guo, J.X. Cleaner technology choice in the synergistic control process for greenhouse gases and air pollutions. J. Clean. Prod. 2019, 238, 117885. [Google Scholar] [CrossRef]
  12. Fan, F.; Lei, Y. Responsive relationship between energy-related carbon dioxide emissions from the transportation sector and economic growth in Beijing—Based on decoupling theory. Int. J. Sustain. Transp. 2017, 11, 764–775. [Google Scholar] [CrossRef]
  13. Arvin, M.B.; Pradhan, R.P.; Norman, N.R. Transportation intensity, urbanization, economic growth, and CO2 emissions in the G-20 countries. Util. Policy 2015, 35, 50–66. [Google Scholar] [CrossRef]
  14. Liu, X.; Bao, Y.; Zhang, Y.; Li, J. Decoupling analysis on China’s civil aviation carbon emissions from transportation revenue: A three-dimension decomposition framework. Sustain. Prod. Consum. 2022, 32, 718–730. [Google Scholar] [CrossRef]
  15. Sufyanullah, K.; Ahmad, K.A.; Ali, M.A.S. Does emission of carbon dioxide is impacted by urbanization? An empirical study of urbanization, energy consumption, economic growth and carbon emissions-Using ARDL bound testing approach. Energy Policy 2022, 164, 112908. [Google Scholar] [CrossRef]
  16. Adams, S.; Boateng, E.; Acheampong, A.O. Transport energy consumption and environmental quality: Does urbanization matter? Sci. Total Environ. 2020, 744, 140617. [Google Scholar] [CrossRef] [PubMed]
  17. Lv, Q.; Liu, H.; Yang, D.; Liu, H. Effects of urbanization on freight transport carbon emissions in China: Common characteristics and regional disparity. J. Clean. Prod. 2018, 211, 481–489. [Google Scholar] [CrossRef]
  18. Yu, Y.; Li, S.; Sun, H.; Taghizadeh-Hesary, F. Energy carbon emission reduction of China’s transportation sector: An input–output approach. Econ. Anal. Policy 2021, 69, 378–393. [Google Scholar] [CrossRef]
  19. Liu, J.; Li, S.; Ji, Q. Regional differences and driving factors analysis of carbon emission intensity from transport sector in China. Energy 2021, 224, 120178. [Google Scholar] [CrossRef]
  20. Chen, W.; Lei, Y. Path analysis of factors in energy-related CO2 emissions from Beijing’s transportation sector. Transp. Res. Part D Transp. Environ. 2017, 50, 473–487. [Google Scholar] [CrossRef]
  21. Wang, Y.; Xing, Z.; Zhang, H.; Wang, Y.; Du, K. On-road mileage-based emission factors of gaseous pollutants from bi-fuel taxi fleets in China: The influence of fuel type, vehicle speed, and accumulated mileage. Sci. Total Environ. 2022, 819, 151999. [Google Scholar] [CrossRef] [PubMed]
  22. Turgut, E.T.; Usanmaz, O.; Cavcar, M. The effect of flight distance on fuel mileage and CO2 per passenger kilometer. Int. J. Sustain. Transp. 2018, 13, 224–234. [Google Scholar] [CrossRef]
  23. Yang, X.; Jia, Z.; Yang, Z.; Yuan, X. The effects of technological factors on carbon emissions from various sectors in China—A spatial perspective. J. Clean. Prod. 2021, 301, 126949. [Google Scholar] [CrossRef]
  24. Yang, X.; Jia, Z.; Yang, Z. How does technological progress impact transportation green total factor productivity: A spatial econometric perspective. Energy Rep. 2021, 7, 3935–3950. [Google Scholar] [CrossRef]
  25. Xie, Z.; Wu, R.; Wang, S. How technological progress affects the carbon emission efficiency? Evidence from national panel quantile regression. J. Clean. Prod. 2021, 307, 127133. [Google Scholar] [CrossRef]
  26. Zhao, M.; Sun, T. Dynamic spatial spillover effect of new energy vehicle industry policies on carbon emission of transportation sector in China. Energy Policy 2022, 165, 112991. [Google Scholar] [CrossRef]
  27. Nan, S.; Huo, Y.; You, W.; Guo, Y. Globalization spatial spillover effects and carbon emissions: What is the role of economic complexity? Energy Econ. 2022, 112, 106184. [Google Scholar] [CrossRef]
  28. Jost, F.; Dale, A.; Newell, R.; Robinson, J. Climate action assessment in three small municipalities in British Columbia: Advancements vis-à-vis major neighboring cities. Curr. Res. Environ. Sustain. 2020, 2, 100010. [Google Scholar] [CrossRef]
  29. Cheng, S.; Fan, W.; Zhang, J.; Wang, N.; Meng, F.; Liu, G. Multi-sectoral determinants of carbon emission inequality in Chinese clustering cities. Energy 2020, 214, 118944. [Google Scholar] [CrossRef]
  30. Yu, Q.; Li, M.; Li, Q.; Wang, Y.; Chen, W. Economic agglomeration and emissions reduction: Does high agglomeration in China’s urban clusters lead to higher carbon intensity? Urban Clim. 2022, 43, 101174. [Google Scholar] [CrossRef]
  31. Wang, S.; Ren, H.; Liang, L.; Li, J.; Wang, Z. The effect of economic development on carbon intensity of human well-being: Evidence from spatial econometric analyses. J. Clean. Prod. 2022, 364, 132632. [Google Scholar] [CrossRef]
  32. Xu, J.; Wang, J.; Yang, X.; Xiong, C. Peer effects in local government decision-making: Evidence from urban environmental regulation. Sustain. Cities Soc. 2022, 85, 104066. [Google Scholar] [CrossRef]
  33. Li, Z.; Wang, J. Spatial emission reduction effects of China’s carbon emissions trading: Quasi-natural experiments and policy spillovers. Chin. J. Popul. Resour. Environ. 2021, 19, 246–255. [Google Scholar] [CrossRef]
  34. Liu, S.; He, N.; Shi, Y.; Li, G. The roles logistics agglomeration and technological progress play in air pollution—New evidence in sub-regions of Chongqing, China. J. Clean. Prod. 2021, 317, 128414. [Google Scholar] [CrossRef]
  35. Apa, R.; De Noni, I.; Orsi, L.; Sedita, S.R. Knowledge space oddity: How to increase the intensity and relevance of the technological progress of European regions. Res. Policy 2018, 47, 1700–1712. [Google Scholar] [CrossRef]
  36. Xu, Y.; Heikkila, E.J. How can cities learn from each other? Evidence from China’s five-year plans. J. Urban Manag. 2020, 9, 216–227. [Google Scholar] [CrossRef]
  37. Wang, Z.; Qiu, S. Can “energy saving and emission reduction” demonstration city selection actually contribute to pollution abatement in China? Sustain. Prod. Consum. 2021, 27, 1882–1902. [Google Scholar] [CrossRef]
  38. Mouratidis, K.; Peters, S.; van Wee, B. Transportation technologies, sharing economy, and teleactivities: Implications for built environment and travel. Transp. Res. Part D Transp. Environ. 2021, 92, 102716. [Google Scholar] [CrossRef]
  39. Guo, Y.; Lu, Q.; Wang, S.; Wang, Q. Analysis of air quality spatial spillover effect caused by transportation infrastructure. Transp. Res. Part D Transp. Environ. 2022, 108, 103325. [Google Scholar] [CrossRef]
  40. Marinos, T.; Belegri-Roboli, A.; Michaelides, P.G.; Konstantakis, K. The spatial spillover effect of transport infrastructures in the Greek economy (2000–2013): A panel data analysis. Res. Transp. Econ. 2022, 94, 101179. [Google Scholar] [CrossRef]
  41. Wang, J.; Dong, K.; Dong, X.; Jiang, Q. Research on the carbon emission effect of the seven regions along the Belt and Road—Based on the spillover and feedback effects model. J. Clean. Prod. 2021, 319, 128758. [Google Scholar] [CrossRef]
  42. Lv, T.; Zeng, C.; Stringer, L.C.; Yang, J.; Wang, P. The spatial spillover effect of transportation networks on ecological footprint. Ecol. Indic. 2021, 132, 108309. [Google Scholar] [CrossRef]
  43. Zhao, P.; Zeng, L.; Li, P.; Lu, H.; Hu, H.; Li, C.; Zheng, M.; Li, H.; Yu, Z.; Yuan, D.; et al. China’s transportation sector carbon dioxide emissions efficiency and its influencing factors based on the EBM DEA model with undesirable outputs and spatial Durbin model. Energy 2022, 238, 121934. [Google Scholar] [CrossRef]
  44. Zhang, Y. Interregional carbon emission spillover–feedback effects in China. Energy Policy 2017, 100, 138–148. [Google Scholar] [CrossRef]
  45. Yoo, S.; Cho, A.; Salman, F.; Yoshida, Y. Green paradox: Factors affecting travel distances and fuel usages, evidence from Japanese survey. J. Clean. Prod. 2020, 273, 122280. [Google Scholar] [CrossRef]
  46. Heinen, E.; Mattioli, G. Multimodality and CO2 emissions: A relationship moderated by distance. Transp. Res. Part D Transp. Environ. 2019, 75, 179–196. [Google Scholar] [CrossRef]
  47. Sturm, P.J.; Pucher, K.; Sudy, C.; Almbauer, R.A. Determination of traffic emissions—Intercomparison of different calculation methods. Sci. Total Environ. 1996, 189, 187–196. [Google Scholar] [CrossRef]
  48. Jiang, Y.; Ding, Z.; Zhou, J.; Wu, P.; Chen, B. Estimation of traffic emissions in a polycentric urban city based on a macroscopic approach. Phys. A Stat. Mech. Its Appl. 2022, 602, 127391. [Google Scholar] [CrossRef]
  49. Climate Department of National Developement and Re-form Commission Guidance for Compiling Provincial Greenhouse Gas Emission Lists (Trial) [R]. Beijing. 2011. Available online: http://www.ncsc.org.cn/SY/tjkhybg/202003/t20200319_769763.shtml (accessed on 29 June 2022).
  50. Energy Department of National Bureau of Statistics of China. China Energy Statistical Yearbook; China Statistics Press: Beijing, China, 2012. [Google Scholar]
  51. Energy Department of National Bureau of Statistics of China. China Energy Statistical Yearbook; China Statistics Press: Beijing, China, 2013. [Google Scholar]
  52. Energy Department of National Bureau of Statistics of China. China Energy Statistical Yearbook; China Statistics Press: Beijing, China, 2014. [Google Scholar]
  53. Energy Department of National Bureau of Statistics of China. China Energy Statistical Yearbook; China Statistics Press: Beijing, China, 2015. [Google Scholar]
  54. Energy Department of National Bureau of Statistics of China. China Energy Statistical Yearbook; China Statistics Press: Beijing, China, 2016. [Google Scholar]
  55. Energy Department of National Bureau of Statistics of China. China Energy Statistical Yearbook; China Statistics Press: Beijing, China, 2017. [Google Scholar]
  56. Energy Department of National Bureau of Statistics of China. China Energy Statistical Yearbook; China Statistics Press: Beijing, China, 2018. [Google Scholar]
  57. Energy Department of National Bureau of Statistics of China. China Energy Statistical Yearbook; China Statistics Press: Beijing, China, 2019. [Google Scholar]
  58. Energy Department of National Bureau of Statistics of China. China Energy Statistical Yearbook; China Statistics Press: Beijing, China, 2020. [Google Scholar]
  59. Energy Department of National Bureau of Statistics of China. China Energy Statistical Yearbook; China Statistics Press: Beijing, China, 2021. [Google Scholar]
  60. Liu, H.; Yang, R.; Wu, D.; Zhou, Z. Green productivity growth and competition analysis of road transportation at the provincial level employing Global Malmquist-Luenberger Index approach. J. Clean. Prod. 2020, 279, 123677. [Google Scholar] [CrossRef]
  61. Wang, C.; Wood, J.; Wang, Y.; Geng, X.; Long, X. CO2 emission in transportation sector across 51 countries along the Belt and Road from 2000 to 2014. J. Clean. Prod. 2020, 266, 122000. [Google Scholar] [CrossRef]
Figure 1. Theoretical Framework for the Synergistic Carbon Emission Reduction Effect of Transportation.
Sustainability 14 10608 g001
Figure 2. Characteristics of total transportation carbon emissions and intensity by province, 2011–2020.
Sustainability 14 10608 g002
Figure 3. Biplot of total transportation carbon emissions and intensity standard deviation by province, 2011–2020.
Sustainability 14 10608 g003
Figure 4. Local MORAN scatterplot of transportation carbon emissions in 2011 and 2020. Note: The 30 provinces and cities in the chart are: 1—Beijing, 2—Tianjin, 3—Hebei, 4—Shanxi, 5—Inner Mongolia, 6—Liaoning, 7—Jilin, 8—Heilongjiang, 9—Shanghai, 10—Jiangsu, 11—Zhejiang, 12—Anhui, 13—Fujian, 14—Jiangxi, 15—Shandong, 16—Henan, 17—Hubei, 18—Hunan, 19—Guangdong, 20—Guangxi, 21—Hainan, 22—Chongqing, 23—Sichuan, 24—Guizhou, 25—Yunnan, 26—Shaanxi, 27—Gansu, 28—Qinghai, 29—Ningxia, 30—Xinjiang.
Sustainability 14 10608 g004
Table 1. Table of parameter values.
Fuel Type
i
Raw CoalCokeCrude OilGasolineKeroseneDieselFuel OilLiquefied GasNatural Gas
Average low calorific value of energy
(ALC; kJ/kg)
20,90828,43541,81643,07043,07042,65241,81644,20038,931
Carbon content
(C; t/TJ)
26.3729.4220.0818.9019.6020.2021.1017.2015.32
Carbon oxidation rate
(R)
0.940.930.980.980.980.980.980.980.99
Table 2. Carbon emission factors of electricity by province.
ProvinceFujian, Anhui, Zhejiang, Shanghai, JiangsuShanxi, Beijing, Tianjin, Shandong, Hebei, Inner MongoliaHeilong jiang, Jilin, LiaoningSichuan, Chongqing, Hunan, Hubei, Henan, JiangxiGansu, Shaanxi, Qinghai, Ningxia, XinjiangYunnan, Guizhou, Guangdong, GuangxiHainan
Electricity carbon emission factors (EF; kgCO2/kWh)0.9281.2461.0960.8010.9770.7140.917
Table 3. Input and output indicators.
Indicator TypeIndicatorsData Source
Input IndicatorsFreight turnoverChina Statistical Yearbook 2011–2020 and the statistical yearbooks of each province
Passenger turnover
Number of employees in the transportation industry
Output IndicatorsTransportation value added
Transportation carbon emissions
Table 4. Model variables.
Variable TypeNameIndicatorsConnotationData Source
Dependent variableCarTotal carbon emissionsTraffic pollution levelIndirect calculation through electricity consumption and fuel consumption
Independent variableTFPTTransportation total factor productivityLevel of technological progress in transportationData envelopment analysis method
NTENumber of traffic employeesLabor input levelProvinces 2011–2020
Statistical Yearbook
RTPassenger turnoverTraffic and travel level
RVFTFreight turnoverTransport production level
Table 5. Transportation Carbon Emissions Global Moran Index.
YearMoran IndexStatistical Valuesp-Value
20110.119 ***2.5080.020
20120.123 ***2.5130.016
20130.142 ***2.4310.008
20140.138 ***2.3110.010
20150.139 ***2.3120.010
20160.138 **2.2070.014
20170.153 ***2.3840.009
20180.155 ***2.4120.008
20190.158 ***2.4260.008
20200.168 ***2.8690.002
Note: “***”and ”**” indicate significant at the 1% and 5% levels, respectively.
Table 6. Wald test and LR test results.
Inspection MethodStatistical Valuesp-Value
LR-lag15.53 ***0.0012
LR-error10.93 ***0.0042
Wald-lag11.55 ***0.0031
Wald-error17.26 ***0.0017
Note: “***” indicates significant at the 1% level.
Table 7. Estimation results of the spatial Durbin model.
Independent VariableGeographical WeightingEconomic Weights
Estimated CoefficientStatistical ValuesEstimated CoefficientStatistical Values
TFPT−0.451 ***(2.12)−0.227 ***1.27
NTE1.046 **(2.05)1.0211.54
RT0.117 **(1.99)0.001 ***2.71
RCFT−0.002(−0.14)−0.001−0.12
W*TFPT0.377 ***(1.56)0.478 ***1.64
W*NTE−1.497(−0.96)1.849 *1.65
W*RT0.07(1.55)−0.001−0.24
W*RCFT0.09(−1.01)0.0012.17
rho0.311 ***(1.13)0.212 ***0.97
Note: “***”, “**”, and “*” indicate significant at the 1%, 5%, and 10% levels, respectively.
Table 8. Results of spatial effect decomposition.
Independent VariableGeographical WeightingEconomic Weights
Total EffectDirect EffectIndirect EffectsTotal EffectDirect EffectIndirect Effects
TFPT0.031 ***0.047 **−0.016 *0.043 ***0.029 **0.014 ***
(2.24)(1.19)(1.12)(2.35)(1.31)(1.10)
NTE−0.335−1.2890.9542.6871.771 **0.916
(−0.18)(−0.68)(2.22)(2.24)(1.71)(1.58)
RT0.002 ***0.0010.0010.002 ***0.0010.001
(2.69)(1.34)(1.57)(2.70)(0.43)(0.67)
RCFT0.011 **0.0100.0010.0020.001 **0.001 **
(0.09)(1.03)(0.98)(0.08)(2.06)(1.98)
Note: “***”, “**”, and “*” indicate significant at the 1%, 5%, and 10% levels, respectively.
Publisher’s Note: MDPI stays neutral with regard to jurisdictional claims in published maps and institutional affiliations.

