Abstract
Multiple major coastal cities face the threat of sea level rise with global climate change. This vulnerability can be further exacerbated by local contexts of urbanization and flood management. Land subsidence caused by groundwater over-extraction has long been identified as a factor that exposes cities to the threat of submergence through its interaction with the sea’s tidal regime or a river basin’s precipitation pattern and flood regime. Decision-making in regards to environmental issues such as land subsidence ultimately relies on monitoring data to frame the problem and formulate policies accordingly. Thus, in examining how subsidence has been shaped into a scientific reality in the Bangkok Metropolitan Region, this article reviews the limits and uncertainties of subsidence monitoring tools and their associated indicators for risk management (safe yield, piezometric level, and subsidence rate). Our analysis of existing technical reports, supported by interviews conducted with key actors involved in the processes of knowledge production and policy-making, has pointed out how such uncertainties give way to varied interpretations of these indicators, which continue to fuel the debate concerning the establishment of a safe yield for groundwater management. Furthermore, our research has also revealed that the monitoring of land subsidence has been receiving less priority due to institutional challenges within concerned governmental agencies. Ultimately, we argue that in order to use the resource sustainably, it is crucial to keep monitoring groundwater overdraft in the neighboring provinces of Bangkok to diligently anticipate long-term flooding risks associated with the changing hydrogeological regime of the delta.
1. Introduction
Deltas are a double-edged environment. While they have historically proven to be propitious to the development of urban hubs, they are also sources of environmental constraints as modest settlements gradually grow into mega-cities. Among those, land subsidence has posed a challenge in many coastal cities around the world (Bangkok, Jakarta, Lagos, London, Manila, San Francisco, Shanghai, Singapore, Taipei, Tokyo, Venice, etc.). Subsidence corresponds to “a gradual settling or sudden sinking of the Earth’s surface due to removal or displacement of subsurface earth materials” [1]. The recognition that land subsidence is most often associated with human intervention, whether through fluid withdrawal (oil, gas, groundwater, etc.), or solid extraction (salt, coal, tunneling, etc.), from the underground [2,3,4], has received international attention following the inclusion of land subsidence as part of the agenda of the UNESCO’s Hydrological Decade 1965–1974 [5]. Chief among the plurality of factors that cause land subsidence is excessive groundwater extraction, which can exceed absolute sea level rise up to a factor of ten [6]. Groundwater overdraft is usually tied to the growing water demand that accompanies the rapid urbanization and industrialization of an area. The first of the series of International Symposium on Land Subsidence, held in Tokyo in 1969, led to the publication of a guidebook on land subsidence destined for engineers, geologists, and hydrologists [7], thus marking an important milestone in the emergence of a specific scientific community around this issue. Grasping the framing of and response to land subsidence is particularly relevant in our present context where the struggle between delta cities and submergence unfurls in a context of climate change causing changing patterns of precipitation, coastal erosion, tidal regimes, and sea levels [8].
Bangkok is a paradigmatic example of a delta city whose entanglement with subsidence resulted in more than five decades of problem-framing and policy-making since the identification of the issue [9]. The city rests atop what can be referred to as the ‘young delta’ plain [10] (p. 28). The geological composition of this plain consists of clastic sediment deposits from Mid-Tertiary to Quaternary age lying over the basement complex. The Lower Chao Phraya Groundwater Basin contains eight aquifers confined by the 17–30 m thick “Bangkok Clay” layer (comprising weathered, soft, and stiff clay), which provides them with artesian head and is composed of sandy and gravely sediments with layers of clay virtually confining them (Table 1). It should be noted that “although these aquifers are treated as laterally continuous and separate for the sake of convenience in well logging and screen placement, the clay interbeds are not continuous across the basin and, thus, significant hydraulic connections exist between the aquifers” [11] (p. 28). Due to their unconsolidated and semi-consolidated nature, the sediments are subjected to effects of compaction, in other words, prone to land subsidence. Groundwater-induced land subsidence in Bangkok translates into increased vulnerability to flooding and damage to urban assets. Furthermore, groundwater overdraft also translates into increased pumping costs due to dropping head, and aquifer salinization caused by sea water encroaching the aquifers due to the reduced pressure of freshwater in the aquifers. Groundwater in the Bangkok region is thus mostly pumped from the second, third, and fourth aquifers, the first one being too saline and the deeper ones necessitating excessively high drilling costs. While the second aquifer has been subjected to rising salinity due to over-pumping in the past, the third aquifer, Nakhon Luang, is the most pumped of them all for it yields water of very good quality (Figure 1) [12,13,14].

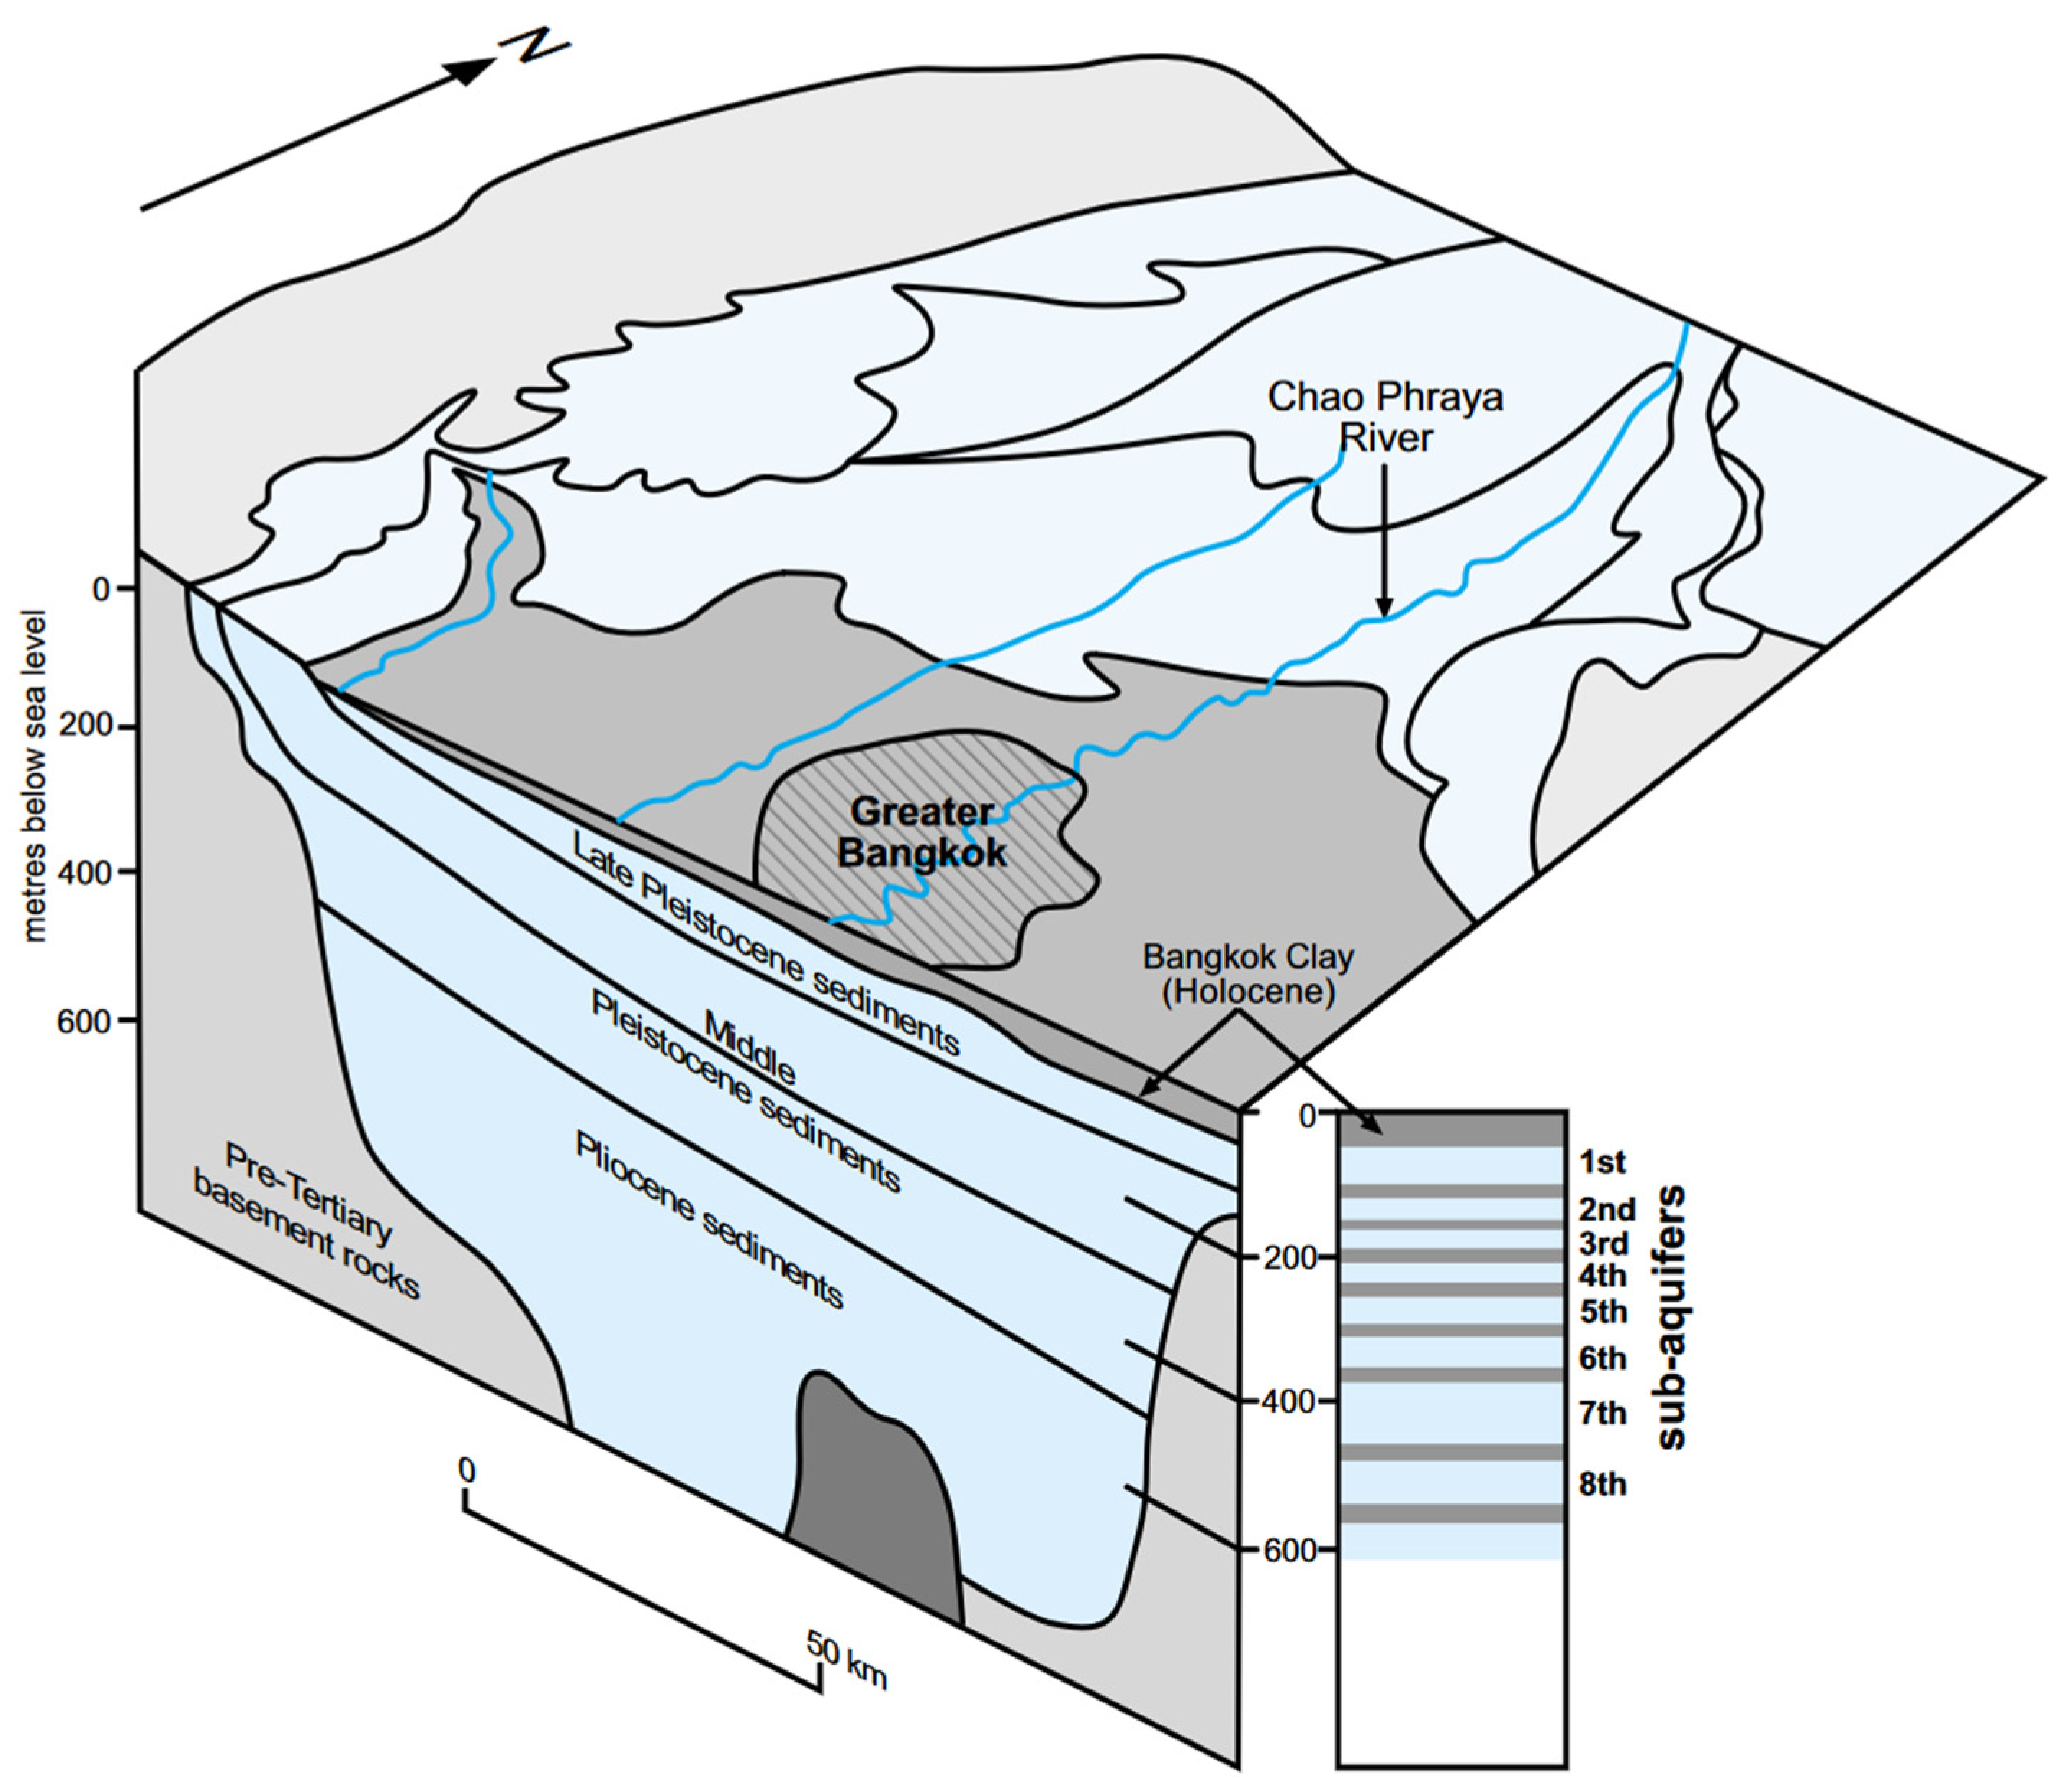

Table 1.
General depth ranges of Bangkok subsoils. Adapted from Balasubramaniam et al. [15].
Table 1.
General depth ranges of Bangkok subsoils. Adapted from Balasubramaniam et al. [15].
| Soil Type | Depth Range (m) |
|---|---|
| Weathered clay | 0–2 |
| Soft clay | 1–16 |
| Stiff clay | 10–25 |
| First sand | 14–38 |
| Hard clay | 24–43 |
| Second sand | 30–58 |

Figure 1.
Hydrogeological block diagram of the Lower Chao Phraya Groundwater Basin [16]. In this diagram, Greater Bangkok refers to the Bangkok Metropolitan Region. The eight distinguished aquifers and their respective depth range are Bangkok aquifer (BK) at 16–50 m, Phra Pradaeng aquifer (PD) at 50–100 m, Nakhon Luang aquifer (NL) at 100–150 m, Nonthaburi aquifer (NB) at 150–200 m, Sam Khok aquifer (SK) at 200–300 m, Phaya Thai aquifer (PT) at 300–350 m, Thonburi aquifer (TB) at 350–450 m, and Pak Nam aquifer (PN) at 450–550 m. The Bangkok Clay layer is contained within the Bangkok aquifer, separating the upper unconfined Bangkok sub-aquifer from the lower confined Bangkok sub-aquifer.

The first comprehensive investigation on land subsidence was conducted between 1978 and 1981 [17], at the request of the National Environment Board (NEB) and the National Research Council, which tasked the Asian Institute of Technology (AIT), Chulalongkorn University, and the Department of Groundwater Resources (DGR) with the proposal of a research program [18]. The DGR was still only a bureau at the time and was detached from its predecessor, the Department of Mineral Resources (DMR), in 2002 to become the independent department we know today. However, for the sake of clarity, we will refer to both as the DGR in our article. Three projects were proposed following the investigation. They cost 1.5 million U.S. dollars at the time and were respectively focused on studying groundwater resources and the aquifers, land subsidence caused by groundwater extraction, and conducting a levelling survey within Bangkok. These projects were respectively led by the DGR, the AIT, and the Royal Thai Survey Department (RTSD). Following the publication of the investigation report, multiple policies were implemented between 1983 and the early 2000s:
- The definition of critical groundwater zones, which allowed for the implementation of policies in focused areas. These first comprised the provinces of Bangkok, Nonthaburi, Pathum Thani, and Samut Prakan in 1983 and the zones were extended in 1995 to also include Nakhon Pathom, Phra Nakhon Si Ayutthaya, and Samut Sakhon.
- The development of tap water (produced from surface water sources) distribution coverage.
- The control of groundwater pumping through well registration in 1985. From 2003 onwards, a cabinet resolution terminated groundwater use in areas where surface water supply existed. A pumping permit could still be obtained if an industrial user justifies the necessity of groundwater in their production process.
- The introduction of an incremental groundwater pricing mechanism. An initial tariff of 1.0 Bt/m3 (0.03 $) was introduced in 1985 and increased later in an attempt to match the tap water’s price to 3.5 Bt/m3 (0.09 $) in 1994 and 8.5 Bt/m3 (0.21 $) in 2003. An additional conservation fee of 8.5 Bt/m3 was imposed on users in the critical groundwater zones in 2006.
- The monitoring of groundwater use and land subsidence through levelling surveys and the installation of monitoring stations.
This paper focuses on the aspect of monitoring because understanding monitoring tools and the knowledge production process is a key element that allows us to comprehend the drivers of policy-making on the issue of land subsidence. Representations of the situation, whether through contour maps or groundwater usage models, stem from monitoring data.
Current literature on Bangkok subsidence is mostly of technical nature and does not reflect the political aspects of policy negotiation, nor does it deconstruct the discourses behind the problem framing. In our view, this is due to the taken-for-granted nature of land subsidence monitoring tools. As contended by Bradnock and Saunders, land subsidence may seem to be a merely technical topic and simply pose a challenge in data acquisition, yet they have emphasized that when “political concerns determine the questions, then the questions asked also help to shape the answers obtained” [19] (p. 67). In other words, understanding the stakes revolving around the issue helps one understand how data are produced and used to assess the problem and address concerns. Thus, this article focuses on the relationship between knowledge production, data interpretation, and policy-making by examining the following questions: How is land subsidence shaped into a scientific problem? To what extent is the complexity of the phenomenon translated into implementable policies? We start with reviewing the three main monitoring tools used for studying land subsidence in order to point out what sort of knowledge and respective uncertainties they produce. In the second section, we dissect how these uncertainties leave room for interpretation with regard to the issue of subsidence and the policies for groundwater regulation. Furthermore, we will examine how the processes of knowledge production and policy implementation are subjected to institutional trappings.
2. Materials and Methods
Our inquiry into knowledge production and groundwater policy-making was limited to the area of the critical groundwater zones in the Chao Phraya delta. They were first defined in 1983 around Bangkok and were expanded in 1995 to cover the province of Ayutthaya and the Bangkok Metropolitan Region (BMR), which comprises the provinces of Bangkok, Nakhon Pathom, Nonthaburi, Pathum Thani, Samut Prakan, and Samut Sakhon. Through the lens of human geography and policy studies, we have focused our research on the monitoring of land subsidence and groundwater use in order to better understand the interlinkages between science, technology, and society that contributed to the framing of this environmental issue.
In the first phase of the research, a literature review was conducted on the topic of subsidence and flooding in the Chao Phraya delta, subsidence in policy studies, and the history of subsidence studies and its monitoring techniques. For the case of BMR in particular, academic publications, excerpts from the media, policy documents, and technical reports combining insights from hydrogeology and geodesy were analyzed. Key actors were then identified ranging from academic experts, engineers, government officials, researchers, and representatives from the industrial and real estate sectors.
In the second phase of the study, exploratory interviews were conducted with the varied key actors in order to elicit their understanding of the policy history and the present state of land subsidence. We chose to conduct semi-directed interviews with these actors to collect qualitative data, which provide more depth and nuance to understand the processes of knowledge production, problem framing, and policy-making we are interested in. The technique consists in preparing a thematic framework before an interview (the structured part of the method) without defining the wording and the order of the questions beforehand (the unstructured part of the method), thus providing an open-ended aspect to interviews, which allows participants to elaborate and rephrase their answers.
Results from the second phase were analyzed, and the lessened monitoring of subsidence in Bangkok’s neighboring provinces in contrast to the narrative of Bangkok’s recovery from subsidence was identified as a salient issue. The initial interviews allowed us to identify an extended network of actors concerned with the issue of knowledge production and policy implementation with regard to groundwater regulation and subsidence monitoring and to broaden the scope of interviewed actors (commonly referred to as the snowball sampling method in social sciences). Thus, the last phase of the research was focused on current challenges with monitoring techniques and growing water demand in the future, which can eventually contribute to worsening issues of groundwater extraction and subsidence. The interview frameworks were reworked with these issues in mind, and the actors were also prompted on their views regarding other actors and other depictions of the issues. Throughout the whole research, a total of 38 interviews, each lasting 135 min on average, were conducted.
3. Results and Discussion
3.1. Monitoring Tools and Their Uncertainties
3.1.1. Land-Based Geodetic Tools and Their Limitations
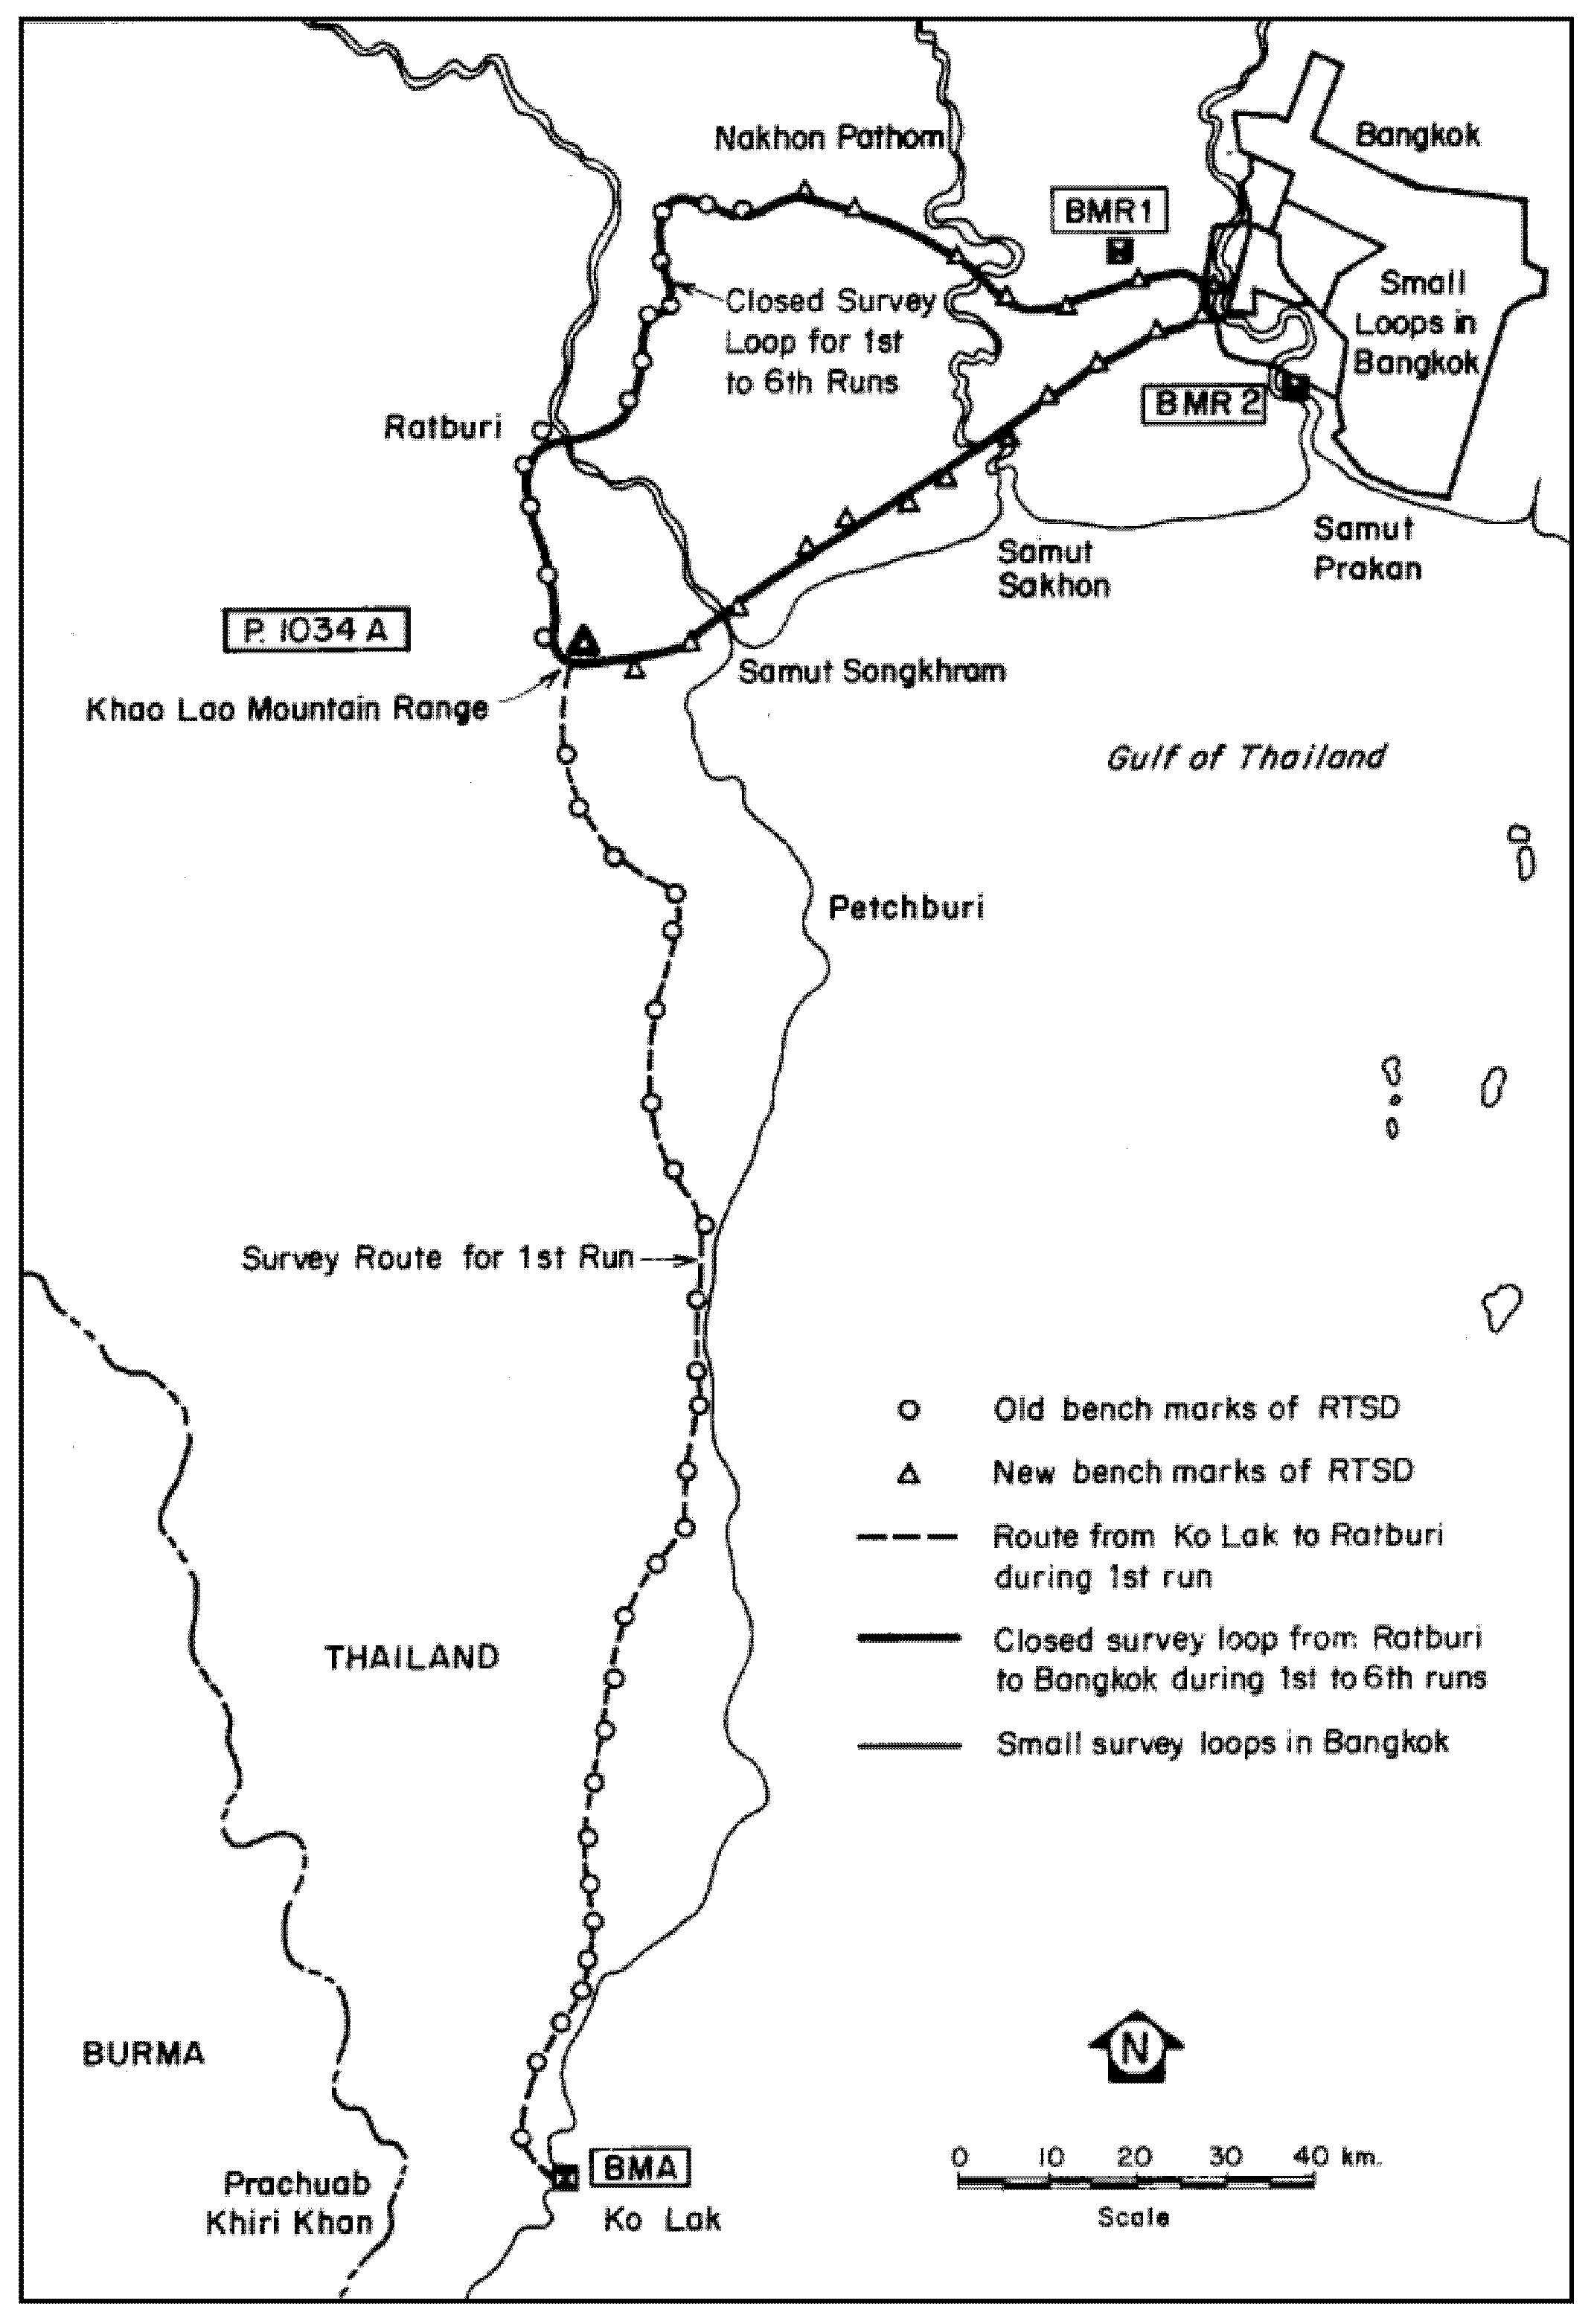
Land-based geodesy, through its exploration of earth’s geometry and its changes over time, has long been the favored means of investigation of land subsidence. It notably allows one to measure absolute land subsidence, through levelling benchmarks, and the compaction of specific soil layers, through an extensometer or any type of compression indicator. The practice of levelling consists in determining the elevation of a point relative to a (stable) reference point called a datum. Once a network of benchmarks has been established via precise levelling, surveying it at a later date allows land subsidence to be assessed [7]. In the context of the RTSD’s levelling survey project, seven runs of first-order levelling were conducted at half-year intervals between mid-1978 and 1981 [20] during which 133 primary benchmarks (PBM) and 514 secondary benchmarks (SBM) were surveyed [21]. One-meter-deep benchmarks were distributed throughout the area and have been maintained ever since by the RTSD [22,23]. Older shallow reference benchmarks established in Bangkok in the 1930s and tied to the broader benchmark network with the stable elevation reference in Ko Lak (Figure 2) were re-leveled for the first time during the RTSD survey in 1978 [24]. The benchmark within Bangkok was found to have subsided between 20 and 86 cm since the 1930s. The levelling actions of 1981 and 1982 were used to draw the contour of the subsidence rate in Bangkok [20] and then to elaborate on the critical groundwater area zoning of 1983. The RTSD interrupted their survey between 1982 and 1984 because of a lack of funding and could only resume in November 1984. By 2015, the RTSD levelling survey network for the critical groundwater zone comprised 93 PBM and 828 SBM.
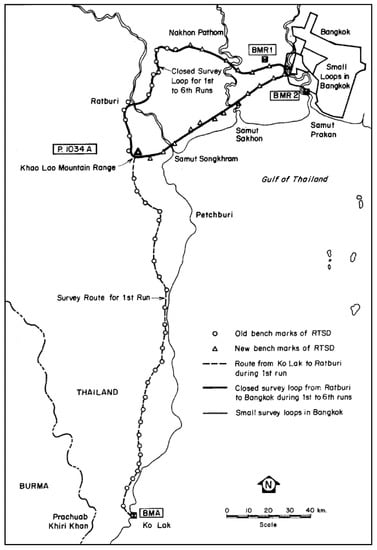
Figure 2.
RTSD levelling routes in the 1978–1980 survey [25].
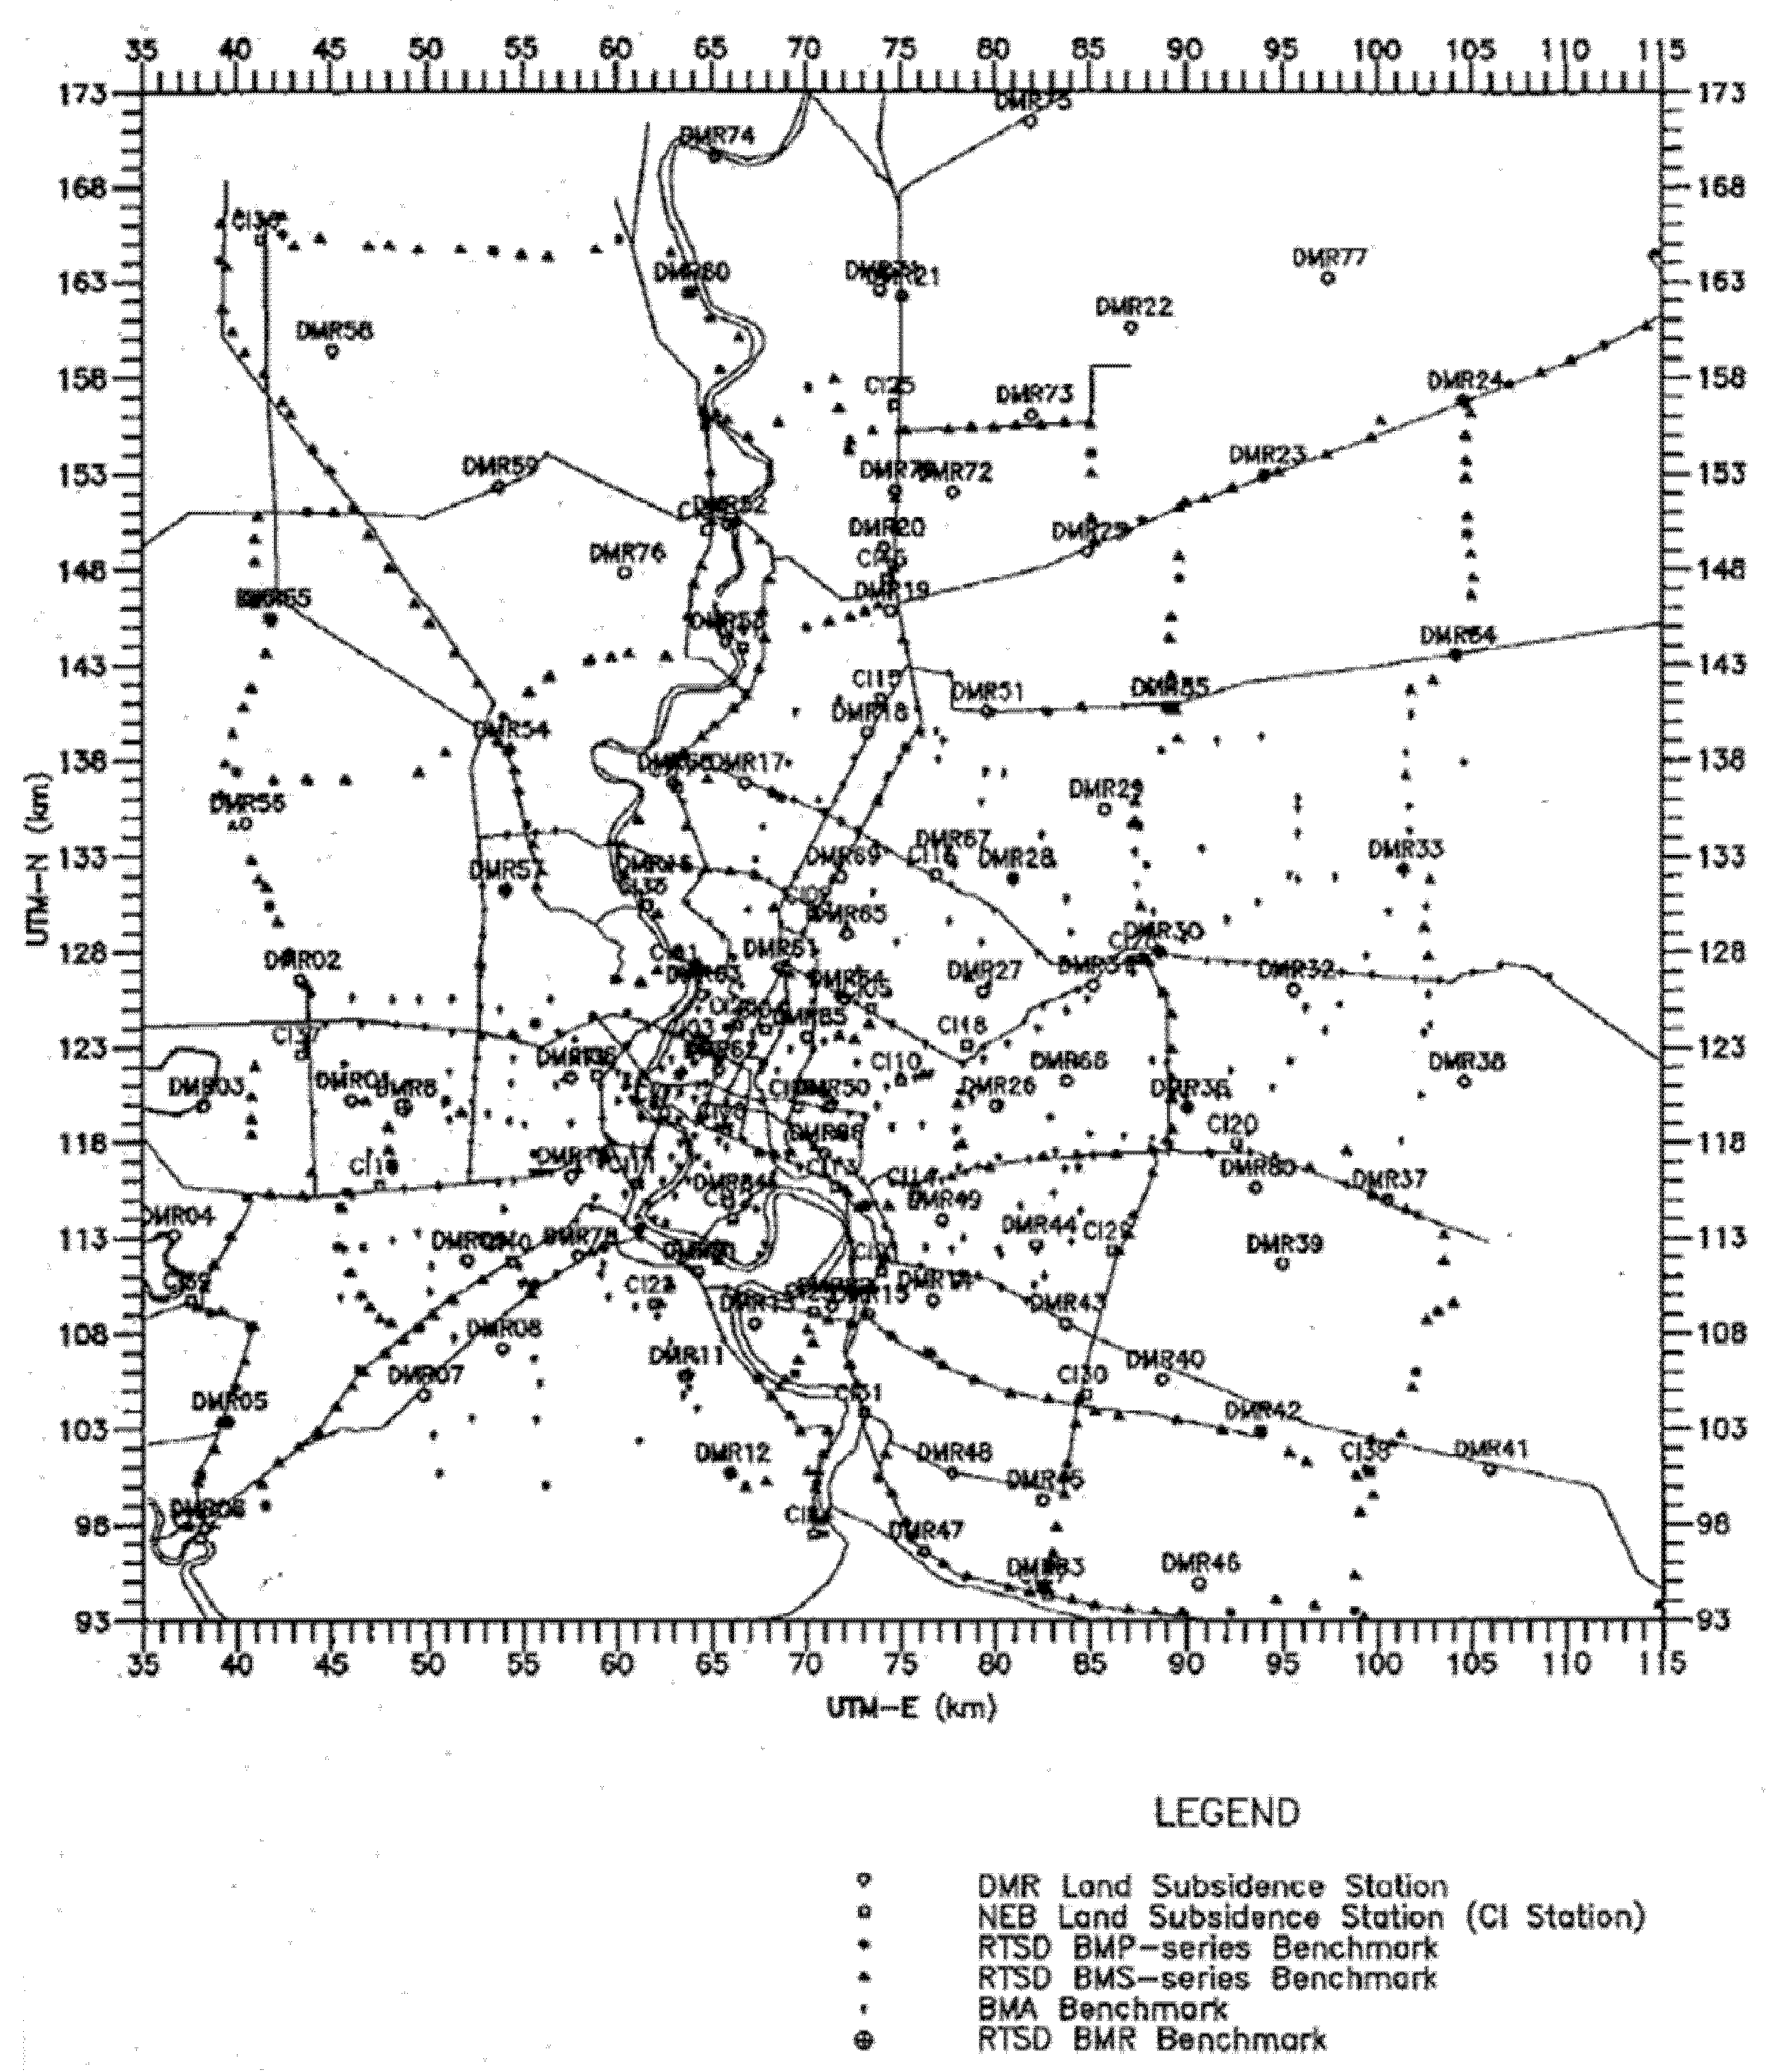
Aside from the RTSD, other agencies, such as the AIT, the DGR, the Bangkok Metropolitan Administration (BMA), and the Japanese International Cooperation Agency (JICA), have also constructed their own levelling benchmarks in the region. Between 1978 and 1982, the AIT, acting under the NEB’s mandate, built 31 land subsidence monitoring stations, which were equipped with two to five benchmarks placed at various depths of the Bangkok clay layer (usually approximately 1 m, 10 m, and 15 m deep), at the depth of the sand layer beneath the Bangkok clay layer (around 20 m deep), and more rarely around 100–200 m below ground level. These stations were commonly referred to as CI stations because the benchmarks are regarded as compression indicators (CI) of the soil layers. The Office of Natural Resources and Environmental Policy and Planning (ONEP) built 28 additional CI stations between 1983 and 1999. The DGR installed a total of 86 levelling benchmarks throughout the entirety of their monitoring stations between 1990 and 1991. The DGR’s monitoring stations contain a 1 m deep benchmark and additional compression indicators placed at the depths of the monitored aquifers, namely Phra Pradaeng (PD), Nakhon Luang (NL), and Nonthaburi (NB) at approximately 100 m, 150 m, and 200 m deep, respectively. By 1992, the Bangkok Metropolitan Administration (BMA) had built 477 benchmarks. JICA assessed the total number of benchmarks, including destroyed and lost ones, at 1243 in 1992 (Figure 3). A year later, JICA constructed three additional monitoring stations. When conducting their levelling surveys, the RTSD usually measures approximately 1100 to 1200 benchmarks [26,27,28].
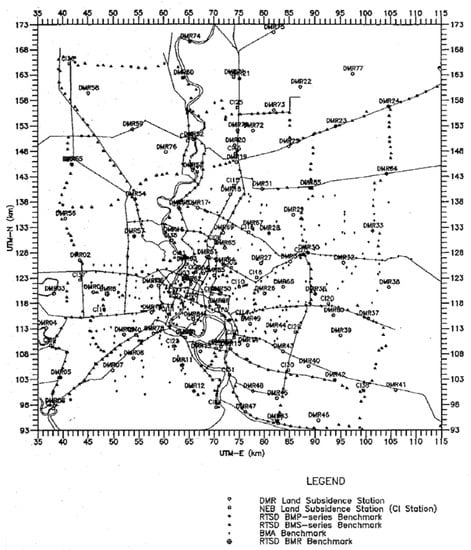
Figure 3.
Location of land subsidence stations and benchmarks in 1992 [29].
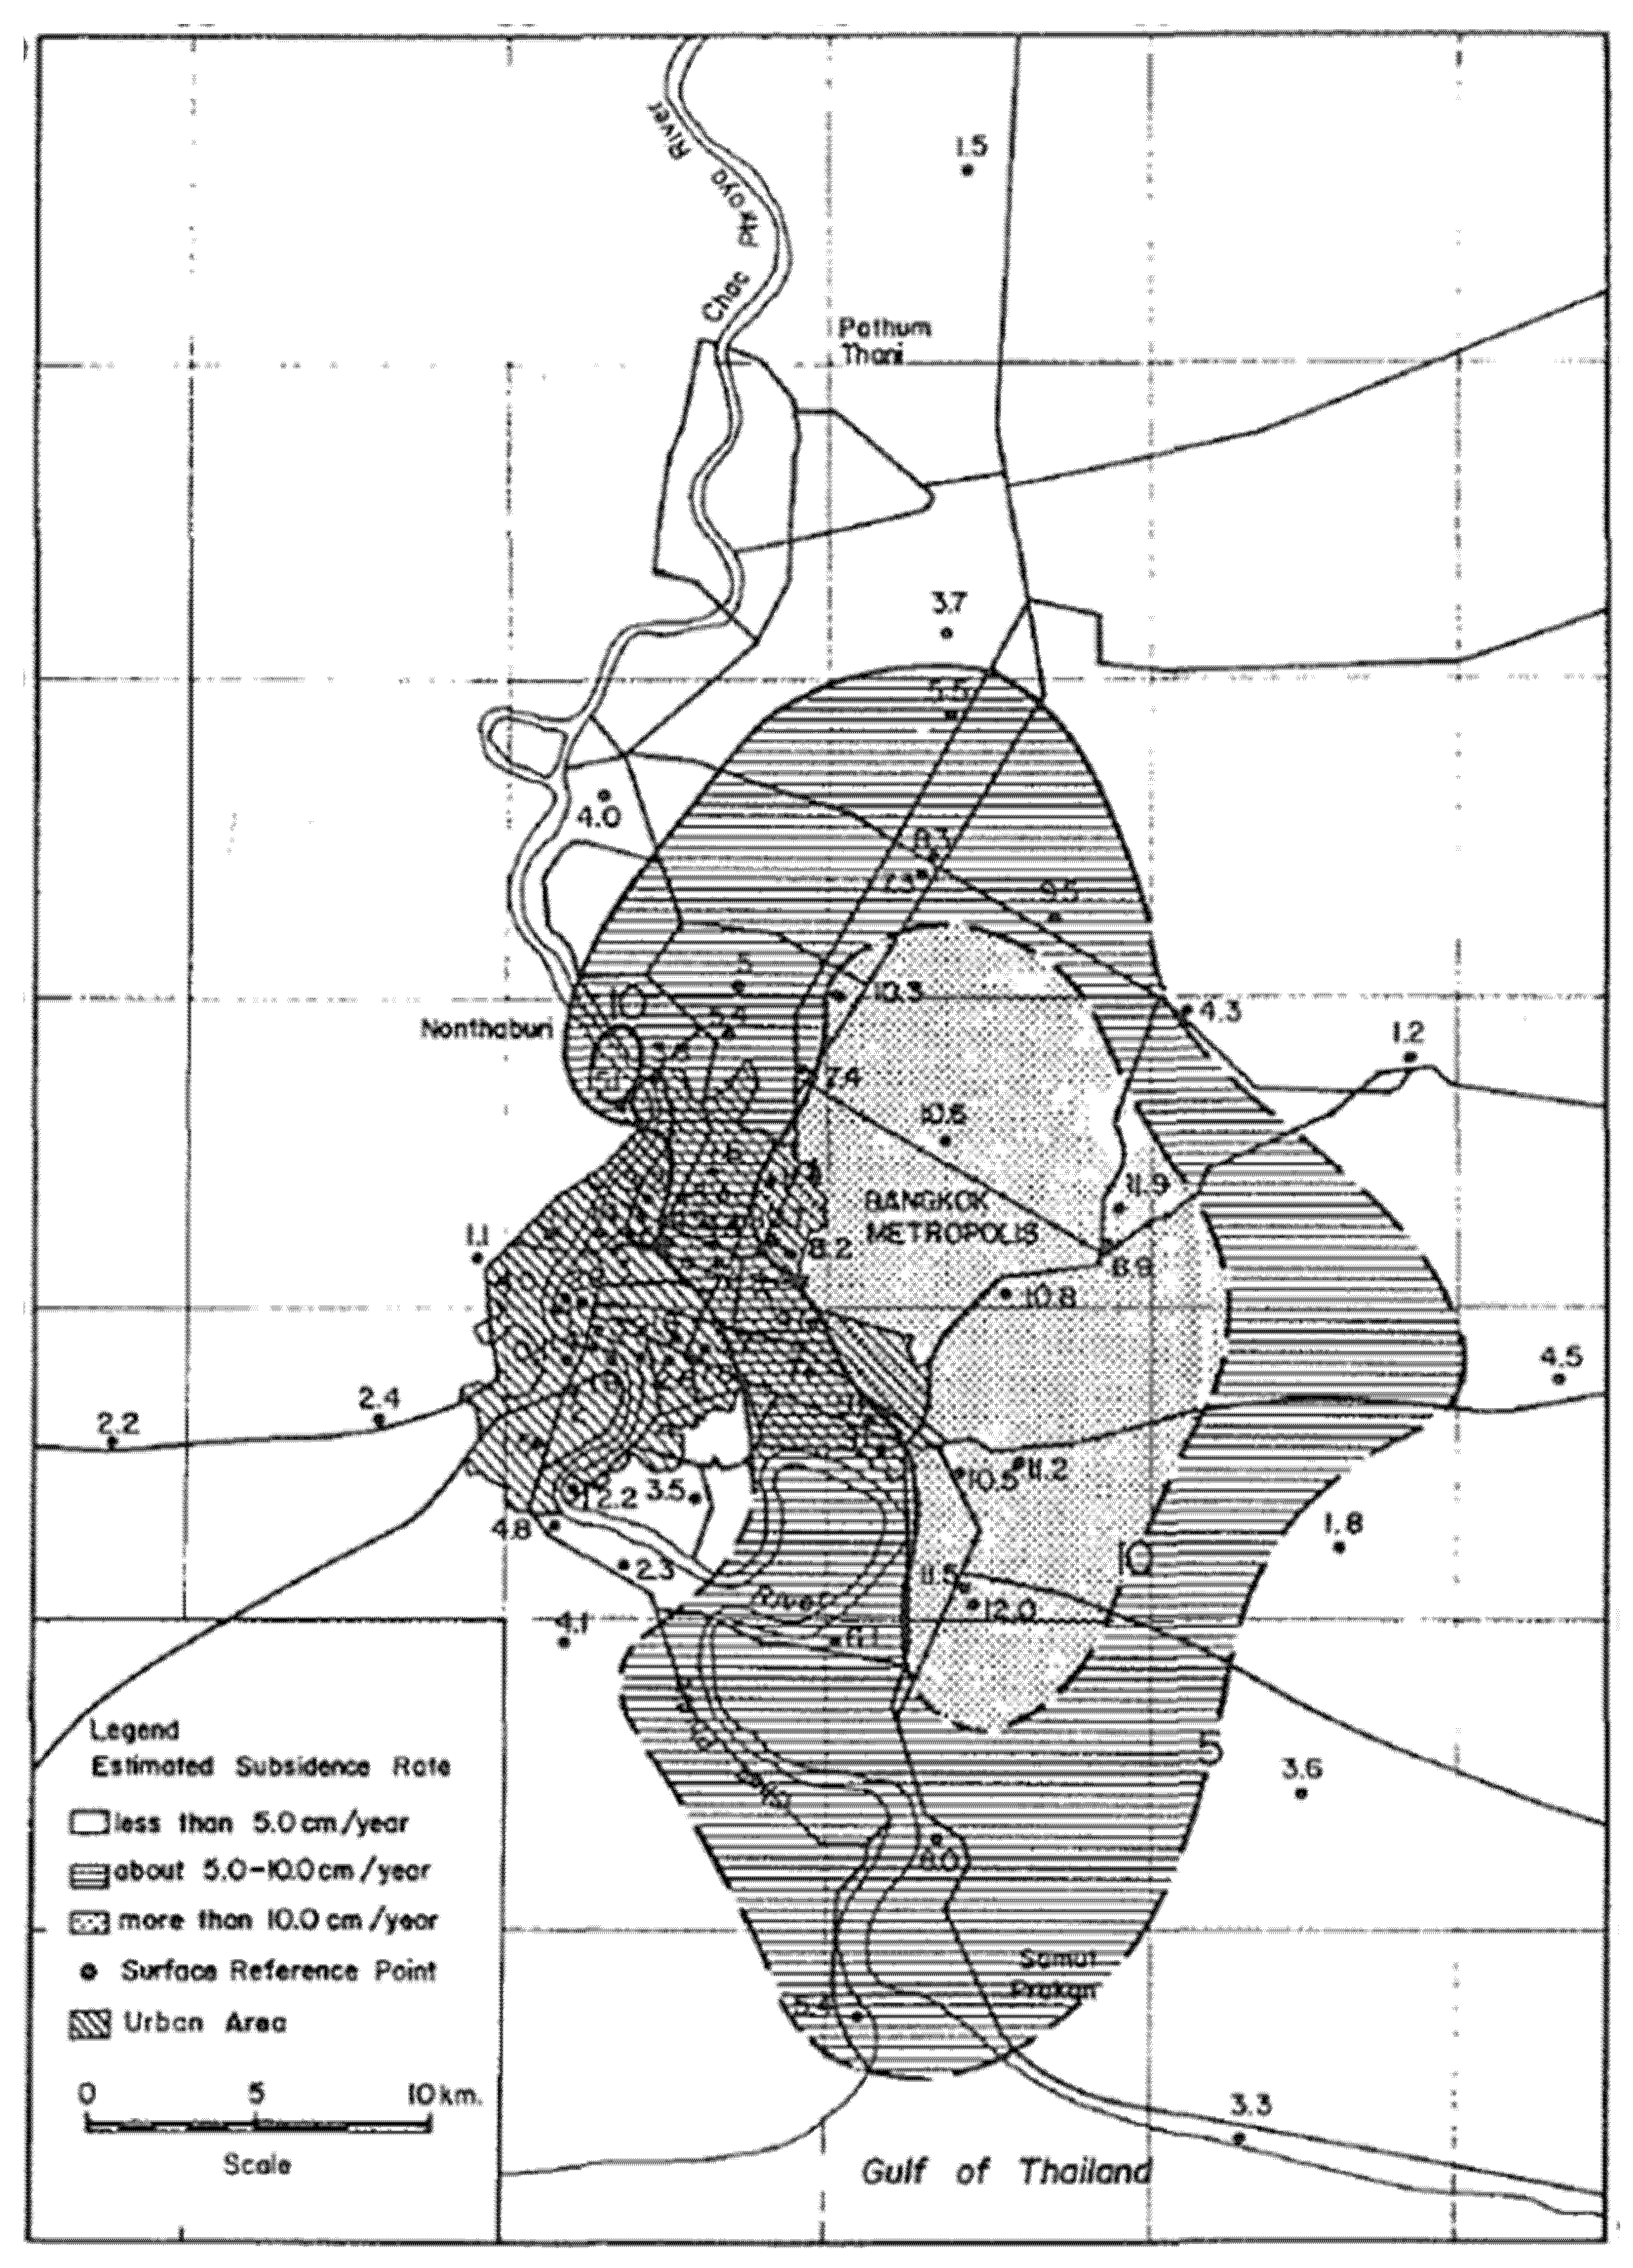
Even though benchmark levelling remains the main way to measure surface subsidence, there are several issues with this method. Firstly, all of the BMA as well as SBM benchmarks are fixed to piles or monuments, bridges, and public buildings whose foundations rest on a sand layer below the superficial layers of soft and stiff clay. Thus, these benchmarks will only reflect the rate of subsidence resulting from the compaction of clay layers below the sand layer upon which they rest. According to the monitoring data available since 1978, it was estimated that 30–50% of the soil compaction occurred in the upper 50 m, namely above the second sand layer [12]. The RTSD’s PBMs are the only ones fixed on ground structures along the main roads, which, unlike the SBM, better reflect the absolute overall subsidence rate. However, these PBM are much less numerous than the SBM, and many of the ground monuments are usually either destroyed or moved not long after their installation due to land development or construction in the area, resulting in a greater loss of PBM than SBM [22] (p. 2971). Additionally, one of the main limitations of the levelling network in Bangkok is that the inner lands between the main roads are monitoring blind spots. The benchmarks on the DGR’s monitoring stations or the AIT’s CI stations, however, provide some insight on subsidence in areas further away from the main roads. Due to the limited number of benchmarks outside the main road network, a former senior DGR researcher acknowledged that much interpolation was needed when drawing land subsidence contour lines in Bangkok, as was performed in the 1978–1982 comprehensive study commissioned by the NEB (Figure 4).
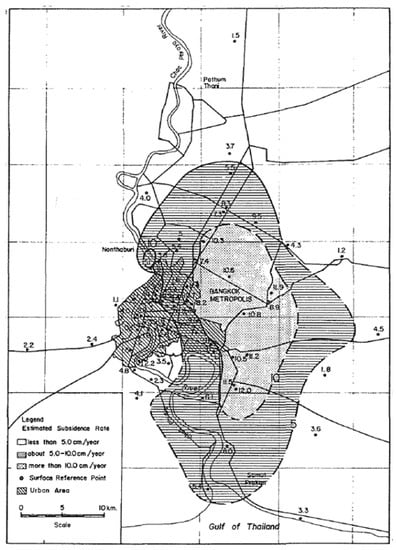
Figure 4.
Subsidence rate in Bangkok as surveyed in 1982 [20].
Most of the levelling benchmarks on the DGR or the AIT’s monitoring stations lie in public or temple areas where the DGR only borrowed a piece of land to install a station. The choice of whether to conserve or remove the benchmarks solely rests on the landowner’s decision. Unfortunately, most of the time, old benchmarks on these stations suffer the same fate as the RTSD’s benchmarks and are either damaged, fully destroyed, or purposefully removed. Such was the case with the CI-10 station in Ramkhamhaeng University, which provided continuous data since the 1980s and served as an important reference in the historical monitoring of land subsidence. It was quite common for DGR senior staff to bring policy makers, such as ministers, on a field visit to this station where it was possible to witness both the apparent damage from subsidence on buildings in the vicinity and the informative data provided by the CI-10 station. The destruction of old benchmarks dating from the 1980s results in the loss of longitudinal data, which are crucial to the understanding of the long-term trend of subsidence. In 2006, the RTSD reported that 16% of the surveyed benchmarks on CI stations were damaged, and additionally, 40% and 31% of them were destroyed on CI stations and DGR monitoring stations, respectively [26]. With the passing of years, the number of surveyed stations has been growing thinner and thinner. The latest RTSD survey report only listed the surveyed stations in good condition, without providing details on the amount and status of damaged stations [27]. This is, in part, due to the decreasing availability of undamaged benchmarks. However, it is also a consequence of the RTSD’s dwindling budget reserved for monitoring purposes (Table 2).

Table 2.
Surveyed levelling benchmarks in the BMR. Original data can be found in the RTSD’s report [26].
The RTSD was autonomous up to the late 2000s, but for the latest survey, they had to sign a memorandum of understanding (MOU) with the DGR so that the latter could fund their levelling survey. The RTSD thus conducted its last two levelling surveys in 2014 and 2016 as part of a survey conducted by the DGR. A senior researcher from the DGR has relayed that the RTSD recommended that two surveys spaced by two years were enough for the project, instead of the usual yearly survey as was conducted in the past, because subsidence was not considered as much of an urgent matter as it was in the past. Furthermore, the RTSD reasoned that the raw data gathered from levelling surveys usually contain errors, which require a considerable amount of time to rectify. They did not have the capacity to do it on a yearly basis anymore. The bias of seasonality was one of the factors that polluted the 2014–2016 dataset. Multiple DGR researchers explained during the interviews that benchmark levelling was performed during the dry season in the past. However, in the latest surveys, the budget came late and delayed the period of surveying, which resulted in measurements that did not occur within similar contexts of soil property, given that the rain in the wet season significantly influences the soil, which is less compacted than when measured in the dry season. Since 2016, no further levelling survey has been conducted.
3.1.2. Satellite-Based Geodetic Tools and Their Limitations
The usage of satellite imagery is another prominent technology for monitoring land subsidence, which has seen increasing use in recent years. The Interferometric Synthetic Aperture Radar (InSAR) is a technique for mapping ground deformation by comparing radar images acquired through a radar satellite that transmits two-way travelling microwave pulses to Earth. Radar images taken from different angles allow one to reveal information about the third dimension (elevation) of an area [30]. InSAR is notably employed to establish a digital elevation model (DEM). Differential SAR Interferometry (DInSAR) analyzes the difference between two or more radar images over time, thus revealing information about surface displacement over time. DInSAR was first used to map elevation changes over large areas in the late 1980s. It became popular in the 1990s following the successful application of DInSAR in the study of surface displacement due to the Landers earthquake in California and ice sheet motion in the Antarctica region. Eventually, applications of DInSAR technology shifted from studies of singular land deformation episodes, such as earthquakes or volcanic eruptions, to studies of temporal evolution of land displacement, thus giving way to the development of second-generation DInSAR techniques, otherwise known as advanced DInSAR [31]. InSAR has been increasingly used for measuring land subsidence in recent decades for its precision (range of mm/year), spatial coverage (100 to 5000 km2), and cost-effectiveness [32,33]. It was first applied in the context of subsidence in Bangkok during a collaboration between German researchers and the DGR [34]. It was determined that InSAR technology was a welcomed supplement to conventional levelling because it offered a more accurate representation of the areal distribution of subsidence beyond the locales where levelling benchmarks were situated. While the DGR has sporadically used the InSAR method in collaboration with university engineers, this technique has not yet been employed for systematic monitoring of subsidence in the BMR and is still mostly carried out within the confines of academic research centers [22,33,35,36,37,38,39,40].
The purpose of DInSAR imagery is most importantly to only estimate changes related to ground motion by removing or reducing as much as possible other components of the signal [41]. Those include components such as the orbital errors corresponding to the different positions of the satellite during the repeated orbits. The topographical component refers to the confusion between land displacement over time and land displacement due to the different angles from which the radar image was taken. The atmospheric component can cause refraction of the signal due to the atmospheric water vapor. Lastly, the noise component in the data (called phase noise) due to spatial, temporal, and thermal factors further complicates the processing of the signal. Temporal decorrelation has been noted as one of the main challenges for DInSAR application and corresponds to changing physical properties of the ground between image acquisitions [39]. Such changes include the changing vegetation cover, as well as areas of active construction. With this in mind, DInSAR is generally perceived to work well in urban areas due to the numerous buildings and their rooftops because these constitute permanent elements in the landscape. These elements are referred to as persistent scatterers in PSInSAR techniques (Persistent Scatterer Interferometric Synthetic Aperture Radar). The relation between scatterers serves as a reference when tracking the deformation over time. As with levelling benchmarks, InSAR can reveal a different state of vertical deformation whether one focuses on ground subsidence or on the subsidence rate of buildings whose foundation piles rest on the sand layer (by mostly employing buildings as persistent scatterers). Most InSAR applications for Bangkok fall in the latter category [33,42,43] and thus only measure the subsidence resulting from the compaction of clay layers below the upper sand layers. In consequence, the subsidence rate of the upper clay layers (in which the majority of subsidence in the BMR occurs) is not rendered visible.
All things considered, InSAR remains a formidable tool for land subsidence monitoring. However, we should keep in mind the interferograms only give us an image of the situation and of the problem’s gravity. An additional step is required when it comes to translating this understanding of the problem into policy measures. In order to establish a sustainable rate of groundwater pumping, it is crucial to understand the pumping behavior of groundwater users not just in terms of areal distribution of pumping (spatial/horizontal dimension), but also in terms of which aquifers are being pumped in which area (vertical dimension).
3.1.3. Hydrogeological Tools
The other main pillar of knowledge production in the context of groundwater overdraft-induced subsidence is the understanding of groundwater usage, which is mainly studied through the monitoring of groundwater levels and pore water pressure in aquifers of interest. This set of data is particularly useful in establishing a conceptual model of groundwater use, which allows envisioning future groundwater depletion and consequential subsidence under various pumping scenarios [41]. This mathematical modeling is based on hydrological data to simulate groundwater flow in the multi-aquifer system, as well as a consolidation model to simulate the compression of soil layers in specific locations [42].
Ideally, a complete groundwater monitoring station, prior to the late 1990s (during which multiple areas started pumping extensively from deeper aquifers), would consist of three monitoring wells that gather data on the second, third, and fourth aquifers (namely Phra Pradaeng, Nakhon Luang, and Nonthaburi). Some of them were equipped to monitor soil layer compression and pore water pressure. The distance between the monitoring stations generally ranges between 5 and 10 km depending on the gradients of the water level [23] (p. 253). In the first phase of the DGR-AIT joint study in 1978–1979, only 1 out of the 52 monitoring stations built by DGR was equipped with three wells and 2 were equipped with six wells [29]. By 1992, the stations were improved, and 71 of them had three observation wells. The DGR surveyed all their stations monthly during the NEB investigation and continued doing so even in 1992, according to JICA [29]. Nowadays, they are only monitored twice a year.
Aside from the DGR’s stations, some of the CI stations were also equipped with a piezometer, as well as JICA’s three stations, which monitored more aquifers than the DGR’s stations and were equipped to record geodetic and hydrogeological data at a one-hour interval. JICA’s stations had five to eight wells ranging from 47 m to 574 m deep. Additional monitoring stations were constructed up to around 2010 (Table 3). Since then, the number of observation wells has barely increased (Figure 5). The most recent additions are six groundwater monitoring stations constructed during a DGR project between 2018 and 2019 [43]. However, these recent stations are prone to initial errors and require further calibration before they can provide data with a quality matching that of older observation wells.

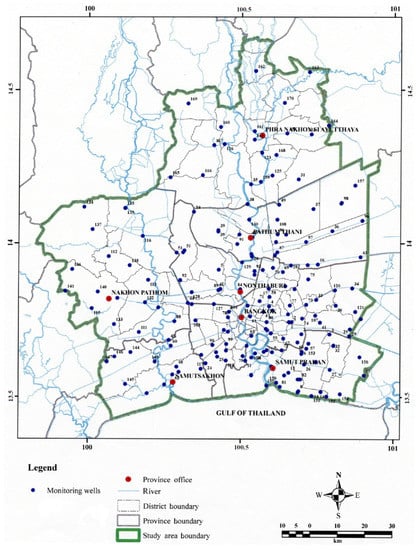
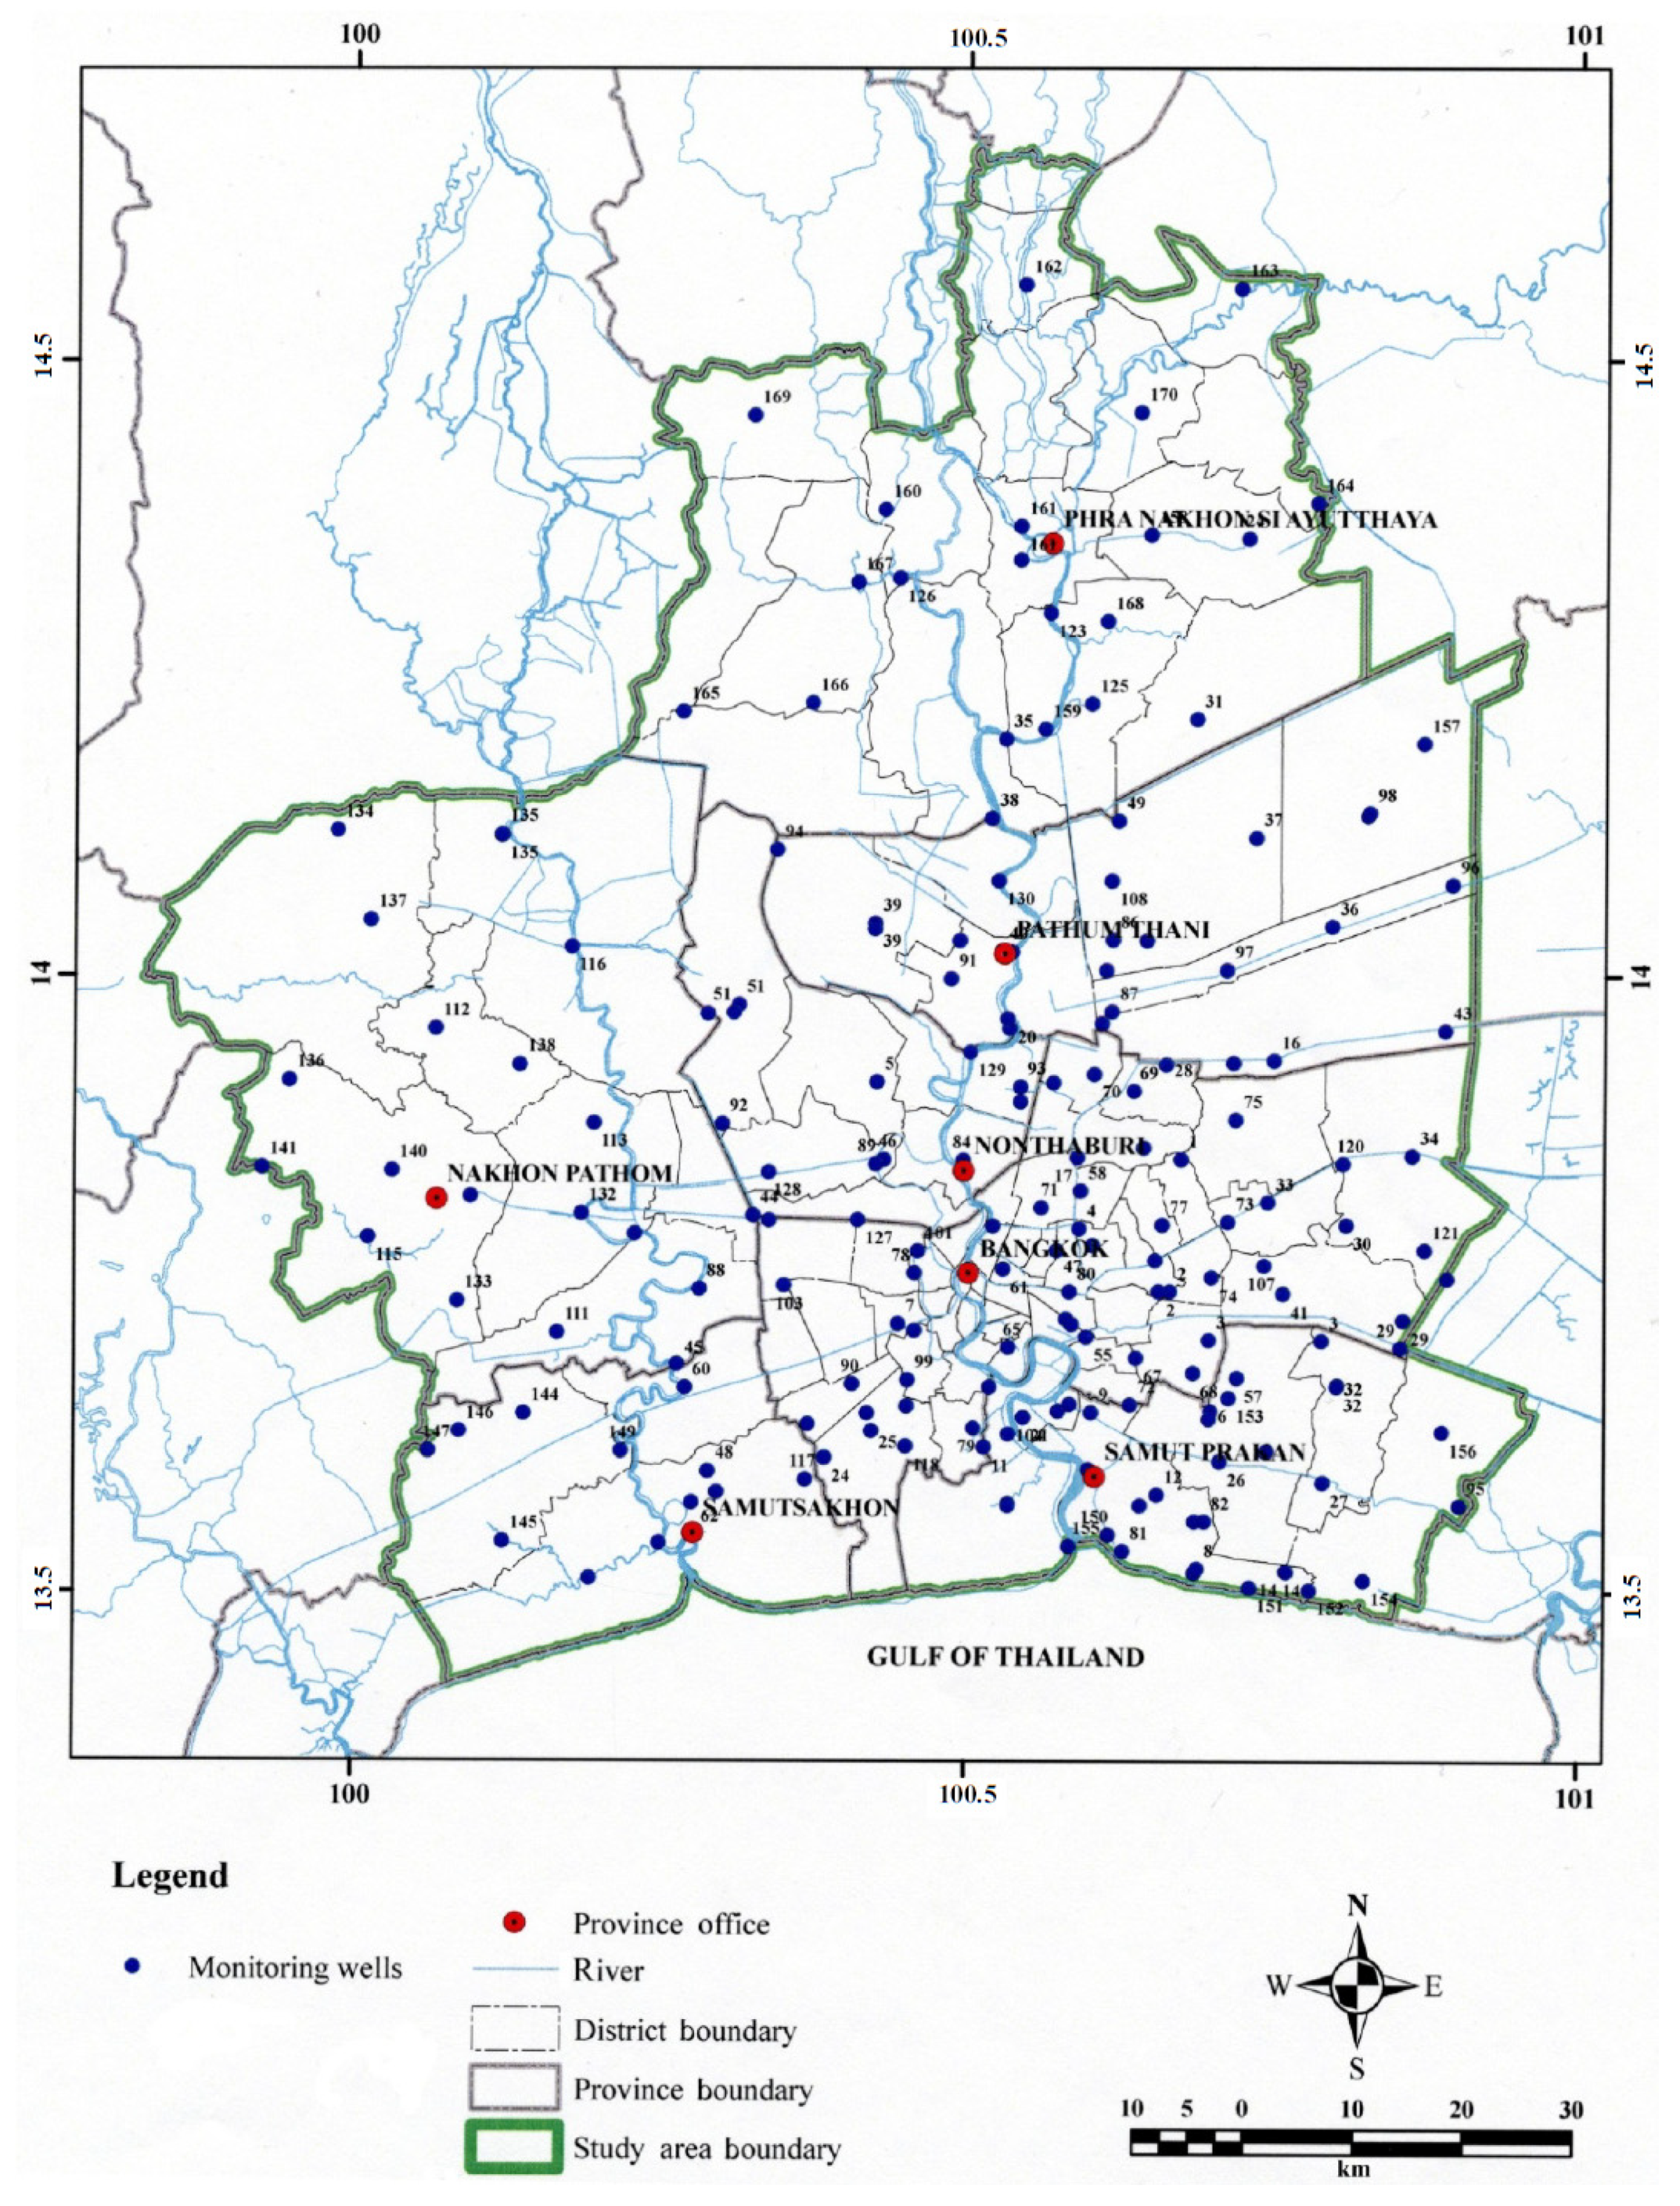

Table 3.
DGR monitoring stations and the number of observation wells in the BMR between 1978 and 2018. Data compiled from various sources [29,44,45].
Table 3.
DGR monitoring stations and the number of observation wells in the BMR between 1978 and 2018. Data compiled from various sources [29,44,45].
| Year | Groundwater Monitoring Stations | Observation Wells |
|---|---|---|
| 1978 | 52 | 60 |
| 1992 | 103 | 258 |
| 2009 | 156 | 474 |
| 2018 | 118 | 330 |

Figure 5.
Groundwater monitoring stations in the BMR in 2009 [46].
Figure 5.
Groundwater monitoring stations in the BMR in 2009 [46].

3.1.4. The Difficult Estimation of Groundwater Usage
As mentioned earlier with regard to the DGR and AIT’s levelling benchmarks, the selection of locales for the installation of monitoring instruments is not chiefly governed by a scientific rationale but rather by the constraint of finding a wide enough space in a public area with a cooperative landowner. This also applies to the construction of groundwater observation wells. Many old observation wells suffered damage due to poor maintenance or have simply been sealed if the landowner was not successfully persuaded by the DGR to maintain the well on their land. Because of the characteristics of the sub-soil in the Chao Phraya delta, the drawdown causes very localized cones of geological depression. Thus, as emphasized by a DGR researcher concerned with monitoring networks, the radius of influence of private wells does not necessarily match the radius of the DGR’s observation wells, hence the remaining uncertainties regarding actual groundwater usage.
In some reports commissioned by the DGR, “effective pumping” is sometimes distinguished from the amount of “groundwater usage based on registered wells”. While the former refers to the volume of pumped water based on the owners of metered well’s self-declaration, the latter is associated with the maximal allowable groundwater usage based on the pumping permits issued for the registered wells. When prompted on how actual groundwater use can be assessed, a senior DGR researcher explained that nobody truly knows what the effective pumping rate really is and that data in the BMR is mostly improperly calibrated and incomplete. Researchers from the AIT pointed to the limited efficacy of groundwater well metering as a control measure since all registered users do not necessarily comply with the regulations [47] (p. 33). According to a source close to factory owners, there are numerous ways for registered users to tamper with their declarations such as using a magnet to alter the accuracy of a meter, diverting the flow through an added pipe to bypass the meter, or simply relying on a hidden unregistered well for most of the pumping and declaring a lesser rate as measured on the metered well. Back in 2006, the DGR was supposed to inspect groundwater use on each registered well at least once every two months but could not do so due to a shortage of inspectors. The lack of regular inspection and reliance on self-declaration for groundwater use estimation still persist today.
Uncertainties also stem from groundwater users without any ill-intent due to the non-standardized nature of self-declared data, we shall refer to these as a declarative bias. Interviewed DGR officers noted an issue with the current well registration form, which only provides the well’s depth but not the depth of extraction. This specification is important since the depth of groundwater extraction can be much lesser than the well’s depth. In addition, many wells are deep enough to tap water from multiple aquifers by installing multiple screens within a single well. Furthermore, the static water level should ideally be measured without disturbance from pumping activities many hours prior to the measurement. However, in practice, this cannot be achieved because most factories, which constitute the greatest portion of groundwater use in BMR nowadays, pump during the whole day without interruption. Data consistency is also weakened by measurements that are not regularly made at the same time of the day. Additionally, water level data can also be influenced by active neighboring wells. A DGR senior researcher admitted this can even happen in the DGR’s own observation well when DGR staff collect data with untrained eyes and fail to detect the influence of another nearby well that is pumping at the time of observation.
In sum, depending on the base data, the estimates of groundwater usage can vary greatly. An example of this is illustrated below via the various estimations made for groundwater usage in 2009 (Table 4). Overall, there is a large gap regarding the estimation of groundwater usage whether it is based on users’ self-declaration (effective pumping) or based on the allowed rate of pumping (registered capacity). Because the DGR staff that analyze this type of data are well aware that there exists a discrepancy between the “effective pumping” in theory and in practice (declarative bias from registered users and uncertainties from unregistered users), they sometimes have to add fictive wells in a model of the Lower Chao Phraya Groundwater Basin to try to factor in the unaccounted usage of groundwater that evades all measuring attempts by the monitoring network in place. Such was the case as exemplified in Metrix associates’ hypothetical estimation that was necessary for their mathematical model as presented in the table below.

Table 4.
Various estimations for groundwater usage in the critical groundwater zones in 2009. Adapted from Lorphensri et al. [23], Metrix associates [44], and KMITL [45].
The problem of illegal wells was noted during the comprehensive research program launched by the NEB in 1978, when researchers had access to data from the MWA for the public pumping rate but were limited to field survey and registration records with regard to private pumping [17]. Despite the legal regulations issued since the Groundwater Act, which provide more control for the DGR with regard to pumping activity, illegal pumping still persists and remains a stubborn source of uncertainty in terms of groundwater usage estimation [47]. Taking action against illegal users has a cost in terms of dedicated time and personnel, especially given that dealing with unknown unregistered users is not part of the DGR’s main mandate. According to sources within the Federation of Thai Industries (FTI) and the DGR, numerous illegal wells still exist in the provinces of Pathum Thani and Samut Sakhon. Up to this date, illegal groundwater pumping has been a practice reported among housing estates, industrial factories, and massage parlors in Bangkok. According to a source within the FTI, the authorities have known about the latter group of groundwater users long before the police raids were conducted against these businesses in January 2018. However, sanctions against owners of massage parlors, known to be powerful and influential figures capable of paying substantial bribes, were previously avoided due to the leverage they had over the authorities in Bangkok. It is very likely that the punitive actions in 2018 were only conducted after the issue of illegal pumping from these users became public knowledge in the media [48], thus leading the concerned authorities to act upon it.
While housing estates were the main users of groundwater in the eastern district of Bang Kapi in the past, some interviewed real estate developers and DGR officers confirmed that there is no incentive nowadays for housing estates to dig a well when they have access to the piped water network. The cost of digging deeper wells, due to the contamination of upper aquifers, combined with the groundwater tariffs, outweighs the cost of public surface water. However, the director of the PWA office in Samut Sakhon confirmed that some new housing estates still choose to save costs by digging a well, with or without a permit, and older housing estates sometimes negotiate for an extension of their groundwater pumping permit. They thus avoid the cost of developing the infrastructure to connect to the PWA’s piped water network.
Unregistered wells also include public wells that were dug during episodes of exceptional water scarcity by local administrative organizations without the issuance of a pumping permit. Some of these wells continued to operate beyond the timespan of the emergency for which they were dug. These wells are in an administrative grey area where they were not dug illegally; however, their continued exploitation remains unregulated. An official within the Bureau of Groundwater Conservation and Restoration explained that the DGR investigators did not want to bother these organizations in the past. The official believes that recent efforts to “pull them into the system” (through proper registration and compliance in paying the due fee for the amount of groundwater pumped) are met with resistance, but he claims the DGR has made progress by slowly raising awareness through the charging of small fees, to at least ensure the public wells are registered.
As for private unregistered wells, the DGR is challenged by its limited authority to inspect registered groundwater users. Thus, in order to enter the premise of a potentially illegal user, DGR inspectors would need a court order from a prosecutor and the support of police officers. In the case of unregistered industrial groundwater users, another possible means of action consists in the launching of an audit by the DIW. Since it has authority over industries, it can look at the production process within a factory and detect a mismatch between the quantity of water used and the quantity of product manufactured. However, the prevention of groundwater-induced subsidence is not part of the DIW’s mandate, and serious concerted actions between the DGR and DIW remain to be seen. Alternatively, an investigation can be opened following a whistle-blower’s report. Even so, this means of action also has its limits due to the fact that the rewards for whistle-blowing are only destined to civil servants but not to ordinary civilians and factory workers. According to a source within the FTI, there is a lack of incentive for a civil servant to file such reports because the reward is significantly lower than the usual bribe. Even when someone is charged with using groundwater illegally, the informant considers current sanctions to be too minimal to discourage illegal pumping. The maximum sanction is a 20,000 Thb fine and a 6-month prison sentence according to penalty regulations within the current Groundwater Act.
3.2. The Translation from Monitoring Data to Risk Management Indicators
The phenomenon of subsidence can be downplayed or exaggerated depending on the way data are interpreted. The quantification of any phenomenon has a psychological effect on our understanding of the environment we live in [49]. Numbers matter in a narrative, and while they are usually presented as authoritative standalone entities, they are actually generated through “processes of institutional and scientific legitimization” to define a problem and its future trends [50]. The complex hydrogeology of the delta is thus rendered sizeable and governable through this process of quantification. Yet, it has been argued in the Policy Studies body of literature that the implementation process of policies “should be regarded as an integral and continuing part of the political policy process rather than an administrative follow-on […]. The political processes by which policy is mediated, negotiated and modified during its formulation continue in the behaviour of those involved in its implementation acting to protect or pursue their own values and interests” [51].
In Thailand, these numbers that are produced to assess the situation are translated into a trio of risk management threshold indicators for the control of groundwater pumping in the BMR, namely the safe yield, the piezometric levels of aquifers (also commonly referred to as groundwater level), and the subsidence rate. The safe yield, also sometimes referred to as permissible or sustainable yield, corresponds to “the amount of groundwater which can be withdrawn from [a groundwater basin] annually without producing undesired results” [52]. This entails a calculated decision of the accepted risk (subsidence, aquifer salinization, increasing depth of fresh groundwater) and the benefits to be reaped (the higher quality and lower cost of groundwater compared to surface water make it a prized commodity). The tolerable subsidence rate is a complementary indicator to the safe yield. The crux of the matter lies in understanding the determination of such thresholds as an exercise of compromise when various stakes, interests, and uncertainty are involved when defining sustainable groundwater use. In the following section, we comment on uncertainties as fuel for policy negotiations and how they are worked around in the day-to-day management of groundwater. Yet, in some instances, they are simply swept under the carpet to put forward a narrative of stabilized subsidence in Bangkok. Ultimately, the policy process of groundwater management is hindered by systemic institutional traps.
3.2.1. Working with and around Uncertainties in Policy Negotiation and Implementation
Premchitt first estimated a threshold value for the safe yield through a mathematical model at 0.8 Mm3/day (million cubic meters per day) at which “the rate of subsidence will virtually cease” [53]. The NEB report later recommended a safe yield of 0.6 Mm3/day as a guideline for the “recovery of water levels” and for the subsidence in Bangkok to stabilize and attain an “insignificant rate” [17]. After the critical groundwater zones were defined and expanded to cover the seven concerned provinces, the safe yield was re-assessed at 1.25 Mm3/day in 2000 [54] and used by the DGR up to the present day to manage groundwater pumping. Kasetsart University produced a report in 2004 in which it suggested the DGR change the safe yield to 0.71 Mm3/day for the next twenty years in order to maintain “the sustainable piezometric levels (not deeper than 20 m below the ground surface for Bangkok aquifer and 30 m for the other aquifers)” [12]. The sustainable piezometric levels are set at such depths in order to maintain enough pressure in the confined aquifer to support the Bangkok Clay layer (17–30 m thick) and prevent it from compacting more dramatically. Chulalongkorn University combined the 2004 groundwater flow model with data from 2008 to update the value of the trio of indicators, thus recommending a safe yield of 0.8 Mm3/day to maintain sustainable piezometric levels within 20–30 m below ground level and the subsidence rate within 1 cm/year [55]. In these reports, the three indicators have been proposed as an interrelated set of thresholds. Yet, our interviews and policy reports analysis reveal that they are managed disjointedly.
While the sustainable piezometric levels make sense in theory, it is not a realistic measure in practice anymore according to a researcher from the DGR arguing that the piezometric levels already reach 60 m in many places, and the levels in some area even reach 80 m below the ground. In Samut Sakhon, notably, the DGR has noticed a clear gap between the observed groundwater drawdown level (80 m) and the modeled one (60 m). Furthermore, the threshold is set to be 30 m for all aquifers, except the Bangkok aquifer, everywhere in the critical groundwater zones without consideration for the horizontal (varying pumping behavior and various subsoil conditions) and vertical (multi-aquifer complex) specificities of each area. The researcher declared that respecting this threshold is impossible nowadays, but since many people ignore this fact, officials from the DGR still bring up the 30 m threshold as a target to help motivate groundwater users to pump less water.
With industries being the current principal groundwater users within the critical groundwater zones, a member of the FTI opined that it feels unfair to them that the 30 m drawdown threshold is employed by the DGR as an argument to limit the allowed pumping rate, and by extension, hindering the growth of certain industrial sites. Some of the FTI’s factory owners argue the DGR should instead focus on dealing with unregistered users rather than further constraining law-abiding users. They believe the safe yield should be higher than 1.25 Mm3/day because the model used for its calculation does not accurately factor in the unregistered pumping. With all the uncertainties associated with the estimation of groundwater usage as pointed out earlier, it goes without saying that it is an uphill battle to define a sustainable yield all parties could agree with. While it is recognized within the DGR that the sustainable yield as set in the 2000s is outdated because the assumptions regarding groundwater usage and the environment have greatly changed, as witnessed through the declining piezometric levels outside Bangkok, it is still employed for present groundwater management. A commendable effort was made by the consultant firm, Metrix associates, contracted by the DGR, to update the safe yield [44]. It was notably suggested that the safe yield should be partitioned by districts within the province and by aquifers within each area. The safe yield for the whole Critical Groundwater Zone, calculated through the model, was estimated to be 687,675 m3/day, roughly half of the current yield in use. Since its publication, the report never gained enough traction from DGR executives (see Section 3.2.3) and even less from groundwater users within the FTI, who feared their area would lose a significant percentage of groundwater allocation. The recalculated sustainable yield was thus shelved as the issue of land subsidence became less of a priority for the department.
3.2.2. The Narrative of Stabilized Subsidence
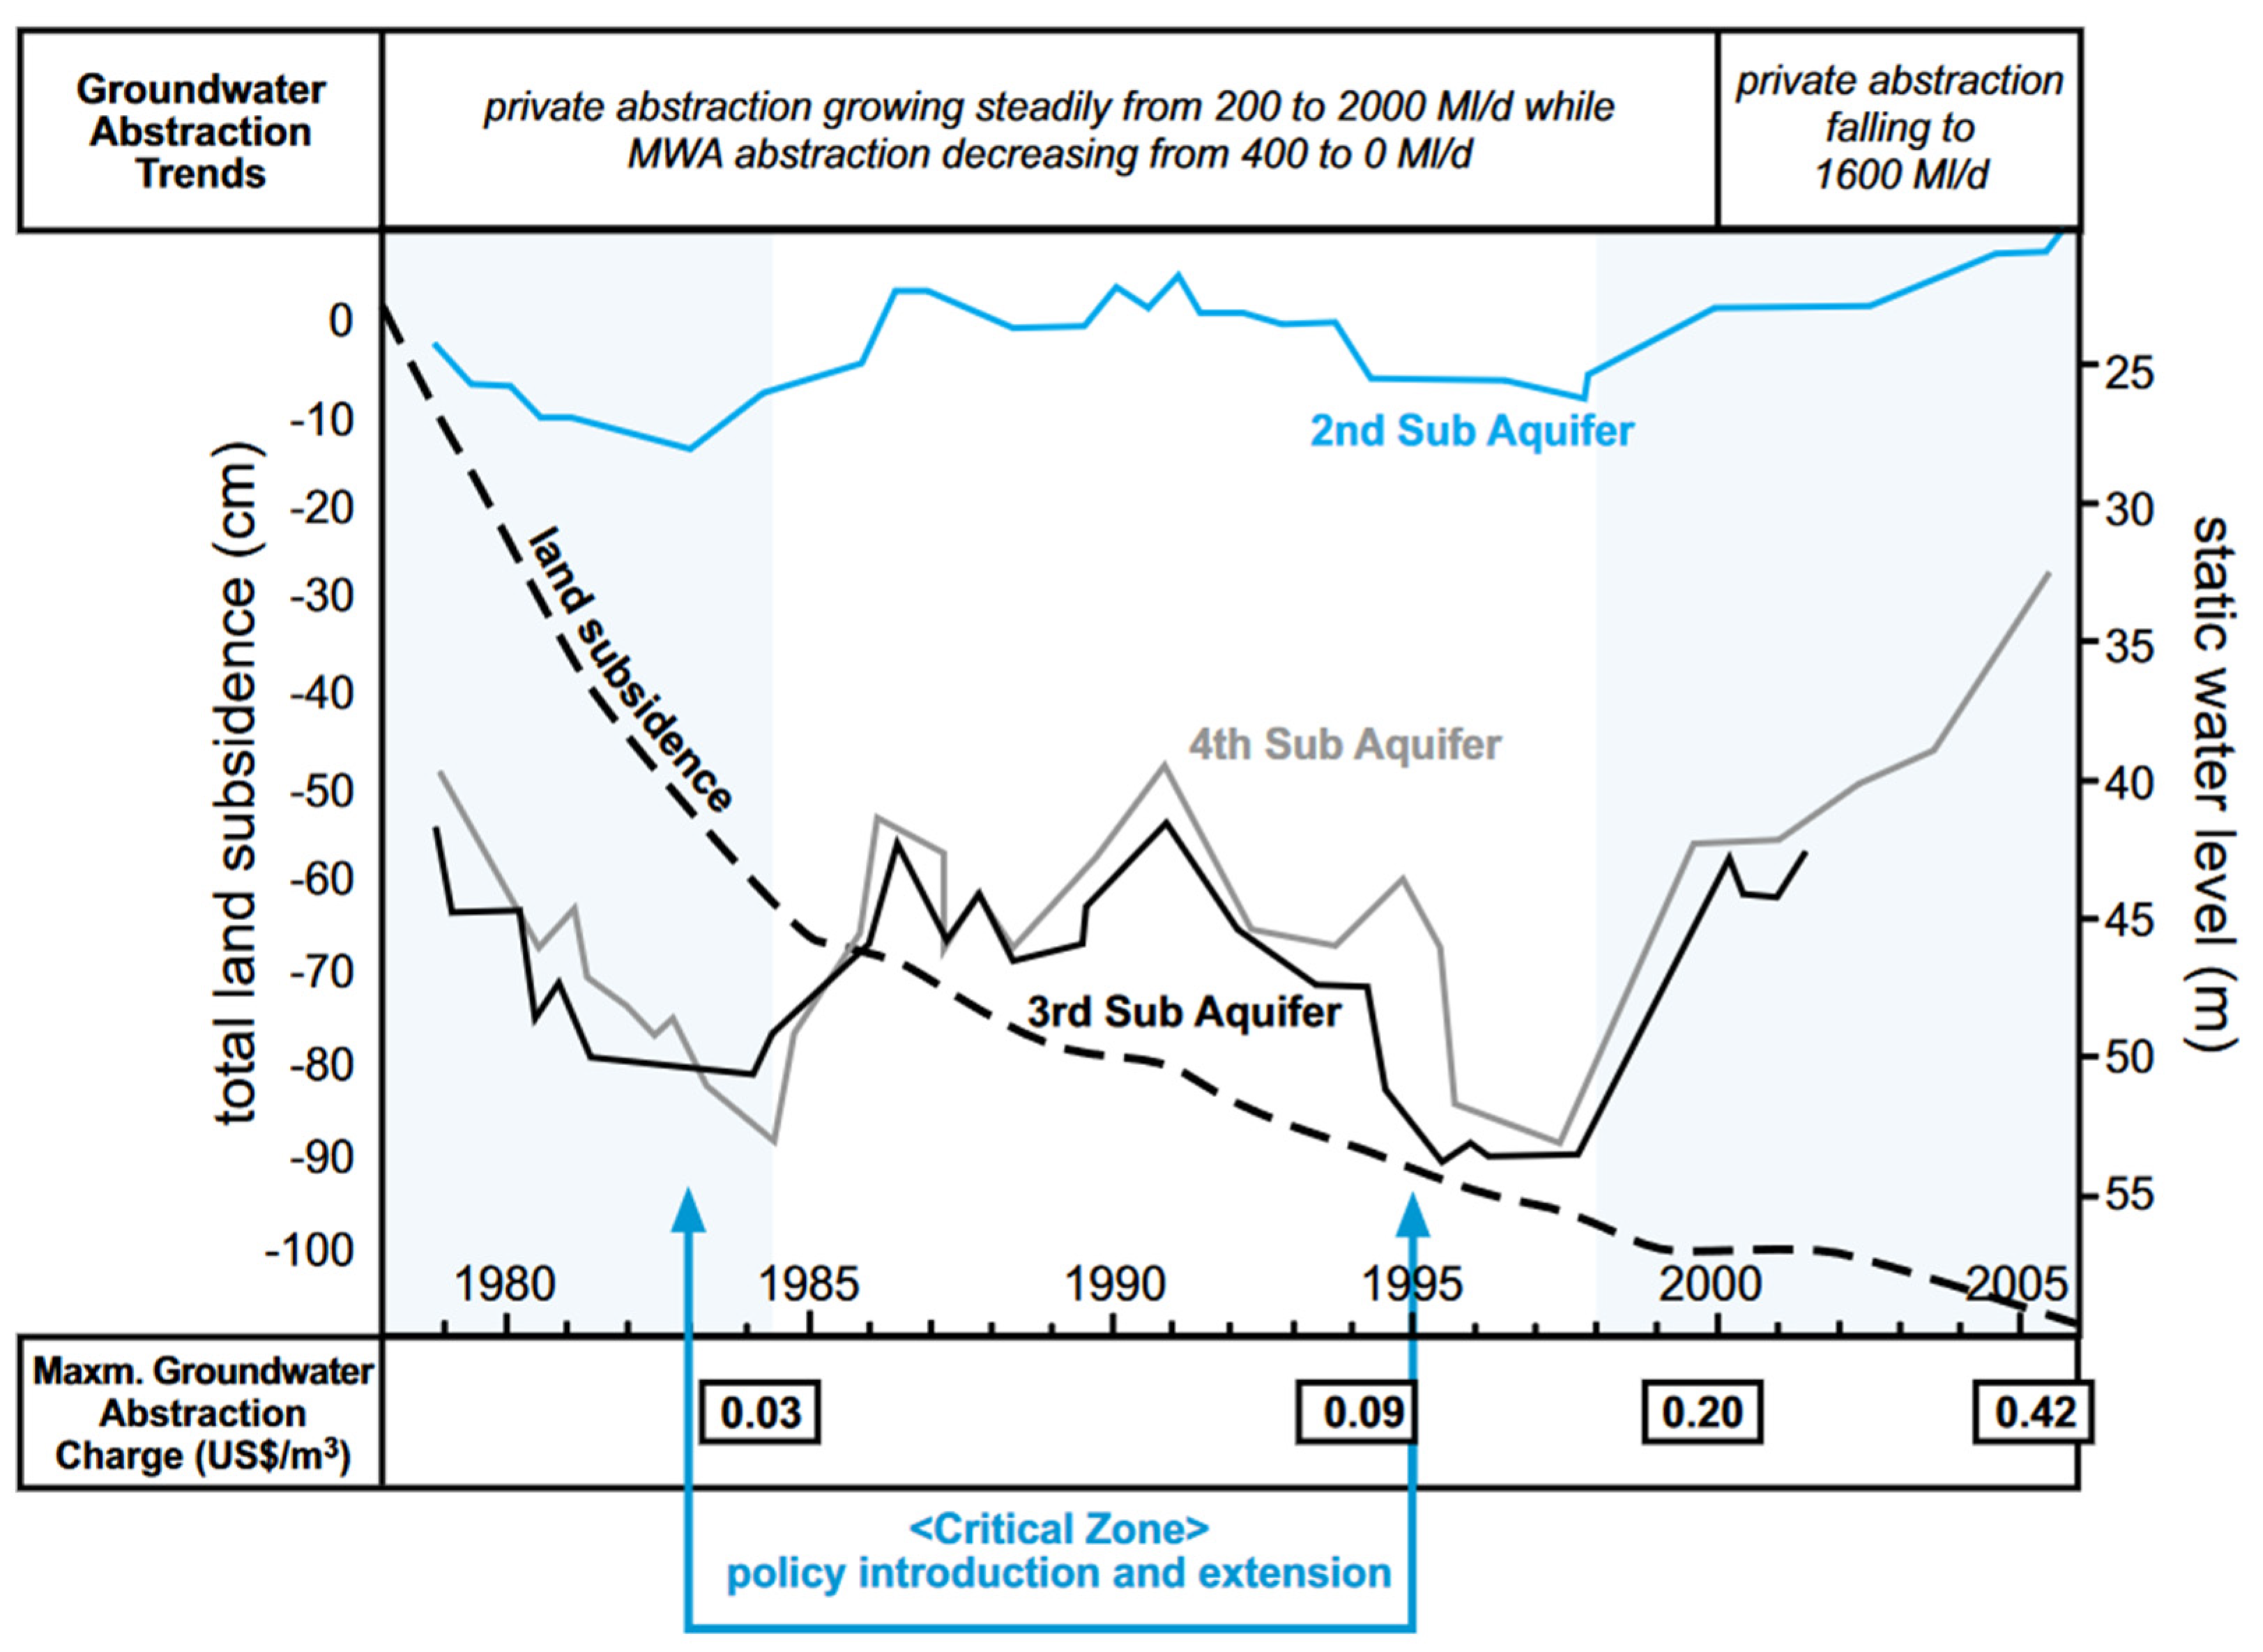
Most of the reports and articles presenting a narrative of subsidence stabilization usually make mention of remedial measures without providing details on how the measures were implemented in practice. Instead, the recovery trend is usually demonstrated through the presentation of a single graph that shows a slowing rate of subsidence and/or recovery of groundwater levels in the Phra Pradaeng, Nakhon Luang, and Nonthaburi aquifers. Such a process corresponds to what Hajer refers to as discursive closure, during which “complex research work is often reduced to a visual representation or a catchy one-liner”, adding that “this translation is accompanied by a loss of meaning: […] all uncertainty and all conditionality of the original knowledge claims is erased to come to discursive closure” [56] (p. 62). The most notorious illustration of this concept for Bangkok would be the CI-10 monitoring station at Ramkhamhaeng University, which was very often employed to demonstrate the recovery of Bangkok from the subsidence crisis (Figure 6). The performative potential of this station in demonstrating the capital city’s recovery is especially strong given that this station, among others in the eastern BMA suburbs, provided the highest recorded subsidence rate of 10 cm/year, becoming the infamous “worst area of subsidence” [57].
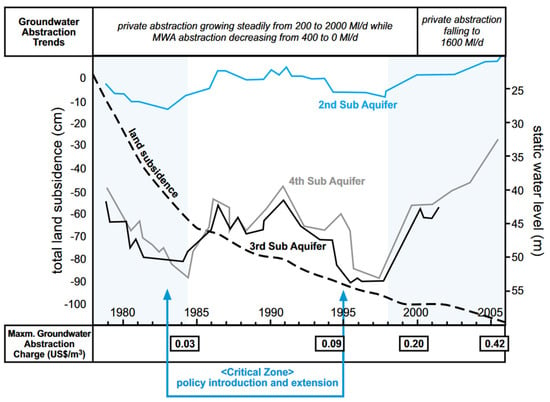
Figure 6.
Policy milestones (groundwater pricing and critical groundwater zones) in relation to the groundwater abstraction trend measured in the BMR and total accumulated subsidence rate and groundwater levels (2nd–4th aquifers) measured on the monitoring station CI-10 [16].
Since the early 2000s, the subsidence in Bangkok has generally been presented as stabilized and non-threatening, notably through the argument that the subsidence rate was now contained within the threshold of 1 cm/year. Examples of this narrative can be found in the DGR’s statement to the press media concerning the subsidence rate in Bangkok in the period between 1999 and 2002 [57] and in a research report concerning the rates BMR for the period between 1998 and 2007 [58]. Yet, another report published by the DGR in 2018 [59] provides a nuanced account for the 1998–2005 period, citing subsidence rates in Bangkok, Nakhon Pathom, Nonthaburi, Pathum Thani, Samut Prakan, and Samut Sakhon that range from 0.4 cm/year to 2.3 cm/year between 1998 and 2002 and 1.3 cm/year to 2.4 cm/year between 2003 and 2005. While the subsidence rates observed in Bangkok were indeed among the lowest compared to all the rates measured in the BMR, the issue of growing subsidence rates in Bangkok’s neighboring provinces was often downplayed in favor of showcasing subsidence rates lower than 1cm/year. Episodes of recovery from subsidence, also designated as a rebound rate, were continuously observed in Pathum Thani and sporadically observed in western Bangkok and Nonthaburi. Although less often studied than cases of subsidence, cases of uplift have been documented in the literature [60,61,62] describing the surface rebound as a consequence of the relaxation of elastically compressed aquifer materials when pore pressure has recovered following the cessation of groundwater pumping [63]. While the rebound rates observed in Bangkok [64] played a role in supporting the narrative of stabilized subsidence [65], it is noteworthy to bear in mind that these rates are not representative of the situation in the whole BMR.
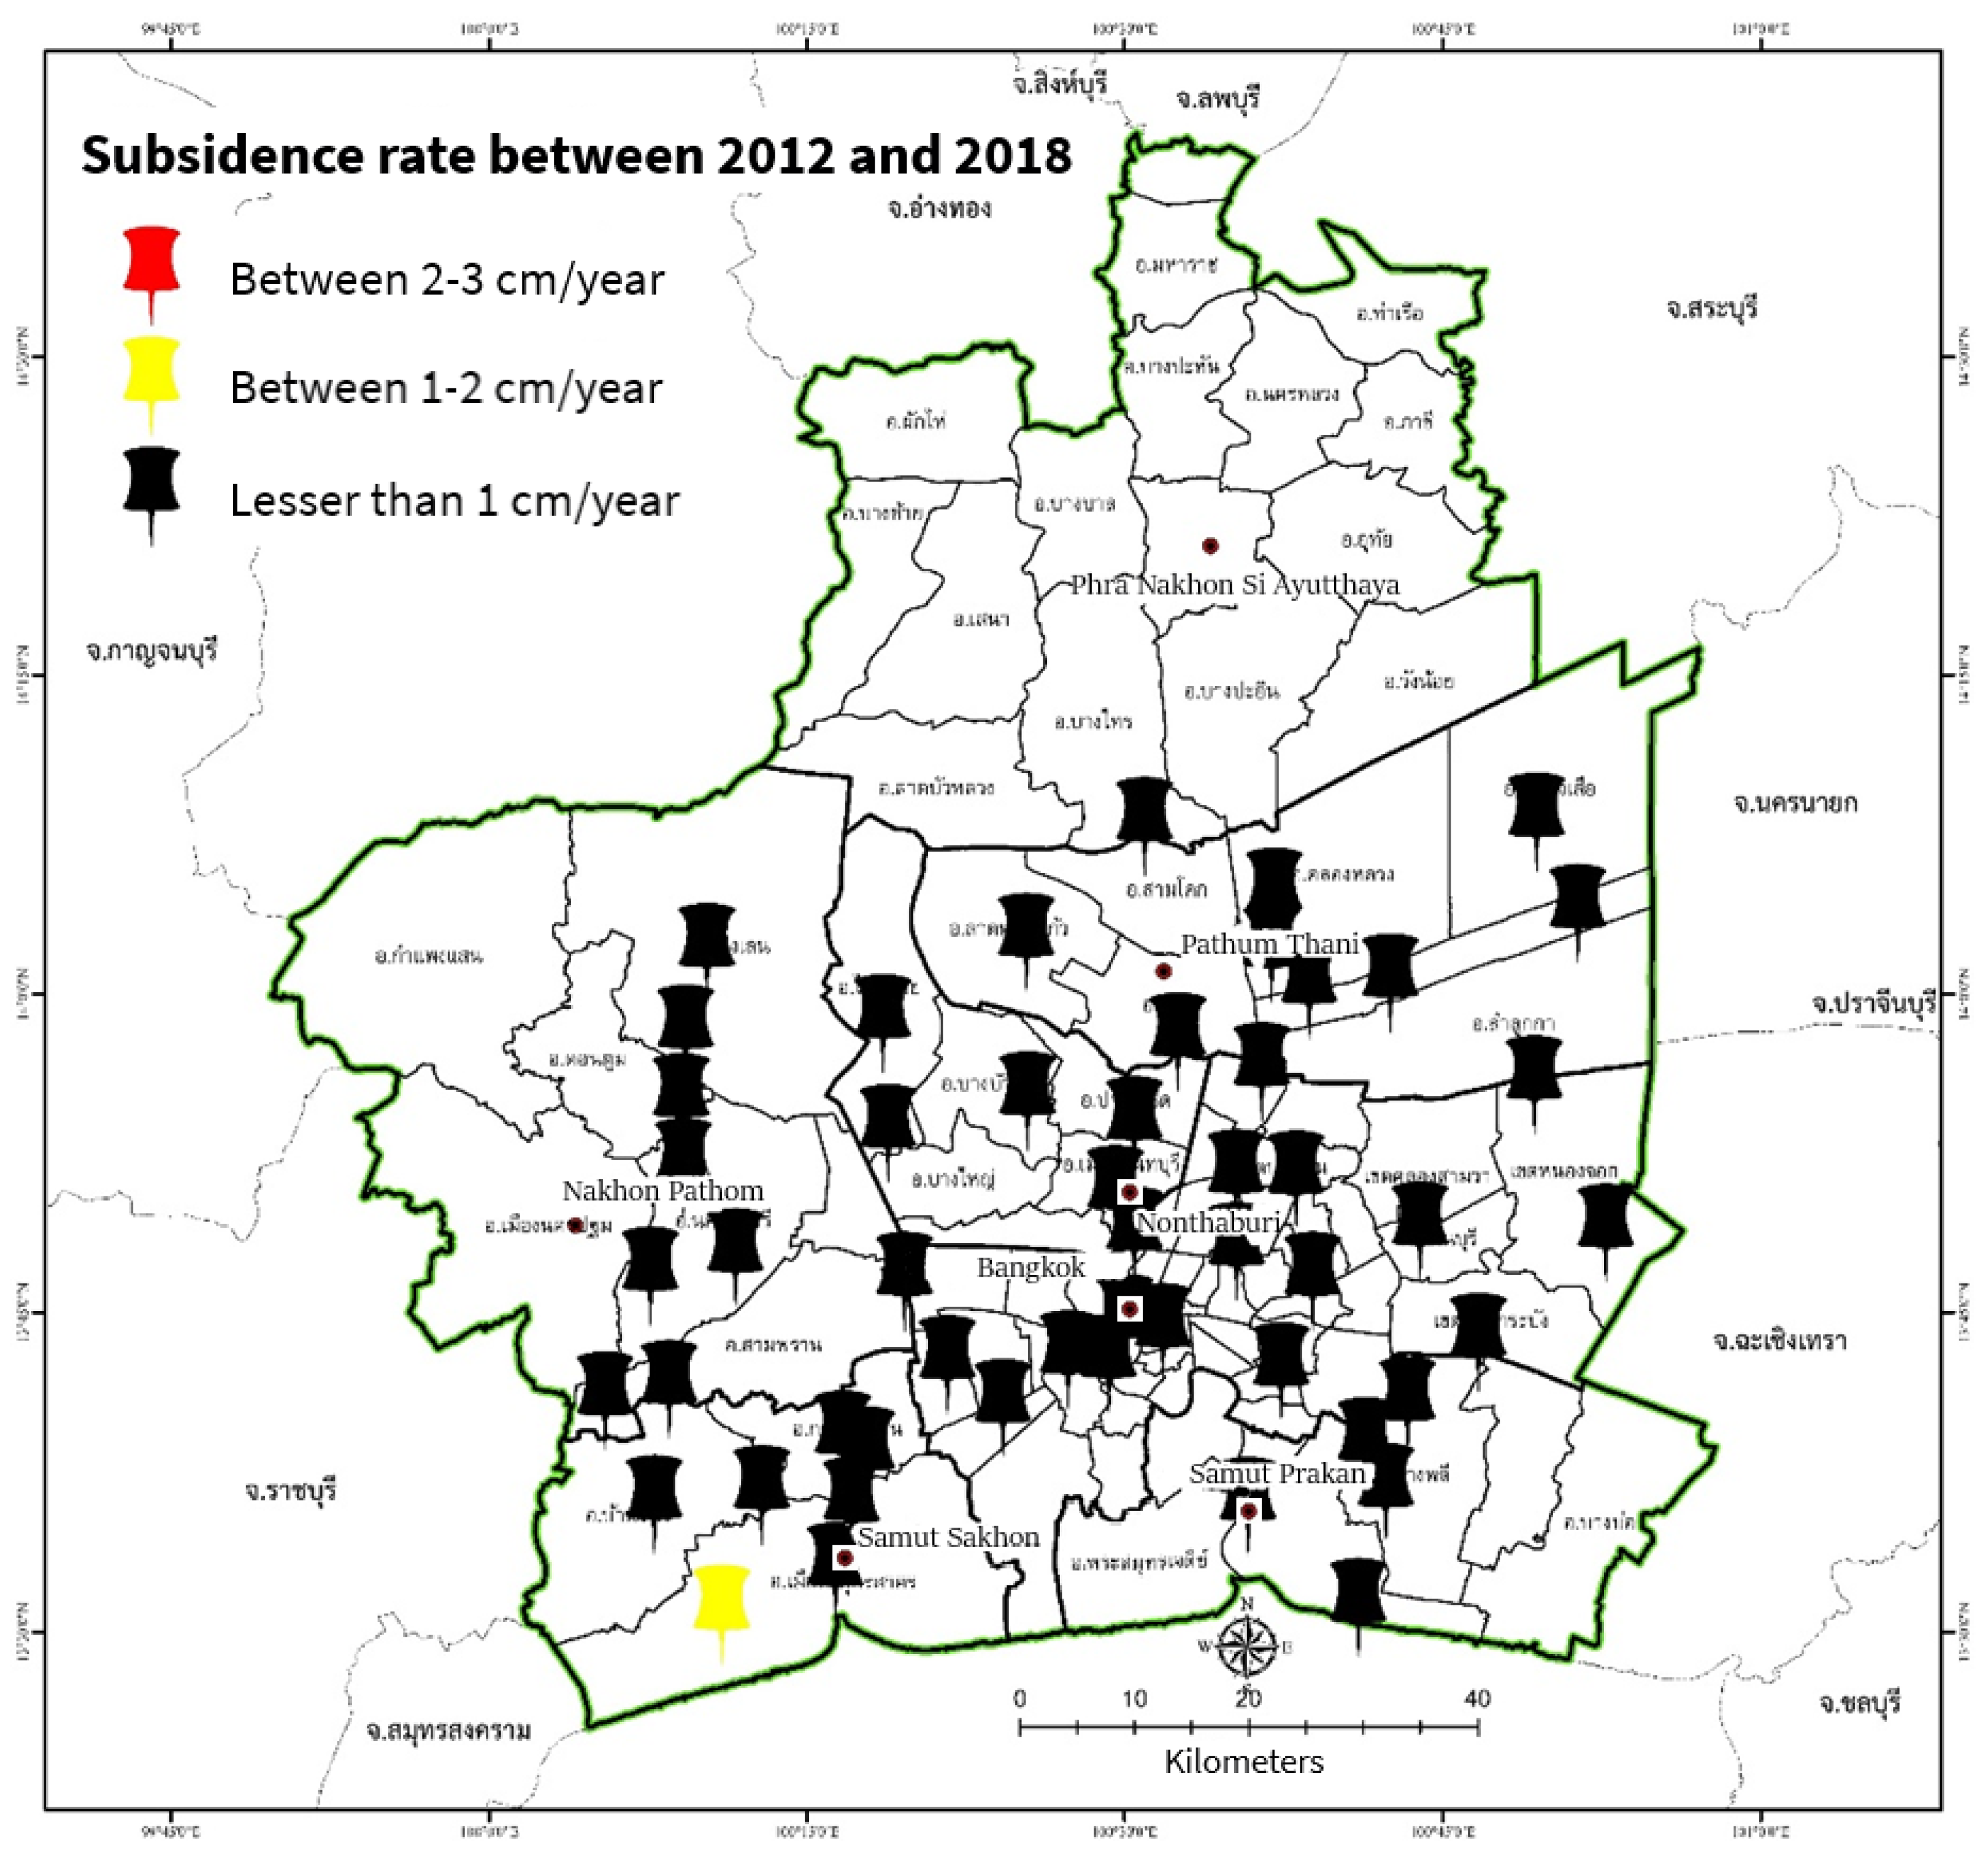
The DGR’s report in 2019 [43] supports the narrative of a stabilized subsidence through a process of discursive closure enacted in a map showing observed subsidence rates throughout BMR to be less than 1 cm/year between 2012 and 2018 (Figure 7). This map has been reproduced multiple times in communication material on the topic to capture this narrative. However, what is lost in the translation of this complex reality is the fact that this map only shows 40 m deep benchmarks, which do not reflect the compaction occurring in the Bangkok clay layer. Additionally, the levelling surveys conducted in 2012 and 2014 that produced data for this map were not conducted during the dry season due to a delay in budget approval, thus exposing the results of the surveys to a seasonality bias as was highlighted earlier. This narrative can be challenged by the more important and fluctuating subsidence rates observed on RTSD’s PBM between 2014 and 2016 [27], as well as InSAR images between 1996 and 2019 [33,38,39,40,66].
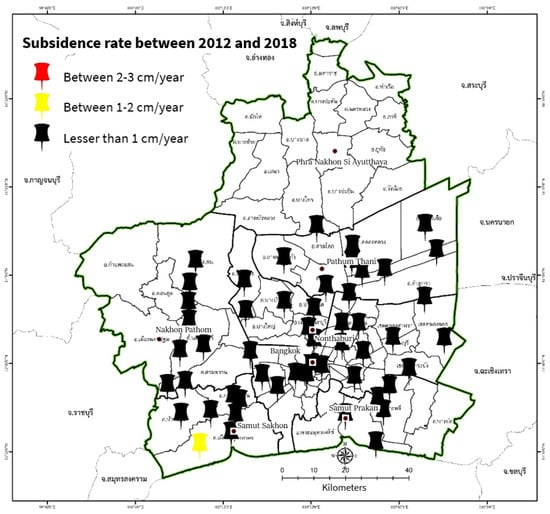
Figure 7.
Map of subsidence rate measured on 40 one-meter-deep benchmarks in the groundwater crisis zone (highlighted in green) between 2012 and 2018. Adapted from a DGR report [67].
Reducing the perception of the threat of subsidence to the 1 cm/year indicator is doubly problematic. Firstly, there is the issue of spatially limiting the scope of the problem to Bangkok. Groundwater pumping did significantly decrease in Bangkok in the late 1990s; however, industrial pumping has increased in some neighboring provinces, notably in Nakhon Pathom and Samut Sakhon where the extraction rate come close to the safe yield. While the issue has been pointed out in the literature [12,24,42,68,69], policy measures have not accompanied these observations. The policy focus on containing the subsidence rate in Bangkok within 1 cm/year has led to reduced attention and devoted budget to the monitoring of new areas of subsidence that shifted from Bangkok to its BMR periphery. Secondly, the translation of all these spatial disparities (rebound and subsidence rates) into a single average rate results in a simplified understanding of the issue, which fails to capture the heterogeneity of localized subsidence rates. In the mid-term, whether an area is subsiding by 0.5, 1.5, or 3 cm/year does not translate into the same vulnerability to flooding. Differing interpretations of subsidence notably fuel the blame game between those who hold groundwater-induced subsidence accountable for the recurrent floods in the city and those who view that subsidence is not a problem anymore and blame the faulty management of drainage by concerned authorities [70].
3.2.3. The Institutional Trappings of Groundwater Control and Subsidence Monitoring
The lack of institutional coordination poses a great challenge in Thailand in terms of knowledge production. Concerning the monitoring of groundwater-induced subsidence, the issue was already raised in 1995 by JICA, which pointed out how the RTSD, DGR, and BMA conducted benchmark levelling separately without coordinating on the data and frequency of levelling [29]. This resulted in a lack of an authoritative land subsidence contour map. JICA advised that a technical sub-committee should be formed under the Groundwater Committee to centralize data from the DGR, DPT (Department of Public Works and Town and Country Planning, at the time it was known as the Public Works Department), MWA, PWA, DOH (Department of Highway), ARD (Office of Accelerated Rural Development), IEAT (Industrial Estate Authority of Thailand), RTSD, and BMA, among relevant agencies. A current member of the Groundwater Committee shared that such data integration has yet to happen and that most concerned agencies still protect their data and are reluctant to share it wholly with other agencies. A retired senior DGR officer further elaborated that this led to people discussing their research within their own circles and depicting their own versions of reality. From these statements, we can gather how the lack of dialogue between circles of knowledge production may lead to conflicting understandings of a problem. The need for data integration was reiterated as a policy recommendation by the Committee to Prepare Against the Sinking Bangkok Crisis, which was formed soon after the instauration of a new government (National Council for Peace and Order) in 2014 and existed only for a brief moment. In terms of institutional coordination, we argue that the DPT and Bangkok’s city planning department should be more involved in the policy process regarding land subsidence. Urban zoning can play a role as a policy measure to control the spatial distribution of water demand as well as limit the concentration of building load in areas heavily prone to subsidence.
Researchers within the DGR recognize the weak points of current land subsidence monitoring. There is room for improvement given the technological advances in terms of computer modelling and software capacities. However, there is also a general perception that the situation is better than it was in the 1980s for BMA. This has led to a lessened sense of urgency around the issue of land subsidence, which eventually translated into lessened efforts in monitoring.
In 2020, a project to improve the subsidence monitoring network was drafted and a budget was sought from the DGR’s Groundwater Development Fund in order to construct new observation wells, particularly in Samut Sakhon, and repair damaged levelling benchmarks and observation wells in the existing network. The director general of the DGR, who also chairs the board that manages the fund, regarded the project as fundamental research that does not yield any practical benefits to the general public. The DGR’s current focus, in terms of budget and knowledge, is the drilling of more tubewells in an effort to augment the supply for domestic consumption and agriculture in times of water shortage [68,69,71,72]. A member of the Groundwater Committee pointed out that the current DGR’s director general has close ties with the deputy prime minister, general Prawit Wongsuwan, known for his sponsorship of the water development project through his positions as chairman of the National Water Resource Committee and director of the National Water Command Center. This relationship has bearings on the DGR’s focus on water projects that “benefit the people”.
With all things considered, monitoring subsidence is not among the main mandates of the DGR. The task was attributed to this department as a result of the historical trajectory of the issue of subsidence which enrolled the DGR to study it along the AIT and RTSD. With time, the DGR came to be seen by other actors as the main implementation agency for policies relating to groundwater and land subsidence, even though the department’s chief mandate is that of developing groundwater resource and preserving it for sustainable use, and not the prevention of risk. A source within the DGR admitted that their internal Bureau of Groundwater Control prefers not to employ the ‘hard stick’ against unregistered users, arguing that such direct sanctions would not only hurt the fate of business owners in the critical groundwater zones, but would also harm the export economy at the national scale. The source further confided that the DGR is not comfortable with making public statements about the number of illegal groundwater users without the support of results from a survey report. Although they know there still exists a great number of illegal users, they can only surmise a rough estimation for the DGR to work with in order to survey areas or construct models more efficiently. According to a source within the FTI, there are many legal remedies as mentioned above, but Thailand is still marred by clientelism, informality, and corrupt practices. There needs to be some serious example-making to discourage groundwater users from pumping illegally.
Monitoring the salinization of aquifers currently worries the DGR more than the monitoring of land subsidence. A researcher within the DGR even stated that increased salinity in an aquifer causes problems after a single year whereas subsidence due to groundwater overdraft is not visible before several years and the impacts only become significant after a decade or more. Presently, there are no career incentives for a DGR officer to work on the issue of subsidence. As the interviewed researcher added, it is tedious work to review all literature on the subject and spend time and give constant attention to that matter. Even if someone has a personal interest in this issue, without the support from the DGR’s executives, in the form of dedicated staff and budget, any effort is meaningless and not conducive to recognition or promotion. Thus, researchers who tried to propose monitoring projects and were met with refusal time and time again ended up discouraged and resigned themselves to wait for another director general who might accord due importance to the monitoring land subsidence.
A former DGR researcher provided insights into the difference between the DGR’s research community in the 1980s and the present generation. Most researchers from the time of the NEB (1982) and JICA’s (1995) studies have retired. The researcher deplored the loss of expertise and interest in the issue of groundwater-induced subsidence within the current generation that did not expand the monitoring network set up by the previous generation of researchers. Only a handful of experts still have an understanding of the issue’s technical complexity. Most of the newly recruited staff usually proceed to hire consultants or become consultants themselves after an internship with the DGR without having undertaken further academic training and acquired formative experience in the field. Without competent and academically well-versed executives and researchers, the DGR’s increasing reliance on outsourced studies and research projects results in a twofold loss for the DGR. As they lose their firsthand knowledge on research topics to universities or consulting firms, they also lose the expertise to supervise and verify the data produced by contractors.
Multiple study reports written by academic research institutes between 2000 and 2010 contained erroneous data that the Research and Development of Groundwater Conservation and Restoration Group had to review and revise. An interviewed DGR senior researcher felt concerned by the lack of area-based knowledge within the department, missing the generation of researchers who were capable of citing key information from the top of their heads because they produced the data firsthand and spent enough time in an area to understand its complexity and history. It was emphasized during the interview that all areas are not homogeneous and are characterized by high uncertainties and, therefore, that a DGR officer cannot simply be transferred to a new area and expect the same methodologies to work universally.
4. Conclusions
Land subsidence has often been described as a wicked policy problem due to its need for clear problem framing, its multi-sectoral aspect, which is confronted by fragmented policy measures, and its policy arena being an “embattled terrain where vested power interests play out” [73]. The case of Bangkok exemplifies a successful reduction in the subsidence rate in inner Bangkok, yet the problem of land subsidence has not been fully dealt with and more can be achieved in terms of policy response to the issue. The soil mechanics involved when a groundwater overdraft induces land subsidence are complex. Most accounts depicting Bangkok’s recovery from the subsidence crisis simplify the complexity of the issue by mentioning only an average subsidence rate (inferior to the 1 cm/year threshold) without mentioning any other indicators (groundwater level and safe yield). While the wicked problem has been rendered seemingly governable by reducing the complexity of the issue through a trio of threshold indicators for groundwater management, the various methods to diagnose the symptoms of this problem still only provide a partial understanding of the situation. As land subsidence was shaped into a scientific reality in Bangkok, the issue enrolled various actors in the knowledge production process ranging from governmental agencies, the World Bank, foreign consultants and experts, as well as domestic academic institutions. Such communities constitute important science–policy interfaces in the groundwater governance meshwork [74]. The DGR stands out among them all as the principal authority in validating the data that support the official discourse and determining the thresholds for sustainable groundwater usage. We argue it is important for the DGR to pursue the monitoring of subsidence beyond Bangkok diligently in order to anticipate long-term flooding risks associated with the changing hydrogeology of the delta.
While it is recognized that there are multiple uncertainties in knowledge production about subsidence (whether through a declarative bias or through unregistered use of groundwater), crude visualization tools (subsidence or groundwater level decline contour map) are still in demand by decision-makers who need to wrap their heads around the reality and spatiality of subsidence. Uncertainties have to be toned down or ignored when producing material for discussion while aiming at policy relevance. Such uncertainties generate ample room for interpreting subsidence as illustrated through the data selection bias, which results in discursive shortcuts that simplify the way the problem is perceived. We’ve illustrated that all the monitoring techniques used in the Bangkok Metropolitan Region were prone to such bias. One can obtain a significantly different subsidence rate depending on the average depth of the selected compression indicators. Similarly, with InSAR imagery, which usually uses buildings as persistent scatterers, we can infer that buildings are “sinking” at a slow rate, but we lose sight of the subsidence rate of the ground itself. This latter aspect of subsidence has critical implications for the region in terms of flood drainage. As for data regarding the rate of groundwater pumping, it can fuel a discourse on the stability of subsidence if only derived from registered wells. However, when unregistered wells are factored into the equation, uncertainty looms large and the threshold indicators for groundwater control demand to be reassessed to better correspond to the actual groundwater pumping.
This article is an invitation to critically re-examine the tools that produce knowledge on environmental issues such as land subsidence, notably by challenging the assumed objectivity of numbers, which, when left unchecked, can contribute to reinforcing a dominant narrative on an environmental issue. This paper serves as a reminder that land subsidence is a complex issue that requires policy attention beyond the scope of limiting the subsidence rate in a short timescale. Groundwater use in the delta needs to be carefully monitored in order to anticipate future water demand [75] and understand the changing geography of groundwater depletion cones and land subsidence. Risks of submergence and flooding can be anticipated through preventive policy planning instead of being dealt with when they materialize through disasters that prompt reactive measures.
Funding
This research was funded by Institut de Recherche pour le Développement (IRD) through a thesis allowance for research in the South (ARTS Program: 929055J).
Institutional Review Board Statement
Ethical review and approval were waived for this study due to proper anonymization of any information disclosed by interviewed informants and informed consent was obtained at the time of original data collection.
Informed Consent Statement
Informed consent was obtained from all subjects involved in the study.
Data Availability Statement
Not applicable.
Acknowledgments
The author acknowledges the support of the Center for Social Development Studies (Chulalongkorn University) for hosting the author during multiple fieldwork periods between 2018 and 2021.
Conflicts of Interest
The author declares no conflict of interest. The funders had no role in the design of the study; in the collection, analyses, or interpretation of data; in the writing of the manuscript, or in the decision to publish the results.
References
- Land Subsidence. Available online: https://www.usgs.gov/mission-areas/water-resources/science/land-subsidence?qt-science_center_objects=0#qt-science_center_objects (accessed on 27 January 2022).
- Poland, J.F.; Davis, G.H. Land Subsidence Due to Withdrawal of Fluids. In Reviews in Engineering Geology; Geological Society of America: Boulder, CO, USA, 1969; Volume 2, pp. 187–270. ISBN 978-0-8137-4102-4. [Google Scholar]
- Barends, F.B.J.; Brouwer, F.J.J.; Schröder, F.H.; International Symposium on Land Subsidence, UNESCO (Eds.) Land Subsidence: By Fluid Withdrawal; by Solid Extraction; Theory and Modelling; Environmental Effects and Remedial Measures. In Proceedings of the Fifth International Symposium on Land Subsidence, The Hague, The Netherlands, 16–20 October 1995; International Association of Hydrological Sciences Publication: Wallingford, UK, 1995. ISBN 978-0-947571-74-0. [Google Scholar]
- Carbognin, L.; Gambolati, G.; Johnson, A.I. (Eds.) Land Subsidence: Geological Issues; Fluid Removal; Solid Extraction; Remedies—Decision Making. In Proceedings of the Sixth International Symposium on Land Subsidence, Ravenna, Italy, 24–29 September 2000; National Group for the Protection Against Hydrogeologic Catastrophies (C.N.R.): Wallingford, UK, 2000; Volume I, ISBN 88-87222-06-1. [Google Scholar]
- Galloway, D.L.; Burbey, T.J. Review: Regional Land Subsidence Accompanying Groundwater Extraction. Hydrogeol. J. 2011, 19, 1459–1486. [Google Scholar] [CrossRef]
- Bucx, T.H.M.; van Ruiten, C.J.M.; Erkens, G.; de Lange, G. An Integrated Assessment Framework for Land Subsidence in Delta Cities. Proc. Int. Assoc. Hydrol. Sci. 2015, 372, 485–491. [Google Scholar] [CrossRef]
- Poland, J.F.; Johnson, I.A.; Vega, G.F.; Yamamoto, S.; Carbognin, L. Guidebook to Studies of Land Subsidence Due to Ground-Water Withdrawal; Studies and Reports in Hydrology; Poland, J.F., Ed.; Unesco: Paris, France, 1984; ISBN 978-92-3-102213-5. [Google Scholar]
- Seijger, C.; Ellen, G.J.; Janssen, S.; Verheijen, E.; Erkens, G. Sinking Deltas: Trapped in a Dual Lock-in of Technology and Institutions. Prometheus 2017, 35, 193–213. [Google Scholar] [CrossRef]
- Cox, J.B. A Review of Engineering Properties of the Recent Marine Clays in Southeast Asia; Asian Institute of Technology: Bangkok, Thailand, 1968. [Google Scholar]
- Tanabe, S. Historical Geography of the Canal System in the Chao Phraya River Delta; Center for Southeast Asian Studies, Kyoto University: Kyoto, Japan, 1977; p. 51. [Google Scholar]
- Sanford, W.E.; Buapeng, S. Assessment Of A Groundwater Flow Model Of The Bangkok Basin, Thailand, Using Carbon-14-Based Ages And Paleohydrology. Hydrogeol. J. 1996, 4, 26–40. [Google Scholar] [CrossRef]
- Phien-wej, N.; Giao, P.H.; Nutalaya, P. Land Subsidence in Bangkok, Thailand. Eng. Geol. 2006, 82, 187–201. [Google Scholar] [CrossRef]
- Onodera, S.; Saito, M.; Sawano, M.; Hosono, T.; Taniguchi, M.; Shimada, J.; Umezawa, Y.; Lubis, R.F.; Buapeng, S.; Delinom, R. Erratum to “Effects of Intensive Urbanization on the Intrusion of Shallow Groundwater into Deep Groundwater: Examples from Bangkok and Jakarta”. Sci. Total Environ. 2009, 407, 3209–3217. [Google Scholar] [CrossRef]
- Bhattacharya, A.K. An Analysis of Land Subsidence in Bangkok and Kolkata Due to Over-Extraction of Groundwater. Electron. J. Geotech. Eng. 2013, 18, 1683–1694. [Google Scholar]
- Balasubramaniam, A.S.; Phien-wej, N.; Gan, C.H.; Oh, Y.N. Piled Foundations and Basement Excavations for Tall Buildings in Bangkok Subsoils. In Proceedings of the 2004 Malaysian Geotechnical Conference, Kuala Lumpur, Malaysia, 20–22 March 2004. [Google Scholar]
- Buapeng, S.; Foster, S. Controlling Groundwater Abstraction and Related Environmental Degradation in Metropolitan Bangkok—Thailand; World Bank: Washington, DC, USA, 2008. [Google Scholar]
- Asian Institute of Technology; Department of Mineral Resources. Groundwater Resources in Bangkok Area: Development and Management Study—Comprehensive Report 1978–1982; National Environment Board of the Government of Thailand: Bangkok, Thailand, 1982. [Google Scholar]
- Phiancharoen, C. Ground Water and Land Subsidence in Bangkok, Thailand. In Land Subsidence Symposium: Proceedings of the Second International Symposium on Land Subsidence, Anaheim, CA, USA, 13–17 December 1976; International Association of Hydrological Sciences: Anaheim, CA, USA, 1976. [Google Scholar]
- Bradnock, R.W.; Saunders, P.L. Sea-Level Rise, Subsidence and Submergence: The Political Ecology of Environmental Change in the Bengal Delta. In Political Ecology: Science, Myth and Power; Stott, P.A., Sullivan, S., Eds.; Oxford University Press: London, UK; New York, NY, USA, 2000; pp. 66–90. ISBN 978-0-340-76165-6. [Google Scholar]
- Nutalaya, P.; Chandra, S.; Balasubramaniam, A.S. Subsidence of Bangkok Clay Due to Deep Well Pumping and Its Control through Artificial Recharge. Int. J. Rock Mech. Min. Sci. Geomech. Abstr. 1988, 25, 727–744. [Google Scholar] [CrossRef]
- Nutalaya, P.; Yong, R.N.; Chumnankit, T.; Buapeng, S. Land Subsidence in Bangkok during 1978–1988. In Sea-Level Rise and Coastal Subsidence; Coastal Systems and Continental Margins; Milliman, J.D., Haq, B.U., Eds.; Springer: Dordrecht, The Netherlands, 1996; Volume 2, pp. 105–130. ISBN 978-90-481-4672-7. [Google Scholar]
- Aobpaet, A.; Cuenca, M.C.; Hooper, A.; Trisirisatayawong, I. InSAR Time-Series Analysis of Land Subsidence in Bangkok, Thailand. Int. J. Remote Sens. 2013, 34, 2969–2982. [Google Scholar] [CrossRef]
- Lorphensri, O.; Nettasana, T.; Ladawadee, A. Groundwater Environment in Bangkok and the Surrounding Vicinity, Thailand. In Groundwater Environment in Asian Cities; Elsevier: Amsterdam, The Netherlands, 2016; pp. 229–262. ISBN 978-0-12-803166-7. [Google Scholar]
- Babel, M.S.; Gupta, A.D.; Domingo, N.D.S. Land Subsidence: A Consequence of Groundwater Over-Exploitation in Bangkok, Thailand. Int. Rev. Environ. Strateg. 2006, 6, 307–328. [Google Scholar]
- Asian Institute of Technology. Investigation of Land Subsidence Caused by Deep Well Pumping in the Bangkok Area: Comprehensive Report 1978–1981; Office of the National Environment Board: Singapore, 1981. [Google Scholar]
- Geodesy and Geophysics Division of Royal Thai Survey Department. Land Subsidence Survey Report; Project for Surveying Land Subsidence within the Bangkok Metropolitan Region; Royal Thai Survey Department: Bangkok, Thailand, 2006. [Google Scholar]
- Geodesy and Geophysics Division of Royal Thai Survey Department. Land Subsidence Survey Report; Project for Surveying Land Subsidence within the Bangkok Metropolitan Region; Royal Thai Survey Department: Bangkok, Thailand, 2016. [Google Scholar]
- Royal Thai Survey Department. Three Decades of Leveling Survey to Measure Subsidence in Bangkok and Vicinity (Translated from Thai). Available online: https://www.rtsd.mi.th/main/2015/04/22/%e0%b8%aa%e0%b8%b2%e0%b8%a1%e0%b8%97%e0%b8%a8%e0%b8%a7%e0%b8%a3%e0%b8%a3%e0%b8%a9%e0%b8%81%e0%b8%b1%e0%b8%9a%e0%b8%81%e0%b8%b2%e0%b8%a3%e0%b8%a3%e0%b8%b1%e0%b8%87%e0%b8%a7%e0%b8%b1%e0%b8%94%e0%b8%95/ (accessed on 22 June 2021).
- Kokusai Kogyo Co., Ltd. The Study on Management of Groundwater and Land Subsidence in the Bangkok Metropolitan Area and Its Vicinity; JICA, DMR, Ministry of Industry and Public Works Department: Tokyo, Japan, 1995. [Google Scholar]
- Bürgmann, R.; Rosen, P.A.; Fielding, E.J. Synthetic Aperture Radar Interferometry to Measure Earth’s Surface Topography and Its Deformation. Annu. Rev. Earth Planet. Sci. 2000, 28, 169–209. [Google Scholar] [CrossRef]
- Sansosti, E.; Casu, F.; Manzo, M.; Lanari, R. Space-Borne Radar Interferometry Techniques for the Generation of Deformation Time Series: An Advanced Tool for Earth’s Surface Displacement Analysis: FRONTIER. Geophys. Res. Lett. 2010, 37, L20305. [Google Scholar] [CrossRef]
- Castellazzi, P.; Martel, R.; Galloway, D.L.; Longuevergne, L.; Rivera, A. Assessing Groundwater Depletion and Dynamics Using GRACE and InSAR: Potential and Limitations. Groundwater 2016, 54, 768–780. [Google Scholar] [CrossRef] [PubMed]
- Piromthong, P. Detection of 1996–2000 Rates and Trend of Land Subsidence in Greater Bangkok by InSAR Time-Series Analysis. Master’s Thesis, Chulalongkorn University, Bangkok, Thailand, 2015. [Google Scholar]
- Kühn, F.; Margane, A.; Tatong, T.; Wever, T. InSAR-Based-Land-Subsidence-Map-for-Bangkok-Thailand.Pdf. In Qualification Partnership Southeastern Europe; Zeitschrift für Angewandte Geologie; Schweizerbart Science Publishers: Stuttgart, Germany, 2004; Volume 50, pp. 74–81. [Google Scholar]
- Aobpaet, A.; Cuenca, M.C.; Hooper, A.; Trisirisatayawong, I. Land Subsidence Evaluation Using INSAR Time Series Analysis in Bangkok Metropolitan Area. In Proceedings of the Fringe 2009 Workshop, Frascati, Italy, 30 November–4 December 2009; p. 8. [Google Scholar]
- Aobpaet, A. InSAR Time-Series Analysis for Land Subsidence Monitoring in Bangkok and Its Vicinity Area. Ph.D. Thesis, Chulalongkorn University, Bangkok, Thailand, 2012. [Google Scholar]
- Aobpaet, A. Land Surface Displacement in Bangkok, Thailand Inferred from Stanford Method for Persistent Scatterers. Lowl. Technol. Int. 2021, 23, 57–65. [Google Scholar] [CrossRef]
- Chaithavee, S. INSAR Time Series Analysis for Land Subsidence Monitoring in Eastern Greater Bangkok. Master’s Thesis, Chulalongkorn University, Bangkok, Thailand, 2015. [Google Scholar]
- Phongha, P. Measuring Bangkok Metropolitan Land Subsidence in 2017 Using Sentinel-1 SAR Data. International Master Program for Environmental Sustainable Development. Master’s Thesis, National Central University, Taiwan, China, 2018. [Google Scholar]
- Pumpuang, A.; Aobpaet, A. The Comparison of Land Subsidence between East and West Side of Bangkok, Thailand. Built Environ. J. 2020, 17, 1. [Google Scholar] [CrossRef]
- Guzy, A.; Malinowska, A.A. State of the Art and Recent Advancements in the Modelling of Land Subsidence Induced by Groundwater Withdrawal. Water 2020, 12, 2051. [Google Scholar] [CrossRef]
- Onta, P.R.; Gupta, A.D. Regional Management Modeling of a Complex Groundwater System for Land Subsidence Control. Water Resour. Manag. 1995, 9, 1–25. [Google Scholar] [CrossRef]
- STS Engineering Consultants Co., Ltd.; Seven Associated Consultants Co., Ltd. Study of the Change of Piezometric Pressure Compression and Settlement in the Bangkok Area and Its Vicinity: Project for the Study of the Effects on the Groundwater Sources in the Groundwater Crisis Area and the Lower Chao Phraya Basin (Year 3–4) Main Report; Department of Groundwater Resources: Bangkok, Thailand, 2019. [Google Scholar]
- Metrix Associates Project to Develop GIS for Groundwater Management in Groundwater Crisis Zone; Department of Groundwater Resources: Bangkok, Thailand, 2012; Volume 2.
- King Mongkut Institute of Technology Ladkrabang (KMITL). Efficient Use of Groundwater in the Industrial Sector; Department of Groundwater Resources: Bangkok, Thailand, 2012. [Google Scholar]
- Fornés Azcoiti, J.M.; Pirarai, K. Groundwater in Thailand. J. Environ. Sci. Eng. B 2014, 3, 304–315. [Google Scholar] [CrossRef]
- Babel, M.S.; Gupta, A.D.; Domingo, N.D.S.; Kamalamma, A.G.; Water Engineering and Management, School of Engineering and Technology; Asian Institute of Technology (AIT). Sustainable Groundwater Management in Bangkok. In Sustainable Groundwater Management in Asian Cities; Freshwater Resources Management Project; Final Report of Research on Sustainable Water Management Policy; Institute for Global Environmental Strategies (IGES): Hayama, Japan, 2007; pp. 26–43. ISBN 4-88788-039-9. [Google Scholar]
- Hodge, M. Sinking Feeling Bangkok Could Be Partly Submerged by 2030 Because ‘Soapy Massage’ Brothels Are Stealing Groundwater Causing the City to SINK. Available online: https://www.thesun.co.uk/news/5427300/bangkok-thailand-brothels-submerged-soapy-water/ (accessed on 17 May 2019).
- Porter, T.M. Trust in Numbers: The Pursuit of Objectivity in Science and Public Life; History and Philosophy of Science; Princeton University Press: Princeton, NJ, USA, 1995; ISBN 978-0-691-02908-5. [Google Scholar]
- Tiwale, S. Number Narratives of Water Shortages: Delinking Water Resources Development from Water Distribution in Mumbai, India. Water Altern. 2021, 14, 841–865. [Google Scholar]
- Barrett, S.M. Implementation Studies: Time for a Revival? Personal Reflections on 20 Years of Implementation Studies. Public Adm. 2004, 82, 249–262. [Google Scholar] [CrossRef]
- Todd, D.K. Ground Water Hydrology; Wiley: New York, NY, USA, 1959; ISBN 978-0-471-87615-1. [Google Scholar]
- Premchitt, J. Analysis and Simulation of Land Subsidence with Special Reference to Bangkok. Ph.D. Thesis, Asian Institute of Technology, Bangkok, Thailand, 1978. [Google Scholar]
- Chula Unisearch. Supporting Document for the Seminar on Artificial Aquifer Recharge to Prevent Subsidence and Preserve the Environment; Grand Hall Meeting Room, Sasin School of Management, Chulalongkorn University, Thailand, 24 May 2000; Chula Unisearch: Bangkok, Thailand, 2000. [Google Scholar]
- Faculty of Engineering, Chulalongkorn University. Analysis of Land Subsidence in Bangkok Metropolitan and Its Vicinity Area; Department of Groundwater Resources: Bangkok, Thailand, 2009. [Google Scholar]
- Hajer, M.A. The Politics of Environmental Discourse: Ecological Modernization and the Policy Process; Clarendon Press—Oxford University Press: Oxford, UK; New York, NY, USA, 1995; ISBN 978-0-19-827969-3. [Google Scholar]
- Slip Threat Subsides. Bangkok Post, 22 March 2002; Accessed via Bangkok Post’s Newspaper Archives.
- Phisut Technology. Land Subsidence Systematic Survey and Analysis in Bkk and Periphery; Department of Groundwater Resources: Bangkok, Thailand, 2012.
- Office of Groundwater Resources Conservation and Rehabilitation—Department of Groundwater Resources. Study Project on the Impact on Grounwater Sources within Groundwater Crisis Area and the Lower Chao Phraya Groundwater Basin; Department of Groundwater Resources: Bangkok, Thailand, 2018.
- Tang, W.; Zhao, X.; Motagh, M.; Bi, G.; Li, J.; Chen, M.; Chen, H.; Liao, M. Land Subsidence and Rebound in the Taiyuan Basin, Northern China, in the Context of Inter-Basin Water Transfer and Groundwater Management. Remote Sens. Environ. 2022, 269, 112792. [Google Scholar] [CrossRef]
- Coda, S.; Tessitore, S.; Di Martire, D.; Calcaterra, D.; De Vita, P.; Allocca, V. Coupled Ground Uplift and Groundwater Rebound in the Metropolitan City of Naples (Southern Italy). J. Hydrol. 2019, 569, 470–482. [Google Scholar] [CrossRef]
- Waltham, T. Sinking Cities. Geol. Today 2002, 18, 95–100. [Google Scholar] [CrossRef]
- Chen, C.-T.; Hu, J.-C.; Lu, C.-Y.; Lee, J.-C.; Chan, Y.-C. Thirty-Year Land Elevation Change from Subsidence to Uplift Following the Termination of Groundwater Pumping and Its Geological Implications in the Metropolitan Taipei Basin, Northern Taiwan. Eng. Geol. 2007, 95, 30–47. [Google Scholar] [CrossRef]
- Ishitsuka, K.; Fukushima, Y.; Tsuji, T.; Yamada, Y.; Matsuoka, T.; Giao, P.H. Natural Surface Rebound of the Bangkok Plain and Aquifer Characterization by Persistent Scatterer Interferometry. Geochem. Geophys. Geosyst. 2014, 15, 965–974. [Google Scholar] [CrossRef]
- Saowiang, K.; Giao, P.H. Numerical Analysis of Subsurface Deformation Induced by Groundwater Level Changes in the Bangkok Aquifer System. Acta Geotech. 2021, 16, 1265–1279. [Google Scholar] [CrossRef]
- Faculty of Engineering, Kasetsart University; Department of Groundwater Resources. The Study of the Use of Remote Radar Signals to Monitor Land Subsidence in Bangkok and Suburb Area Project; Department of Groundwater Resources: Bangkok, Thailand, 2019.
- STS Engineering Consultants Co., Ltd.; Seven Associated Consultants Co., Ltd. Study of the Change of Piezometric Pressure Compression and Settlement in the Bangkok Area and Its Vicinity: Project for the Study of the Effects on the Groundwater Sources in the Groundwater Crisis Area and the Lower Chao Phraya Basin (Year 3–4) Executive Summary (English); Department of Groundwater Resources: Bangkok, Thailand, 2019.
- Bangkok Post. Groundwater Plan for Drought in Isan. Available online: https://www.bangkokpost.com/thailand/general/2068791/groundwater-plan-for-drought-in-isan (accessed on 24 February 2021).
- Bangkok Post. Drilling Guarantees Fresh Water for N East. Available online: https://www.bangkokpost.com/thailand/general/2209167/drilling-guarantees-fresh-water-for-n-east (accessed on 2 December 2021).
- MGR Online. Bangkok Is Damned! Land Subsides 1 Cm per Year Putting the Whole Area at Risk of Sinking under the Sea. Available online: https://mgronline.com/daily/detail/9620000056708 (accessed on 13 April 2022).
- Department of Groundwater Resources. Gen Prawit Officially Launched the Largest Groundwater Supply in Chainat, Thailand Distributing Water for More than 5000 People throughout the Year. Available online: http://www.dgr.go.th/en/newsAll/302/4285 (accessed on 13 April 2022).
- Matichon Online. Royal Initiative Solving Drought with Large Scale Groundwater Projects (Translated from Thai). Available online: https://www.matichon.co.th/local/quality-life/news_2912515 (accessed on 13 April 2022).
- Siriwardane-de Zoysa, R.; Schöne, T.; Herbeck, J.; Illigner, J.; Haghighi, M.; Simarmata, H.; Porio, E.; Rovere, A.; Hornidge, A.-K. The ‘Wickedness’ of Governing Land Subsidence: Policy Perspectives from Urban Southeast Asia. PLoS ONE 2021, 16, e0250208. [Google Scholar] [CrossRef]
- Sarkki, S.; Balian, E.; Heink, U.; Keune, H.; Nesshöver, C.; Niemelä, J.; Tinch, R.; Van Den Hove, S.; Watt, A.; Waylen, K.A.; et al. Managing Science-Policy Interfaces for Impact: Interactions within the Environmental Governance Meshwork. Environ. Sci. Policy 2020, 113, 21–30. [Google Scholar] [CrossRef]
- Neupane, S.; Ghimire, U.; Shrestha, S.; Mohanasundaram, S. Mapping Groundwater Resilience to Climate Change and Human Development in Bangkok and Its Vicinity, Thailand; Asian Institute of Technology: Bangkok, Thailand, 2022. [Google Scholar]
Publisher’s Note: MDPI stays neutral with regard to jurisdictional claims in published maps and institutional affiliations. |
© 2022 by the author. Licensee MDPI, Basel, Switzerland. This article is an open access article distributed under the terms and conditions of the Creative Commons Attribution (CC BY) license (https://creativecommons.org/licenses/by/4.0/).

