
Tribological Analysis of Molybdenum Disulfide (MOS2) Additivated in the Castor and Mineral Oil Used in Diesel Engine


 ,
,  , ,
, ,  , and
, and 
Abstract
:1. Introduction
2. Materials and Methods
2.1. Materials
2.1.1. Base Oil
2.1.2. Comparison of Castor Oil with Other Oils
2.1.3. Shell as a Standard Lubricant
2.1.4. Additive
2.1.5. Surfactants
2.1.6. Specifications of Diesel Engine
2.2. Methods
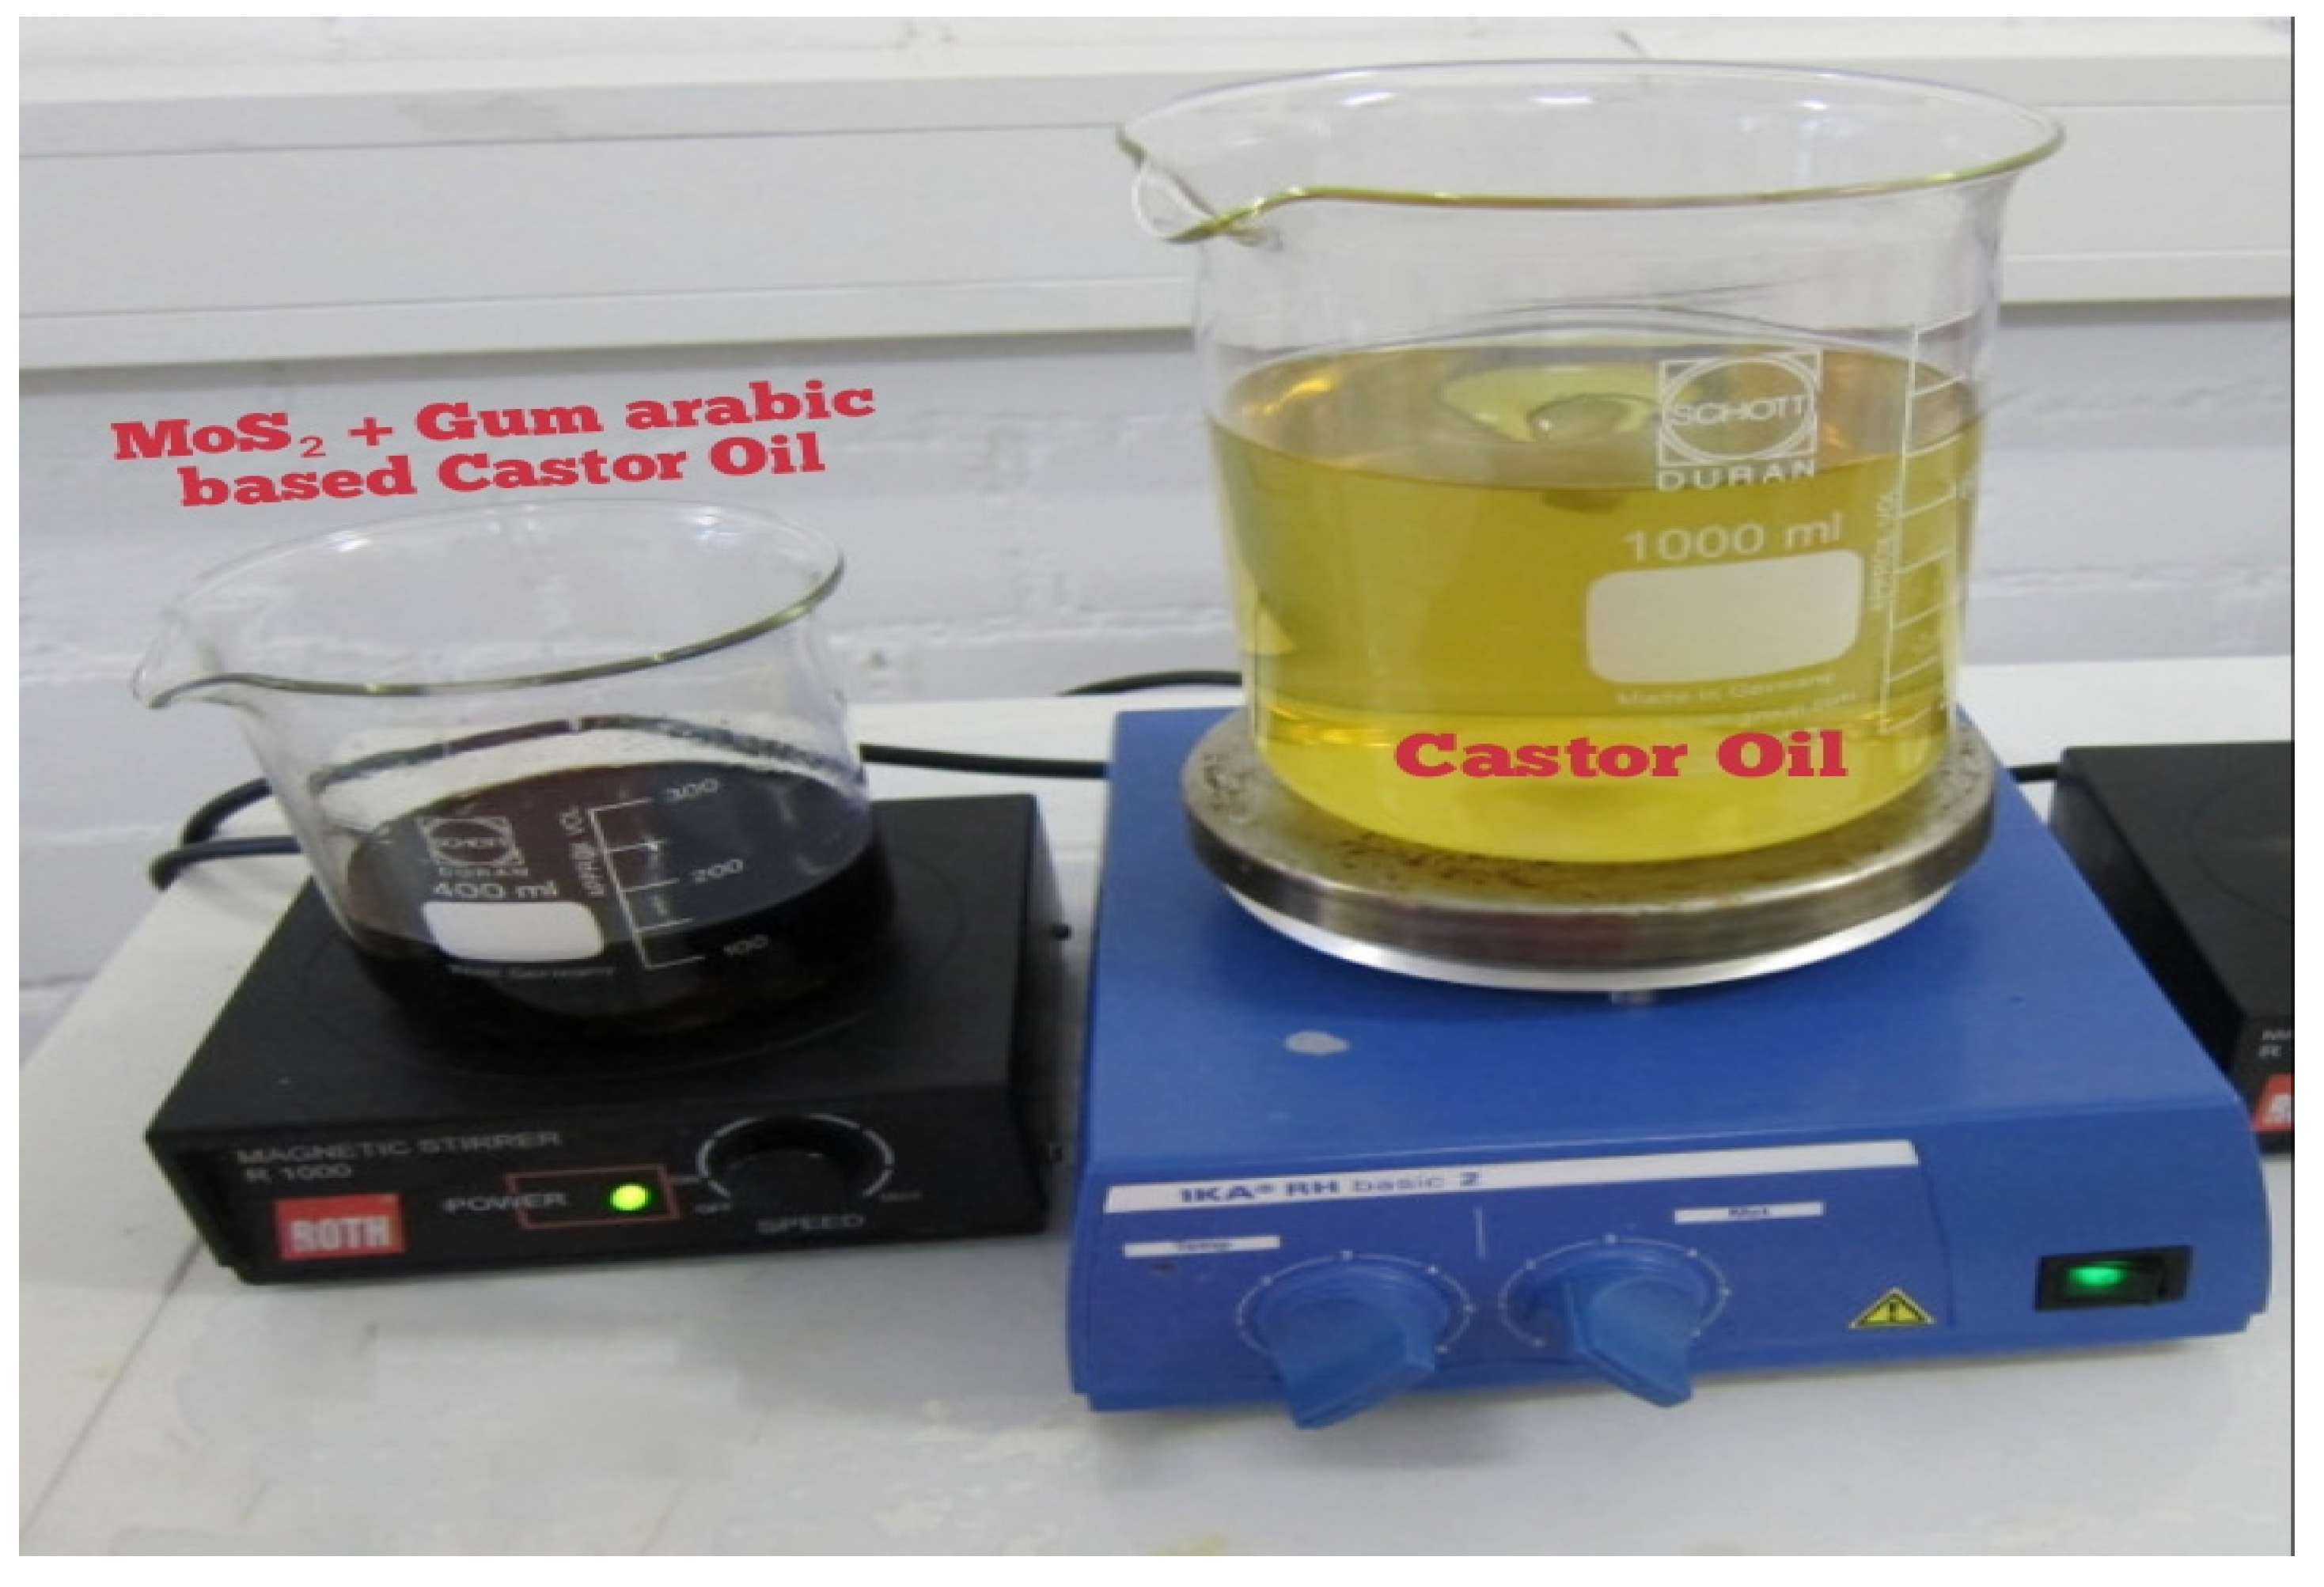
2.2.1. Formulation
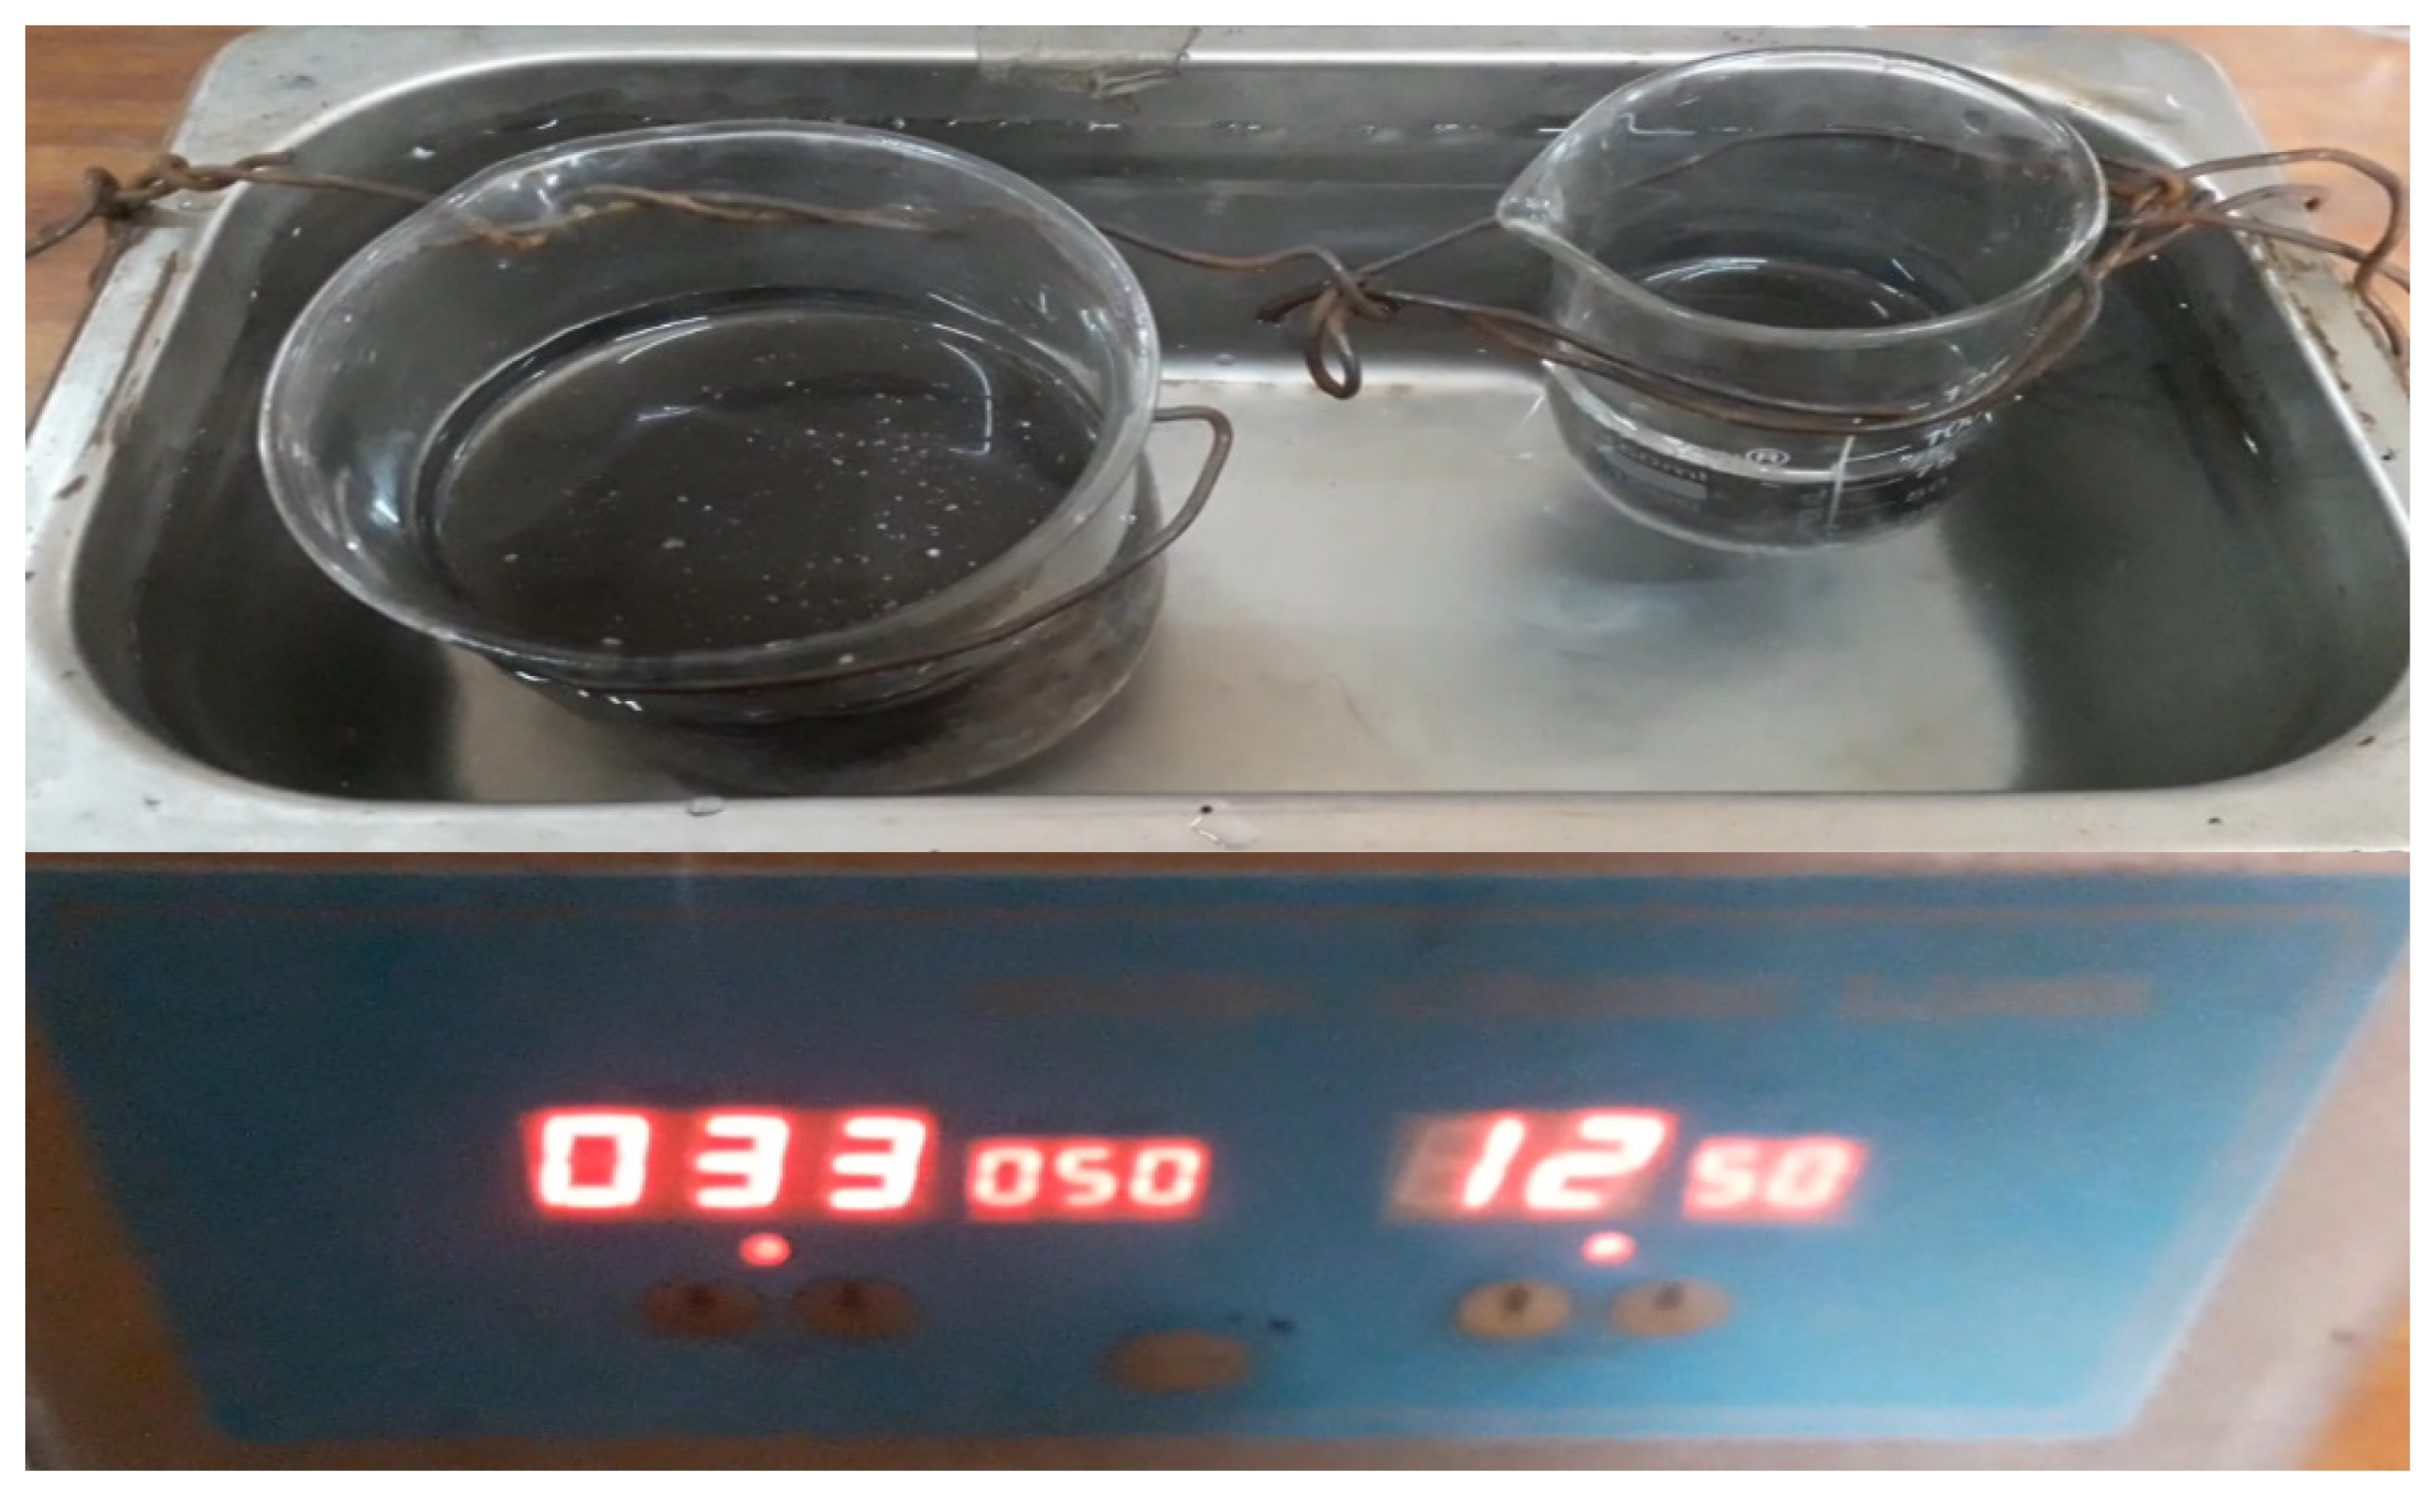
2.2.2. Equipment Used
2.2.3. Testing of Fresh MoS2-Based Synthetic and Shell Lubricants
2.2.4. Experimentation of Fresh Synthetic and Conventional Lubricants
2.2.5. Testing of Used MoS2-Based Synthetic and Shell Lubricants
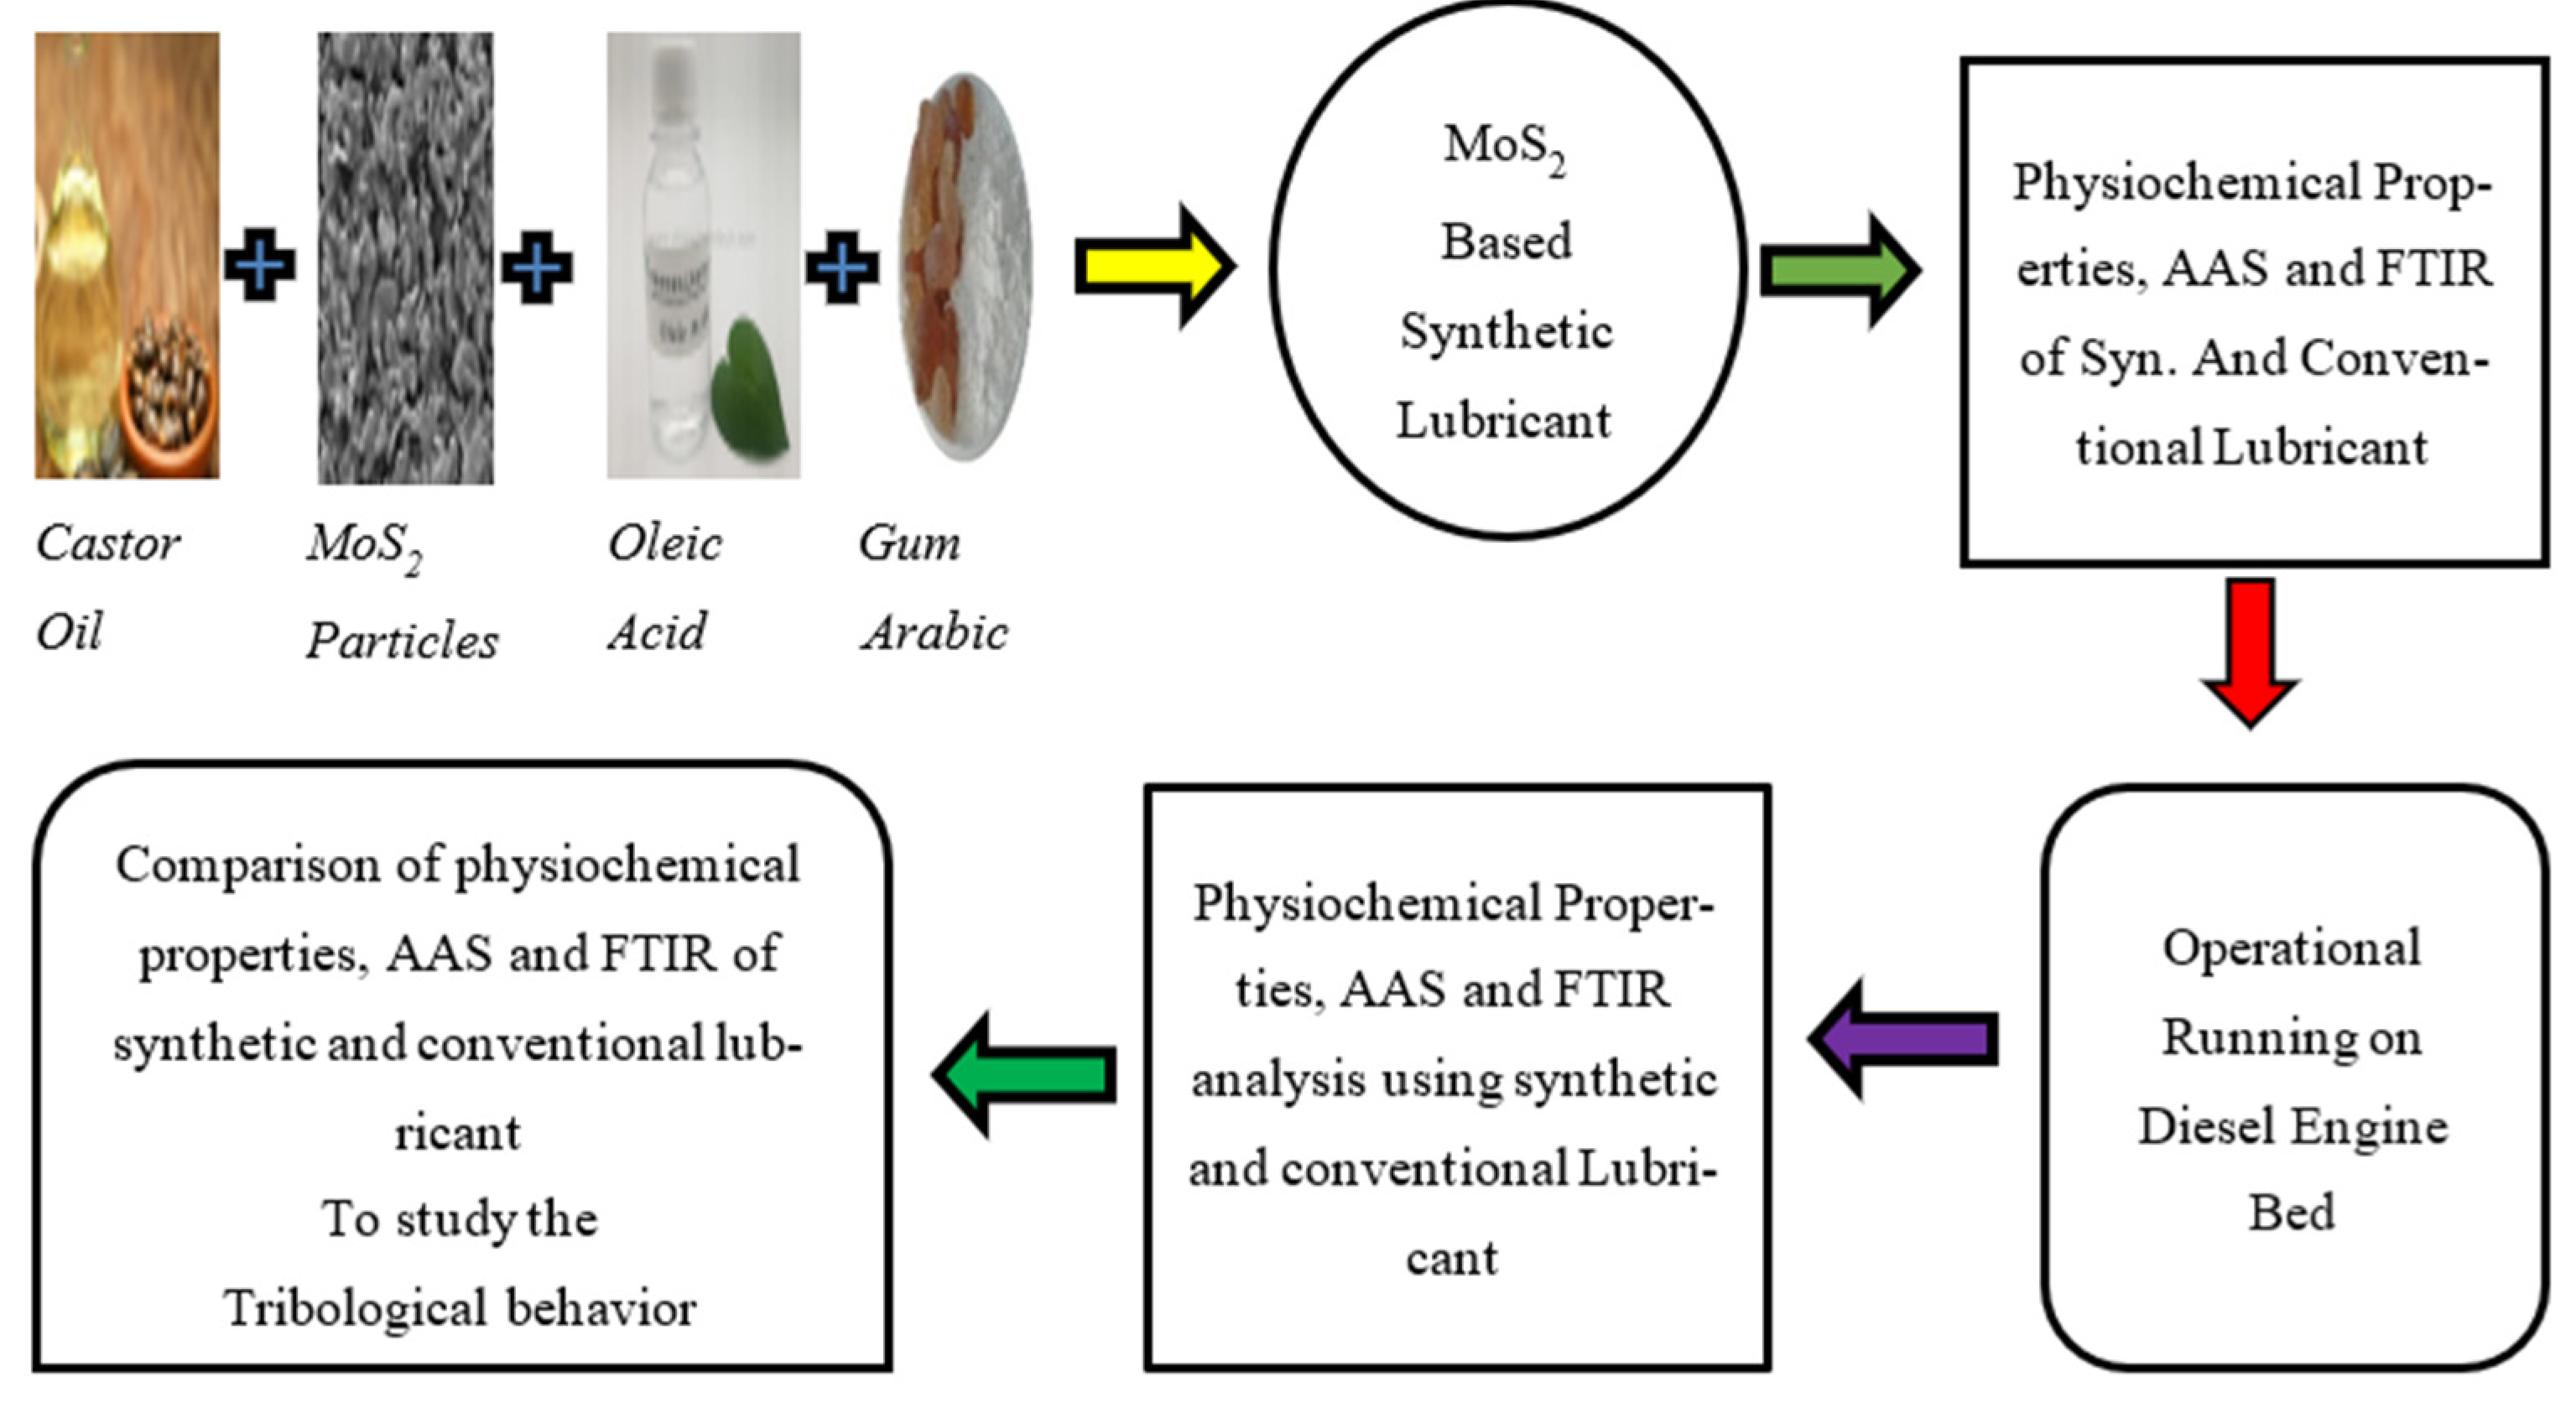
2.2.6. Flow Chart Diagram of Methodology
3. Results and Discussion
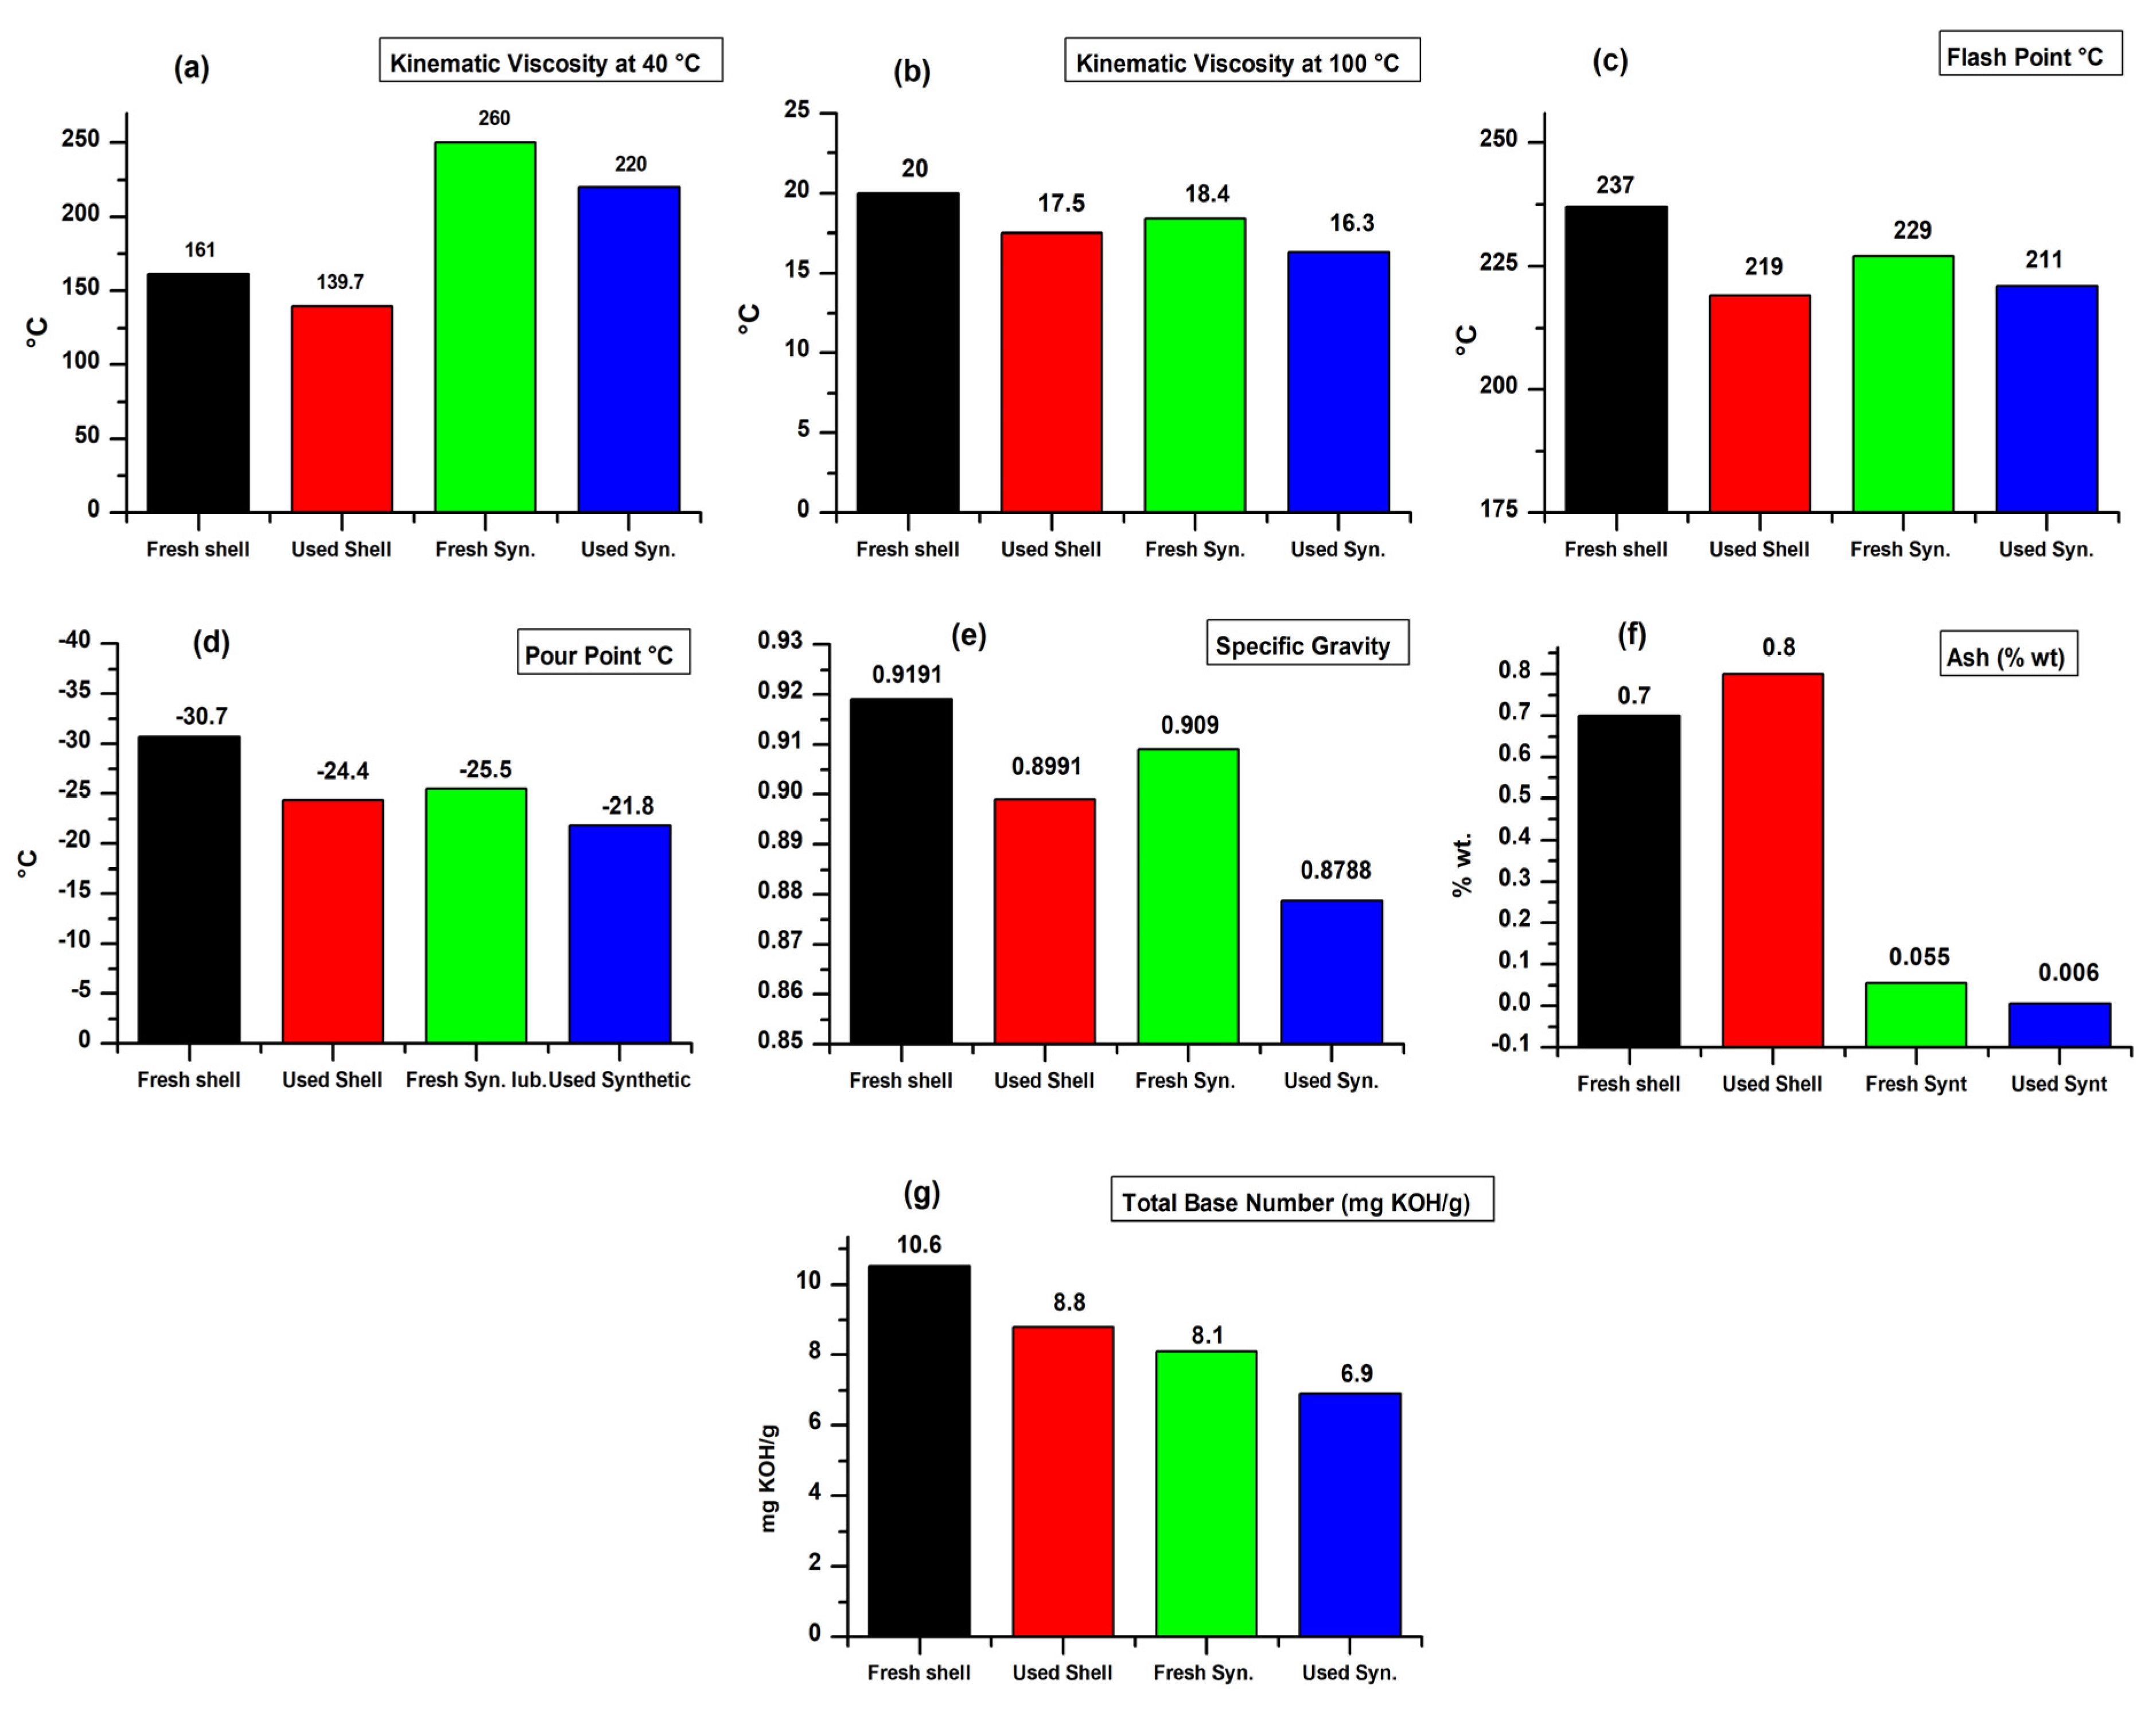
3.1. Physicochemial Properties
3.1.1. Kinematic Viscosity
3.1.2. Flash Point
3.1.3. Pour Point
3.1.4. Ash
3.1.5. Specific Gravity
3.1.6. Total Base Number
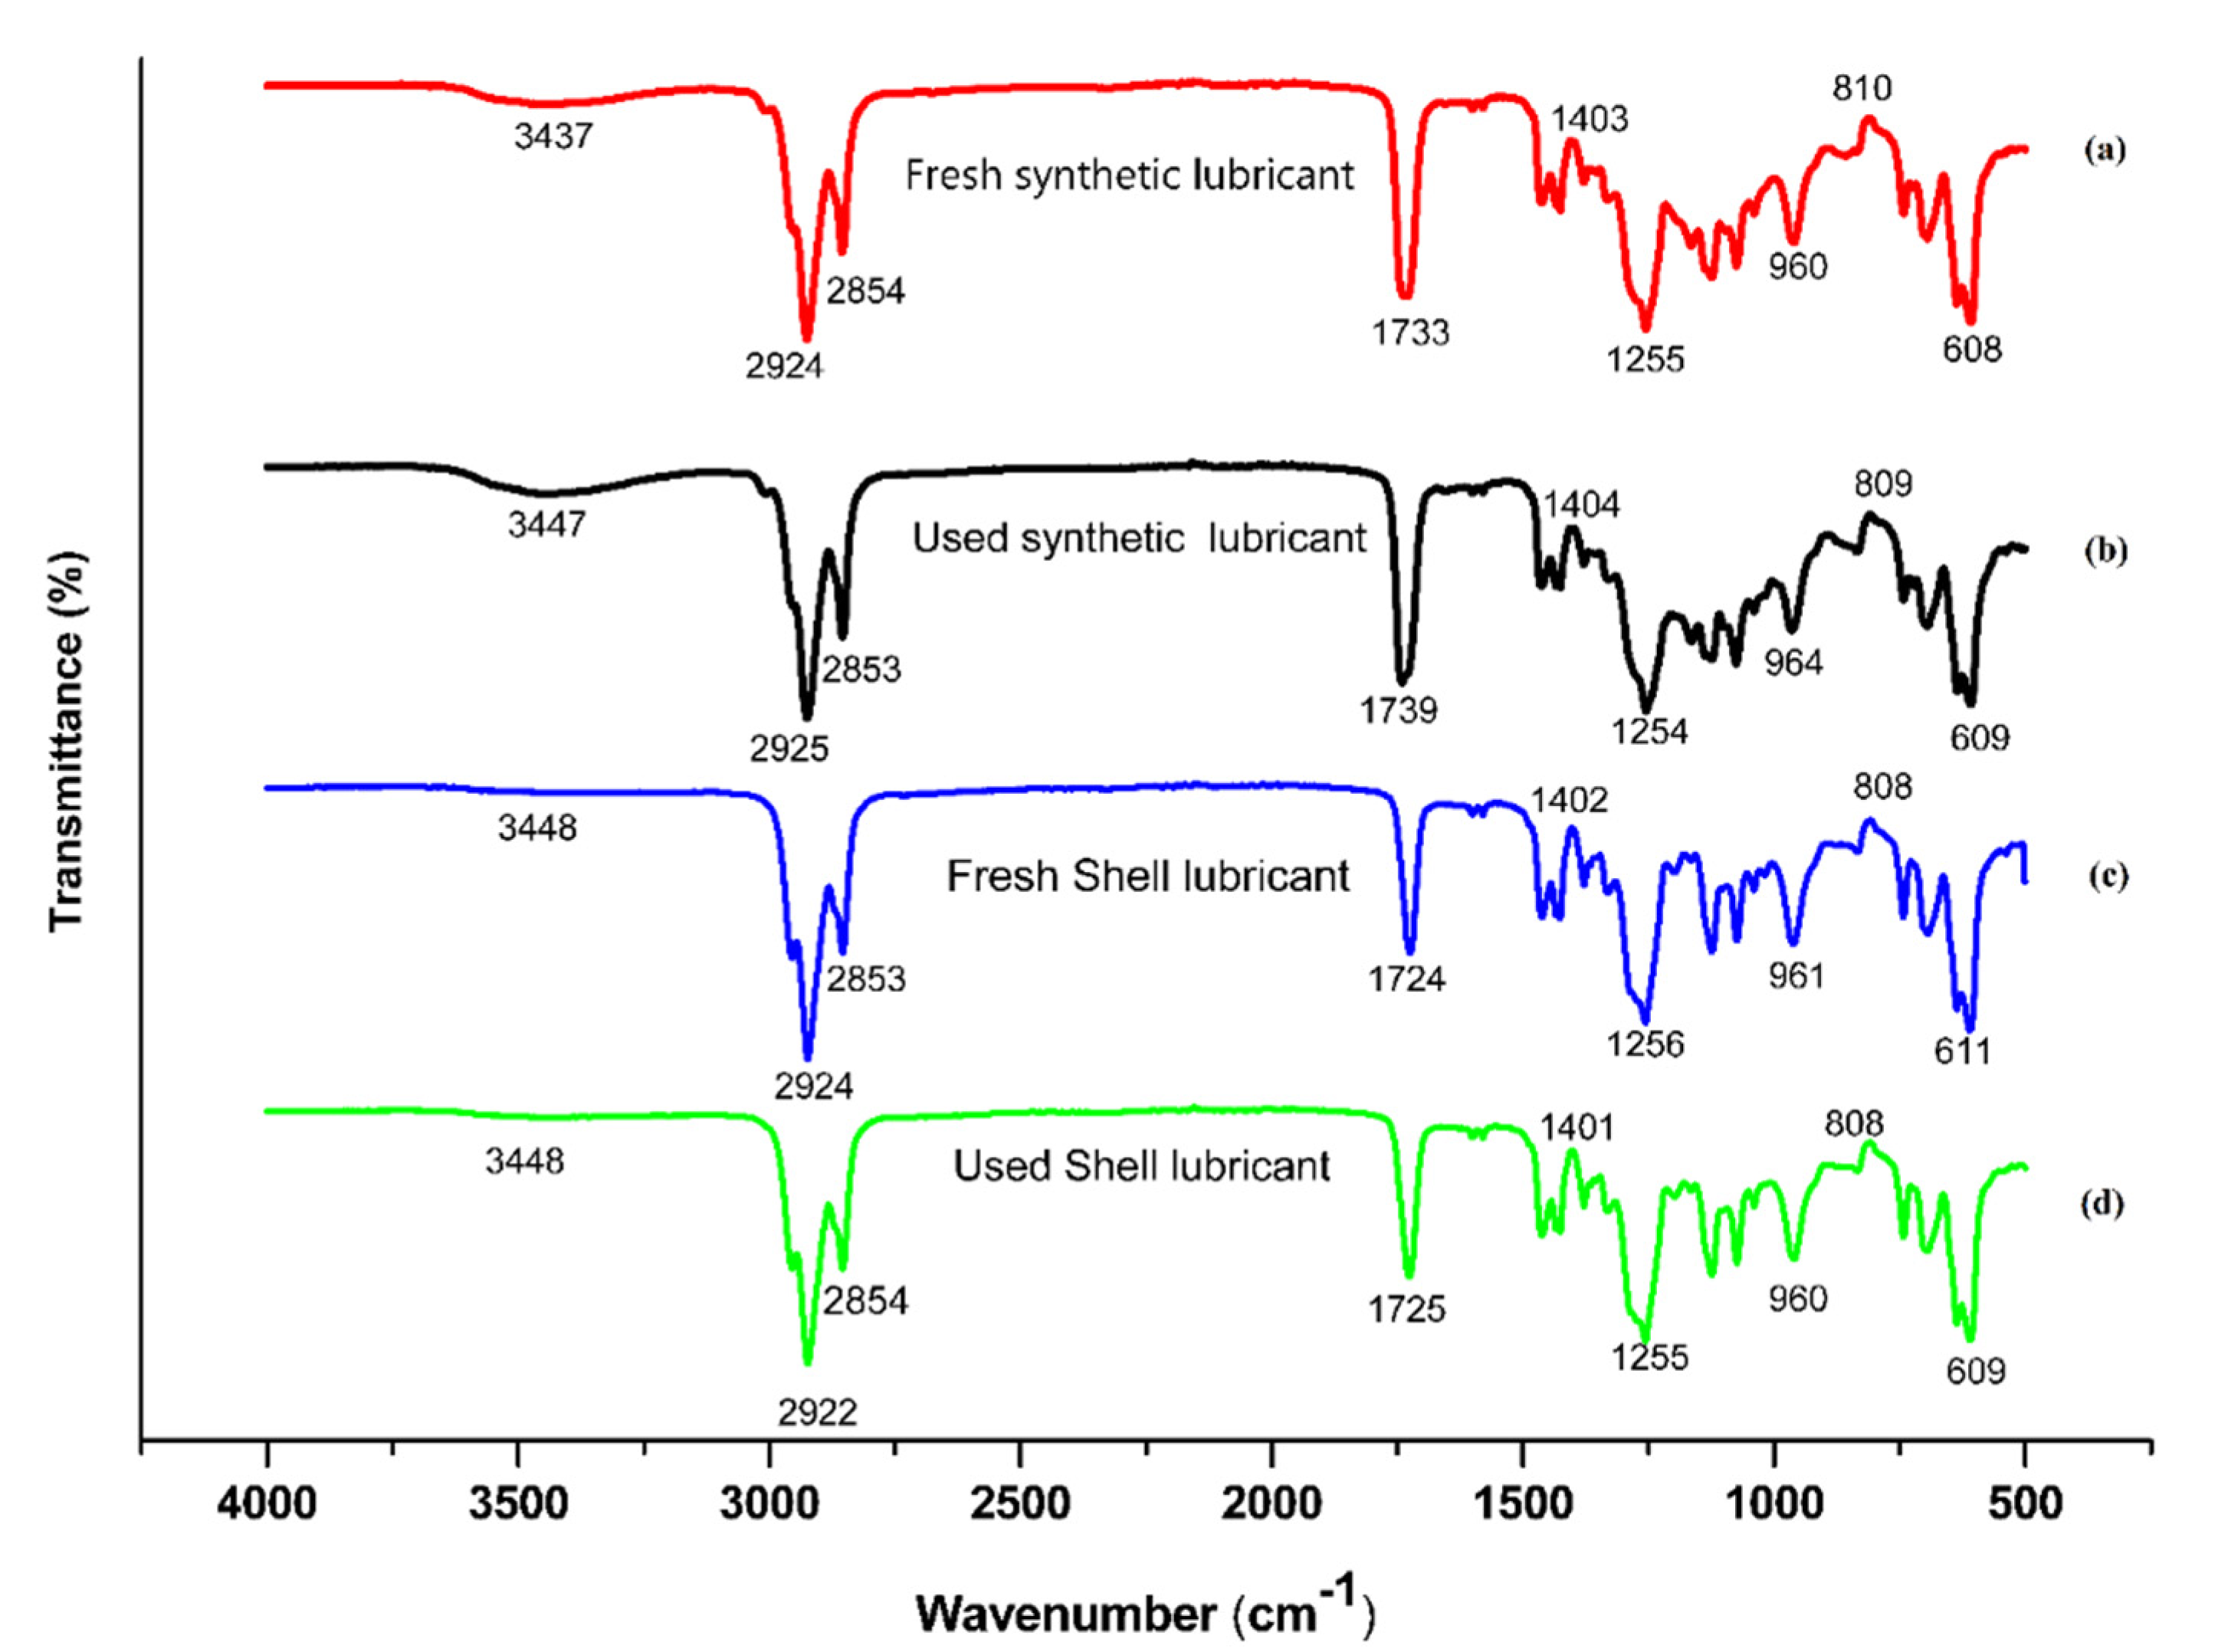
3.2. Fourier Transform Infrared (FTIR)
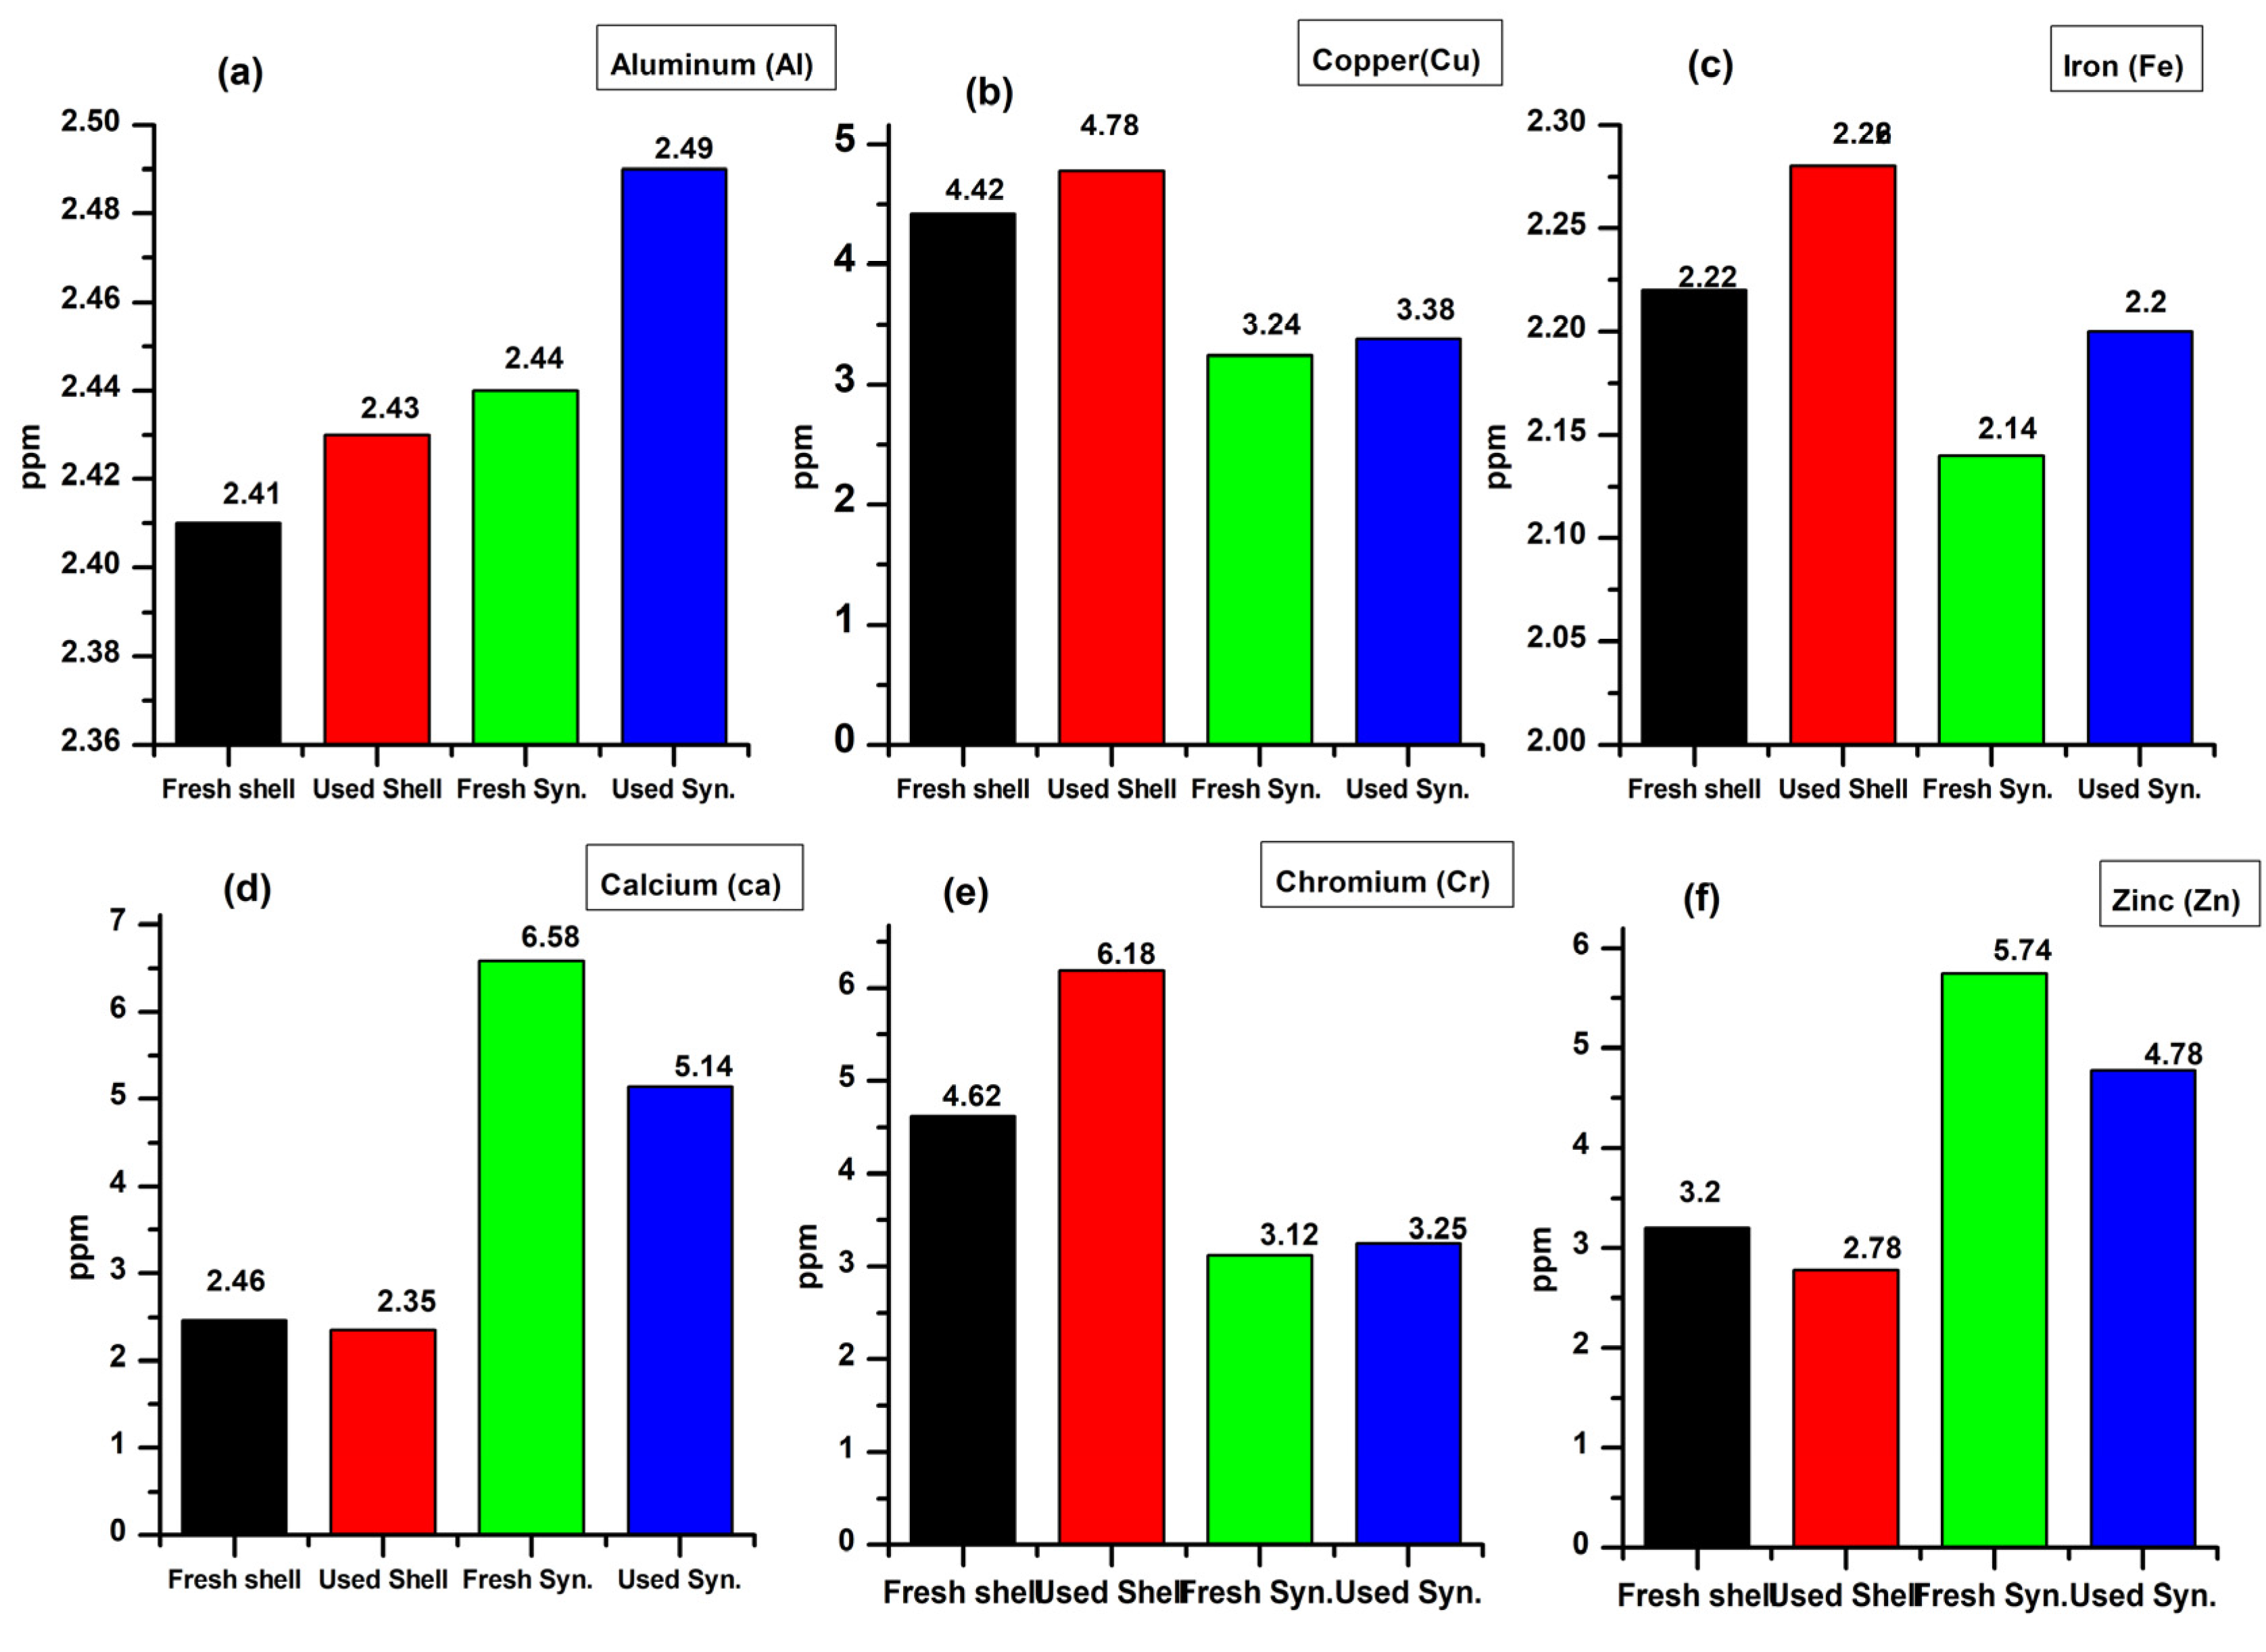
3.3. Atomic Absorption Spectroscopy
3.3.1. Aluminum (Al)
3.3.2. Copper (Cu)
3.3.3. Iron (Fe)
3.3.4. Calcium (Ca)
3.3.5. Chromium (Cr)
3.3.6. Zinc (Zn)
4. Conclusions
Author Contributions
Funding
Institutional Review Board Statement
Informed Consent Statement
Data Availability Statement
Conflicts of Interest
References
- Martín-Alfonso, J.E.; Valencia, C.; Sánchez, M.C.; Franco, J.M. Evaluation of thermal and rheological properties of lubricating greases modified with recycled LDPE. Tribol. Trans. 2012, 55, 518–528. [Google Scholar] [CrossRef]
- Gebretsadik, D.W. Tribological Properties of Composite Multilayer Coatings. Master’s Thesis, Luleå University of Technology, Lulea, Sweden, 2009. [Google Scholar]
- Hutchings, I.M. Leonardo da Vinci’s studies of friction. Wear 2016, 360, 51–66. [Google Scholar] [CrossRef] [Green Version]
- Liew Yun Hsien, W. Utilization of Vegetable Oil as Bio-Lubricant and Additive. In Towards Green Lubrication in Machining; Springer: Berlin/Heidelberg, Germany, 2015; pp. 7–17. [Google Scholar]
- Singh, Y.; Farooq, A.; Raza, A.; Mahmood, M.A.; Jain, S. Sustainability of a non-edible vegetable oil based bio-lubricant for automotive applications: A review. Process Saf. Environ. Prot. 2017, 111, 701–713. [Google Scholar] [CrossRef]
- Dinesh, R.; Prasad, M.G.; Kumar, R.R.; Santharaj, N.J.; Santhip, J.; Raaj, A.A. Investigation of tribological and thermophysical properties of engine oil containing nano additives. Mater. Today Proc. 2016, 3, 45–53. [Google Scholar] [CrossRef]
- Doll, K.M.; Sharma, B.K. Physical properties study on partially bio-based lubricant blends: Thermally modified soybean oil with popular commercial esters. Int. J. Sustain. Eng. 2012, 5, 33–37. [Google Scholar] [CrossRef]
- Raza, A.; Ahmed, A.; Kalam, M.A.; Fattah, I.R. Bio-Based Lubricant in the Presence of Additives: Classification to Tribological Behaviour. In Green Tribology; CRC Press: Boca Raton, FL, USA, 2021; pp. 27–70. [Google Scholar]
- Emmanuel, O.A.; Kessington, O.O.; Mudiakeoghene, O.-J. Biodegradation of vegetable oils: A review. Sci. Res. Essays 2009, 4, 543–548. [Google Scholar]
- McNutt, J. Development of biolubricants from vegetable oils via chemical modification. J. Ind. Eng. Chem. 2016, 36, 1–12. [Google Scholar] [CrossRef]
- Stachowiak, G.W.; Batchelor, A.W. Engineering Tribology; Butterworth-Heinemann: Oxford, UK, 2013. [Google Scholar]
- Salimon, J.; Salih, N.; Yousif, E. Industrial development and applications of plant oils and their biobased oleochemicals. Arab. J. Chem. 2012, 5, 135–145. [Google Scholar] [CrossRef] [Green Version]
- Syahir, A.Z.; Zulkifli, N.W.M.; Masjuki, H.H.; Kalam, M.A.; Alabdulkarem, A.; Gulzar, M.; Khuong, L.S.; Harith, M.H. A review on bio-based lubricants and their applications. J. Clean. Prod. 2017, 168, 997–1016. [Google Scholar] [CrossRef]
- Singh, A. Castor oil-based lubricant reduces smoke emission in two-stroke engines. Ind. Crops Prod. 2011, 33, 287–295. [Google Scholar] [CrossRef]
- Bongfa, B.; Peter, A.A.; Barnabas, A.; Adeotic, M.O. Comparison of lubricant properties of castor oil and commercial engine oil. J. Tribol. 2015, 5, 1–10. [Google Scholar]
- Gulzar, M.; Masjuki, H.H.; Varman, M.; Kalam, M.A.; Mufti, R.A.; Zulkifli, N.W.M.; Yunus, R.; Zahid, R. Improving the AW/EP ability of chemically modified palm oil by adding CuO and MoS2 nanoparticles. Tribol. Int. 2015, 88, 271–279. [Google Scholar] [CrossRef]
- Noori, A.A.S.; Hussein, H.A.; Namer, N.S. Influence of Adding CuO and MoS2 Nano-Particles to Castor Oil and Moulding Oil on Tribological Properties. In IOP Conference Series: Materials Science and Engineering; IOP Publishing: Bristol, UK, 2019. [Google Scholar]
- Bekal, S.; Bhat, N. Bio-lubricant as an alternative to mineral oil for a CI engine—An experimental investigation with pongamia oil as a lubricant. Energy Sources Part A Recovery Util. Environ. Eff. 2012, 34, 1016–1026. [Google Scholar] [CrossRef]
- Yeboah, A.; Ying, S.; Lu, J.; Xie, Y.; Amoanimaa-Dede, H.; Boateng, K.G.A.; Chen, M.; Yin, X. Castor oil (Ricinus communis): A review on the chemical composition and physicochemical properties. Food Sci. Technol. 2020, 41. [Google Scholar] [CrossRef]
- Fakhri, N.; Qadir, H. Studies on various physico-chemical characteristics of some vegetable oils. J. Environ. Sci. Eng. 2011, 5, 48. [Google Scholar]
- Valente, O.S.; Pasa, V.M.D.; Belchior, C.R.P.; Sodré, J.R. Physical–chemical properties of waste cooking oil biodiesel and castor oil biodiesel blends. Fuel 2011, 90, 1700–1702. [Google Scholar] [CrossRef] [Green Version]
- Yu, R.; Liu, J.; Zhou, Y. Experimental study on tribological property of MoS2 nanoparticle in castor oil. J. Tribol. 2019, 141, 102001. [Google Scholar] [CrossRef]
- Sgroi, M.F.; Asti, M.; Gili, F.; Deorsola, F.A.; Bensaid, S.; Fino, D.; Kraft, G.; Garcia, I.; Dassenoy, F. Engine bench and road testing of an engine oil containing MoS2 particles as nano-additive for friction reduction. Tribol. Int. 2017, 105, 317–325. [Google Scholar] [CrossRef]
- Siao, M.D.; Shen, W.C.; Chen, R.S.; Chang, Z.W.; Shih, M.C.; Chiu, Y.P.; Cheng, C.M. Two-dimensional electronic transport and surface electron accumulation in MoS2. Nat. Commun. 2018, 9, 1442. [Google Scholar] [CrossRef] [Green Version]
- Farahmandjou, M. Effect of Oleic Acid and Oleylamine Surfactants on the Size of FePt Nanoparticles. J. Supercond. Nov. Magn. 2012, 25, 2075–2079. [Google Scholar] [CrossRef]
- Gokdogan, O.; Eryilmaz, T.; Yesilyurt, M.K. Thermophysical properties of castor oil (Ricinus communis L.) biodiesel and its blends. CTF-Cienc. Tecnol. Futuro 2015, 6, 95–128. [Google Scholar] [CrossRef]
- Efeovbokhan, V.E.; Ayoola, A.A.; Anawe, P.A.L.; Oteri, O. The effects of trans-esterification of castor seed oil using ethanol, methanol and their blends on the properties and yields of biodiesel. Int. J. Eng. Technol. 2012, 2, 1734–1742. [Google Scholar]
- Kazeem, O.; Taiwo, O.; Kazeem, A.; Mondiu, D. Determination of some physical properties of castor (Ricirus communis) oil. Int. J. Sci. Eng. Technol. 2014, 3, 1503–1508. [Google Scholar]
- Adeyemo, D.J.; Umar, I.M.; Thomas, S.A.; Agbaji, E.B. Analysis of lubricating oil for Cu, Fe, Mn, Ni, and Zn using electrothermal atomic absorption spectrometry. Instrum. Sci. Technol. 2004, 32, 689–694. [Google Scholar] [CrossRef]
- Ekanem, E.; Lori, J.; Thomas, S. The determination of wear metals in used lubricating oils by flame atomic absorption spectrometry using sulphanilic acid as ashing agent. Talanta 1997, 44, 2103–2108. [Google Scholar] [CrossRef]
- Li, H.; Niu, S.; Lu, C. Pyrolysis characteristics of castor oil through thermogravimetric coupled with fourier transform infrared spectroscopy. Procedia Eng. 2017, 205, 3705–3710. [Google Scholar] [CrossRef]
- Negi, H.; Singh, R.K. A review on lignin utilization in petroleum exploration, petroleum products formulation, bio-fuel production, and oil spill clean-up. Biomass Convers. Biorefinery 2020, 1–12. [Google Scholar] [CrossRef]
- Kumar, R.; Hussainova, I.; Rahmani, R.; Antonov, M. Solid Lubrication at High-Temperatures—A Review. Materials 2022, 15, 1695. [Google Scholar] [CrossRef]

| Properties | Castor Oil |
|---|---|
| Density (kg/m3) | 962.8 |
| Fire point (°C) | 335 |
| Flash point (°C) | 298 |
| Cloud point (°C) | 15.8 |
| Specific gravity | 0.9628 |
| Viscosity (mPa·s) | 686.26 |
| Pour point (°C) | −33 |
| Properties | Units | Castor Oil | Rubber Seed Oil | Waste Cooking Oil | Canola Oil | Olive Oil | Sunflower Oil |
|---|---|---|---|---|---|---|---|
| Specific gravity at 30 °C | 0.956 | 0.945 | 0.801 | 69.998 | 0.8883 | 0.8833 | |
| Acid value | (mgKOH/g) | 0.91 | 37.80 | 3 | 0.650 | 3.220 | 0.524 |
| Flash point | (°C) | 197 | 152.0 | 305 | 217 | 210 | 93.3 |
| Saponification value | (mgKOH/g) | 179.52 | 255.25 | 186.3 | 178 | 193 | 195 |
| Iodine value | (gI2/100 g) | 83.5 | 23.81 | 57.08 | 162.86 | 80.57 | 125.21 |
| Kinematic viscosity at 40 °C | cSt | 321.0 | 380.65 | 49.84 | 38.6 | 49.998 | 43.063 |
| Pour point | (°C) | −33 | 106.0 | −7.8 | −18 | 3 | −36 |
| pH value | 7.203 | 7.1 | 5.5 | 6.201 | 6.693 | 6.301 |
| Properties | Shell Oil |
|---|---|
| Density (kg/m3) | 888 |
| Flash point (°C) | 215 |
| Specific gravity | 0.9628 |
| Viscosity (mPa·s) | 161 |
| Pour point (°C) | −27 |
| Suppliers Information | MoS2 |
|---|---|
| Company | Sigma Aldrich |
| Grade standard | Electron grade |
| Purity | 99% |
| Average particle size (nm) | 60 |
| Appearance | Black powder |
| Description | Specifications |
|---|---|
| Engine model | Lombardini–15 LD 315 |
| Cylinders | 1 |
| Displacement | 315 cm3 |
| Bore | 78 mm |
| Stoke | 60 mm |
| Compression ratio | 20.3:1 |
| Max. torque @ rpm | 15 Nm @ 2400 |
| Oil consumption | 0.0030 L |
| Oil sump capacity | 1.2 L |
| Dynamometer attached | Hydraulic dynamometer |
| Cooling system | Air cooled |
| Mode of injection | Direct injection |
| Dry weight | 33 kg |
| Recommended battery | 12/44 (V/Ah) |
| Atomic Absorption Spectroscopy of Different Elements | ||||||
|---|---|---|---|---|---|---|
| Sr. | Types of Elements | Types of Lubricants | Before Engine Operation | After Engine Operation | ||
| Mean Absorbance | ppm | Mean Absorbance | ppm | |||
| 1 | Chromium (Cr) | Synthetic | 0.000231 | 4.62 | 0.000111 | 2.220 |
| Conventional | 0.000156 | 3.12 | 0.000107 | 2.14 | ||
| 2 | Iron (Fe) | Synthetic | 0.000111 | 2.22 | 0.000221 | 4.42 |
| Conventional | 0.000107 | 2.14 | 0.000160 | 3.24 | ||
| 3 | Copper (Cu) | Synthetic | 0.000221 | 4.42 | 0.000280 | 5.74 |
| Conventional | 0.000162 | 3.24 | 0.000160 | 3.20 | ||
| 4 | Zinc (Zn) | Synthetic | 0.000287 | 5.74 | 0.000122 | 2.44 |
| Conventional | 0.000016 | 3.2 | 0.000120 | 2.41 | ||
| 5 | Aluminum (Al) | Synthetic | 0.000122 | 2.44 | 0.000329 | 6.58 |
| Conventional | 0.000120 | 2.41 | 0.000123 | 2.46 | ||
| 6 | Calcium (Ca) | Synthetic | 0.000329 | 6.58 | 0.000111 | 2.22 |
| Conventional | 0.000123 | 2.46 | 0.000107 | 2.14 | ||
Publisher’s Note: MDPI stays neutral with regard to jurisdictional claims in published maps and institutional affiliations. |
© 2022 by the authors. Licensee MDPI, Basel, Switzerland. This article is an open access article distributed under the terms and conditions of the Creative Commons Attribution (CC BY) license (https://creativecommons.org/licenses/by/4.0/).
Share and Cite
Hassan, M.U.; Usman, M.; Bashir, R.; Naeem Shah, A.; Ijaz Malik, M.A.; Mujtaba, M.A.; Elkhatib, S.E.; Kalam, M.A. Tribological Analysis of Molybdenum Disulfide (MOS2) Additivated in the Castor and Mineral Oil Used in Diesel Engine. Sustainability 2022, 14, 10485. https://doi.org/10.3390/su141710485
Hassan MU, Usman M, Bashir R, Naeem Shah A, Ijaz Malik MA, Mujtaba MA, Elkhatib SE, Kalam MA. Tribological Analysis of Molybdenum Disulfide (MOS2) Additivated in the Castor and Mineral Oil Used in Diesel Engine. Sustainability. 2022; 14(17):10485. https://doi.org/10.3390/su141710485
Chicago/Turabian StyleHassan, Mehmood Ul, Muhammad Usman, Rehmat Bashir, Asad Naeem Shah, Muhammad Ali Ijaz Malik, M.A. Mujtaba, Samah Elsayed Elkhatib, and Md Abul Kalam. 2022. "Tribological Analysis of Molybdenum Disulfide (MOS2) Additivated in the Castor and Mineral Oil Used in Diesel Engine" Sustainability 14, no. 17: 10485. https://doi.org/10.3390/su141710485
APA StyleHassan, M. U., Usman, M., Bashir, R., Naeem Shah, A., Ijaz Malik, M. A., Mujtaba, M. A., Elkhatib, S. E., & Kalam, M. A. (2022). Tribological Analysis of Molybdenum Disulfide (MOS2) Additivated in the Castor and Mineral Oil Used in Diesel Engine. Sustainability, 14(17), 10485. https://doi.org/10.3390/su141710485