Article

From ESG to DESG: The Impact of DESG (Digital Environmental, Social, and Governance) on Customer Attitudes and Brand Equity

by
Wilert Puriwat
1 and
Suchart Tripopsakul
2,*
1
Chulalongkorn Business School, Chulalongkorn University, Bangkok 10330, Thailand
2
School of Entrepreneurship and Management, Bangkok University, Bangkok 12120, Thailand
*
Author to whom correspondence should be addressed.
Sustainability 2022, 14(17), 10480; https://doi.org/10.3390/su141710480
Submission received: 7 July 2022 / Revised: 19 August 2022 / Accepted: 20 August 2022 / Published: 23 August 2022

Abstract

:
Due to the advances in digital technology, the environmental, social, and governance (ESG) concept has been transformed into the digital environmental, social, and corporate governance (DESG) model, which can be realized as a potentially vital strategic movement for sustainable business practices in the contemporary digital era. Nevertheless, there is a lack of empirical research evidence on how firms’ DESG practices impact customers’ attitudes and brand equity. The purposes of this study were (1) to investigate the effect of DESG initiatives on customers’ attitudes (CA) and brand equity (BE), and (2) to explore how those impacts vary based on the diversity of socio-economic attributes. An online survey was conducted, and the data were analyzed by a structural equation modeling (SEM) technique. Based on 212 samples of Thai citizens’ experiences with firms’ DESG initiatives, the results revealed that DESG has a significant positive direct effect on CA. The mediation analysis revealed that CA fully mediated the relationship between DESG and BE. The results of a second-order confirmatory factor analysis of the DESG construct found that the digital social dimension (b = 0.775) played the strongest role in explaining DESG, followed by the digital environmental (b = 0.768) and digital governance (b = 0.718) dimensions. The moderation analysis found that the impact of DESG on CA was stronger for younger groups than older populations. Additionally, the group with a higher formal education level seemed to exhibit higher levels of CA than those with a lower level. Our study is one of a few endeavors to clarify the effects of DESG from the customer’s side, and suggests several implications and recommendations.

1. Introduction

The environmental, social, and governance (ESG) concept has gained prominence as a crucial term in business management strategies around the world. ESG stands for “environmental, social, and governance”, and refers to the non-financial issues that a company should examine in addition to the financial reasons when making investment decisions [1]. Lessons learned from the COVID-19 pandemic can help businesses alter their focus to become more resilient to catastrophes. Visionary organizations are establishing a compass to better respond to future crises and navigate through volatility by focusing on responses to social and environmental concerns rather than the standard company operational outlook [2]. Companies have been required to reduce their environmental impact, increase their worker value, diversify their relationships, and keep their businesses profitable during the last few decades as a result of pressure from stakeholders. Investors must strike an equilibrium between an asset’s risk and return before deciding. Hedge and mutual funds with environmental, social, and governance initiatives currently handle more than USD 30 trillion. The ESG concept is used to track half of the European investment market and around one-third of the American market [3]. Consumers are becoming more conscious of the effects when choosing ESG-focused companies, whereas businesses are boosting public awareness of their efforts. E-commerce participants are also emphasizing their efforts to lessen the environmental impact of shipping materials as well as the carbon costs of moving products directly to customers. The burden is also being felt by companies in their supply chain. More often, customers are gradually selecting brands that are devoted to environmental sustainability, according to a prior survey. The study found that 80% of consumers said they are more likely to choose a brand which is environmentally sustainable. This illustrates a change in customers’ perceptions of businesses’ environmental strategies; for example, 90% of customers believe that society needs to become more energy-conscious [4].
In Thailand, various businesses in the banking, financial market, and insurance industries have attempted to apply ESG practices. The Ministry of Finance, for example, is developing a Sustainable Financing Framework with the goal of issuing sovereign green, social, and sustainable bonds and loans. One of the primary objectives of the Bank of Thailand’s three-year strategy plan (2020–2022) is to encourage financial institutions to integrate ESG into their business and operating models. Sustainability disclosures have been promoted among listed firms of all sizes by the Stock Exchange of Thailand (SET), accompanied by the establishment of the Thailand Sustainability Investment (THSI) and SETTHSI indexes, which include listed companies who pass the THSI assessment standards [2].
Although metrics and standards for reporting on environmental, social, and governance issues have been developed to share information with stakeholders, they are frequently directed at regulators and investors rather than consumers; thus, customers’ perceptions of sustainability activities are not necessarily reflected in communications about such activities. The contemporary developments in digital technologies enable firms to implement and communicate their environmental, social, and good governance practices through digital platforms. For example, people can immerse themselves in the new virtual environment known as the Metaverse. The Metaverse is a virtual world where people can exist as digital characters (avatars) who can roam in three dimensions and participate in events, exercise, shop, gamble, and even play games. In the Metaverse, business owners can set up online stores, employ shopkeepers, and offer goods and services to avatars who are virtual humans. Regardless of their physical locations, businesses and organizations can organize meetings in the Metaverse [5]. Less travel is anticipated when meetings and social events take place in the Metaverse, which will cut down on the carbon emissions produced by physical commutes using various modes of transportation. Around 20% of the world’s carbon dioxide emissions are attributable to transportation, with road travel accounting for 75% of these emissions [6]. Hopefully, the environmental advantages of the Metaverse development will outweigh the disadvantages. We have coined the term “Digital Environmental, Social, and Corporate Governance (DESG)” to describe the phenomenon, which refers to organizational activities that aim to promote sustainable development goals through the innovative application of technologies that produce, utilize, transmit, or source electronic data.
In reality, little research has been carried out on how DESG measurements and reporting affect customers’ attitudes and behaviors towards sustainability [7]. Nevertheless, in the contemporary setting of the digitalized corporate environment, businesses work to implement digital initiatives and declare their intentions towards the environment, society, and governance in relation to these multifaceted digitalization agendas in their strategic planning. To adapt to the ongoing changes brought about by digitization and fulfill their commitments to a variety of stakeholders, businesses must proactively consider these developments [8]. In this sense, a company makes use of digital technology to address multiple stakeholders and prioritizes DESG in its strategic planning. Little research has looked at how DESG affects brand equity and consumer sentiments. To fulfill this research gap, the current research proposed and verified the effect of firms’ DESG initiatives from the customers’ side. This study explored the impact of DESG initiatives on customers’ attitudes and brand equity and how those impacts vary based on the diversity of customers’ profiles.
This study is organized as follows. An overview of the literature on the DESG concept and its ramifications is presented in Section 2. The study framework is explained, and the hypotheses are developed in Section 3. The methodology that was used to acquire the data is illustrated in Section 4. The results of the data analysis are shown and discussed in Section 5. The conclusions are presented in Section 6, along with this study’s limitations and potential guidelines for further research.

2. Literature Review

2.1. From ESG to DESG

Since its introduction in 2006 with the release of the UN Principles of Responsible Investment, the ESG concept has captured the attention of researchers and practitioners. The three new pillars of corporate social responsibility are also known as the ESG concept. Its definitions include terms such as “green”, “ethical”, “mission”, “impact”, “responsible”, “values”, “socially responsible”, and “sustainability”, which refer to methods of having a good social influence [1]. To direct, administer, and manage all of its affairs in a way that furthers the interests of its stockholders and other stakeholders, an organization’s relationship with its ecological surroundings, its coexistence and interaction with people and other populations, and its corporate system of internal controls and procedures are all considered to be part of ESG [9,10]. The term “digital transformation” refers to the application of a wide range of technologies from the digital, physical, and biological areas, either singly or in combination, to create new markets and enterprises, as well as possibly addressing ESG and other social and economic issues. Both digital and ESG activities seek to fulfill shifting stakeholder expectations as well as the effects of new business and operating models on society and the environment. The adoption of digital technologies and their capacity to influence ESG goals are becoming increasingly convergent. Improved data collection, reporting, and analysis will have the largest immediate impact and will benefit every part of the business. Additionally, organizations in the banking and treasury sectors are implementing cutting-edge technologies such as blockchain to digitize their supply chains, as well as cloud infrastructure, robotics for shared service center operations, and artificial intelligence (AI). They are also applying new information and cooperation mechanisms to achieve important objectives such as regulatory compliance, data protection, workforce productivity, etc. Many corporations are discovering that this novel technology advances genuine compliance with ESG goals, because contemporary digital technologies can transform function quickly. They can complement one another rather than clash with one another, assisting firms in achieving critically essential priorities that are growing more and more important to both employees and constituents, as well as customers [11]. For instance, by utilizing machine learning in conjunction with optical sensors, artificial intelligence (AI) enables a business to identify and lower the amount of methane emissions at a wellhead or pipeline more effectively. One of the top AI businesses is Royal Dutch Shell, which has integrated descriptive analytics and preventative maintenance for 500,000 valves throughout its global operations. The ability of AI to perform data analysis and the methods that enable computers to do so identify important information that can be used as a basis for business choices. The ability to track CO2 removal and energy emission reduction makes AI a useful addition to ESG programs. Additionally, Shell has begun integrating digital twin technology into its gas facilities to investigate operational performance, reduce energy use, and ultimately boost gas and condensate production. By identifying cost-saving options in specific parts of a process or service that might otherwise be viewed as wasteful, this cutting-edge technology helps DESG [12].
Nowadays, customers are more empowered thanks to social media, digital tools, and widespread information access. Customers are embracing technology to hold businesses accountable to them and to make use of their consumer rights. Private data and information can be generated, stored, and exchanged almost indefinitely due to digital and internet technology. To maintain their digital experience, businesses must foster collaboration and streamline decision-making. Firms require a structure and plan for digital governance which promotes workflows that are faster, easier, and more efficient. The goal of the discipline of “digital governance” is to clearly define who is responsible for digital strategy, policy, and standards [13]. The norms, institutions, and standards that influence the laws governing the creation and application of these technologies are collectively referred to as digital governance [14]. An organization can use data and digital technologies in ways that are regarded as socially responsible by following a set of practices and behaviors that together make up a digital social pillar. In other words, the digital social pillar deals with how a company uses technology to foster positive relationships with individuals, groups, and society [15]. The performance of a company is influenced by its brand identity, customer and stakeholder communication strategies, recruiting policies, and any other people-centric activities carried out through or influenced by digital platforms. Tools that respect client privacy are available for use by businesses. For instance, iOS’s App Tracking Transparency feature lets users choose which apps can share data. Businesses should prevent misinformation on all platforms and channels where they engage with customers. They can do this by checking the facts of everything they say on every platform, responding quickly and honestly to criticism online, and supporting laws that control content [16].
Previous research has investigated the relationship between ESG and financial issues such as the cost of capital and firms’ financial performance. Access to external financial resources is more likely for transparent organizations that embrace broader ESG disclosure practices [17]. The cost of loans can be reduced because lenders are better informed about the many business variables associated with increased company transparency on ESG issues. Companies can now provide information about all facets of business management without hiding anything that potential lenders might find important by providing more information on environmental impacts, social issues, and corporate governance systems [18]. The cost of debt for borrowing firms is shown to be correlated with their ESG rating [19]. As a result of their exposure to environmental, social, and governance liabilities that eventually raise their default risk, firms with low ESG ratings are thought to be riskier. Ramirez, Monsalve, González-Ruiz, Almonacid, and Peña found that the governance pillar score shows a negative relationship with the cost of capital [20]. This demonstrates that making internal processes and governance bodies clearer can be a key driver of creating value for firms and giving investors more confidence. Good ESG performance can enhance financial performance [21]. This finding has important ramifications for investors, firm management, decision-makers, and industry regulators. To accomplish a long-term profitability goal, the emphasis must be shifted from profit maximization to corporate social responsibility. This will support the company’s long-term sustainable and healthy development while also enhancing its societal impact and public image. About 90% of 2000 empirical studies revealed a non-negative association between ESG and business financial performance [22]. More significantly, the vast majority of studies present positive results. DESG is more than just ESG with a “digital” label attached. DESG blends ethical digital transformation concepts with responsible and more sustainable business practices, although both have a similar overall framework. The ultimate outcome is a modern organizational framework for the 21st century.
For this reason, the digital environmental, social, and corporate governance (DESG) concept should be emphasized by firms as an imperative strategic movement to establish enterprises that only take what they need to maintain the sustainability of social, environmental, and economic systems. The term “digital environmental, social, and corporate governance” is used by the authors to refer to firms’ initiatives that aim to promote Sustainable Development Goals through the innovative application of technologies that produce, utilize, transmit, or source electronic data. These activities’ digital nature frees them from geographical restrictions and increases scalability, which increases their impact. These DESG activities’ goals also remove the tension between profit and purpose by emphasizing the creation of socio-ecological value as a crucial component of an economic offer. This is what makes the DESG lens different from other lenses.

2.2. Customer Attitudes and Brand Equity

The customer’s attitude is defined as the willingness of the customer to express a favorable or unfavorable reaction toward specific goods, businesses, or brands. An individual’s perception of any brand is based on the information or knowledge they have learned from their family, friends, networks, cultural background, and other external factors. Alternatively, these sentiments can be based on customers’ experiences and engagement. Customers gradually develop their attitudes regarding a brand, deciding whether they like, trust, or are loyal to it [23]. In our study, “customer attitude” refers to consumers’ perceptions of businesses or brands that follow ethical business practices and are socially and ecologically responsible. Customers could have a favorable opinion of brands or corporations based on companies’ DESG initiatives.
According to Aaker (1996), brand equity is the combination of brand assets and liabilities associated with a brand’s name and symbol that add to or detract from the value supplied by a product or service to a business and/or that business’s customers [24]. The company’s perspective was included by Keller, Parameswaran, and Jacob (2011), who defined it as the diverse impacts of brand understanding on customers’ responses to brand marketing [25]. Brand equity is a collection of beliefs, attitudes, knowledge, and actions on the part of a consumer that result in improved utility and allow a brand to generate greater margins than it could without the brand [26].
Although several studies have investigated the consequences of ESG, to date, no study has examined the effect of DESG on customers’ attitudes and brand equity. Corporate social responsibility should enhance consumers’ perceptions of a company, according to widely accepted marketing studies [27]. Companies with effective ESG policies make use of factors that give them a competitive advantage, such as improved brand trust and image [1].

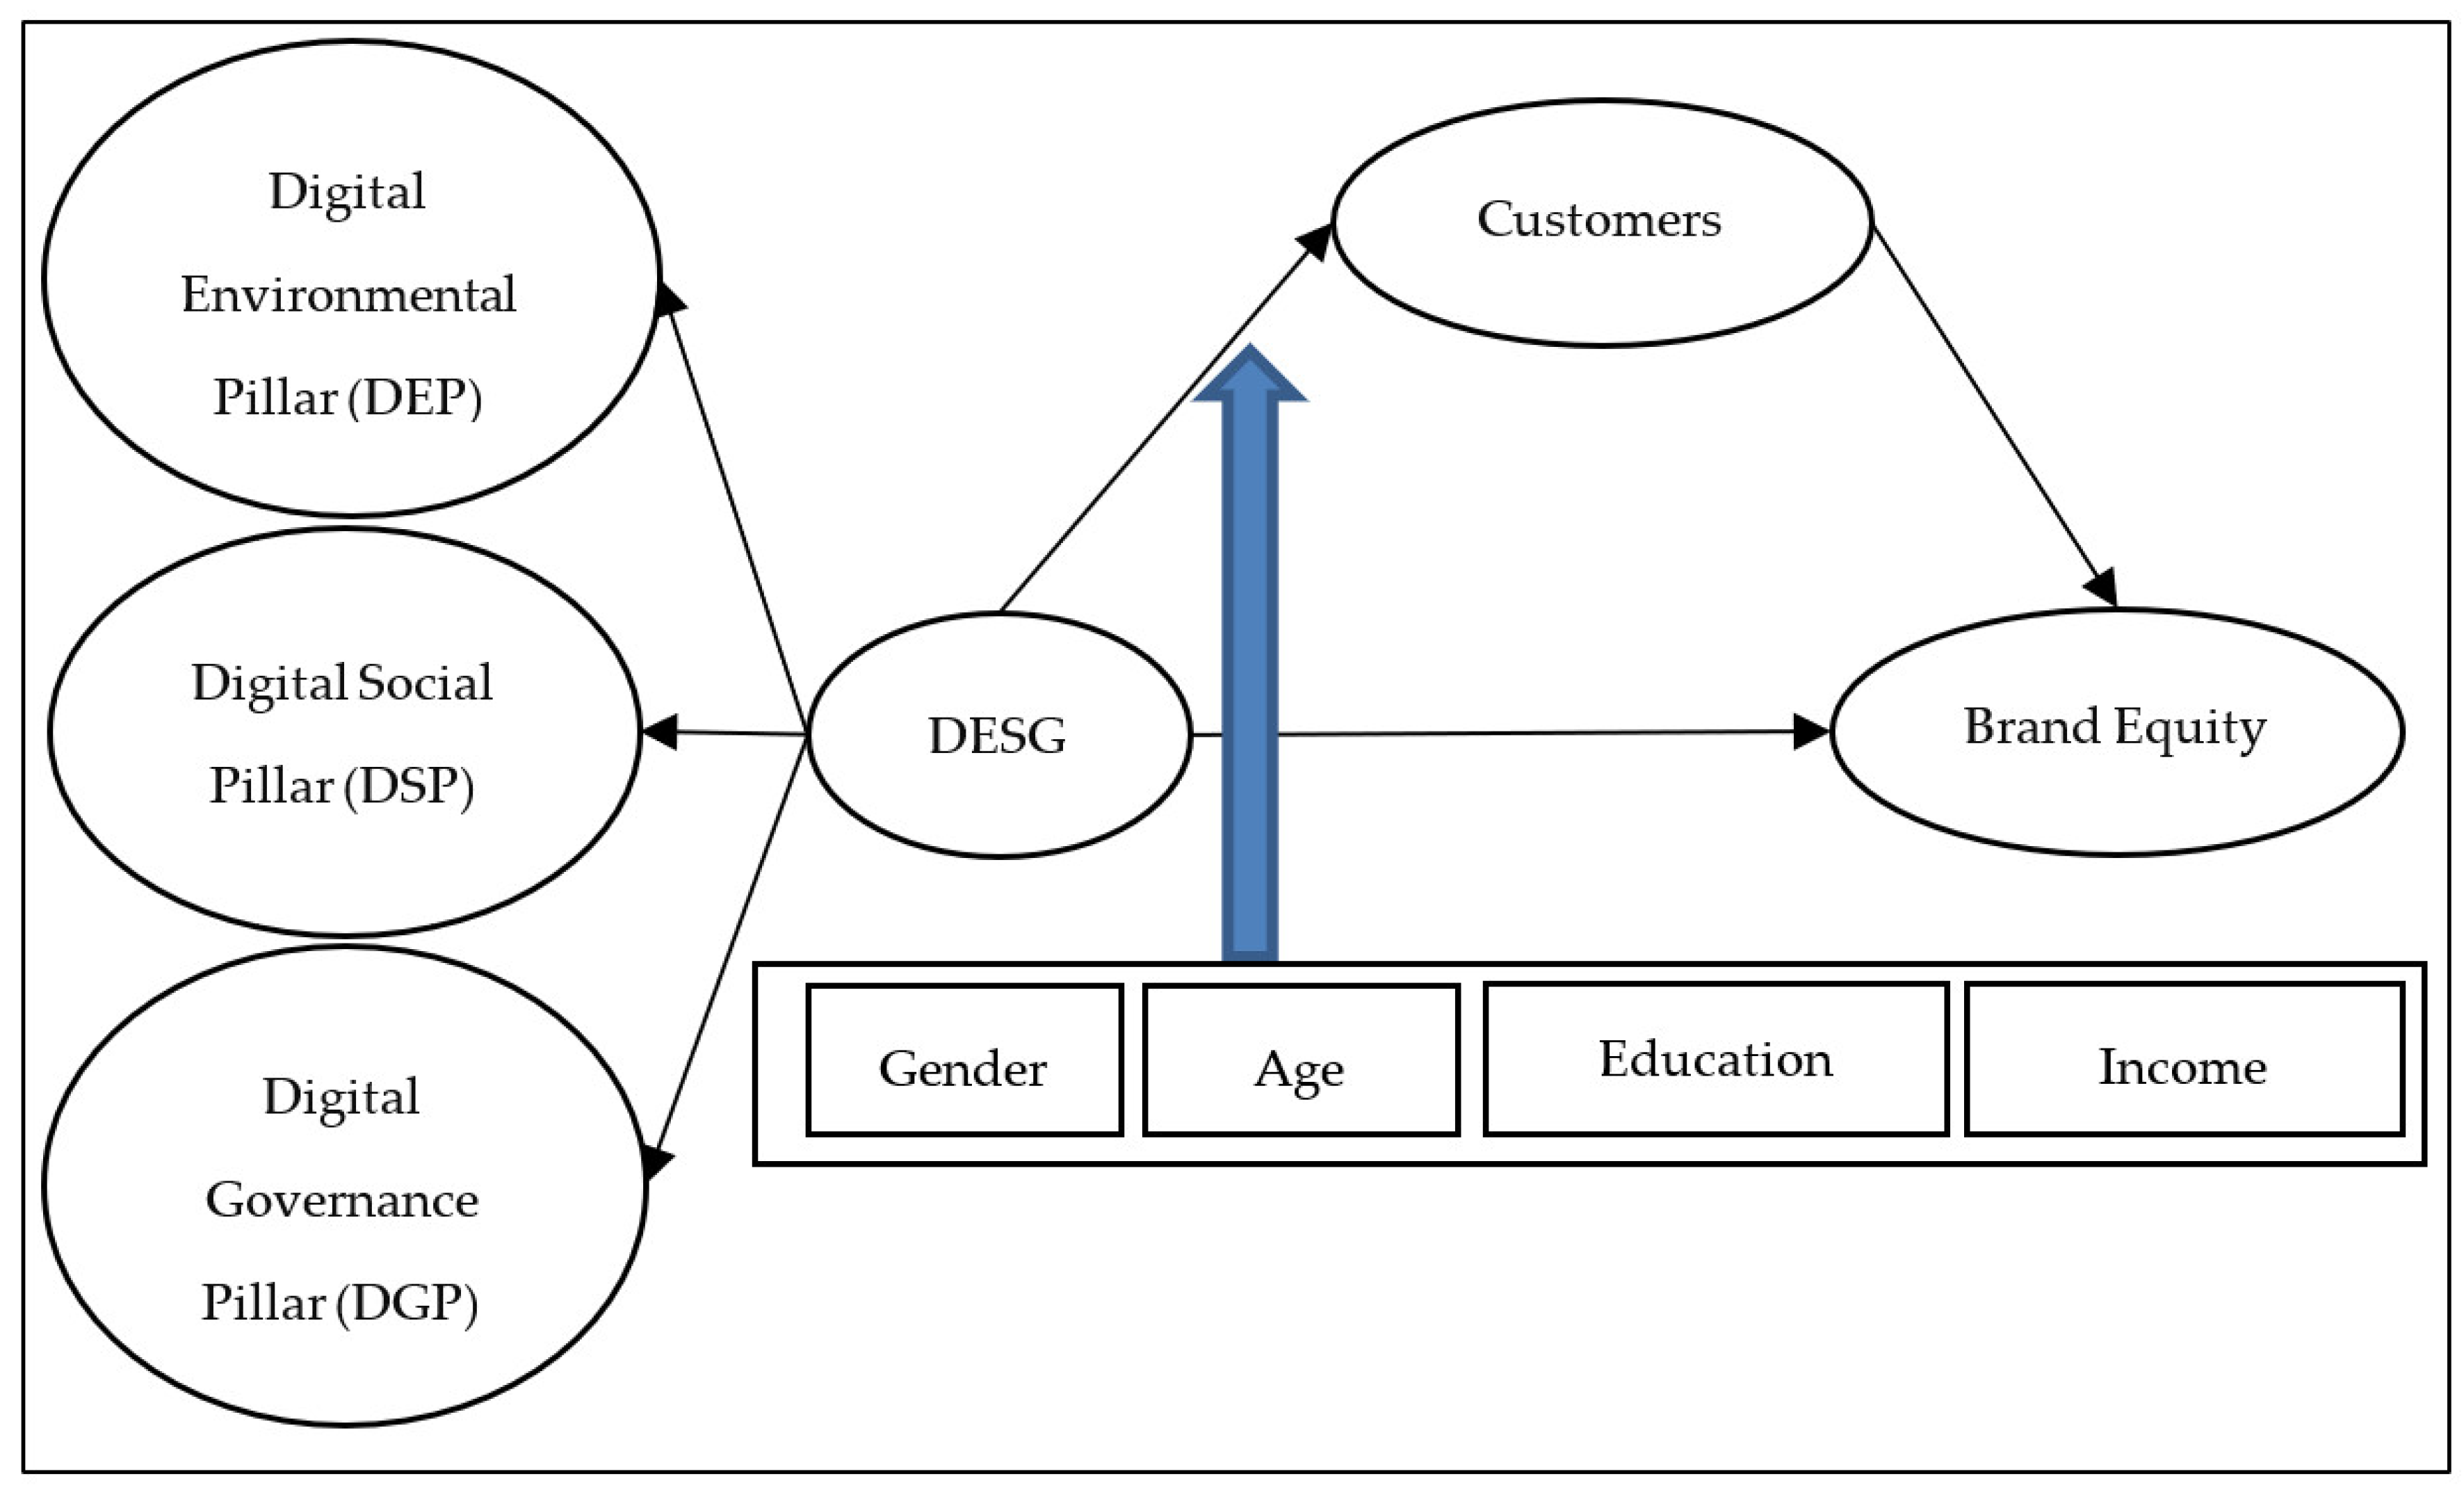
2.3. Hypothesis Development

This study explored the effect of DESG initiatives on customers’ attitudes and brand equity. DESG is a second-order construct which comprises three dimensions, namely, the digital environmental, social, and governance pillars. Kwak and Cha (2022) argued that firms’ ESG activities affect customers’ attitudes such as brand image [5]. Four out of five consumers say that they are inclined to purchase from a consumer brand that takes a pro-sustainability stance, according to the Sustainability Matters consumer research survey [4]. A company can gain a competitive edge through brands with a strong social presence. Social responsibility initiatives thus play a significant role in building a company’s reputation. Historical studies have shown how important ethical and responsible business practices are in fostering brand preferences and subsequently enhancing equity [28,29]. According to Jones [30], consumers’ attitudes toward brand equity are the result of co-creative interactions between customers and brands [30]. Customers’ positive perceptions of a company’s social responsibility efforts help to build brand equity. From a strategic standpoint, social responsibility actions can help develop and preserve a brand’s reputation, and can therefore be viewed as an investment from a strategic standpoint. Social responsibility programs benefit brand equity and a company’s reputation in a positive catalytic way [31]. Regarding socio-economic attributes, Smith et al. found that women pay greater attention to corporate ethical obligations than men [32]. Haski-Leventhal et al. also found that positive attitudes toward CSR initiatives vary according to age [33].
Based on the literature review, we proposed the conceptual framework as shown in Figure 1.
In line with this paradigm, the following hypotheses were developed:
H1. 
DESG significantly influences customers’ attitudes (CA).
H2. 
Customers’ attitudes (CA) significantly influence brand equity (BE).
H3. 
Customers’ attitudes (CA) positively mediate the relationships between DESG and brand equity (BE).
H4. 
Socio-economic attributes (gender, age, education level, and income) moderate the effect of DESG on customers’ attitudes (CA).

3. Research Methodology

3.1. Research Design and Data Collection

Quantitative research was conducted via an online questionnaire to investigate the effects of DESG on customers’ attitudes and purchase intentions. A retrospective methodology was used, and the respondents were prompted to share recent memories of their encounters with any firms or brands’ DESG initiatives, then answer questions concerning their perceptions, attitudes, and behaviors related to DESG initiatives. To verify the hypotheses proposed in the research and evaluate the significance of the theory as well as positive correlations between the variables according to Anderson and Gerbing’s (1988) suggestions regarding structural equation modeling (SEM), the minimum sample size for this type of study should be 150 [34]; 200 has been recommended as an acceptable sample size for SEM analysis [35]. SEM was mainly used in this study; therefore, the authors targeted a minimum sample size of 200 in the data collection process. To confirm the suitability of the samples, the respondents were screened primarily through screening questions. Initially, the respondents were asked the question, “Have you ever recognized any principles, plans, or strategies that reflect the philosophy of a business performed as a steward of environmental, social, and good governance initiatives via any software-based online infrastructure that facilitates interactions and transactions between you and firms or brands?”. The data of 254 Thai citizens were collected, and 212 samples were used for further analysis after the questionnaires were checked for completion.

3.2. Questionnaire Development

There were two sections in the questionnaire. Information on demographics and behavior was covered in the first part. Measurement items based on perceptions of DESG projects were included in the second segment. In this study, DESG consisted of three dimensions: the digital environmental, digital social, and digital governance pillars. The authors adopted and modified the questionnaire items from previous studies [36,37,38,39,40,41,42,43,44,45]. To evaluate the customers’ attitudes, the researchers considered a four-item scale from Herrero and Martínez (2020), and Chu and Chen (2019) [46,47]. Brand equity was evaluated using a four-item scale adopted and modified from the study of Christodoulides and Chernatony (2010) [26]. Responses were rated on a Likert scale of 1 to 5, with 5 representing “strongly agree or always” and 1 representing “strongly disagree or never”. Each construct in the questionnaire, which consisted of 20 measurement items, is listed in Table 1. For determining the validity of the questions, a director from the Creative Economy Agency (CEA), a senior lecturer from Bangkok University, and one expert from the Digital Economy Promotion Agency (DEPA) were invited to review the relevance and validity of the questions, including any potential ambiguities, to ensure that the goals and objectives of the present study were clear. The researcher invited the experts to use the Index of Item Objective Congruence (IOC) to examine the consistency between the research objectives and the survey items [48]. The range of the IOC values determined by the experts’ judgment was 0.80 to 1.00, which met the required level. The next step involved 30 undergraduate students at Bangkok University participating in a pilot test study. The internal consistency reliability was shown to be quite high, with a scale-wide Cronbach’s alpha coefficient ranging between 0.906 and 0.954 for the pilot test.

4. Results

4.1. Descriptive Statistics

Most respondents in the complete study sample were males (51.23%), aged 30 to 39 years (29.52%), single in terms of marital status (52.21%), held a bachelor’s degree (51.25%), and received a monthly salary of USD 559–978 (25.13%). Table 2 shows the demographics of the respondents.

4.2. Measurement Model

To examine the proposed hypotheses, a two-step modeling approach was adopted [49]. The first approach was evaluating the measurement model through confirmatory factor analysis (CFA). Both convergent and discriminant validities were tested to ensure that our measurement constructs adequately explained the proposed conceptual framework. As illustrated earlier, the ESG is a higher-order construct with three dimensions, namely, the DEP (four items), DSP (four items), and DGP (four items) constructs. CA and BE were measured by four items each. Cronbach’s alpha was found to be between 0.848 and 0.904. The results of the measurement model are summarized in Table 3 and Table 4.
Table 3 demonstrates that, when the six constructs are analyzed, the model fit is good (Chi-square = 383.284; df = 164; CMIN/df = 2.337; GFI = 0.911; NFI = 0.958; TLI = 0.985; CFI = 0.941; RMSEA = 0.039). Item loading (standardized estimates), average variance extracted (AVE), and composite reliability (CR) are all measures of convergent validity. Hair et al. (2014) [50] stated that these metrics should have an AVE of >0.5 and a CR of >0.7. This shows that the convergent validity is acceptable. The results of the discriminant validity test are given in Table 4. The square root of each construct’s AVE was larger than the estimates of their inter-construct correlations; therefore, the study had satisfactory discriminant validity.

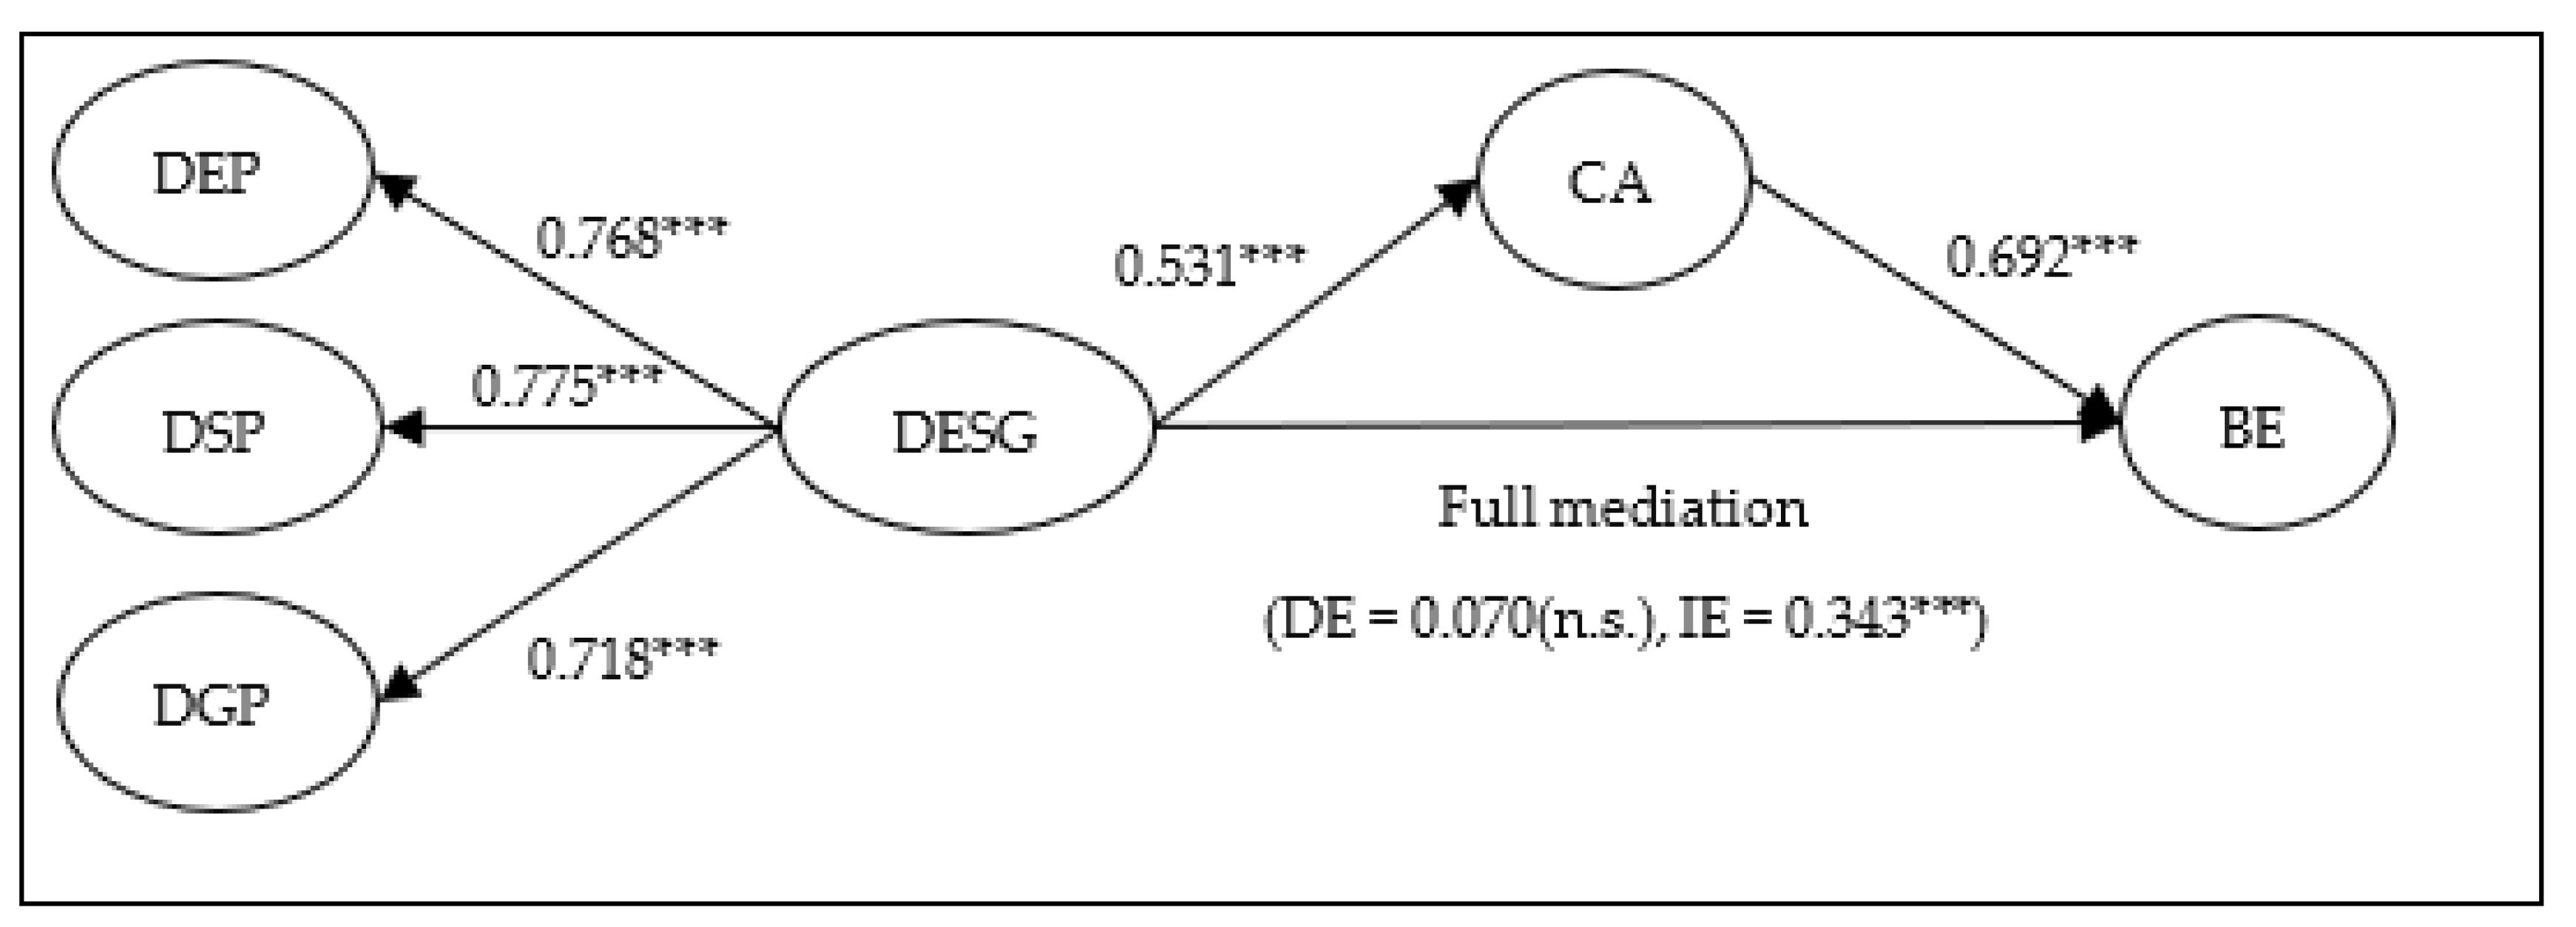
4.3. Structural Model and Hypotheses Testing

After validating the measurement model, the structural model was examined to test our proposed hypotheses. The path model and relationships of all constructs are illustrated in Figure 2. The results of the path analysis demonstrated the adequate fit of model to the data.
The hypothesized path model outcomes indicate that the fit of the model to the data was adequate (Chi-square = 383.284; df = 164; CMIN/df = 2.337; GFI = 0.911; NFI = 0.958; TLI = 0.985; CFI = 0.941; RMSEA = 0.039). Table 5 shows the results of testing the hypotheses, which indicated significance for two hypotheses. Specifically, the outcomes supported the hypotheses concerning the relationship between DESG and CA (H1: b = 0.531, t-value = 5.403, sig < 0.001), and between CA and BE (H2: b = 0.692, t-value = 6.112, sig < 0.001).
In order to test the mediating effect of DESG on BE via CA (H3), the Baron–Kenny approach was used [51]. The authors started by testing the relationships among DESG, CA, and BE, which were found to be significantly related. Next, whether the relationship between DESG and BE was significantly reduced when the effect of CA was controlled into the model was tested via a bootstrapping technique. The results of the mediation analysis with bootstrapping showed that DESG has no significant direct effect on BE (0.070; 95% CI [−0.048, 0.200]), but has a significant indirect effect on BE via CA (0.343; p < 0.001; 95% CI [0.211, 0.479]), thus indicating that full mediation is confirmed. The results of the mediation analysis with bootstrapping are summarized in Table 6.
To test H4 and investigate the mediation effect of DESG on CA, the moderating variables of age, education, and income were initially converted into binary variables by the authors (older vs. younger age group, high vs. low education level, and high vs. low income).
Critical ratios were developed in the study to evaluate the moderation hypothesis. The ratios were established for variance in the factor loadings between groups of socio-economic attributes using AMOS, a statistical package provided by Gaskin and Lim (2018) for evaluating moderation effects by means of regression weights and critical ratios for different parameters [52]. The authors explored the related models for each binary group separately and compared the regression weights and critical ratios for differences among the groups (see Table 7).
Table 7 shows that DESG had a significant and positive effect on CA for both male (β = 0.515, p < 0.001) and female (β = 0.541, p < 0.001) participants. Nevertheless, the authors found no statistically significant difference between males and females (Z score = 1.472). In terms of age, DESG had a significant and positive effect on CA in both younger (β = 0.592, p < 0.001) and older (β = 0.398, p < 0.001) people. The outcomes show a stronger impact of DESG on CA in the younger group compared with the older group (Z-score = 4.587 ***). For education, DESG significantly and positively impacted CA among groups with an educational level below a bachelor’s degree (β = 0.318, p < 0.001) and those with a bachelor’s degree or higher (β = 0.567, p < 0.001). The outcomes revealed the strong impact of DESG on CA for the group with a higher education level compared with those with lower education (Z-score = 4.789 ***). Regarding income, the authors observed a non-statistically significant difference between high- and low-income groups (Z score = 1.311). On the basis of the results of the moderating effect, H5 is supported.

5. Discussion

The purposes of this study were to examine the impact of DESG on customers’ attitude and brand equity, and to examine how the impact of DESG on customers’ attitudes varied in accordance with the differences in demographic factors such as gender, age, education, and income. The outcomes revealed that DESG has both a direct positive effect on customers’ attitudes and an indirect positive effect on brand equity via customers’ attitudes. Our findings are consistent with those of a previous study by Koh et al. (2022), showing that perceived DESG had direct positive effects on consumers’ perceptions such as brand trustworthiness, brand image, and perceived quality [1]. Although the findings of our study did not show a direct effect of DESG on brand equity, the mediation analysis confirmed that customers’ attitudes positively mediated the relationship between DESG and brand equity. In other words, DESG initiatives can strengthen customers’ positive attitudes towards firms or brands, which subsequently lead to higher levels of brand equity. Regarding the three dimensions of DESG, the digital social dimension played the strongest role in explaining DESG, followed by the digital environmental and digital governance dimensions. Due to their failure to inform the public of their DESG efforts, many organizations with DESG initiatives have lowered their corporate image. It is crucial to communicate firms’ DESG efforts, although various demographics respond to ESG programs in different ways [53]. Our research provides useful information regarding which components of DESG firms should prioritize when communicating with the public. Prior to developing an ESG communication strategy, businesses must comprehend the relative importance of each component to various demographics. Finding out how much different demographic groups care about firms’ digital environmental, social, and governance initiatives also provides marketers with very useful information to effectively undertake their DESG communications. According to the empirical data of this study, the findings are inconsistent with those of a previous study [33,54], which found a correlation between gender and perceptions of what the ethical climate should be, with females showing significantly more favorable attitudes toward ethical behavior than males. We found that there was no statistically significant difference between men and women when it came to the DESG efforts of firms. The results of the moderation analysis confirmed that the well-educated younger generation seemed to be more concerned about firms’ DESG efforts. This finding differs from that of a prior study by Haski-Leventhal et al., which indicated that older age groups rated transcendent ideals and favorable social responsibility attitudes more highly than younger age groups [33]; however, our findings are in line with those of Kim et al., who showed that the younger generation acknowledged the importance of ESG initiatives when selecting e-commerce service providers [55]. About 33% of millennials use investments that include ESG aspects frequently or solely, according to the Harris Poll conducted for CNBC, compared with 19% of Gen Z, 16% of Gen X, and 2% of Baby Boomers [56]. Interestingly, groups with a higher formal education level seem to possess a more positive attitude towards firms’ DESG initiatives than those with a lower educational level. This finding is consistent with Karabašević et al., who showed that the level of awareness and comprehension of principles of overall sustainability and their implementation in the country’s territory increases with education level [57].
The results of this study have numerous managerial implications. Initially, firms should focus more on DESG as one of the vital strategies to drive positive customer attitudes and to strengthen their brand equity. The results of the study show that customers’ attitudes positively increase when customers perceive firms’ DESG initiatives, subsequently leading to enhanced brand equity. Secondly, firms need to take the different impacts of digital environment, social, and governance initiatives into account. Our findings confirmed that the environment, social, and governance concepts have an unequal effect on customers’ attitudes. Thirdly, the findings of this study provide specific guidelines for firms to help them use different DESG communication strategies depending on the socio-economic groups of their customers. The results of this research revealed that the importance of a firm’s DESG activities increases with the customers’ formal education level. As a result, it is crucial to promote DESG initiatives through communication channels primarily used by customers with high levels of education. Moreover, the results suggested that the impact of DESG on customer’s attitude was stronger for younger groups than older ones. Therefore, firms should consider whether the DESG initiatives are correctly matched with the targeted customer groups when promoting DESG initiatives.

6. Conclusions

The aims of this study were to explore the impact of DESG on customers’ attitudes and brand equity, and the moderating effect of the socio-economic characteristics of the customers such as gender, age, formal education level, and income. The results revealed that perceived DESG was found to be a significant determinant of CA. The results of the mediation analysis also revealed that consumers’ attitudes fully mediate the effect of DESG on BE. Socio-economic factors influence not only the customers’ choice of a firm’s product or brand, but also the customers’ attitudes towards firms’ DESG initiatives. Two socio-economic attributes (age and formal education) were found to moderate the effect of DESG on CA. To enact DESG, businesses must be concerned about how their own activities might cause such consequences, in addition to being aware of the different potential implications of digital technology on customers, stakeholders, the environment, and society. Therefore, DESG culture must ensure that firms which use technology are held responsible for any negative effects that come from their work on developing, using, evaluating, and improving the technology. People must be given the freedom to apply these concepts to their daily tasks if DESG principles are to be implemented throughout the entire organization. In summary, DESG is a new yet developing field. It is time to integrate these ideas into common corporate terminology.
There are a few limitations present in the study which must be discussed. Firstly, this study comprised only a few constructs that we expected to be impacted by DESG. Future research could include more constructs such as eWOM and purchase intentions, and test these with empirical data. Additionally, increased ESG action is linked to higher costs and cash flows from those initiatives. Financial considerations including the cost of equity, the cost of capital, and cash flow should be considered in further analyses of the value of DESG activities. Secondly, the samples were collected in Thailand. The generalization of the outcomes should be carried out prudently. Dissimilar cultural characteristics may affect customers’ attitudes towards DESG. The collection and comparison of data across countries is a potential area for future research.

Author Contributions

Conceptualization, W.P. and S.T.; Data curation, W.P. and S.T.; Formal analysis, W.P. and S.T.; Funding acquisition, W.P.; Investigation, W.P. and S.T.; Methodology, W.P. and S.T.; Project administration, S.T.; Resources, W.P.; Validation, W.P. and S.T.; Visualization, S.T.; Writing—original draft, W.P. and S.T.; Writing—review & editing, S.T. All authors have read and agreed to the published version of the manuscript.

Funding

This research received no external funding.

Institutional Review Board Statement

This study was carried out through the approval of the Ethics Committee for Human Research, Bangkok University (Reference no. 416312002), in accordance with the Declaration of Helsinki.

Data Availability Statement

The datasets generated during and/or analyzed during the current study are not publicly available due to IRB stipulations but are available from the corresponding author on reasonable request.

Conflicts of Interest

The authors declare no conflict of interest.

References

  1. Koh, H.-K.; Burnasheva, R.; Suh, Y.G. Perceived ESG (Environmental, Social, Governance) and Consumers’ Responses: The Mediating Role of Brand Credibility, Brand Image, and Perceived Quality. Sustainability 2022, 14, 4515. [Google Scholar] [CrossRef]
  2. Sawatdipong, J. Thailand–ESG Revolution: Are You Prepared? In-House Community. 2021. Available online: https://www.inhousecommunity.com/article/thailand-esg-revolution-prepared/ (accessed on 1 July 2022).
  3. dos Santos, M.C.; Pereira, F.H. ESG performance scoring method to support responsible investments in port operations. Case Stud. Transp. Policy 2022, 10, 664–673. [Google Scholar] [CrossRef]
  4. Smartest Energy. Sustainability Matters Consumer Research Report. 2015. Available online: https://www.smartestenergy.com/en_gb/info-hub/sustainability-matters-report/ (accessed on 30 June 2022).
  5. Kwak, M.-K.; Cha, S.-S. Can Coffee Shops That Have Become the Red Ocean Win with ESG? J. Distrib. Sci. 2022, 20, 83–93. [Google Scholar] [CrossRef]
  6. Ritchie, H. Cars, Planes, Trains: Where do CO2 Emissions from Transport Come from? Available online: https://ourworldindata.org/co2-emissions-from-transport (accessed on 12 January 2022).
  7. Aksoy, L.; Buoye, A.J.; Fors, M.; Keiningham, T.L.; Rosengren, S. Environmental, Social and Governance (ESG) metrics do not serve services customers: A missing link between sustainability metrics and customer perceptions of social innovation. J. Serv. Manag. 2022, 33, 565–577. [Google Scholar] [CrossRef]
  8. Khattak, A.; Yousaf, Z. Digital Social Responsibility towards Corporate Social Responsibility and Strategic Performance of Hi-Tech SMEs: Customer Engagement as a Mediator. Sustainability 2021, 14, 131. [Google Scholar] [CrossRef]
  9. Whitelock, V.G. Environmental social governance management: A theoretical perspective for the role of disclosure in the supply chain. Int. J. Bus. Inf. Syst. 2015, 18, 390. [Google Scholar] [CrossRef]
  10. Whitelock, V.G. Multidimensional environmental social governance sustainability framework: Integration, using a purchasing, operations, and supply chain management context. Sustain. Dev. 2019, 27, 923–931. [Google Scholar] [CrossRef]
  11. Mitra, S.; Pittaluga, E. Digital Transformation and Environmental, Social & Governance: A Perfect Synergy for Today’s Rapidly Evolving World. Treasury and Trade Solutions. 2021. Available online: https://www.citibank.com/tts/insights/assets/docs/articles/2063965_ESG-Article.pdf (accessed on 1 July 2022).
  12. Valdez, M. Top 3 Reasons Why Digital Transformation Is Key to The ‘E’ In ESG. 2022. Available online: https://opportune.com/insights/article/top-3-reasons-why-digital-transformation-is-key-to-the-e-in-esg/ (accessed on 29 June 2022).
  13. Welchman, L. Managing Chaos: Digital Governance by Design; Rosenfeld Media: New York, NY, USA, 2015. [Google Scholar]
  14. Runde, D.; Ramanujam, S. Global Digital Governance: Here’s What You Need to Know. 2021. Available online: https://www.csis.org/analysis/global-digital-governance-heres-what-you-need-know (accessed on 30 June 2022).
  15. Frick, T. Where Do Digital Emissions Come From? 2022. Available online: https://www.mightybytes.com/blog/author/timfrick/ (accessed on 15 July 2022).
  16. Frick, T. Understanding Social Digital Responsibility. 2022. Available online: https://www.mightybytes.com/blog/social-digital-responsibility/ (accessed on 15 July 2022).
  17. Raimo, N.; Caragnano, A.; Mariani, M.; Vitolla, F. Integrated reporting quality and cost of debt financing. J. Appl. Account. Res. 2021, 23, 122–138. [Google Scholar] [CrossRef]
  18. Raimo, N.; Caragnano, A.; Zito, M.; Vitolla, F.; Mariani, M. Extending the benefits of ESG disclosure: The effect on the cost of debt financing. Corp. Soc. Responsib. Environ. Manag. 2021, 28, 1412–1421. [Google Scholar] [CrossRef]
  19. Apergis, N.; Poufinas, T.; Antonopoulos, A. ESG scores and cost of debt. Energy Econ. 2022, 112, 106186. [Google Scholar] [CrossRef]
  20. Ramirez, A.G.; Monsalve, J.; González-Ruiz, J.D.; Almonacid, P.; Peña, A. Relationship between the Cost of Capital and Environmental, Social, and Governance Scores: Evidence from Latin America. Sustainability 2022, 14, 5012. [Google Scholar] [CrossRef]
  21. Zhao, C.; Guo, Y.; Yuan, J.; Wu, M.; Li, D.; Zhou, Y.; Kang, J. ESG and Corporate Financial Performance: Empirical Evidence from China’s Listed Power Generation Companies. Sustainability 2018, 10, 2607. [Google Scholar] [CrossRef]
  22. Friede, G.; Busch, T.; Bassen, A. ESG and financial performance: Aggregated evidence from more than 2000 empirical studies. J. Sustain. Financ. Investig. 2015, 5, 210–233. [Google Scholar] [CrossRef]
  23. Hsu, Y.; Bui, T.H.G. Consumers’ Perspectives and Behaviors towards Corporate Social Responsibility—A Cross-Cultural Study. Sustainability 2022, 14, 615. [Google Scholar] [CrossRef]
  24. Aaker, D.A. Measuring Brand Equity Across Products and Markets. Calif. Manag. Rev. 1996, 38, 102–120. [Google Scholar] [CrossRef]
  25. Keller, K.L.; Parameswaran, M.G.; Isaac, J. Strategic Brand Management: Building, Measuring, and Managing Brand Equity; Pearson Education India: Noida, India, 2011. [Google Scholar]
  26. Christodoulides, G.; De Chernatony, L. Consumer-based brand equity conceptualisation and measurement: A literature review. Int. J. Mark. Res. 2010, 52, 43–66. [Google Scholar] [CrossRef]
  27. Torres, A.; Bijmolt, T.H.; Tribó, J.A.; Verhoef, P. Generating global brand equity through corporate social responsibility to key stakeholders. Int. J. Res. Mark. 2012, 29, 13–24. [Google Scholar] [CrossRef]
  28. Hur, W.-M.; Kim, H.; Woo, J. How CSR Leads to Corporate Brand Equity: Mediating Mechanisms of Corporate Brand Credibility and Reputation. J. Bus. Ethics 2013, 125, 75–86. [Google Scholar] [CrossRef]
  29. Lai, C.-S.; Chiu, C.-J.; Yang, C.-F.; Pai, D.-C. The Effects of Corporate Social Responsibility on Brand Performance: The Mediating Effect of Industrial Brand Equity and Corporate Reputation. J. Bus. Ethics 2010, 95, 457–469. [Google Scholar] [CrossRef]
  30. Jones, R. Finding sources of brand value: Developing a stakeholder model of brand equity. J. Brand Manag. 2005, 13, 10–32. [Google Scholar] [CrossRef]
  31. Sharma, R.; Jain, V. CSR, Trust, Brand Loyalty and Brand Equity: Empirical Evidences from Sportswear Industry in the NCR Region of India. Metamorphosis 2019, 18, 57–67. [Google Scholar] [CrossRef]
  32. Smith, W.J.; Wokutch, R.E.; Harrington, K.V.; Dennis, B.S. An Examination of the Influence of Diversity and Stakeholder Role on Corporate Social Orientation. Bus. Soc. 2001, 40, 266–294. [Google Scholar] [CrossRef]
  33. Haski-Leventhal, D.; Pournader, M.; McKinnon, A. The Role of Gender and Age in Business Students’ Values, CSR Attitudes, and Responsible Management Education: Learnings from the PRME International Survey. J. Bus. Ethics 2015, 146, 219–239. [Google Scholar] [CrossRef]
  34. Anderson, J.C.; Gerbing, D.W. Structural equation modeling in practice: A review and recommended two-step approach. Psychol. Bull. 1988, 103, 411–423. [Google Scholar] [CrossRef]
  35. Kline, R.B. Principles and Practice of Structural Equation Modeling; Guilford Publications: New York, NY, USA, 2015. [Google Scholar]
  36. Moisescu, O.I. Development and Validation of a Measurement Scale for Customers’ perceptions of Corporate Social Responsibility. Manag. Mark. J. 2015, 13, 311–332. Available online: https://www.mnmk.ro/documents/2016_X1/Articol_4.pdf (accessed on 3 July 2022).
  37. Maignan, I. Consumers’ Perceptions of Corporate Social Responsibilities: A Cross-Cultural Comparison. J. Bus. Ethics 2001, 30, 57–72. [Google Scholar] [CrossRef]
  38. De Los Salmones, M.D.M.G.; Crespo, A.H.; Del Bosque, I.R. Influence of Corporate Social Responsibility on Loyalty and Valuation of Services. J. Bus. Ethics 2005, 61, 369–385. [Google Scholar] [CrossRef]
  39. Mohr, L.A.; Webb, D.J. The effects of corporate social responsibility and price on consumer responses. J. Consum. Aff. 2005, 39, 121–147. [Google Scholar] [CrossRef]
  40. Becker-Olsen, K.L.; Taylor, C.R.; Hill, R.P.; Yalcinkaya, G. A Cross-Cultural Examination of Corporate Social Responsibility Marketing Communications in Mexico and the United States: Strategies for Global Brands. J. Int. Mark. 2011, 19, 30–44. [Google Scholar] [CrossRef]
  41. Wagner, T.; Bicen, P.; Hall, Z.R. The dark side of retailing: Towards a scale of corporate social irresponsibility. Int. J. Retail Distrib. Manag. 2008, 36, 124–142. [Google Scholar] [CrossRef]
  42. Turker, D. Measuring Corporate Social Responsibility: A Scale Development Study. J. Bus. Ethics 2008, 85, 411–427. [Google Scholar] [CrossRef]
  43. Öberseder, M.; Schlegelmilch, B.B.; Murphy, P.E.; Gruber, V. Consumers’ Perceptions of Corporate Social Responsibility: Scale Development and Validation. J. Bus. Ethics 2014, 124, 101–115. [Google Scholar] [CrossRef]
  44. Pérez, A.; Rodríguez del Bosque, I. Measuring CSR Image: Three Studies to Develop and to Validate a Reliable Measurement Tool. J. Bus. Ethics 2013, 118, 265–286. [Google Scholar] [CrossRef]
  45. Mandhachitara, R.; Poolthong, Y. A model of customer loyalty and corporate social responsibility. J. Serv. Mark. 2011, 25, 122–133. [Google Scholar] [CrossRef]
  46. Salmones, M.D.M.G.-D.L.; Herrero, A.; Martínez, P. Determinants of Electronic Word-of-Mouth on Social Networking Sites About Negative News on CSR. J. Bus. Ethic 2020, 171, 583–597. [Google Scholar] [CrossRef]
  47. Chu, S.-C.; Chen, H.-T. Impact of consumers’ corporate social responsibility-related activities in social media on brand attitude, electronic word-of-mouth intention, and purchase intention: A study of Chinese consumer behavior. J. Consum. Behav. 2019, 18, 453–462. [Google Scholar] [CrossRef]
  48. Rovinelli, R.J.; Hambleton, R.K. On the use of content specialists in the assessment of criterion-referenced test item validity. Tijdschr. Voor Onderwijsres. 1976, 2, 49–60. [Google Scholar]
  49. Kline, R.B. Software Review: Software Programs for Structural Equation Modeling: Amos, EQS, and LISREL. J. Psychoeduc. Assess. 1998, 16, 343–364. [Google Scholar] [CrossRef]
  50. Hair, J.F.; Marcelo, G.; Patel, V. AMOS covariance-based structural equation modeling (CB-SEM): Guidelines on its application as a marketing research tool. Braz. J. Mark. 2014, 13, 44–55. [Google Scholar] [CrossRef]
  51. Baron, R.M.; Kenny, D.A. The moderator–mediator variable distinction in social psychological research: Conceptual, strategic, and statistical considerations. J. Pers. Soc. Psychol. 1986, 51, 1173–1182. [Google Scholar] [CrossRef]
  52. Gaskin, J.; Lim, J. Multigroup Analysis-AMOS Plugin. Gaskination’s StatWiki. 2018. Available online: http://statwiki.kolobkreations.com/index.php?title=Main_Page (accessed on 30 November 2020).
  53. Reptrak. ESG By Numbers: Who Cares about it, How Much, and Why. 2020. Available online: https://f.hubspotusercontent20.net/hubfs/2963875/ESG%20by%20Numbers.pdf (accessed on 25 June 2022).
  54. Luthar, H.K.; DiBattista, R.A.; Gautschi, T. Perception of what the ethical climate is and what it should be: The role of gender, academic status, and ethical education. J. Bus. Ethics 1997, 16, 205–217. [Google Scholar] [CrossRef]
  55. Kim, J.; Kim, M.; Im, S.; Choi, D. Competitiveness of E Commerce Firms through ESG Logistics. Sustainability 2021, 13, 11548. [Google Scholar] [CrossRef]
  56. Adamczyk, A. Millennials spurred growth in sustainable investing for years. In Now, All Generations are Interested in ESG Options; CNBC: Englewood Cliffs, NJ, USA, 2021; Available online: https://www.cnbc.com/2021/05/21/millennials-spurred-growth-in-esg-investing-now-all-ages-are-on-board.html (accessed on 28 June 2022).
  57. Karabasevic, D.; Petrović, G.B.; Maksimovic, M.; Darjan, K.; Gordana, P.; Mlađan, M. The impact of the levels of education on the perception of corporate social responsibility. Posl. Èkon. 2016, 10, 106–117. [Google Scholar] [CrossRef]
Figure 1. The study’s conceptual framework.
Sustainability 14 10480 g001
Figure 2. SEM results. Notes: *** p < 0.001; n.s. = not significant. DE, direct effect; IE, indirect effect. Fit indices: Chi-square = 383.284; df = 164; CMIN/df = 2.337; GFI = 0.911; NFI = 0.958; TLI = 0.985; CFI = 0.941; RMSEA = 0.039.
Sustainability 14 10480 g002
Table 1. Questionnaire constructs and variables.
ConstructsItemsObserved Variables
Any software-based online infrastructures that facilitate interactions and transactions between you and the firm or bran
Digital environmental
pillar (DEP)
DEP1The firm (or brand) [NAME] makes every effort to minimize or eliminate harmful effects on the environment.
DEP2The firm (or brand) [NAME] reduces resource consumption as much as possible without harming the environment.
DEP3The firm (or brand) [NAME] actively pursues using environmentally friendly materials.
DEP4The firm (or brand) [NAME] focuses on the efficient administration of recycling and trash disposal activities.
Digital social
pillar (SP)
DSP1The firm (or brand) [NAME] respects social norms, traditions, and culture.
DSP2The firm (or brand) [NAME] benefits people’s long-term welfare and quality of life in society.
DSP3The firm (or brand) [NAME] contributes to social and economic development.
DSP4The firm (or brand) [NAME] supports charities and social initiatives that target underprivileged groups.
Digital governance
pillar (DGP)
DGP1The firm (or brand) [NAME] fully complies with the law when carrying out its operations.
DGP2The firm (or brand) [NAME] is concerned about carrying out its duties toward its partners and stockholders.
DGP3The ethical principles of the firm (or brand) [NAME] have priority over achieving economic performance.
DGP4The firm (or brand) [NAME] makes every effort to prevent and avoid corruption in its interactions with the country.
Customer attitudes (CA)CA1My attitude toward the firm (or brand) [NAME] is good.
CA2My attitude toward the firm (or brand) [NAME] is positive.
CA3My attitude toward the firm (or brand) [NAME] is favorable.
CA4In general, how satisfied are you with the firm (or brand) [NAME]?
Brand equity (BE)BE1Even though they are identical, it makes sense to purchase this brand instead of any other.
BE2I would choose to purchase this brand even if it has the same attributes as another brand.
BE3I would rather purchase brand [NAME] if there was another brand that was equally as nice.
BE4It would appear wiser to buy this brand if another brand did not differ from it in any manner.
Table 2. Descriptive statistics.
ItemDescriptionSample%
GenderMale10951.23
Female10348.77
AgeLess than 202210.38
20–295224.65
30–396329.52
40–493014.21
50–592813.42
Above 60177.82
Marital statusSingle11152.21
Married9946.58
Others31.21
EducationBelow bachelor’s degree167.52
Bachelor’s degree10951.25
Master’s degree or PhD8741.23
Income (USD)Below 5594722.21
559–9785325.13
979–13975224.62
1397–2794 4119.52
Above 2794188.52
Note: n = 212; missing data are not shown or calculated in the table; USD 1 = THB 35.78.
Table 3. Factor loadings, composite reliability (CR), average variance extracted (AVE), and Cronbach’s alpha.
ConstructItem CodeItem LoadingsCRAVECronbach’s Alpha
Digital environmental pillar (DEP)DEP10.7080.8820.6540.904
DEP20.711 ***
DEP30.931 ***
DEP40.861 ***
Digital social
pillar (DSP)
DSP10.7440.8810.6500.883
DSP20.798 ***
DSP30.882 ***
DSP40.796 ***
Digital governance
pillar (DGP)
DGP10.7800.8660.6170.860
DGP20.767 ***
DGP30.810 ***
DGP40.784 ***
DESGDEP0.7680.7300.569-
DSP0.775 ***
DGP0.718 ***
Customer attitudes (CA)CA10.7990.8570.5990.852
CA20.766 ***
CA30.763 ***
CA40.768 ***
Brand equity (BE)BE10.7560.8690.6250.848
BE20.726 ***
BE30.855 ***
BE40.819 ***
Notes: DEP1, DSP1, DGP1, CA1, and BE1 are fixed parameters; ESG is a second-order construct of DEP, DSP, and DGP; *** p < 0.001. Fit indices: Chi-square = 383.284; df = 164; CMIN/df = 2.337; GFI = 0.911; NFI = 0.958; TLI = 0.985; CFI = 0.941; RMSEA = 0.039.
Table 4. Discriminant validity.
ESGCABE
ESG0.809
CA0.5320.807
BE0.5480.4740.785
Notes: The diagonal elements in bold in the table denote the AVE square root for every construct used in the study. Non-diagonal elements denote the correlations between the constructs. Only correlations and the AVE square root of the first-order constructs are shown in the table.
Table 5. Structural parameter estimates.
HypothesesRelationshipEstimate (b)Result
H1DESG → CA0.531 ***Supported
H2CA → BE0.692 ***Supported
Notes: R2 (Customer Attitudes) = 0.511; R2 (Brand Equity) = 0.402; *** p < 0.001.
Table 6. The results of the mediation analysis.
HypothesisDirect EffectIndirect EffectResult
H3: Customers’ attitudes (CA) positively mediate between the relationships between DESG and brand equity (BE).0.070 (n.s)0.343 (***)Full mediation
Note: *** p < 0.001; n.s. = not significant.
Table 7. Path-wise moderation effect: group differences.
Structural Path and Direction
CA ← DESG
Result
EstimatePz-Score
GenderMale0.5150.0001.472Not supported
Female0.5410.000
AgeYounger (≥30 years old)0.5920.0004.587 ***Supported
Older (above 30 years old)0.3980.000
EducationLow (below bachelor’s degree)0.3180.0004.789 ***Supported
High (bachelor’s degree or above)0.5670.000
IncomeLow (below USD 1162)0.5270.0001.311Not supported
High (more than USD 1162)0.5390.000
Note: *** p < 0.001.
Publisher’s Note: MDPI stays neutral with regard to jurisdictional claims in published maps and institutional affiliations.

