
Spatial Multi-Criteria Analysis for Road Segment Cycling Suitability Assessment


Abstract
:1. Introduction
1.1. Framework
- Respond to citizens’, companies’ and society’s basic needs of access and development in a way that is safe and compatible with human health and environment preservation, while promoting equity in each generation and between generations.
- Be achievable, operating equitably and effectively, offering different transport choices, supporting a competitive economy and a balanced regional development.
- Limit emissions and waste to the planet’s absorption capacity level using renewable energy at its generation rate and non-renewable energy at its substitution rate, minimizing the impact on land use and noise pollution.
1.2. EU and Portuguese Cycling Vision
1.3. Bikeability
1.4. Road Slope
1.5. Spatial Multi-Criteria Analysis
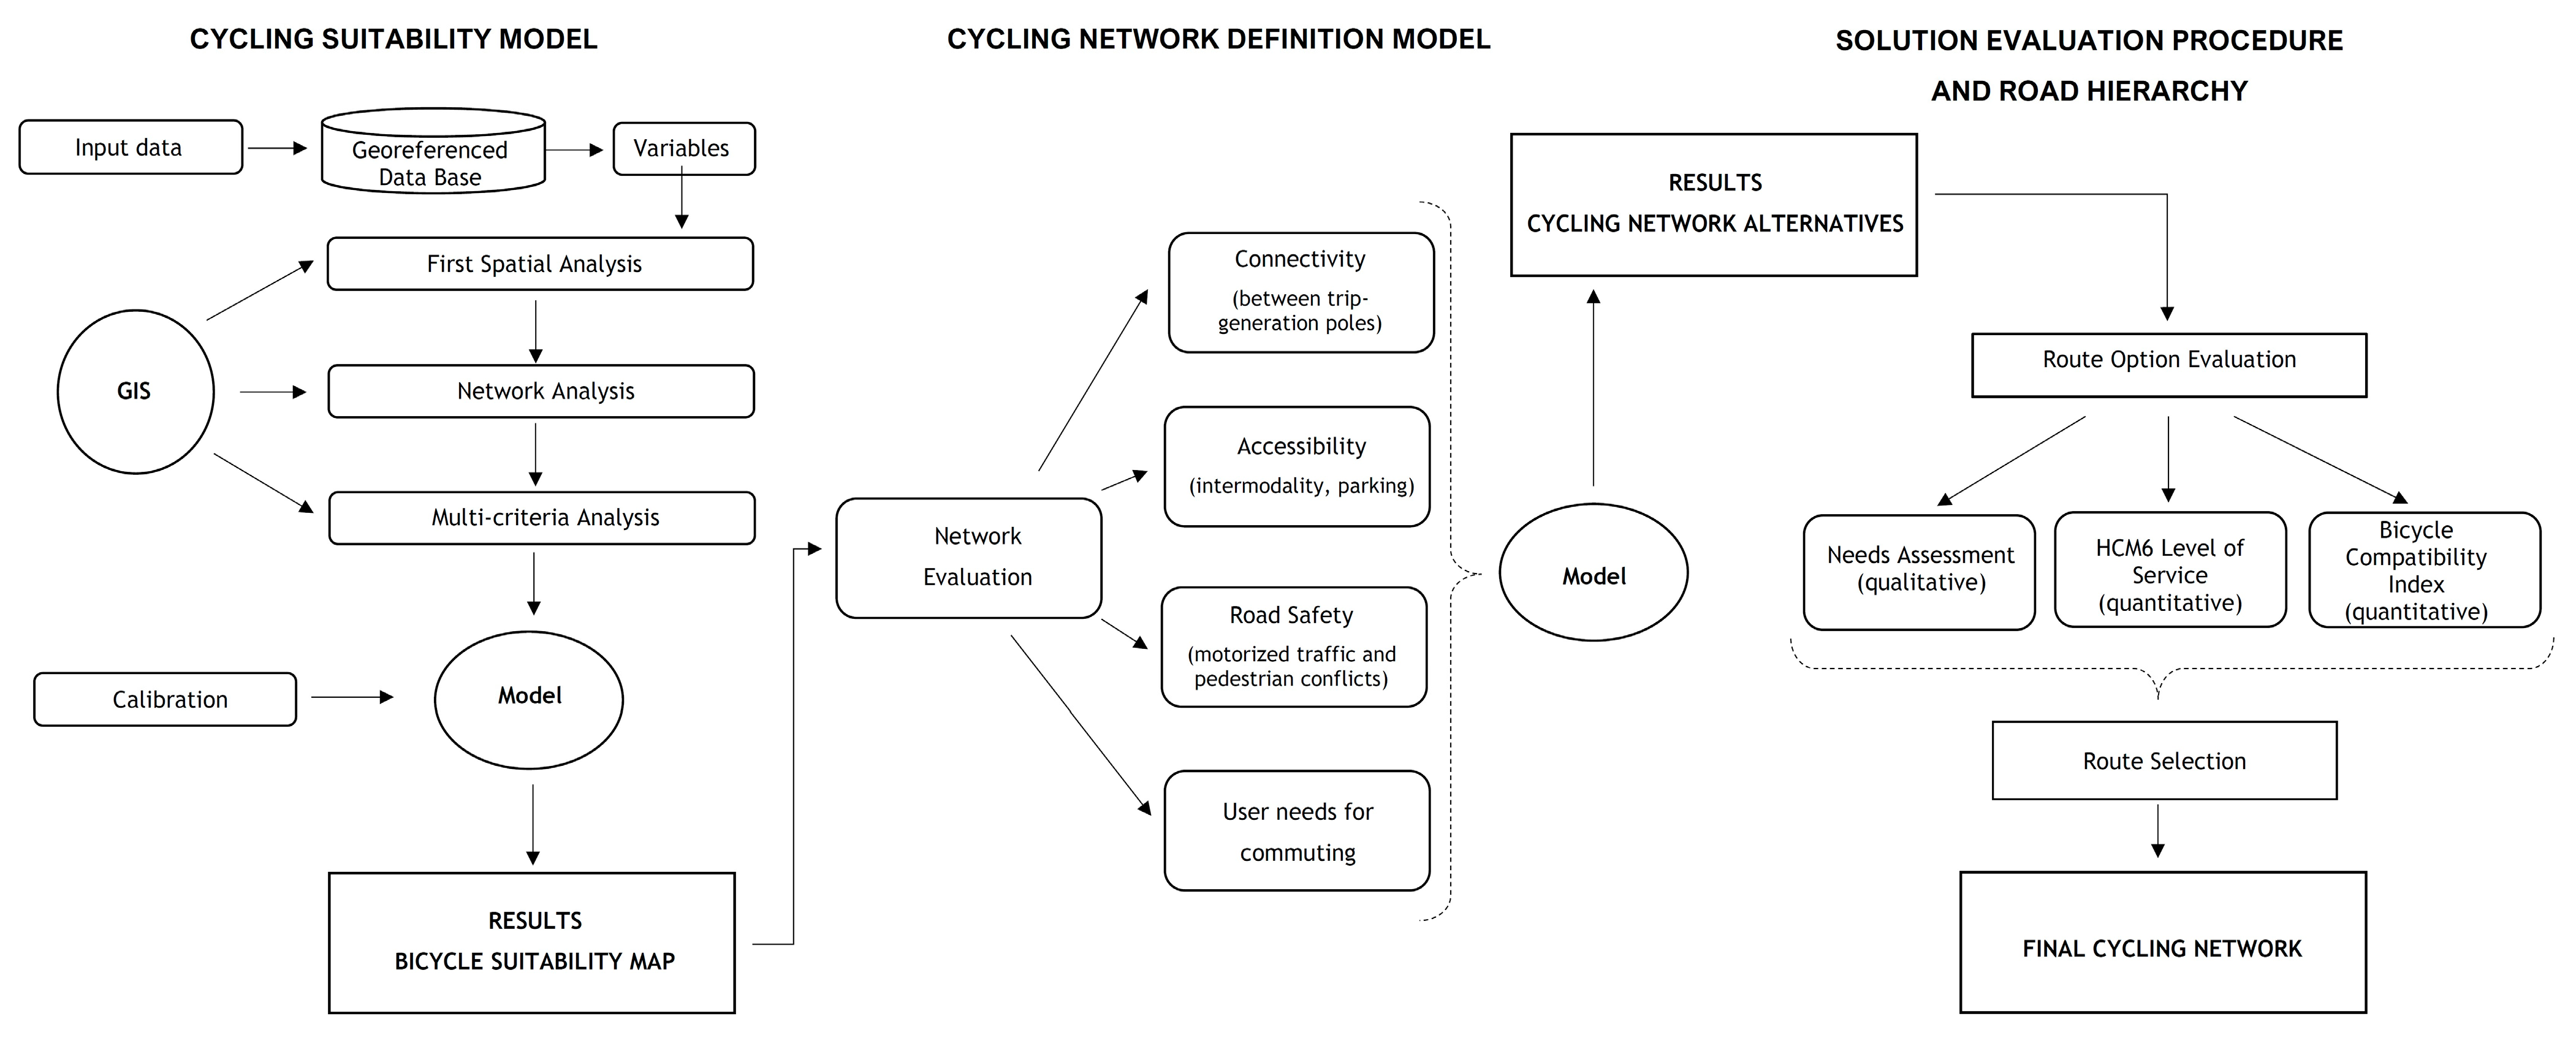
2. Method
- (1)
- A spatial multi-criteria cycling suitability model based on demographic data, trip generation points’ location, type of bicycle (conventional and electric) and road network characteristics (slope, street hierarchy class and cross-section geometry).
- (2)
- A cycling network definition model based on connectivity, network intersections, integration with other transport modes, parking, and safety.
- (3)
- And a procedure for assessing cycling routes hierarchy/solutions.
3. Case Study
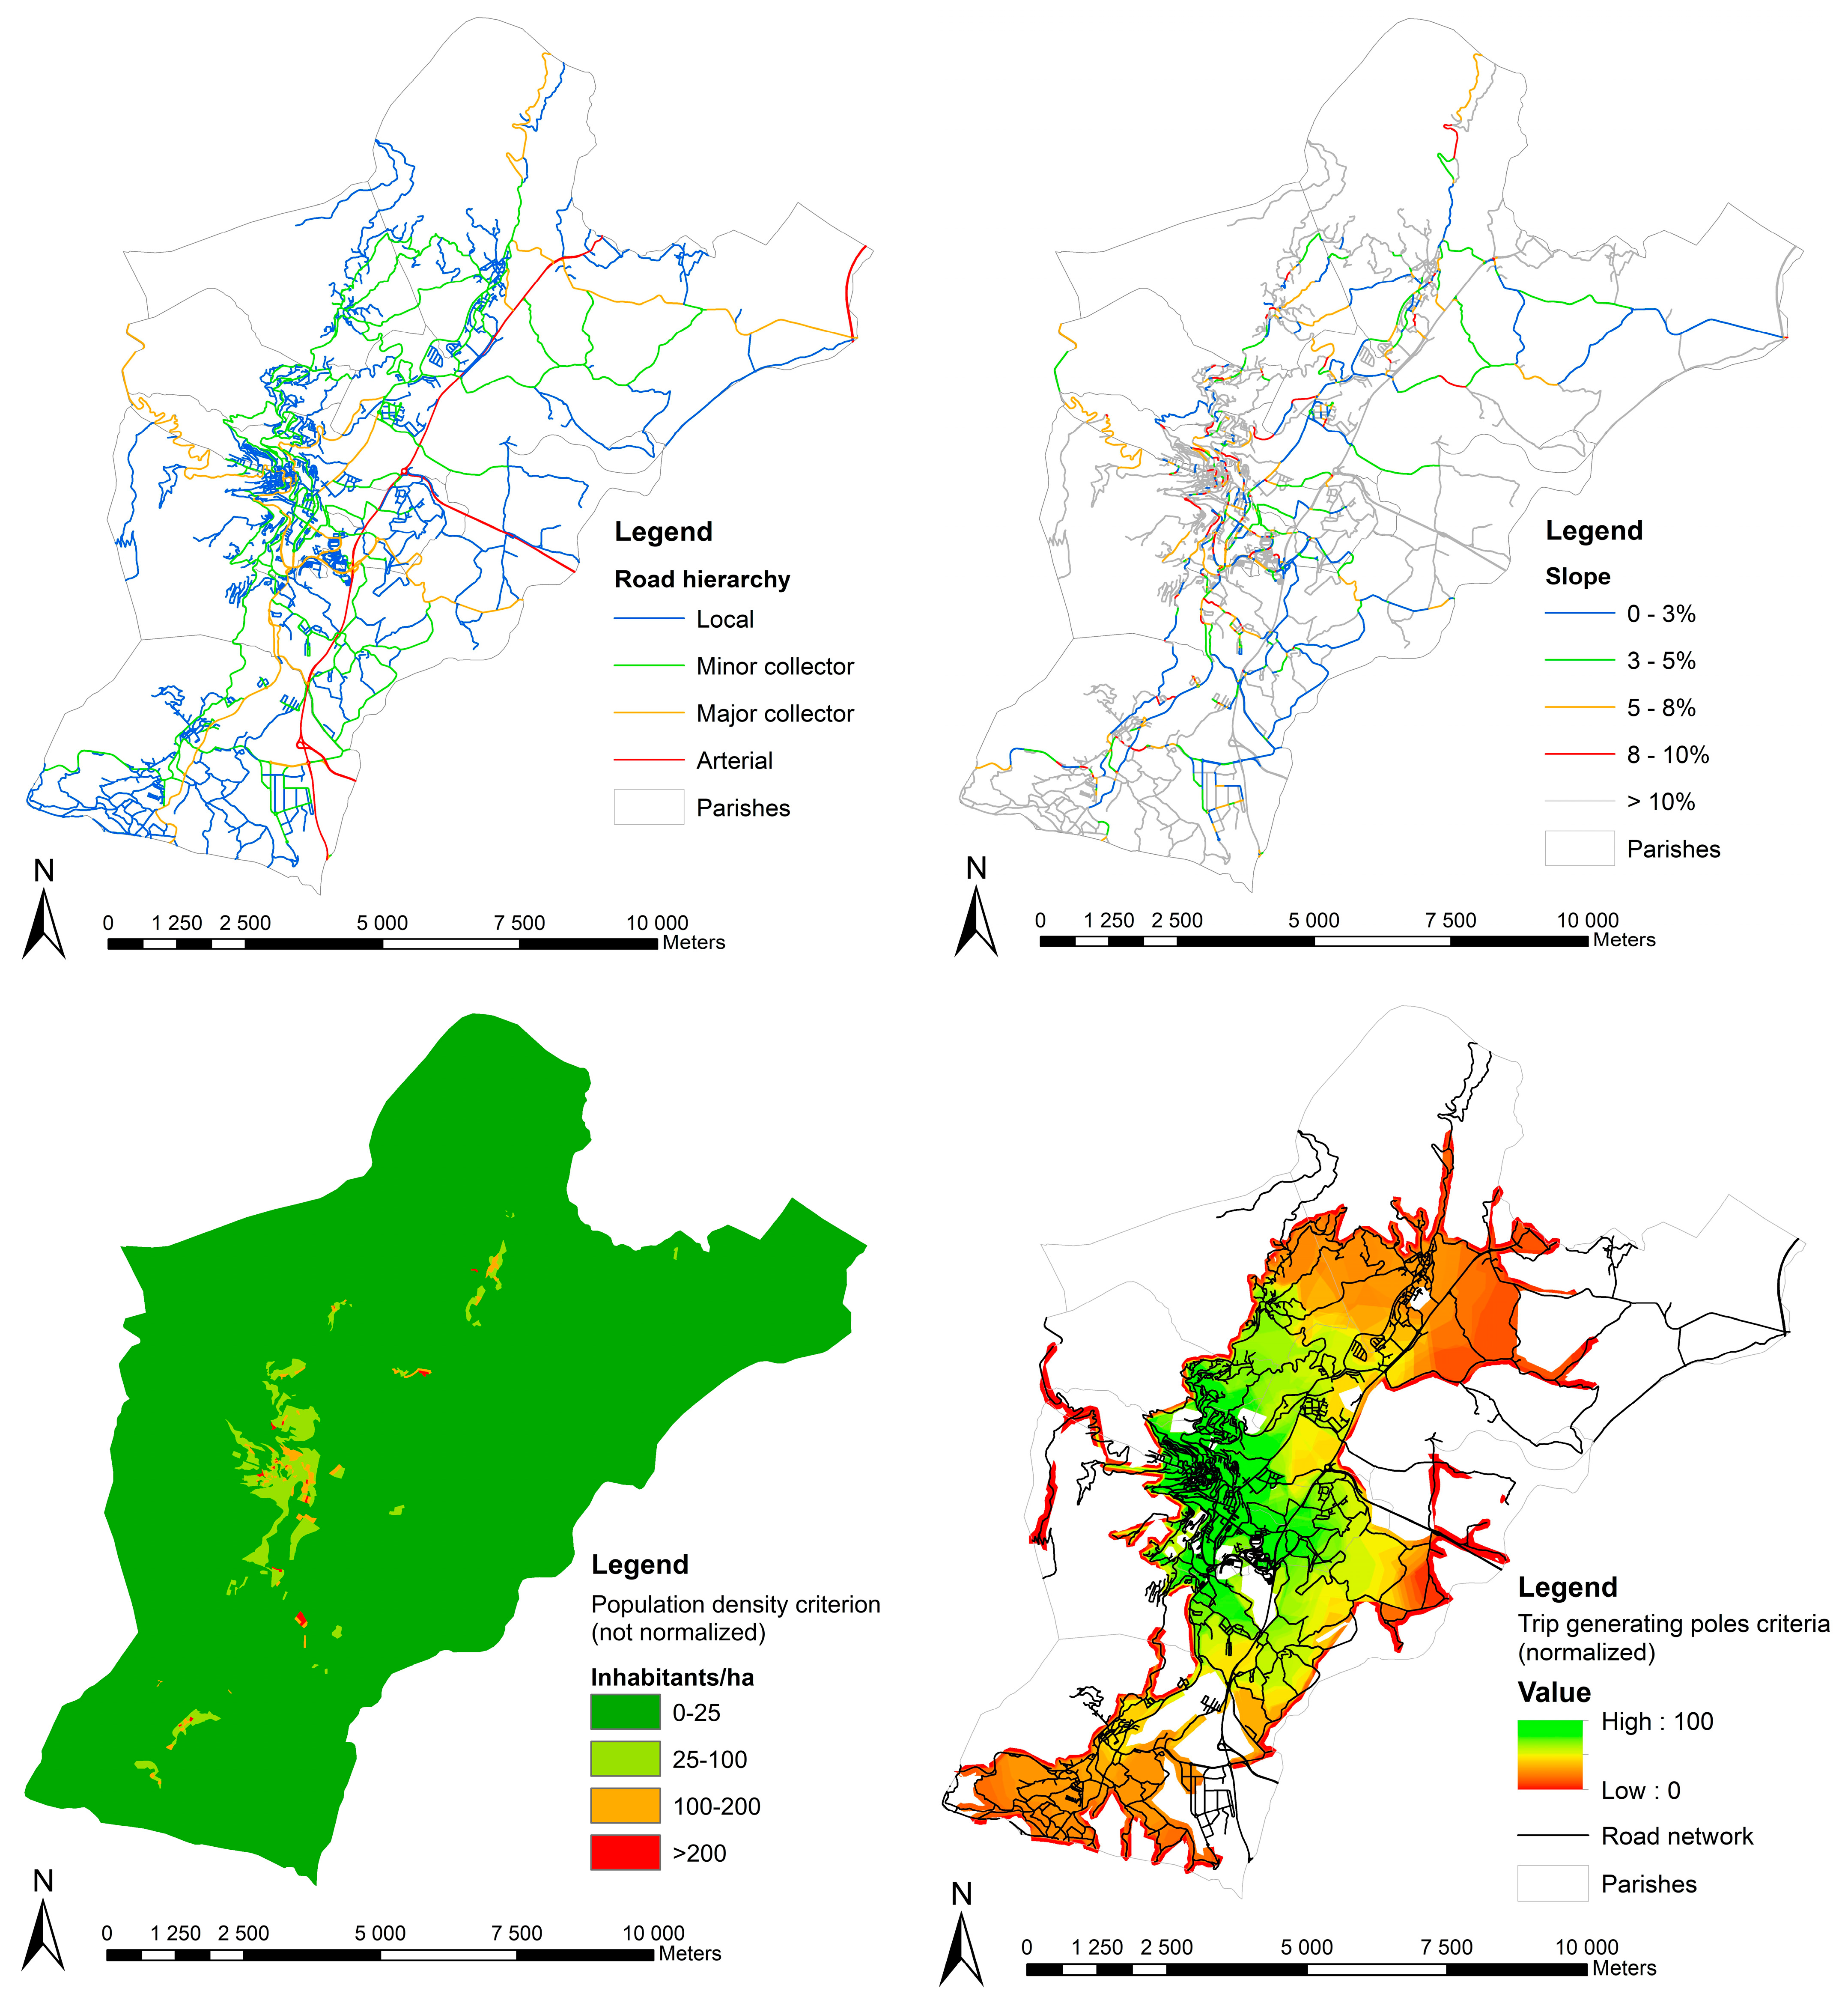
3.1. Study Area and Framework of Municipal Policies and Strategies
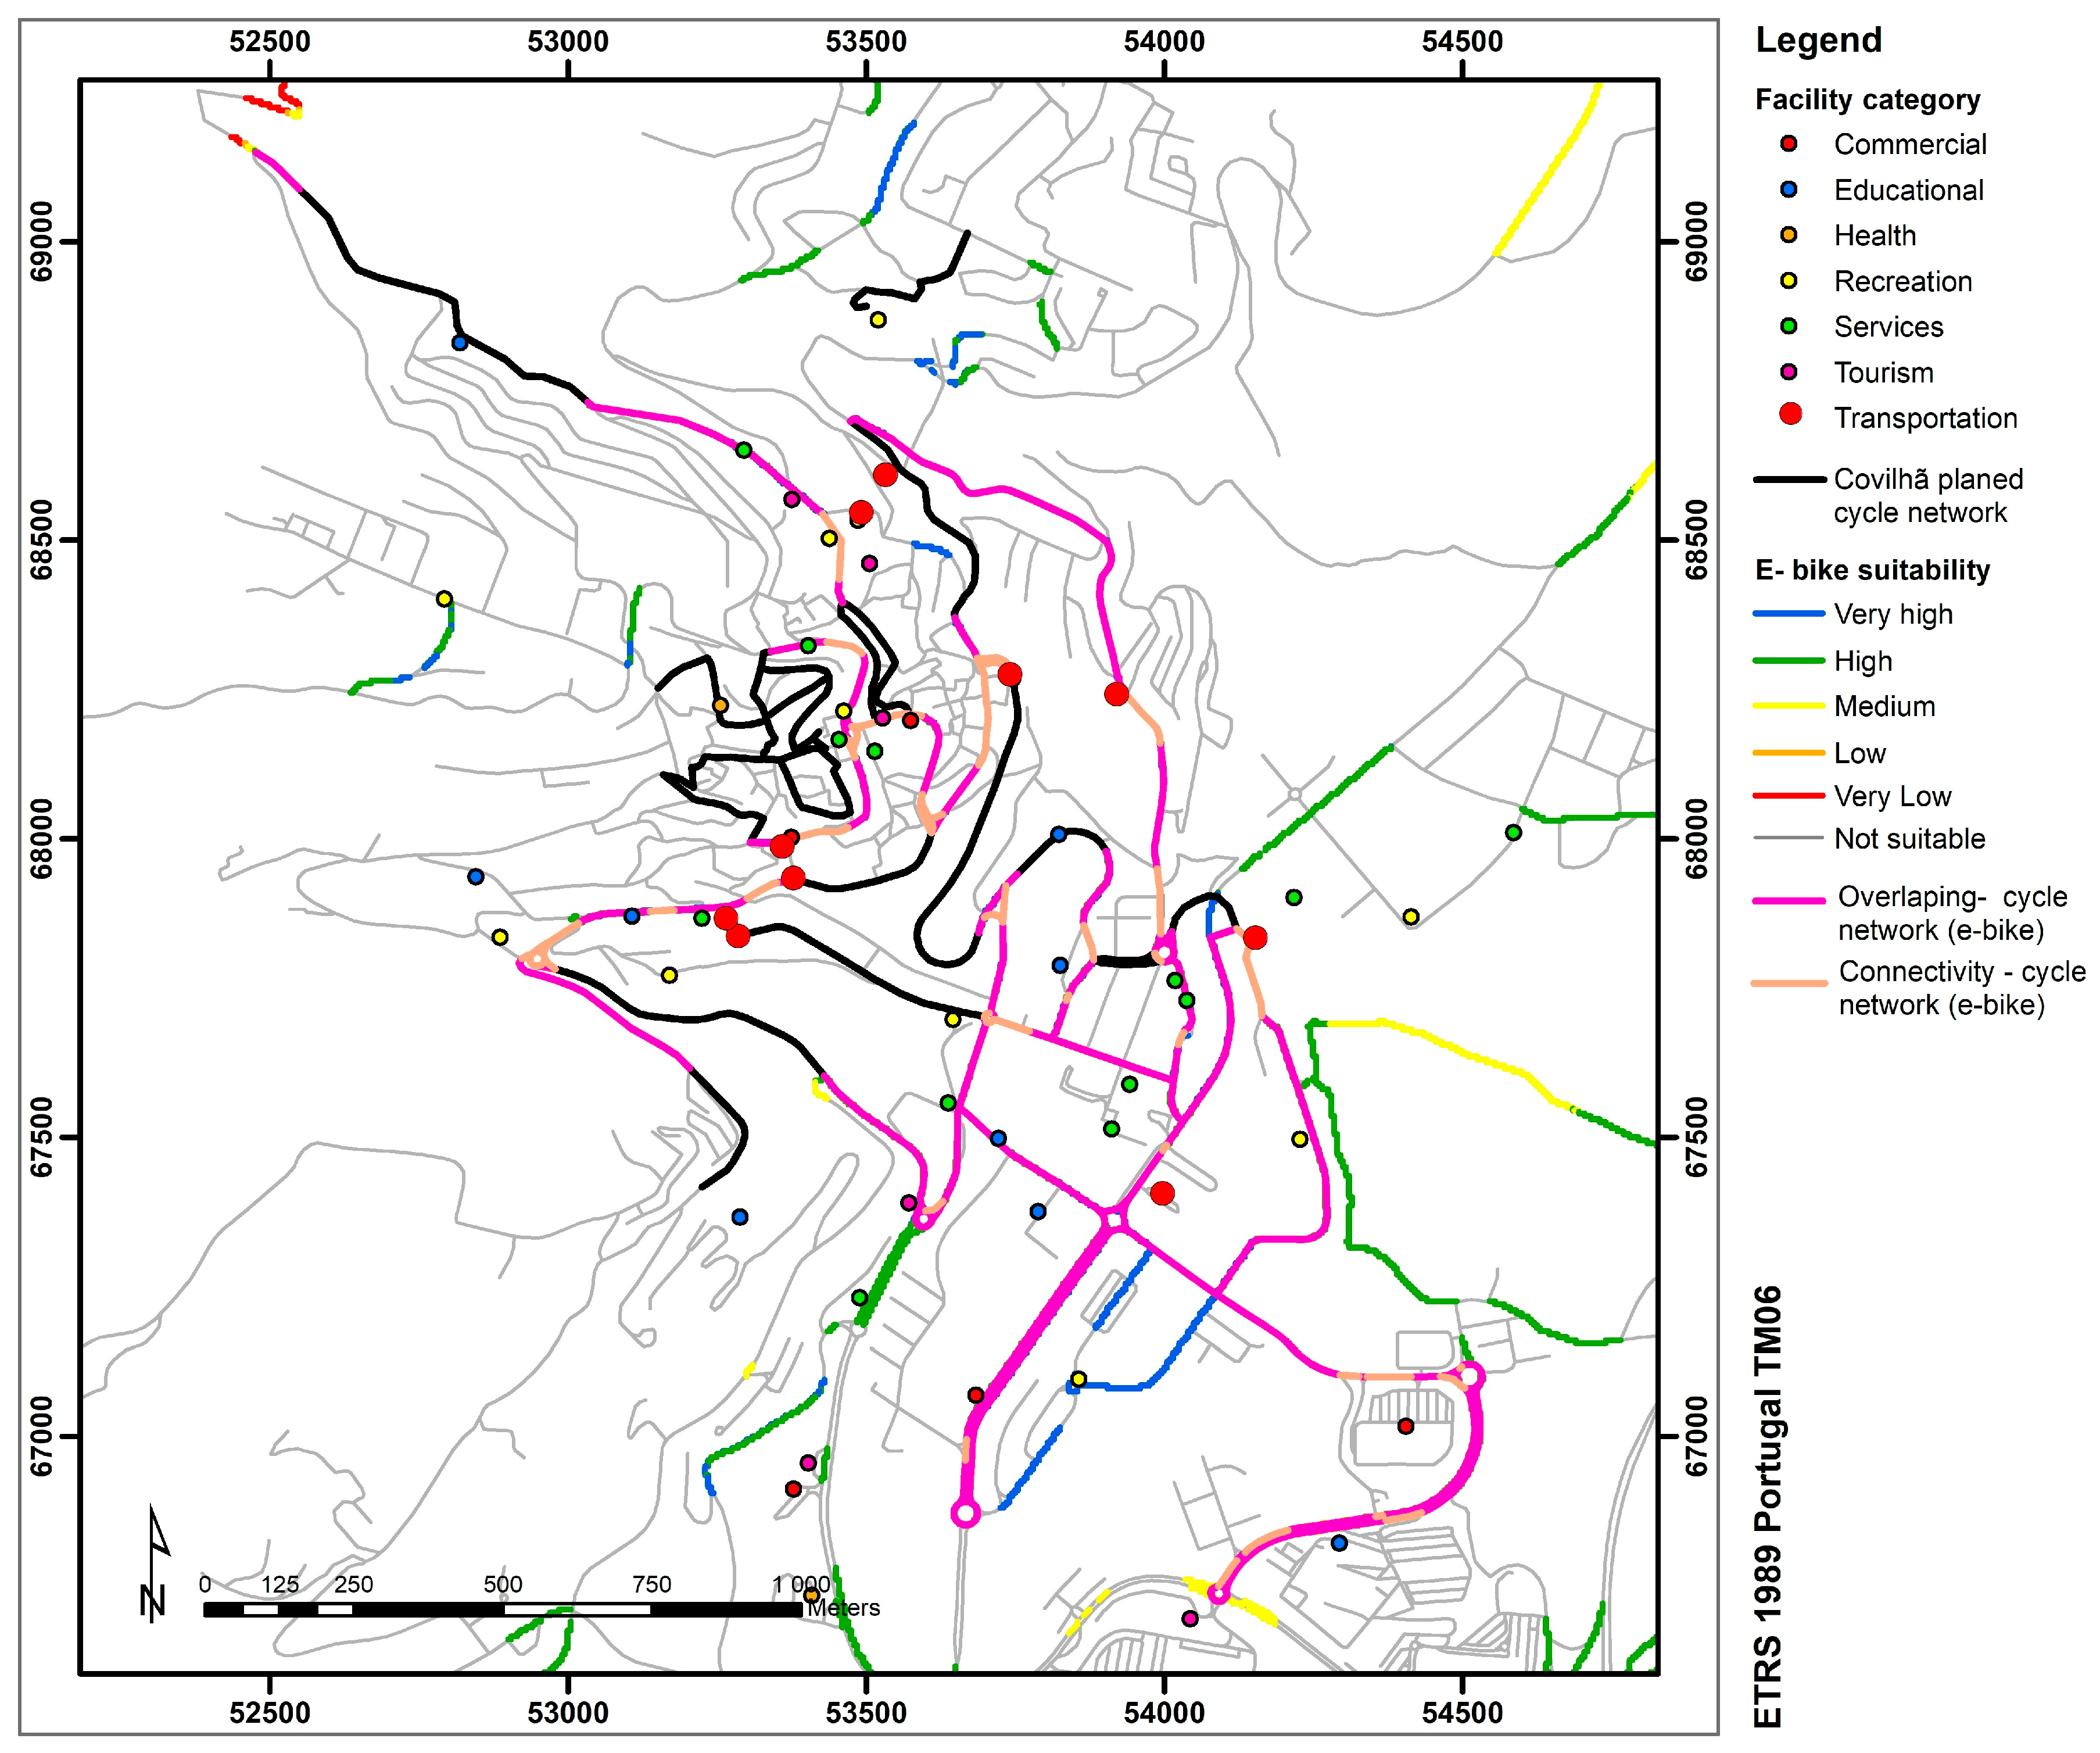
3.2. Analysis
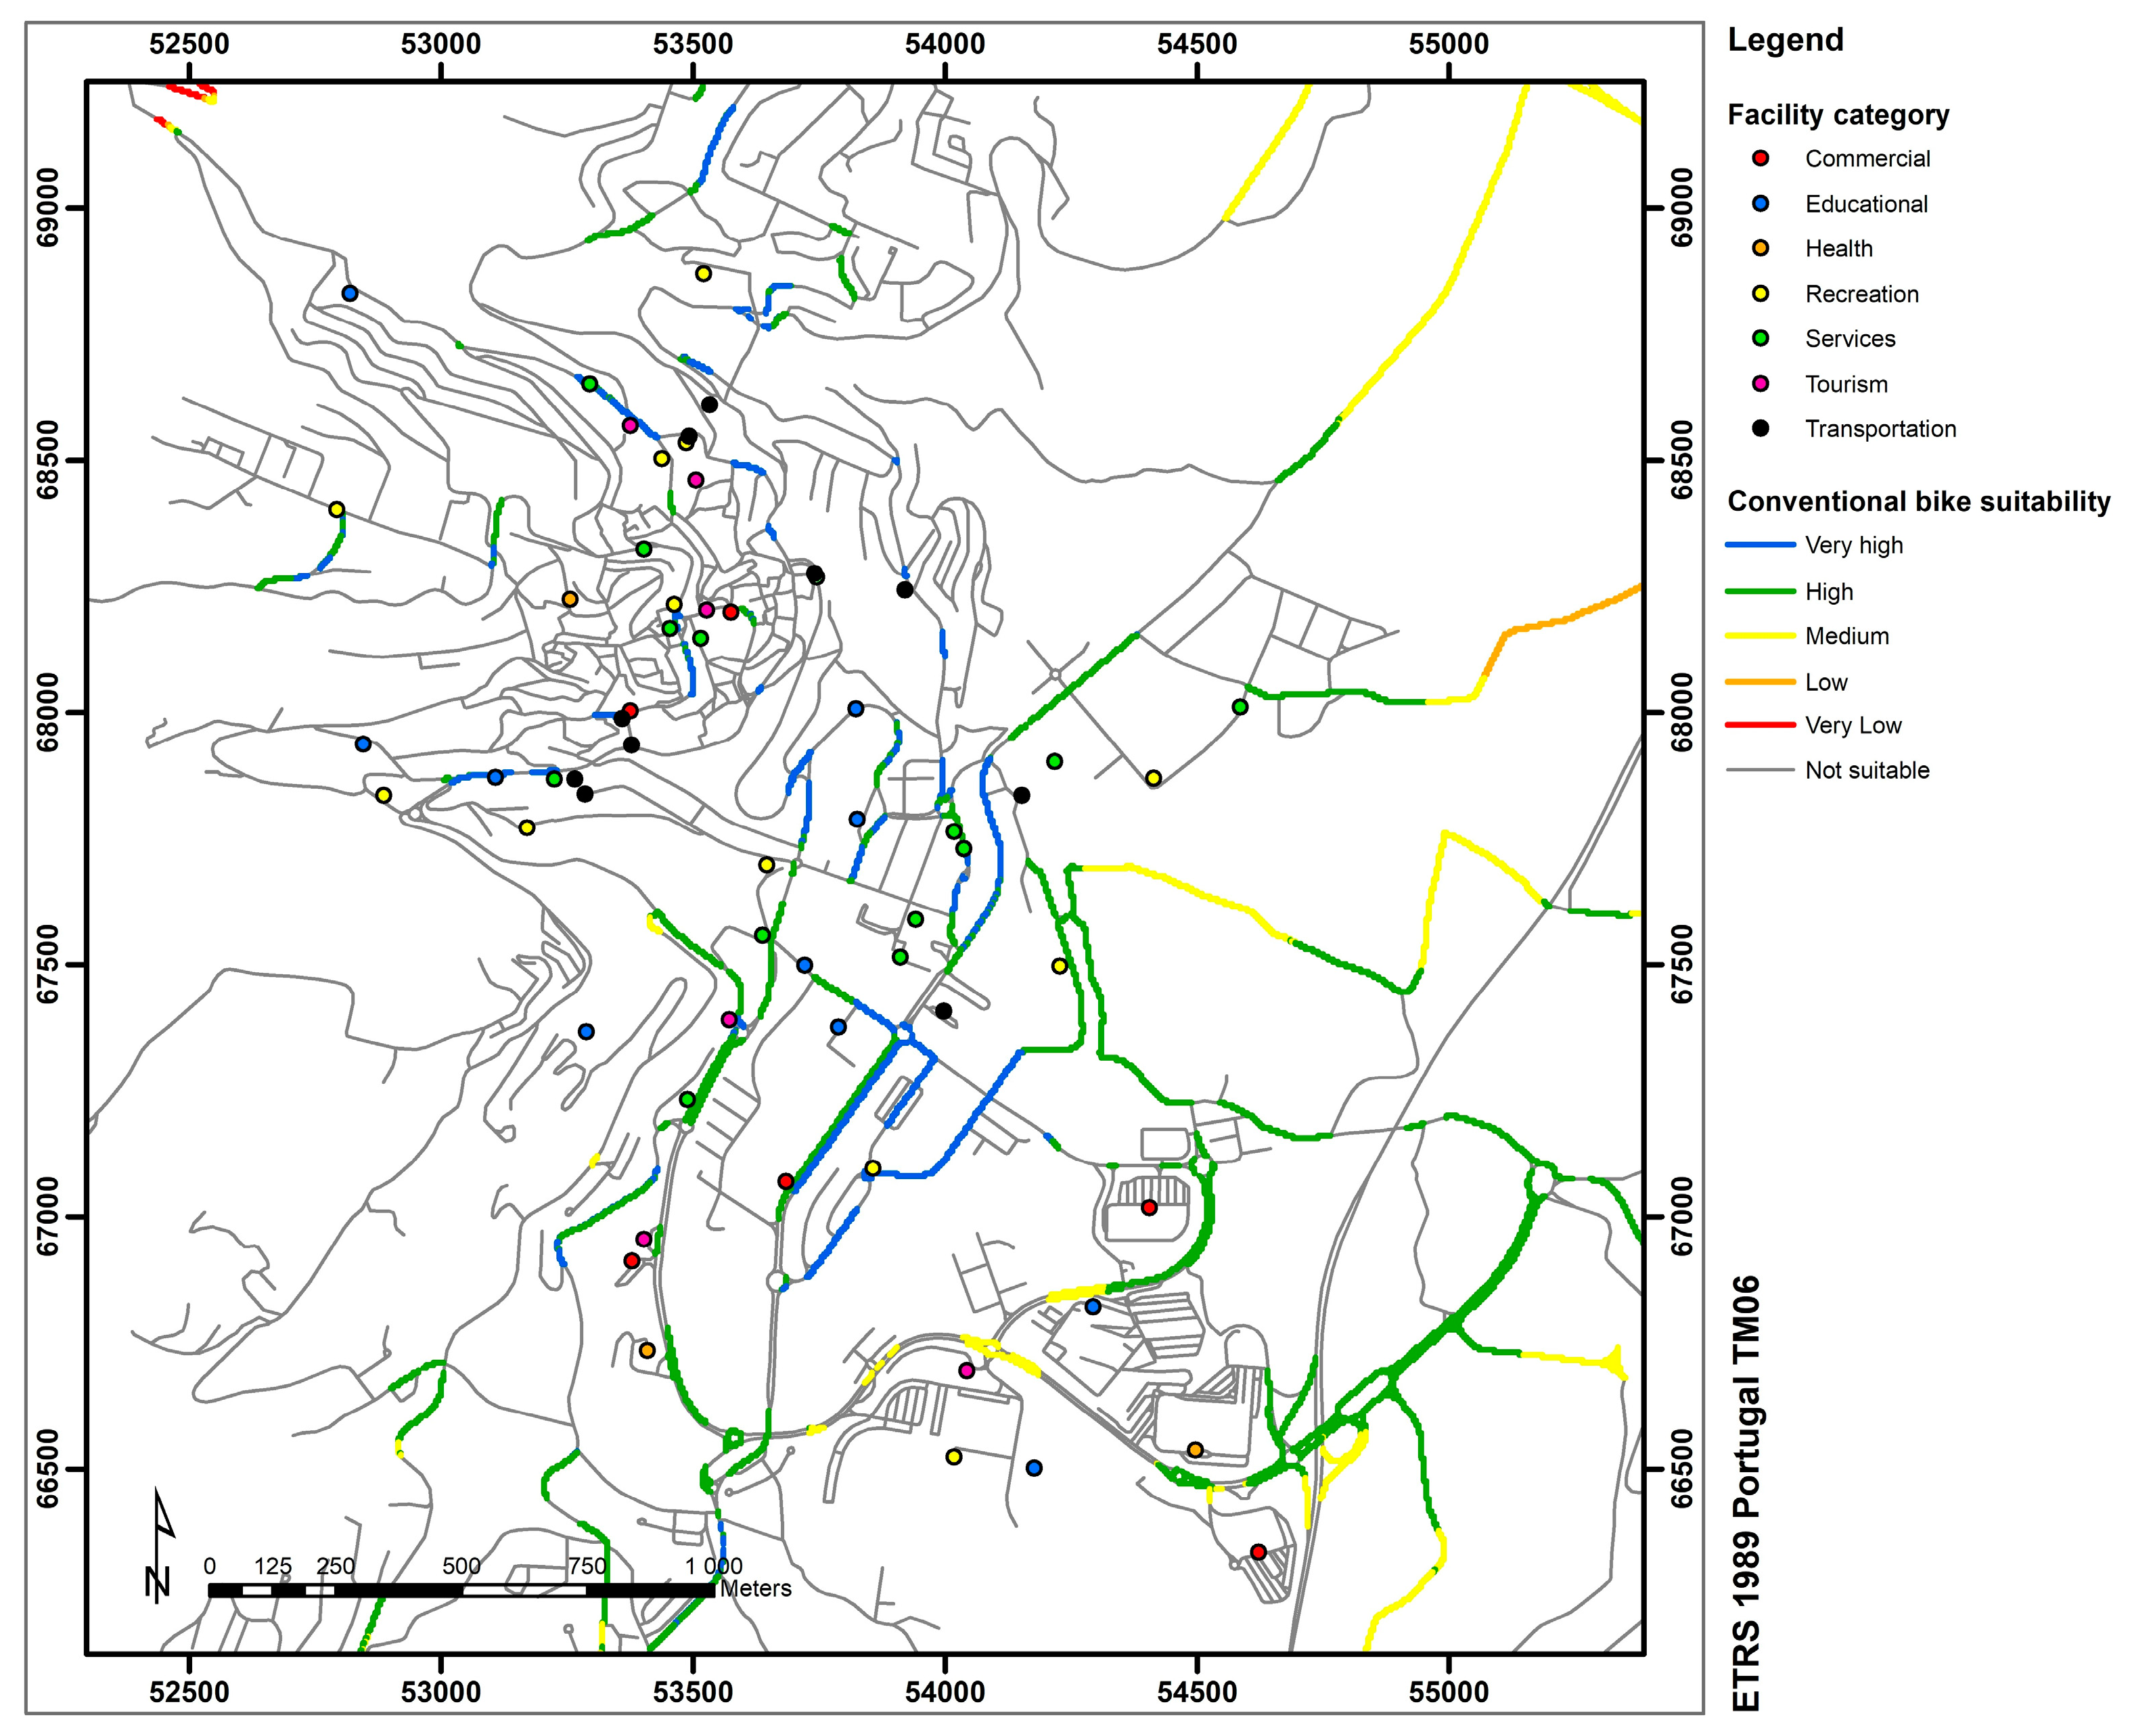
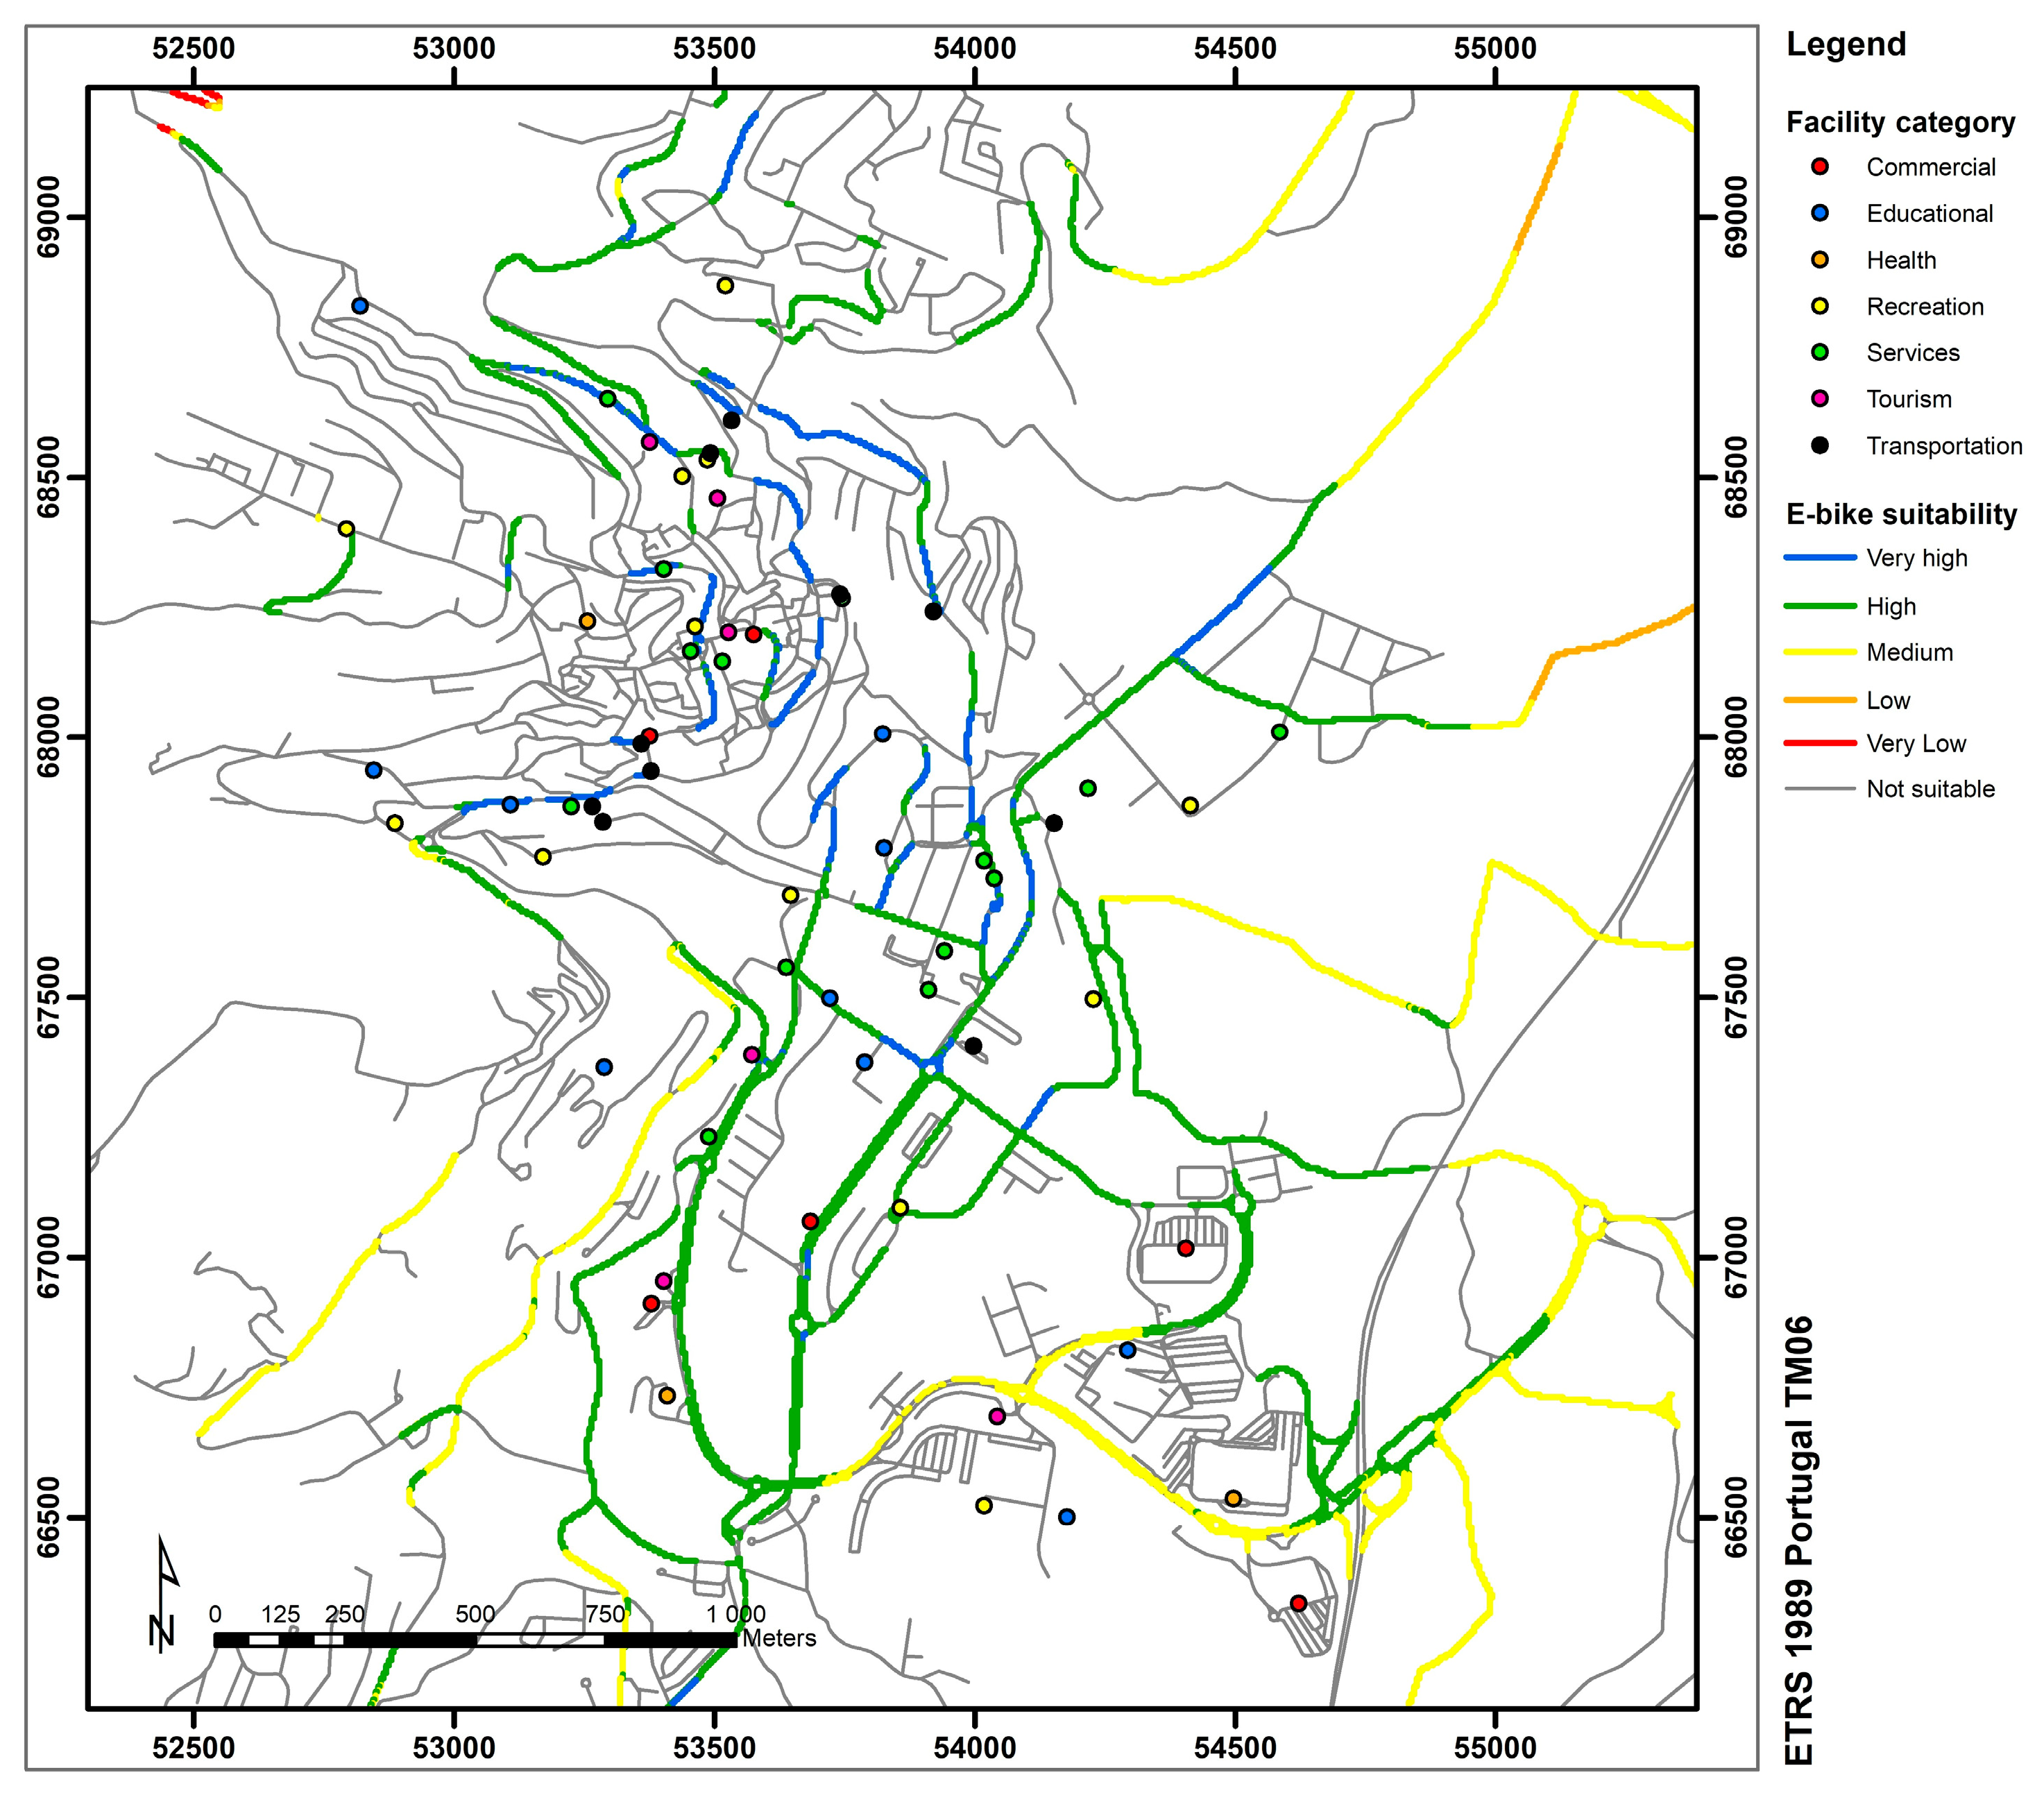
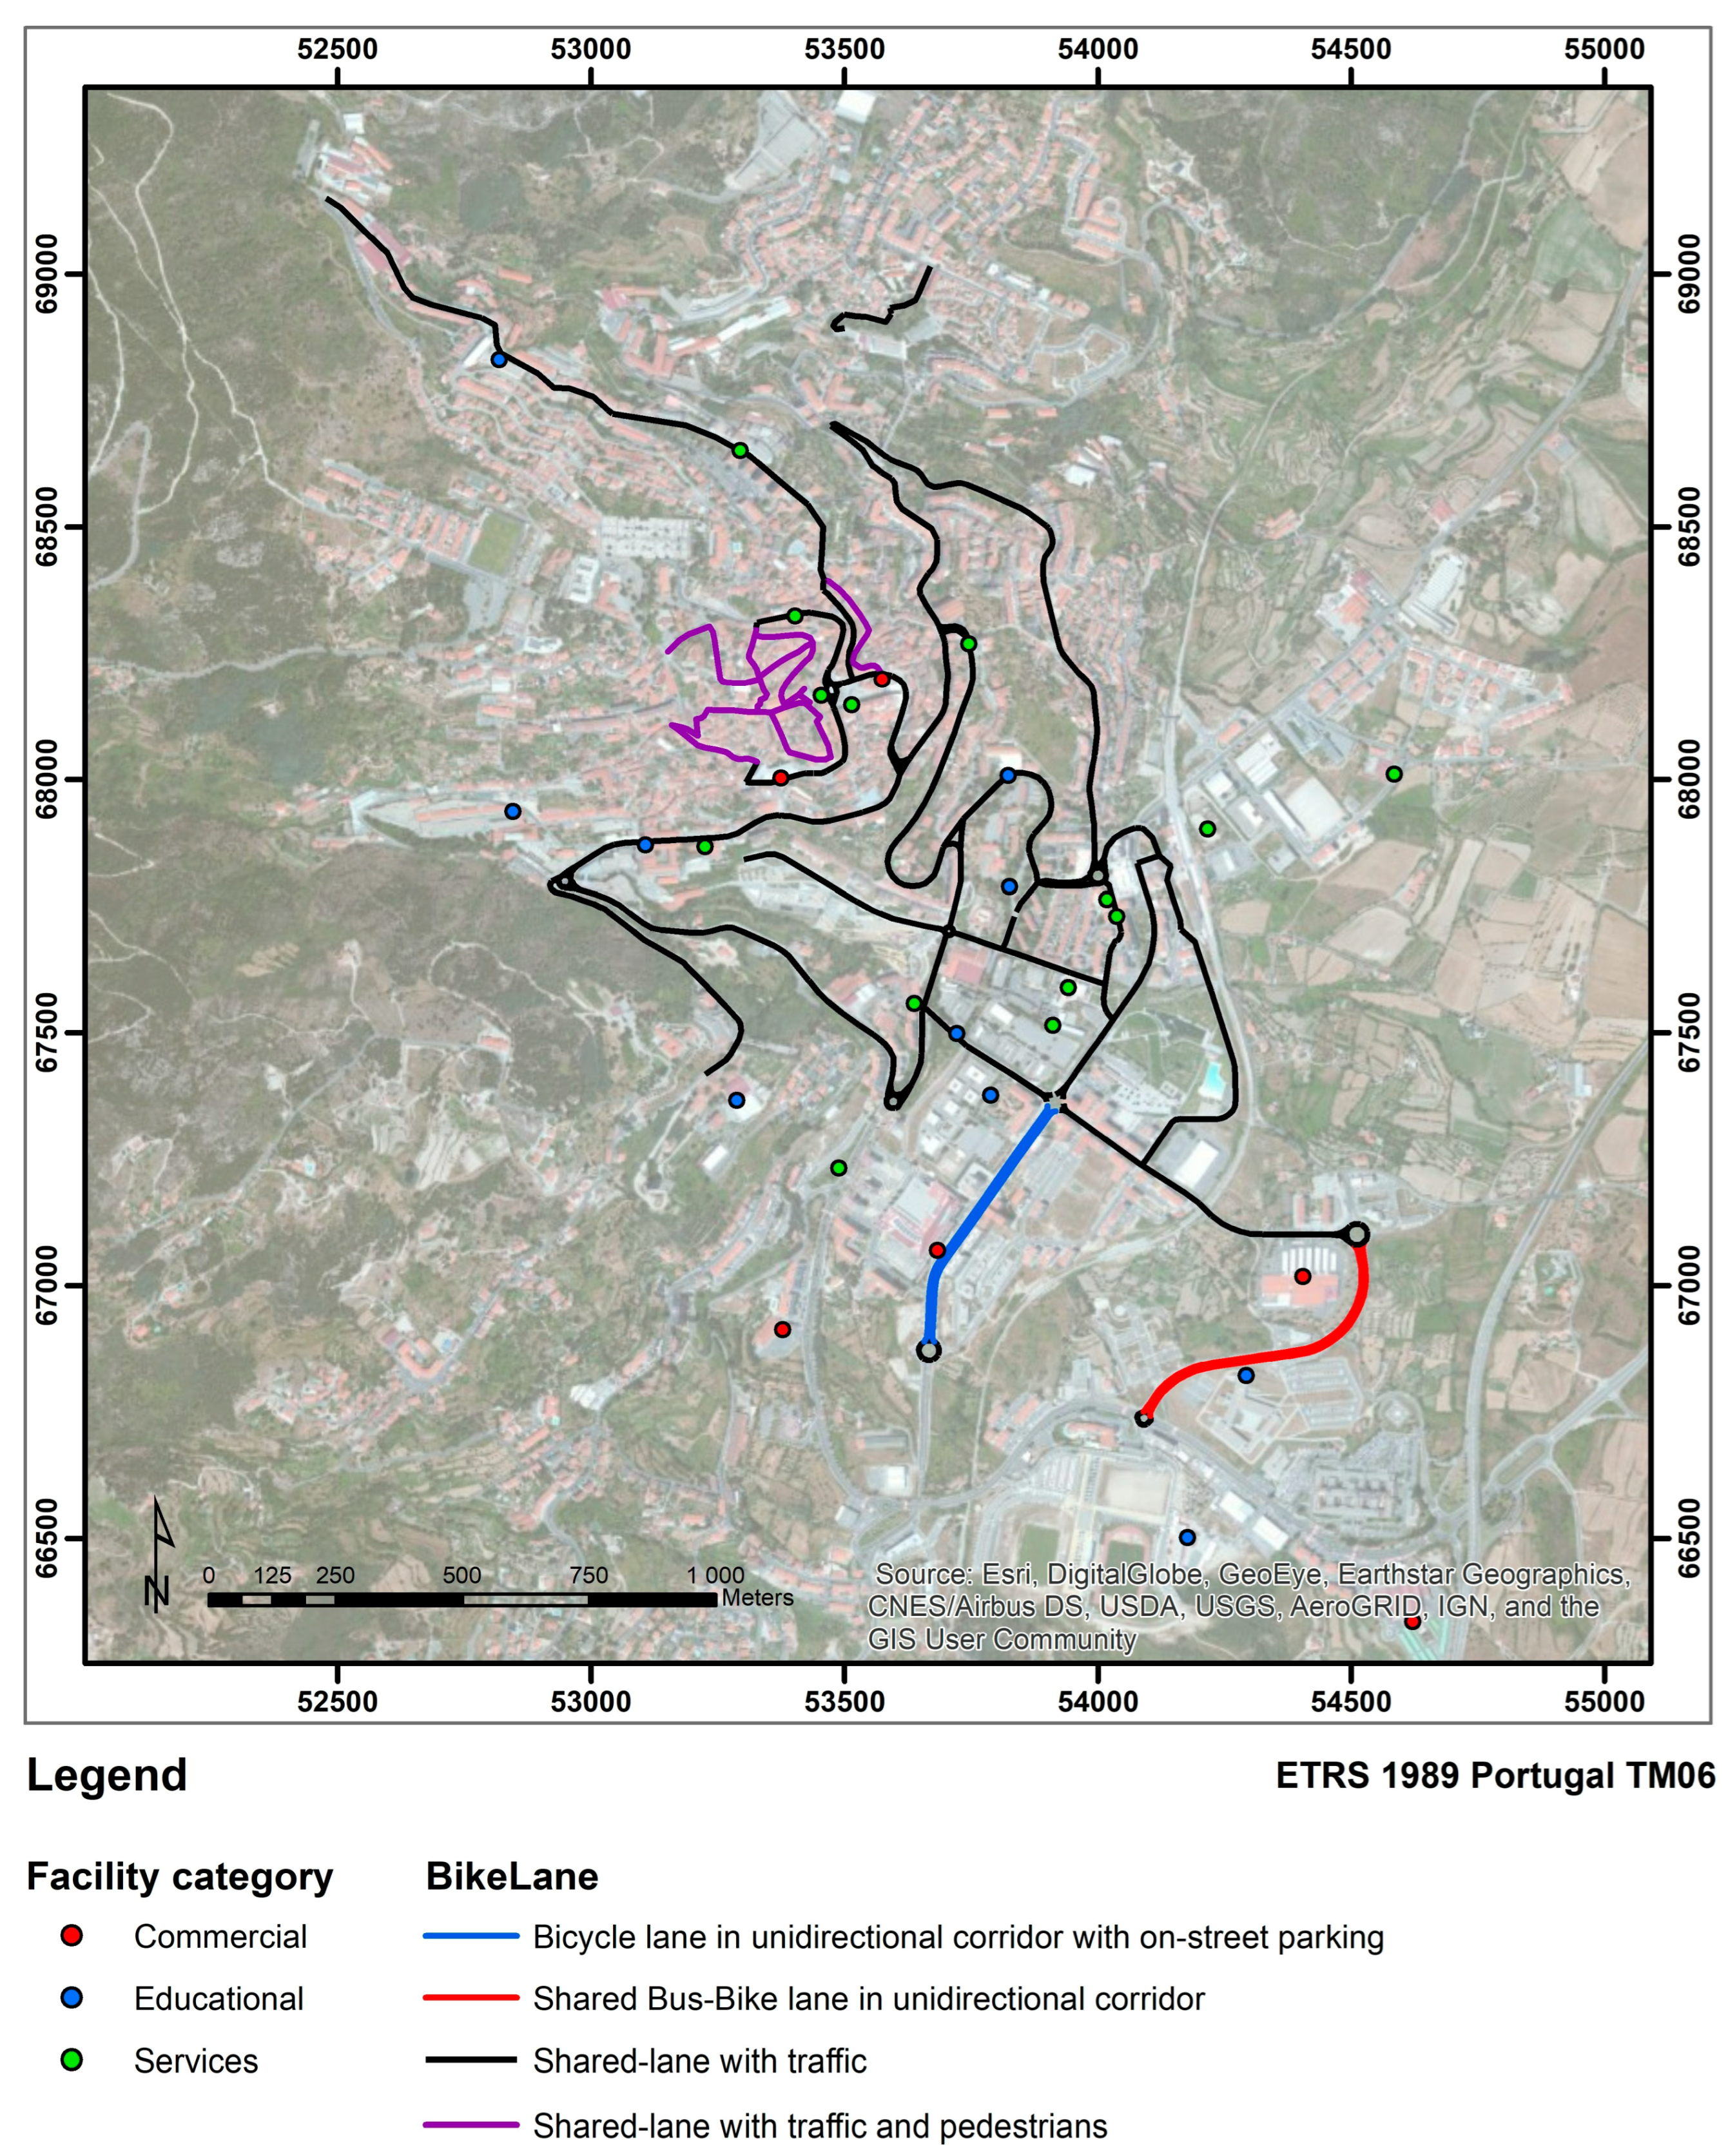
4. Results and Discussion
5. Conclusions
Author Contributions
Funding
Data Availability Statement
Acknowledgments
Conflicts of Interest
References
- World Business Council for Sustainable Development (WBCSD). The Sustainable Mobility Project; Progress Report; WBCSD: Geneva, Switzerland, 2002. [Google Scholar]
- Motta, R.; Silva, P.; Brasil, A. Desafios da mobilidade sustentável no Brasil. Rev. Dos Transp. Públicos ANTP 2012, 34, 25–48. [Google Scholar]
- Vilão, R.; Venâncio, C.; da Silva, F.; Lajas, R.; Martins, R. Projecto Mobilidade Sustentável. Vol. II—Manual de Boas Práticas para a Mobilidade Sustentável; Agência Portuguesa do Ambiente: Amadora, Portugal, 2010. [Google Scholar]
- Wadhwa, L. Sustainable transportation: The key to sustainable cities. Sustain. City 2000, 39, 281–289. [Google Scholar] [CrossRef]
- Rupprecht Consult, Guidelines for Developing and Implementing a Sustainable Urban Mobility Plan, 2nd ed.; Rupprecht Consult: Koln, Germany, 2019.
- Instituto da Mobilidade e dos Transportes Terrestre (IMTT). Rede Ciclável Princípios de Planeamento e Desenho; IMTT: Lisbon, Portugal, 2011. [Google Scholar]
- Commission of the European Communities. COM (2007) 551 Final: Green Paper—Towards a New Culture for Urban Mobility; Commission of the European Communities: Brussels, Belgium, 2007. [Google Scholar]
- European Commission. White Paper—Roadmap to a Single European Transport Are—Towards a Competitive and Resource Efficient Transport System; European Commission: Brussels, Belgium, 2011. [Google Scholar]
- European Commission. Urban Agenda for the EU—Pact of Amsterdam; European Commission: Amsterdam, The Netherlands, 2016. [Google Scholar]
- European Commission. A European Strategy for Low-Emission Mobility; European Commission: Brussels, Belgium, 2016. [Google Scholar]
- European Commission. Communication from the Commission to the European Parlament, the Council, the European Economic and Social Committee and the Committee of the Regions: Together Towards Competitive and Resource-Efficient Urban Mobility; European Commission: Brussels, Belgium, 2013. [Google Scholar]
- United Nations Economic Commission for Europe. Paris Declaration: City in Motion, People First; United Nations Economic Commission for Europe: Geneva, Switzerland, 2015. [Google Scholar]
- European Committee of the Regions. Opinion of the European Committee of the Regions—An EU Roadmap for Cycling. Off. J. Eur. Union 2017, C88, 49–53. [Google Scholar]
- European Transport Safety Council (ETSC) and EUROCITIES. EU Cycling Strategy; European Cyclists’ Federation (ECF): Brussels, Belgium, 2017; Volume 22. [Google Scholar] [CrossRef]
- European Commission. Action Plan on Urban Mobility; European Commission: Brussels, Belgium, 2009. [Google Scholar]
- UNICEF-ONU-UNESCO. From Amsterdam to Paris and beyond: The Transport, Health and Environment Pan-European Programme (THE PEP) 2009–2020; UNICEF: Geneva, Switzerland, 2014. [Google Scholar]
- Le Gouvernement du Grand-Duché de Luxembourg, Ministere du Développement Durable et des Infrastructures. Informal Meeting of EU Ministers for Transport; UNESCO: Paris, France, 2015.
- Federal Ministry Republic of Austria. Graz Declaration; Federal Ministry Republic of Austria: Graz, Austria, 2018.
- Official Journal of the European Union. Directive (EU) 2019/1936 of the European Parliament and of the Council; European Union: Brussels, Belgium, 2019. [Google Scholar]
- European Commission. Communication from the Commission to the European Parliament, the Council, the European Economic and Social Committee and the Committee of the Regions: Sustainable and Smart Mobility Strategy—Putting European Transport on Track for the Future; European Commission: Brussels, Belgium, 2020. [Google Scholar]
- Federal Ministry for Climate Action, Environment, Energy, Mobility, Innovation and Technology of the Republic of Austria. Pan-European Master Plan for Cycling Promotion. Transport, Health and Environment Pan-European Programme (THE PEP). In Proceedings of the 5th High-level Meeting on Transport, Health and Environment, Vienna, Austria, 2 March 2021. [Google Scholar]
- Colli, E.; Küster, F.; Žganec, M. The State of National Cycling Strategies in Europe (2021); European Cyclists’ Federation (ECF): Brussels, Belgium, 2022. [Google Scholar]
- Assembleia da República. Lei n.o 58/2007 de 4 de Setembro; Assembleia da República: Lisbon, Portugal, 2007. [Google Scholar]
- Resolução do Conselho de Ministros n.o 109/2007. Estratégia Nacional de Desenvolvimento Sustentável (ENDS); Conselho de Ministros: Lisbon, Portugal, 2007.
- Resolução do Conselho de Ministros n.o 28/2015. Compromisso para o Crescimento Verde; Conselho de Ministros: Lisbon, Portugal, 2015.
- Ministério do Ambiente. Portugal Ciclável 2030 (PC2030); Ministério do Ambiente: Lisbon, Portugal, 2018.
- Diário da República. Estratégia Nacional para a Mobilidade Ativa Ciclável 2020–2030; Resolução do Conselho de Ministros 131/2019; Diário da República: Lisbon, Portugal, 2019. [Google Scholar]
- Marín, G.; Sarría, A.; Serrato, B.; Muñoz, M. (Eds.) Instrumentos de sensibilização dos municípios para uma mobilidade sustentável: O caso do Programa ECOXXI. In Proceedings of the XV Coloquio Ibérico de Geografía, Murcia, Spain, 7–9 November 2016; pp. 579–588. [Google Scholar]
- ECOXXI Program. Available online: https://ecoxxi.abae.pt/ (accessed on 21 November 2020).
- Gomes, M. ECOXXI 2018; Associação Bandeira Azul da Europa: Lisbon, Portugal, 2018. [Google Scholar]
- Diário da República. 1.a Série. Plano Nacional de Promoção da Bicicleta e Outros Modos de Transporte Suaves; Diário da República: Lisbon, Portugal, 2009. [Google Scholar]
- Instituto das Mobilidades e dos Transportes (IMT). CiclAndo—Plano de Promoção da Bicicleta e Outros Modos Suaves 2013–2020; Instituto das Mobilidades e dos Transportes (IMT): Lisbon, Portugal, 2012. [Google Scholar]
- Instituto da Mobilidade e dos Transportes Terrestres (IMTT). Diretrizes Nacionais para a Mobilidade; Instituto das Mobilidades e dos Transportes (IMT): Lisbon, Portugal, 2012. [Google Scholar]
- Diário da República. 1.a Série. Roteiro para a Neutralidade Carbónica 2050 (RNC2050); Resolução do Conselho de Ministros n.o 107/2019; Diário da República: Lisbon, Portugal, 2019. [Google Scholar]
- Laboratório Nacional de Engenharia Civil (LNEC)—Departamento de Transportes. Documento Normativo para Aplicação A Arruamentos Urbanos—Fascículo III—Características Geométricas para vias de Tráfego Não Motorizado; Laboratório Nacional de Engenharia Civil (LNEC)—Departamento de Transportes: Lisbon, Portugal, 2020.
- Diário da República. 2.a Série. Regulamento de Atribuição do Incentivo Pela Introdução no Consumo de Veículos de Baixas Emissões; Despacho 2535/2021; Diário da República: Lisbon, Portugal, 2021. [Google Scholar]
- Fundo para o Serviço Público de Transportes. Apoio à Aquisição e Instalação de Equipamentos Destinados ao Estacionamento de Bicicletas; Aviso de abertura de candidature n.o 3/2021; Fundo para o Serviço Público de Transportes: Lisbon, Portugal, 2021. [Google Scholar]
- Diário da República. 1a Série Lei de Bases do Clima; Lei 98/2021; Diário da República: Lisbon, Portugal, 2021. [Google Scholar]
- Reggiani, G.; van Oijen, T.; Hamedmoghadam, H.; Daamen, W.; Vu, H.; Hoogendoorn, S. Understanding bikeability: A methodology to assess urban networks. Transportation 2022, 49, 897–925. [Google Scholar] [CrossRef]
- Kellstedt, D.; Spengler, J.; Foster, M.; Lee, C.; Maddock, J. A Scoping Review of Bikeability Assessment Methods. J. Community Health 2021, 46, 211–224. [Google Scholar] [CrossRef]
- Krenn, P.; Oja, P.; Titze, S. Development of a Bikeability Index to Assess the Bicycle-Friendliness of Urban Environments. Open J. Civ. Eng. 2015, 5, 451–459. [Google Scholar] [CrossRef]
- Motta, B. A Bikeability Index for Curitiba (Brazil). Master’s Thesis, University of Twente, Enschede, The Netherlands, 2017. [Google Scholar]
- Chevalier, A.; Xu, L. On the applicability of a western bikeability index in the Chinese context. Int. Rev. Spat. Plan. Sustain. Dev. 2020, 8, 59–93. [Google Scholar] [CrossRef]
- Urrego, N.; Páez, D.; Guzmán, V. Cali Bikeability Index Map—A Tool for Evaluating Public Investment and Future Needs; Universidad de los Andes: Bogota, Colombia, 2014. [Google Scholar]
- Arellana, J.; Saltarín, M.; Larrañaga, A.; González, V.; Henao, C. Developing an urban bikeability index for different types of cyclists as a tool to prioritise bicycle infrastructure investments. Transp. Res. Part A Policy Pract. 2020, 139, 310–334. [Google Scholar] [CrossRef]
- Schmid-Querg, J.; Keler, A.; Grigoropoulos, G. The Munich bikeability index: A practical approach for measuring urban bikeability. Sustainability 2021, 13, 428. [Google Scholar] [CrossRef]
- Ostensen, A. The Bicycle Compatibility Index: A Level of Service Concept, Implementation Manual; FHWA-RD-98-095; Federal Highway Administration: Washington, DC, USA, 1998.
- Tran, P.; Zhao, M.; Yamamoto, K.; Minet, L.; Nguyen, T.; Balasubramanian, R. Cyclists’ personal exposure to traffic-related air pollution and its influence on bikeability. Transp. Res. Part D Transp. Environ. 2020, 88, 102563. [Google Scholar] [CrossRef]
- Müller, S.; Mejia-Dorantes, L.; Kersten, E. Analysis of active school transportation in hilly urban environments: A case study of Dresden. J. Transp. Geogr. 2020, 88, 102872. [Google Scholar] [CrossRef]
- Heinen, E.; van Wee, B.; Maat, K. Commuting by bicycle: An overview of the literature. Transp. Rev. 2010, 30, 59–96. [Google Scholar] [CrossRef]
- Broach, J.; Dill, J.; Gliebe, J. Where do cyclists ride? A route choice model developed with revealed preference GPS data. Transp. Res. Part A Policy Pract. 2012, 46, 1730–1740. [Google Scholar] [CrossRef]
- Mateo-Babiano, I.; Bean, R.; Corcoran, J.; Pojani, D. How does our natural and built environment affect the use of bicycle sharing? Transp. Res. Part A Policy Pract. 2016, 94, 295–307. [Google Scholar] [CrossRef]
- Li, Z.; Wang, W.; Liu, P.; Ragland, D. Physical environments influencing bicyclists’ perception of comfort on separated and on-street bicycle facilities. Transp. Res. Part D Transp. Environ. 2012, 17, 256–261. [Google Scholar] [CrossRef]
- Tscharaktschiew, S.; Müller, S. Ride to the hills, ride to your school: Physical effort and mode choice. Transp. Res. Part D Transp. Environ. 2021, 98, 1–18. [Google Scholar] [CrossRef]
- Paige Willis, D.; Manaugh, K.; El-Geneidy, A. Uniquely satisfied: Exploring cyclist satisfaction. Transp. Res. Part F Traffic Psychol. Behav. 2013, 18, 136–147. [Google Scholar] [CrossRef]
- Câmara Municipal da Covilhã. Projeto de Execução da Rede Ciclável da Cidade da Covilhã; Câmara Municipal da Covilhã: Covilhã, Portugal, 2017. [Google Scholar]
- Aumann, P.; Arnold, T. Part 6A: Paths for Walking and Cycling. In Guide to Road Design; Austroads: Sydney, Austrialia, 2021. [Google Scholar]
- Transport for London. London Cycling Design Standards; Transport for London: London, UK, 2014.
- Taylor, S.; Giang, C.; Chau, P.; Aumann, P. Cycling Aspects of Austroads Guides, 3rd ed.; Austroads: Sydney, Australia, 2017. [Google Scholar]
- Bedoya i Echave, A. Manual Para el Diseño de Vías Ciclistas de Cataluña; Generalitat de Catalunya, Departament de Política Territorial i Obras Públicas: Barcelona, Spain, 2007. [Google Scholar]
- AASHTO. Guide for the Development of Bicycle Facilities, 4th ed.; AASHTO: Washington, DC, USA, 2012. [Google Scholar]
- CROW. Design Manual for Bicycle Traffic; CROW: Ede, The Netherlands, 2017. [Google Scholar]
- Böcker, L.; Anderson, E.; Uteng, T.; Throndsen, T. Bike sharing use in conjunction to public transport: Exploring spatiotemporal, age and gender dimensions in Oslo, Norway. Transp. Res. Part A Policy Pract. 2020, 138, 389–401. [Google Scholar] [CrossRef]
- Department for Transport. Cycle Infrastructure Design—Local Transport Note 1/20; Department for Transport: London, UK, 2020.
- California Department of Transportation. Chapter 1000: Bicycle Transportation. In Highway Design Manual; California Department of Transportation: Sacramento, CA, USA, 2020. [Google Scholar]
- Auckland Transport. Cycling Infrastructure; Auckland Transport: Auckland, New Zealand, 2021.
- Transport Scotland. Cycling by Design; Transport Scotland: Glasgow, UK, 2021.
- da Silva, M.; Martinez, V.; Lohmann, M. Geoprocessing and slope analysis of the cycling network of Londrina/PR. Geopauta 2021, 5, 116–127. [Google Scholar] [CrossRef]
- Fyhri, A.; Heinen, E.; Fearnley, N.; Sundfør, H. A push to cycling—Exploring the e-bike’s role in overcoming barriers to bicycle use with a survey and an intervention study. Int. J. Sustain. Transp. 2017, 11, 681–695. [Google Scholar] [CrossRef]
- Liu, L.; Suzuki, T. Quantifying e-bike applicability by comparing travel time and physical energy expenditure: A case study of Japanese cities. J. Transp. Health 2019, 13, 150–163. [Google Scholar] [CrossRef]
- Gitelman, V.; Korchatov, A.; Carmel, R. Safety-related behaviours of e-cyclists on urban streets: An observational study in Israel. Transp. Res. Procedia 60 2022, 60, 609–616. [Google Scholar] [CrossRef]
- Julio, R.; Monzon, A. Long term assessment of a successful e-bike-sharing system. Key drivers and impact on travel behaviour. Case Stud. Transp. Policy 2022, 10, 1299–1313. [Google Scholar] [CrossRef]
- Mohamed, A.; Bigazzi, A. Speed and road grade dynamics of urban trips on electric and conventional bicycles. Transp. B 2019, 7, 1467–1480. [Google Scholar] [CrossRef]
- Woodcock, J.; Aldred, R.; Lovelace, R.; Strain, T.; Goodman, A. Health, environmental and distributional impacts of cycling uptake: The model underlying the Propensity to Cycle tool for England and Wales. J. Transp. Health 2021, 22, 101066. [Google Scholar] [CrossRef]
- Flügel, S.; Hulleberg, N.; Fyhri, A.; Weber, C.; Ævarsson, G. Empirical speed models for cycling in the Oslo road network. Transportation 2019, 46, 1395–1419. [Google Scholar] [CrossRef]
- Wysling, L.; Purves, R. Where to improve cycling infrastructure? Assessing bicycle suitability and bikeability with open data in the city of Paris. Transp. Res. Interdiscip. Perspect. 2022, 15, 100648. [Google Scholar] [CrossRef]
- Matias, I.; Santos, B.; Virtudes, A. Making Cycling Spaces in Hilly Cities. KnE Eng. 2020, 152–165. [Google Scholar] [CrossRef]
- Langford, B.; Cherry, C.; Bassett, D.; Fitzhugh, E.; Dhakal, N. Comparing physical activity of pedal-assist electric bikes with walking and conventional bicycles. J. Transp. Health 2017, 6, 463–473. [Google Scholar] [CrossRef]
- Carver, S. Integrating multi-criteria evaluation with geographical information systems. Int. J. Geogr. Inf. Syst. 1991, 5, 321–339. [Google Scholar] [CrossRef]
- Chakhar, S.; Mousseau, V. Multicriteria Spatial Decision Support Systems. In Encyclopedia of GIS; Shekhar, S., Xiong, H., Eds.; Springer: New York, NY, USA, 2008; Volume 20. [Google Scholar]
- Chakhar, S.; Mousseau, V. GIS-based multicriteria spatial modelling generic framework. Int. J. Geogr. Inf. Sci. 2008, 22, 1159–1196. [Google Scholar] [CrossRef]
- Eastman, J. Multi-criteria evaluation and GIS. In Geographical Information Systems; John Wiley and Sons: New York, NY, USA, 1999. [Google Scholar]
- Eastman, J.; Jin, W.; Kyem, P.; Toledano, J. Raster procedures for multi-criteria/multi-objective decisions. Photogramm. Eng. Remote Sens. 1995, 61, 539–547. [Google Scholar]
- Belton, V.; Stewart, T. Multiple Criteria Decision Analysis: An Integrated Approach; Springer: New York, NY, USA, 2002. [Google Scholar] [CrossRef]
- Afshari, A.; Yusuff, R. A review of Spatial Multi Criteria Decision Making. In Proceedings of the 6th SASTech, Kuala Lumpur, Malaysia, 4–25 March 2012. [Google Scholar]
- Barfod, M.; Leleur, S. Multi-Criteria Decision Analysis for Use in Transport Decision Making; DTU Transport: Amsterdam, The Netherlands, 2014; 75p. [Google Scholar]
- Department for Communities and Local Government. Multi-Criteria Analysis: A Manual; Department for Communities and Local Government: London, UK, 2009.
- Voogd, J. Multicriteria Evaluation for Urban and Regional Planning. In Delftsche Uitgevers Maatschappij; Delft Academic Press: Delft, The Netherlands, 1982. [Google Scholar]
- Dean, M. Chapter 6—Multi-criteria analysis. In Advances in Transport Policy and Planning; Mouter, N., Ed.; Academic Press: Cambridge, MA, USA, 2020; Volume 6, pp. 165–224. [Google Scholar] [CrossRef]
- Yannis, G.; Kopsacheili, A.; Dragomanovits, A.; Petraki, V. State-of-the-art review on multi-criteria decision-making in the transport sector. J. Traffic Transp. Eng. 2020, 7, 413–431. [Google Scholar] [CrossRef]
- Passos, S. Instrument for Bicycle Suitability Maps Creation Using GIS. Master’s Thesis, University of Beira Interior, Covilhã, Portugal, 2018. [Google Scholar]
- Ferreira, S. Automatização de um Modelo de Análise Espacial em SIG para a Avaliação do Potencial de Mobilidade Suave. Master’ Thesis, University of Beira Interior, Covilhã, Portugal, 2021. [Google Scholar]
- Lucena, P. Análise Multicritério Espacial Aplicada à Avaliação do Potencial de Mobilidade Suave. O Caso das Cidades de Encosta. Master’ Thesis, University of Beira Interior, Covilhã, Portugal, 2021. [Google Scholar]
- Nogueira, A.; Santos, B.; Gonçalves, J.; Kempa, J.; Chmielewski, J. Transportation Network Spatial Analysis to Measure Pedestrian Suitability. The Case of Hilly Cities. IOP Conf. Ser. Mater. Sci. Eng. 2021, 1203, 022107. [Google Scholar] [CrossRef]
- Sousa, A.; Santos, B.; Goncalves, J. Pedestrian Environment Quality Assessment in Portuguese Medium-Sized Cities. IOP Conf. Ser. Mater. Sci. Eng. 2019, 471, 062033. [Google Scholar] [CrossRef]
- Caires, D. REOT Covilhã-2019 Relatório do Estado do Ordenamento do Território: Avaliação da Dinâmica e Evolução Urbanística do Concelho da Covilhã; Câmara Municipal de Valença: Covilhã, Portugal, 2019. [Google Scholar]
- Tomé, A.; Santos, B.; Carvalheira, C. GIS-Based Transport Accessibility Analysis to Community Facilities in Mid-Sized Cities. IOP Conf. Ser. Mater. Sci. Eng. 2019, 471, 062034. [Google Scholar] [CrossRef]
- Portal do INE, Statistics Portugal. Available online: https://www.ine.pt/xportal/xmain?xpgid=ine_main&xpid=INE&xlang=pt (accessed on 24 January 2021).
- TIS—Consultores em Transportes Inovação e Sistemas; Universidade da Beira Interior. PAMUS das Beiras e Serra da Estrela Fase 3: Proposta do PAMUS-BSE; TIS—Consultores em Transportes Inovação e Sistemas: Covilhã, Portugal, 2016. [Google Scholar]
- Matias, I.; Santos, B.; Gonçalves, J.; Kempa, J.; Chmielewski, J. EU and Portuguese Cycling Strategy for Sustainable Urban Mobility. In Proceedings of the 7th World Multidisciplinary Civil Engineering-Architecture-Urban Planning Symposium—WMCAUS, Prague, Czech Republic, 5–9 September 2022. accepted. [Google Scholar]


| Year | Event | Brief Description |
|---|---|---|
| 2007 | Green Paper—Towards a new culture of urban mobility [7] | Defined a European agenda for urban mobility. Priority challenges: cities and towns decongested; greener cities and towns; smarter, affordable, and safe urban transport. |
| 2009 | Action Plan on Urban Mobility [15] | Proposed 20 measures to encourage and help local, regional, and national authorities in achieving their goals for sustainable urban mobility, including actions to promote cycling. The European Commission (EC) presented for the first time a comprehensive support package in the field of urban mobility. |
| 2011 | White Paper: Roadmap to a single European Transport Area—Towards a competitive and resource-efficient transport system [8] | Two explicit mentions to cycling in the 40 initiatives set out in the EU: efforts to deliver a ‘zero-vision’ for the number of road transport casualties, and the importance of promoting cycling as an alternative to car use. Acknowledges the importance of cycling in delivering clean and sustainable urban mobility and becoming an integral part of the urban transport system. |
| 2013 | Together towards competitive and resource-efficient urban mobility [11] | Sets out the concept of Sustainable Urban Mobility Plans (SUMP) on urban logistics and access regulations, deployment of Intelligent Transportation Systems (ITS) solutions in urban areas, and urban road safety. Promotes the development of strategies that can stimulate a shift towards cleaner and more sustainable transport modes, such as walking and cycling. |
| 2014 | Paris Declaration—City in motion: People first [12] From Amsterdam to Paris and Beyond: the transport, health and environment Pan-European programme [16] | Explicitly recognized the benefits of cycling in delivering sustainable economic development, reducing transport-related emissions, and promoting a more efficient transport system, whilst developing a Pan-European masterplan for the promotion of cycling. |
| 2015 | Declaration on cycling as a climate friendly transport mode [17] | Called the Commission to act on: integrate cycling into multimodal transport policy, including smart mobility, stressing the need to promote physical infrastructure and behavioral change programs; develop an EU-level strategic document on cycling; and set up a European focal point for cycling to serve as a one-stop-shop for relevant questions and facilitate exchange of best practices. |
| 2016 | Urban agenda for the EU—Pact of Amsterdam [9] | Established and noted that cycling was one of the elements to be focused on while delivering sustainable and efficient urban mobility. |
| A European strategy for low-emission mobility [10] | The EU Commission refer to cycling in the section on action by cities, underlining the importance of local action and SUMP in enabling and encouraging cycling. | |
| 2017 | Opinion of the European Committee of the Regions—An EU roadmap for cycling [13] | Established a set of policy recommendations, such as the inclusion of an EU Roadmap for Cycling in the Commission’s Work Programme 2018 with actions to disseminate and raise awareness of cycling benefits and to promote a culture of cycling. Supported the development of a Pan-European Master Plan for cycling promotion. |
| EU Cycling Strategy—Recommendations for achieving green growth and effective mobility in 2030 [14] | Designed to inspire the EC to develop its own European Cycling Strategy. Defined four central objectives: cycling as an equal partner in the mobility system; a 50% increase in EU bicycle use by 2030; a 50% decrease in EU killed and seriously injured cyclists by 2030; and increase the EU’s investment in bicycles to €3 billion in 2021–2027 period and €6 billion for 2028–2034. | |
| 2018 | Graz Declaration—Starting a new era: clean, safe and affordable mobility for Europe [18] | Discussed pathways leading to clean mobility. Acknowledged cycling as an equal mode of transport, developing a European strategic and supportive framework to promote and integrate active mobility in European funding and financing schemes. |
| 2019 | Directive (EU) 2019/1936 [19] | Revised the Directive 2008/96/EC on Road Infrastructure Safety Management (RISM), with dedicated guidance on road design quality requirements for “vulnerable” road users (cyclists, pedestrians, and powered two-wheelers). |
| 2020 | Sustainable and Smart Mobility Strategy—putting European transport on track for the future [20] | The strategy sets out a roadmap for European transport firmly on the track to sustainable and smart future mobility. It identifies 10 flagship areas with an action plan for future years, supporting the 2030 climate target plan. It aims for a 90% reduction in the transport sector’s emissions by 2050, defining several initiatives to increase cycling mode share to achieve zero emissions, zero road fatalities, and first/last mile healthy mobility solutions. |
| 2021 | Pan-European Master Plan for cycling promotion [21] | The plan established several objectives to be implemented in the Pan-European region by 2030:
|
| Year | Event | Brief Description |
|---|---|---|
| 2005 | ECOXXI Sustainability education program [28,29,30] | The program involved the identification of local sustainability indicators including sustainable mobility—indicator 18. This indicator evaluated the incentive to soft/active modes measured by the description of the three main actions to encourage soft/active modes implemented by a given municipality in the previous three years. |
| 2007 | Law no. 58/2007 National Program for Spatial Planning Policy (PNPOT) [23] | Framework of reference for other programs and territorial plans and a guiding instrument for strategies with territorial impact. A set of priority measures were established including the development of sustainable urban transport plans that aimed to reinforce the use of public transport and non-motorized mobility and improve the air quality, particularly in densely populated areas. |
| Portuguese Sustainable Development Strategy (ENDS 2015) [24] | Defined the strategic objectives, priorities, and the most relevant vectors for accessibility and mobility. ENDS 2015 was the benchmark for the application to Community funds through the 2007–2013 period. It focused mainly on contributing to the reduction of air pollutants and noise, particularly in urban areas, and improving accessibility to citizens with reduced mobility. | |
| 2009 | Resolution no. 3/2009—Recommendations for the National Plan for the promotion of bicycles and others soft transport modes [31] | The resolution established 6 objectives to achieve:
|
| 2012 | ciclAndo—Plan for the promotion of bicycles and other soft modes [32] | Following the recommendations of resolution no. 3/2009, the plan defined 2 structuring strategic objectives framed in 5 areas of action with 17 operational goals. |
| Portuguese Guidelines for Mobility [33] | Eleven guidelines for mobility were established constituting a set of instruments, plans and programs called the “Mobility Package”. The package also contains a guide for accessibility, mobility, and transport in municipal spatial planning; a guide for preparing mobility and transport plans; a collection of technical/thematic brochures to support the preparation of mobility and transport plans, including a brochure on the principles for cycling networks planning and design; a guide for the elaboration of trip generation points mobility plans; and a guide on urban logistics. | |
| 2015 | Resolution no. 28/2015—Green Growth Commitment [25] | This strategic document highlights the need to find alternatives to private car use and the importance of promoting the bicycle as a particularly efficient urban mobility mode, increasing its share in urban trips and its articulation with public transport modes. |
| 2018 | Bikeable Portugal 2030 [26] | The program’s main objective was the identification of a set of favorable cycling scenarios in mainland Portugal to be integrated into an inter-municipal connectivity plan. |
| 2019 | National Strategy for Cycling Active Mobility 2020–2030 (ENMAC) [27] | ENMAC expects to reach 10,000 km of cycle paths by 2030, built through several investment initiatives; a cycling modal share of 7.5% in national territory and 10% in cities; and the reduction in road accidents involving cyclists by 50%. ENMAC foresees the implementation of 51 measures organized into 6 strategic dimensions. |
| Roadmap for Carbon Neutrality 2050 (RNC2050) [34] | The government expects, by 2050, between 8% and 14% of short-distance mobility to be made using low-impact or active modes. This is considered one of the 5 main decarbonization drivers in the transport sector. | |
| 2020 | Normative document for application to urban streets—Issue III—Geometric characteristics for non-motorized traffic streets [35] | The normative includes the cyclable road’s theme, covering typologies, design and dimensioning, and measures to be applied in specific situations. The Normative can be considered a support document for ENMAC implementation. |
| 2021 | Regulation to support financially the acquisition of low emission vehicles [36] and for the implementation of bike park systems [37] | The incentive for the acquisition of low emission vehicles allocates financial support for individual persons and companies considering specific criteria. The financial support for the implementation of bike park systems aims to encourage the acquisition and installation of equipment for parking bicycles in places served by cycle paths, where “bicycle use” is notorious or in places where such use is intended to be stimulated, such as transport interfaces, schools, health services and other public services. |
| National Climate Basic Law (Law 98/2021) [38] | The government assumes the compromise to promote cycling and pedestrian mobility (article 50—Sustainable Mobility) |
| Source | Slope | Description/Criteria for Cycling |
|---|---|---|
| Government of Catalonia Ministry of Town and Country Planning and Public Works—Manual for the design of cycle paths in Catalonia (2008) [60] | 0 to 2% | No length limit |
| 4% | Up to 4 km | |
| 5% | 2 km | |
| 6% | 240 m | |
| 10% | 30 m | |
| 25% | 15 m | |
| Portuguese Institute of Mobility and Land Transport (IMTT)—Cyclable Network: Planning and design principles (2011) [6] | 0 to 3% | Level: Good for cycling |
| 3 to 5% | Gentle slope: Suitable for cycling up to medium distances. | |
| 5 to 8% | Moderate slope: Inappropriate for long and medium distances. | |
| 8 to 10% | Steep slope: Acceptable for very short distances. | |
| American Association of State Highway and Transportation Officials (AASHTO)—Guide for the development of bicycle facilities (2012) [61] | 0 to 5% | Shared use path: The maximum slope of a shared use path adjacent to a roadway should be 5%, but the slope should generally match the slope of the adjacent roadway. Slopes on paths in independent rights-of-way should also be limited to 5% maximum. |
| >5% | Shared use path: Where a shared use path runs along a roadway with a slope that exceeds 5 percent, the side path slope may exceed 5 percent but must be less than or equal to the roadway slope. | |
| - | On-road facilities: If properly designed for motor vehicles, roadway design elements such as slope will meet or exceed the minimum design standards applicable to bicycles. | |
| Transport for London—London cycling design standards (2014) [58] | 0 to 3% | For cycle tracks, a maximum slope of 3% is recommended. |
| 3 to 5% | 3% can rise to 5% over a distance of up to 100 m. | |
| 5 to 7% | Where it is unavoidable, a slope of up to 7% over a distance of no more than 30 m is acceptable. | |
| >7% | In some circumstances, slopes steeper than 7% over short distances on a cycle route may be preferable to failing to provide the route at all. | |
| Comfort indicator: Uphill slope over 100 m >5% Basic cycling level of service 3 to 5% Good cycling level of service <3% Highest cycling level of service | ||
| Austroads—Cycling aspects of Austroads Guides (2017) [59] Austroads—Guide to road design Part 6A: Paths for walking and cycling (2021) [57] | 0 to 3% | Uphill: 3% is the desirable maximum slope for use on cycling paths. |
| 3 to 5% | Uphill and downhill: Slope to a maximum of about 5% and providing short flatter sections (20 m long) at regular intervals to give cyclists travelling, both uphill and downhill, some relief from the slope. | |
| >5% | Downhill: Slope steeper than 5% should not be provided unless it is unavoidable. | |
| Avoid | Slope greater than 10% over 50 m with horizontal curves or a slope of 12% over 50 m on a straight path. | |
| CROW Design manual for bicycle traffic (2017) [62] | 2 to 10% | Depending on slope height and length (slope severity/difficulty). Z = H2/L Z = slope difficulty H = slope height difference (m) L = slope length (m) |
| Böcker et al. (2020) [63] | <4% | Low slopes: Topography is not a limiting factor. |
| 4 to 8% | Moderate uphill slope: Topography does become a significant constraint. | |
| >8% | Cyclists generally avoid steep uphill and downhill slopes. | |
| Cycle Infrastructure Design (2020) [64] | <5% | Maximum desirable slope—up to 30 m. |
| 8% | Absolute maximum slope. | |
| Highway Design Manual—Chapter 1000—Bicycle transportation design (2020) [65] | <2% | Sustained slope. |
| <5% | Maximum recommended slope. | |
| Cycling Infrastructure—Auckland Transport (2021) [66] | <3% | Maximum desired slope. |
| <5% | Undesirable because the ascents are difficult for many people to climb, and descents cause excess of speed. | |
| >5% | Recommended only for short sections. | |
| Cycling by Design—Transport Scotland (2021) [67] | <3% | Providing cycle links on steep gradients will not provide the highest level of service for all users, and alternative routes should be considered where practical. |
| Geoprocessing and slope analysis of the cycling network of Londrina/PR (2021) [68] | <5% | Considered acceptable. |
| >5% | “Warning points” for the implementation of infrastructure that helps cyclists in their travels. | |
| <8% | International references considered gradient slope of up to 8% as acceptable depending on the terrain and conditions offered to the cyclist. | |
| Service Areas | Score (0–100) | Facility Category | Weight | |
|---|---|---|---|---|
| Travel Distance (m) | Travel Time (min) | |||
| 1000 | 0–4 | 90 | Transportation | 0.69 |
| 2500 | 4–10 | 75 | Health | 0.70 |
| 5000 | 10–20 | 50 | Educational | 0.79 |
| 10,000 | 20–40 | 1 | Services | 0.68 |
| >10,000 | >40 | 0 | Commercial | 0.71 |
| Tourism | 0.80 | |||
| Culture | 0.73 | |||
| Recreation | 0.82 | |||
| Sport | 0.78 | |||
Publisher’s Note: MDPI stays neutral with regard to jurisdictional claims in published maps and institutional affiliations. |
© 2022 by the authors. Licensee MDPI, Basel, Switzerland. This article is an open access article distributed under the terms and conditions of the Creative Commons Attribution (CC BY) license (https://creativecommons.org/licenses/by/4.0/).
Share and Cite
Santos, B.; Passos, S.; Gonçalves, J.; Matias, I. Spatial Multi-Criteria Analysis for Road Segment Cycling Suitability Assessment. Sustainability 2022, 14, 9928. https://doi.org/10.3390/su14169928
Santos B, Passos S, Gonçalves J, Matias I. Spatial Multi-Criteria Analysis for Road Segment Cycling Suitability Assessment. Sustainability. 2022; 14(16):9928. https://doi.org/10.3390/su14169928
Chicago/Turabian StyleSantos, Bertha, Sílvia Passos, Jorge Gonçalves, and Isabel Matias. 2022. "Spatial Multi-Criteria Analysis for Road Segment Cycling Suitability Assessment" Sustainability 14, no. 16: 9928. https://doi.org/10.3390/su14169928
APA StyleSantos, B., Passos, S., Gonçalves, J., & Matias, I. (2022). Spatial Multi-Criteria Analysis for Road Segment Cycling Suitability Assessment. Sustainability, 14(16), 9928. https://doi.org/10.3390/su14169928