1. Introduction
Regardless of its history of almost half a century, the concept of the circular economy has been unsuccessful in capturing the general interest and establishing itself as a strategic priority, irrespective of its beneficial activity and the great possibilities that the system along with its methods promises. In the context and under the pressures of the global energy, food and financial crisis, the remarkable idea of regenerative design launched by Lyle in the 1970s and developed within the theoretical context of sustainability [
1,
2] returns as the primary current model. According to Stahel [
3], one of the founders, the circular economy is based on “a new relationship between goods and materials” that involves recycling resources and energy while creating jobs.
Starting with the “2030 Agenda for Sustainable Development”, the European Union (EU) adopted ambitious action plans and transformative strategies, policies and practices for a circular economy transition [
4,
5,
6,
7,
8,
9,
10,
11]. Regarding the most recent EU approach toward a circular economy, in March 2022, the European Commission presented a set of measures in order to facilitate a faster transition that emphasized the responsibility of product buyers and the promotion of sustainable products [
12].
The EU is stimulating the transition to the circular economy by providing hundreds of millions of euros a year in order to alter the economy of EU member states to achieve the EU’s major goals of full employment and climate change eradication and to encourage them to adopt best practices. Transitioning a country to circular economy has both considerable expenses and benefits. Some EU member states adopted early transition plans and strategies for the circular economy and have managed to achieve economic growth unconnected to climate change adaptation measures; others have not yet done so. However, considering the complexity of the transition process, the implementation of the circular economy worldwide is unequal and in most instances in its incipient phase. An analysis of the successful experiences at the macro level summarizes a few key factors that support the transitional process toward a circular economy. The lesson learned from the EU is that really implementing the circular economy requires, on the one hand, smart regulation and on the other hand, the long-term involvement of all actors in society, at all levels—member states, regions, cities, businesses, citizens—and their ability to develop cooperation networks and suitable collaboration and exchange patterns. Economic actors, from the viewpoint of the EU, play a critical role in achieving this shift given that most hurdles are found at the microeconomic level [
8,
9].
The circular economy is a challenge for the competitive business environment both for obtaining quality products and services at an acceptable price and for implementing clean production flows and activities, in accordance with the green transition, digitalization and specific environmental standards and the challenges posed in the competitive environment by climate changes [
13].
A circular economy involves sharing products and purchasing services rather than goods. Raw materials and consumables are used many times; the goods are designed to serve for longer periods of time. The raw materials and consumables from which the goods are made are reused at the end of their life or at an intermediate stage, thus ensuring the minimization of the amount of waste generated from the production and use of finished products. Although the circular economy is often associated with recycling, in some cases, this is only the first step in its implementation.
In the face of the growing shortage of natural resources and the rapid increase in waste, the transition toward a circular economy is a current trend. States, having developed their national strategies and plans for sustainable development, are gradually moving towards new “circular” business models, introducing new standards and changing their production and consumption strategies. Unlike the traditional model of economic development, the circular model is the most successful way to conserve resources and materials, then aiming for the path to continued economic growth.
For the economy to become circular, it is necessary not only to eliminate all waste but especially to change the mentality of the producer and the consumer, to establish close cooperation between industry, researchers, and government [
14]. Our world is about to change radically, from the choices of raw materials and the way products and new service concepts are developed to the widespread use of by-products in one industry as valuable raw materials for another.
A circular economy means that all participants in the economic chain are going to be participating in the creation of a new product or service. Small, medium and large companies need to rethink the supply chain and start seeing it as an interconnected network of companies moving in the same direction. By creating production models that reduce dependence on raw materials and by continuously recycling materials of all kinds back into the production cycle, companies will be economically advantaged compared with their competition and protect themselves from the volatility of the product market.
Despite the importance of the concept of the circular economy for academia, national governments and supranational institutions and companies, the relationship between circular economies and sustainable economic development is unclear and insufficiently researched [
15]. Therefore, this research aims to establish the correlations between the circular economy and the indicators to measure its implementation, namely sustainable economic development.
This paper presents the analysis of the influence of circular economy indicators on sustainable economic development in the EU, using the panel regression method on annual statistical data collected from the Eurostat database from 2012 to 2020. The selected circular economy indicators are: environmental tax revenues, environmental protection expenditures, recycling rate of municipal waste and trade in recyclable raw materials. The dependent variable used is GDP per capita. The following hypothesis was tested: GDP per capita is influenced by circular economy indicators. Assessing EU member states’ circular economy indicators’ influence on GDP per capita fills a research gap due to the lack of a widely used approach in the context of the multitude of potential indicators.
2. Literature Review
The concept of a circular economy involves direct participation in the planning and development stages of products to ensure a long life cycle and a high potential for reuse, modernization, recovery and subsequent recycling. Ideally, the phases of the circular economy model should be started long before the product becomes unusable or requires processing or repair.
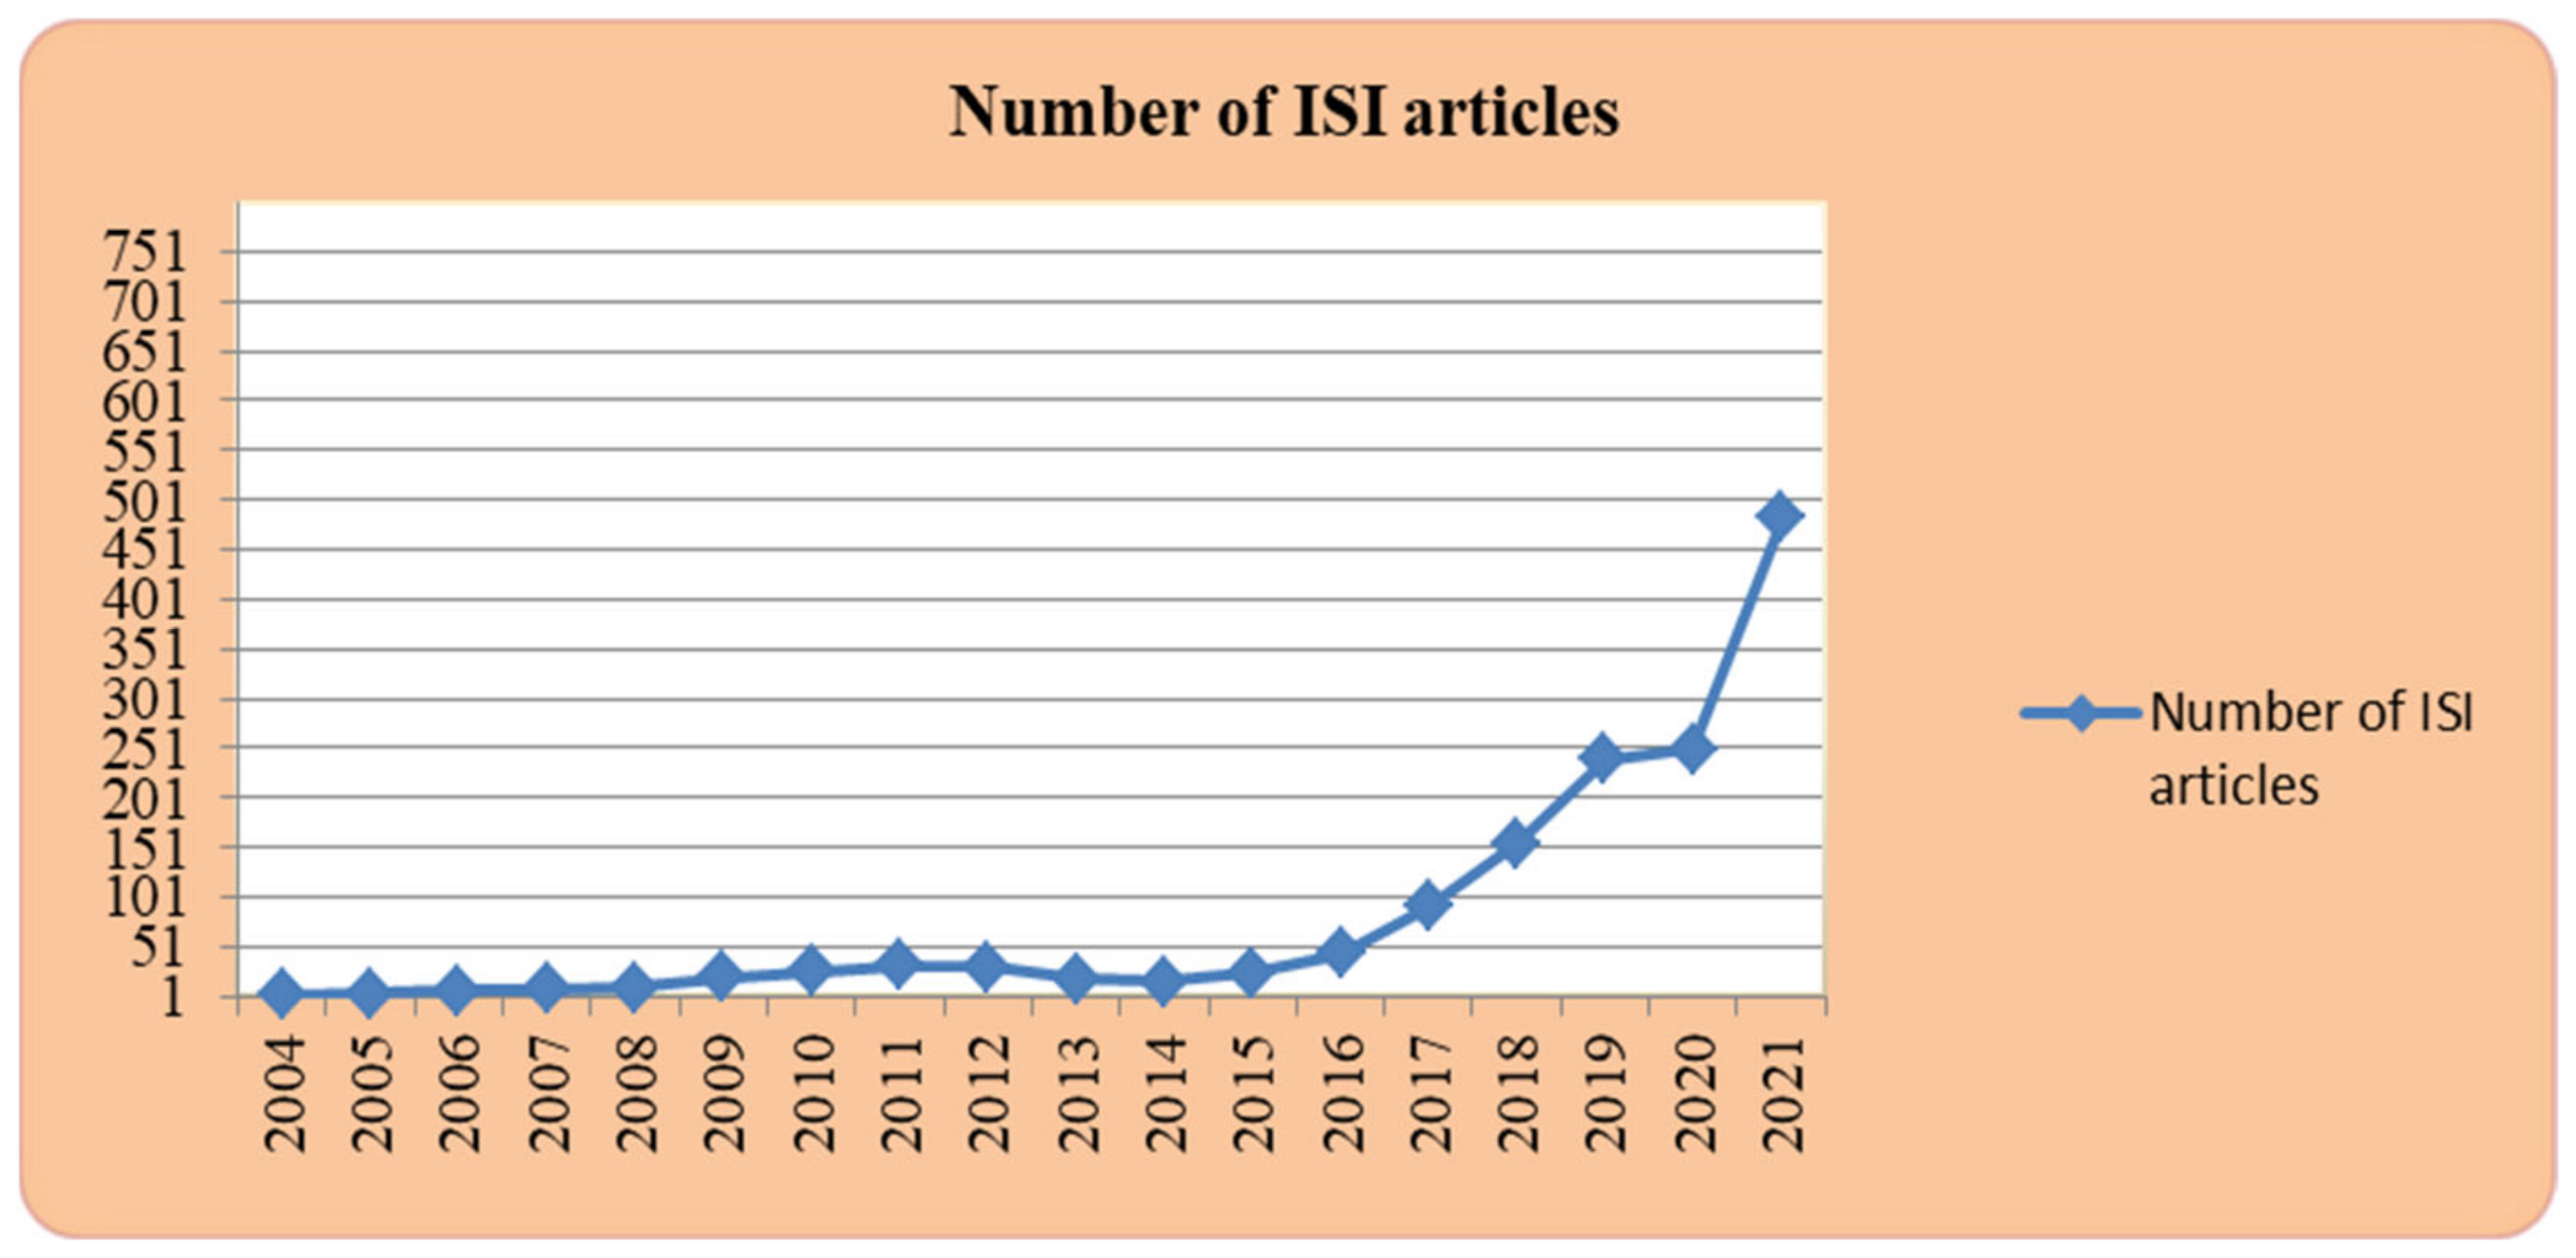
Over the years, researchers worldwide have dedicated their attention to studying this circular economy model and its correlation with sustainable economic development, with 1729 ISI scientific papers already being recorded in the WoS database in June 2022 that include these keywords in their subjects: “circular economy” and/or “sustainable economic development”. The first article published on this research subject appeared in 2004, and beginning in 2018, their number increased significantly, as shown in
Figure 1.
The ISI articles shown in
Figure 1 fall into the following areas of research: environmental sciences (42.22%), green sustainable science technology (34.82%), engineering environmental (18.91%), environmental studies (21.05%), management, business, economics (24.86%).
As regards to the country where the authors of the articles come from, China ranks first with 23.59% of all scientific studies published in WoS on this topic, followed by Italy (10.76%), England (8.33%), Spain (8.04%), the USA (6.07%), Germany (5.38%), the Netherlands (5.03%) and Poland (5.03%).
This section will focus on the most important articles related to the circular economy concept and its correlation with sustainable economic development. The correlation between “
circular economy” and sustainable economic development is the result of a problematic discussion among scientists, innovators and entrepreneurs in the 1960s [
16] in which early work focused on increasing the competitiveness of companies by saving resources and reducing waste [
17]. The concept of the circular economy appears at the intersection of two sciences: ecology and economics. In 1966, the theory of the circular economy was presented by the American economist K. Boulding, who said that the earth became the only spaceship without unlimited tanks, so each of us must find his place in the cyclical ecological system [
16].
The concept of a
circular economy leads to the expansion of sectors of economies based on circular business models (circular suppliers, resource recovery, sharing and reuse platforms, etc.) and the formation of innovative ecosystems [
18,
19]. The circular economy is also defined as a “re-generable economy by design”, “an economic system where goods and services are produced and commercialized through the closing of the loops” [
20,
21,
22] and “a method of overcoming the current production and consumption model based upon the increase of the quantity utilized” [
23].
Regardless of the definition, the central idea pertains to methods of adding value while minimizing expenditures in economic activity. Stopping the drain and waste of resources through reduction, reuse and recycling, the loops are closed and there is a chance at protecting and maintaining what is inside, mainly related to welfare.
Presently, the concept of the circular economy and the associated models aggregate the contributions of various schools of thought, having as a foundation principle the ancient philosophy of identifying natural systems from the real world. In search of its conceptual identity, the circular economy underwent various stages: “regenerative design” launched by Lyle [
1]; “performance economy” represented by Stahel [
17]; the “philosophy of redesign” and the “cradle-to-cradle model” as stated by McDonough and Braungart [
24]; “industrial ecology” developed by Lifset and Graedel [
25]; “the green economy”, defined by UNEP [
26]; “the blue economy” of Gunter Pauli [
27,
28]; and “bio-based economy” [
29] and “natural capitalism” promoted by Lovins, Lovins and Hawken [
20,
21,
23,
30].
As a result, the purpose of the circular economy was crystalized, mainly to create a regenerative system that would enable a longer product life cycle and an economy that would operate efficiently on all levels through a regenerative design and through the reduction, reutilization and recycling of all materials [
20,
21,
23], which goes further than the reduction of negative externalities as in the linear economy. As Ghisellini, Cialani and Ulgiati [
23] pointed out, the “holy grail” of the circular economy could be accomplished, mainly attaining economic growth without negatively affecting the environment. In this light, the transition to the circular economy is a strategic alteration that “requires a systemic transformation encompassing long-term resilience and capable of generating economic, environmental and social opportunities and benefits” [
20,
21].
The circular economy should lead to the creation of a system that allows for the long life of products through optimal reuse, reconditioning and recycling of products and materials [
20,
21,
23]. The ultimate target of the circular economy is to decouple environmental pressure from economic growth [
23].
Many countries have a linear economic model based on a growing shortage of raw materials and energy resources, an increase in environmental pollution and an increase in unorganized landfills as well as in industrial and household waste. For this reason, there is a rethinking of the traditional economic model, and increasing attention is being paid to the concept of the circular economy based on the “take, make, reuse” principle [
31].
The circular economy model aims to save resources, on the one hand, and raw materials and materials, on the other hand. There are three characteristics of the circular economy: increased control over nonrenewable natural resources and maintaining a sustainable balance of renewable natural resources that maintain an inexhaustible level of natural capital [
32]; the optimization of consumption processes through the development and distribution of products, components and materials corresponding to the highest level of reuse; and identifying and preventing the negative externalities of current production activities in order to increase economic efficiency and improve environmental systems [
33].
The circular economy distinguishes technical and biological cycles. Organic food and materials are adapted to be recycled through natural processes, and consumption is only achieved in biological cycles. Through these processes, renewable resources are provided for the economy, products are restored and raw and materials are reused and sometimes recycled [
34]. It is important to mention that modern advances consist of information, technology and the development of IT infrastructure in the context of the circular economy oriented towards the virtualization, dematerialization and intellectualization of production processes. From the traditional point of view, production and consumption are linear, and so is the final process. Unlike the linear economic model, the circular mechanism of the economy involves an increase in the share of renewable and recyclable resources in production processes, thus reducing the consumption of raw materials. The mechanism of the circular economy conserves resources, using them as much as possible, extracting maximum value during use, restoring products and reusing raw and materials. This mechanism creates added value in the recycling process and maximizes the use of all production products [
35].
Walker et al. [
36] conducted a semi-quantitative study involving interviews with companies applying the circular economy model in Italy and the Netherlands to understand the concept of the circular economy and its causal link with sustainability. The survey results show that most companies claim that they support sustainability and circularity and that the circular economy is one of the means for sustainable economic development. However, respondents are not very clear whether the circular economy increases economic benefits.
In their paper, Moraga et al. [
37] suggested an array of indicators to measure the level of fulfillment of the circular economy, most of them focusing on the conservation of materials and waste recycling. Among the specific indicators of the circular economy analyzed in the paper are trade in recyclable raw materials, specifically the recycling rate.
The current state of the environment and the climate change we are facing require a fundamentally new approach to the implementation of economic activity. They require a rational use of natural resources and a transition to a closed-loop economy. Some noteworthy examples of this are: the use of low-waste and waste-free technologies, the introduction of biological methods of pest control in agriculture, the creation of environmentally friendly species and the improvement of technologies for the extraction and transport of natural raw materials [
38,
39].
Many authors such as Hysa et al., Corona et al., Lakatos et al. and Laht et al. [
34,
40,
41,
42] showed that production and consumption, competitiveness and innovation, waste management and secondary raw materials have significant influence on the economic dynamics of a country, the last two indicators actually measuring the circular economy.
There are numerous comparative studies of circular economy indicators’ influence on sustainable economic development between EU member states. In the context of a lack of a standard system of circular economy indicators or a widely used approach, these studies select various combinations of indicators. For example, Mihai, Manea and Vasile [
43] select the share of renewable energy, gas emissions and unemployment rate and test their influence on GDP per capita; Georgescu, Kinnunen and Androniceanu [
44] select: the research and development expenditure, the generation of municipal waste per capita and the recycling rate of municipal waste and also test their influence on GDP per capita; Grdic, Nizic and Rudan [
45] identified GPB as an independent variable and combined the production of municipal waste per capita and the recycling rates of: municipal waste, packaging waste, bio-waste and e-waste as the dependent variables; Chen and Pao [
46] select the municipal waste generation per capita and the municipal waste recycling rate and combine these with the circular economy-related investment, the circularity rate and the trade in recyclable raw materials. Gomonov et al. [
47] pointed out that the best quality indicator for the classification of EU member states regarding dynamics in the development of the circular economy is the generation of municipal waste per capita.
Coscieme, Mortensen and Sutton [
48] criticized the choice of GDP per capita, arguing that “limitless economic growth is not possible on a planet with finite resources” and that in the EU, GDP is inversely related to indicators of environmental sustainability. On the contrary, Nazarko, Chodakowska and Nazarko [
49] stated that the position of an EU member state in achieving circular economy objectives is strongly correlated with the GDP per capita and pointed out “five meta-indicators: Recycling rate of general waste, Waste production, Jobs and investments, Recycling rate of special waste, and Circular material use rate”. There are also many studies focusing on the indicators and strategies related to the circular economy at micro-economic levels. In a comprehensive framework, Kravchenko, Pigosso and McAloone [
50] identified leading sustainability-related performance indicators according to circular economy strategies in the manufacturing industry and proved that prior to implementation, any decision to adopt a circular economy strategy should be carefully evaluated in terms of its prospective sustainability performance. Bocken et al. [
51] pointed out that business model and design strategies must work together to shift from a linear to a circular economy. Examples of key business model strategies for transitioning to a circular economy are classified by Bocken et al. [
51] and Bakker et al. [
52]: business model strategies for decelerating loops (extending the life span and increasing the value of the product, the long life model of the products, performance model) and business model strategies for closed-loop system (boosting resource value, industrial symbiosis).
Numerous studies explore specific issues of the circular economy in firms with different levels of environmental awareness or experience in different industries among leading manufacturers and traditional manufacturers, with the most studied industries being IT and electronics, automotive, chemicals and food, as shown by Botezat et al. [
53]. Recent interesting studies explore and validate the circular economy’s application in constructions such as the study by Teixeira Marvila et al. [
54] regarding the use of cementation ceramics in construction materials, the study by Awoyera and Adesina [
55] regarding the use of plastic waste for construction applications or the study by Klyuev et al. [
56] regarding the usage of fibrous waste in construction materials.
Our research focuses on the macroeconomic level connected with the theoretical literature that test circular economy indicators’ influence on GDP per capita [
43,
44,
46,
49] and select as independent variables the
recycling rate of municipal waste, one of the most recommended indicators in the literature [
44,
45,
46,
49] and the
trade in recyclable raw materials, also frequently used [
46]. In addition to previous studies, in this research are also selected two independent variables,
environmental tax revenues and
environmental protection expenditures, that constitute the novelty of our approach.
3. Materials and Methods
Currently, the linear economy model, due to its destructive effect on the planet’s ecosystem, is recognized as inconsistent with the principles of sustainable development. For this reason, EU member states have begun to develop new concepts of efficient management, using technologies to conserve the planet’s ecosystem. This has resulted in a circular economy model in which waste is to be integrated into new economic processes, bringing benefits to the environment and the economy.
In this research are analyzed annual statistical data collected from the Eurostat database for 27 EU member states for the years 2012–2020, resulting in a total of 236 observations. Following the issues mentioned in the previous paragraphs, the following relevant variables are analyzed:
Dependent variable: GDP_CAP—Gross domestic product (GDP) per capita.
Independent variables:
- °
tr_raw—Trade in recyclable raw materials
- °
envr_wasmun—Recycling rate of municipal waste
- °
envr_tx—Environmental tax revenues
- °
gov_ep—Environmental protection expenditures
In order to analyze the statistical impacts of the four exogenous variables on the endogenous one (GDP_CAP), a statistical hypothesis was proposed and validated based on a panel regression model:
H0. GDP/capita is influenced by circular economy indicators.
GDP per capita expressed in purchasing power parity is one of the key indicators of a nation’s economic development, reflecting the real level of well-being of its population.
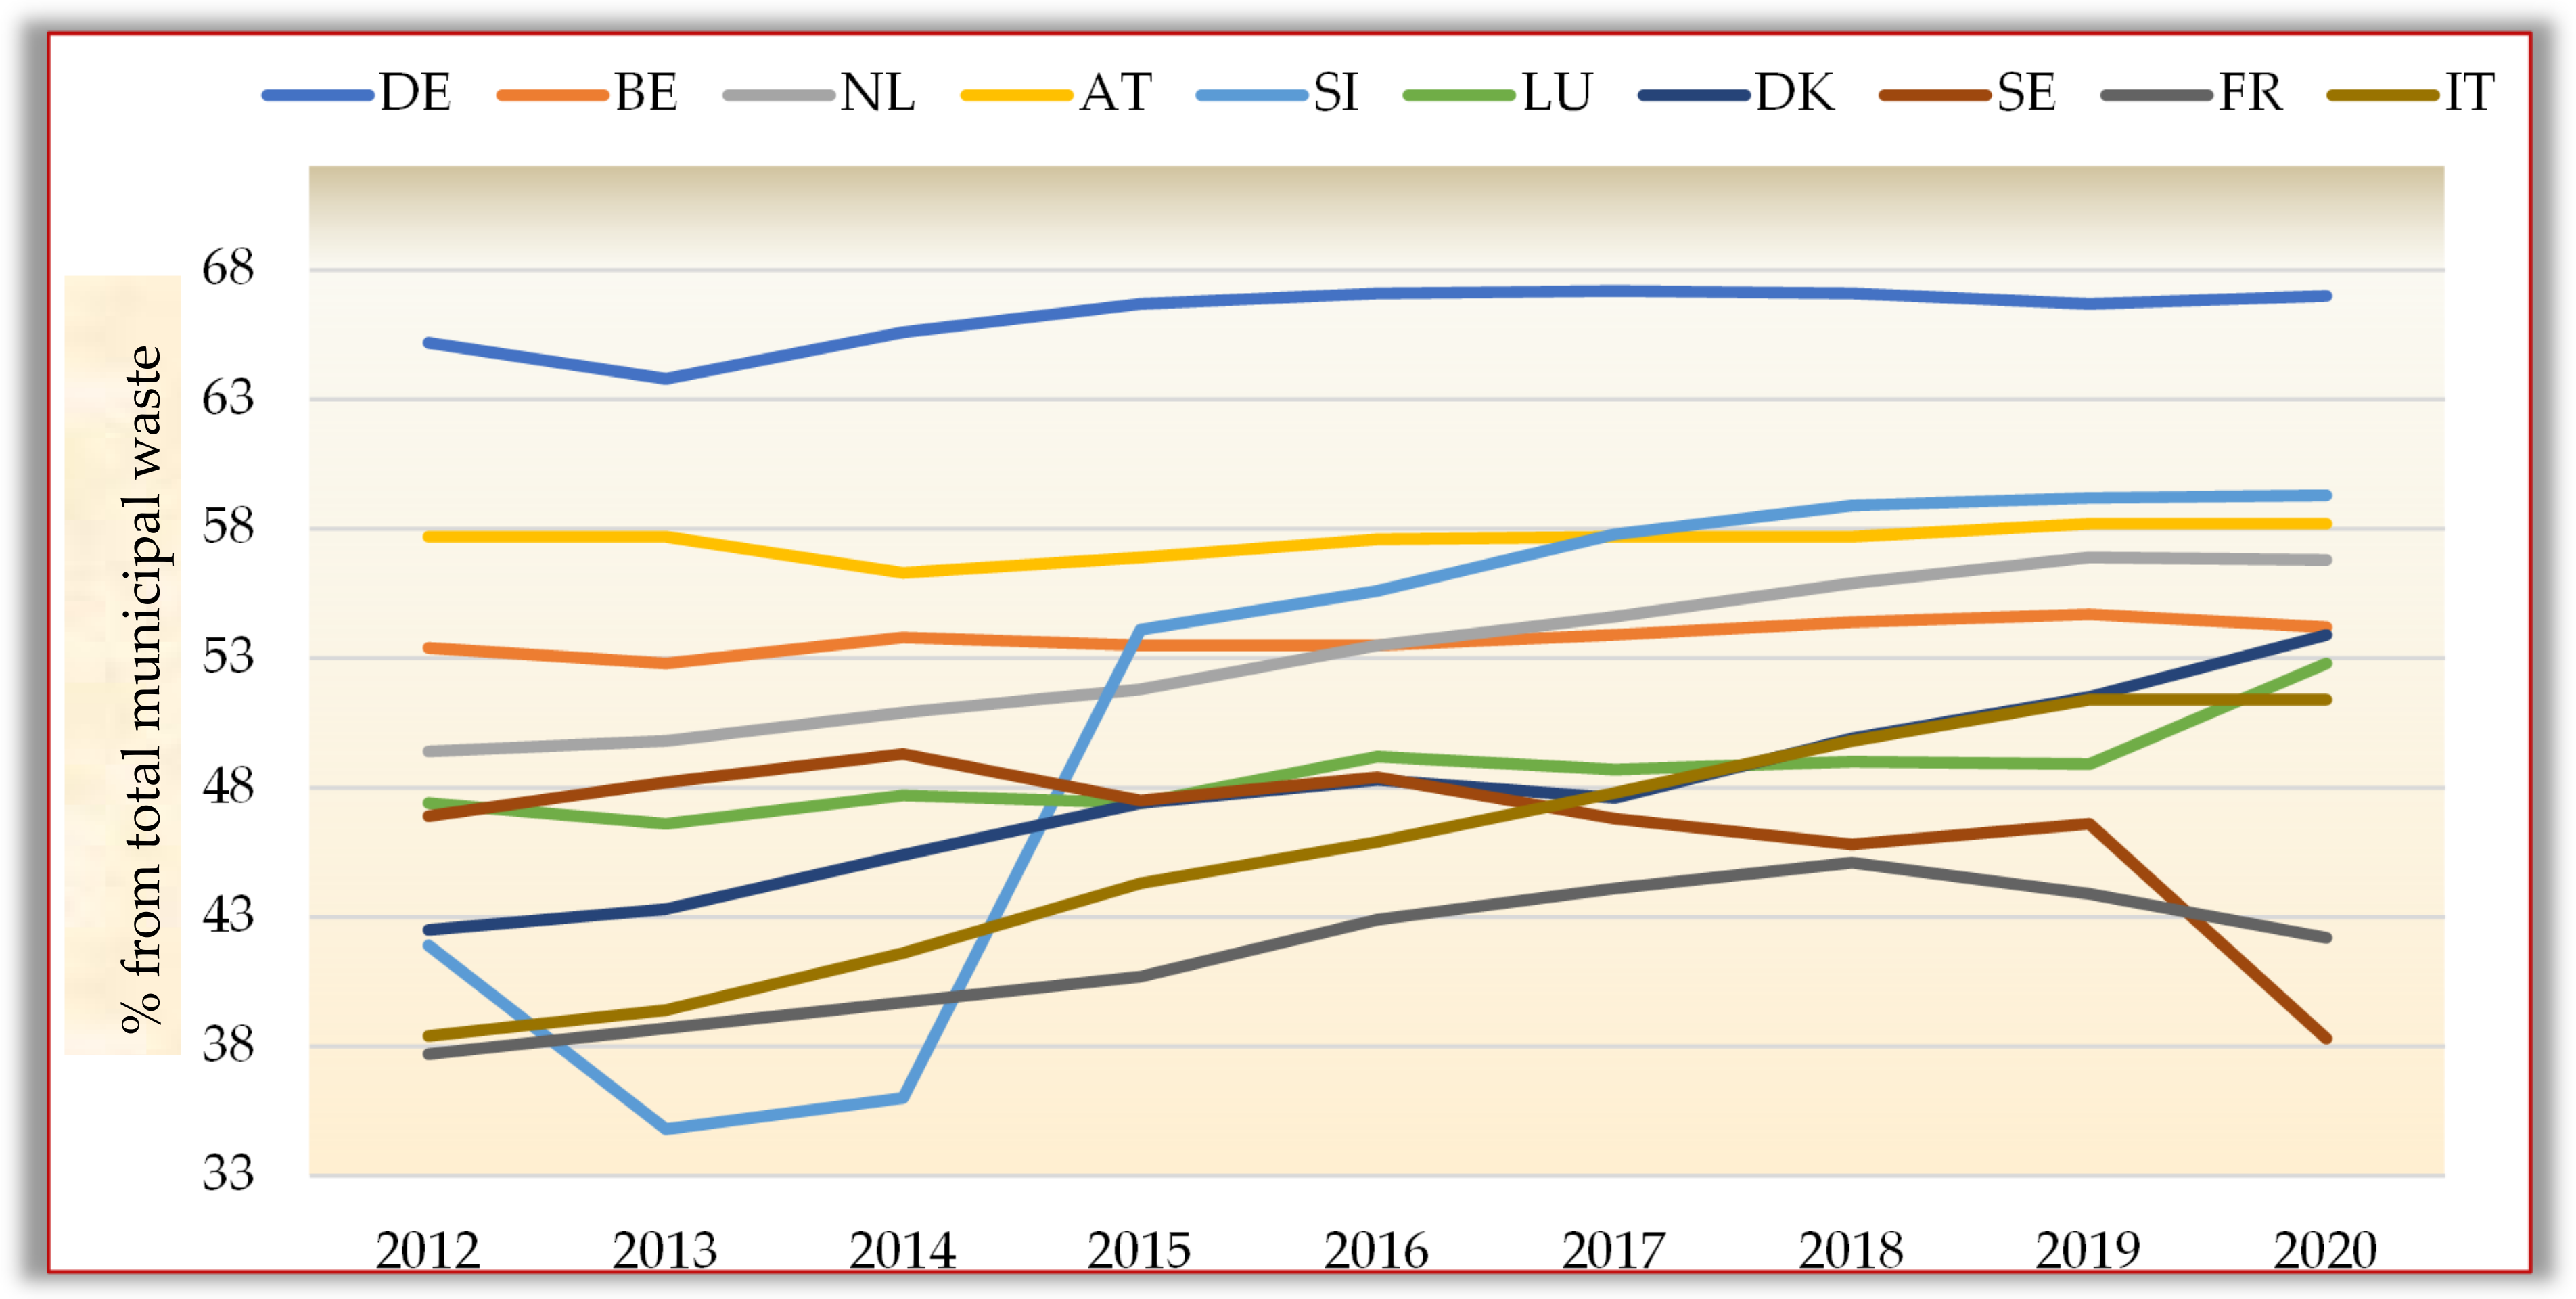
One of the most significant metrics of the circular economy is the recycling rate of municipal waste, which shows us the part of the waste that will be used as a secondary resource. Given that the member states of the EU report each year the amount recycled and the total municipal waste generated in tons, how they are managed differs significantly from country to country [
57,
58].
Figure 2 captures the 10 EU countries with the highest municipal waste recycling rates according to Eurostat data. This category includes Germany, Belgium, the Netherlands, Austria, Slovenia, Luxembourg, Denmark, Sweden, France, Italy and Lithuania. The highest percentage of waste recycling, 67%, was reached in Germany in 2020, and the lowest was in 2012 in Lithuania, 23.5%. The municipal wastes are just 10% of the total waste generated from all activities in a country. Compared to the generate waste municipal, the ranking of the waste generation in the EU member states remains the same, specifically, in 2018 the most waste from all activities were generated in Germany, followed by France and then Romania. According to data published by Eurostat, some smaller EU member states generate increased levels of total waste, with high values recorded in Estonia and Finland. Regarding waste treatment, over 50% from generated waste is recycled, and this percentage has gradually increased in the last 15 years. There are significant differences between EU member states regarding waste treatment methods: Italy, Belgium and Germany have high recycling rates, while other states such as Romania, Finland and Sweden opt for waste storage.
It can be noticed that the recycling rate in Slovenia increased by 18.1% in 2015 compared with 2014. A similar situation can be found, in Lithuania with a 14.9% higher recycling rate of municipal waste in 2016 compared with 2015. At the other extreme, a drastic decrease can be seen in Slovenia of −7.1% in 2013 compared with 2012. Analyzing the last two years, it can be observed that most countries have an upward trend. However, decreases in the recycling rates of municipal waste can be observed in Sweden by −8.30% in 2020 compared with 2019, in Lithuania by −4.60% and in France by −1.70%. On the other hand, a slight increase of 3.90% is observed in Luxembourg and Denmark with 2.40%.
The trade-in recyclable raw materials indicator, which measures the amount of waste shipped between EU member states and outside the European Union [
40], showed an impressive increase in imports and exports during the period under review. In 2020, EU exports of recyclable raw materials amounted to 38.4 million tons, the highest level since 2004. In contrast, imports of recyclable raw materials into the EU fell to 44.7 million tons in 2020 compared with 2019. The environmental tax revenues indicator, calculated as a percentage of the total budget revenues, is considered an instrument of the circular economy. According to the information available on Eurostat [
59], in 2020, the governments of the EU member states collected revenues from environmental taxes amounting to EUR 299.9 billion, representing 2.2% of the EU’s gross domestic product (GDP) and 5.4% of the total government revenues of the EU member states from taxes and social contributions. Environmental taxes, which include taxes on energy, transport taxes, pollution and resources, underwent significant variations during the analyzed period, being strongly influenced by market shocks. The majority of environmental taxes, 77.2% in 2020, are energy taxes. Transport taxes rank second as a share of total environmental taxes, with 1.1% in 2020.
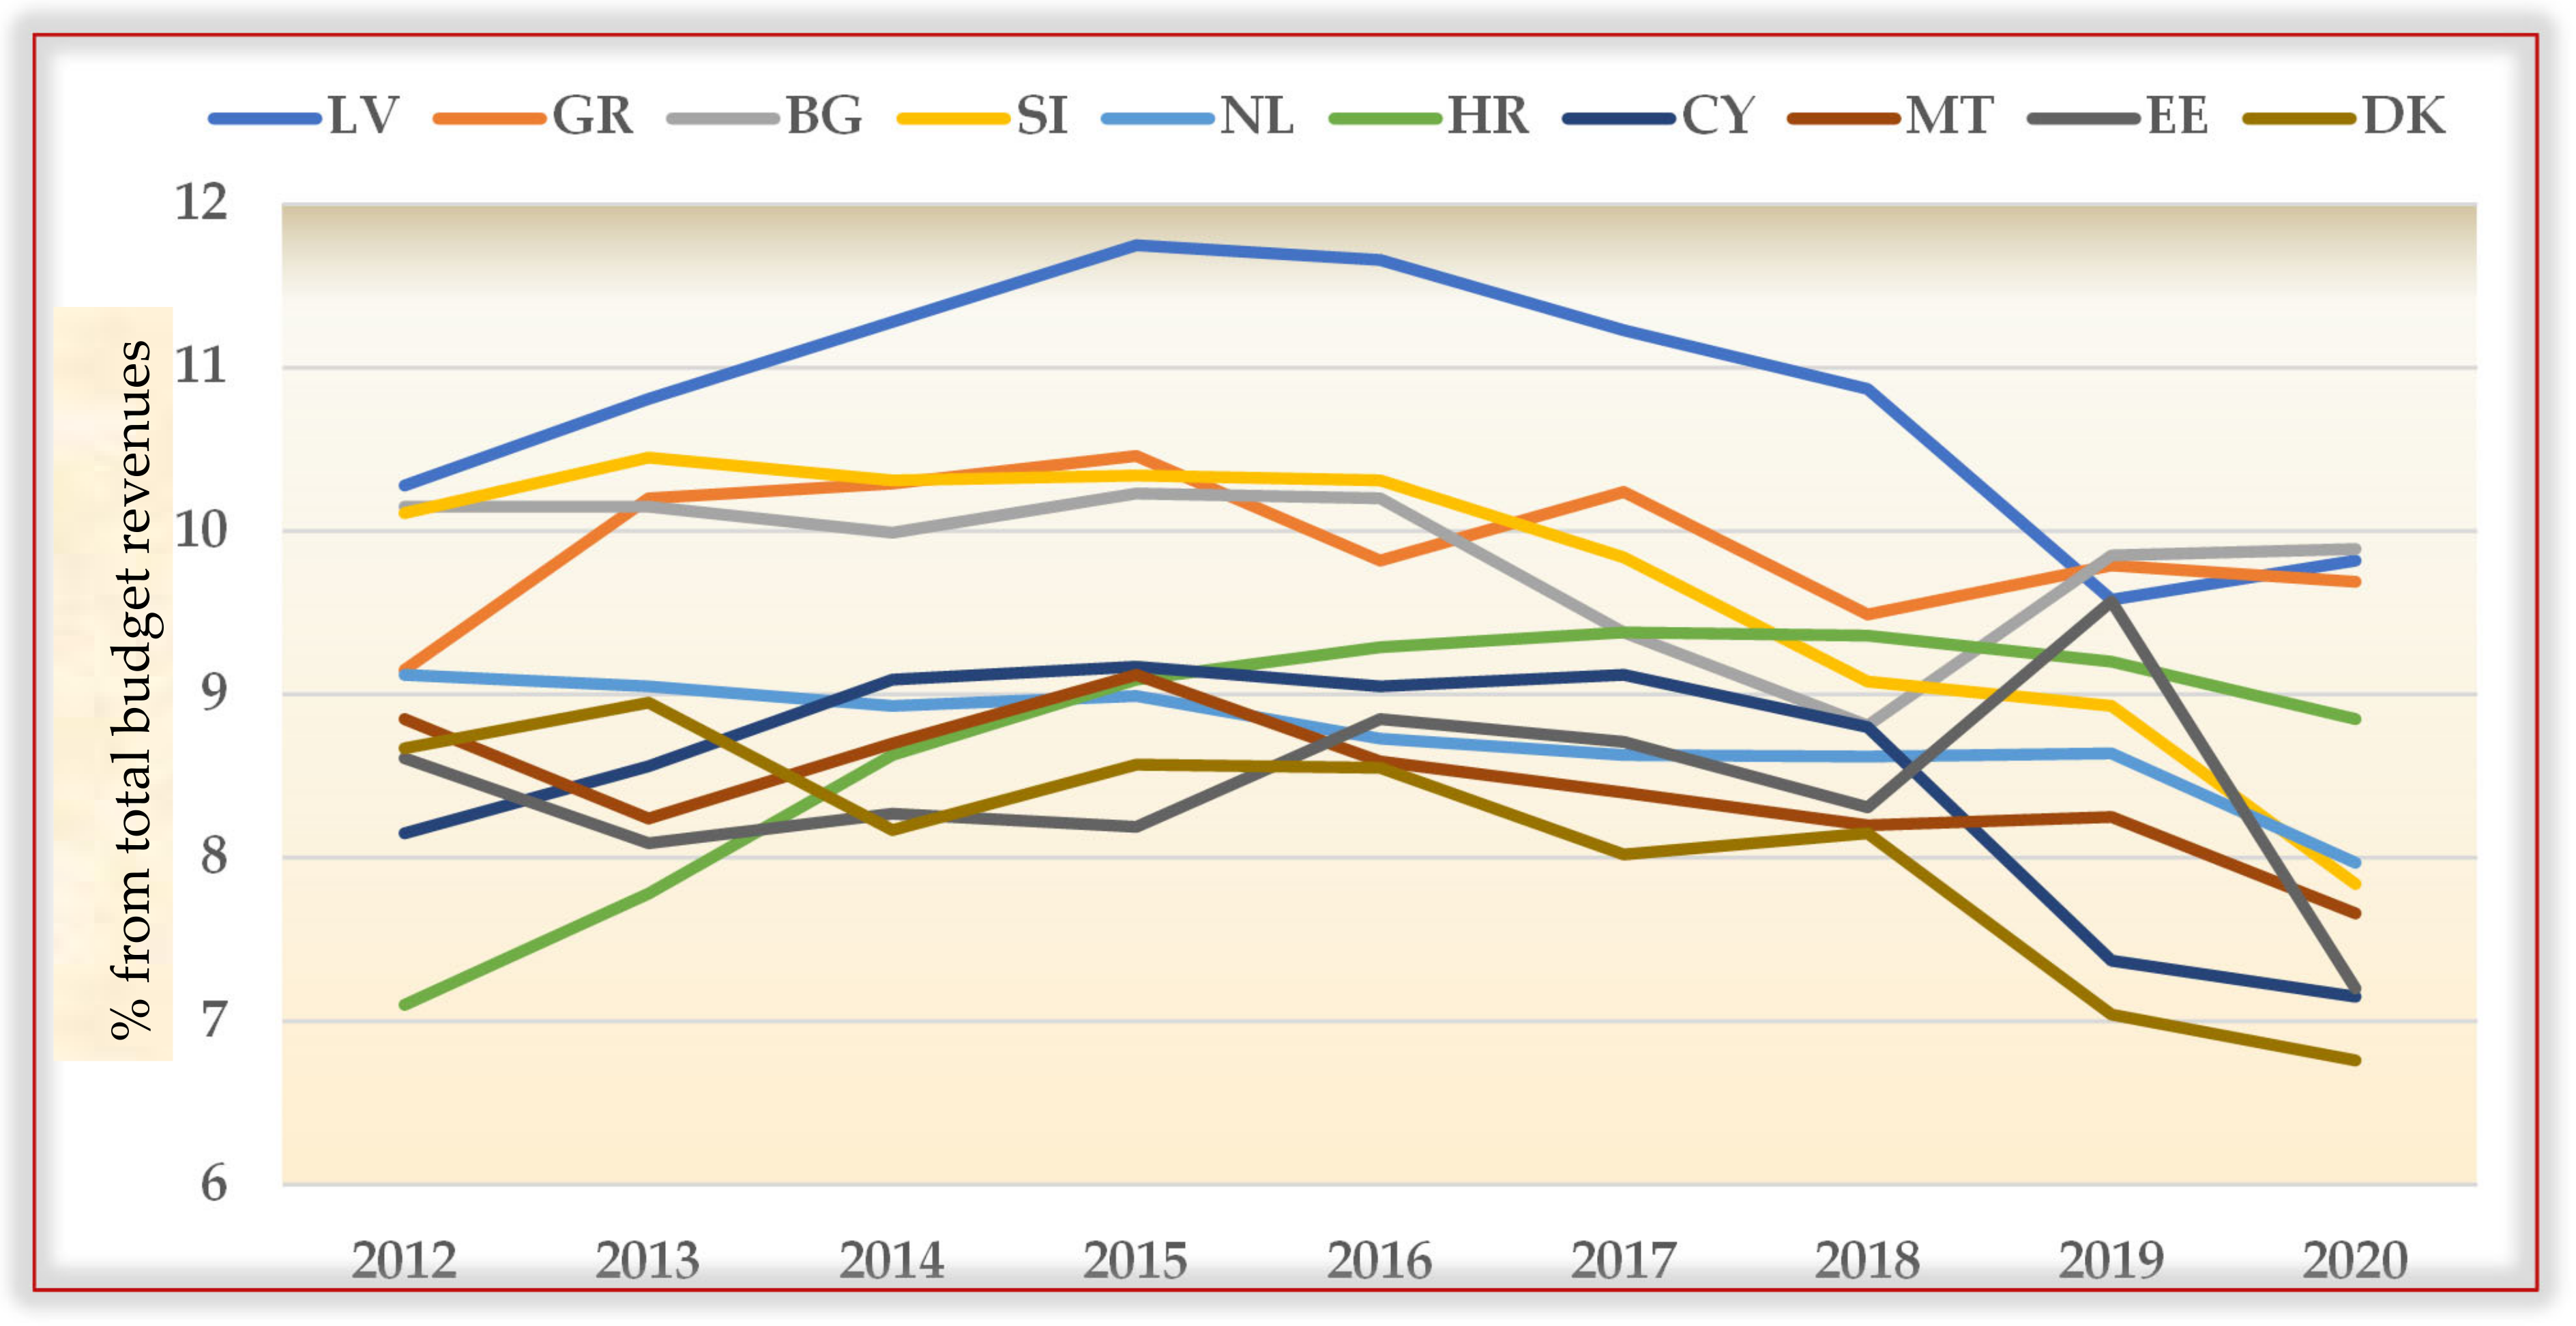
Among the analyzed countries, Latvia has the highest share of environmental tax revenues in total budget revenues with a maximum of 11.75% in 2015. At the same time, Croatia has the lowest proportion for the analyzed countries with 7.1% in 2012. From
Figure 3, it can be noticed that the trend in revenues from environmental taxes is a constant one, with a gradual decrease starting in 2018 for most countries.
The European Green Deal creates the context for well-designed tax reforms that stimulate sustainable economic development, consider climate change and contribute to a just transition. Environmental taxes have a direct role as fiscal levers used to shape the sustainable behavior of market actors [
60].
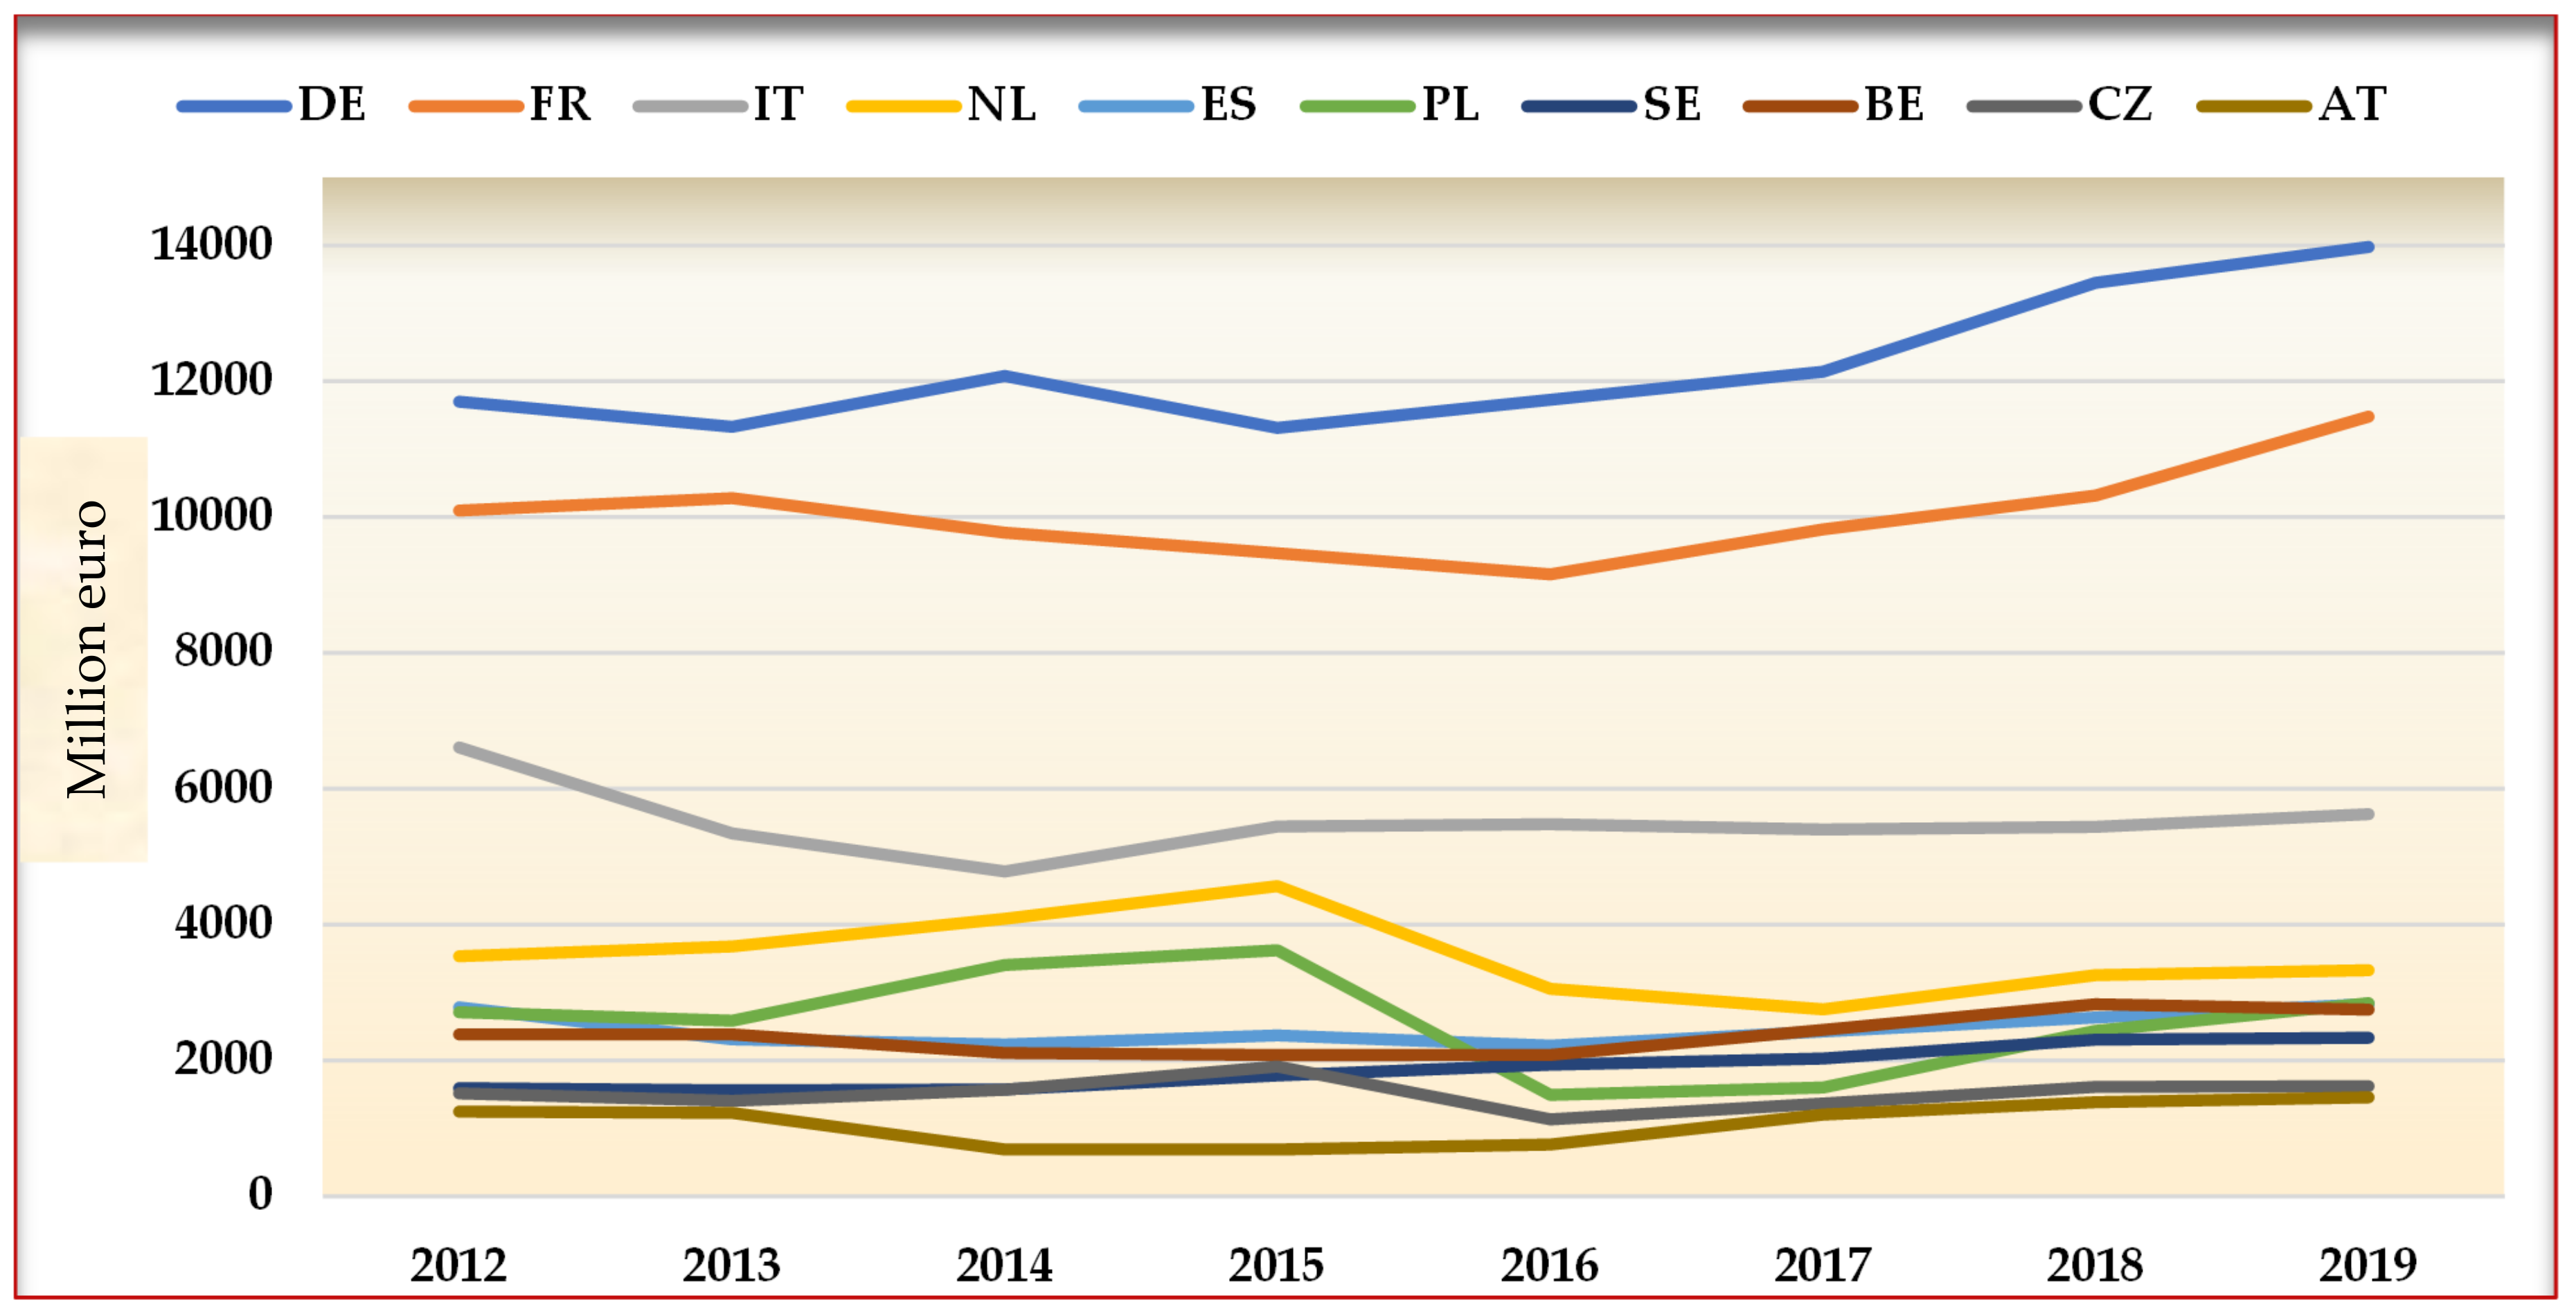
The last variable selected is environmental protection expenditures, which include the resources of the economy allocated to the prevention, reduction and elimination of pollution or any other elements that lead to environmental degradation. According to information provided by Eurostat [
59], this indicator includes both public and private investments made to protect the environment (e.g., waste and wastewater management, soil decontamination).
Figure 4 analyzes the trajectory followed by the top 10 EU countries in terms of investments in environmental protection. The highest value was recorded in Germany in the amount of EUR 13.98 billion in 2019, while the lowest was found in Austria in the amount of EUR 690.3 million in 2015. An important aspect to mention is the fact that there are some major differences throughout the period analyzed between the investments made by the first two countries, namely Germany and France, and the following countries such as Italy, the Netherlands and Spain. However, starting in 2017, a constant upward trend can be observed in the case of all countries analyzed.
The objective of the panel regression was to analyze through the four variables used, namely, environmental tax revenues, environmental protection expenditures, recycling rate of municipal waste and trade in recyclable raw materials, how the indicators of a circular economy influence sustainable economic development.
Table 1 presents the statistical descriptions of the analyzed variables.
It can be noted that the median and the average for each variable in
Table 1 are close to each other. This finding supports the idea that the data of the selected variables followed a normal distribution.
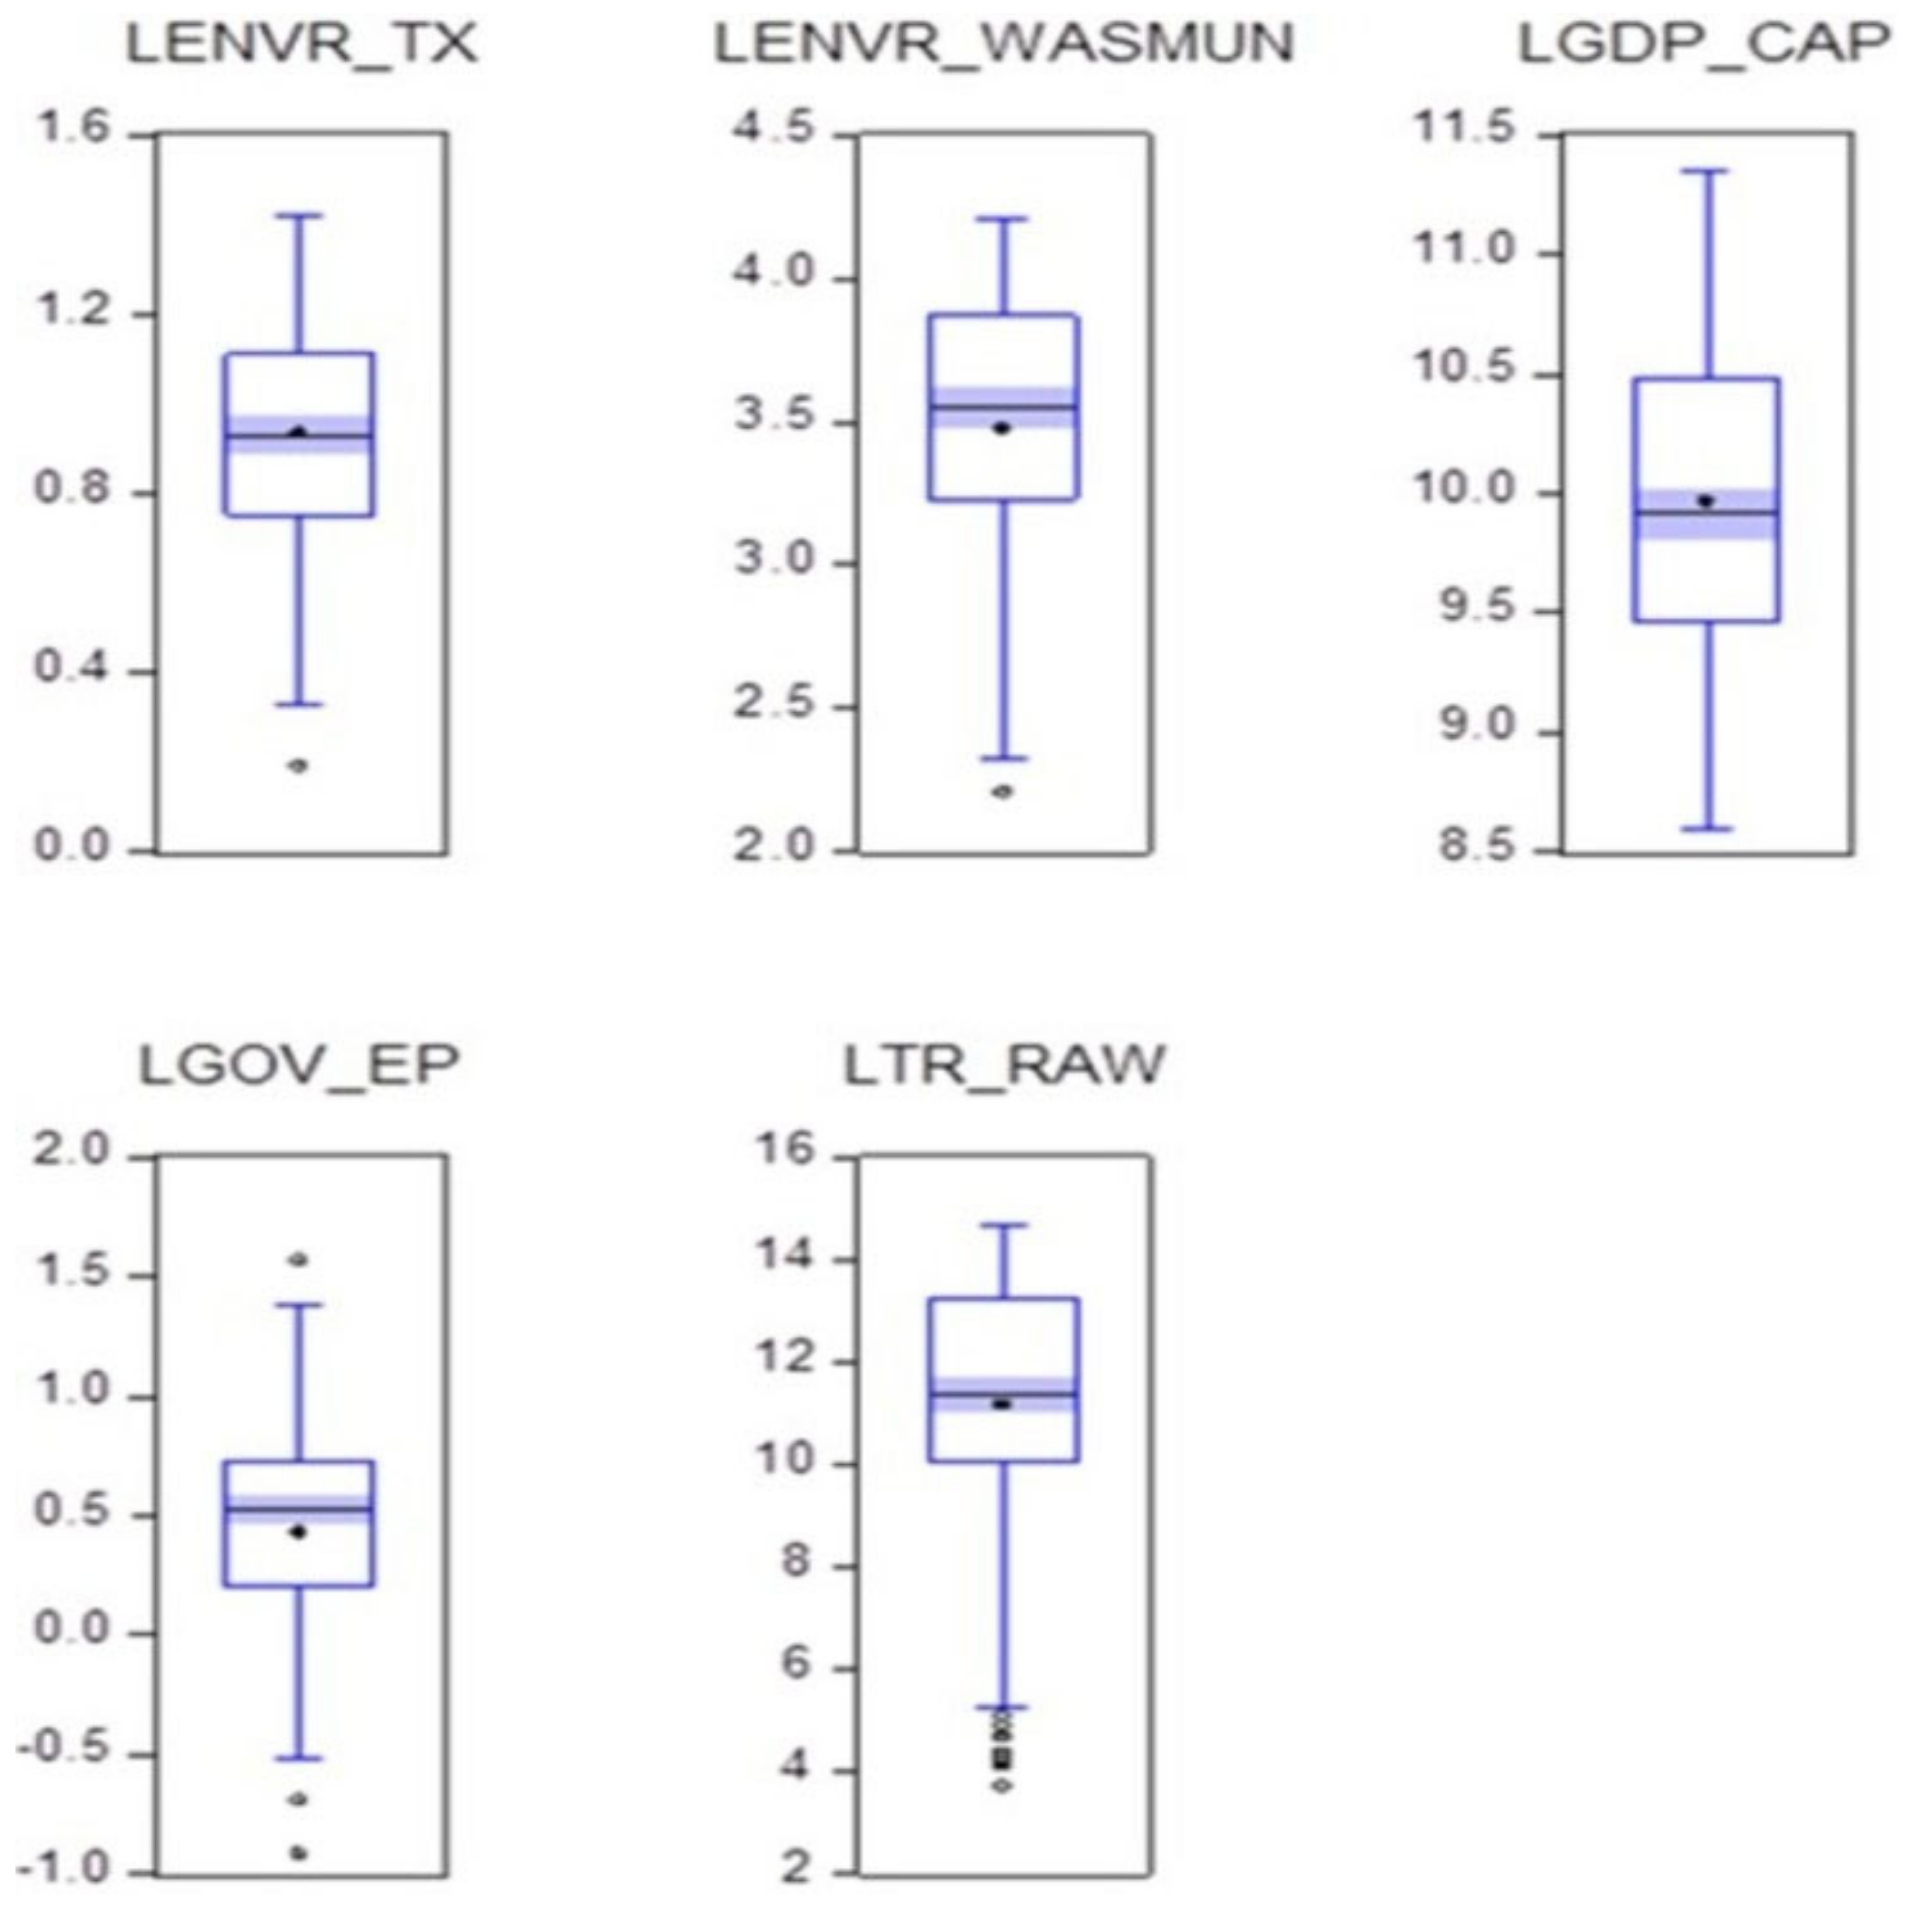
From
Figure 5, three of the circular economy indicators,
Environmental taxes, Trade in recyclable raw materials and
Recycle rate of municipal waste are within normal parameters; only
Environmental protection expenditures shows a slight deviation. The values of the variables used are logarithmic to facilitate the interpretation of the coefficients obtained from the regression.
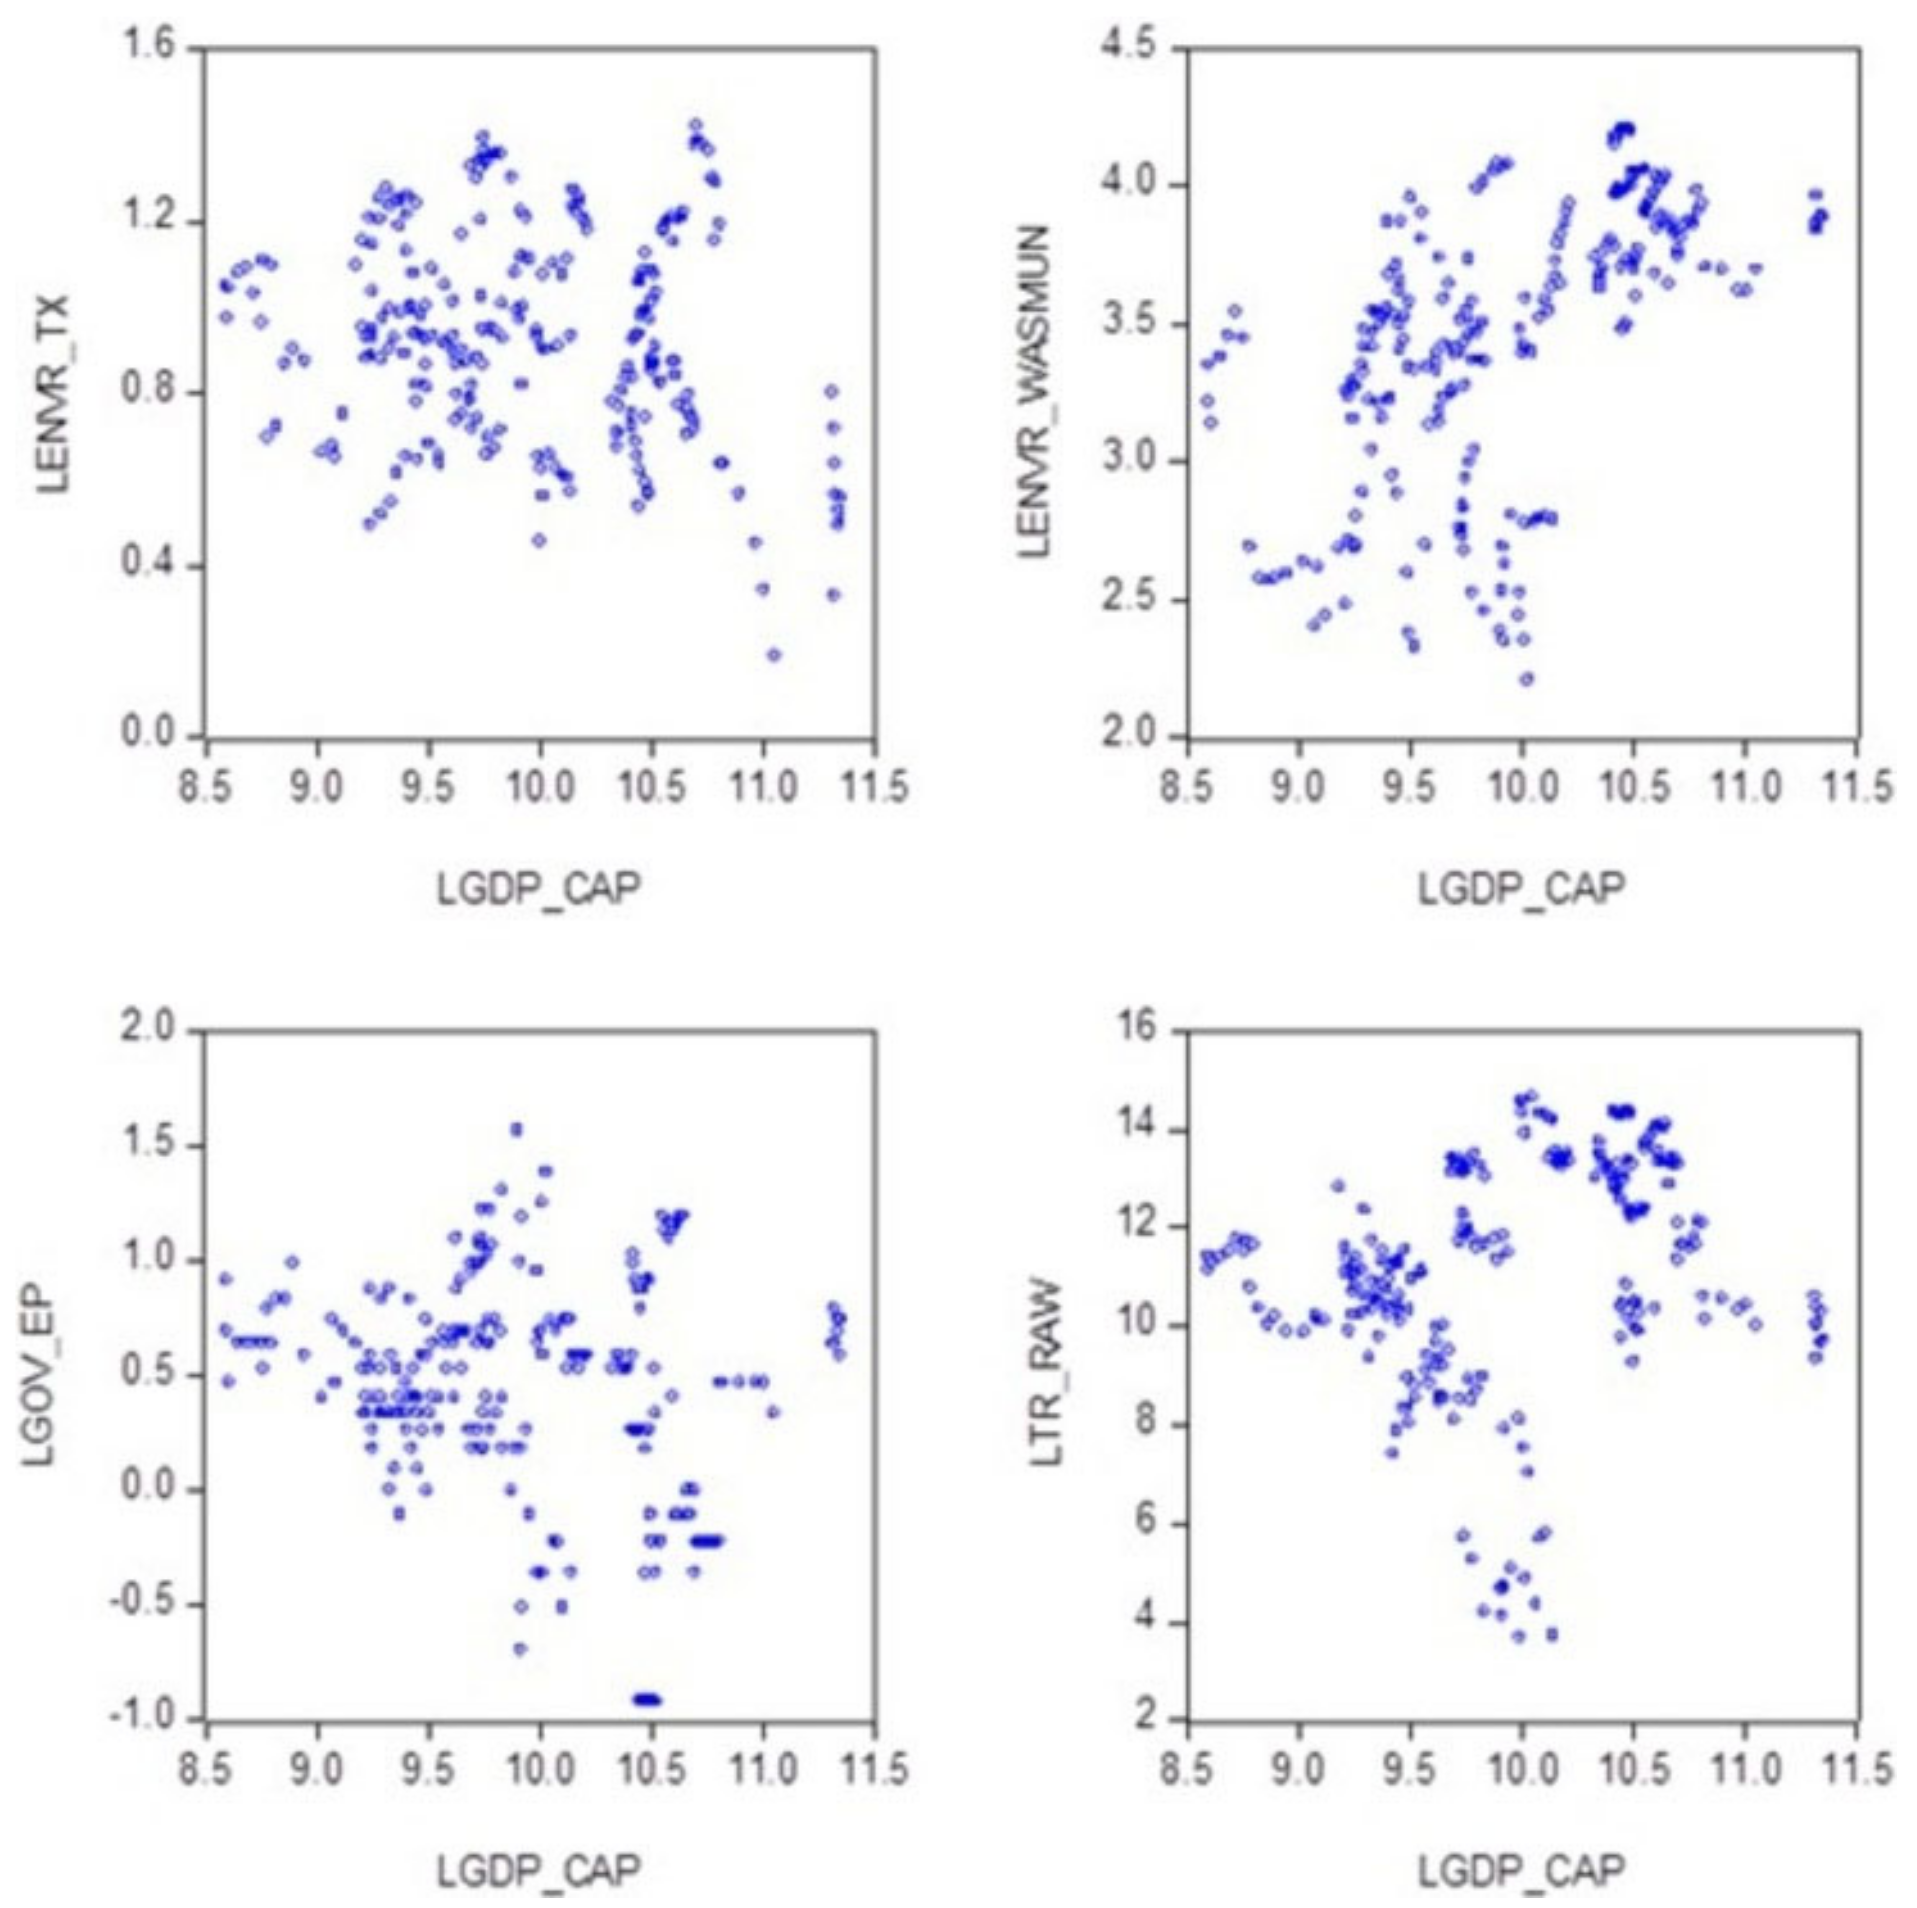
The scatterplot in
Figure 6 shows the correlation of GDP per capita with each of the four independent variables. As can be seen, data sets for environmental taxes and environmental protection expenditures have been concentrated. As for the other two variables, recycle rate of municipal waste and trade in recycle raw
materials, the correlation with GDP per capita is slightly positive.
There are several types of models for analyzing data panels, such as fixed-effects models (FE) and random-effects models (RE). In contrast with fixed-effects models, in RE models, the error αi is assumed to be totally random, showing no correlation with the regressors [
61].
The first step in making a panel model is to determine if the regression is a panel or a regular regression by testing the presence of individual effects for the data group [
62].
To decide which of the two models, random effects or fixed effects, is more suitable for our research, various tests were performed, and the information criteria associated with the models or the economic contexts were taken into account. Baltagi [
63] suggests that all these methods should be considered so that both models can be estimated and the best model can be chosen taking into account the informational criteria and/or the economic context. If it cannot be stated that the observations are random extractions from a sufficiently large population, for example when conducting analyses at the county or province level, it is often preferable to use a model with fixed effects [
64].
4. Results
In developing the panel regression, first, the Hausman test was performed to determine the appropriate specification of the model effects. The Hausman test compares a consistent and efficient estimator in the null hypothesis and inconsistent in the alternative hypothesis, an estimator that is consistent in both alternatives. The null hypothesis of the Hausman test shows that there are no statistically significant differences between the estimates of the coefficients in the FE model and the estimates of the coefficients in the RE model. If the null hypothesis is rejected, i.e., if the difference between the two estimators is large, then the fixed-effects model is preferred. Conversely, the variable-effects model is used if the null hypothesis is confirmed [
65].
With the first test of the variables, the analyzed data revealed a probability of 0.1414 > 0.0001, which confirmed the null hypothesis and determined the panel approach to be random effects for modeling the indicators of the circular economy with GDP per capita. To obtain the estimates of the RE panel data model, the least squares method adapted for this type of data (pooled least squares) was used. The Hausman test was used to develop the equation for the RE panel data analysis:
i = number of countries,
t = time (the period of time for the panel data),
β1,2,3,4 = is the coefficient for the four independent variables,
ui = is the error term,
εit = within-entity error,
logenvr_wasmun = the logarithmic value of the recycling rate of municipal waste,
logenvr_tax = the logarithmic value of the environmental tax revenues,
logtr_raw = the logarithmic value of the trade in recyclable raw materials,
loggov_epv = the logarithmic value of the environmental protection expenditures.
Table 2 presented the details of the RE panel least squared estimation method. Three variables from those analyzed significantly influence the GDP per capita because
p < 0.01:
Environmental tax revenues (the biggest influence),
Recycling rate of municipal waste, Environmental protection expenditures. For
Trade in recyclable raw materials,
p < 0.1, its influence being thus lower.
Given that Prob (F-Statistic) is below the significance threshold of 5%, it can be stated that the selected RE model is valid and that there is a statistically significant correlation between GDP per capita and one of the four independent variables. Moreover, given the the high R-squared coefficient, 99.21% of the variation in GDP per capita is justified by the four independent variables of the selected RE model.
In order to evaluate the influence of the circular economy indicators on the GDP/capita, the correlations were calculated of the probabilities of the explanatory variables’ coefficients. The model results show that the dependent variable GDP per capita is positively and significantly correlated with the Recycling rate of municipal waste and is inversely correlated with Environmental tax revenues and Environmental protection expenditures. Thus, with a 1% increase in the Recycling rate of municipal waste, GDP per capita increases by 18.33%, and with a 1% decrease in Environmental protection expenditures, GDP/capita increases by 9.07%. Additionally, increasing of the variable Environmental tax revenues by 1% decreases GDP per capita by 29.59%.
It can be noted that the constant C is high and positive, which reflects that other variables not taken into account in this article greatly influence the evolution of GDP per capita.
Thus, our analysis confirms the importance of the three indicators of the circular economy on sustainable economic development in the case of 27 EU member states. The research results connect with the key literature that test circular economy indicators’ influence on GDP per capita [
43,
44,
46] and confirm the relevance of the recycling rate of municipal waste and the trade in recyclable raw materials as independent variables, which are frequently recommended in the literature [
44,
46]. As was presented in the literature review, environmental tax revenues and environmental protection expenditures were not frequently selected as independent variables in other studies addressing the circular economy indicators’ influence on sustainable economic development among EU member states. In our opinion, the selected circular economy indicators environmental tax revenues, environmental protection expenditures, recycling rate of municipal waste and trade in recyclable raw materials, as well as using the panel regression method, are innovative in relation to existing literature.
Compared with our research results, Mihai et al. [
43] identified a strong direct correlation between renewable energy and GDP and indirect correlations between renewable energy and the unemployment rate and gas emissions. Georgescu et al. [
44] came to the conclusion that the recycling rate of municipal waste is directly correlated with economic development, the same result as in our research, as well as that the generation of municipal waste per capita positively influences both the recycling rate of municipal waste and economic development. At the same time, Chen et al. [
46] highlighted the causal relationship between circular economy indicators and GDP, showing that there are direct correlations between GDP and the recycling rate of municipal waste and trade in recyclable raw materials, just as we identified in the RE panel data model. Even though our research has its limitations based on the fact that this is not a new topic, our comparative evaluation of the selected circular economy indicators’ influence on sustainable economic development between the 27 EU member states can contribute to a unified system of circular economy indicators. In line with the key literature [
44,
45,
46,
49], our results prove the positive and significant correlation of the recycling rate of municipal waste with GDP per capita and the irrelevance of trade in recyclable raw materials. Moreover, environmental tax revenues and environmental protection expenditures were also significant indicators: GDP per capita was inversely and significantly correlated with environmental tax revenues and environmental protection expenditures. These results reveal underestimated macroeconomic impacts of an environmental tax reform among EU member states, the “green taxation”, an essential instrument for achieving the European Green Deal’s objectives.
5. Conclusions
The circular economy is based on business models for the reusing, recycling and recovering of materials in producing and consuming goods.
The absence of a unified system of circular economy indicators creates inconsistencies and misinterpretations that at the EU level endanger the achievement of common goals regarding circular economies among the member states. The approach used here enables a comparative evaluation of the circular economy indicators’ influence on sustainable economic development between 27 EU member states and common policy recommendation for members states with similar profiles. In this research, we established correlations between circular economy performance indicators and sustainable economic development using panel data analysis.
The results of applying the RE panel least squared model show that there is a statistically significant relationship between GDP per capita and the three independent variables, mainly due to the high R-squared coefficient: 99.21% of GDP change per capita is explained by the four independent variables.
Environmental tax revenues have the most significant influence on GDP per capita, in the opposite direction, and the least influence is that of trade in recyclable raw materials. With an increase of 1% in the recycling rate of municipal waste, GDP/per capita increases by 18.33%, and with a decrease of 1% in environment protection expenditures, the GDP per capita increases by 9.07%. Additionally, an increase of 1% in the variable environmental tax revenues decreases GDP per capita by 29.59%.
Thus, our analysis confirms the importance of the three circular economy indicators for sustainable economic development in the case of EU member states.
The results of our research could be useful to policy makers on sustainable economic development. The results confirmed that an increase in the recycling rate of municipal waste and decreases in environmental tax revenues and environmental protection expenditures led to an increase in GDP per capita and sustainable economic development. This implies that decreases in environmental taxation alongside with polluter-pays instruments instead of environmental protection expenditures could generate positive impacts for GDP per capita. The positive economic results could be achieved through a “green taxation” reform among EU member states that must encourage changes in consumer and business behavior and make the polluter-pays principle a reality in the EU.
This research’s innovation and scientific contributions are related to the selection and combination of circular economy indicators. This approach allows us to identify circular economy indicators that strongly correlated with GDP per capita. Moreover, identified divergences reveal underestimated opportunities for sustainable economic development and emerging challenges for circular economy policies.
Furthermore, regarding policy recommendations, further research can help select the most appropriate set of instruments for green taxation reform. Additionally, for further research development, the panel analysis performed can be improved by introducing a control variable, including several non-EU countries or extending the analysis period.


 ,
, 
