Article

Public Perceptions of Renewable Energy in the Philippines

Faculty of International Business Management, Kyoei University, Kasukabe 344-0051, Japan
*
Author to whom correspondence should be addressed.
Sustainability 2022, 14(16), 9906; https://doi.org/10.3390/su14169906
Submission received: 20 July 2022 / Revised: 4 August 2022 / Accepted: 9 August 2022 / Published: 10 August 2022
(This article belongs to the Section Energy Sustainability)

Abstract

:
The current study examines how renewable energy is perceived by the Philippine public through the use of an online survey. As a developing economy with limited fossil fuel resources but huge potential for renewable energy (RE), and as a signatory of the Kyoto Protocol and other international environmental agreements, RE should be central to the government’s energy policy. However, at the time of the survey, RE provided less than 25% of electricity capacity, placing it below the ASEAN average, despite its ambitious public announcements and being the first to adopt a legal framework explicitly intended to support RE expansion. The study corroborates other research that finds a high level of awareness and concern for the climate crisis amongst the Philippine public. Given that RE is often locally and community based, public knowledge and support would greatly facilitate the expansion of RE. The research found that 86.2% of the participants supported the expansion of RE and 80.8% expressed willingness to install RE on their property if it was affordable, but there was also continued support for traditional fossil fuels among 45.0% of the participants. Regression analysis found that claimed knowledge of RE was found to have a largely positive correlation with support for RE, and just over 50% saw cooperation between local and central governments as necessary for RE expansion to succeed.

1. Introduction

The Philippines has a growing economy and population, which puts constant pressure on the country’s energy supplies, more than half of which are mainly imported fossil fuels. Much like the rest of the world, the country faces the choice of continuing to rely on imported fossil fuels or expanding its renewable energy (RE) capacity. As a member of the UN Framework Convention on Climate Change and a signatory of the Kyoto Protocol, the latter course would be in line with the country’s international commitments. In 2008, the Philippines was the first country in South-East Asia to pass a Renewable Energy Law, but it has been slow to properly enact it. On top of this, as discussed below, there are concerns that the act and government implementation of it are holding back the expansion of RE. Furthermore, the expansion of RE in the Philippines faces a variety of political, social, structural, and economic challenges. A key factor in easing the expansion of RE is public support and demand (and public opposition will delay its implementation even further).
This research examines the current state of public support in each of the country’s three power grids (Luzon, Mindanao, and Visayas) for renewable energy, the willingness of people to install it on their own property, and their willingness to pay for its development. It makes an effort to contribute to the ongoing discussion in the Philippines and the world about how to proceed with expanding RE, addressing public concerns, and broadening public understanding of the issues involved.

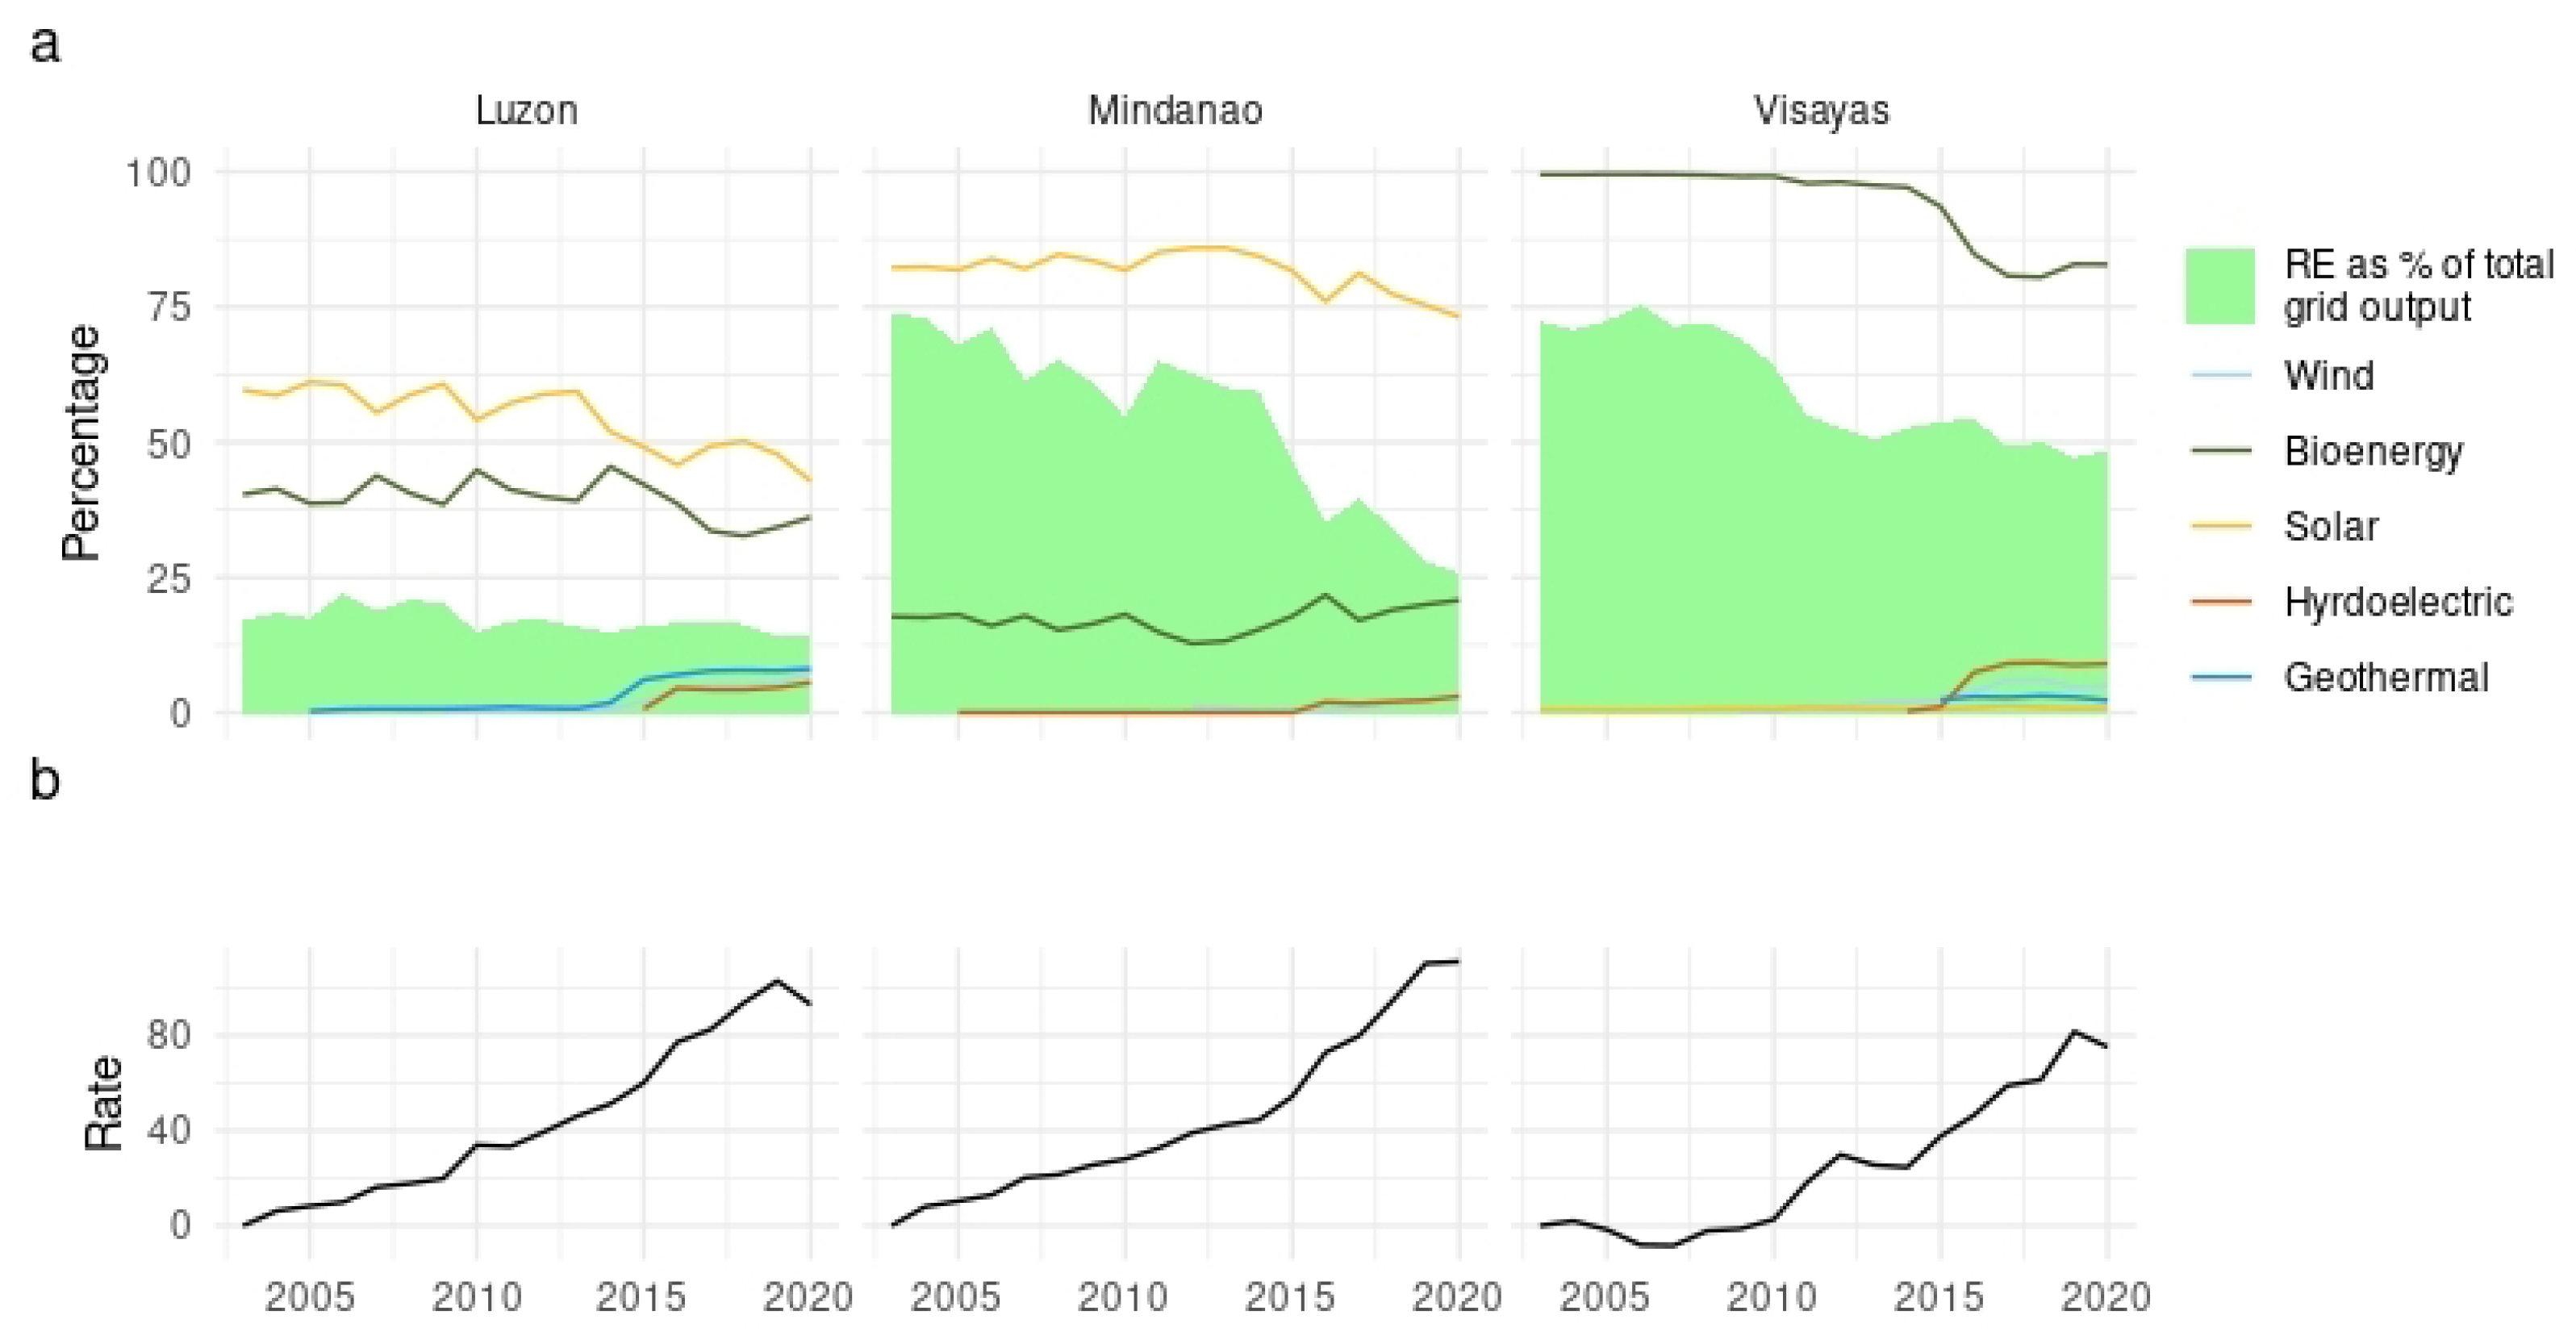
1.1. The Current State of RE in the Philippines

As of 2016 [1], 75.8% of electricity in the Philippines was generated from fossil fuels, with 47% generated from coal, most of which is imported. The remaining 24.2% was generated from RE sources, but 12.2% was from geothermal energy and 8.9% from large-scale hydroelectric projects. Wind, solar, biomass, or other sources accounted for only 3.1% of the energy supply. As an island nation with an extensive coastline, the potential for wave and on- or off-shore wind energy generation is huge, and also for solar energy. As Figure 1 illustrates, RE has not been able to keep up with a growing energy market. For comparison, energy from ‘clean’ sources contributes 13% in Indonesia, 37% in Vietnam, and 32% in Japan [2]. In Europe, only Poland has a lower rate (17.1%) and the next lowest is Holland with 36.4% clean electricity [2]. In addition to this, the Philippines has higher electricity prices than its ASEAN neighbours, up to a third more than the next highest [3], and second only to Japan in the wider Asian region [4].
The adoption of renewable energy by individuals and households has been slow. As of 2020, the Philippines had approximately 100 MW of rooftop solar panel capacity [5]. This compares to Vietnam, with 378 MW in 2019, rising to almost 9.6 GW in 2020 [6]. This, despite the use of net metering in the Philippines, in which consumers generating less than 100 KW can sell excess electricity back to the grid for about a third of the market price [5]. Only 4000 users had signed up for net metering by 2020. This is due to a variety of obstacles, including the extensive paperwork and the cost (starting with PHP 15,000 (PHP: Philippine peso) for a distribution impact study, approximately USD 275) (Efforts have been made to reduce these costs, including requiring the distribution utility to bear the cost of the meter and its installation [7]. Additionally, several efforts have been made to increase the 100 KW limit to allow companies to take advantage of net metering (most recently by Senator Gatchalian [8])), and time (ranging from 9 to 28 weeks [9,10,11] to register for net metering). Furthermore, many houses—particularly those in off-grid areas—do not have the structural integrity to support the hardware required for solar panels [5].
Roxas and Santiago [12] argue that the focus of the Philippine government on capacity rather than the quality of RE and the impact it has on communities means that large grids will be oversubscribed and cause the feed-in-tax (FiT) system to become unbalanced. Similarly, Barroco and Herrera [13] highlight the failure of the Philippine FiT regime to encourage investment from smaller and more innovative investors, which has mainly favoured large established energy companies and large investors. Revenue uncertainty and regulatory confusion are major barriers for many smaller investors. Lagac and Yap [14] point out that although FiT has increased RE capacity, it has a smaller share of the total energy market than before it was implemented. They also suggest that there are potential social and financial costs resulting from the FiT and the spread of RE, with an estimated shortfall of about PHP 5 million between 2015 and 2019. Bertheau et al. [15] highlight the challenges facing off-grid cooperatives in introducing renewable energy projects. Slow implementation of policy and broader planning and policy failures, along with weak financial returns for joint private-cooperative ventures, have meant slow uptake, especially when local people do not get involved. They highlight the complex nature of the process, the failure to connect grand policy statements with practice, and fragmented leadership. On the other hand, Guild [16] argues that the FiT regime adopted by the Philippines has been largely successful compared to that of its neighbour, Indonesia, a conclusion confirmed by more recent comparative research [17].
At a more general political and organisational level, Marquardt [18] argues that the complex, multilevel, decentralised nature of the Philippine political system leads to bad information flows, policy failure, clientelism, corruption, and obstructionism. In practical terms, it can mean that technical and policy knowledge is clustered around the central government, whereas local actors with local knowledge key to successful implementation are ignored by the centre but lack access to technical skills and necessary policy information.

1.2. Public Acceptance

Research in a variety of countries suggests that public acceptance can be a significant driver in the adoption of RE [19,20,21,22]. Makki and Mosley [23] found 19 factors that influence public perception of RE after an extensive review of the literature, many of which corresponded to the significant independent variables in this study. Lucas et al. [24] point out that social acceptance of new technologies such as RE include the concepts of awareness, support, participation and engagement, the latter two suggesting a more proactive acceptance.
In discussing the nature of public acceptance of RE, Devine-Wright [25] offers three levels of analysis: personal (sociodemographic characteristics); social-psychological (personal beliefs, knowledge and experience); contextual (type, location, and scale of technology, and institutional structure). A key point raised by Devine-Wright relevant to this study is that awareness and knowledge of an energy type do not necessarily lead to support for it. On the other hand, concern for environmental issues may be associated with support for RE. They also pointed to issues of trust, fairness, the impact it has on the individual and the community, ownership, and control as factors shaping public support for RE in general, as well as for individual projects.
In the context of the Philippines, Bollentino et al. [26] found that, in a national study of 4300 people, almost 60% of the respondents felt that they were not well informed about climate change, but over 70% felt that they would be affected by it in some way. This research is confirmed by the results of the global UNDP [27] survey on climate change in which 74% of Filipino respondents agreed with the concept of a climate crisis. The UNDP also found that gender only accounted for 1% of variance in belief in a climate crisis (compared to more than 5% in more than half of the countries).
In addition to its impact on the climate, RE can play a key role in achieving energy security and independence, and in addressing energy poverty issues. Given the current failure of existing institutions to provide a comprehensive expansion of RE, public acceptance of, and participation in, renewable energy will play a key role in its further adoption.

1.3. Aims of the Study

The objective of the study is to address the following questions:
  • How much support is there for RE in the Philippines?
  • What are the factors that influence this support?
  • Does this support manifest itself in the form of willingness to install (WTI)?
The analysis focuses on two dependent variables: overall support for RE, and WTI. Other dependent variables also presented themselves (support for particular types of RE, and willingness to pay), but for the sake of brevity, we have focused on these two.
Section 2 gives an outline of the materials and methods used to collect and analyse the data used in this research. Section 3 first looks at the descriptive statistics and then the results of the statistical analysis. This is followed in Section 4 with a discussion and some concluding remarks in Section 5.

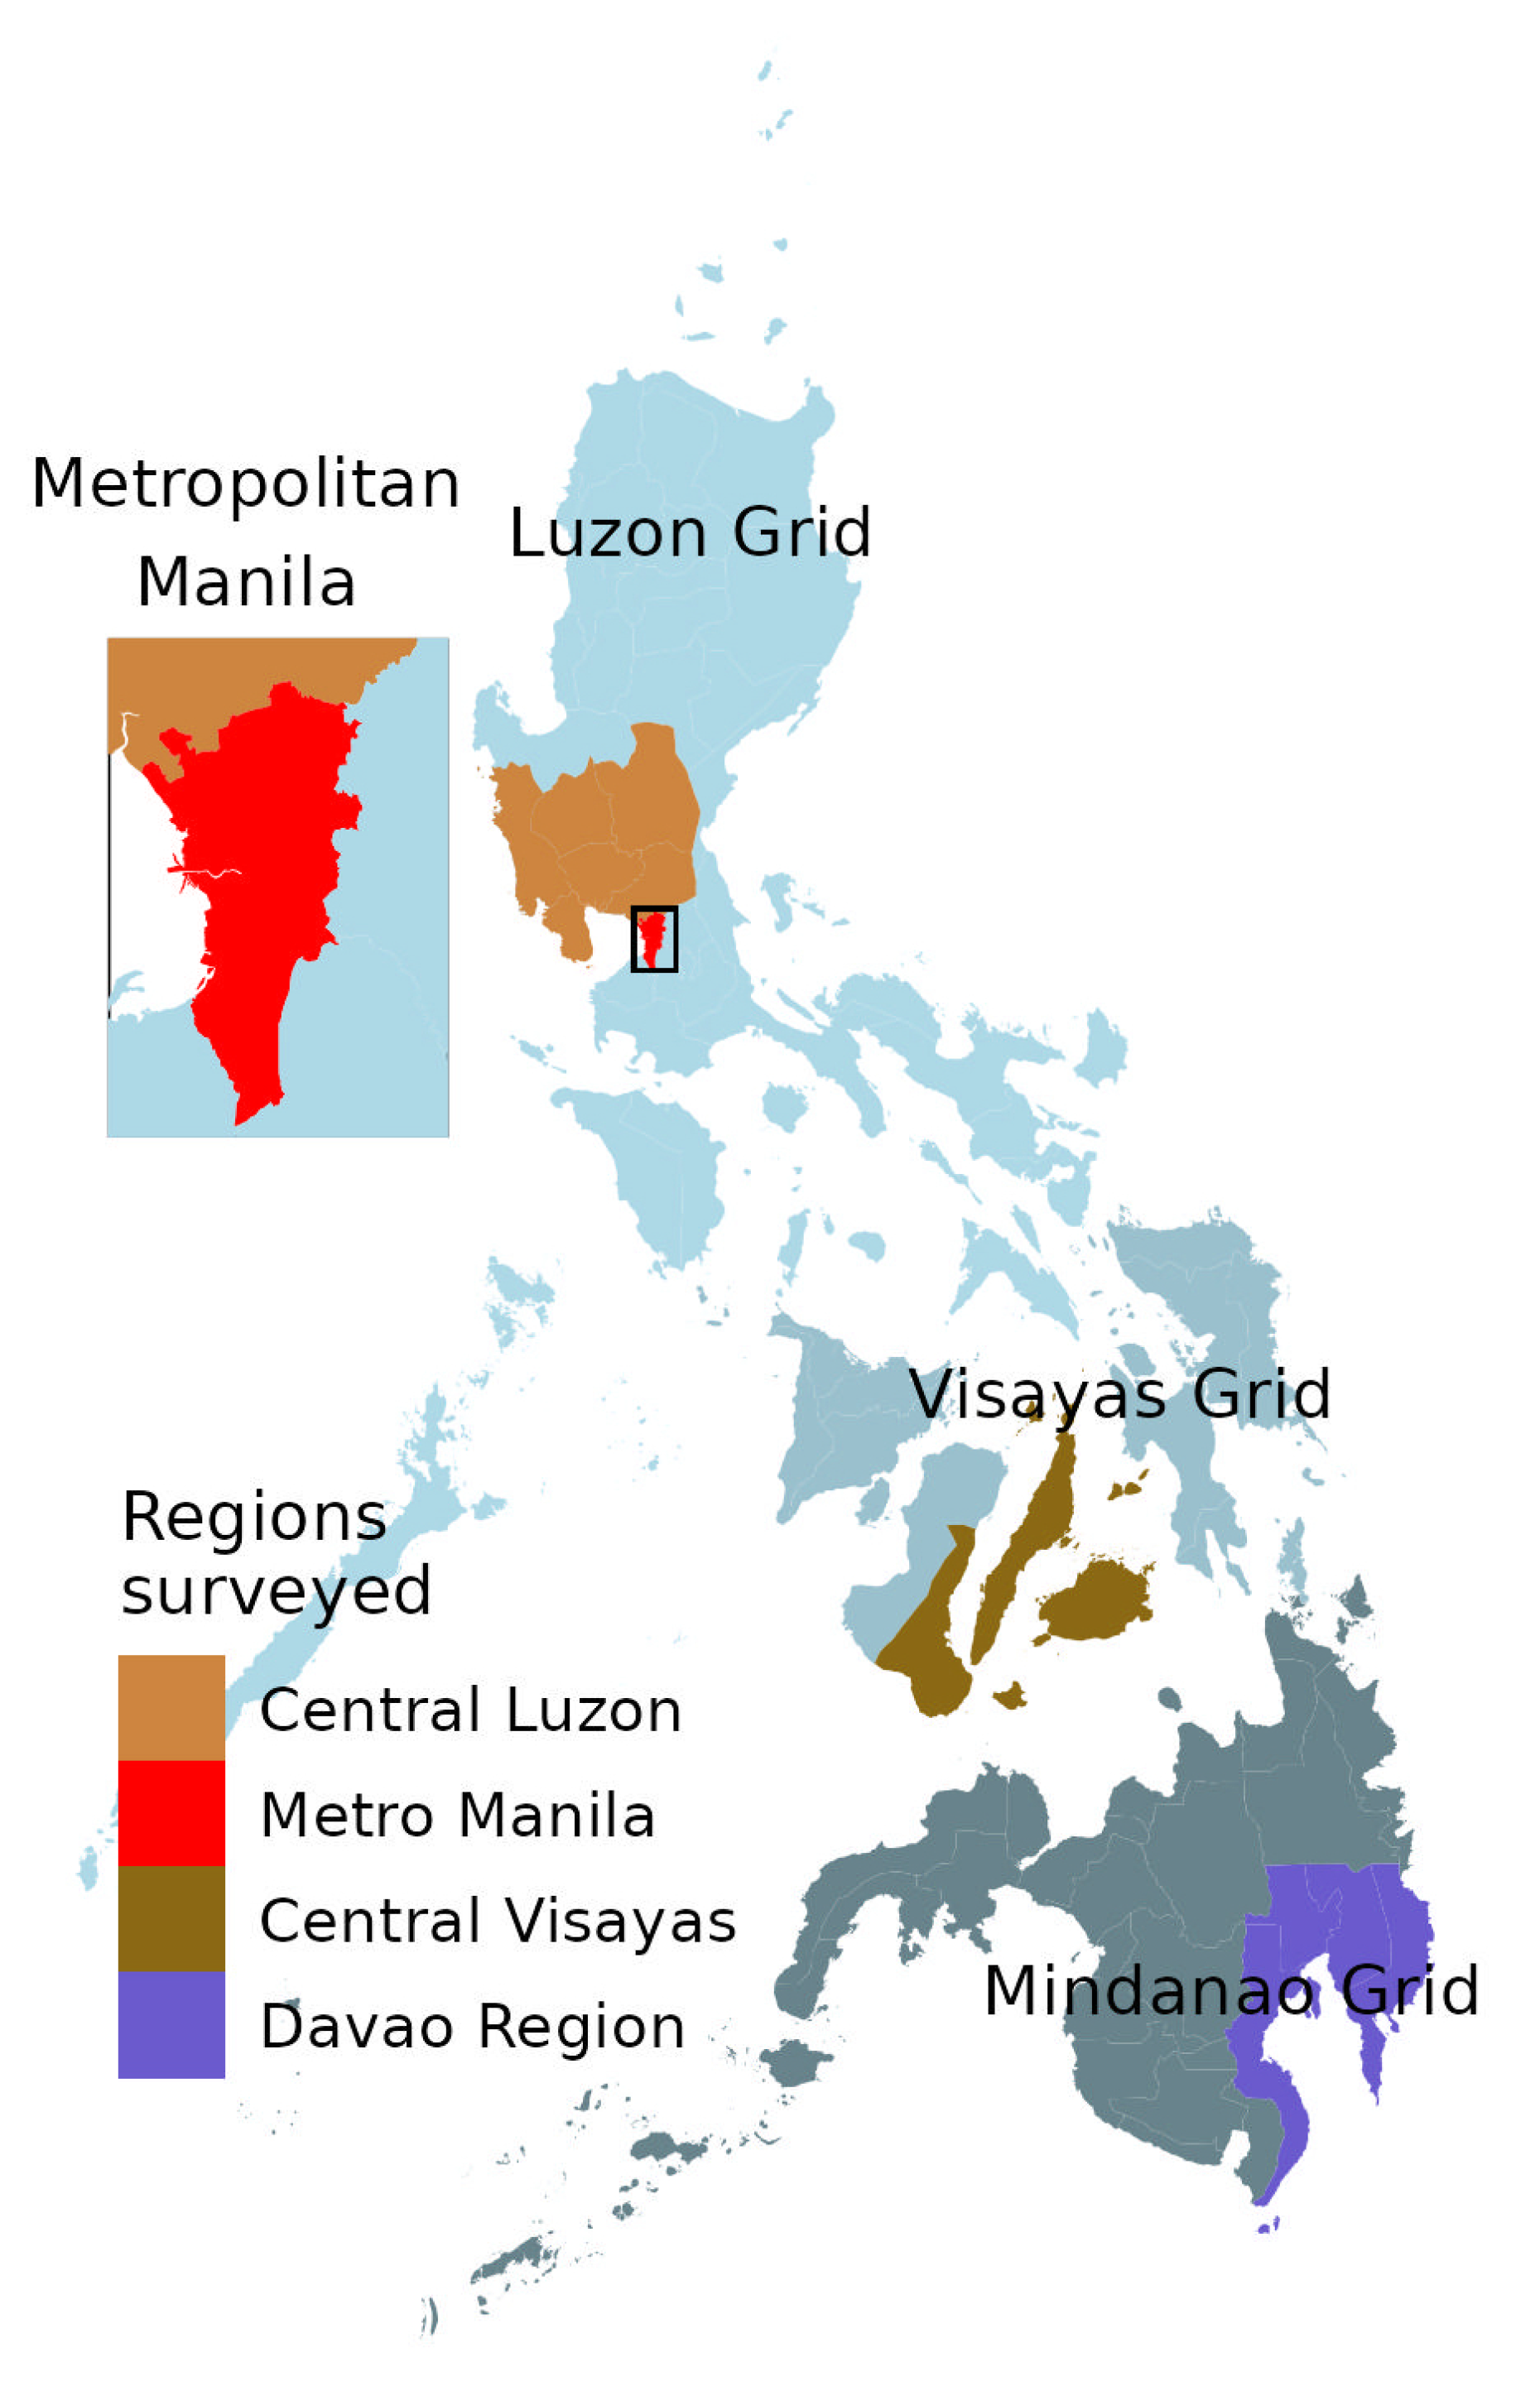
2. Materials and Methods

Data Collection and Questions

The data for this investigation is based on a survey of 400 people in the Philippines through the Pollfish online survey service (www.pollfish.com), conducted between 10 and 11 July 2021. The Philippines is made up of 81 provinces, which are grouped into 17 administrative regions. These are part of three island groups with common cultural and linguistic identities: Luzon, Visayas, and Mindanao. The electricity distribution system is divided into three grids, corresponding to these three geographical areas. The survey targeted four administrative regions, covering each of the grids: the National Capital Region (NCR, also known as Metropolitan Manila), which has a population of 13.5 million, approximately 12.4% of the total population; Central Luzon, with a population of 12.4 million, approximately 11.4% of the total population; Central Visayas (which includes Cebu, Bohol, and many other popular tourist destinations), with a population of 8 million, approximately 7.4% of the population; Davao Region, with a population of 5.3 million, approximately 4.8% of the total population. The first two are in the Luzon Grid, the third is in the Visayas Grid, and the fourth is in the Mindanao Grid [28] (as illustrated in Figure 2). At the time of the survey, the grids were largely independent but plans to integrate them are making progress [29]. Maintenance, fuel shortages and other issues often result in planned and unplanned power outages [30] (colloquially known as ‘brownouts’).
There were a total of 15 questions, plus individual demographic data supplied by Pollfish, generating a total of 91 items. All the questions were in Tagalog.
Most of the questions were on a 5-point Likert scale. This is a commonly used question format that allows the respondent to both show their agreement or disagreement with the question, and the strength of feeling they have toward it (for example, 1 = ‘disagree’, 2 = ‘somewhat disagree’, 3 = ‘unsure/neither agree nor disagree’, 4 = ‘somewhat agree’, 5 = ‘agree’). Following the analysis levels set by Devine-Wright discussed above [25], these included:
  • Personal:
    -
    Pollfish provided demographic data on gender, location, income, occupational and marital status, number of children, education, and year of birth (which was changed for analysis purposes into age brackets).
  • Social-psychological:
    -
    Perception of the climate crisis; participants were given six options, ranging from ‘not a serious problem that can be easily ignored’, to ‘it is a serious crisis that requires major economic and social change’ (Likert scale).
    -
    The priority given to addressing the crisis in relation to economic growth, ranging from ‘economy comes first’ to ‘environment comes first’ (Likert scale).
    -
    Self-declared knowledge of different types of energy sources (Likert scale).
    -
    The extent to which different actors are responsible for reducing the climate crisis, including government, industry, the individual, or natural processes (Likert scale).
    -
    Whether different types of energy should be expanded or not, including RE in general, different types of RE, fossil fuels, and nuclear energy (Likert scale).
    -
    How RE should be financed; respondents were presented with a list of financing sources such as general taxation, a levy, taxation on fossil fuels, etc., and a four-point scale from zero contribution to major contribution (Likert scale).
    -
    Respondents were asked to rank commonly given arguments for and against RE as good, bad, or unimportant (three-point Likert scale).
    -
    How much trust respondents placed in the actions and statements of various actors, including central and local governments, the media, RE campaigners, and energy providers (Likert scale).
  • Contextual:
    -
    Respondents were asked if they were in a rural or urban area (binary item).
    -
    Their exposure to RE, ranging from none to having it at home, at work, in the community, or working for an RE company (categorical item).
    -
    Their experience with power outages, from daily to zero (categorical).
    -
    The importance of the impact of RE on indigenous cultures and the wider environment (Likert scale).

3. Results

3.1. Analysis Methodology

Likert data, while very useful, are also somewhat problematic as to whether it should be treated as purely ordinal or as interval. If considered as purely ordinal, then there are problems surrounding assumptions of normal distribution, implying that mean and other useful parametric measures cannot be used. If the latter, then according to critics, we are assuming that the difference between ‘agree’ and ‘somewhat agree’ is equivalent to that between ‘somewhat disagree’ and ‘disagree’, and that ‘neither agree nor disagree/unsure’ is a midpoint between the extremes, (‘the average of fair- and good- is not fair-and-a-half; this is true even when one assigns integers to represent fair- and good!’ [31]) and should be considered a statistical ‘sin’ [32]. On the other hand, others point to the robustness of the methods and the similarity of the results of parametric and nonparametric measures, as well as the successful use of parametric methods since the introduction of Likert scales 80 plus years ago [33,34]. This paper takes the latter position while bearing in mind the problems associated with it. Likert scale-based surveys are extremely useful for assessing public opinion, hence their popularity with researchers and their acceptance by the public.
The data were processed using multiple regression analysis, using the MASS [35], psych [36], and sjplot [37] packages in R.

3.2. Descriptive Results

3.2.1. Demographic Details

The demographics of the sample are given in Table 1. The number of women present is somewhat higher than in the general population (60% of respondents, but 49.8% of the general population). The survey has a higher proportion of university graduates than the general population (42% university graduates, compared to 11.5%). Generally speaking, participants are younger, more educated, more single, more female, and more urban than the general population. The table also shows the widespread occurrence of power outages, with 83.6% of the participants experiencing one within the last six months.

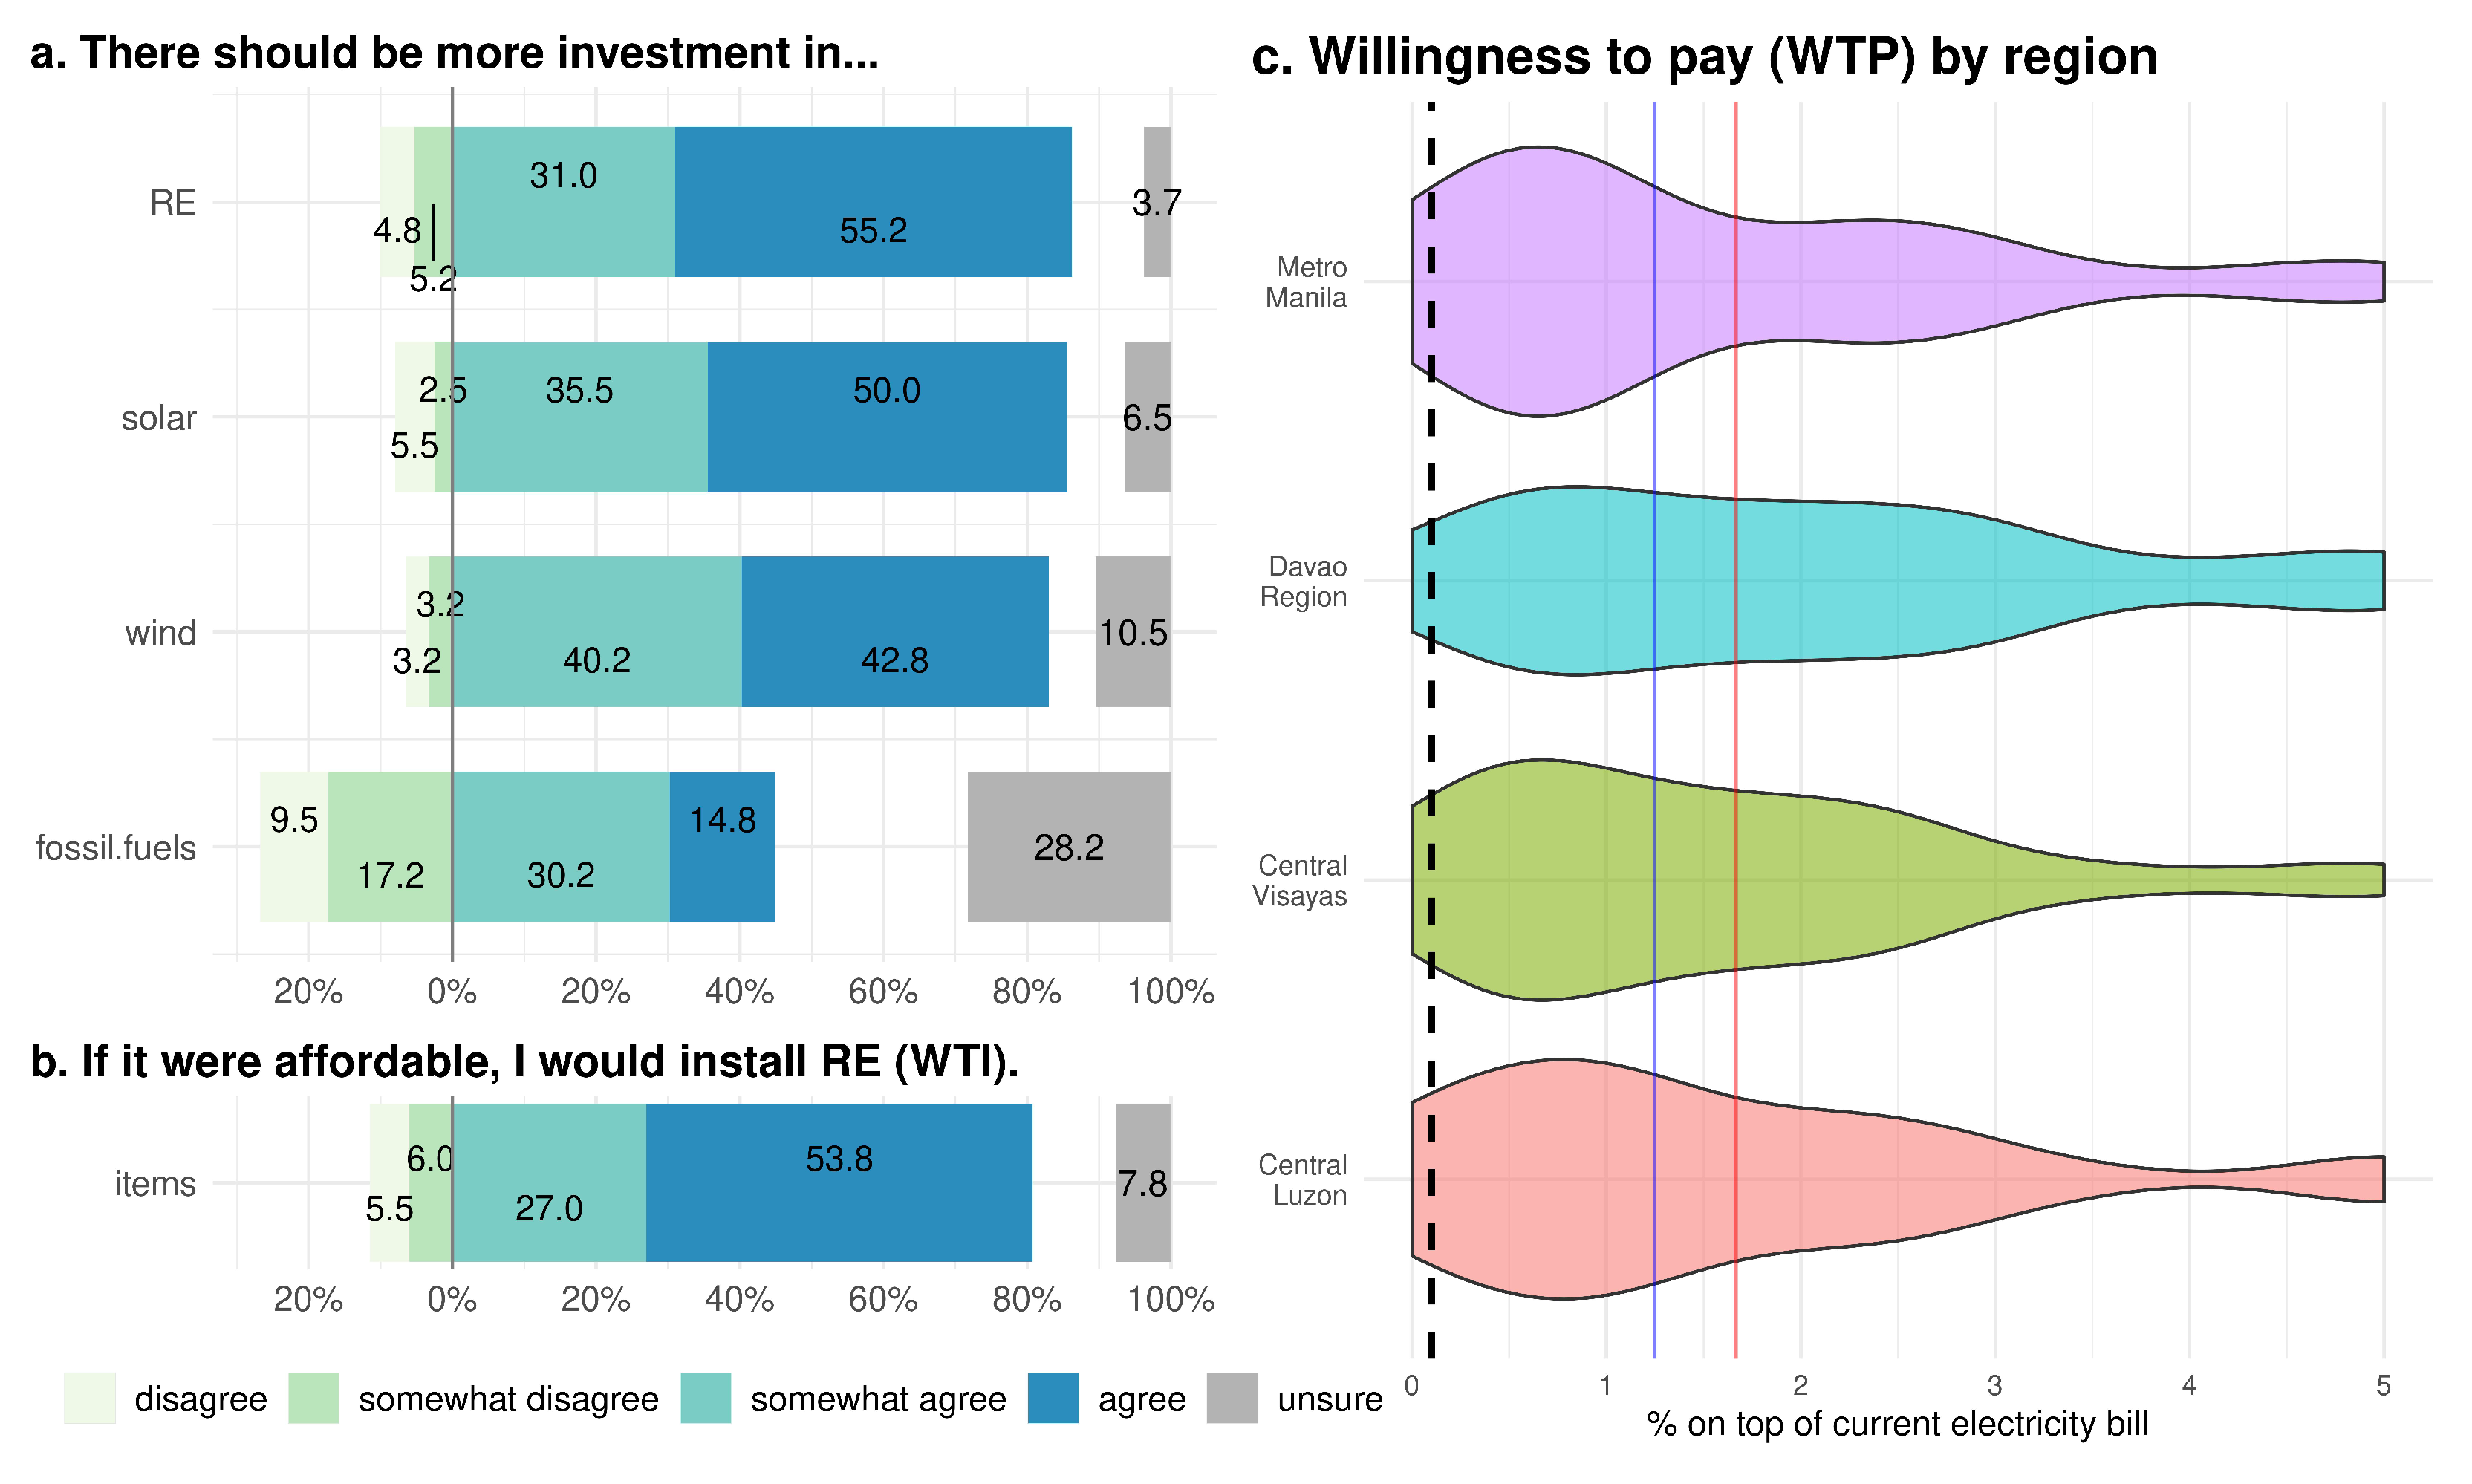
3.2.2. Investment in RE, WTI, and Willingness to Pay

The respondents were asked if they agreed with the statement that there should be more investment in RE in general, in solar, and in wind energies; support for investment in fossil fuels included as a contrast. They were also asked if they agreed with the statement that if affordable they would install RE on their own property (willingness to install—WTI), and the amount extra they are willing to pay on their electricity bills (willingness to pay—WTP). The first five of these were measured on a five-point scale. As illustrated in Figure 3a, there is very high support for expanding RE, with 86.2% saying ‘agree’ or ‘somewhat agree’, and only 10.0% disagreeing, with similar responses for solar and wind power. On the other hand, only 45.0% showed any level of support for investing in fossil fuels. An overwhelming number of participants (80.0%) said they would install RE on their homes (WTI) if it were affordable (Figure 3b). A common measure of support for RE is WTP [38], as this places a price on the individual’s previously claimed support. It should be noted that this question was posed last in the survey, potentially allowing the preceding questions to guide participants toward being more supportive of RE and more generous in its funding.
Currently, all electricity consumers are charged a feed-in-tariff allowance (FiT-All), which is set by the Energy Regulatory Commission in consultation with the National Transmission Corporation (TransCo). The rate for the period of the survey was PHP 0.0983 per kWh, about 0.01 to 0.02% of the average bill, depending on the provider [39]. This marked a reduction from previous years (although higher than the PHP 0.0495 rate for 2019, but still much lower than the PHP 0.2226 of 2018 [40]), in part in response to the financial hardship many households faced due to the COVID pandemic. (The situation was somewhat more complicated than this suggests. The FiT-All was suspended for one month in March 2022 to address hardship issues [41]. The Meralco rate schedule [42] suggests a rate of 0.0495 per kilowatt, but also a lower charge than the PHP 0.0983 rate was calculated with, so the FiT rate remains about the same.)
As Figure 3c illustrates, participants were asked how much more per month they would be willing to pay on top of their current electricity bill to help finance RE, and were presented with a sliding scale ranging from 0% to 5%, increasing in 0.5% increments. (The first step of 0.5% is considerably higher than the actual FiT rate, arguably a failure of the survey design. However, it is sufficient enough to provide a general picture.) A total of 22.25% chose 0.5%, the lowest possible, and, 27.25% of the participants chose 1 to 1.5%, about ten times the contemporary FiT-All levels. A total of 9.8% of the participants selected 0%.

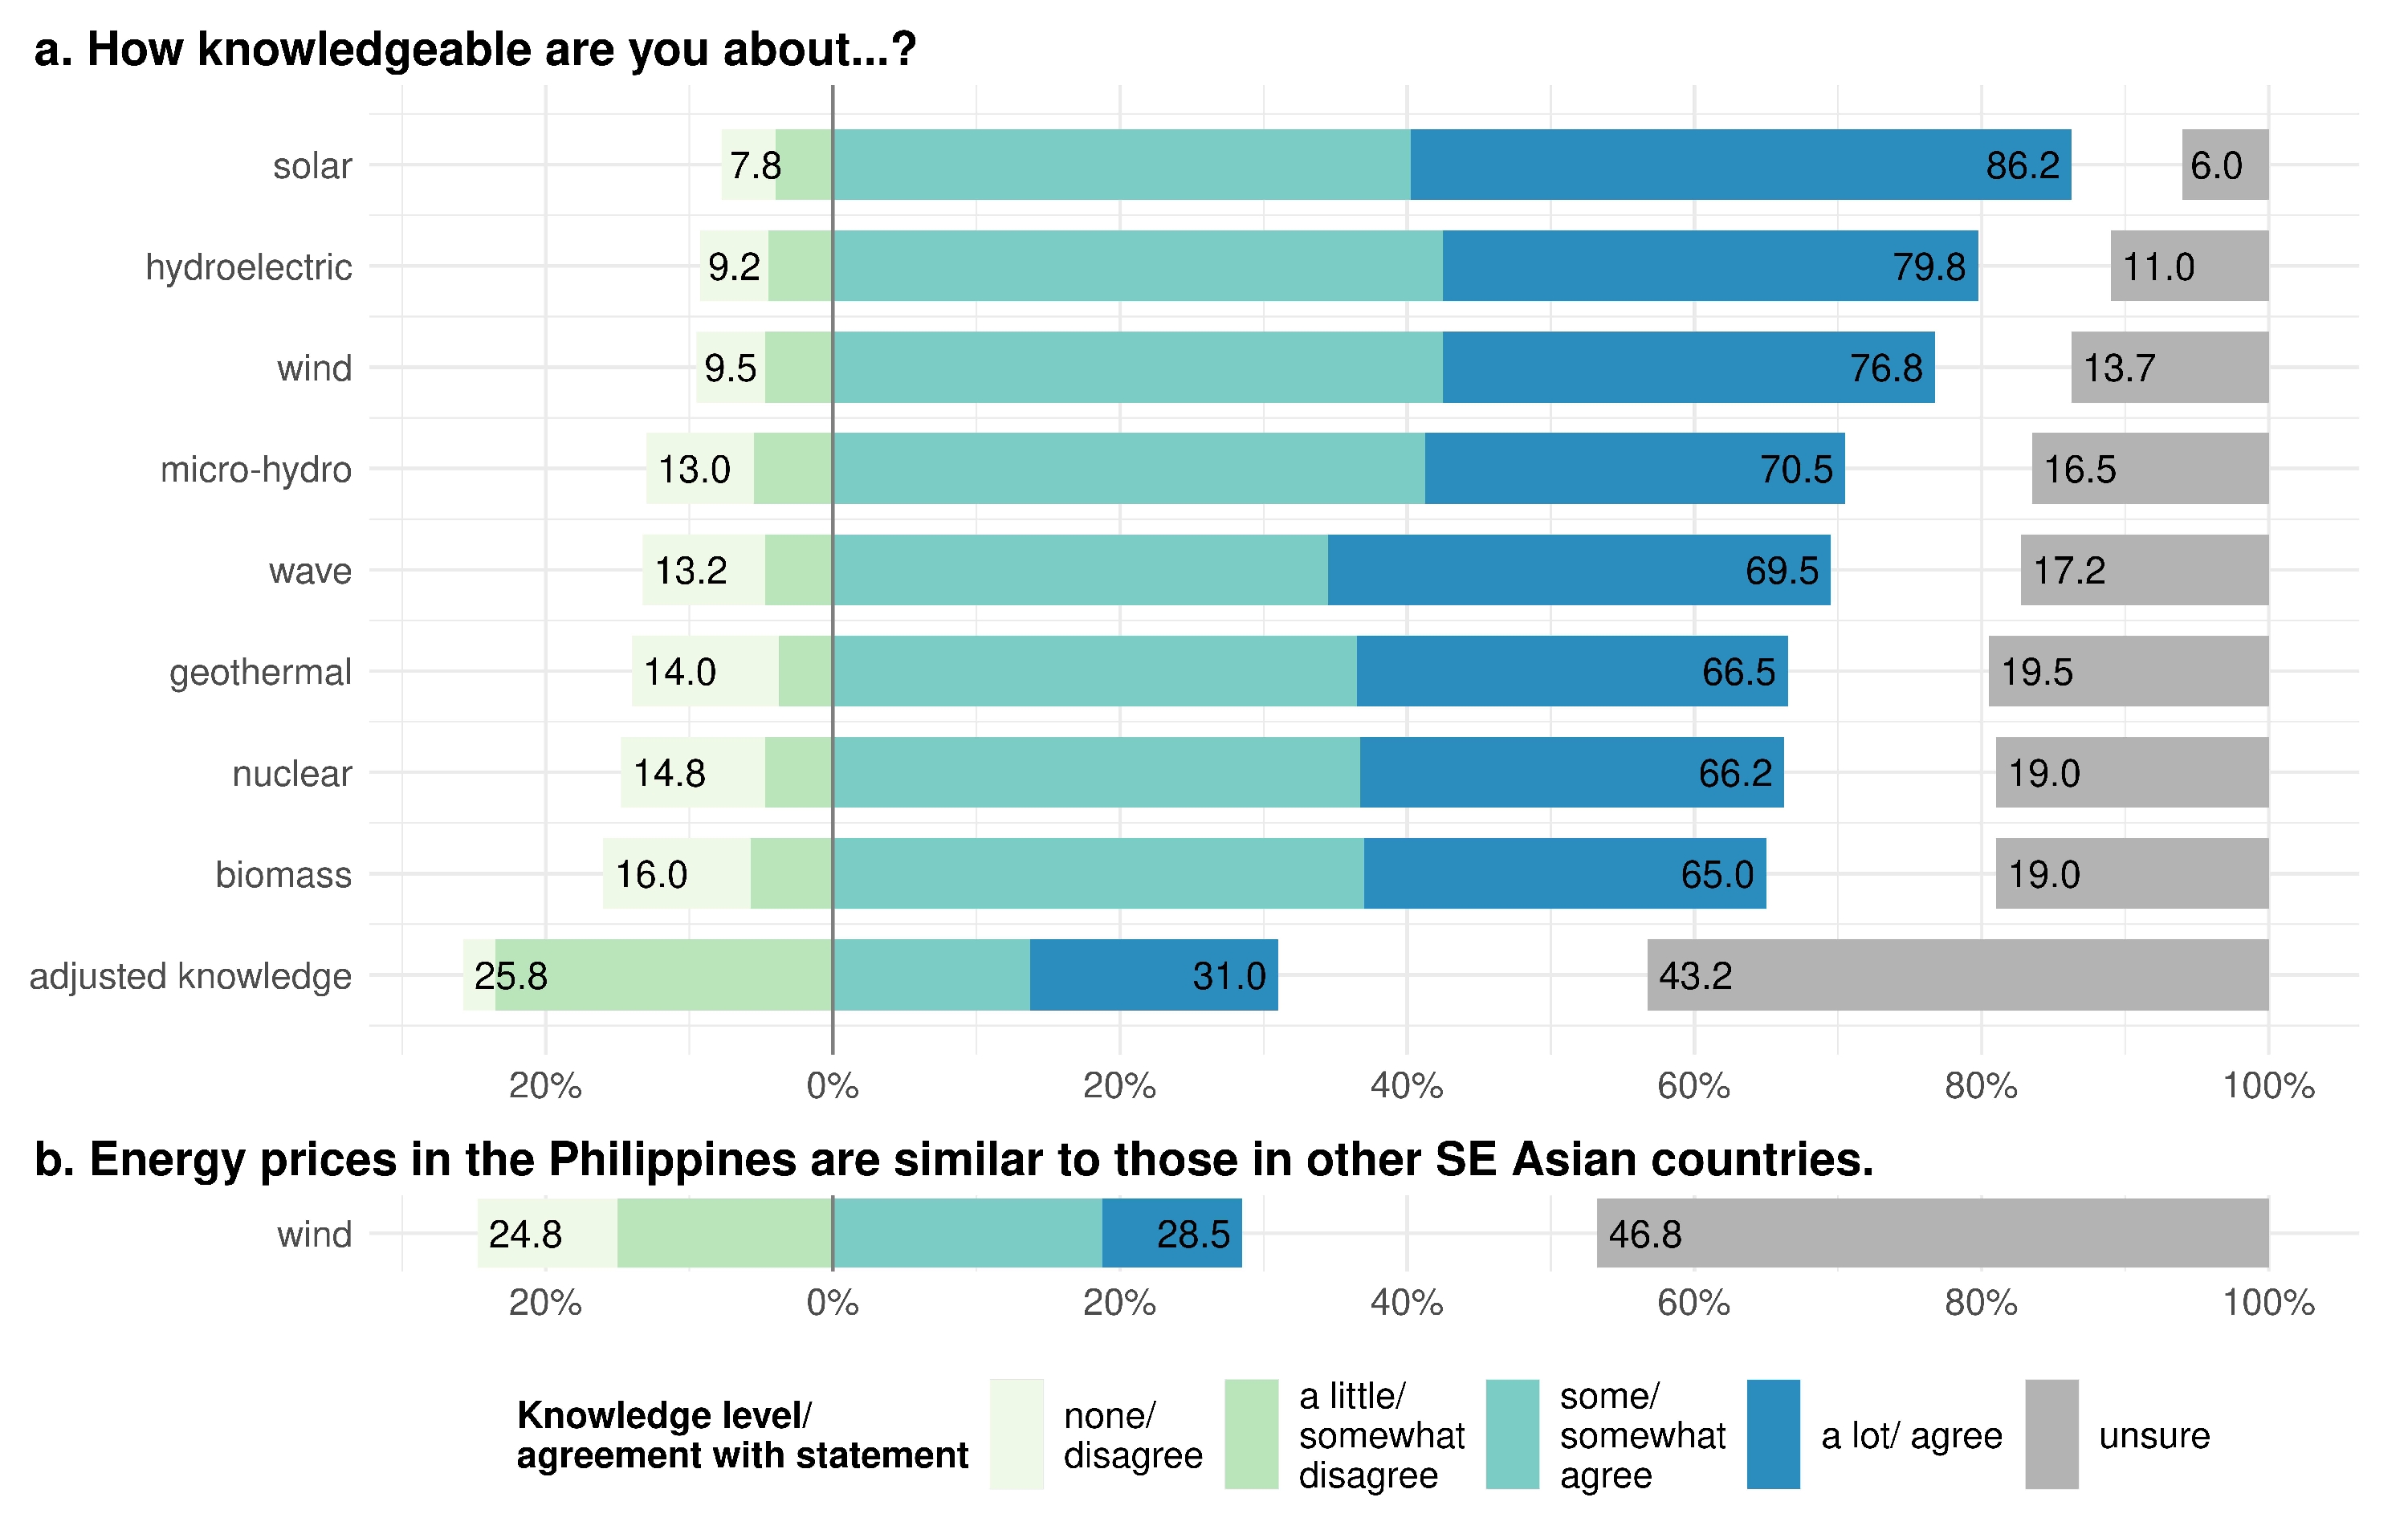
3.2.3. Knowledge of Energy Sources

Participants were asked to rate their knowledge of the different types of alternative energy sources available or potentially available in the Philippines (Figure 4). The problem with self-reporting is that people judge levels of knowledge differently or may be misinformed. Therefore, they were also asked a factual question: ‘Do you agree that energy prices in the Philippines are similar to those in other South East Asian countries?’ This was used to create a new ‘adjusted knowledge’ variable, which reduced the scores of those who were overly self-confident in their level of knowledge. Although far from perfect, this proved to be more significant in some models than individual scores or an unadjusted accumulative knowledge variable. The greatest impact of the adjusted knowledge variable was to increase the number of ‘unsure’ and ‘a little knowledgeable’ responses. As the adjusted rating indicates, there were a large number of participants who claimed high levels of knowledge (65.0% for biomass to 86.2% for solar), but were mistaken or not aware of the comparatively high energy prices in the Philippines. The claimed levels of knowledge were evenly distributed amongst the survey regions. Interestingly, this includes geothermal energy, even though it is a major energy source in the Central Visayas, but not in Mindanao. The 69.0% of participants with an adjusted ‘none’ to ‘unsure’ knowledge response is very similar to the results of the Bollettino survey discussed above [26].

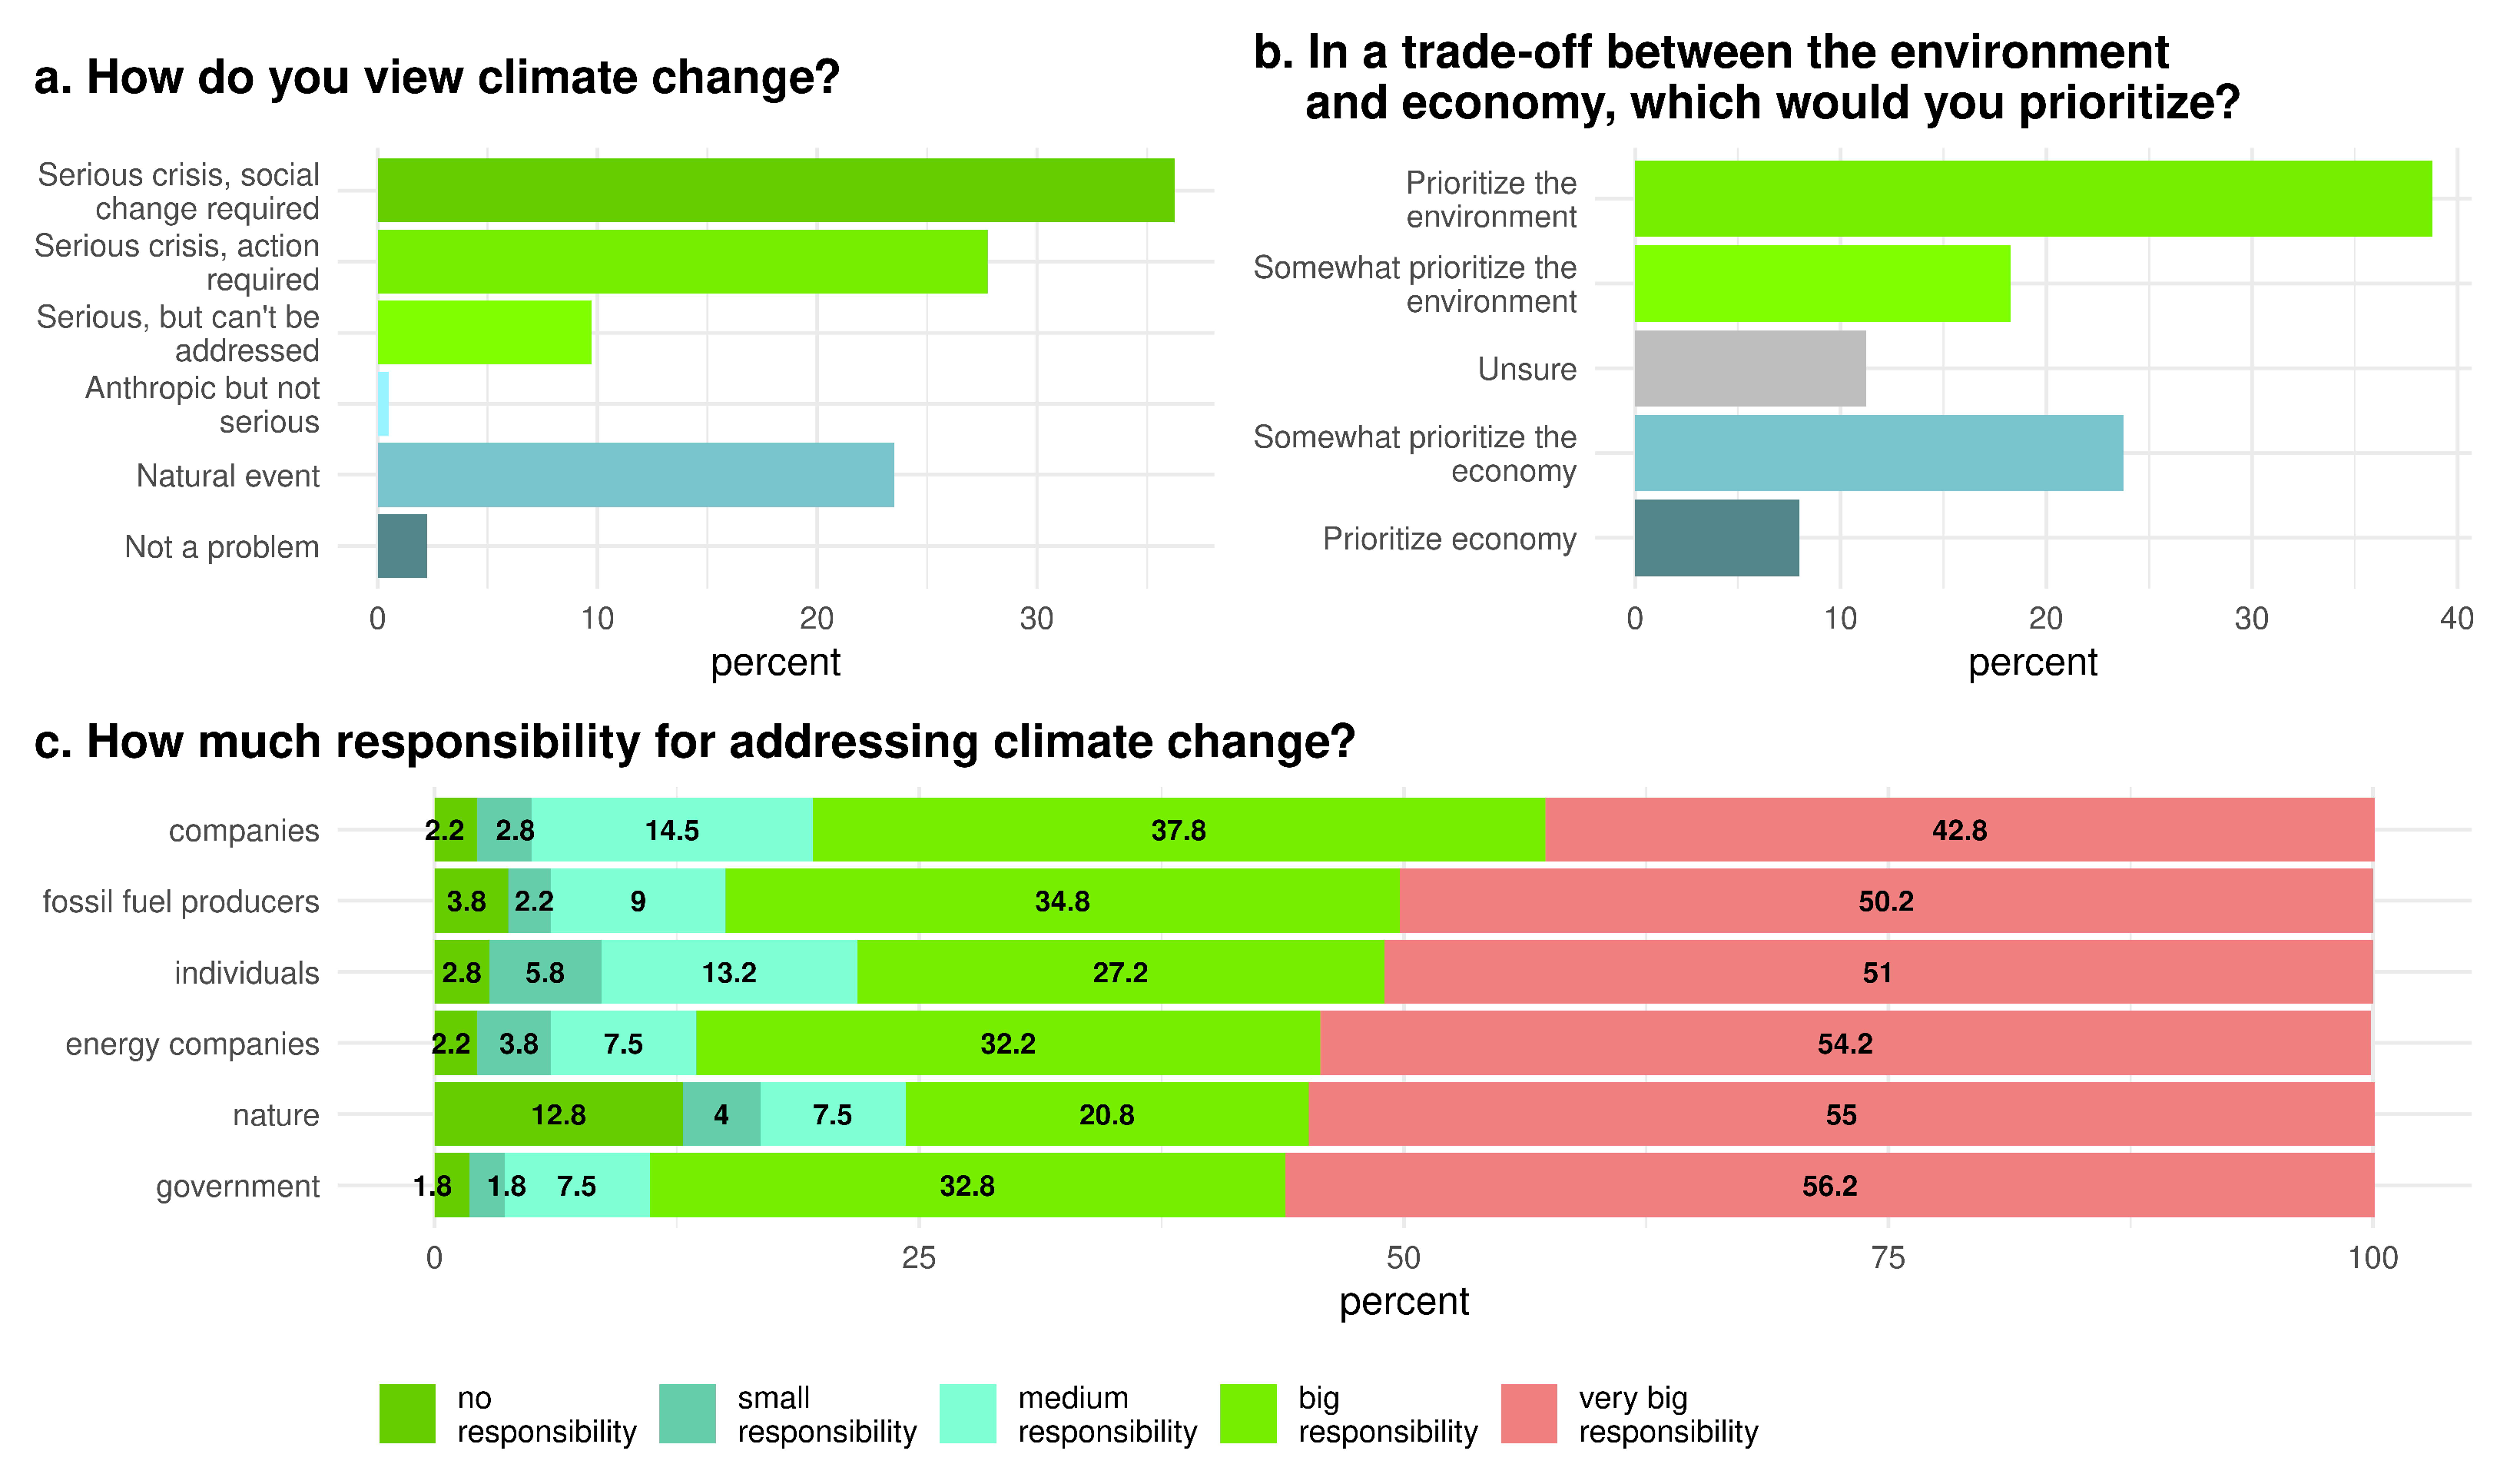
3.2.4. Perceptions of the Climate Crisis

Participants were asked a series of questions to gauge their position on climate change (the term ‘climate change’ (‘pagbabago ng klima ng mga’) was chosen over ‘climate crisis’ (‘krisis sa klima’) as a less controversial and more neutral term to avoid influencing the response) (Figure 5). Firstly, participants were offered a series of options on whether it was insignificant, natural, or anthropogenic, and how it should be addressed: do nothing, some action needed, or significant societal changes needed. As illustrated in Figure 5a, 36.3% of the participants saw climate change as a serious enough crisis to require serious societal change, followed by 27.8% who saw it as requiring action from industry, government, and individuals. The third largest response (23.5%) was from those who believed it was a naturally occurring event that did not require action. This agrees with the results of the UNDP survey [27]. The follow-up question was whether the participants prioritised the environment or the economy (Figure 5b). A total of 38.8% said they would choose the environment at the expense of the economy, followed by 23.8% who said that they somewhat prioritise the economy over the environment. The third measure of environmental perception was how much responsibility for addressing the crisis participants assigned to different actors (Figure 5c). The government was considered the most important actor (89.0% giving it a ‘big’ or ‘very big responsibility’), followed by energy companies (86.4%) and fossil fuel companies (85.0%). Nature was chosen as having ‘very big responsibility’ by 55.0%, but also given the biggest ‘no responsibility’ (12.8%). Individuals were seen as having a ‘very big responsibility’ by 51.0% of the participants.

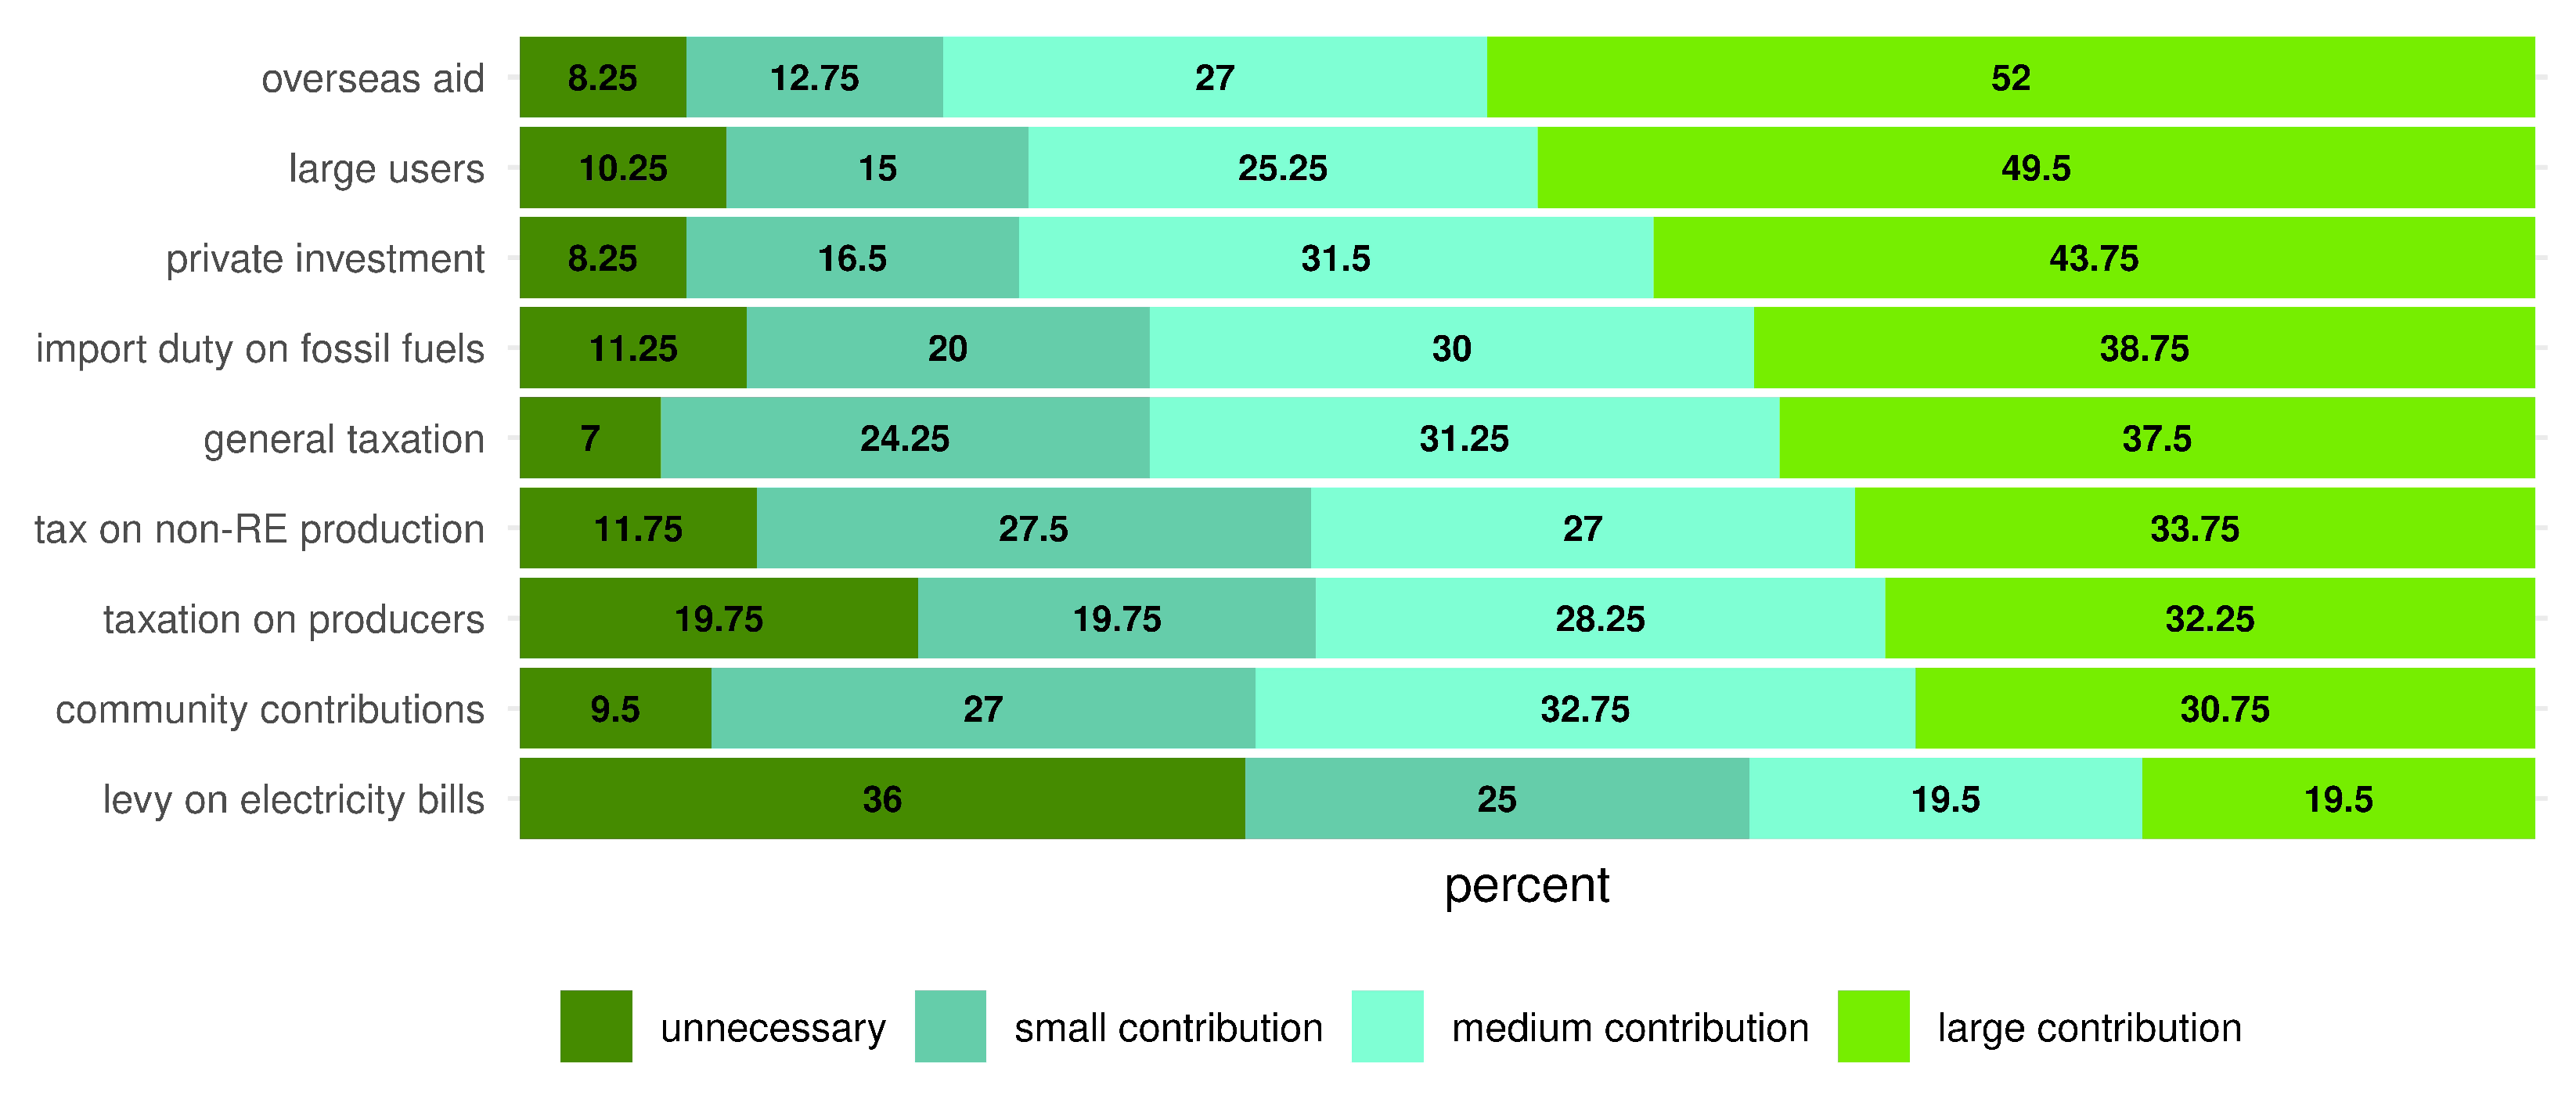
3.2.5. Contributing to RE Investment

Respondents were asked how much different actors should contribute to investment in RE. As Figure 6 illustrates, overseas aid was found to be the main source of investment (52.0%), followed by contributions from large energy users (49.5%). At the other end of the scale is a levy on electricity bills—a feed-in-tariff—with only 19.5% of respondents saying that this should be a large source of investment funds, and 36.0% saying that it is unnecessary. This was followed by contributions from communities benefiting from RE projects (30.75%). However, general taxation as a funding source was only opposed by 7.0% of the respondents, suggesting that although they did not want to directly pay for RE through their bills, participants mostly agreed that there should be some public investment in it.

3.2.6. Other Variables

Other independent variables also had an impact on various models. Some of these were presented as five-point Likert questions, others were presented as ‘good’, ‘bad’, or ‘unimportant’ arguments for or against RE. These variables are given in Table 2. A total of 81.75% of the participants agreed that more cooperation between local and central government is necessary, and 76.0% approved of subsidies for RE. However, there was also a degree of scepticism about RE: 56.5% saw RE as unable to supply the country’s energy needs, 46.25% said that construction was too expensive, and another 35% that the electricity produced by RE is too expensive.

3.3. Statistical Analysis and Modelling of Variables

As discussed in Section 3.1, the dependent variables are all ordinal factors (i.e., 1 to 5 on the Likert scale) where we cannot necessarily assume equal spacing between the different response categories, a suitable analytical approach is to use proportional odds logistic regression [43]. The polr function from the MASS package in r [35] was used. The model is parameterized as follows:
l o g i t ( P ( Y m ) ) = β m 0 η 1 x 1 η p x p
where Y is the dependent variable with the ordinal outcome of M categories. The dependent variables were tested for normal distribution using the Shapiro–Wilks test, which suggested a non-normal distribution. In the models below, χ 2 was calculated using the Kruskal–Wallis H test, as it assumes a nonnormal distribution and is suitable for nonparametric data. The Brant test indicated that the parallel regression assumption was valid for all models.
Given that so many individuals both supported the expansion of RE and also saw the climate crisis as serious and requiring societal change, the two variables gauging perception of the climate crisis have very little power in explaining any variation in the dependent variables.

3.3.1. Regression Analysis of Overall Support for RE

Table 3 gives the results of the regression analysis for the responses to the statement ‘More of the Philippines’ electricity should be generated by renewable energy’. χ 2 is significant and McFadden R 2 is more than 0.2, suggesting that the model has a good fit.
The regression analysis suggests that higher levels of education have a positive impact on support (0.27). Those who thought that more cooperation between central and local government also tended to be more supportive of RE (0.54), as were those who wanted more subsidies for RE (0.51), and who believed that companies should be responsible for tackling the climate crisis (0.51). However, given the wide range of the 95% confidence intervals (CI), this model is not particularly strong. Income did not have a significant impact on the analysis.

3.3.2. Regression Analysis of WTI

Table 4 gives the regression analysis for WTI. Income, not surprisingly, has a positive impact on the model (0.27). Yet again, the need for more cooperation has a strong impact on the model (0.63), as does support for subsidising RE (0.36). The belief that fossil fuel producers are responsible for tackling the climate crisis is also a significant variable (0.47). Knowledge also has a positive impact on support for WTI (0.35). Interestingly, the variable ‘RE is unable to supply the Philippines’ energy needs’ has a positive impact (0.35). It is possible that many participants saw this statement as a comment on the current state of affairs rather than as a general statement on the ability of RE to provide energy needs in the future, suggesting the statement was poorly worded. However, this cannot explain the positive impact of the variable ‘fossil fuels are reliable’ (0.33). Although χ 2 is significant, McFadden R 2 suggests that the model is not a particularly good fit.

4. Discussion

The data indicate that there is widespread awareness of the climate crisis, support for urgent action to address it, and support for renewable energy in the Philippines. This awareness and support are similar regardless of age, gender, location, and income. However, the models suggest that other concerns also play a role in the attitudes of the participants towards RE and energy policy. A common variable in the models was support for the statement that cooperation between local and central governments would improve the implementation of RE. This may indicate a concern about the overly complex and fractured nature of the Philippine government, as described by Marquardt [18] and Bertheau et al. [15]. Furthermore, the sizable minority (45.0% agreeing and 28.2% ‘unsure’) that gave support for further investment in fossil fuels (Figure 3a) and the support shown for the reliability of fossil fuels (41.25% ‘somewhat agree’ and 21.25% ‘agree’, Section 3.2.6) suggests that issues related to energy supply in general are of greater concern than RE in particular.
Returning to the discussion on public acceptance (Section 1.2), when applying the Devine-Wright [25] approach the results suggest that social-psychological factors took precedence for most of the participants. Gender and education (Devine-Wright’s ‘personal’ level) are significant for RE support, whereas income was the only personal factor with an impact on WTI. As mentioned above, the widespread agreement on the climate crisis meant that these measures did not contribute to explaining any variation in the regression models. Contextual factors (rural or urban, experience of brownouts) also had no significant impact. The Lucas et al. [24] definition of public acceptance (awareness, support, participation and engagement) fits well with the results of this survey, and the high WTI indicates a willingness to engage with RE technology.
The positive impact of knowledge in both models suggests that an effective public relations campaign will be beneficial to further increase the support and implementation of RE in the Philippines. The relatively high WTP indicated in Figure 3c, (the limitations of this measure are discussed below) suggest it would be possible for the Philippine authorities to increase the FiT rate and accelerate the expansion and diversification of RE sources without too much public opposition, if they are able to address the organisational issues discussed above and apparent to the 81.75% of participants (Section 3.2.6) who agreed that more cooperation between different levels of government is needed.
A weakness of the survey was the question on WTP. The participants were presented with a sliding scale that may not have been granular enough for many of them. During the survey design process, it was decided that this would be better than other options such as a list of numbers that might bias their choice, or a blank entry field that might produce inconsistent entries (for example, some may enter a percentage, others a currency amount, etc.). However, the results presented in Figure 3c are sufficient to provide an overall picture of the participants’ WTP.

5. Conclusions

The current research set out to explore the degree of support for renewable energy in the Philippines. An online survey of 400 people gave a good cross-section of society in four different regions and in all three power grids, albeit somewhat more female and better educated than the general population. The research found a widespread understanding of the climate crisis and support for radical action, across all socioeconomic groups. Increased RE expansion was clearly supported, but tempered by the belief that more cooperation between the local and central government is necessary.
More than 80% of the participants indicated a willingness to install RE on their own property if it were affordable (Figure 3b). This suggests that among our participants there is clear support for a more decentralised renewable energy generation system.
The WTI results further suggest a high potential for growth in rooftop solar energy and other localised renewable energy, if the authorities are willing and able to create an administrative environment conducive to it. The relatively high WTP (despite the weakness of the question in the survey, as discussed above) suggests that, if properly presented and implemented, there is public support for widespread RE expansion. The structural and financial obstacles that must be overcome are not insurmountable and require only political will, as suggested by Vietnam’s success in expanding rooftop solar panels [6].
Future areas of research are two-fold. First, to take a more qualitative approach to the Philippine renewable energy sector and look at the decision-making process of individual actors: an energy provider, a household or a community, and individuals in official decision-making positions. The second area of research to consider is to conduct a similar survey of the Philippines’ South-East Asian neighbours and build a comparative model.

Author Contributions

Conceptualization and methodology, S.L. and T.N.; investigation, formal analysis, writing, and vizualization, S.L. All authors have read and agreed to the published version of the manuscript.

Funding

This work was supported by JSPS Kakenhi Grant Number JP22H02447.

Institutional Review Board Statement

The study was conducted in accordance with the Declaration of Helsinki, and approved by the Ethics Committee of Kyoei University (protocol code 20220007, approved 10 August 2022).

Informed Consent Statement

Informed consent was obtained from all subjects involved in the study.

Data Availability Statement

The data presented in this study is available on request from the corresponding author.

Acknowledgments

With thanks to Marjorie Hope Reyes for help with the translation of the survey into Tagalog.

Conflicts of Interest

The authors declare no conflict of interest.

Abbreviations

The following abbreviations are used in this manuscript:
FiTFeed-in-Tariff
FiT-AllFeed-in-Tariff Allowance
RERenewable Energy
UNDPUnited Nations Development Programme
WTIWillingness to Install
WTPWillingness to Pay

References

  1. Asian Development Bank. Philippines: Energy Sector Assessment, Strategy, and Road Map; Asian Development Bank: Mandaluyong, Philippines, 2018. [Google Scholar]
  2. Ember. Countries and Regions: Electricity Trends. 2022. Available online: https://ember-climate.org/countries-and-regions/ (accessed on 28 June 2022).
  3. Yokota, E.; Kutani, I. Comparative Analysis of Power Prices in the Philippines and Selected ASEAN Countries. 2018. Available online: https://www.eria.org/research/comparative-analysis-of-power-prices-in-the-philippines-and-selected-asean-countries/ (accessed on 2 July 2022).
  4. Lectura, L. Average Electricity Price in PHL 2nd Highest in Asia–Think Tank. 2018. Available online: https://businessmirror.com.ph/2018/08/07/average-electricity-price-in-phl-2nd-highest-in-asia-think-tank/ (accessed on 2 July 2022).
  5. Lackovic, M.; Ruiz-Cabrero, J. Powering up Philippines’ Renewable Ambitions with Rooftop Solar. 2021. Available online: https://www.bworldonline.com/opinion/2021/11/09/409305/powering-up-philippines-renewable-ambitions-with-rooftop-solar/ (accessed on 29 June 2022).
  6. Gunther, E.A. Vietnam Rooftop Solar Records Major Boom as More than 9 GW Installed in 2020. Available online: https://www.pv-tech.org/vietnam-rooftop-solar-records-major-boom-as-more-than-9gw-installed-in-2020/ (accessed on 29 June 2022).
  7. Energy Regulatory Commission. Resolution No. 06, Series of 2019: A Resolution Adopting the Amendments to the Rules Enabling the Net-Metering Program for Renewable Energy. 2019. Available online: https://www.erc.gov.ph/Files/Render/issuance/29981 (accessed on 30 July 2022).
  8. Gatchalian, W. An Act Enhancing the Implementation of the Net-Metering Program, Amending for the Purpose Republic Act No. 9513, Otherwise Know as the Renewable Energy Act of 2008. 2021. Available online: https://wingatchalian.com/wp-content/uploads/2021/05/3505531885.pdf (accessed on 28 June 2022).
  9. Solaric. Net Metering: The Process and Why It Takes Time—Solar Panels Philippines. 2019. Available online: https://solaric.com.ph/blog/process-net-metering/ (accessed on 29 June 2022).
  10. Verzola, R. Microrenewables. 2019. Available online: https://rverzola.files.wordpress.com/2019/08/mr11_vol4_08282019_final_8am.pdf (accessed on 13 April 2022).
  11. Verzola, R. Microrenewables. 2019. Available online: https://rverzola.files.wordpress.com/2019/11/mr12_vol4_1104_final.pdf (accessed on 13 April 2022).
  12. Roxas, F.; Santiago, A. Alternative framework for renewable energy planning in the Philippines. Renew. Sustain. Energy Rev. 2016, 59, 1396–1404. [Google Scholar] [CrossRef]
  13. Barroco, J.; Herrera, M. Clearing barriers to project finance for renewable energy in developing countries: A Philippines case study. Energy Policy 2019, 135, 111008. [Google Scholar] [CrossRef]
  14. Lagac, J.M.P.; Yap, J.T. Evaluating the feed-in tariff policy in the Philippines. Int. J. Energy Econ. Policy 2021, 11, 419–425. [Google Scholar] [CrossRef]
  15. Bertheau, P.; Dionisio, J.; Jütte, C.; Aquino, C. Challenges for implementing renewable energy in a cooperative-driven off-grid system in the Philippines. Environ. Innov. Soc. Transit. 2020, 35, 333–345. [Google Scholar] [CrossRef]
  16. Guild, J. Feed-in-tariffs and the politics of renewable energy in Indonesia and the Philippines. Asia Pac. Policy Stud. 2019, 6, 417–431. [Google Scholar] [CrossRef] [Green Version]
  17. Rababah, H.E.; Ghazali, A.; Isa, M.H.M. Building Integrated Photovoltaic (BIPV) in Southeast Asian Countries: Review of Effects and Challenges. Sustainability 2021, 13, 12952. [Google Scholar] [CrossRef]
  18. Marquardt, J. How Power Affects Policy Implementation: Lessons from the Philippines. J. Curr. Southeast Asian Aff. 2017, 36, 3–27. [Google Scholar] [CrossRef] [Green Version]
  19. Fatima, N.; Li, Y.; Ahmad, M.; Jabeen, G.; Li, X. Factors influencing renewable energy generation development: A way to environmental sustainability. Environ. Sci. Pollut. Res. 2021, 28, 51714–51732. [Google Scholar] [CrossRef]
  20. Taufik, D.; Dagevos, H. Driving public acceptance (instead of skepticism) of technologies enabling bioenergy production: A corporate social responsibility perspective. J. Clean. Prod. 2021, 324, 129273. [Google Scholar] [CrossRef]
  21. Gareiou, Z.; Drimili, E.; Zervas, E. Public acceptance of renewable energy sources. In Low Carbon Energy Technologies in Sustainable Energy Systems; Elsevier: Amsterdam, The Netherlands, 2021; pp. 309–327. [Google Scholar]
  22. Cousse, J. Still in love with solar energy? Installation size, affect, and the social acceptance of renewable energy technologies. Renew. Sustain. Energy Rev. 2021, 145, 111107. [Google Scholar] [CrossRef]
  23. Makki, A.A.; Mosly, I. Factors Affecting Public Willingness to Adopt Renewable Energy Technologies: An Exploratory Analysis. Sustainability 2020, 12, 845. [Google Scholar] [CrossRef] [Green Version]
  24. Lucas, H.; Carbajo, R.; Machiba, T.; Zhukov, E.; Cabeza, L.F. Improving Public Attitude towards Renewable Energy. Energies 2021, 14, 4521. [Google Scholar] [CrossRef]
  25. Devine-Wright, P. Reconsidering public acceptance of renewable energy technologies: A critical review. In Delivering a Low Carbon Electricity System; Grubb, M., Jamasb, T., Pollitt, M.G., Eds.; Cambridge University Press: Cambridge, UK, 2008; pp. 443–461. [Google Scholar]
  26. Bollettino, V.; Alcayna-Stevens, T.; Sharma, M.; Dy, P.; Pham, P.; Vinck, P. Public perception of climate change and disaster preparedness: Evidence from the Philippines. Clim. Risk Manag. 2020, 30, 100250. [Google Scholar] [CrossRef]
  27. UNDP. Peoples’ Climate Vote Results, 2021. Available online: https://www.undp.org/publications/g20-peoples-climate-vote-2021 (accessed on 27 June 2022).
  28. Philippine Statistical Authority. Population and Housing Statistical Tables. 2022. Available online: https://psa.gov.ph/population-and-housing/statistical-tables (accessed on 29 June 2022).
  29. NGCP Completes Integral Components of Mindanao-Visayas Interconnection Project—SUNSTAR. 2022. Available online: https://www.sunstar.com.ph/article/1933553/bacolod/business/ngcp-completes-integral-components-of-mindanao-visayas-interconnection-project (accessed on 2 July 2022).
  30. Dalusung, A.; Manansala, J. Who Is Profiting from the Power Outages? 2021. Available online: https://businessmirror.com.ph/2021/09/04/who-is-profiting-from-the-power-outages/ (accessed on 2 July 2022).
  31. Jamieson, S. Likert scales: How to (ab) use them? Med. Educ. 2004, 38, 1217–1218. [Google Scholar] [CrossRef] [PubMed]
  32. Kuzon, W.; Urbanchek, M.; McCabe, S. The seven deadly sins of statistical analysis. Ann. Plast. Surg. 1996, 37, 265–272. [Google Scholar] [CrossRef] [PubMed]
  33. Norman, G. Likert scales, levels of measurement and the “laws” of statistics. Adv. Health Sci. Educ. 2010, 15, 625–632. [Google Scholar] [CrossRef] [PubMed]
  34. Sullivan, G.M.; Artino, A.R., Jr. Analyzing and Interpreting Data From Likert-Type Scales. J. Grad. Med. Educ. 2013, 5, 541–542. [Google Scholar] [CrossRef] [PubMed] [Green Version]
  35. Venables, W.N.; Ripley, B.D. Modern Applied Statistics with S, 4th ed.; Springer: New York, NY, USA, 2002. [Google Scholar]
  36. Revelle, W. psych: Procedures for Psychological, Psychometric, and Personality Research; R Package Version 1.5.8; Northwestern University: Evanston, IL, USA, 2015. [Google Scholar]
  37. Lüdecke, D. sjPlot: Data Visualization for Statistics in Social Science; R Package Version 2.8.10; Zenodo: Meyrin, Switzerland, 2021. [Google Scholar]
  38. Karasmanaki, E. Understanding willingness to pay for renewable energy among citizens of the European Union during the period 2010–2020. In Low Carbon Energy Technologies in Sustainable Energy Systems; Kyriakopous, G.L., Ed.; Elsevier: Amsterdam, The Netherlands, 2021; pp. 141–161. [Google Scholar] [CrossRef]
  39. Energy Regulatory Commission. ERC Approves a Lower Feed in Tariff Allowance. 2020. Available online: http://www.erc.gov.ph/ContentPage/62245 (accessed on 7 April 2022).
  40. Energy Regulatory Commission. ERC Approves a Lower Feed-in Tariff Allowance. 2019. Available online: https://www.erc.gov.ph/ContentPage/61912#collapse2019 (accessed on 7 April 2022).
  41. Energy Regulatory Commission. ERC Suspends FIT-All Collection to Lower Electricity Rates. 2020. Available online: https://www.erc.gov.ph/ContentPage/61946 (accessed on 11 April 2022).
  42. Meralco. Summary Schedule of Rates Effective July 2020 Billing. 2020. Available online: https://meralcomain.s3.ap-southeast-1.amazonaws.com/2020-07/07-2020_rate_schedule.pdf (accessed on 11 April 2022).
  43. Fullerton, A.S.; Xu, J. Ordered Regression Models; Taylor & Francis Group: Abingdon, UK, 2016. [Google Scholar]
Figure 1. Renewable energy in the Philippines, 2003∼2020. (a) RE as a percentage of grid output, and contributions made to total RE output from different sources. (b) Growth of grid output over the base year (2003). Source: Department of Energy, Philippine Power Statistics 2020.
Sustainability 14 09906 g001
Figure 2. The four regions covered in the survey and the three power grids of the Philippines. Compiled with data from https://diva-gis.org/, accessed on 12 March 2022.
Sustainability 14 09906 g002
Figure 3. Participants support for increased investment in renewable energies. (a) Participants support for different renewable energies and fossil fuels; (b) willingness to install (WTI) renewable energy; (c) willingness to pay (WTP). In (c), the vertical red line indicates the mean, the blue line indicates the median, and the black dashed line indicates the approximate FiT rate (0.01%) for the time of the survey.
Sustainability 14 09906 g003
Figure 4. (a) Knowledge of different energy types amongst participants; (b) responses to the statement ‘Energy prices in the Philippines are similar to those of other South East Asian countries’. (a) includes an ‘adjusted knowledge’ variable, that combines claimed knowledge and takes account of responses to the factual statement posed in (b).
Sustainability 14 09906 g004
Figure 5. Participants’ perception of the climate crisis. (a) looks to the general perception of the crisis; (b) is to whether the economy or environment should be given priority in decision making; (c) gives the degree to which different actors are responsible for addressing the crisis.
Sustainability 14 09906 g005
Figure 6. How much different actors should contribute to RE investment (n = 400).
Sustainability 14 09906 g006
Table 1. Demographic details of the survey participants (n = 400).
VariableDistributionN%
Genderfemale24060.0
male16040.0
Location 1rural16842.0
urban23258.0
Age Group18–2412431.0
25–3413834.5
35–449724.2
45–54276.8
55 and over143.5
Marital statusmarried/cohabit13934.8
single/other26165.2
Childrennone22155.2
present17944.8
Educationhigh school13634.0
college7719.2
university16842.0
post-graduate194.8
Employmentemployed13734.2
homemaker4110.2
student7719.2
self-employed5914.8
unemployed4210.5
other4411.0
Income (PHP)under 150,000 (Lower 1)17644.0
150,000∼299,999 (Lower 2)6516.3
300,000∼449,999 (Middle 1)358.8
500,000∼749,999 (Middle 2),246.0
750,000∼1,249,999 (Upper 1)133.3
1,250,000∼1,999,999 (Upper 2)51.3
2,000,000 and over (Upper 3)71.75
unreported7518.8
1 An equal number of participants were recruited from each of the regions covered in the survey.
Table 2. Other variables featured in the statistical analysis.
VariablesResponses
5-Point Likert Questions
somewhat agree (%)agree (%)
More cooperation necessary between local and central governments to improve RE effectiveness32.7549.0
RE should be subsidised39.2536.75
Fossil fuels are reliable compared to RE41.2521.25
Good/Bad Arguments against RE
good argument (%)
RE unable to supply energy needs of the country56.5
RE construction and installation is too expensive46.25
Electricity produced by RE is expensive35.0
Note: Only noteworthy responses are given for concision.
Table 3. Regression analysis of support for overall expansion of RE (n = 400).
VariableLog-OddsSECI
gender0.65 **0.230.20–1.11
education0.27 *0.120.04–0.49
more cooperation necessary0.54 ***0.120.31–0.77
RE should be subsidised0.51 ***0.120.28–0.75
companies are responsible0.51 ***0.130.26–0.75
fossil fuels are reliable0.50 ***0.110.29–0.72
RE is expensive0.51 **0.180.15–0.87
knowledge0.43 ***0.110.20–0.65
installation expensive0.22 *0.100.04–0.49
Intercepts
disagree|somewhat disagree7.89 ***0.987.44–8.35
somewhat disagree|unsure9.14 ***1.008.91–9.36
unsure|somewhat agree9.71 ***1.019.51–9.91
somewhat agree|agree12.14 ***1.0911.92–12.35
χ 2 (H)157.16 ***
McFadden R 2 0.228
log-Likelihood−343.69
Note: * p < 0.05, ** p < 0.01, *** p < 0.001, CI: 95%: confidence interval.
Table 4. Regression analysis of willingness to install (WTI) (n = 400).
VariableLog-OddsSECI
income0.27 ***0.080.11–0.43
more cooperation necessary0.63 ***0.120.40–0.87
fossil fuel producers are responsible0.47 ***0.110.26–0.69
RE should be subsidised0.36 **0.110.13–0.58
knowledge0.35 **0.110.14–0.56
RE unable to supply energy needs0.35 *0.160.03–0.68
fossil fuels are reliable0.33 ***0.100.13–0.53
tax large electricity providers0.30 **0.110.08–0.52
Intercepts
disagree|somewhat disagree5.03 ***0.725.90–6.30
somewhat disagree|unsure6.10 ***0.746.79–7.10
unsure|somewhat agree6.94 ***0.766.79–7.10
somewhat agree|agree8.72 ***0.818.50–8.94
χ 2 (H)140.49 ***
McFadden R 2 0.172
log-Likelihood−401.99
Note: * p < 0.05, ** p < 0.01, *** p < 0.001, CI: 95%: confidence interval.
Publisher’s Note: MDPI stays neutral with regard to jurisdictional claims in published maps and institutional affiliations.

