Article

Quantitative Analysis of the Impact of Ecological Industry and Ecological Investment on the Economy: A Case Study of Beijing, China

1
State Key Laboratory of Simulation and Regulation of Water Cycle in River Basin, China Institute of Water Resources and Hydropower Research, Beijing 100038, China
2
College of Water Resources, North China University of Water Resources and Electric Power, Zhengzhou 450046, China
*
Author to whom correspondence should be addressed.
Sustainability 2022, 14(16), 9889; https://doi.org/10.3390/su14169889
Submission received: 14 July 2022 / Revised: 1 August 2022 / Accepted: 8 August 2022 / Published: 10 August 2022
(This article belongs to the Section Economic and Business Aspects of Sustainability)

Abstract

:
As China attaches increasing importance to its ecological environment, ecology-related industries have become essential to China’s national economy. However, in the current national economic accounting practice, the ecological industry (eco-industry) is not independent, and the ecological service value ecology creates is currently not within the scope of national economic accounting. To clarify the impact of the development of the eco-industry on the whole regional economy, this paper takes Beijing as the study area. For the first time, the input–output analysis method is adopted to differentiate the eco-industry as an independent sector. Moreover, the ecosystem services value is integrated into the eco-industry, and each coefficient is quantitatively analyzed from an industrial-chain perspective. The results show that the eco-industry exerts a good pulling effect on the regional economy. The inputs and outputs of the eco-industry clearly tend to focus on eco-environmental and public-service-related industries, followed by industries for which ecological development can create value. Judging from the entire regional economy, ecological investment significantly impacts both the education and financial industries. Ecological investment can promote socio-economic development, achieving a 1.318 increase in regional GDP per unit of eco-investment. The results imply that the development of the eco-industry in China should be boosted further and social capital investment should be attracted. Finally, this paper provides a scientific basis for policymakers to better understand the overall situation of both the eco-industry and industry linkages and guide them to develop relevant ecological investment strategies.

1. Introduction

In recent decades, China’s rapid economic growth has seriously damaged its ecological environment [1,2]. Environmental pollution and ecological damage resulted in a loss of about 4% of China’s gross domestic product (GDP) in 2015 [3]. To solve the severe eco-environmental problems China currently faces, the Chinese government has proposed a major strategy for ecological civilization and incorporated “green development” into the national 14th Five-Year Plan. Since this incorporation, China has made significant achievements in ecological management and restoration. The scale of ecological investment has continuously expanded (see Figure 1). In 2018, 509.158 billion yuan were invested in ecological protection and construction in China (including investment in forestry and grass ecology, ecological construction and protection of water resources, construction of ecological parks, and investment in urban greening and garden construction). The number of national ecotourism visits reached 3.665 billion, and tourism revenue reached 1.30 trillion yuan, directly driving other industries by its output value of 1.07 trillion yuan. Ecotourism employed 170,134 people, with an average salary of 73,626 yuan [4]. As the scale of China’s eco-environmental protection construction continues to expand, the areas relevant for natural ecology (such as forests, waters, and grasslands) are steadily expanding. Moreover, the size of urban ecologies such as parks and urban greenery is gradually growing. At the same time, natural and urban ecosystems and their related ecological processes constantly provide ecological products and services. These form and maintain environmental conditions and materials that sustain humans, other animals, and plants [5]. Ecosystems provide benefits and create value for residents’ lives and business production both directly and indirectly, thus creating a virtuous cycle for urban sustainable development. In addition, as China’s economic growth has slowed under the impact of the COVID-19 pandemic, increasing investment in infrastructure has become a means for the government to stimulate economic growth. According to the results of rational analysis, investment in eco-environmental construction is not only a good choice for improving the ecological environment and responding to national ecological development requirements; it also drives the development of various industries and promotes the socio-economy [6,7]. The Chinese government has been concerned about the development of its ecological industry (eco-industry) and the impact of eco-investment both on various industries and the national economy. The need to understand the current status of the eco-industry in China has become urgent. The role and function of the eco-industry as part of economic development must be assessed so that the government can adjust the industrial structure and develop appropriate management strategies.
Relevant studies have already constructed a green-economy analysis framework and applied it to analyze the impact of green industries and green development on the social economy [8,9,10]. For example, Yi et al. [11] measured the clean-energy economy of China at the city level by calculating green jobs and enterprises through analytical methods. The study showed that green jobs and enterprises are unevenly distributed across different regions of China. By creating a green-economy development index to measure the development level of the green economy, He et al. [12] constructed a threshold effect model. They used this model to study the non-linear relationship between renewable energy investment and the green-economy development index. Since the 1970s, economists have employed input–output analyses, using environmental data to explore the relationship between economic development and the environment. These explorations have resulted in the development of a series of input–output models that include environmental factors. Leontief et al. [13] proposed an environmental input–output model that includes generating and eliminating pollutants. Wu et al. [14] constructed a green input–output model that includes environmental factors such as natural resources, pollution, and environmental protection, which was used to analyze the sustainable development of China’s economy. Lei et al. [15] compiled a 2007 Chinese input–output table that integrated the energy economy environment. With this table, they explored the implied energy consumption and implied emissions in China based on the green input–output theory. Wang et al. [16] used a multiregional input–output model to calculate emissions driven by cross-regional drivers and trace emission flows along supply chains in China. Li et al. [17] established an extended provincial input–output model to calculate provincial production-based emissions, consumption-based emissions, and emissions transfers from 2005 to 2015. They used this model to examine whether mitigation policies can promote emissions reduction in China. Fan et al. [18] separated the environmental industry from the traditional input–output table and defined it as a separate industrial sector. They analyzed and calculated the development of the environmental industry and the impact of environmental investments on different sectors of society.
Input–output models have been widely adopted in the fields of energy [19,20,21,22] and resources [23,24,25]. Gao et al. [26] extended the traditional input–output table and built an account that contains resources, the environment, and nature to analyze the impact of economic policies on resources and the environment. Deng et al. [27] proposed an extended input–output table of water resources, introduced water consumption of different industries into the input–output matrix, and obtained a more accurate water-consumption structure for China’s arid regions. Choi et al. [28] used carbon tax as an example to integrate short-term, policy-induced changes in consumer demand into an input–output framework. They used this framework to analyze the environmental and economic impacts of the policy, including direct and indirect effects on carbon emissions, material flows in the economy, and dependence on various ecosystem goods and services. Guo et al. [29] defined key sectors driving energy consumption and CO2 emissions in China in terms of input–output relationships and demand elasticities. Their research identified sectors that should receive more attention as the Chinese government develops appropriate energy conservation and emission-reduction policies. Lange [30] constructed an environmental economic model by combining the natural resource account with the dynamic input–output model of 30 industrial sectors. This model was then used to assess the ecological impact of Indonesia’s second long-term development plan. Liu et al. [31] developed a new assessment framework for the water–energy nexus based on an environmentally extended multiregional input–output model, incorporating the concepts of virtual water and embodied energy.
However, past research on green jobs and the green economy has generally focused on resources as well as environmental rather than ecological domains. It is challenging for natural capital—created by the construction and restoration of ecological investment in forests, rivers, lakes, and urban greening—to yield direct economic benefits. Socio-economic accounting does not include the value obtained by the service function of ecosystems. Moreover, the pulling effect of the eco-industry on other industrial sectors remains unclear. In existing national economic accounting approaches, the eco-industry does not appear as a separate sector in the input–output table. It is not easy to truly reflect the driving effect ecological investment imposes on economic growth. Therefore, to identify the impact the eco-industry and investments have on the social economy with the input–output model, an input–output table must be compiled that includes the eco-industry. This table can then be used to analyze the impact and contribution of both eco-industry and eco-investment on other industries. Based on the above presentation and taking Beijing as the study area, this paper presents the following three research achievements: (1) The input–output analysis method is adopted for the first time to differentiate the eco-industry as an independent sector. The method of proportional distribution and investment disassembly is adopted. (2) The ecosystem services value is integrated into the eco-industry by means of equivalent-factor-matching industry. The ecological service functions and each coefficient are quantitatively analyzed from an industrial-chain perspective. (3) The driving effect of eco-investment on various industries and the impact on regional economics are analyzed from an input–output perspective. In conclusion, this paper provides a scientific basis for policymakers to understand the overall state of the eco-industry and industry linkages and guide them toward developing relevant ecological investment strategies.

2. Materials and Methods

2.1. Definition of the Eco-Industry

Research on the definition of the environmental protection industry is relatively mature and mainly focuses on four products and services: environmental protection products, environmental protection services, resource-recycling products, and environmentally friendly products [32]. However, the contribution of eco-industry to economic systems and the industrial linkages between ecosystem services and sectoral economies are not included. The eco-industry is the industry of ecologically related socio-economic activities. It can be mainly divided into industries related to natural ecology and those related to urban ecology. Industries related to natural ecology mainly include the following: natural forest ecological protection (mainly including afforestation and forest quality improvement, wetland restoration and preservation, sand release and sand control, wildlife protection, and nature reserve construction and repair), forest park operation and maintenance, and water ecological restoration and management (including soil and water conservation and ecology, water-source protection, groundwater conservation, and water ecological-environment management). Urban ecology mainly includes urban greening and the construction and maintenance of urban gardens. Ecological services include the service functions of the ecosystems in the region, such as forests, grasslands, shrubs, aquatic ecosystems, and other ecosystems, for urban environmental purification, recreation, and entertainment.

2.2. Construction of the Eco-Industry Input–Output Model

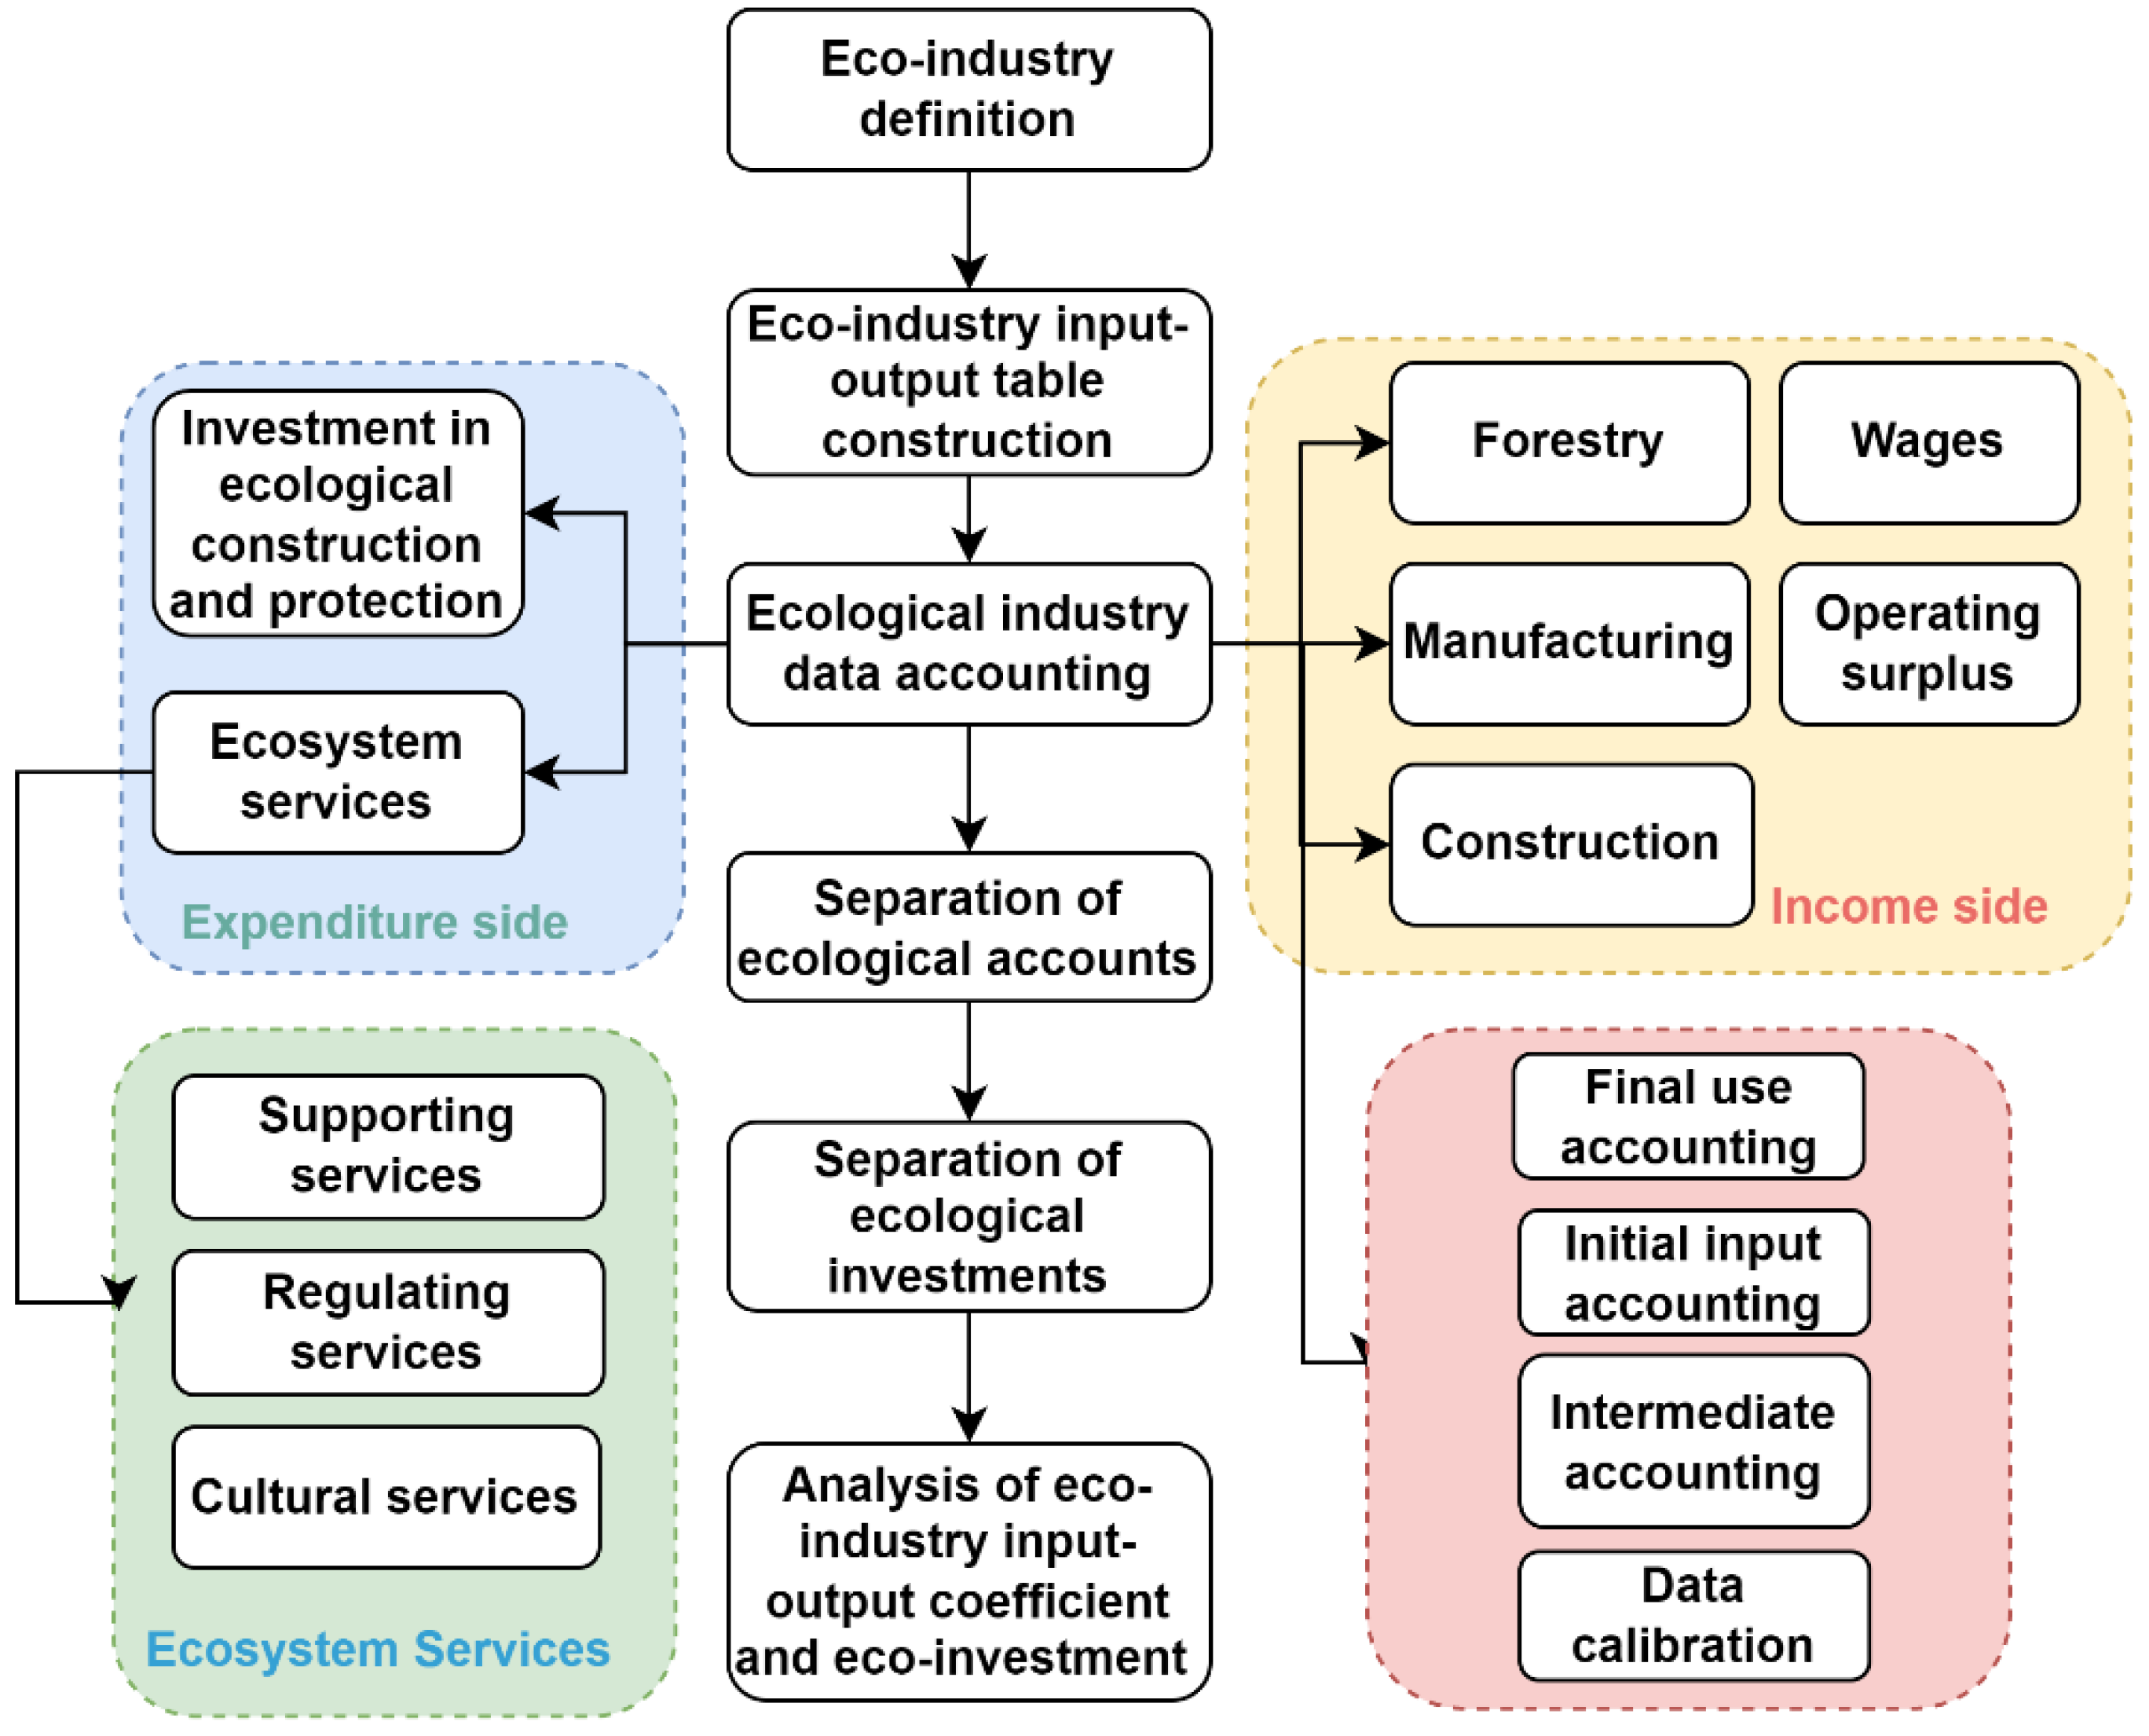
The input–output model is based on an input–output table, which describes the sources of inputs and where outputs are used in the production of each industry of the national or regional economy. This table represents the interdependent and inter-constrained quantitative relationships among industries. Figure 2 shows the process of constructing the input–output table of the eco-industry. First, to reflect ecological protection and construction activities, the part of the traditional sectoral output that is consumed by the eco-industry is separated. Thus, the intermediate input in the production process of industry n + 1 (eco-industry), i.e., the income of the industry, is formed. This component consists of the constituent elements of ecological and environmental infrastructure construction. Examples include the construction of urban parks (for which trees are required; thus, this value needs to be separated from the forestry industry), infrastructure construction (requiring the consumption of the construction industry), the purchase of specialized equipment (requiring the purchase of products from the manufacturing industry), and ecological and environmental monitoring equipment (requiring purchases from the science and technology industry).
Second, according to the calculated ecosystem services value and relevant studies in the existing literature [33,34,35], the ecological-service consumption of each industry is allocated. The row for industry n + 1 (the expenditure side) is obtained, reflecting the consumption of each sector to pay for ecological services. This reflects the purchasing costs of each industry for consuming the value of ecological services and the government’s operation and maintenance costs to maintain the ecosystem function. This part consists of a combination of government investments (direct consumption) and the value of ecosystem services (indirect consumption). Eco-industry consumption reflects the consumption of ecosystem services by external industries, mainly reflecting the benefits ecosystem services bring to production and lives, including the values of health care, real estate, and culture and entertainment. Because of the introduction of the value of ecosystem services, primary production factors will grow further under the virtuous cycle of the ecosystem. The proportion of salaries of eco-industry-related staff will increase, as will the profits of the eco-industry. In this paper, the Biproportional Scaling Method balancing method [36] is used to balance the final input–output table, and the non-parametric interpolation method [37] is used to add missing data. Ultimately, government and enterprises’ investments in ecology form natural capital [38,39], and this value is separated from fixed capital formation to form ecological investments. Table 1 shows the final input–output table of the eco-industry.

2.3. Study Area

For this paper, Beijing is chosen as study area. Beijing is the capital city of China and the largest city of northern China, with a total area of 16,410.54 km2. Beijing has an average multi-year precipitation of 627.4 mm. In 2020, the water area was 370.51 km2 [40], the forest area was 7182 km2, and urban greening coverage was 49%. Beijing’s GDP in 2021 was 4.03 trillion yuan, ranking second among mainland Chinese cities, with a GDP per capita of 183,980 yuan. Beijing’s GDP growth rate over 2012–2021 averaged 8.71%, which exceeds the Chinese average of 8.65%.
Beijing was once one of the most polluted cities in China, and has experienced unprecedented urbanization over the past decades, resulting in severe ecological damage [41]. In recent years, Beijing has vigorously promoted the construction of ecological civilization (the main focuses of which are the conservation of nature and sustainable development). With increasing investment in ecological-environment construction, the overall quality of the ecological environment of Beijing has gradually improved. The area of natural waters has increased by 96.63 km2 over the past 13 years, and various nature reserves have been developed, accounting for 22% of the Beijing city area. In 2021, Beijing’s annual average concentration value of fine particulate matter (PM2.5) was 33 µg·m−3, which shows a decrease by 13.2% from the 2020 level. The city’s surface water quality continues to improve, and the annual average concentration of significant pollution indicators continues to decrease. The investment in and construction for ecology by the Beijing government have achieved certain results in addition to enhancing the living standard and happiness of residents. In summary, Beijing presents an exemplary case as a research area for studying eco-industry and investment.
In this paper, the ecosystem services value provided by land ecosystems is used to estimate the ecological benefits of the land. The ecosystem services value assessment is based on the study of Chuai et al. [42]. At the core of this assessment method lies the determination of the value of a standard equivalent factor, which is the value provided by the natural ecological components of a particular land ecosystem per unit of area [34]. The value of an equivalent factor is proposed to be the economic value of natural food production per hectare of farmland per year. However, it is difficult to accurately evaluate the economic value of food production provided by farmland ecosystems under natural conditions (excluding anthropogenic disturbances). It has been suggested that natural food production is equivalent to ~1/7 of the actual food production [43]. This paper takes the average net profit of an arable land ecosystem (excluding the cost of human input) as the value of a standard equivalent factor. The calculation results show that Beijing’s total ecological service values in 2017 and 2020 were 18,869,519,100 yuan and 26,906,619,500 yuan, respectively, see Table 2.

2.4. Method and Data

2.4.1. Data Sources

The extended input–output table constructed in this paper is mainly based on the following sources: 2017 China National Input-Output Table, 2017 Beijing National Input-Output Table, 2021 China Environmental Protection Industry Development Status Report, 2017 China Ecological Environment Statistical Annual Report, 2017 China Ecological Environment Bulletin, 2017–2021 China Fixed Asset Investment Statistical Yearbooks, 2018 China Forestry Statistical Yearbook, 2018 China Labor Statistical Yearbook, 2017–2021 China Environmental Statistical Yearbooks, 2018 China Economic Census Yearbook, 2017–2021 China Statistical Yearbooks, 2017 Beijing Water Resources Bulletin, and 2017 Beijing Water Statistical Yearbook.
In this paper, the latest input–output table of 42 industries in Beijing is condensed into 20 industries, according to the industry classification of the national economy, as shown in Table 3.

2.4.2. Accounting of Total Output

The ecosystem produces ecological services that are jointly consumed by residents, businesses, and the government, thus forming natural capital. The value of the raw-material supply services of the ecosystem is already reflected in existing input–output tables. The total value of the output of the eco-industry consists of four main components: consumption by enterprises (intermediate), consumption by residents, consumption by the government, and fixed capital formation. There are no statistical data on inventory increase in capital formation, and the values of inventory increase, import, and others are 0. Thus, the following equation expresses the total output of the eco-industry:
X n + 1 = I n + 1 + E S V   -   E S V S
where Xn+1 is the total output of the eco-industry, In+1 is the investment of the eco-industry, ESV is the whole ecosystem services value, and ESVS is the ecosystem supply service value.

2.4.3. Accounting of Final Use

First, the investments in ecology-related industries are summarized by the regional industry category, totaling 43,687,000,000 yuan. These investments form natural capital and, based on data from the 2018 China Fixed Asset Investment Yearbook, they are separated from fixed capital. Government consumption in the eco-industry reflects the government’s expenditure to provide ecological public services to society. Investment in ecology can be considered as the government’s continuous consumption of ecosystems to maintain ecosystem sustainability and service functions. In this paper, government consumption is accounted for in the four areas of the eco-industry survey (ecological protection industry, forestry ecological protection, urban greening, and ecological water protection). Enterprises and residents jointly consume the ecosystem services value. Several studies reveal that private entities and households derive similar benefits from ecological services [44,45]. Assuming a consumption ratio of residents to enterprises of 1:1, the consumption value of both is 789,932,000 yuan.

2.4.4. Value-Added Accounting

Labor remuneration in the eco-industry is estimated from the number of employees and their average wages in the water resources, environment, and public facilities management industry. Data are obtained from the labor force statistical yearbook and from the added value in the water resources, environment, and public facilities management industry in the tertiary industry statistical yearbook. The coefficients of fixed capital depreciation, operating surplus, and net production tax coefficients are assigned based on the added value of ecological and environmental industries’ proportional coefficients in the national 149 sectoral input–output tables.

2.4.5. Intermediate Use Accounting

In separating the intermediate output of the ecological industry, the output of the non-ecological industry is divided into two parts. One is the consumption of non-ecological industry products by the non-ecological industry, and the other is the consumption of services of the non-ecological industry to the ecological industry, as shown in Figure 3. As mentioned above, the total intermediate output of the ecological industry is 789,932,000 yuan. The distribution of intermediate output refers to the intermediate input distribution coefficient of the ecological protection industry in the input–output table of 149 sectors in China in 2017. Moreover, ecological-service consumption of certain industries is revised according to the matching of ecological service type and industry, with reference to the research results of Zhang [33], Xie et al. [34], and Zhao et al. [35].

2.4.6. Data Calibration

The final input–output table was calibrated as follows:
(1)
Input–output balance calibration:
X i = X j
where Xi and Xj are total outputs of i and j, respectively.
(2)
Eco-industry account balance:
j = 1 n x n + 1 j + Y j + E c I n + 1 = X n + 1
where Xn+1 is the total eco-industry output, which is consistent with the calculation result of Equation (1).

2.5. Eco-Industry Input–Output and Investment Pull Models

2.5.1. The Backward and Forward Linkage of the Eco-Industry

The backward linkage of an industry reflects the ability of a change in final products from the industry to influence the change in the total output of the national or regional economy. This reflects the ability of an industry to promote the development of the regional economy, which is expressed by the effect coefficient. An effect coefficient greater than 1 indicates that the ability of the industrial sector to boost the regional economy is greater than the average level and therefore plays a more significant role in promoting the development of the regional economy. In contrast, a coefficient less than 1 indicates that the ability of the industrial sector to stimulate the regional economy is lower than the average level and therefore plays a relatively minor role in promoting economic development.
δ n + 1 = i = 1 n + 1 b i n + 1 1 n + 1 j = 1 n + 1 i = 1 n + 1 b i j ,   ω n + 1 = j = 1 n + 1 b n + 1 j 1 n + 1 i = 1 n + 1 j = 1 n + 1 b i j
where δ n + 1 is the effect coefficient of the eco-industry, ω n + 1 is the induction coefficient of the eco-industry, and bij is the Leontief inverse matrix.
Industry forward linkage reflects an industry’s degree of demand induction when each industry in the regional economy is increased by one unit of final use. This induction ability expresses the pulling power of the industry by regional economy development, represented by the induction coefficient. A coefficient greater than 1 indicates that the regional economy strongly pulls the industrial sector. In contrast, a coefficient less than 1 indicates that the regional economy pulls the industrial sector relatively weakly.

2.5.2. Eco-Industry Input–Output Analysis

First, in this study, the direct eco-industry consumption coefficient (i.e., the value of eco-services directly consumed by the jth industrial sector to produce one unit of product or service) is used to reflect the demand for eco-industry by each industrial sector. This vector, which is denoted as Mj, is calculated by Equation (5):
M j = X n + 1 j X j , j = 1 , 2 n
Second, the eco-industry complete-consumption coefficient (i.e., the total value of direct and indirect eco-services consumed to achieve a one-unit increase in the jth industrial sector) is used to reflect the demand for eco-services consumed by the production or service expansion within each industrial sector. Complete consumption of the eco-industry includes both direct and indirect consumption. Indirect consumption refers to the input of ecological services for producing goods and services in other industries. The calculation of the eco-industry whole coefficient is based on the following:
B M = M ( I A ) 1
where BM is the row vector of the complete consumption of the eco-industry (bmj); thus, Equation (6) represents the degree of demand for ecological services in an industrial sector. I is the unit matrix, and A is the matrix of direct-consumption coefficients.
The eco-industry consumption multiplier is the ratio of the eco-industry full-consumption coefficient of the jth sector to the eco-industry direct-consumption coefficient. This multiplier reflects the demand for eco-services in the national or regional economy as a whole, which is stimulated by changes in the production of units of final goods or services in the jth industrial sector. The demand for ecological services is triggered by changes in the production of units of final goods or services in the industrial sector. The multiplier is calculated as:
e j = b m j m j , j = 1 , 2 n
In this study, the output model is developed from a value-added perspective. In the output model, the value-added coefficient of direct consumption of the eco-industry (i.e., the creation of new added value per unit of eco-services directly consumed by the jth industrial sector) reflects the ability of the eco-industry to create economic benefits. The coefficients are calculated according to Equation (8):
λ j = X n + 1 j V j , j = 1 , 2 n
The value-added coefficient of the complete consumption of the eco-industry represents the ecological services the jth industrial sector requires to add value to the whole economic system. This includes the value both directly and indirectly added by the industrial sector, as well as the value added by other industrial sectors. The calculation formula is:
σ j = λ j ( I A ) 1 , j = 1 , 2 , n
The value-added multiplier of eco-industrial consumption (i.e., the increase in added value of the whole economic system that results from the increase in added value per unit in the jth industrial sector through eco-services consumption) reflects the impact of the change in added value resulting from the increase in eco-services consumption of industrial sector j on total added value. The multiplier is the ratio of the coefficient of complete added value of the eco-industry to the coefficient of direct added value of the eco-industry, calculated as:
p j = λ j σ j , j = 1 , 2 n

2.5.3. Eco-Investment Pull Model

Based on the value balance relationship between the final product and the total product in the input–output table, the model of the pull effect of ecological investment on various industrial sectors of society is constructed. The equilibrium relationship is established using the row vectors of the input–output table. The expression is as follows:
( I A ) X = E c I   o r   X = ( I A ) 1 E c I
Equation (11) is called the demand-pull model and allows for the quantitative study of the impact changes in ecological investment ΔEcI have on the total output of each industry ΔX. The demand-pull model forms the core principle underlying the analysis of the effects of ecological investment on the development of each industry using the input–output model [46,47]. Both direct and indirect increases in output create additional income. These increases also trigger the population’s consumption, and this increased consumption will increase final demand, thus generating new output. This effect is called induced impact, which considers the re-pull after consumption and employment. To study the actual effect of ecological investment, the direct remuneration matrix A is extended by including labor compensation in the input–output table as a new row and the consumption by residents as a new column [48]. The extended direct-consumption coefficient matrix is A*= [ A H e H r 0 ] .
Then, there are:
Δ X n = ( I A * ) 1 Δ E c I n ,   Δ G D P n = A v ( I A * ) 1 Δ E c I n
where Av is the diagonal matrix of value-added coefficients.
Finally, the coefficient of the contribution of eco-investment to GDP and total output CX, Cgdp, is introduced:
C X = Δ E X Δ E c I ,   C g d p = Δ E G D P Δ E c I
where Δ E X is the change in total social output because of eco-investment, Δ E G D P is the change in social GDP because of eco-investment, and Δ E c I is the change in eco-investment.

3. Results

3.1. Analysis of the Backward and Forward Linkages of the Eco-Industry

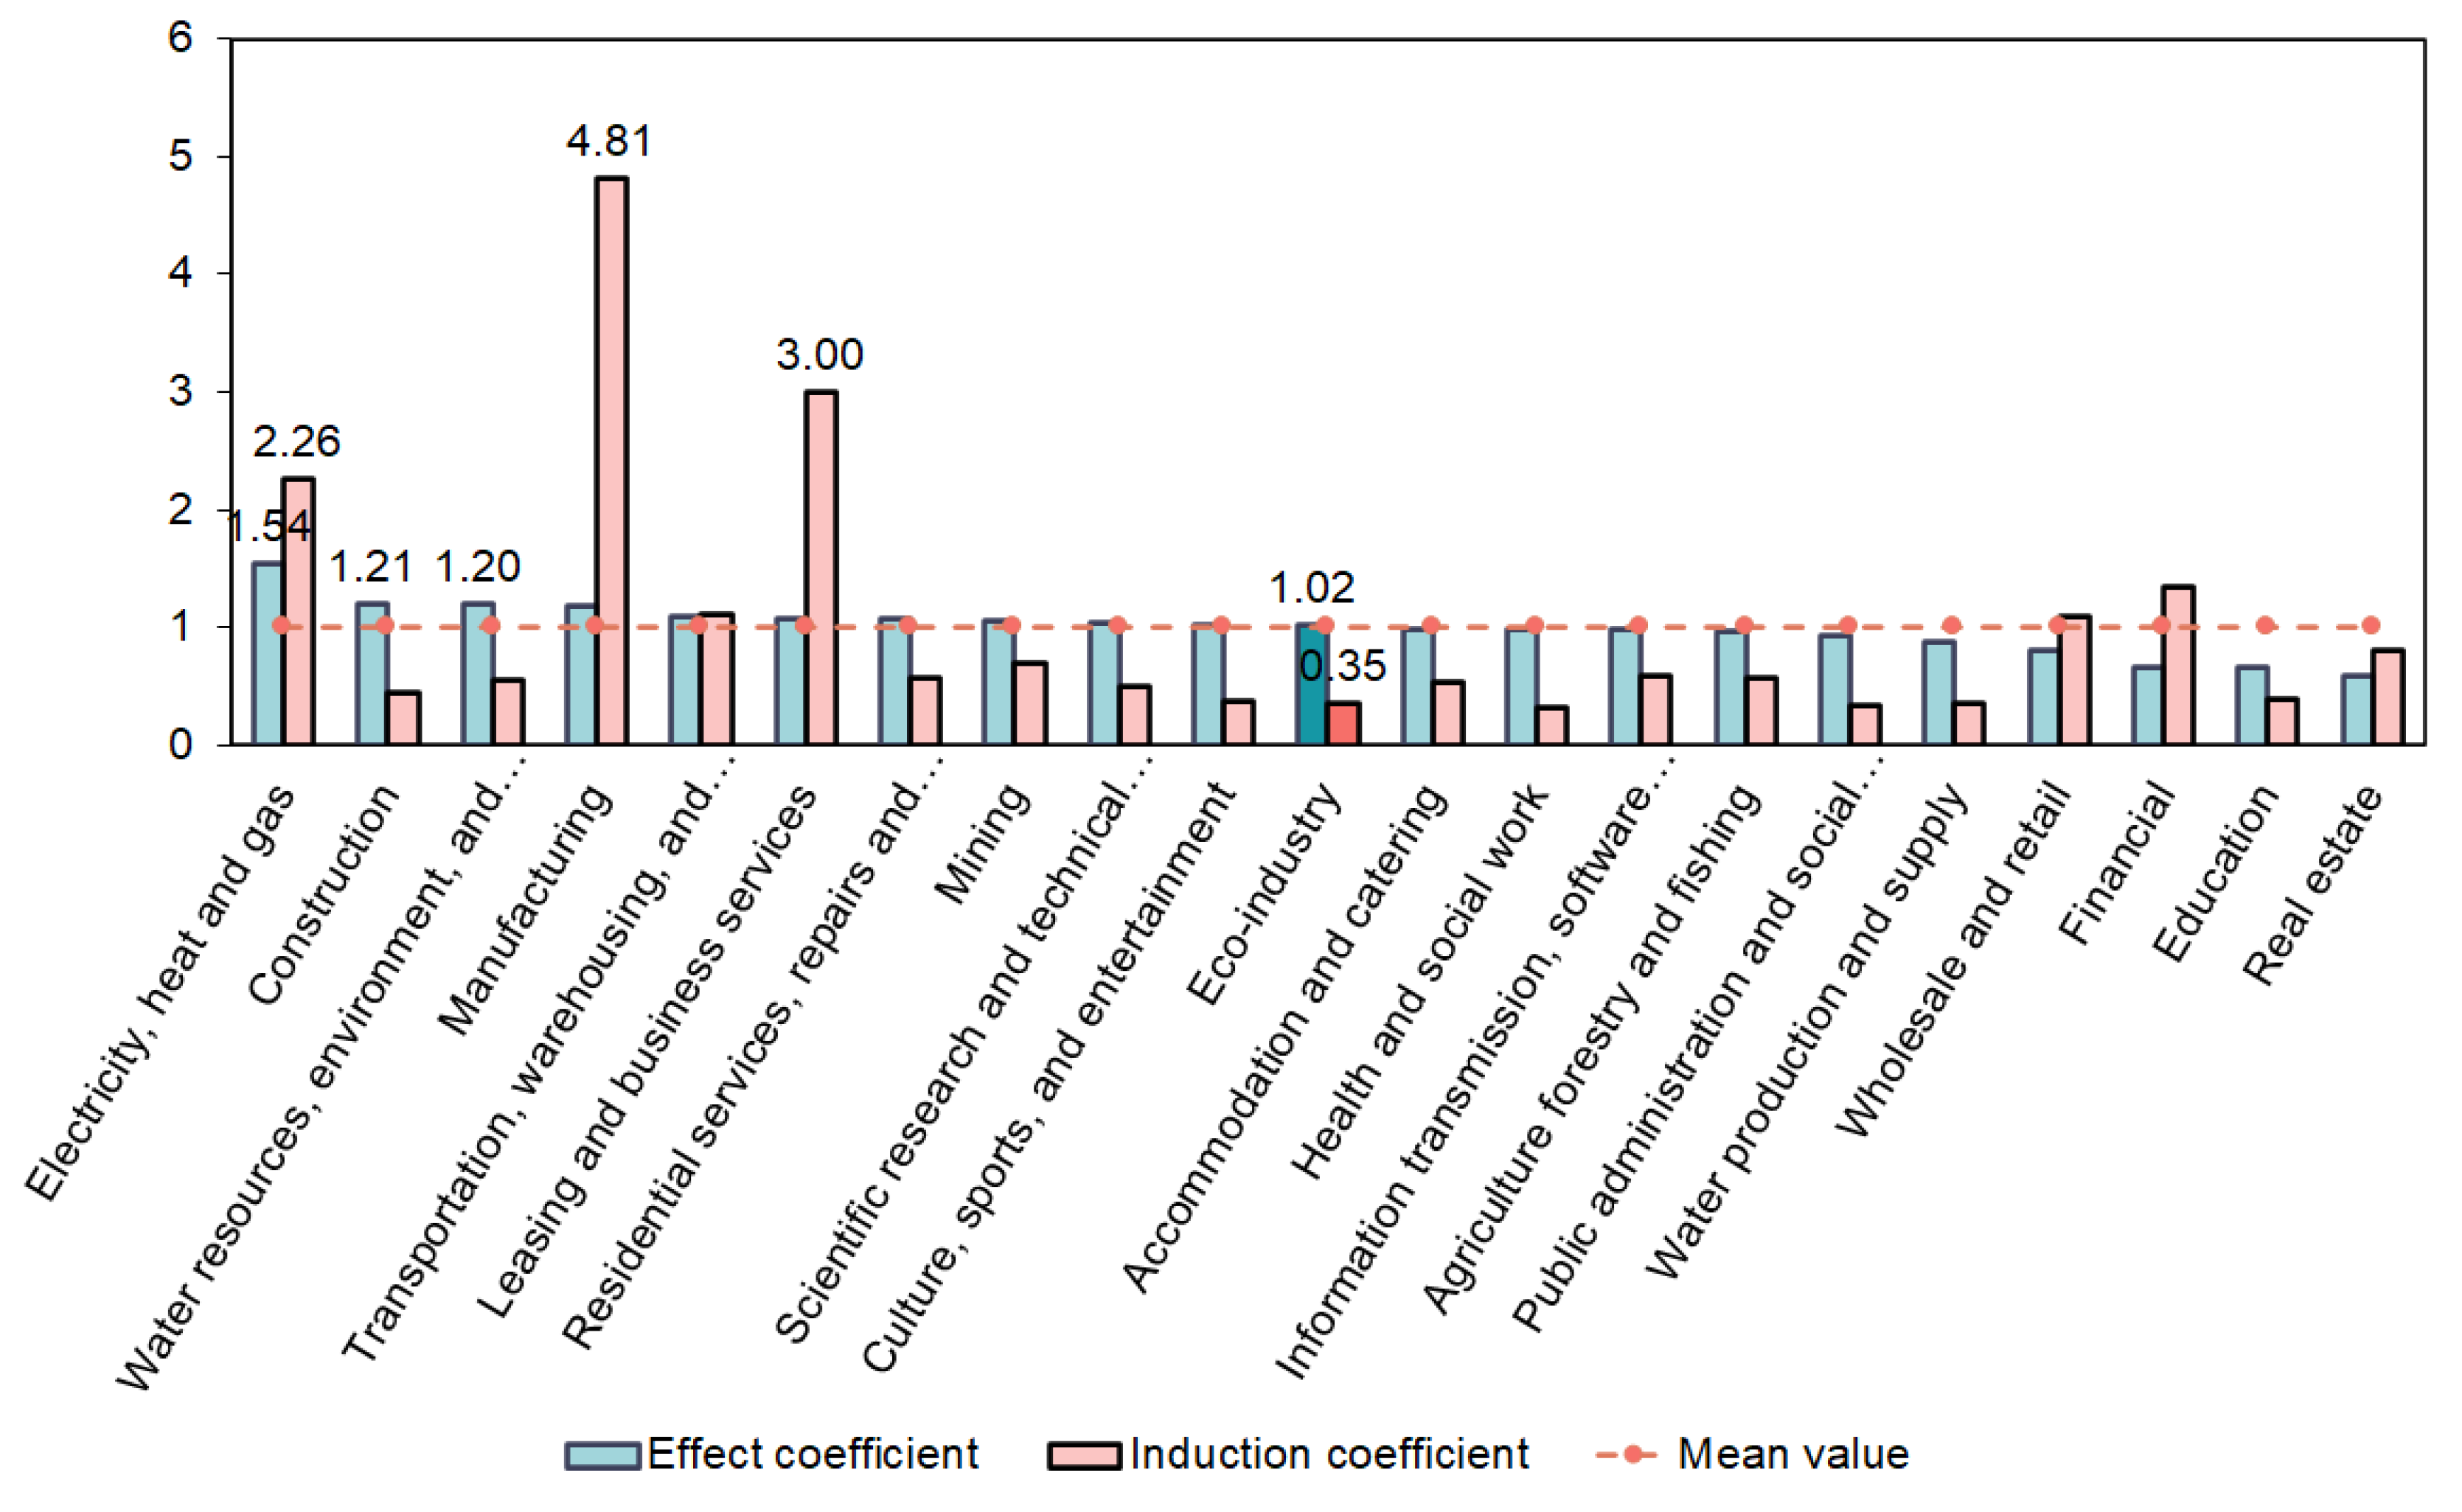
The results of the calculation shown in Figure 4 include 11 industries with effect coefficients between 1 and 6 and induction coefficients greater than 1. The electricity, heat, and gas industry (1.54), construction industry (1.21), and water resources, environment, and public facilities management industry (1.20) are the three industries with the highest effect coefficients. This indicates that these industries exert a solid driving effect on the regional economy. In addition, the manufacturing industry (4.81), leasing and business services industry (3.00), and electricity, heat, and gas industry (2.26) are the three industries with the highest induction coefficients. This indicates that the growth of the regional economy strongly drives these industries. In contrast, industries with effect and induction coefficients less than 1 are primarily tertiary industries such as the real estate industry and the education industry. These industries belong to the backward sector of the whole industrial chain, with a relatively high share of final consumption. Therefore, the pulling effect these industries impose on the regional economy and the driving impact the regional economy imposes on them are less pronounced. The effect coefficient of eco-industry ranks in the middle among all industrial sectors and exceeds the induction coefficient. This indicates that the driving effect the eco-industry has on the regional economy is better than its pulling effect after being subjected to the development of the regional economy. This result is consistent with the results of similar studies [22,49]. In 2017, the effect coefficient of the eco-industry was 1.02, which means that the effect was greater than the average of all industries. This indicates that the development of the eco-industry has the remarkable ability to promote the development of the regional economy. The induction coefficient of the eco-industry was 0.35 in 2017, and the induction coefficient of the eco-industry is lower than the average of all industries, indicating that the pulling effect of national economic growth on eco-industry is weak. Further, in this paper, the impact of the eco-industry is analyzed from ecological services inputs and value-added promotion of eco-industries in each industry.

3.2. Input–Output Analysis of the Eco-Industry

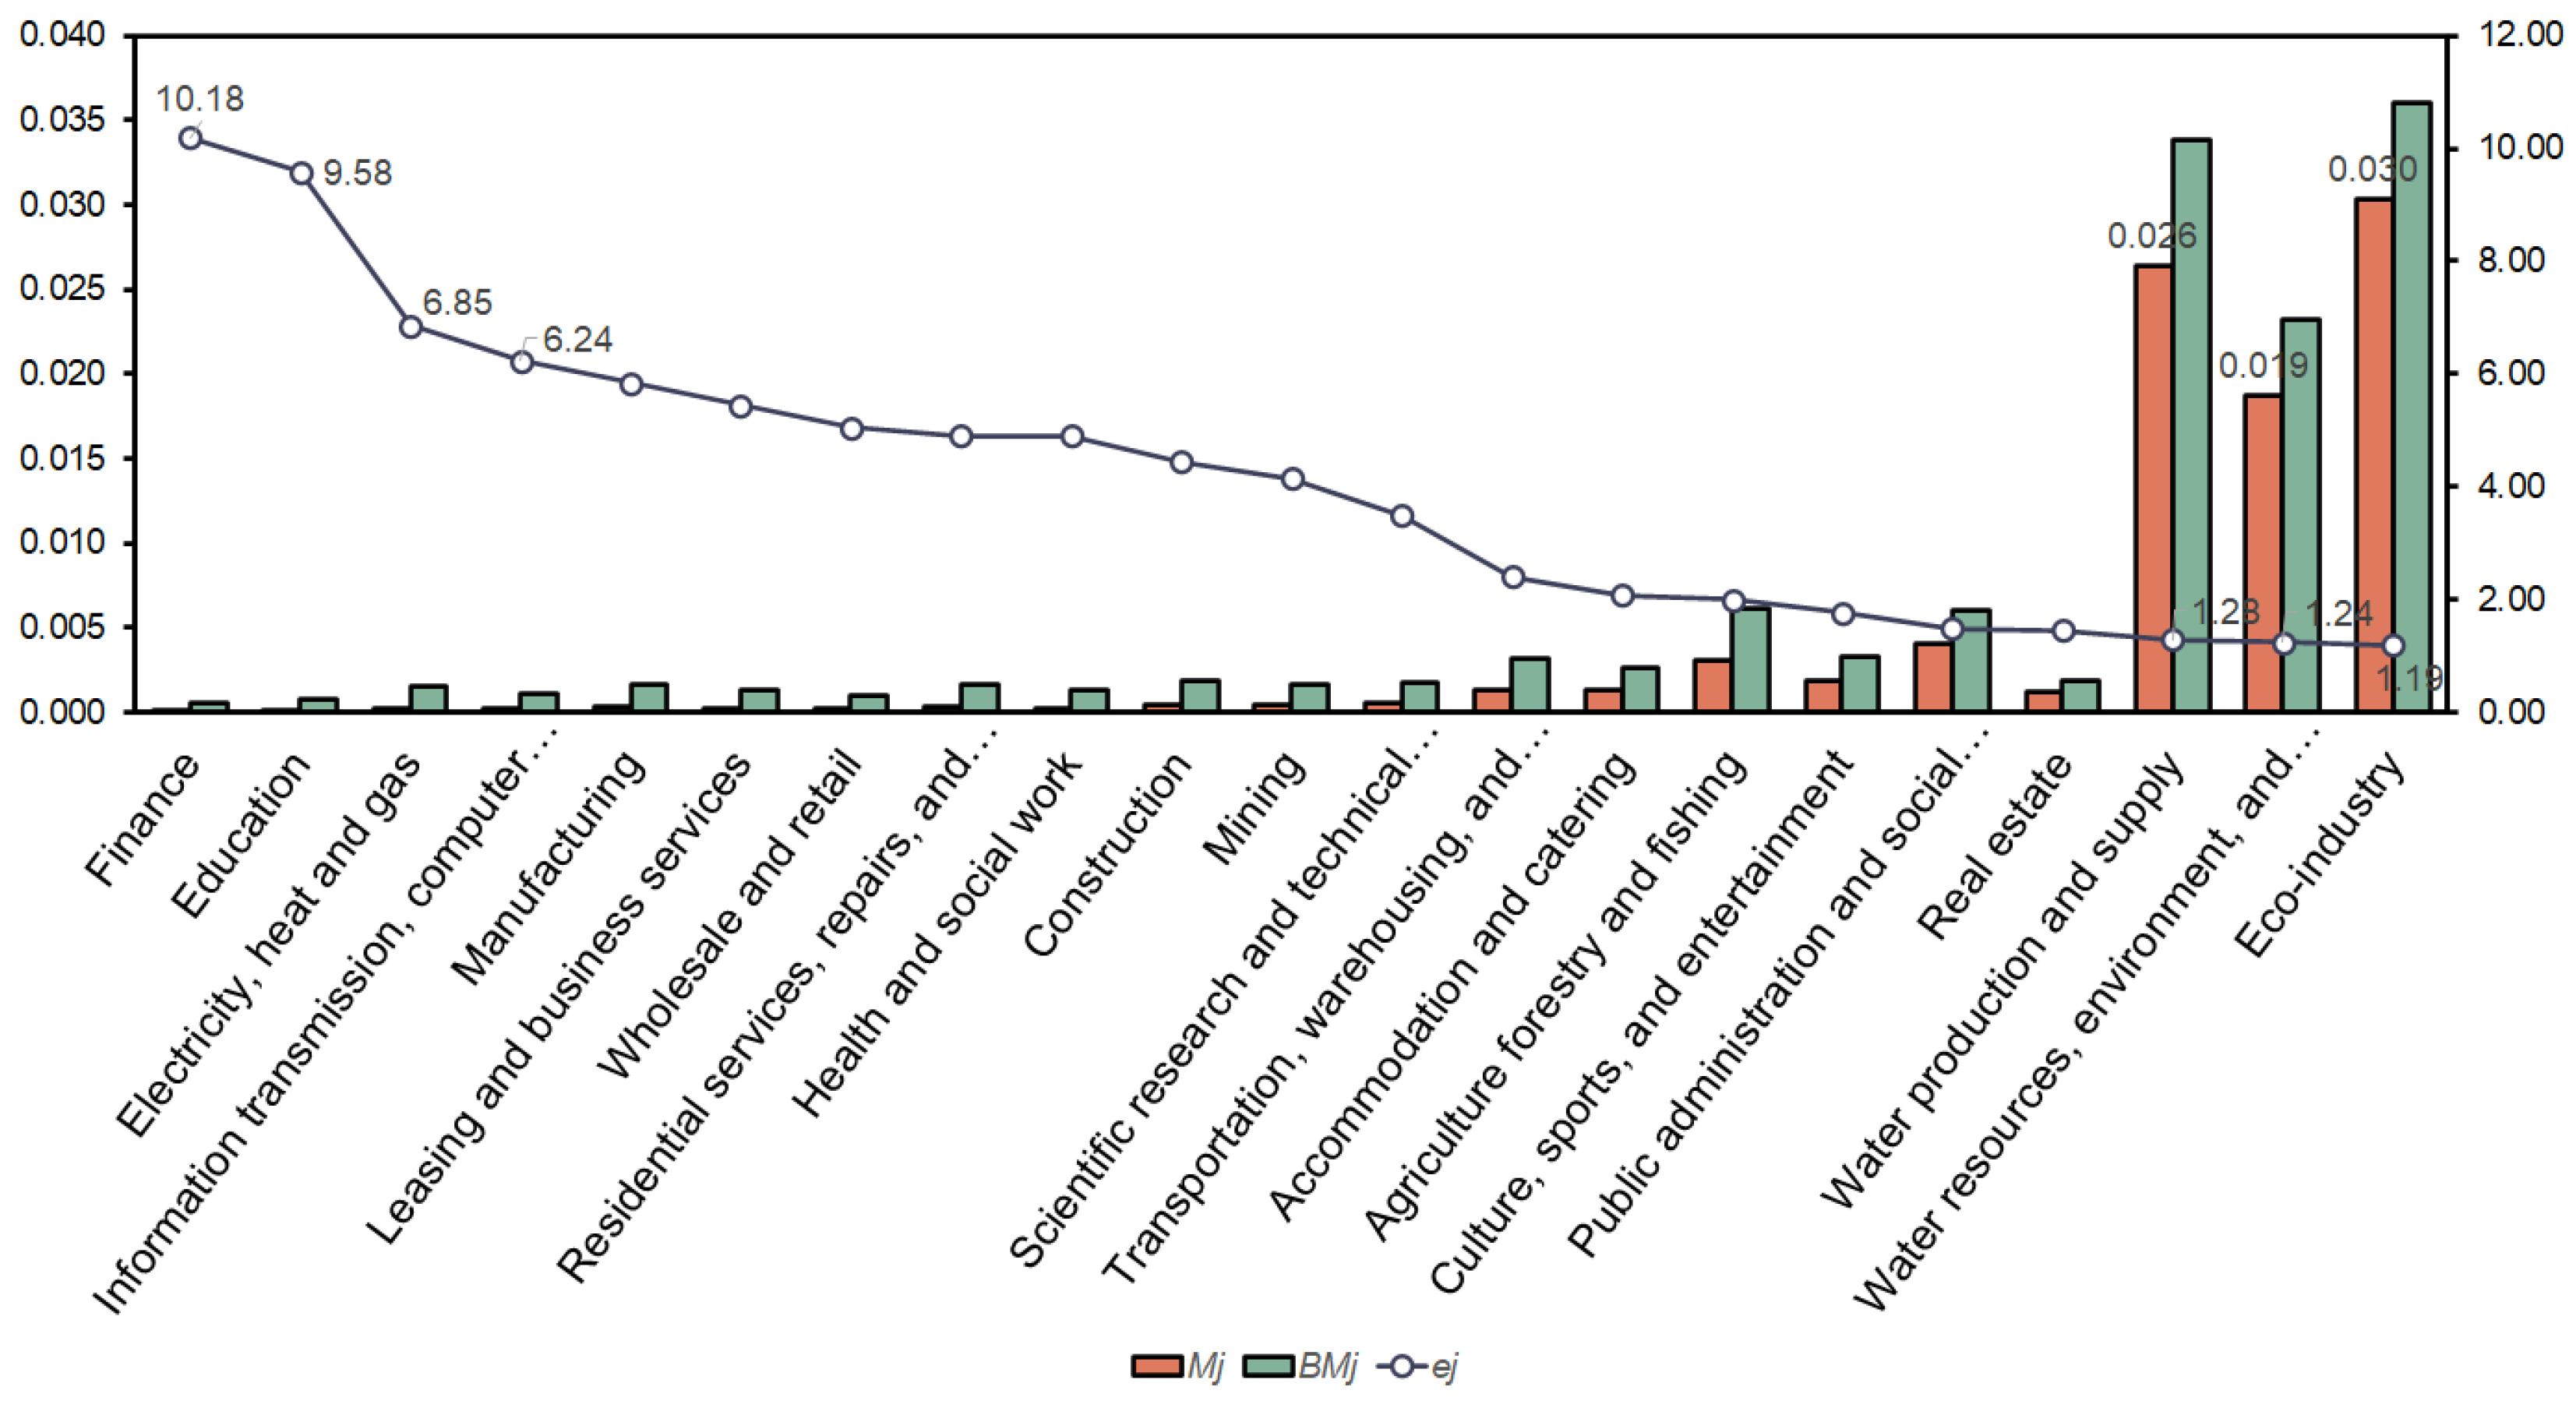
The results show that the direct-consumption coefficient (Mj) of the eco-industry varies by industrial sector (Figure 5). The public administration and social organization industry, water resources, environment, and public facilities management industry, eco-industry, and water production and supply industry all have a high share of inputs of ecological services. All other industrial sectors have relatively low inputs of ecological services, indicating a strong tendency for direct consumption by the eco-industry. The eco-industry has the largest direct-consumption coefficient for eco-industry (0.030) and the second-largest coefficient for the water production and supply industry (0.026), followed by the water resources, environment, and public facilities management industry (0.019). In addition, at 0.31% of the total input value for ecological services, the primary industry ranked fifth. In contrast, the finance, education, electricity, and gas industries have less direct ecological services inputs. The complete-consumption coefficient (BMj) trend of the eco-industry is similar to that of Mj. Industrial sectors with higher complete-consumption coefficients for eco-industry are the same as those with higher direct-consumption coefficients (Figure 5). Industrial sectors with lower complete-consumption coefficients for the eco-industry originate from the finance, education, electricity, gas, and information transmission, computer services, and software industries. In this paper, the consumption multiplier (ej) of the eco-industry is obtained by comparing the direct and complete-consumption coefficients of the eco-industry. The consumption multiplier of the eco-industry exceeds 1 for all industrial sectors, especially for finance (10.18), education (9.58), electricity, heat, and gas (6.85), and information transmission, computer services, and software (6.24). While these industries consume only a small share of ecological services directly, their indirect consumption is high. The consumption multipliers of the eco-industry in the water resources, environment, and public facilities management industry (1.24), eco-industry (1.19), and water production and supply industry (1.28) are small.
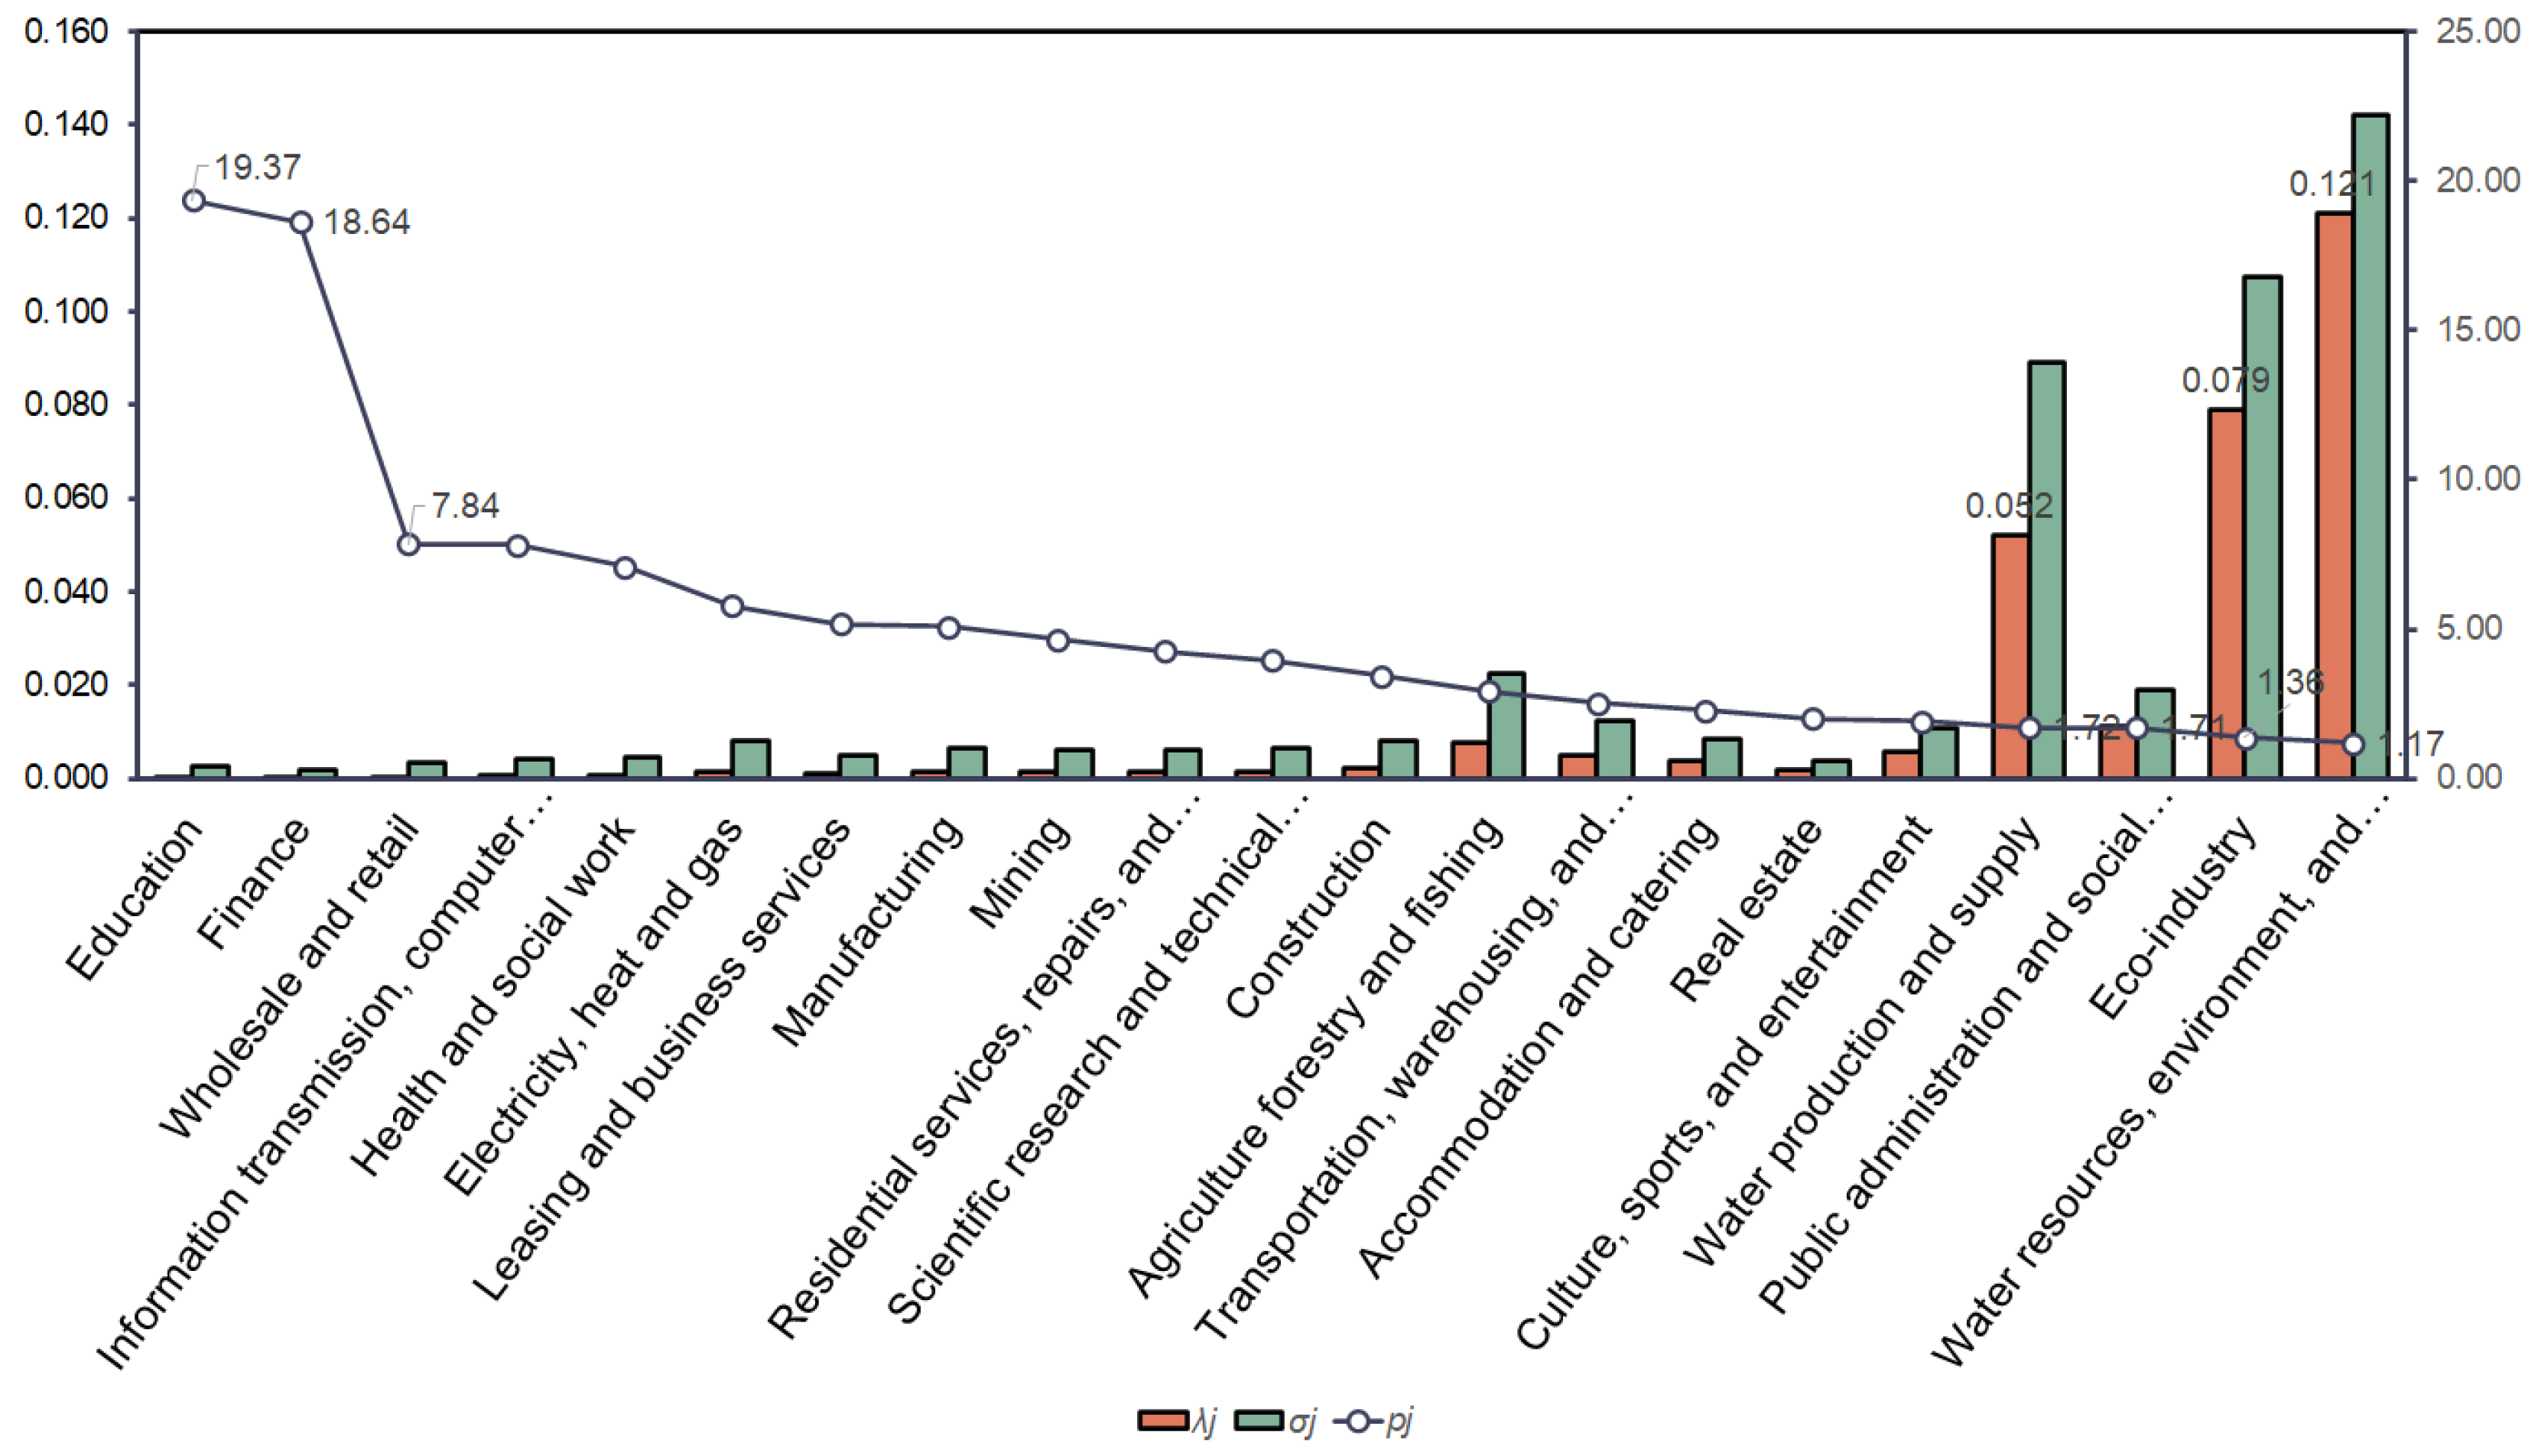
In this paper, the capacity of each industrial sector to create added value is calculated through the consumption of eco-services according to Equations (8)–(10) (Figure 6). While the consumption value-added coefficient ( λ j ) of the eco-industry varies considerably across industries, top-ranking industrial sectors are more relevant to the ecological environment. The water resources, environment, and public facilities management industry has the highest value (0.121), followed by the eco-industry (0.079) and the water production and supply industry (0.052). Certain tertiary industries such as education, finance, wholesale, and retail trade have lower value-added coefficients for direct consumption of ecological services. In addition, the complete-consumption value-added coefficient of the eco-industry ( σ j ) for each industrial sector is more significant than its direct-consumption value-added coefficient. This relationship indicates that part of the added value of these industrial sectors originates from using ecological services of the eco-industry for intermediate use. The consumption value-added multiplier (pj) of the eco-industry shows that the eco-industry directly drives the added value of both the eco-industry (1.36) and the water resources, environment, and public facilities management industry (1.17). In contrast, the development of the eco-industry has a more vital ability to indirectly contribute to added value in sectors such as education (19.37), finance (18.64), and wholesale and retail trade (7.84).

3.3. Pulling Effect of Ecological Investment on Regional Economy

In the input–output table, it is crucial to translate ecological investment into sectoral investment. According to spending, the eco-industry and civil engineering for urban ecological infrastructure construction are part of the construction industry. Forestry ecology, water ecology protection, and restoration equipment purchase are industries of forestry, manufacturing, water, and environment. To improve the accuracy of investment allocation, related ecological restoration and urban greening projects, as well as park construction projects, were analyzed to determine the proportion of investment. Finally, values of 20% for agriculture, forestry, and fishing, 25% for manufacturing, 5% for water production and supply, 30% for construction, and 20% for water, environment, and public facilities management were used. Ecological investment was allocated proportional to each industry, and the corresponding part of the original industry was deducted to arrive at the final use of the ecological investment column vector. The driving effect of ecological investment on industry GDP and total output value was calculated by Equation (12) (Table 4). Compared with 2017, the 2018 ecological investment increased by 9.662 billion yuan, driving regional GDP growth of 12.730 billion yuan and regional total output value growth of 36.769 billion yuan. The GDP driving coefficient was 1.318, and the total output value-driving coefficient was 3.806, implying that one unit of ecological investment can drive GDP growth by 1.318 times and total output value growth by 3.806 times. The manufacturing, construction, real estate, and cultural and entertainment industries are the most effective. Their GDP growths were driven by ecological investments of 951 million yuan, 612 million yuan, 2.285 billion yuan, and 1.104 billion yuan, respectively. In contrast, the effects on the mining, public administration, social organization, and scientific research and technical services industries were weak, with 110 million yuan, 0.18 billion yuan, and 129 million yuan, respectively.

4. Discussion

As mentioned above, the effect of the coefficient of the eco-industry is slightly stronger than the general level of the industry, but the induction coefficient is weaker. This paper suggests that one of the possible reasons for this result is that the government mainly led the development of the eco-industry, which is highly influenced by policy drivers. The final use of the eco-industry contributes more than intermediate industries, which means that the eco-industry is the final industry use type. Furthermore, the eco-industry is characterized by long investment cycles and vulnerability to external shocks. Although the eco-industry has strong industrial pulling power, the general public does not pay sufficient attention to the eco-industry. Therefore, the eco-industry is less developed than certain other industries. However, this phenomenon will change with changes to China’s economic growth model. In general, the development of the eco-industry has greater pulling power over other industries, and the eco-industry plays a supporting role in the development of other industries.
Figure 5 and Figure 6 show that the inputs and outputs of the eco-industry in each industry clearly tend to focus on the water production and supply industry, the water conservation and environment industry, and the eco-industry itself. This is equivalent to the operation and maintenance of the eco-industry in the eco-environment-related industries and the additional support of the ecosystem services function in the eco-environment-related industries. For example, the water production and supply industry invests significant annual funds in water purification. The value generated by the waste treatment and pollution control function of the ecosystem services function is equivalent to the value the industry should have paid to the eco-industry but did not. This value represents the direct-contribution value of the eco-services. Moreover, the three industries of real estate, culture, sports and entertainment, and accommodation and catering have a higher demand for the cultural, entertainment, and the ornamental function of the ecosystem. Therefore, these industries also have a higher share of their ecosystem services. Real estate developers and accommodation and restaurant operators are more willing to raise costs for ecosystem services, because doing so will increase their revenue. This result is comparable to that of Zhang [33], who concluded that for every 1% increase in green space coverage in a community, property prices could increase by 0.58%. Zhang also reported that the value added in Qingdao because of the greening enhancement of the community was 2.508 billion yuan in 2007 [33]. Judging from the entire regional economy, the finance and education sectors indirectly use more ecological services and create more benefits from the indirect consumption of ecosystem services. A possible reason is that the output of the eco-industry (ecological services) is mainly concentrated in the ecological environment and public services sectors. Most of the associated industries are public welfare industries that require a large amount of governmental input. Moreover, the main component of the eco-industry is ecological investment, in which the services provided by the financial industry play an essential role. Similarly, the education industry has a higher share of final use, mainly for residential and government consumption. Both residents and the government are willing to consume eco-services, as indicated by the higher demand for eco-services from changes in the final use per unit in the education and financial industries. This higher demand results in relatively high eco-industry consumption multipliers and eco-industry value-added multipliers for both industries. In addition, the secondary industry has a lower direct ecological-service consumption and a higher demand coefficient for ecological services. The main reason is that the total output of the secondary industry is higher, while the share of ecological services is relatively low. Furthermore, because the intermediate use of the eco-industry is higher in other industries, the secondary industry is more indirectly involved in the demand for ecosystem services. At the same time, certain tertiary industries such as real estate, culture, and entertainment, as well as accommodation and catering, gain higher benefits from the eco-industry. Ecosystem services either directly or indirectly help these industries increase their value.
As shown in Table 4, unit ecological investment drove GDP growth by 1.318 units and total output growth by 3.806 units, indicating that ecological investment contributes more substantially to GDP and total output. This is similar to the findings reported by Fan et al. [48] on the pulling effect of investment in environmental industries on total socio-economic production. The GDP and total output driving the impact of eco-industry investment are slightly higher compared to those of the environmental protection industry. The main reasons for this slight difference are the high final use share of the eco-industry, the formation of natural capital by eco-investment, and the higher willingness of residents to pay for ecological services. The pulling effect of eco-investment varies significantly among different industries. The pulling effect of eco-investment is particularly pronounced in high-output industries such as real estate, accommodation, and catering, as well as cultural and entertainment industries. In comparison, the input of eco-services in the manufacturing and education industries is lower. Still, the pulling effect eco-investment exerts on their added value and total output is apparent, indicating that ecosystem services indirectly create value for these industries and promote their healthy development.
Based on the above analysis, the following policy suggestions are presented to promote the actual effectiveness of the eco-industry from the eco-industry development level: (1) The proportion of eco-investment in infrastructure construction investment should be appropriately increased. Under the current trend of China’s economic slowdown and overall consumption deficit, eco-environment construction will promote the development of eco-environment-related industries. Certain tertiary industries such as the real estate industry, the cultural and entertainment industry, as well as the accommodation and catering industry, create benefits by consuming ecological services. In turn, residents’ consumption will be promoted, thus becoming a necessary engine for economic growth. (2) The eco-industry indirectly promotes the development of the education, finance, and secondary industries. Therefore, the government should further promote the integration of the eco-industry with other industries and strengthen the guidance and promotion of the economic driving function of ecological industry. The supporting role of the eco-industry and ecological services in driving various industrial sectors should be fully explored. (3) The efficiency of financial capital investment should be improved, giving full play to the role of demonstration and guidance and attracting social capital investment. Because the secondary industry does not directly create revenue from the consumption of ecosystem services, these ecosystem services are an offsetting expense for the secondary industry. Out of concern for their costs, companies lack the initiative and motivation to actively increase their ecosystem services inputs. The positive spillover effect of the production and consumption of ecosystem services means that the fundraising required for the development of the eco-industry relies heavily on financial investment from the government. However, solely relying on financial investment is not an effective solution for the incentive problem for investment agents in the production process. Therefore, it is necessary to demonstrate and guide government investments as well as improve the output efficiency of the eco-industry by attracting social capital investment.

5. Conclusions

With an increasing number of eco-environmental protection policies and investments in the construction of China’s eco-environment, both enterprises and residents are benefiting from the resulting gradual improvement of the eco-environment. Investing in the eco-industry has become a new economic growth opportunity. The development of the eco-industry can both directly and indirectly drive other industries. However, the eco-industry is neither fully defined nor well developed, and in existing national economic accounting, the eco-industry is not a separate sector. Moreover, the ecosystem services value is difficult to estimate, and the services provided by ecosystems do not circulate directly in the market. Current national economic accounting does not incorporate the value of ecological services created by improving the ecological environment and eco-industries. It is therefore difficult to estimate the direct and indirect impacts of eco-industries on other industrial sectors, and the national and regional economic pull of government investment in ecology remains unclear. To promote the development of eco-industries and to clarify the eco-industry and the impact of eco-investment on different industrial sectors and the entire national economy, this study adopts an input–output approach. Beijing is taken as the study area. For the first time, the eco-industry—as an independent sector—is split from the traditional input–output table through the method of proportional distribution and investment disassembly. The value of ecosystem services is integrated into the eco-industry by the method of equivalent factor matching and ecological service functions. Various coefficients are calculated and analyzed from an industrial-chain perspective. This study provides a scientific basis for policymakers to understand the overall situation of the eco-industry as well as industrial linkages, thus helping policymakers to improve relevant investment strategies. The results show that the eco-industry exerts a good pulling effect on the social economy, with an influence coefficient of 1.017, which is higher than the industry average. The inputs and outputs of the eco-industry show a clear tendency to focus on eco-environment-related industries and public-service-related industries. Examples of these industries are the water resources, environment, and public facilities management industry, the eco-industry itself, and the water production and supply industry. These are followed by industries for which ecological development can create value directly, such as the real estate industry, the accommodation and catering industry, the culture, sports, and entertainment industry, and the primary industry. In the entire regional economy, eco-investment plays a significant role in promoting the development of tertiary industries such as finance and education. Ecological investment significantly affects the real estate industry, the education industry, the culture, sports, and entertainment industry, and the accommodation and catering industry. One unit of ecological investment can drive 1.318 units of regional GDP growth and 3.806 units of total output growth.
This paper has certain shortcomings. Because of the lack of data related to the eco-industry, this paper could only adopt allocation by using similar industry coefficients in eco-industry input–output accounting. Several of the used industries’ ecological services were estimated based on relevant literature and experience. This paper quantitatively analyzes the industry–industry linkage of the eco-industry and the economic pulling effect of ecological investment from an input–output perspective, which is still a bold approach. The calculated results provide a reference for the government to formulate relevant ecological development policies, which have actual reference significance.

Author Contributions

Conceptualization, H.N. and Y.Q.; methodology, Y.Q.; software, J.Z. and Y.Q.; validation, Y.Q.; formal analysis, J.Z. and Y.Q.; investigation, Y.Q.; resources, Y.Q.; data curation, H.N.; writing—original draft preparation, Y.Q.; writing—review and editing, G.C. and C.L.; visualization, Y.Q.; supervision, H.N.; project administration, H.N.; funding acquisition, H.N. and C.L. All authors have read and agreed to the published version of the manuscript.

Funding

This research was funded by the study on simulation and sustainability of economic and ecological effects of national water network (grant number 2021YFC3200205), the National Natural Science Foundation of China (grant number 52009042) and the Open Research Fund of State Key Laboratory of Simulation and Regulation of Water Cycle in River Basin (China Institute of Water Resources and Hydropower Research), (grant number IWHR-SKL-2014**).

Institutional Review Board Statement

Not applicable.

Informed Consent Statement

Not applicable.

Data Availability Statement

The data presented in this study are available on request from the corresponding author.

Conflicts of Interest

The authors declare no conflict of interest.

References

  1. Liu, J.; Li, S.; Ouyang, Z.; Tam, C.; Chen, X. Ecological and socioeconomic effects of China’s policies for ecosystem services. Proc. Natl. Acad. Sci. USA 2008, 105, 9477–9482. [Google Scholar] [CrossRef] [Green Version]
  2. Wang, W.; Guo, H.; Chuai, X.; Dai, C.; Lai, L.; Zhang, M. The impact of land use change on the temporospatial variations of ecosystems services value in China and an optimized land use solution. Environ. Sci. Policy 2014, 44, 62–72. [Google Scholar] [CrossRef]
  3. Ministry of Ecology and Environment of the People’s Republic of China 2018. Economic-Ecological Product Accounting. Available online: http://www.zhb.gov.cn/ (accessed on 26 April 2021).
  4. National Forestry and Grassland Adminstration 2019. China Forestry and Grassland Statistical Yearbook. Available online: http://www.forestry.gov.cn/ (accessed on 26 October 2019).
  5. Millennium Ecosystem Assessment, Ecosystems and Human Well-Being; Island Press: Washington, DC, USA, 2005.
  6. China 2022. Actively Expand Effective Investment to Promote Steady and Sound Economic Development. Available online: http://www.gov.cn/xinwen/2022-04/28/content_5687673.htm (accessed on 28 April 2022).
  7. China 2022. Opinions of The General Office of the State Council on Further Revitalizing Stock Assets and Expanding Effective Investment. Available online: http://www.gov.cn/zhengce/content/2022-05/25/content_5692190.htm (accessed on 25 May 2022).
  8. Chen, W.; Chen, J.; Xu, D.; Liu, J.; Niu, N. Assessment of the practices and contributions of China’s green industry to the socio-economic development. J. Clean. Prod. 2017, 153, 648–656. [Google Scholar] [CrossRef]
  9. Tao, X.; Wang, P.; Zhu, B. Provincial green economic efficiency of China: A non-separable input–output SBM approach. Appl. Energy 2016, 171, 58–66. [Google Scholar] [CrossRef]
  10. Kunanuntakij, K.; Varabuntoonvit, V.; Vorayos, N.; Panjapornpon, C.; Mungcharoen, T. Thailand Green GDP assessment based on environmentally extended input-output model. J. Clean. Prod. 2017, 167, 970–977. [Google Scholar] [CrossRef]
  11. Yi, H.; Liu, Y. Green economy in China: Regional variations and policy drivers. Glob. Environ. Chang. 2015, 31, 11–19. [Google Scholar] [CrossRef]
  12. He, L.; Zhang, L.; Zhong, Z.; Wang, D.; Wang, F. Green credit, renewable energy investment and green economy development: Empirical analysis based on 150 listed companies of China. J. Clean. Prod. 2019, 208, 363–372. [Google Scholar] [CrossRef]
  13. Leontief, W. National income, economic structure, and environmental externalities. In The Measurement of Economic and Social Performance; NBER: Cambridge, MA, USA, 1973; pp. 565–576. [Google Scholar]
  14. Wu, Y.; Xia, Y.; Yan, F. Application of green input output matrix to sustainable development in China. In Proceedings of the PICMET’09–2009 Portland International Conference on Management of Engineering & Technology, Portland, OR, USA, 2–6 August 2009; IEEE: Piscataway, NJ, USA, 2009. [Google Scholar]
  15. Lei, M.; Zhao, X. Application analysis of green input-output accounting under sustainable development: Based on China 2007 Green Input-Output Table. Econ. Sci. 2011, 4, 16–27. [Google Scholar]
  16. Wang, Y.; Yang, H.; Liu, J.; Xu, Y.; Wang, X.; Ma, J.; Xu, J.; Yi, K.; Tao, S. Analysis of multiple drivers of air pollution emissions in China via interregional trade. J. Clean. Prod. 2020, 244, 118507. [Google Scholar] [CrossRef]
  17. Li, M.; Gao, Y.; Meng, B.; Yang, Z. Managing the mitigation: Analysis of the effectiveness of target-based policies on China’s provincial carbon emission and transfer. Energy Policy 2021, 151, 112189. [Google Scholar] [CrossRef]
  18. Fan, Y.; Wu, S.; Lu, Y.; Wang, Y.; Zhao, Y.; Xu, S.; Feng, Y. An approach of measuring environmental protection in Chinese industries: A study using input–output model analysis. J. Clean. Prod. 2016, 137, 1479–1490. [Google Scholar] [CrossRef]
  19. Garrett-Peltier, H. Green versus brown: Comparing the employment impacts of energy efficiency, renewable energy, and fossil fuels using an input-output model. Econ. Model. 2017, 61, 439–447. [Google Scholar] [CrossRef]
  20. Bagheri, M.; Guevara, Z.; Alikarami, M.; Kennedy, C.A.; Doluweera, G. Green growth planning: A multi-factor energy input-output analysis of the Canadian economy. Energy Econ. 2018, 74, 708–720. [Google Scholar] [CrossRef]
  21. Guevara, Z.; Henriques, S.; Sousa, T. Driving factors of differences in primary energy intensities of 14 European countries. Energy Policy 2021, 149, 112090. [Google Scholar] [CrossRef]
  22. Zhang, W.; Wang, F.; Hubacek, K.; Liu, Y.; Wang, J.; Feng, K.; Jiang, L.; Jiang, H.; Zhang, B.; Bi, J. Unequal exchange of air pollution and economic benefits embodied in China’s exports. Environ. Sci. Technol. 2018, 52, 3888–3898. [Google Scholar] [CrossRef]
  23. Wang, Y.; Wang, N. The role of the marine industry in China’s national economy: An input–output analysis. Mar. Policy 2019, 99, 42–49. [Google Scholar] [CrossRef]
  24. Liu, Y.; Chen, B. Water-energy scarcity nexus risk in the national trade system based on multiregional input-output and network environ analyses. Appl. Energy 2020, 268, 114974. [Google Scholar] [CrossRef]
  25. Deng, H.-M.; Wang, C.; Cai, W.-J.; Liu, Y.; Zhang, L.-X. Managing the water-energy-food nexus in China by adjusting critical final demands and supply chains: An input-output analysis. Sci. Total Environ. 2020, 720, 137635. [Google Scholar] [CrossRef]
  26. Gao, Y.; Li, S. Construction of Extended CGE Model with Resource and Environment Accounting. China Popul. Resour. Environ. 2008, 18, 20–23. [Google Scholar]
  27. Deng, X.; Zhang, F.; Wang, Z.; Li, X.; Zhang, T. An extended input output table compiled for analyzing water demand and consumption at county level in China. Sustainability 2014, 6, 3301–3320. [Google Scholar] [CrossRef] [Green Version]
  28. Choi, J.-K.; Bakshi, B.R.; Haab, T. Effects of a carbon price in the US on economic sectors, resource use, and emissions: An input–output approach. Energy Policy 2010, 38, 3527–3536. [Google Scholar] [CrossRef]
  29. Guo, J.; Zhang, Y.-J.; Zhang, K.-B. The key sectors for energy conservation and carbon emissions reduction in China: Evidence from the input-output method. J. Clean. Prod. 2018, 179, 180–190. [Google Scholar] [CrossRef]
  30. Lange, G.-M. Applying an integrated natural resource accounts and input–output model to development planning in Indonesia. Econ. Syst. Res. 1998, 10, 113–134. [Google Scholar]
  31. Liu, Z.; Huang, Q.; He, C.; Wang, C.; Wang, Y.; Li, K. Water-energy nexus within urban agglomeration: An assessment framework combining the multiregional input-output model, virtual water, and embodied energy. Resour. Conserv. Recycl. 2021, 164, 105113. [Google Scholar] [CrossRef]
  32. Peng, Y.; Xu, X.; Lu, Y.; Zhao, Y. Empirical Research in Environmental Protection Investment to Promote the Development of Environmental Protection Industry. Ecol. Econ. 2016, 32, 92–95. [Google Scholar]
  33. Zhang, D. A Study on Urban Forest Welfare Benefit Evaluation: Qingdao City as a Case. Ph.D. Thesis, Chinese Academy of Forestry, Beijing, China, 2009. [Google Scholar]
  34. Xie, G.; Zhang, C.; Zhen, L.; Zhang, L. Dynamic changes in the value of China’s ecosystem services. Ecosyst. Serv. 2017, 26, 146–154. [Google Scholar] [CrossRef]
  35. Zhao, T.Q.; Ouyang, Z.Y.; Wang, X.K.; Miao, H.; Wei, Y.C. Ecosystem servies and their valuation of terrestrial surface water system in China. J. Nat. Resour. 2003, 18, 443–452. [Google Scholar]
  36. Kalantari, B.; Lari, I.; Ricca, F.; Simeone, B. On the complexity of general matrix scaling and entropy minimization via the RAS algorithm. Math. Program. 2008, 112, 371–401. [Google Scholar] [CrossRef]
  37. Deng, X.; Lin, Y.; Yuan, Y. Non-parametric method for filling in the missing value for cross-sectional dataset: A validation on the per capita GDP data at county level in China. J. Food Agric. Environ. 2012, 10, 1350–1354. [Google Scholar]
  38. Costanza, R.; d’Arge, R.; de Groot, R.; Farber, S.; Grasso, M.; Hannon, B.; Limburg, K.; Naeem, S.; O’Neill, R.V.; Paruelo, J.; et al. The value of the world’s ecosystem services and natural capital. Nature 1997, 387, 253–260. [Google Scholar] [CrossRef]
  39. Costanza, R. Valuing natural capital and ecosystem services toward the goals of efficiency, fairness, and sustainability. Ecosyst. Serv. 2020, 43, 101096. [Google Scholar] [CrossRef]
  40. Authority BW 2020. Report of Water Ecological Monitoring and Health Assessment in Beijing. Available online: http://swj.beijing.gov.cn/ (accessed on 26 August 2021).
  41. Ma, S. A Dissertation Submitted in Partial Fulfillment of the Requirements for the Degree of Doctor of Management. Ph.D. Thesis, Huazhong University of Science and Technology, Wuhan, China, 2018. [Google Scholar]
  42. Chuai, X.; Huang, X.; Wu, C.; Li, J.; Lu, Q.; Qi, X.; Zhang, M.; Zuo, T.; Lu, J. Land use and ecosystems services value changes and ecological land management in coastal Jiangsu, China. Habitat Int. 2016, 57, 164–174. [Google Scholar] [CrossRef]
  43. Peng, W.F.; Zhou, J.M.; Fan, S.Y.; Yang, C.J. Effects of the land use change on ecosystem service value in Chengdu, western China from 1978 to 2010. J. Indian Soc. Remote Sens. 2016, 44, 197–206. [Google Scholar] [CrossRef]
  44. Bagstad, K.J.; Villa, F.; Batker, D.; Harrison-Cox, J.; Voigt, B.; Johnson, G.W. From theoretical to actual ecosystem services: Mapping beneficiaries and spatial flows in ecosystem service assessments. Ecol. Soc. 2014, 19, 64. [Google Scholar] [CrossRef] [Green Version]
  45. Suwarno, A.; Hein, L.; Sumarga, E. Who benefits from ecosystem services? A case study for Central Kalimantan, Indonesia. Environ. Manag. 2016, 57, 331–344. [Google Scholar] [CrossRef] [PubMed] [Green Version]
  46. Singh, V.K.; Henriques, C.O.; Martins, A.G. Fostering investment on energy efficient appliances in India—A multi-perspective economic input-output lifecycle assessment. Energy 2018, 149, 1022–1035. [Google Scholar] [CrossRef]
  47. Zhang, W.; Wang, J.; Zhang, B.; Bi, J.; Jiang, H. Can China comply with its 12th five-year plan on industrial emissions control: A structural decomposition analysis. Environ. Sci. Technol. 2015, 49, 4816–4824. [Google Scholar] [CrossRef]
  48. Fan, Y.; Wu, S.; Lu, Y.; Zhao, Y. Study on the effect of the environmental protection industry and investment for the national economy: An input-output perspective. J. Clean. Prod. 2019, 227, 1093–1106. [Google Scholar] [CrossRef]
  49. Liu, C. Analysis of the Industrial Efficiency and Regional Effects of Eco-Tourism in Xiaolongshan Forests Region. Ph.D. Thesis, Lanzhou University, Lanzhou, China, 2012. [Google Scholar]
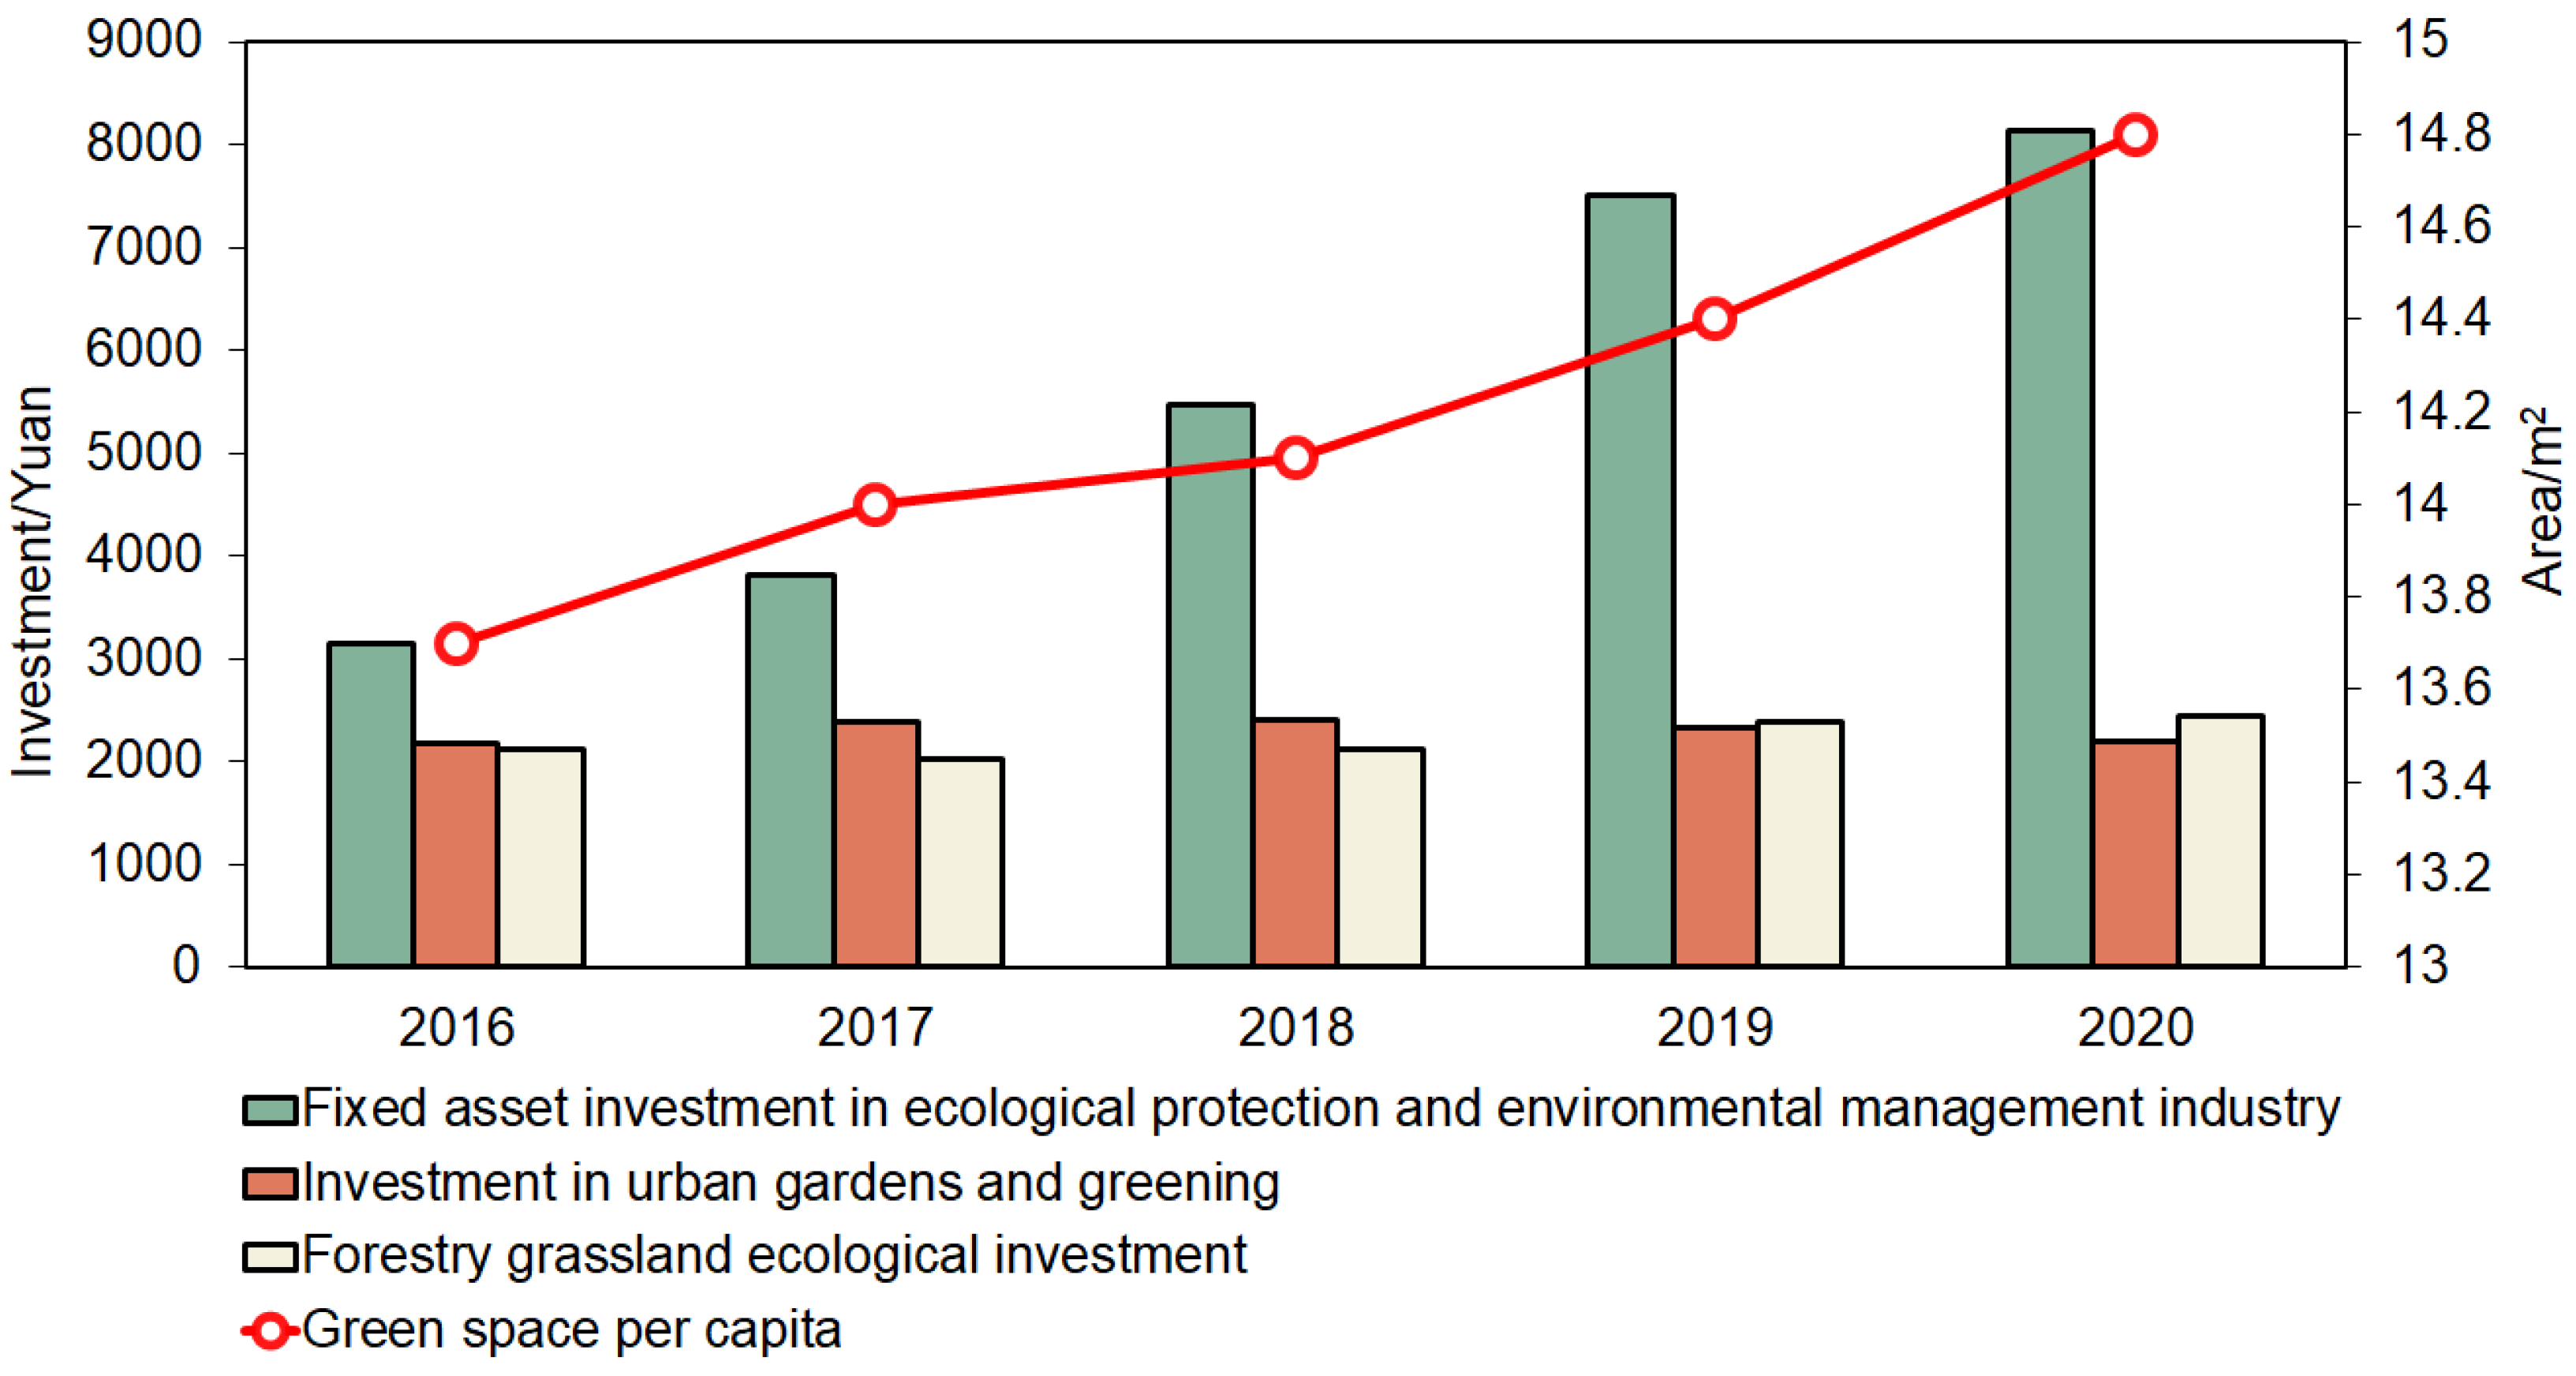
Figure 1. Investment in ecology-related industries in China from 2016 to 2020. Data source: 2017–2021 China Environmental Statistical Yearbooks and 2017–2021 China Statistical Yearbooks.
Sustainability 14 09889 g001
Figure 2. Eco-industry accounting and separation steps.
Sustainability 14 09889 g002
Figure 3. Intermediate use splitting of the eco-industry.
Sustainability 14 09889 g003
Figure 4. Effect coefficient and induction coefficient of industrial sectors (for industry name see Table 3).
Sustainability 14 09889 g004
Figure 5. Analysis of eco-industry consumption coefficients.
Sustainability 14 09889 g005
Figure 6. Analysis of eco-industry consumption value-added coefficients.
Sustainability 14 09889 g006
Table 1. Structure of the eco-industry input–output model.
OutputIntermediate UseFinal UseTotal Output
Input Industry 1Industry 2Industry nIndustry n (Ecology)Final UseEcological
Investment
IntermediateuseIndustry 1X11X12X1nX1(n + 1)Y1YIe1X1
Industry 2X21X22X2nX2(n + 1)Y2YIe2X2
Industry nXn1Xn2XnnXn(n + 1)YnYIenXn
Industry n + 1 (Ecology)X(n + 1)1X(n + 1)2X(n + 1)nX(n + 1)(n + 1)Y(n + 1)Yie(n + 1)X(n + 1)
Value addedV1V2VnV(n + 1)
Total inputX1X2XnX(n + 1)
Table 2. Value calculation of ecosystem services in the study area; unit: 104 Yuan.
PrimarySecondary20172020
ClassificationClassification
Supply servicesFood production105,852.6843,952.47
Raw material55,107.2973,079.76
Water supply138,828.3168,565.84
Regulating servicesGas regulation187,552.38242,441.01
Climate regulation381,881.43698,028.69
Waste treatment118,889.32213,701.04
Hydrological regulation487,643.77658,884.32
Supporting servicesSoil formation and retention182,360.69288,277.35
Nutrient cycling23,816.2623,664.02
Biodiversity protection144,213.39263,089.37
Cultural servicesRecreation and culture64,828.93116,978.07
Total1,886,951.912,690,661.95
Table 3. National economy industry categories.
Industry NumberIndustry Name
1Agriculture, forestry, and fishing
2Mining
3Manufacturing
4Electricity, heat, and gas
5Water production and supply
6Construction
7Wholesale and retail
8Transportation, warehousing, and postal services
9Accommodation and catering
10Information transmission, computer services, and software
11Finance
12Real estate
13Leasing and business services
14Scientific research and technical services
15Water resources, environment, and public facilities management
16Residential services, repairs, and other services
17Education
18Health and social work
19Culture, sports, and entertainment
20Public administration and social organization
Table 4. Driving effects of ecological investment on industrial sectors (108 yuan).
Industrial SectorsGDPTotal Output
Agriculture, forestry, and fishing3.889.76
Mining1.103.67
Manufacturing9.5143.24
Electricity, heat, and gas4.0924.43
Water production and supply2.945.80
Construction6.1233.58
Wholesale and retail8.1817.49
Transportation, warehousing, and postal services4.4116.20
Accommodation and catering7.9323.27
Information transmission, computer services, and software1.664.76
Finance7.1412.50
Real estate22.8533.13
Leasing and business services7.8730.96
Scientific research and technical services1.294.15
Water resources, environment, and public facilities management2.6817.28
Residential services, repairs, and other services1.877.82
Education11.8118.64
Health and social work4.7011.63
Culture, sports, and entertainment11.0433.13
Public administration and social organization0.180.49
Eco-industry6.0515.76
Total127.30367.69
Pull coefficient1.3183.806
Publisher’s Note: MDPI stays neutral with regard to jurisdictional claims in published maps and institutional affiliations.