Article

Building a Hierarchical Sustainable Consumption Behavior Model in Qualitative Information: Consumer Behavior Influences on Social Impacts and Environmental Responses

by
Tat-Dat Bui
1,2,
Ming K. Lim
3,
Raditia Yudistira Sujanto
4,5,
Monica Ongkowidjaja
2 and
Ming-Lang Tseng
1,2,6,7,*
1
Institute of Innovation and Circular Economy, Asia University, Taichung 413, Taiwan
2
Department of Business Administration, Asia Management College, Asia University, Taichung 413, Taiwan
3
Adam Smith Business School, University of Glasgow, Glasgow G12 8QQ, UK
4
Intelligent Maritime Research Center, National Taiwan Ocean University, Keelung 202, Taiwan
5
Department of Communication, Universitas’ Aisyiyah Yogyakarta, Yogyakarta 55592, Indonesia
6
Department of Medical Research, China Medical University Hospital, China Medical University, Taichung 404, Taiwan
7
Ramon V. Del Rosario College of Business, De La Salle University, Manila 1004, Philippines
*
Author to whom correspondence should be addressed.
Sustainability 2022, 14(16), 9877; https://doi.org/10.3390/su14169877
Submission received: 8 July 2022 / Revised: 2 August 2022 / Accepted: 5 August 2022 / Published: 10 August 2022
(This article belongs to the Special Issue Sustainable Consumption Behavior in the Disruptive Environment)

Abstract

:
This study contributes to an understanding of valid sustainable consumption behavior attributes in Indonesia, due to the current unsustainability of product usage and environmental damage. Increasing consumption requires an understanding and exploration of important aspects of the consumption process and consumers’ behaviour. Sustainable consumption fulfils human needs, increases quality of life, reduces environmental damage and minimizes the risk to human health. A set of qualitative aspects and criteria is selected, validated by experts, using the Delphi method. Qualitative information is translated into comparable scales by applying fuzzy set theory. The interrelationships among the attributes are then identified by using a decision-making trial evaluation in the laboratory. Choquet integral is used to eliminate problems of expert subjectivity and this interactivity method, thus, provides higher insight into effectively addressing uncertainties. The results show that social impact and consumer behavior have a significant role in driving sustainable consumption behavior, representing an individual’s motivation in planning or decision making when performing a specific sustainable behavior. Sustainable consumption behavior is motivated by perceived consumer effectiveness, trust from consumers, environmental knowledge, environmental responsibility, behavioral intention, emotion, and motivation regarding social consumption mot. Theoretical and managerial implications are also provided.

1. Introduction

In Indonesia, 75% of generated waste is caused by food consumption [1]. This is a consequence of increasing consumption on the consumer’s part, along with unsustainability in food packaging and food waste [2]. Firms must consider the environmental, economic and social impact (triple bottom line; TBL perspectives) in their food product assessment, and consider efficient practices leading towards sustainable consumption. Indeed, sustainable consumption requires an understanding of consumer behavior, and sustainable consumption behavior (SCB) requires additional efforts to develop and is difficult to trigger spontaneously [3]. The reciprocal rules in SCB indicate that a beneficial action on the part of consumer behavior leads to a response in kind, regarding the social impact of multilateral relationships [4]. For instance, consumer behavior can be examined by a close inter-personal demographic to determine environmental responses drawing from SCB [5,6]. Moreover, Yang et al. [7] argued that, since SCB is pro-environment, consumers display altruistic characteristics which are expressed in their value selection and self-identity construction, in order to fulfil their needs, while reducing the impact on the environment. Yet research addressing how consumer behavior impacts on environmental and social aspects in structuring the SCB model is still lacking [8]. Even though various aspects and criteria have been proposed to measure the SCB, the hierarchical structure in the nature of the measurement model is still underdeveloped.
In this study, SCB explores sustainable consumption related to consumers’ backgrounds related circumstances, along with the improvement of strategies involved in exchange relationships based on social exchange theory (SET), due to the expected benefits in economic and social resources [6]. In terms of theoretical insights, SCB aims to understand the waste of resources, with the aim of preserving environmental sustainability, in which consumers can help in reducing their social impact, consumer behavior is involved in the resource exchange processes, and the importance of demographic features forming the SCB model is considered [5]. Food consumption has an impact on individual and public health, natural resources, social cohesion and the economy; nevertheless, the complexity of consumer behavior and their fundamental knowledge is difficult to explain from a single viewpoint [9,10,11]. As aforementioned, SCB supports corporate sustainability while supporting the firm to arrive at economic benefits, and positive environmental impact and social effects; especially, environmentally-friendly product consumption is a trend, via which consumers change their behavior to achieve sustainability [4,10,12].
For instance, Chen et al. [13] suggested that communication efforts dedicated to educating consumers about the environment and knowledge of conservation affect SCB. Effective environmental responses require efforts to gain an understanding of the relevant concept regarding consumers’ behaviors and to further explore attributes encouraging consumer intention to understand the SCB model [4]. Alzubaidi et al. [14] argued that attributes affecting consumers’ environmental responses are affected by innovativeness, perceived consumer effectiveness, and environmental concerns. However, there are still attitudinal behavior inconsistencies in how consumers perceive products and in the understanding of consumers’ socio-economic and demographic profiles [5,8]. Indeed, SCB has not fully alleviated these situations and has not covered this broader range of activities, despite studies in the resolution of the problem of addressing and becoming acquainted with SCB [13,15].
Since increasing attention has been paid to consumers changing their consumption behavior toward sustainability, this study argues that the SET needs to understand social impacts and consumers’ responses to the environment, in order to construct a holistic SCB model [4,9]. Basha and Lal [16] argued that social pressure changing consumer behavior is urgent and offer valuable insight into how SCB conceivably might transform the situation to a more sustainable supply, production and consumption. In addition, Sarkis et al. [11] claimed that social impact effectiveness is necessary to warrant the development and adoption of the successful economic development new categories and consumption models to involve new behaviors and measure this accomplishment precisely. Schäfer et al. [15] pointed out that in sustainable consumption it is essential to understand the contextual and causal influences. Ganglmair-Wooliscroft and Wooliscroft [17] argued that, apart from individual characteristics, there is a wide variety of other influencing factors in the dynamics of consumer behavior regarding sustainability. The SCB model deals with consumer’s behavior in changing resistant daily routines and therefore creating more positive social impacts; however, the model has to be structured taking into account contextual and causal influences.
This study applies the Delphi method and a fuzzy decision-making trial evaluation laboratory (DEMATEL) together to develop valid measures and a causal model. First, a measurement SCB model is proposed, described in qualitative information. The Delphi method is intended to structure and validate the selected attributes from the literature and expects’ opinions [18,19,20]. Secondly, Fuzzy DEMATEL transforms the customer perceptions into quantitative information and visualizes the interrelationships among attributes [21]. However, the experts’ experience, knowledge, and familiarity with the field may cause biases judgments that effect the results [22]. Further, there are lack of tools to enable interactions among the attribute since they are presumed as exhaustive and independent. Next, Choquet integral is used as a non-additive fuzzy integral to eliminate the expert subjective problems and interactivity method; thus, it provides higher insight on validating hierarchical structure [23,24]. The objectives of this study are as follows:
  • To present a set of SCB attributes;
  • To examine the causal SCB model in qualitative information;
  • To identify the improvement criteria for practice.
The contribution of this study lies in both theoretical and managerial views: (1) a set of valid SCB aspects and criteria are presented to extend the SCB knowledge in the literature; (2) The SCB causal interrelationship model is justified; and (3) criteria are indicated for the improvement of practices to enhance performance. The remainder of this study is organized as follows. Section 2 presents the literature review related to SET, SCB, proposed method and attributes for measurement. Section 3 describes the industrial background and methodology. Section 4 provides the results and major findings from the data analysis process. Theoretical and managerial implications are provided in Section 5. The final section covers the conclusion, contributions, limitations and opportunities for future research.

2. Literature Review

This section discusses the SCB, SET background, proposed method and proposed attribute for measurement.

2.1. Theoretical Background

Instead, SET is a fundamental concept for analyzing consumer behavior and relationships to determine social structure complexity of modern economics. The theory reflects reciprocal rules between consumer behavior or social impact in an interaction situation or resource-exchanging behavior, which can be considered as the causal influence on the social impacts and consumer behavior as well economic benefits. From the SET perspective, the principle of individual consumer behavior is to maximize benefits and minimize costs and explained the personal consumer behavior in favor of sustainability using SET as foundation to explain SCB model in one relationship create a close interactive association to determines the consumers behavior and their environmental responses. The resources exchanged could be social impact in nature, such as social impact, environmental influences, as well as economic benefits.
However, only few studies have focused on attitude consumer toward SCB using SET. For instance, Wang et al. [6] sought to unravel SCB model from a socio-economic SET point of view as an outline to guide consumer behavior regarding efforts to minimize waste through consumers’ behavior. Schäfer et al. [15] proposed social norms and a social context attribute for facilitating consumer behavior towards sustainability practices. The SET proposes consumers who are involved in an exchange relationship and receive personal social and economic benefit from exchange relationship are inclined to express positive attitudes to sustainability, therefore supporting sustainability development [7]. The theory argued that consumer’s action toward sustainability is driven by economic and social benefit during exchange relationship with another individual [25]. Hence, SCB needs SET as an outline to form consumer behavior efforts in an economic incentive, where consumers realize that they earn benefit and motivate them sustainability.

2.2. Sustainable Consumption Behavior

Sustainable consumption aims to provide better service to meet human needs, increasing the quality of life but also reducing environmental damage and risks to human health and minimizes the waste, uses green products, saves energy, and recycles and extends the lifecycle of products [16]. The concept aims to reduce environmental damage and encourage consumers to make environmentally focused decisions spurring from behavioral change. Prior studies have emphasized SCB in traditional economy, such as green product purchasing, product disposal, and energy use; or talk over the potential sustainability regarding the general TBL dimensions [13,26]. However, the traditional consumers still have poor ecological awareness, needing to promote their personal evolvement through greater sustainable awareness through choosing environmentally friendly products or products with eco-labels [2,3]. The increasingly significant overall environmental impacts associated with the selection, use and disposal of products by consumers are infrequently presented [3]. Sigala [27] implied that SCB is a voluntary behaviour by consumers that supports sustainability with the recognition of environmental and societal influences during consumption. Cohen and Muñoz [26] argued that this approach facilitates the efficient use of under-utilized resources and extends the lifecycle of accessed products, thereby reflecting the significant potential of sustainability in the sharing economy. SCB provides better services to meet the basic demands of current consumers and the aspirations for future improvement while continually assessing sustainability by reducing environmental damage and risks to human health.
The sustainability transformation needs the alternative practice institutionalized that do not jeopardize established systems in the long run with wider consumer behavior on social impacts [4,15]. In contrast, Dong et al. [28] claimed that there are psychological and social needs in SCB that influence personal consumer’s intention to consume durable products. Vega-Zamora et al. [29] highlighted consumers consider the benefit that they receive when choosing products and consuming them and desired to create or heighten their self-identity from affluence levels and influence the behaviour of another consumer. Hence, SCB model needs to figure out the consumer behavior and social impact from the SET while continually assessing sustainability by reducing environmental damage though consumer’s environmental responses. It is important for consumption, which is the driving force behind the implied changes, to pursue gradual sustainability in harmony with sustainable development objectives.

2.3. Proposed Method

This study is to build a valid measure and identifies the causality relationships among the attributes. A combined method consisting of the Delphi method and fuzzy DEMATEL is proposed to investigate the SCB. Delphi technique is recommended in the first stage of the evaluation process to construct and validate the attributes collected from the literature by considering the expert advice [18,30]. This is a methodical technique that assists to gather experts’ opinions for decision making resolutions. Day and Bobeva [31] implied that the Delphi method involves interactive and systematic estimation assigned to a group of experts who provide opinions for planning, issue identification and prioritization, and framework and strategy development [20,32]. Hsu and Sandford [33] stated that this method aims to collect personal judgements on issues or problems if no previous studies or renowned material is obtainable. The method is appropriate and useful in identifying, selecting and validating attributes into a proposed framework for further investigation.
The attributes are assessed using the fuzzy DEMATEL method to examine their interrelationships among others by evaluating the qualitative linguistic information to map a causal diagram of proposed attributes. Fuzzy set theory is used to conceptualize human qualitative judgements in uncertainty into the quantitative script value, while the DEMATEL method is intended to examine the causal interactions among aspects and criteria [21]. For instance, Wu et al. [9] utilizes fuzzy DEMATEL methods to inspect the interrelationships among attributes by generating the linguistic descriptions from experts and forming a causal diagram of proposed attributes. Tseng et al. [21] applied fuzzy DEMATEL to solve complex problems among the attributes by investigating the attributes’ distribution based on the driving and dependence powers.
However, in nature, the hierarchical levels are showed in the model; yet, prior studies are lacking to enhance the experts’ subjective judgement in the link of hierarchical level in the SCB model [22]. Choquet integral is used to remove the expert subjective judgment and enhance the interactivity among the hierarchal attributes due to traditional multi-criteria approach with average weight technique and attributes independence assumption are currently not appropriated to evaluate SCB since the data are non-interactive making weighted effects are additive [24]. A non-additive set occupation must be used to o overcome these shortcomings and a nonlinear integral or non-additive fuzzy integral to replace the weighted average. For instance, Tseng et al. [23] used Choquet integral to select the optimal selection in a multi- hierarchical level. In addition, Olawumi and Chan [24] applied generalized Choquet fuzzy integral method to determine the importance criteria in a non-additive fuzzy integral. This study involves the Delphi method, fuzzy DEMATEL and non-additive Choquet integral together to indicate the important SCB attributes.

2.4. Measured Attributes

From the literature of the SET and SCB, this study proposed a measurement set of 5 aspect and 19 criteria including consumer demographic (A1), consumer behavior (A2), economic benefits (A3), social impacts (A4), and environmental responses (A5).
SCB should involve consumer demographics (A1) to implement and apply sustainability [5,34]. The aspect related to intentional and attitudinal consumer behavior dimensions on socioeconomic efforts [8,25]. Gender (C1) is a criterion that conducts a comprehensive review for explaining demographic profiles and influences management and persuasion behavior during their sustainability consumption [35]. Age is identified as a vital interpreter of consumer behavior, showing the different favorable attitudes toward purchasing [34]. Education basis (C3) refers to consumers who have a basic understanding of how environmental knowledge influences sustainable consumption, especially consumption management and persuasion behavior. Consumers, including highly educated consumers, participate in the prevention of environmental damage [9,34].
Consumer behavior (A2) is examined as it relates to sustainability. For instance, Ramkissoon and Mavondo [36] emphasized that consumers who engage in environmentally sustainable behavior attach high value to improving quality of life. Trust from consumers (C4) involves fully convincing consumer about their support for sustainability and the benefit that consumers obtain. Consumers also believe in other actions and imitate behavior [29]. Emotion (C5) takes place in relationships during consumption or generates feelings of social connection to enhance the consumers’ awareness about building and maintaining friendly environments, which represents consumer satisfaction and builds intimacy with products [28]. Perceived consumer effectiveness (C6) is a belief held by consumers regarding whether their actions produce a positive or negative impact on sustainability or inhibits the influence of attitude on behavior [34]. However, there is evidence showing that consumers believe their behavior has a limited impact on the environment [11]. Behavioral intention (C7) efforts for performing specific behavior reflects resource awareness. Consumers believe in consistently engaging in behavior that creates a positive attitude. Mothers’ influence on their children (C8) is a practice of consumption behavior in which the children were influenced by the connection of the mother and her children. Children generally represent the most immediate layer of their mothers’ extended selves [37]. Perception of consequences (C9) concerns individual perception about the awareness of the impact that can occur as a result of a person’s behavior, which can have a positive impact on the environment.
Consumers obtain economic benefit (A3) as an incentive when they are engaging in SCB transactions. Economic benefits motivate consumers to waste less. Advertising appeal (C10) perceives the importance of SCB in consumers’ opinions about an issue. Advertising appeals also motivate consumers’ environmental-friendly consumption behavior through specific and detailed messages that contain explanations that are credible and memorable [38]. Price (C11) is the level of financial and psychological risk that consumers should consider during their consumption [6,39]. Consumer decisions are also based on price and return policy (refund rate and return period) when determining whether to buy the product and which product to buy among the available alternatives [40]. However, consumers who want to treat sustainability as a priority factor have additional factors to consider with regard to their food choices [3].
Social impact (A4) is a complex form of sustainability and has rarely been considered with respect to SCB [6,15]. Consumers influence other consumers because they have a positive sharing experience as information becomes a purchase intention [41]. Reputation (C12) is public opinion based on a third party’s collective evaluation of the level of service and honesty during online transactions. Response rate (C13) is a service’s willingness, ability, and commitment to deliver high-quality service that enhances consumer satisfaction. Social consumption motivation (C14) aligns with social status and is related to perceived and actual judgements from consumers’ significant peers who acquire possessions to socially display their self-achievements and happiness to maximize their social status [6]. However, there is lack of motivation among consumers for adopting pro-environmental consumption habits [3]. Benefit (C15) is what they obtain from implementing sustainable consumption, such as reduced environmental problems [9].
SET proposes that consumers who are involved in an exchange relationship and receive social and economic benefit from the exchange relationship are inclined to express decent environmental responses (A5). Particularly, environmental attitude (C16) reflects individual beliefs regarding the consequences of SCB. Environmental knowledge (C17) is information about environmental concepts, environmental problems, and strategies to solve the problems. Consumers who have more information show that they have more knowledge [9]. Environmental concern (C18) denotes the orientation of individuals towards the environment and their level of concern with the environment. Environmental responsibility (C19) is the growth of responsibility perception that significantly increases consumers’ readiness to engage in green purchasing behavior. The proposed attributes are presented in Table 1.

3. Methods

The background of food industry in Indonesia is presented, and the Delphi method and fuzzy DEMATEL are explained.

3.1. Industrial Background

Indonesia’s food industry has been growing rapidly because of its significant contribution to the national economy. Indonesia has a population of approximately 267 million people, making it one of the largest markets for the food industry in South East Asia. The country is developing rapidly, and an increase in the number of office workers has subsequently led to a growth in both disposable income and household consumption [1]. These conditions have also been followed by increasing consumption and unsustainability of food products. The food industry fulfils consumer needs and rarely considers environmental effects such as pollution, scarcity of natural resources, and environmental degradation. Consumers’ decisions are based on an eagerness to consume certain products rather than on their environmental knowledge about saving future generations. In the process, there is a lack of sustainable knowledge during consumption, and the food industry is responsible for educating consumers about sustainable consumption behavior. Consuming foods in a sustainable way is becoming one of the most popular ways of solving environmental problems. Consumers who are engaged in such behavior show respect for the environment.
However, the growth of the Indonesia food industry is having an impact on the environment. Rising incomes among the growing middle class and millennialism, changes in lifestyles due to their large number and unique consumption behavior. Indonesia presents the sustainable consumption of food as having great potential for development in response to challenges with unsustainability (e.g., environmental pollution, scarcity of natural resources, and environmental degradation). For related reasons, social, economic, environmental, consumer demographic and consumer behavior have been subjected to considerable sustainability consumption behavior.

3.2. Delphi Method

The Delphi method is to categorize the knowledge and abilities of a group of experts in a unique objective develop a comprehensive set of attributes [19]. Hsu and Sandford [33] applied this method to determine, expose and explore settlements in different judgements, grouping unorganized attributes by initiating the respondents. Von Bergner and Lohmann [32] stated that the method is suitable for exploratory qualitative study to inquire about experts’ sentiments regarding novel of ideas or complex problems by conducting several questionnaires and controlled feedback. This study uses face-to-face interviews for information gathering in the Delphi method. The attributes are derived from the literature and validated by industrial experts. The attributes were collected by reviewing the related literature to secure agreement among respondents, with the experts being requested to confirm the importance of the attribute using a nominal YES/NO scale. Agreement on the inclusion of indicators was based on a 75% or higher consensus score [20].

3.3. Fuzzy DEMATEL

The DEMATEL is an effective tool to resolve complex interrelationship problems where the interrelationships among cause and effect attributes are transformed [21,42]. Fuzzy DEMATEL uses defuzzification to transform qualitative information into fuzzy linguistic information. The process is to obtain crisp values from triangular fuzzy numbers (TFN). The left and right values are determined by the minimum and maximum numbers and are transformed into crisp values [43]. Fuzzy membership functions e ˜ i j k = e ˜ 1 i j k , e ˜ 2 i j k , e ˜ 3 i j k are used to compute the total weighted values. The crisp values are displayed in a matrix of total direct relation for mapping a diagram to simplify analytical results. The cause and effect groups that contain certain attributes represent the structured interrelationship and effects. Therefore, a set of attributes is proposed, F = f 1 , f 2 , f 3 , , f n , certain pairwise interrelationships is used to create the mathematical relation.
This study uses a linguistic scale of VL (very low influence), L (low influence), M (moderate influence), HI (high influence), and VHI (very high influence); see Table 2. Assuming that there are k members in the decision group, the assessment of e ˜ i j k , denotes the fuzzy weight of attribute i t h which affects the attribute j t h and is assessed by evaluators k t h .
The fuzzy numbers are normalized as:
F = f e ˜ 1 i j   k ,   f e ˜ 2 i j k , f e ˜ 3 i j k = e 1 i j k m i n e 1 i j k Δ ,   e 2 i j k m i n e 2 i j k Δ ,   e 3 i j k m i n e 3 i j k Δ
where Δ = m a x e 3 i j k m i n e .
The left l v and right r v normalized values are computed using:
( l v i j n ,   r v i j n ) = ( f e 2 i j k 1 + f e 2 i j k f e 1 i j k   , f e 3 i j k 1 + f e 3 i j k f e 2 i j k
The total normalized crisp values c v is generated as:
c v i j k = [ l v i j k 1 l v i j k + ( r v i j k ) 2 ( 1 l v i j k + r v i j k )
The synthetic values notation to accumulate the individual perceptiveness from k respondents is adopted.
e ˜ i j k = ( c v i j 1 + c v i j 2 + c v i j 3 + + c v i j 3 ) k
The initial matrix of direct relation I M is a n × n matrix that is acquired by pairwise comparison. In this matrix, e ˜ i j k is assigned as the level to which attribute i affects attribute j , amended as I M = e ˜ i j k n × n .
The normalized direct relation matrix U is created using,
U = τ I M   τ = 1 j = 1 k 1 i k m a x e ˜ i j k
From the normalized direct relation matrix, the interrelationship matrix W is obtained by:
W = U I U 1
where W refers as w i j n × n   i , j = 1 , 2 , n .
The values of the driving power α and dependence power β are obtained from the sum of rows’ and columns’ values of the interrelationship matrix by applying the following equations.
α = [ i 1 n w i j ] n × n = w i n × 1
β = [ j 1 n w i j ] n × n = w j 1 × n
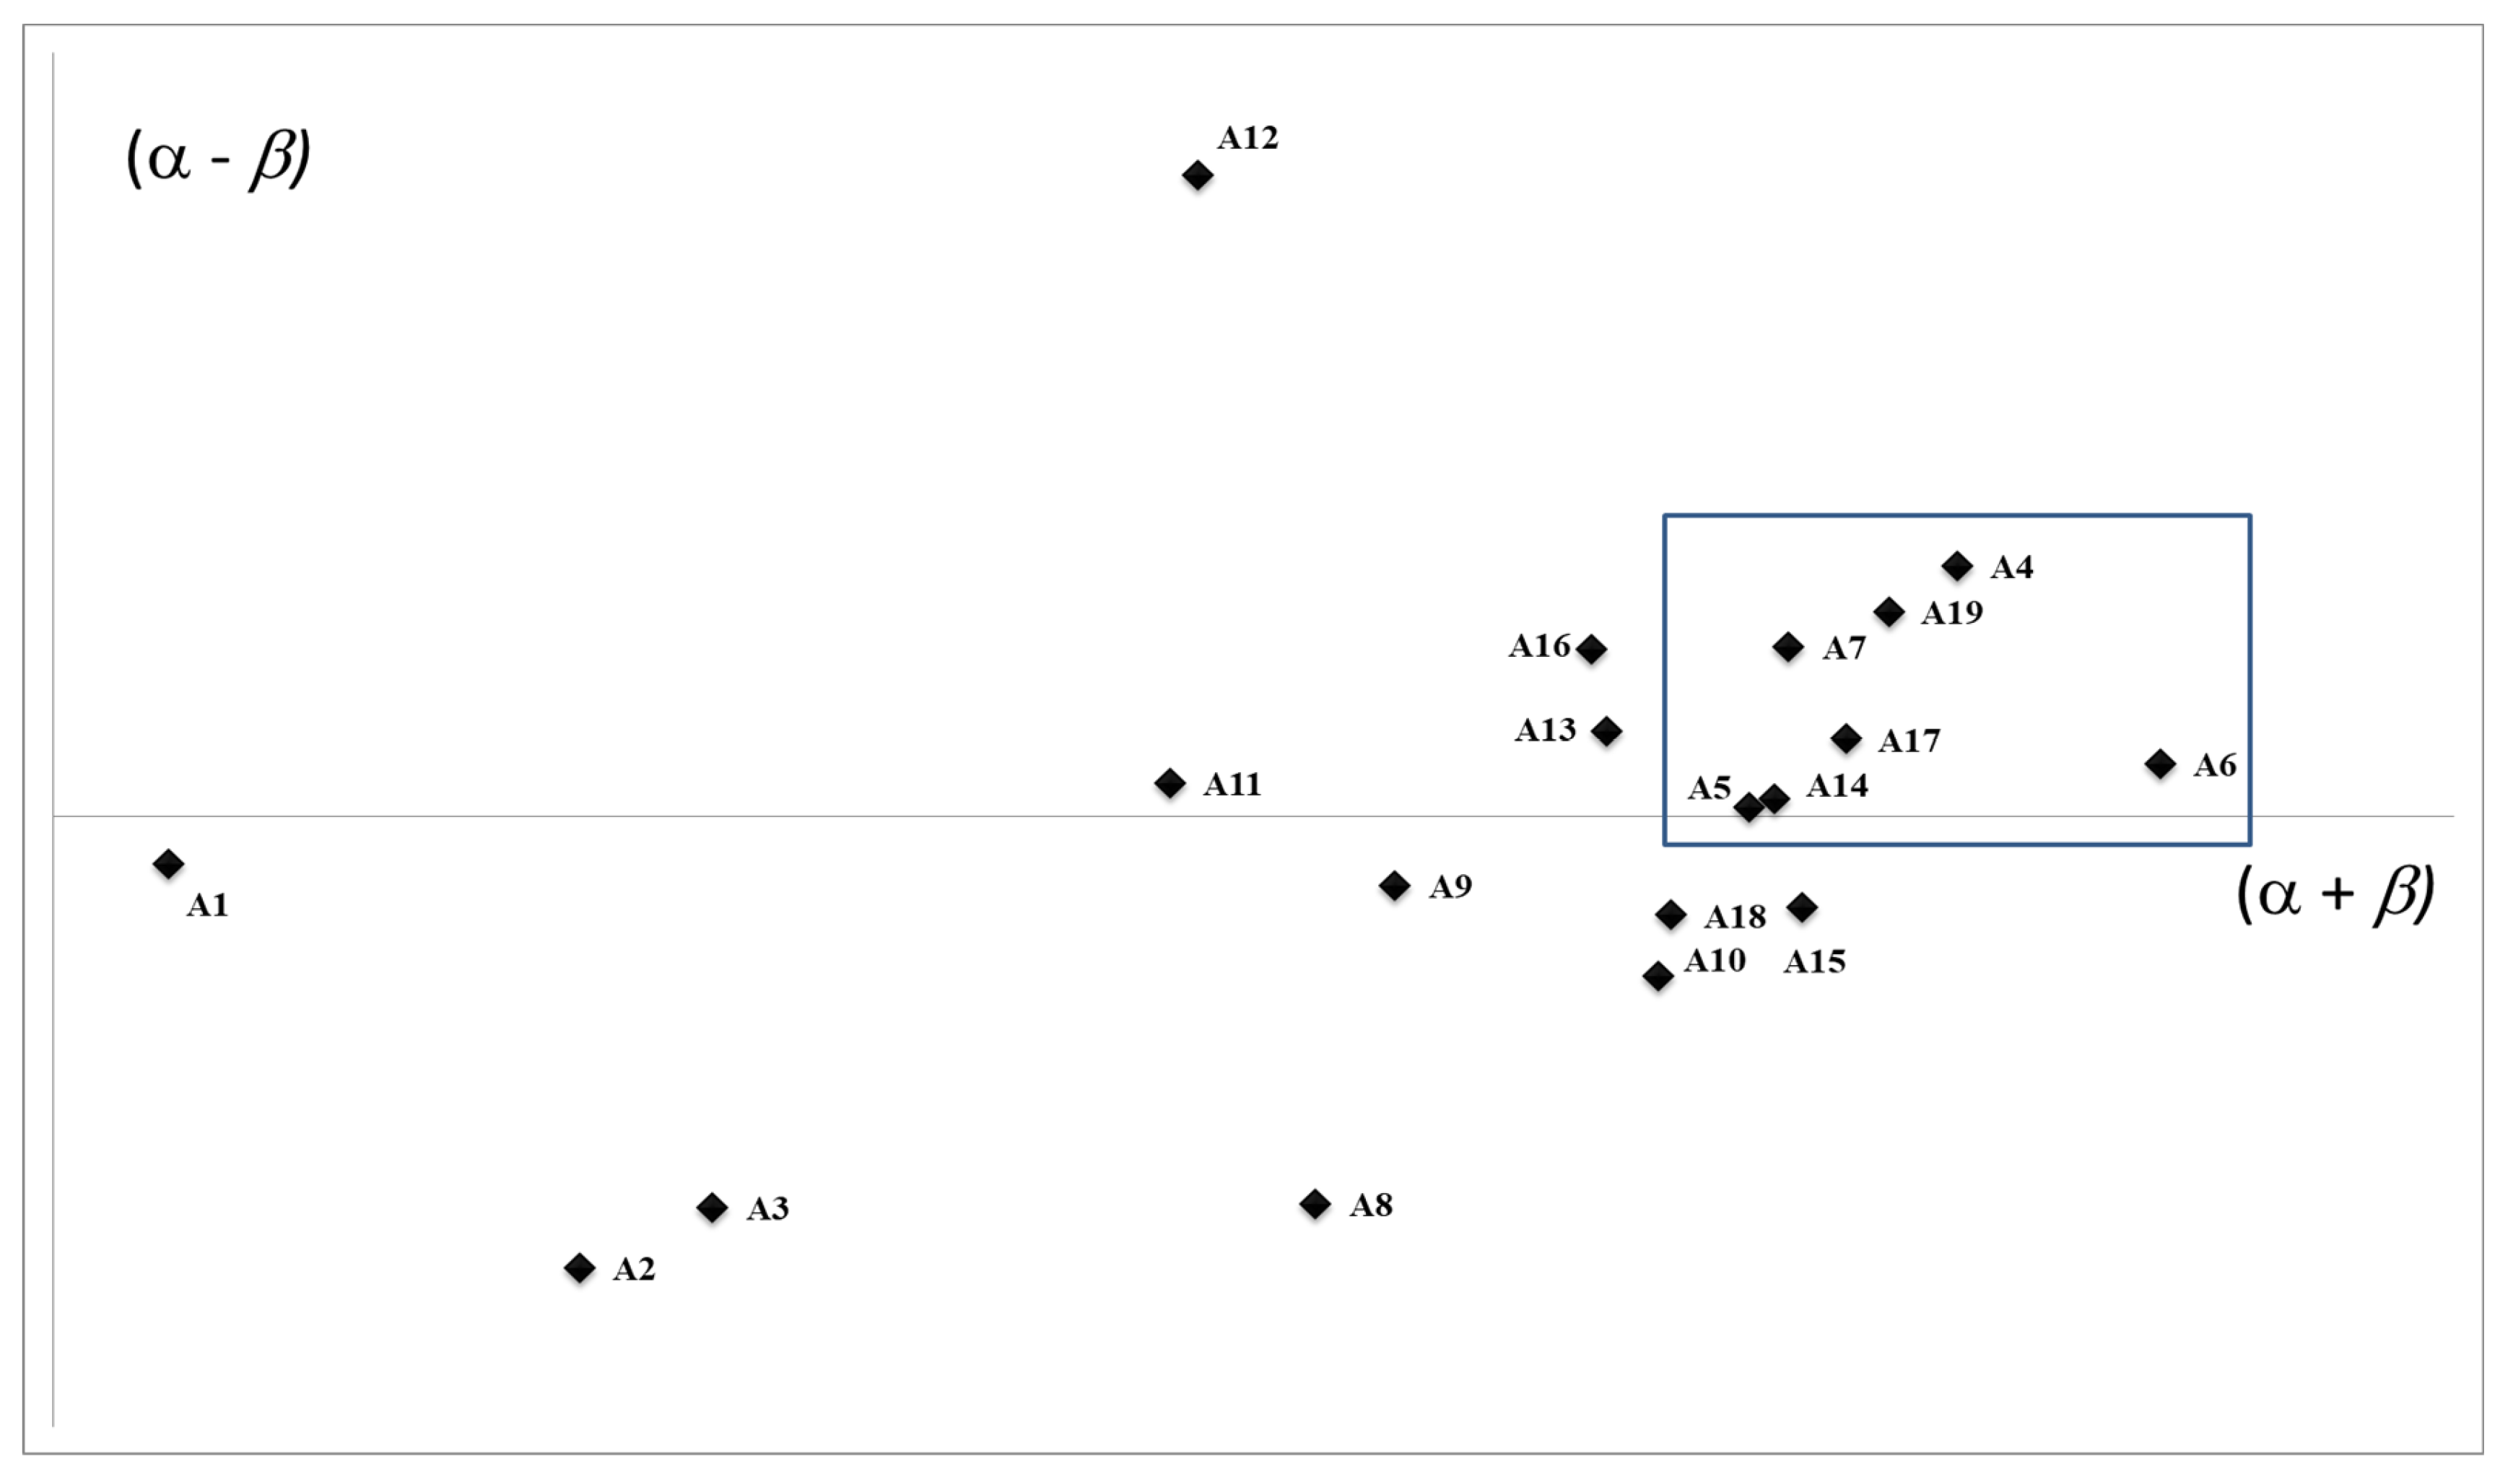
The attributes are positioned in a cause—effect diagram by adopting α   + β ,   α   β   , which are in turn horizontal and vertical axes. (α + β) exhibits the importance of attributes, indicating that the higher the values of (α + β) are, the more important function of the attributes is. α   β classifies the attributes into cause and effect groups by considering α   β values as positive or negative. If α   β is positive, the attribute belongs to the cause group; if the value is negative, it is in the effect group.

3.4. Choquet Integral

There are need to pre-allocation the expert weights and solve incomplete preference interrelations when the expert evaluation is unknown and their judgement favoritisms are linguistic and uncertainty [23]. The unweighted supermatrix is obtained to deal with the relationship of feedback the criteria [22,23]. Once the matrix is unable to imitate to the column stochastic determinant, the expert is required to provide the weights to adjust it as a weighted supermatrix. As a result, the gradual convergence of the interrelationship is obtained to accurate the relative weights among the criteria using:
P * = lim n P n
The choquet integral, as the non-additive fuzzy integral, is a numeric-based approach, which has been used for both pattern recognition and image segmentation. Adoption of a fuzzy integral in membership aggregation, rather than a traditional aggregation operator, leads to an important distinction as to how processes of fuzzy integration are utilized. The success of a Choquet integral depends on an appropriate representation of fuzzy measures, which captures the importance of individual criterion or their combination [44,45]. Sugeno [46] introduced monotonic and non-additive fuzzy integrals to express the grades of importance for attributes, which is useful to model the preference structure. Fuzzy measure can be explicated as the subjective importance of a criterion during the evaluation process [23]. Sugeno and Terano [47] incorporated the λ-additive axiom to reduce the difficulty of collecting information. In fuzzy measure space (X, β, g), let λ ( 1 , ) . If A β , B β , A B = ϕ , then the fuzzy measure g is λ-additive. This particular fuzzy measure is termed as λ-fuzzy measure because it has to satisfy λ-additively, named Sugeno measure.
Assume that X = {x1, x2, x3, …, xn} and P(X) is the power set of X, the set function g: P(X) → [0, 1] is called a fuzzy measure, which is non-additive and preserves the following properties:
  • g ( ϕ ) = 0 ;
  • g(X) = 1;
  • if A , B P ( X ) and A B then g ( A ) g ( B ) (monotonicity);
  • In P(X), if A 1 A 2 A 3 A 4 , and U i = 1 A i P ( X ) , then l i m i g ( A i ) = g ( U i = 1 A i ) (continuity from below);
  • In P(X), if A 1 A 2 A 3 A 4 , and i = 1 A i P ( X ) , then l i m i g ( A i ) = g ( i = 1 A i ) (continuity from above).
In addition, λ-fuzzy measure has the following additional properties:
g ( A B ) = g ( A ) + g ( B ) + λ g ( A ) g ( B )
where λ > 0 for all A , B P ( X ) and A B = ϕ . If X is a finite set, then U i = 1 n A i = X . The λ-fuzzy measure g satisfies the following:
g ( X ) = g ( U i = 1 n A i ) = 1 λ i = 1 n 1 + λ g ( A i ) 1 i = 1 n g ( A i ) i f   λ 0 , i f   λ = 0 ,
where A i A j = ϕ for all i, j = 1, 2, 3, …, n and i j . In Equation (14), λ 0 indicates that the λ-fuzzy measure g is non-additive; otherwise, the λ-fuzzy measure g is additive and there is no interaction between Ai and Aj for i j . The interaction means there is information fusion between criteria [45]. λ > 0 implies that g ( A B ) = g ( A ) + g ( B ) and the set {A, B} has multiplicative effect, whereas λ < 0 indicates the substitutive effect of the set {A, B} [48]. In fuzzy measure space (X, β, g), let h be a measurable function from X to [0, 1], the definition of the fuzzy integral of h over A with respect to g is
A h ( x ) d g = sup α [ 0 , 1 ] [ α g ( A F α ) ]
where Fα = {x| h(x)α}. A is a domain of fuzzy integral. When A = X, the fuzzy integral can be denoted by ∫hdg. Consider a fuzzy measure g of (X, P(X)) and X is a finite set here. Let h: X → [0, 1] and assume without loss of generality that the function h(xi) is monotonically decreasing with respect to i, for instance h(x1)≥ h(x2)≥…≥ h(xn). To assure that the elements in X be renumbered, we acquire the following equation:
h ( x ) g = i = 1 n [ h ( x i ) g ( H i )
where H = (x1, x2,…….., xi), i = 1, 2,…,n. In practice, h can be regarded as the performance on a particular attribute for the criteria; g presents the grade of subjective importance of each attribute. The fuzzy integral of h(x) with respect to 
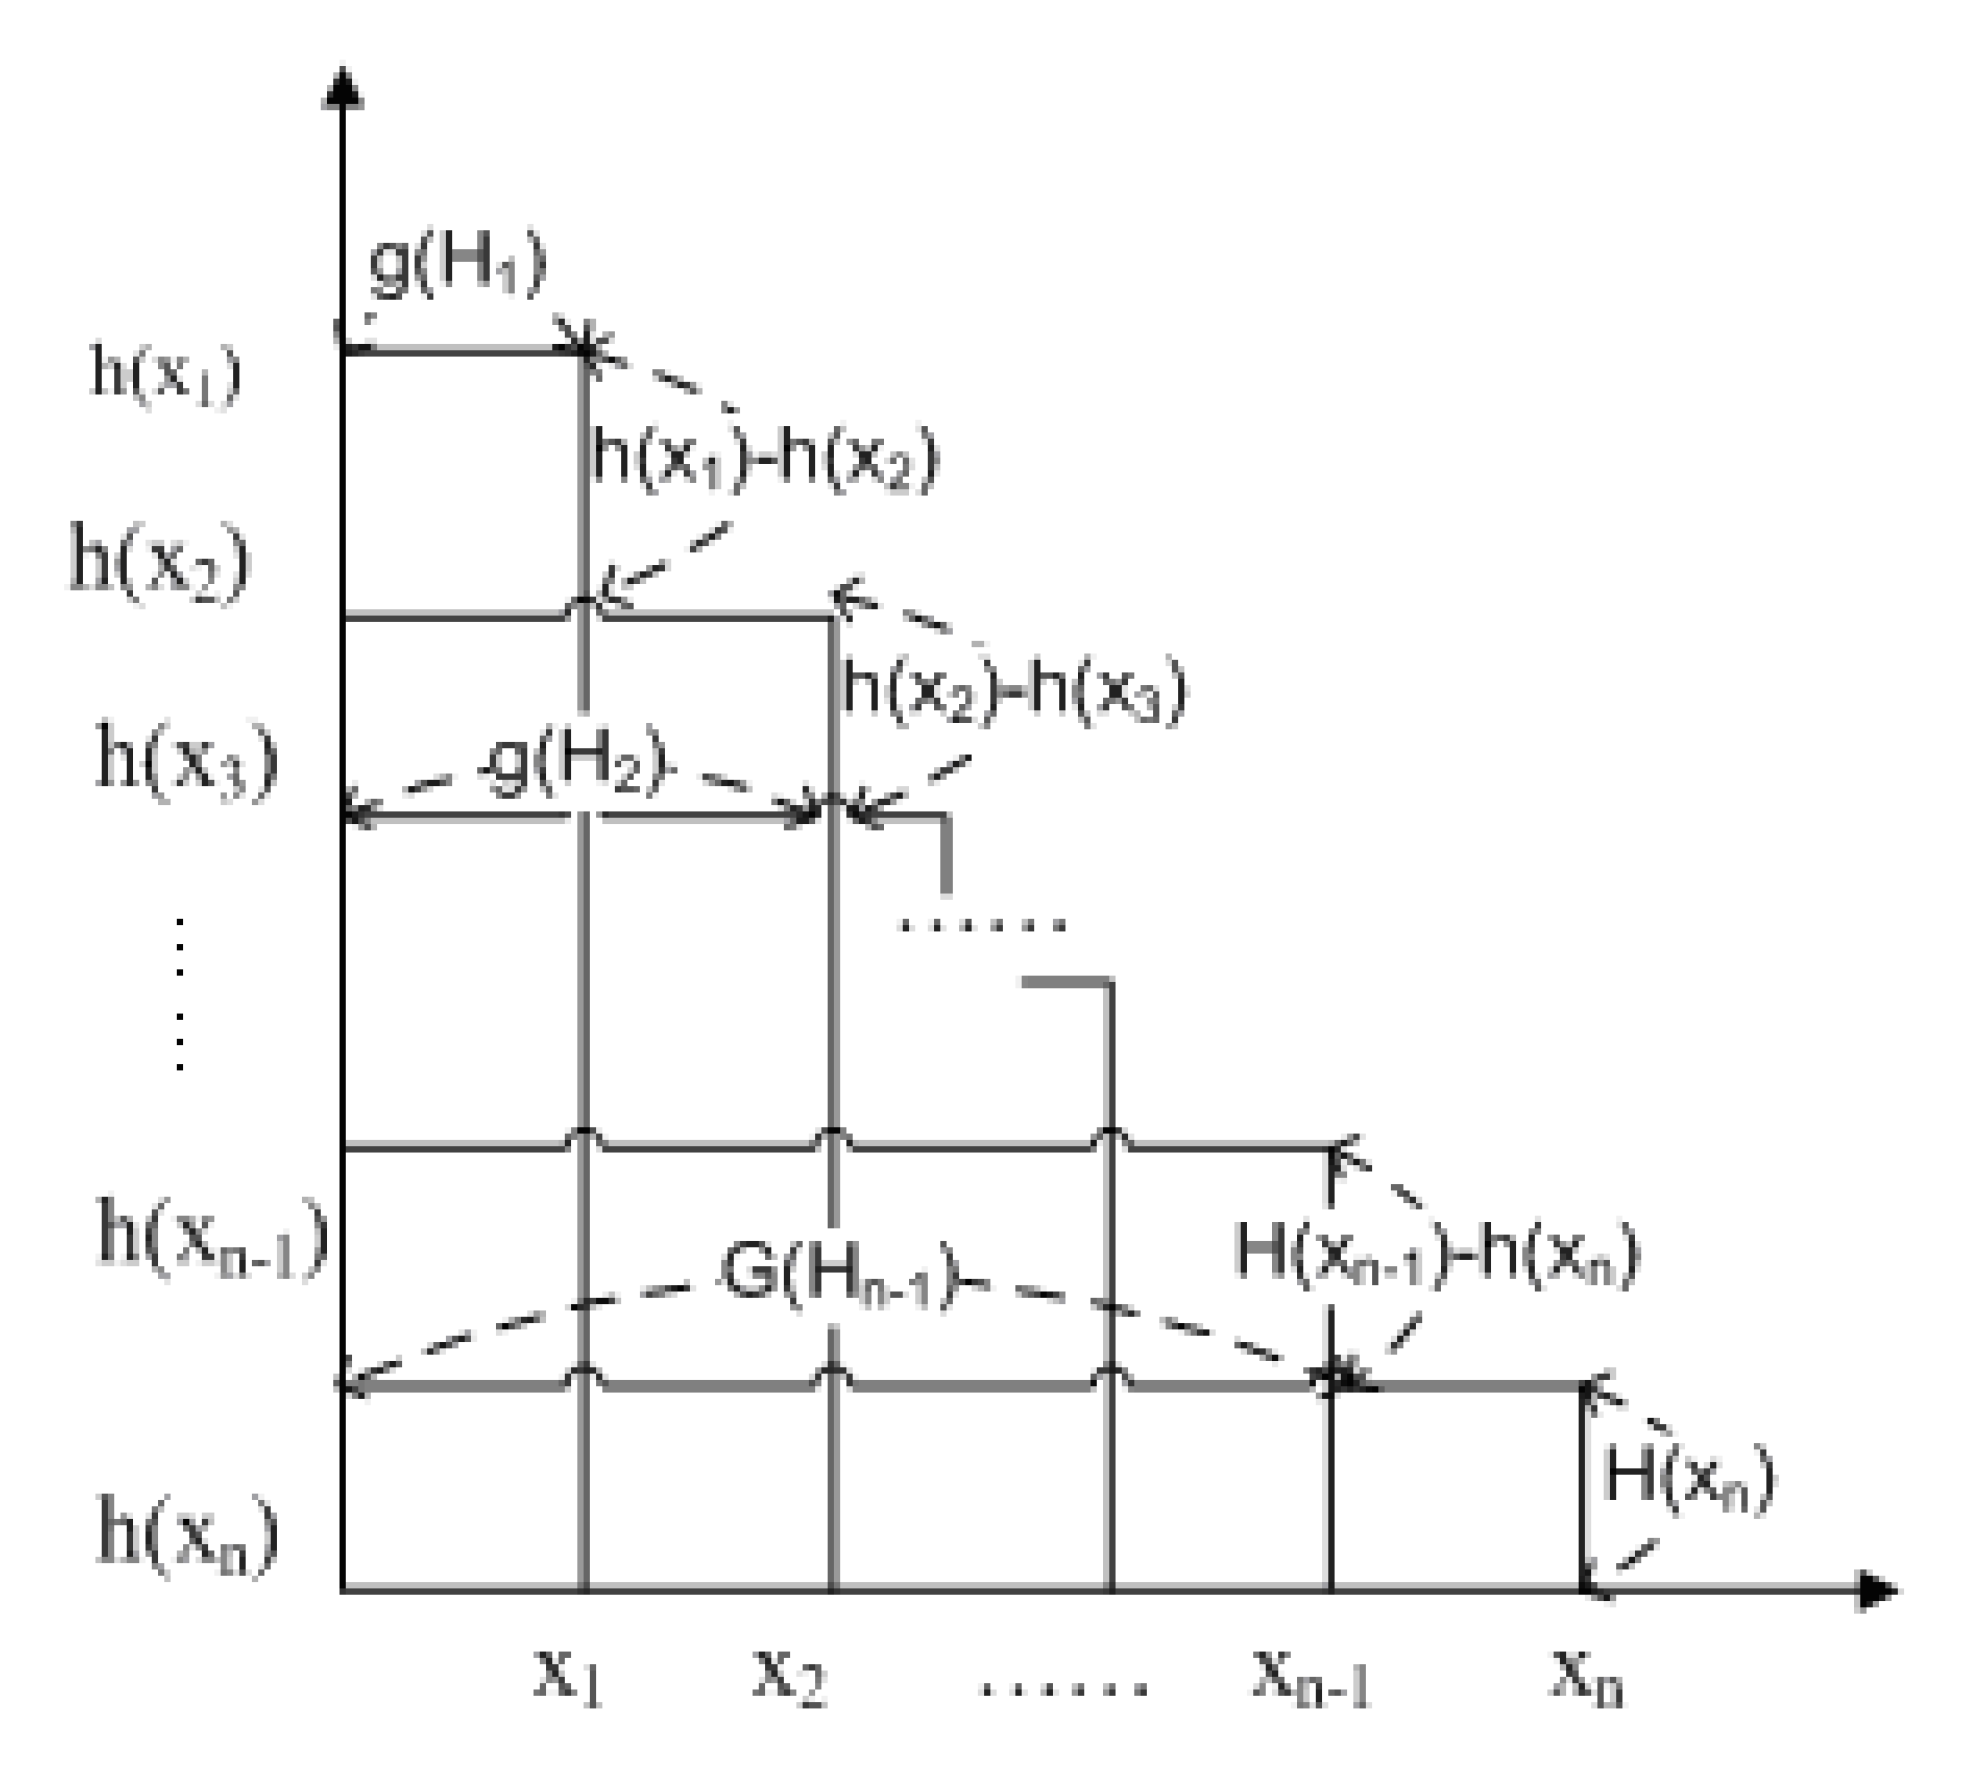
g gives the overall assessment of the attribute. To simply the calculation, the same fuzzy measure of choquet integral is expressed as follow:
( c ) h d g = h ( x n ) g ( H n ) + [ h ( x n 1 ) h ( x n ) ] g ( H n 1 ) + + [ h ( x 1 ) h ( x 2 ) ] g ( H i )
where 0 h ( x 1 ) h ( x 2 ) h ( x n ) 1 , h ( x 0 ) = 0 and Hi = {x(i),……, x(n)}. In literature, the fuzzy integral defined by ∫hdg is called “choquet integral.” The basic concept can be illustrated in Figure 1. The fuzzy integral measurement model needs not assume independency among alternatives; it can, therefore, be used in nonlinear situations.

3.5. Data Collection and Proposed Analysis Steps

This study uses the opinions of thirty experts with more than 10 years extensive experience in the field to assess the food industry. A team of 30 experts consisting of 16 experts from academia and 14 professionals from the practical area is approached. An online discussion was organized to acquire the experts’ judgements and confirm their agreement with the significant attributes that need to define SCB structure based on the Delphi method. Then the questionnaire is delivered to collect their linguistic evaluations on the SCB attributes and assure the analysis authenticity of Fuzzy DEMATEL and Choquet integral. The experts’ information is presented in Appendix A.
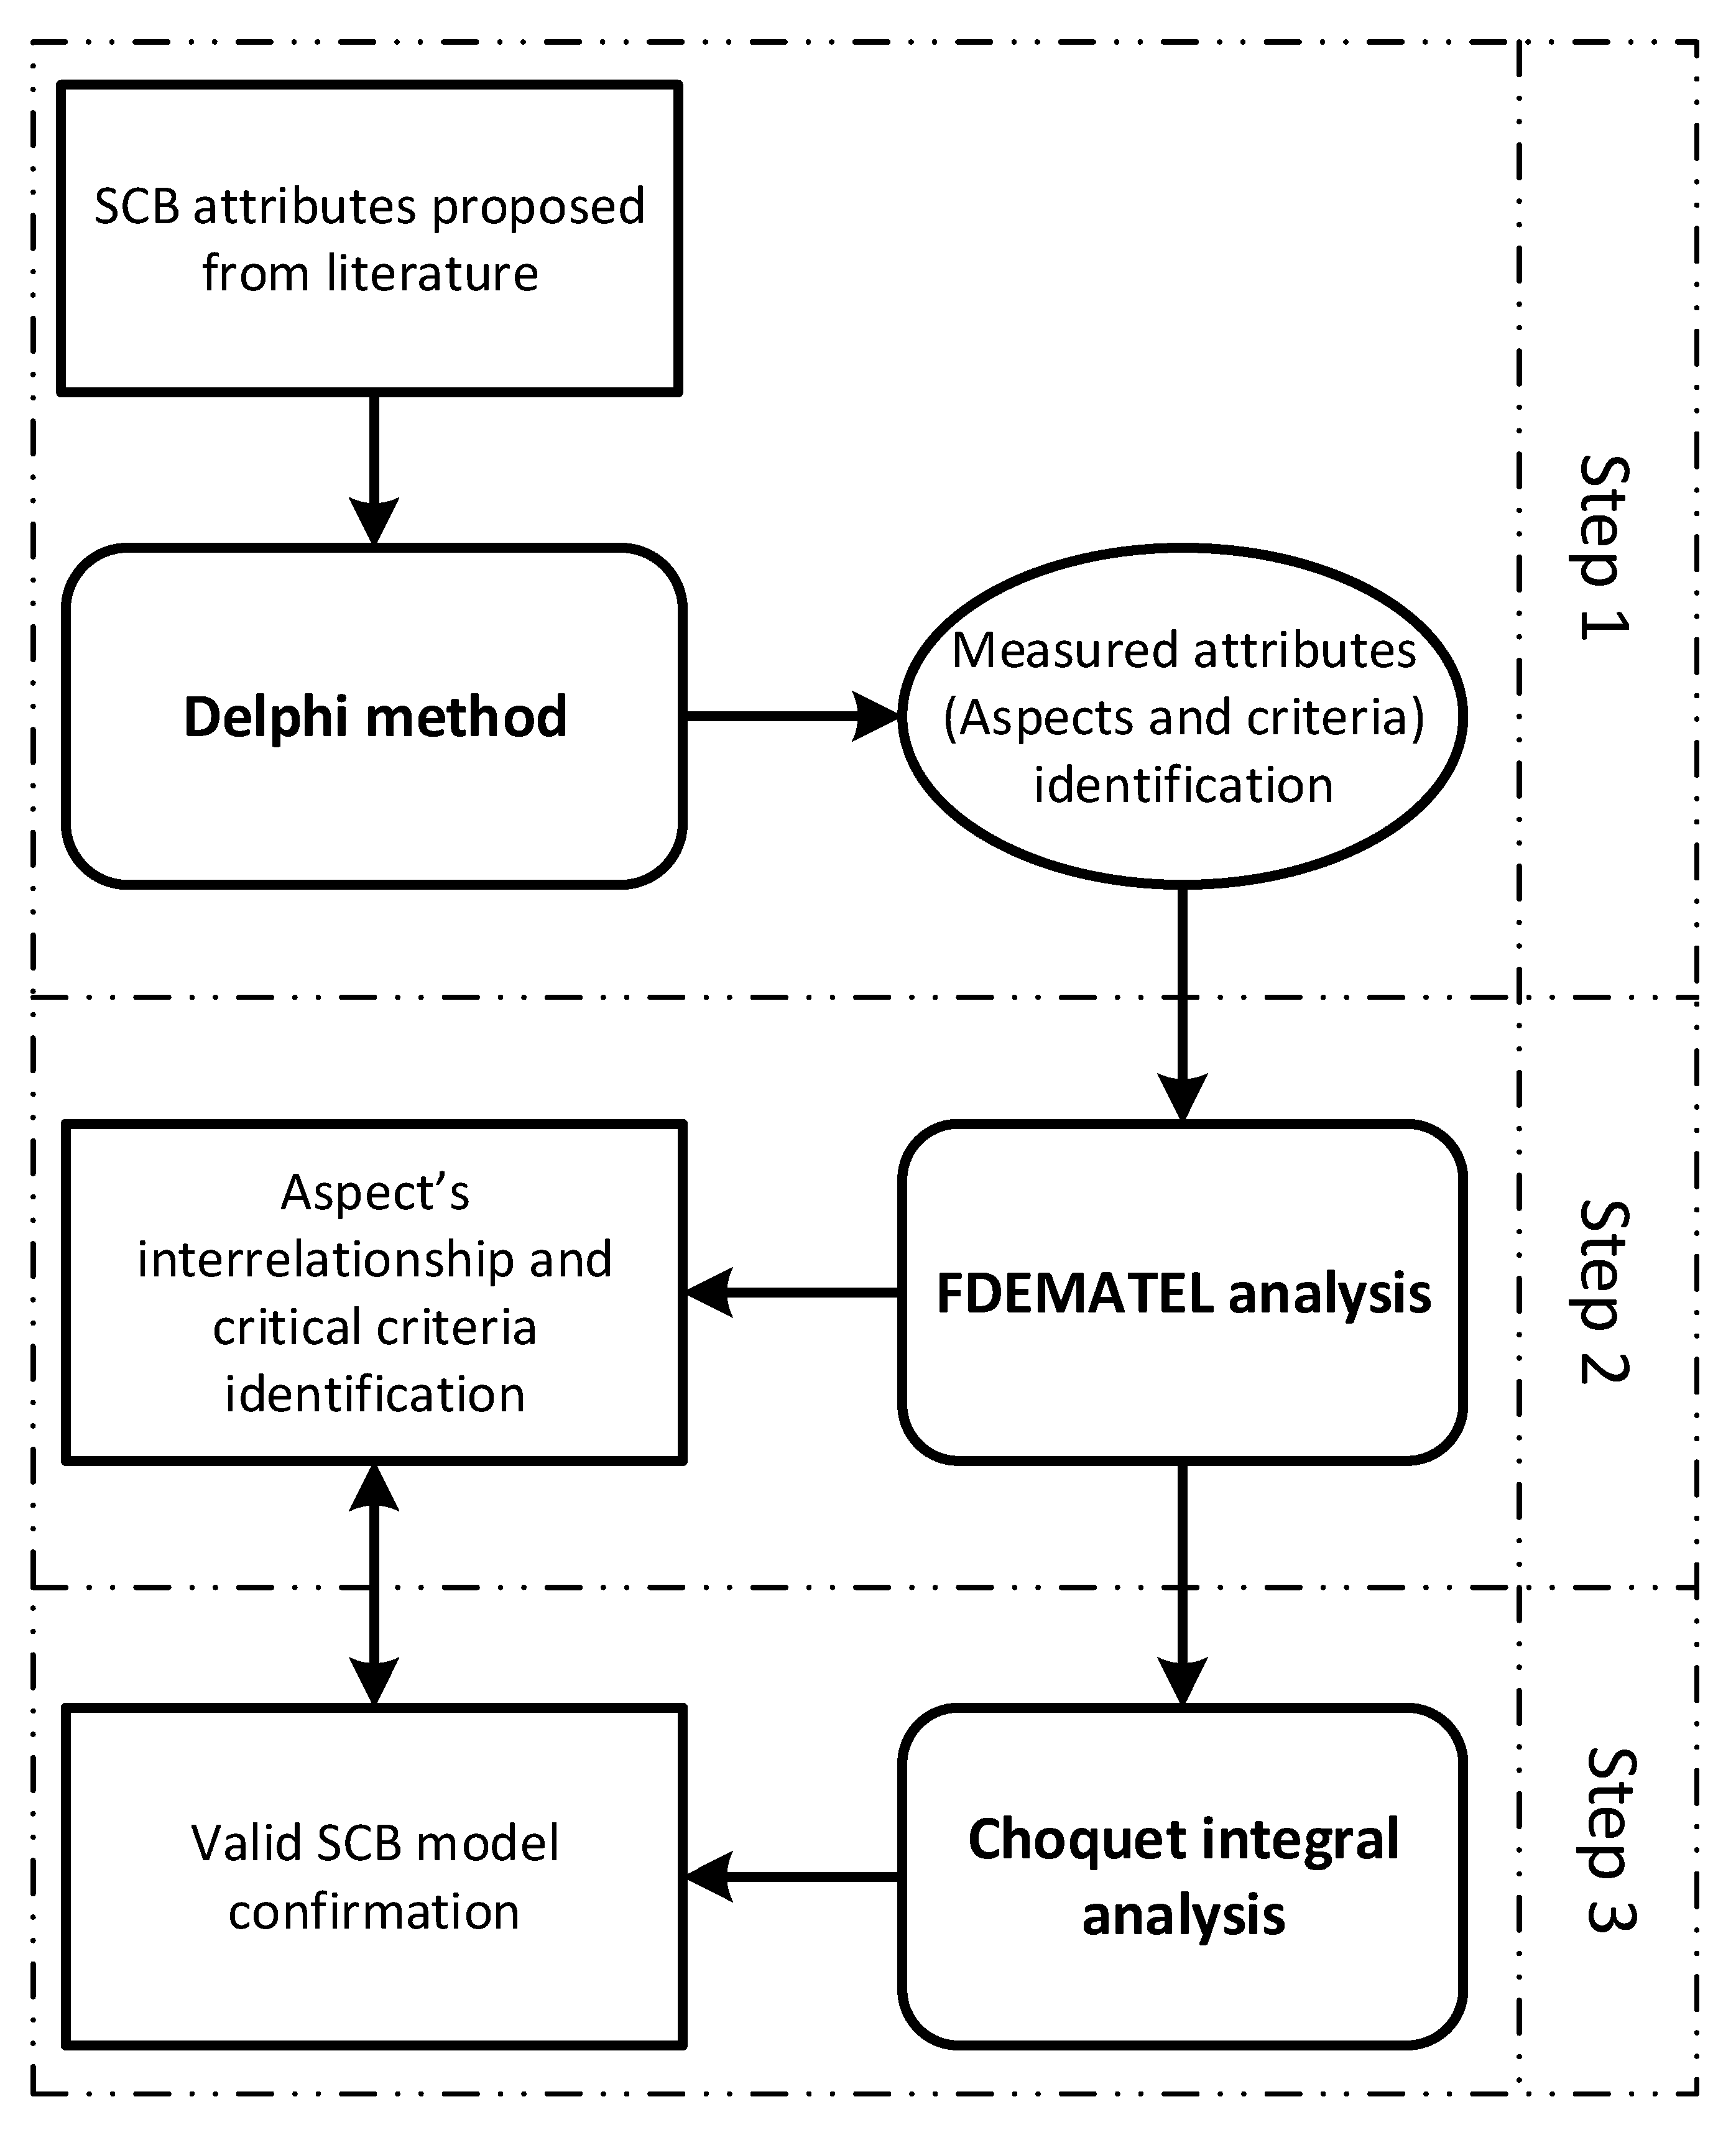
The analysis steps were proposed, as shown in Figure 2.
  • The SCB attributes is identified in the literature the confirmed with the expect by using the Delphi method.
  • The experts’ linguistic evaluation on SCB attributes is collected by employing the questionnaire, which is formed based on the confirmable attributes. Fuzzy DEMATEL is used to develop valid measures and a causal model of SCB.
  • Choquet integral is utilized to eliminate the expert subjective problems and provides higher insight on validating hierarchical structure.

4. Results

The results of utilizing the Delphi method, fuzzy DEMATEL and Choquet integral for aspects and criteria are presented in this section.

4.1. Delphi Method

This study collected the SBC attributes by reviewing the literature. These attributes are used to acquire the experts’ judgements. The experts were invited to confirm their agreement with the significant attributes that need to define SCB. The results indicate that there is a set of 5 aspects and 19 criteria, including consumer demographics (A1), consumer behavior (A2), social impact (A3), economic benefits (A4), environmental responses (A5), which are confirmed to be valid for the fuzzy DEMATEL analysis, as shown in Table 1.

4.2. Fuzzy-DEMATEL Analysis

The collected data from the experts come in linguistic forms. The evaluations of interrelationships among the aspects are therefore presented using a linguistic scale from Table 2. These linguistic data are transformed into triangular fuzzy numbers, as shown in Table 3. However, these fuzzy numbers are not applicable for computing, as the vague meanings and total normalized crisp value for aspects must be aggregated from 6 experts, as shown in Table 4. The DEMATEL is used to assess interrelationships through a causal-effect diagram. The aspects are set into an interrelationship matrix, and this matrix is transformed into cause-effect interrelationships, as seen in Table 5.
The values of the driving power α and dependence power β are obtained from the sum of rows’ and columns’ values of the interrelationship matrix, as shown in Table 5. The mapping of [(α + β), (α − β)] is transferred into a cause -effect diagram as in Figure 3. The result shows that consumer behavior (A2), economic benefits (A3) and social impact (A4) belong to the cause group, while consumer demographics (A1) and environmental responses (A5) are included in the effect group. In particular, consumer behavior (A2) and social impact (A4) are the two causal aspects that should receive critical attention since they have the strongest interrelation effect among the SCB model.
Similarly, the same procedure is employed for the criteria. 19 criteria are involved. The total normalized crisp values for criteria are computed, as shown in Table 6. The interrelationship matrix is generated as in Table 7. The matrix is converted into cause-effect interrelationships, which are shown in Table 8. The causal diagram is drawn as seen in Figure 4.
Figure 4 shows that the criteria belonging to the causal group include C4, C5, C6, C7, C11, C12, C13, C14, C16, and C17. The effect group comprises C1, C2, C3, C8, C9, C10, C15, C18, and C19. For further implication, a group of seven causal criteria consisting of perceived consumer effectiveness (C6), trust from consumer (C4), environmental responsibility (C19), environmental knowledge (C17), behavioral intention (C7), social consumption motivation (C14), and build emotion (C5), which has the highest importance level, are chosen for discussion.

4.3. Choquet Integral

The weighted criteria can be obtained from the integration of determinants from the converged supermatrix. The integration weight results are through normalization process. The resulted global weights are shown in Table 9.
The choquet integral is applied to provides with functionality and reliability for determining best alternatives by solving k-fuzzy measure, where the λ values are limited to [0, 1]. The choquet integral ( c ) h d g is employed to obtain the aggregated value for each criterion based on its global weigh. The overall Choquet integral weight index for aspects are showed in Table 10. Figure 5 shows the validity between the aspect and criteria in this study proposed hierarchical framework as there is no differences between λ = 0 and λ = 1. Further, the A2 is allocated at the top in the diagram follows by the A3 and A4 are above the average value consisting with the DEMATEL result confirms the result are valid and reliable, and free from biases judgments and expert subjective problems.

5. Implications

This section addresses the theoretical and managerial implications identified by this study. Contributions to both the theoretical literature and practice are presented.

5.1. Theoretical Implications

This study contributes to the literature by exploring the causal SCB aspects, and the results provide insights that could prove useful in addressing SET. Social impact and consumer behaviour should be regarded as important during the SCB process.
This study provides empirical evidence suggesting that consumer behavior is a causal attribute. Consumer behavior impacts the effect group in various ways because consumers’ behavior may have high place attachment for improving quality of life. On the theoretical level, consumer behavior as an individual’s motivation in his/her plan or decision to exert effort in performing a specific sustainability behavior. This create a pros/cons as contradicting consumer’s action toward sustainability is driven by economic benefit and social impacts [7,17]. In this study, consumers’ attitudes affect different dimensions of sustainable consumer behavior through the economic benefits and social impacts, especially with regard to the environment [8,9,11]. Consumer behavior has a strong relationship with social impact for achieving sustainability consumption behavior [25,36]. These results also show that consumers learn such behavior from their mothers, which means that consumers in our environment and society also play an important role because their actions are imitated [3,37]. Consumer demographic is interrelated to the consumer behavior and consumer behavior producing a significant relationship to environmental responses. This SCB model is providing an insight view for a hierarchical model in qualitative information.
The result shows that social impact, belonging to the causal group, has a critical effect on other aspects. The social context is important for impacting SCB, especially in facilitating sustainability practices in which consumer are embedded with social norms. Thus, this study suggests that these aspects can be used to secure a sustainable competitive advantage by motivating and benefiting consumers who engage in sustainable food consumption and by bringing other resources together. Social approaches generate consumer behavior and thus help in developing more sustainable forms of consumption behavior that directly improve SCB [13,15]. Consumer behaviour is also emphasized because consumer behavior could easily be facilitated by social or peer influence to conform to pressure from others [16,41]. Consumers may observe others’ behavior and imitate their actions to as responding to the environmental action [4,13]. Consumers have another reason to show that they desire to build or enhance their self-identity regardless of affluence levels and influence the behaviour of consumers.
Nevertheless, economic benefits are also an important aspect in SCB causal interrelationships. Consumers obtain economic benefits through transaction incentives. Consumers compare benefits and costs to motivate them to be less wasteful. Increasing consumption will contribute to economic growth. However, consumption is either directly or indirectly the source of most environmental issues, and it also plays a major role in creating many social and financial problems [3]. Since there is a high level of financial and phycological and social risk, these problems can be avoided based on the good perceptions of consumers. Therefore, building and developing consumer-friendly trends from consumers and creating demand for green products in the market are needed. The government also participates in economic benefits by providing policy and regulation standards for incentives. Cooperation between the government, manufacturers and consumers is required to implement SCB.

5.2. Managerial Implications

SCB criteria are identified to provide managerial insights for decision makers. Within this context, these criteria are helping to improve the sustainability of Indonesia’s food industry and are already being explored.
Perceived consumer effectiveness (C6) helps to connect and improve SCB. Consumers believe in the effort they make regarding different solutions to existing problems. From a positive point of view, individual beliefs about chosen actions can produce a positive or negative change in the situation. This criterion affects specific consumer behavior by indulging and supplying a positive attitude regarding SCB and the environment, which helps to explain behavior. Consumers who have higher perceived consumer effectiveness are generally more environmentally conscious and have greater concern for ethics. Environmental and social information about food products is personally relevant to such individuals. Therefore, different thinking to enhance the perception of effectiveness is useful. Some consumers have made extensive efforts to reduce environmental harm, while others believe that their effort cannot make any difference. Making consumers believe that their actions might help solve an existing problem and will possibly have an effect on reducing resource challenges.
Consumer trust (C4) is interest in the organic food consumption. In an industry context, trust bring positive or negative effects for SCB development and continuation during individual decisions. A lack of trust from consumers generates inconsistency in food consumption. Trust is also not easy to manage because consumers are varied and lack knowledge about the components inside products. When consumers consume food products, they should believe that the product effectively fulfils a function and all of the process was from an organic supply chain. Firms should convince consumers about the benefit or advantages that they obtain when consuming food, such as environmental or health benefits, and firms should fully convince them that products are produced in an environmentally friendly way. Trust can also be obtained from effective communication campaigns or activities in practical terms or with regard to their elite image (expensive, special), authenticity, healthiness, social influence, naturalness, and quality. Effective verbal communication about certification and product composition can impact consumers’ trust and shape consumption behavior in favour of sustainable consumption.
Environmental responsibility (C19) explains the sense of responsibility to protect the environment, which is always based on the perception of consequence. Increasing responsibility among consumer can help promote SCB. Consumers show their environmental responsibility through their lifestyle and sacrifices, which can help make the world more sustainable by encouraging others to participate in saving the environment. Consumers can also obtain information on environmental problems caused by human consumption and use it to change their consumption for the better. Since responsibility is usually based on self-interest, needs, legal obligations, consumer desires, motivation, positive influence on the environment and value, firms can campaign to increase environmental awareness and use the threat of the endangered environment to enhance environment responsibility.
Environmental knowledge (C17) assumed to motivate SCB. Consumers have environmental knowledge that influences on his/her and others’ environmental responses, attitudes and participation towards sustainable consumption and may be used as a solution for the environmental problems. Therefore, more information provided would lead to increased consumer knowledge, which in turn might strengthen consumers’ trust in products and reinforce the attitude-behavior relationship. Conversely, a lack of knowledge prevents consumers from translating their concerns into the actual purchase of products. A deeper understanding of the consequences of irresponsible consumption might prove to be more effective in causing consumers to shift towards sustainable consumption. Consequences can be appropriate to motivate their decision-making, as it relates to product purchases. Consumer knowledge about the cause and impact of pollution also leads to a level of awareness regarding their consumption consequences.
Behavioral intention (C7) shows the essential criteria to improve the performance of SCB. Consumers who have behavioral intention can perform a specific behavior for the conservation of the physical and social environment for future generations. Attitudes towards consumption behavior are considered for evaluating a particular behavior intention that leads to a specific behavior with certain consequences. Therefore, individuals tend to possess a favourable attitude when the outcomes are positively evaluated, and thus, consumers are likely to engage in that specific behavior. To encourage behavioral intention, firms should facilitate or constrain actions to make it easier for consumers to perform their behavior under social pressure.
Social consumption motivation (C14) causes someone to be willing to put extra effort into performing a specific behavior, such as carrying out various activities that become a responsibility and fulfilling an obligation in order to achieve social status. Social consumption motivation is about perceived and actual judgements from their significant peers; consumers acquire possessions to display their self-achievement and happiness in order to maximize their social status. Motivation can also show whether consumers are satisfied with the product they consumed and its influence on the environment, which can motivate them to engage in SCB. This study suggests that successful social consumption motivation encourages consumers to consider the environmental, economic and social aspects during the consumption process and provides inspiration to improve the situation for current and future generations. Therefore, firms should take note of the social environment that is creating the social motivation for their consumers to engage in sustainable consumption.
Consumer emotion (C5) reflects specific actions or behavior by generating feelings of social connection. Building positive emotions in consumers is important for firms throughout the industry as a new revolution to promote sustainable consumption. Nevertheless, a lack of building emotions results in the loss of consumers and elimination of participation in SCB. This study recommends that in building consumer emotions can increase their motivation to reduce SCB failure. Consumer emotion fulfils psychological needs, and positive emotions from their consumption attitude drive behavioural intention.

6. Conclusions

This study builds a hierarchical SCM model in qualitative information using Delphi method and fuzzy DEMATEL method to approach and explore the attributes that influence sustainable consumption in the Indonesian food industry and Choquet integral is used to eliminate the expert subjective problems and interactivity method, thus, provides the hierarchical insight for effectively addressing the aspects and criteria. From the SET interrelationship context, this study provides a valid set of five aspects and 19 criteria, including consumer demographics, consumer behavior, social impacts, economic benefits, and environmental responses. This study partially fulfills the gaps from consumer demographics and consumer behavior approach. The qualitiave information is hard to be transformed into comparable data. This study handles the qualitiave information and addresses the hierarchical and interrelationships in SCB model.
The results show that social impact and personal behaviour are the strongest causal aspects that improve SCB. As a part of exchange theory, these criteria influence SCB improvement through practice. The aspects explaining the social impacts are easily facilitated by personal behaviour, which influences consumers with regard to how they should behave to minimize waste and be efficient with resource use. Thus, social impact gives consumers the opportunity to imitate others’ behaviour and encourages them engage in SCB. Sustainable consumption behaviour leads to economic benefits, and consumers play an important role during implementation; their attitude towards SCB also originates from the benefits that are perceived to confirm their intention to practice sustainability. Perceived consumer effectiveness, trust from consumers, environmental responsibility, environmental knowledge, behavioural intention, social consumption motivation, and built emotion are found to be the leading criteria in approaching SCB. Consumers develop different solutions to their problems during their consumption, and their perception of effectiveness in reducing environmental harm leads to sustainable behaviour.
The contributions of this study are as follows. This study developed theoretical hierarchical SCB structure and a causal relationship model among the attributes; particularly, the consumer behaviour has influence on social impacts and environmental responses are with main causal relationships. Social impact gives consumers the opportunity to imitate others’ behavior and encourages them engage. SCB model leads to both economic and environmental benefits, and consumers play an important role during implementation to sustainability. In practices, the top important criteria are found to address the sustainable consumption behaviour improvement.
There are several limitations in this study. First, the proposed aspects and criteria are measured suing qualitative information with limited applicability in uncertainties. Future study might involve more quantitative data. The consumer demographical information might be exploring in the future studies. Second, the evaluation only within 30 experts. the future study might also enlarge the sample size to calibrate and justify the model, as well as could apply the sensitivity analysis to understand the customer perceptions under difference scenarios. Third, this study constructed its hierarchical framework based on the SCB theoretical background in food industry. Additional studies may extend the case to other industries or other countries to examine the practical differences between cases.

Author Contributions

T.-D.B. Conceptualization; original draft writing; review & editing; M.K.L. Original draft writing; resources; review and editing; R.Y.S. review and editing; M.O. Conceptualization; original draft Writing; M.-L.T. Conceptualization; resources; review and editing. All authors have read and agreed to the published version of the manuscript.

Funding

This study is partially supported by Ministry of Science and Technology, Taiwan (MOST 110-2221-E-468-010).

Institutional Review Board Statement

Not applicable.

Informed Consent Statement

Not applicable.

Data Availability Statement

Not applicable.

Conflicts of Interest

The authors declare no conflict of interest.

Appendix A. Respondents’ Demographic for FDM and FDEMATEL Result

Table A1. Respondents’ demographic for FDM and FDEMATEL result.
ExpertPositionEducation LevelsYears of ExperienceOrganization Type
(Academia/Practice)
1Business directorPhD18Practice
2Business directorMaster17Practice
3Sale ManagerMaster16Practice
4Sale ManagerMaster12Practice
5Marketing directorMaster10Practice
6Marketing directorMaster16Practice
7Marketing managerMaster13Practice
8Marketing managerBachelor12Practice
9Marketing managerBachelor12Practice
10project leaderBachelor11Practice
11project leaderBachelor10Practice
12Market analyzerMaster10Practice
13Market analyzerMaster10Practice
14Market analyzerBachelor10Practice
15ProfessorPhD18Academia
16ProfessorPhD16Academia
17ProfessorPhD15Academia
18Associate professorPhD15Academia
19Associate professorPhD13Academia
20Associate professorPhD12Academia
21Associate professorPhD12Academia
22Lecturer PhD10Academia
23Lecturer Master16Academia
24Lecturer Master13Academia
25Lecturer Master10Academia
26Associate ResearcherPhD12Academia
27Associate ResearcherPhD11Academia
28ResearcherMaster10Academia
29ResearcherMaster10Academia
30ResearcherMaster10Academia

References

  1. Greenpeace Indonesia. Greenpeace Indonesia Menemukan Lebih Dari 700 Merek Sampah Plastik Dari Tiga Lokasi. 2018. Available online: https://www.greenpeace.org/indonesia/siaran-pers/1052/greenpeace-menemukan-lebih-dari-700-merek-sampah-plastik-dari-tiga-lokasi/ (accessed on 20 May 2022).
  2. Beiki, H.; Seyedhosseini, S.M.; Ponkratov, V.V.; Zekiy, A.O.; Ivanov, S.A. Addressing a sustainable supplier selection and order allocation problem by an integrated approach: A case of automobile manufacturing. J. Ind. Prod. Eng. 2021, 38, 239–253. [Google Scholar] [CrossRef]
  3. Wojnarowska, M.; Sołtysik, M.; Prusak, A. Impact of eco-labelling on the implementation of sustainable production and consumption. Environ. Impact Assess. Rev. 2021, 86, 106505. [Google Scholar] [CrossRef]
  4. Tseng, M.L.; Chiu, A.S.F.; Liu, G.; Jantaralolica, T. Circular economy enables sustainable consumption and production to lead economic growth. Resour. Conserv. Recycl. 2020, 154, 104601. [Google Scholar] [CrossRef]
  5. Uniyal, S.; Mangla, S.K.; Sarma, P.R.S.; Tseng, M.-L.; Patil, P. ICT as “Knowledge Management” for Assessing Sustainable Consumption and Production in Supply Chains. J. Glob. Inf. Manag. 2021, 29, 164–198. [Google Scholar] [CrossRef]
  6. Wang, Y.; Xiang, D.; Yang, Z.; Ma, S.S. Unraveling customer sustainable consumption behaviors in sharing economy: A socio-economic approach based on social exchange theory. J. Clean. Prod. 2019, 208, 869–879. [Google Scholar] [CrossRef]
  7. Yang, M.; Chen, H.; Long, R.; Yang, J. The impact of different regulation policies on promoting green consumption behavior based on social network modeling. Sustain. Prod. Consum. 2022, 32, 468–478. [Google Scholar] [CrossRef]
  8. Feil, A.A.; da Silva Cyrne, C.C.; Sindelar, F.C.W.; Barden, J.E.; Dalmoro, M. Profiles of sustainable food consumption: Consumer behavior toward organic food in southern region of Brazil. J. Clean. Prod. 2020, 258, 120690. [Google Scholar] [CrossRef]
  9. Wu, C.S.; Zhou, X.X.; Song, M. Sustainable consumer behavior in China: An empirical analysis from the Midwest Regions. J. Clean. Prod. 2016, 134, 147–165. [Google Scholar] [CrossRef]
  10. Wang, C.; Ghadimi, P.; Lim, M.K.; Tseng, M.L. A literature review of sustainable consumption and production: A comparative analysis in developed and developing economies. J. Clean. Prod. 2019, 206, 741–754. [Google Scholar] [CrossRef]
  11. Sarkis, J.; Cohen, M.J.; Dewick, P.; Schröder, P. A brave new world: Lessons from the COVID-19 pandemic for transitioning to sustainable supply and production. Resour. Conserv. Recycl. 2020, 159, 104894. [Google Scholar] [CrossRef]
  12. Kautish, P.; Paço, A.; Thaichon, P. Sustainable consumption and plastic packaging: Relationships among product development, perceived marketplace influence and choice behavior. J. Retail. Consum. Serv. 2022, 67, 103032. [Google Scholar] [CrossRef]
  13. Chen, C.-C.; Sujanto, R.Y.; Bui, T.-D.; Tseng, M.-L. Sustainable recyclate packaging in Indonesian food and beverage industry: A hybrid decision-making analysis in consumption stages. Qual. Quant. 2022, 1–37. [Google Scholar] [CrossRef]
  14. Alzubaidi, H.; Slade, E.L.; Dwivedi, Y. Examining antecedents of consumers’pro-environmental behaviors: TPB extended with materialism and innovativeness. J. Bus. Res. 2021, 122, 685–699. [Google Scholar] [CrossRef]
  15. Schäfer, M.; de Figueiredo, M.D.; Iran, S.; Jaeger-Erben, M.; Silva, M.E.; Lazaro, J.C.; Meißner, M. Imitation, adaptation, or local emergency?–A cross-country comparison of social innovations for sustainable consumption in Brazil, Germany, and Iran. J. Clean. Prod. 2020, 284, 124740. [Google Scholar] [CrossRef]
  16. Basha, M.B.; Lal, D. Indian consumers’ attitudes towards purchasing organically produced foods: An empirical study. J. Clean. Prod. 2019, 215, 99–111. [Google Scholar] [CrossRef]
  17. Ganglmair-Wooliscroft, A.; Wooliscroft, B. An investigation of sustainable consumption behavior systems—Exploring personal and socio-structural characteristics in different national contexts. J. Bus. Res. 2022, 148, 161–173. [Google Scholar] [CrossRef]
  18. Attarmoghaddam, N.; Khorakian, A.; Saghih, A.M.F. Employing system dynamic and DEMATEL for improving the new product development time in knowledge-based companies. J. Ind. Prod. Eng. 2022, in press. [Google Scholar] [CrossRef]
  19. Ahmad, S.; Wong, K.Y. Development of weighted triple-bottom line sustainability indicators for the Malaysian food manufacturing industry using the Delphi method. J. Clean. Prod. 2019, 229, 1167–1182. [Google Scholar] [CrossRef]
  20. Chang, P.L.; Hsu, C.W.; Chang, P.C. Fuzzy Delphi method for evaluating hydrogen production technologies. Int. J. Hydrogen Energy 2011, 36, 14172–14179. [Google Scholar] [CrossRef]
  21. Tseng, M.L.; Wu, K.J.; Lee, C.H.; Lim, M.K.; Bui, T.D.; Chen, C.C. Assessing sustainable tourism in Vietnam: A hierarchical structure approach. J. Clean. Prod. 2018, 195, 406–417. [Google Scholar] [CrossRef]
  22. Tsai, F.M.; Bui, T.D.; Tseng, M.L.; Lim, M.K.; Wu, K.J.; Mashud, A.H.M. Assessing a hierarchical sustainable solid waste management structure with qualitative information: Policy and regulations drive social impacts and stakeholder participation. Resour. Conserv. Recycl. 2020, 168, 105285. [Google Scholar] [CrossRef]
  23. Tseng, M.L.; Chiang, J.H.; Lan, L.W. Selection of optimal supplier in supply chain management strategy with analytic network process and choquet integral. Comput. Ind. Eng. 2009, 57, 330–340. [Google Scholar] [CrossRef]
  24. Olawumi, T.O.; Chan, D.W. Application of Generalized Choquet Fuzzy Integral Method in the Sustainability Rating of Green Buildings based on the BSAM Scheme. Sustain. Cities Soc. 2020, 61, 102147. [Google Scholar] [CrossRef]
  25. Ran, Y.; Lewis, A.N.; Dawkins, E.; Grah, R.; Vanhuyse, F.; Engström, E.; Lambe, F. Information as an enabler of sustainable food choices: A behavioural approach to understanding consumer decision-making. Sustain. Prod. Consum. 2022, 31, 642–656. [Google Scholar] [CrossRef]
  26. Cohen, B.; Munoz, P. Sharing cities and sustainable consumption and production: Towards an integrated framework. J. Clean. Prod. 2016, 134, 87–97. [Google Scholar] [CrossRef]
  27. Sigala, M. Customer involvement in sustainable supply chain management: A research framework and implications in tourism. Cornell Hosp. Q. 2014, 55, 76–88. [Google Scholar] [CrossRef]
  28. Dong, X.; Li, H.; Liu, S.; Cai, C.; Fan, X. How does material possession love influence sustainable consumption behavior towards the durable products? J. Clean. Prod. 2018, 198, 389–400. [Google Scholar] [CrossRef]
  29. Vega-Zamora, M.; Torres-Ruiz, F.J.; Parras-Rosa, M. Towards sustainable consumption: Keys to communication for improving trust in organic foods. J. Clean. Prod. 2019, 216, 511–519. [Google Scholar] [CrossRef]
  30. Lim, S.A.H.; Antony, J. Statistical process control readiness in the food industry: Development of a self-assessment tool. Trends Food Sci. Technol. 2016, 58, 133–139. [Google Scholar] [CrossRef]
  31. Day, J.; Bobeva, M. A generic toolkit for the successful management of Delphi studies. Electron. J. Bus. Res. Methodol. 2005, 3, 103–116. [Google Scholar]
  32. Von Bergner, N.M.; Lohmann, M. Future challenges for global tourism: A Delphi survey. J. Travel Res. 2014, 53, 420–432. [Google Scholar] [CrossRef]
  33. Hsu, C.C.; Sandford, B.A. The Delphi technique: Making sense of consensus. Pract. Assess. Res. Eval. 2007, 12, 10. [Google Scholar]
  34. Wu, K.J.; Liao, C.J.; Tseng, M.; Chiu, K.K.S. Multi-attribute approach to sustainable supply chain management under uncertainty. Ind. Manag. Data Syst. 2016, 116, 777–800. [Google Scholar] [CrossRef]
  35. Sharma, R.; Jha, M. Values influencing sustainable consumption behavior: Exploring the contextual relationship. J. Bus. Res. 2017, 76, 77–88. [Google Scholar] [CrossRef]
  36. Ramkissoon, H.; Mavondo, F.T. Proenvironmental behavior: Critical link between satisfaction and place attachment in Australia and Canada. Tour. Anal. 2017, 22, 59–73. [Google Scholar] [CrossRef]
  37. Gentina, E.; Huarng, K.H.; Sakashita, M. A social comparison theory approach to mothers’ and daughters’ clothing co-consumption behaviors: A cross-cultural study in France and Japan. J. Bus. Res. 2018, 89, 361–370. [Google Scholar] [CrossRef]
  38. Yang, D.; Lu, Y.; Zhu, W.; Su, C. Going green: How different advertising appeals impact green consumption behavior. J. Bus. Res. 2015, 68, 2663–2675. [Google Scholar] [CrossRef]
  39. Chang, H.-H.; Su, J.-W. Sustainable consumption in Taiwan retailing: The impact of product features and price promotion on purchase behaviors toward expiring products. Food Qual. Prefer. 2022, 96, 104452. [Google Scholar] [CrossRef]
  40. Ülkü, M.A.; Hsuan, J. Towards sustainable consumption and production: Competitive pricing of modular products for green consumers. J. Clean. Prod. 2017, 142, 4230–4242. [Google Scholar] [CrossRef]
  41. Joo, S.; Lee, H.; Suh, E.K.; Suh, K.S. Shared experience in pretrip and experience sharing in posttrip: A survey of Airbnb users. Inf. Manag. 2017, 54, 714–727. [Google Scholar]
  42. Wang, R.C.; Chuu, S.J. Group decision-making using a fuzzy linguistic approach for evaluating the flexibility in a manufacturing system. Eur. J. Oper. Res. 2004, 154, 563–572. [Google Scholar] [CrossRef]
  43. Opricovic, S.; Tzeng, G.H. Compromise solution by MCDM methods: A comparative analysis of VIKOR and TOPSIS. Eur. J. Oper. Res. 2004, 156, 445–455. [Google Scholar] [CrossRef]
  44. Chiang, J.H. Aggregating membership values by a Choquet-fuzzy-integralbased operator. Fuzzy Sets Syst. 2000, 11, 367–375. [Google Scholar] [CrossRef]
  45. Klir, G.J.; Wang, Z.; Harmanec, D. Constructing fuzzy measures in expertsystems. Fuzzy Sets Syst. 1997, 92, 251–264. [Google Scholar] [CrossRef]
  46. Sugeno, M. Theory of Fuzzy Integrals and Its Application. Ph.D. Thesis, Tokyo Institute of Technology, Tokyo, Japan, 1974. [Google Scholar]
  47. Sugeno, M.; Terano, T. A model of learning lased on fuzzy information. Kybernetes 1977, 6, 157–166. [Google Scholar] [CrossRef]
  48. Chen, Y.W.; Tzeng, G.H. Using fuzzy integral for evaluating subjectively perceived travel costs in a traffic assignment model. Eur. J. Oper. Res. 2001, 130, 653–664. [Google Scholar] [CrossRef]
Figure 1. The basic concept of Choquet integral.
Sustainability 14 09877 g001
Figure 2. Proposed analysis step.
Sustainability 14 09877 g002
Figure 3. Causal interrelationships diagram for aspects.
Sustainability 14 09877 g003
Figure 4. Causal diagram for criteria.
Sustainability 14 09877 g004
Figure 5. Choquet integral diagram for aspects.
Sustainability 14 09877 g005
Table 1. SCB aspects and criteria.
AspectsCriteriaReferences
A1Consumer DemographicC1Gender[8,9,34]
C2Age
C3Basic of education
A2Consumer behaviorC4Trust from consumer [28,29,34,37]
C5Build emotion
C6Perceived consumer effectiveness
C7Behavioral intention
C8Mother’s influence to their children
C9Perception of consequences
A3Economic benefits C10Advertising appeal[6,38,40]
C11Price
A4Social impactsC12Reputation[6,9]
C13Response rate
C14Social consumption motivation
C15Benefit
A5Environment responsesC16Environmental attitude[9,34]
C17Environmental knowledge
C18Environmental concern
C19Environmental responsibility
Table 2. TFNs linguistic scale.
ScaleLinguistic VariableCorresponding Triangular Fuzzy Number (TFNs)
VLVery low influence(0.0, 0.1, 0.3)
LLow influence(0.1, 0.3, 0.5)
MModerate influence(0.3, 0.5, 0.7)
HIHigh influence(0.5, 0.7, 0.9)
VHIVery high influence(0.7, 0.9, 1.0)
Table 3. Triangular fuzzy numbers—example from respondent 1.
A1A2A3A4A5
A1[1.000 1.000 1.000][0.700 0.900 1.000][0.700 0.900 1.000][0.700 0.900 1.000][0.700 0.900 1.000]
A2[0.700 0.900 1.000][1.000 1.000 1.000][0.700 0.900 1.000][0.700 0.900 1.000][0.700 0.900 1.000]
A3[0.700 0.900 1.000][0.700 0.900 1.000][1.000 1.000 1.000][0.700 0.900 1.000][0.700 0.900 1.000]
A4[0.700 0.900 1.000][0.700 0.900 1.000][0.700 0.900 1.000][1.000 1.000 1.000][0.700 0.900 1.000]
A5[0.700 0.900 1.000][0.700 0.900 1.000][0.700 0.900 1.000][0.700 0.900 1.000][1.000 1.000 1.000]
Table 4. Total normalized crisp value for aspects.
A1A2A3A4A5
A10.7990.4960.5300.5590.467
A20.5880.8040.6830.6830.654
A30.5880.6540.5370.5630.624
A40.5620.6540.6540.8040.624
A50.4670.6530.5000.6530.804
Table 5. Interrelationship matrix and causal-effect interrelationships for aspects.
A1A2A3A4A5αβα − βα + β
A11.9892.0541.8582.0781.9929.97110.56120.532(0.590)
A22.2952.5632.2712.5292.45312.11111.55523.6660.556
A32.0122.2061.9502.1822.14210.49210.28720.7790.205
A42.2152.4382.1922.4872.36711.69911.57123.2710.128
A52.0502.2932.0162.2962.28210.93811.23622.174(0.298)
Table 6. Total normalized crisp value for criteria.
C1C2C3C4C5C6C7C8C9C10C11C12C13C14C15C16C17C18C19
C10.3000.4240.3580.3910.5490.4580.5150.5790.3870.5200.5160.3410.2670.5490.4580.1670.2330.2330.362
C20.4250.3000.4910.4240.4240.3910.5150.5440.3910.4910.4830.3700.3620.5150.4580.3870.4830.4830.482
C30.3590.4580.3000.4910.4240.5490.4240.4690.5500.4530.2620.4080.3620.4910.4240.5790.5790.5790.453
C40.3920.3910.5830.3000.6740.6740.5490.5090.5870.6150.6160.5620.6740.5580.6740.6170.6750.6750.674
C50.4210.5540.4580.6160.3000.6450.6150.6590.5870.6110.4580.4700.5210.6110.6150.5590.5540.5880.587
C60.4000.4240.5580.6160.6150.3000.5580.6290.6160.6440.5830.5330.6740.6740.6150.6170.6460.6460.615
C70.5170.5830.5240.5870.6150.5870.3000.5550.5580.6160.5870.5040.5830.5580.5870.6170.6160.6750.583
C80.5500.6160.4910.5820.6440.4580.5530.3600.4240.5200.4870.4080.4910.4240.4580.4590.4920.4920.491
C90.3910.4540.5580.5200.5200.5530.5580.6290.3000.5530.4870.4370.5200.4870.5870.5870.5870.5870.587
C100.4960.5870.5820.6440.6440.6440.5530.5490.5200.3000.6120.4700.5540.5820.5820.4590.4590.4590.424
C110.5170.5780.4240.5200.4910.5820.5530.5490.4870.6110.3000.3790.5830.6450.6740.4590.4920.4920.491
C120.4920.5830.5240.6740.5490.6110.5530.5840.6160.6450.4620.2500.6740.6150.6450.5870.5500.5500.582
C130.3330.4910.4580.6440.5870.5820.5530.5490.6160.6110.5540.5330.3000.5820.6440.5870.5830.5830.549
C140.5540.6120.5540.4910.6150.6150.5580.5090.5530.6450.6160.5330.5870.3000.5530.5210.5830.5830.549
C150.4290.4910.5540.5870.6150.6150.5580.5490.5870.5820.6160.5330.6160.5200.3000.5590.5590.5250.554
C160.3000.5830.6150.5200.5870.6450.5820.5490.5870.5200.5240.5030.5500.5820.5870.3000.6460.6460.645
C170.2670.5490.6450.5870.4630.6450.5820.5490.6160.5490.5240.5330.6160.6440.5870.6170.3000.6750.674
C180.2000.5200.5200.5200.4960.6160.5530.5890.5200.5820.4910.5330.5500.5200.6150.6460.6750.3000.674
C190.3960.5490.5820.5870.6160.6740.6110.6240.6160.5200.5240.5030.6160.6150.5870.6170.6750.6750.300
Table 7. Interrelationship matrix for criteria.
C1C2C3C4C5C6C7C8C9C10C11C12C13C14C15C16C17C18C19
C10.3420.4330.4290.4530.4720.4800.4610.4770.4450.4750.4400.3890.4350.4720.4720.4200.4430.4460.449
C20.3860.4650.4840.5010.5060.5220.5050.5200.4900.5180.4790.4310.4880.5150.5180.4840.5120.5140.505
C30.3890.4910.4810.5200.5200.5500.5110.5270.5170.5290.4730.4460.5020.5260.5290.5150.5340.5370.517
C40.4910.6100.6310.6350.6750.7000.6530.6650.6500.6780.6280.5730.6590.6660.6870.6460.6760.6790.668
C50.4690.5930.5890.6300.6090.6620.6260.6450.6170.6440.5830.5360.6130.6370.6480.6080.6320.6380.627
C60.4890.6100.6260.6600.6670.6630.6500.6720.6500.6770.6220.5670.6560.6720.6790.6430.6700.6740.659
C70.4890.6100.6090.6430.6520.6730.6130.6510.6300.6600.6090.5520.6330.6480.6620.6280.6530.6610.642
C80.4360.5420.5340.5670.5780.5820.5610.5570.5440.5740.5290.4790.5500.5600.5720.5410.5650.5680.558
C90.4440.5570.5700.5930.5990.6240.5920.6120.5630.6090.5580.5080.5840.5960.6150.5830.6060.6090.598
C100.4610.5770.5800.6130.6190.6410.6010.6150.5920.5960.5780.5190.5960.6140.6250.5800.6030.6060.593
C110.4520.5620.5520.5860.5900.6190.5850.5990.5740.6080.5360.4980.5830.6040.6170.5650.5900.5930.583
C120.4870.6100.6090.6510.6470.6760.6360.6540.6360.6630.5990.5300.6420.6530.6670.6260.6480.6510.642
C130.4590.5850.5860.6300.6310.6540.6170.6320.6170.6410.5890.5390.5910.6310.6480.6080.6320.6350.621
C140.4820.6000.5990.6210.6380.6620.6230.6340.6160.6490.5990.5430.6200.6120.6450.6070.6360.6390.625
C150.4660.5830.5920.6230.6310.6540.6160.6300.6130.6360.5920.5370.6160.6240.6150.6040.6270.6280.619
C160.4600.5980.6050.6250.6360.6650.6250.6380.6200.6390.5910.5410.6180.6370.6480.5890.6430.6460.635
C170.4640.6040.6160.6390.6350.6740.6340.6470.6320.6500.6000.5520.6330.6510.6580.6260.6220.6580.647
C180.4390.5770.5810.6080.6120.6450.6070.6240.5990.6270.5730.5300.6020.6150.6340.6030.6290.5990.621
C190.4850.6160.6230.6520.6610.6910.6500.6670.6440.6610.6120.5600.6460.6620.6710.6380.6680.6710.627
Table 8. Causal-effect interrelationships for criteria.
αβα − βα + β
C18.4308.59017.020(0.159)
C29.34110.82120.161(1.480)
C39.61010.89420.504(1.283)
C412.26711.45023.7170.818
C511.60411.57623.1800.029
C612.20612.03524.2420.171
C711.91811.36523.2830.553
C810.39511.66622.061(1.271)
C911.01811.24822.266(0.230)
C1011.21111.73522.945(0.524)
C1110.89710.78921.6860.108
C1211.9289.83021.7582.098
C1311.54411.26822.8110.276
C1411.65011.59523.2450.055
C1511.50811.80923.317(0.302)
C1611.65911.11422.7730.546
C1711.84111.58923.4300.252
C1811.32711.65222.979(0.325)
C1912.10511.43623.5410.669
Table 9. Criteria global weights suppermatrix.
C1C2C3C4C5C6C7C8C9C10C11C12C13C14C15C16C17C18C19
C10.03960.03960.03960.03960.03960.03960.03960.03960.03960.03960.03960.03960.03960.03960.03960.03960.03960.03960.0396
C20.04400.04400.04400.04400.04400.04400.04400.04400.04400.04400.04400.04400.04400.04400.04400.04400.04400.04400.0440
C30.04520.04520.04520.04520.04520.04520.04520.04520.04520.04520.04520.04520.04520.04520.04520.04520.04520.04520.0452
C40.05770.05770.05770.05770.05770.05770.05770.05770.05770.05770.05770.05770.05770.05770.05770.05770.05770.05770.0577
C50.05460.05460.05460.05460.05460.05460.05460.05460.05460.05460.05460.05460.05460.05460.05460.05460.05460.05460.0546
C60.05750.05750.05750.05750.05750.05750.05750.05750.05750.05750.05750.05750.05750.05750.05750.05750.05750.05750.0575
C70.05620.05620.05620.05620.05620.05620.05620.05620.05620.05620.05620.05620.05620.05620.05620.05620.05620.05620.0562
C80.04920.04920.04920.04920.04920.04920.04920.04920.04920.04920.04920.04920.04920.04920.04920.04920.04920.04920.0492
C90.05180.05180.05180.05180.05180.05180.05180.05180.05180.05180.05180.05180.05180.05180.05180.05180.05180.05180.0518
C100.05290.05290.05290.05290.05290.05290.05290.05290.05290.05290.05290.05290.05290.05290.05290.05290.05290.05290.0529
C110.05130.05130.05130.05130.05130.05130.05130.05130.05130.05130.05130.05130.05130.05130.05130.05130.05130.05130.0513
C120.05600.05600.05600.05600.05600.05600.05600.05600.05600.05600.05600.05600.05600.05600.05600.05600.05600.05600.0560
C130.05420.05420.05420.05420.05420.05420.05420.05420.05420.05420.05420.05420.05420.05420.05420.05420.05420.05420.0542
C140.05510.05510.05510.05510.05510.05510.05510.05510.05510.05510.05510.05510.05510.05510.05510.05510.05510.05510.0551
C150.05430.05430.05430.05430.05430.05430.05430.05430.05430.05430.05430.05430.05430.05430.05430.05430.05430.05430.0543
C160.05470.05470.05470.05470.05470.05470.05470.05470.05470.05470.05470.05470.05470.05470.05470.05470.05470.05470.0547
C170.05560.05560.05560.05560.05560.05560.05560.05560.05560.05560.05560.05560.05560.05560.05560.05560.05560.05560.0556
C180.05310.05310.05310.05310.05310.05310.05310.05310.05310.05310.05310.05310.05310.05310.05310.05310.05310.05310.0531
C190.05690.05690.05690.05690.05690.05690.05690.05690.05690.05690.05690.05690.05690.05690.05690.05690.05690.05690.0569
Table 10. Overall Choquet integral weight index for aspects.
A1A2A3A4A5
Λ Value0.0001.0000.0001.0000.0001.0000.0001.0000.0001.000
0.1150.1180.1150.1190.1150.1190.1140.1180.1150.118
0.1720.1720.1710.1720.1720.1720.1720.1720.1710.171
0.2280.2280.2280.2280.2280.2280.2280.2280.2280.228
0.2840.2840.2840.2840.2840.2840.2830.2830.2840.284
0.3360.3360.3400.3400.3400.3400.3390.3390.3390.339
0.3910.3910.3950.3950.3950.3950.3950.3950.3950.395
0.4460.4460.4500.4500.4500.4500.4500.4500.4500.450
0.5000.5000.5040.5040.5040.5040.5040.5040.5040.504
0.5540.5540.5590.5590.5590.5590.5590.5590.5590.559
0.6090.6090.6130.6130.6120.6120.6120.6120.6130.613
0.6620.6620.6660.6660.6660.6660.6630.6630.6660.666
0.7110.7110.7190.7190.7170.7170.7180.7180.7150.715
0.7670.7670.7710.7710.7620.7620.7710.7710.7670.767
0.8110.8110.8220.8220.8150.8150.8220.8220.8070.807
0.8620.8620.8670.8670.8670.8670.8710.8710.8580.858
0.9070.9070.9160.9160.9160.9160.9110.9110.9030.903
0.9470.9470.9600.9600.9600.9600.9560.9560.9470.947
1.0001.0001.0401.0401.0001.0001.0001.0001.0001.000
( c ) h d g value 10.305 10.424 10.367 10.371 10.324
10.302 10.421 10.363 10.368 10.320
Publisher’s Note: MDPI stays neutral with regard to jurisdictional claims in published maps and institutional affiliations.

