Article

Analysis of Crowded Propagation on the Metro Network

1
School of Geography and Tourism, Anhui Normal University, Huajin Campus, South 189 Jiuhua Rd, Wuhu 241002, China
2
Engineering Technology Research Center of Resources Environment and GIS, Wuhu 241008, China
3
Beijing Key Laboratory of Traffic Engineering, Beijing University of Technology, Beijing 100124, China
4
Quantutong Location Network Co., Ltd., 4F, No. 2 Courtyard, Liangshuihe No. 1 Street, Beijing 100176, China
*
Author to whom correspondence should be addressed.
Sustainability 2022, 14(16), 9829; https://doi.org/10.3390/su14169829
Submission received: 12 July 2022 / Revised: 27 July 2022 / Accepted: 9 August 2022 / Published: 9 August 2022
(This article belongs to the Topic Sustainable Transportation)

Abstract

:
The crowd in a metro system can cause inconvenience and even safety problems to passengers. The study of crowded propagation in metro systems can identify where and when crowds occur, ensuring travel quality and safety. Based on this, a modified susceptible–infected-susceptible (SIS) crowded propagation model is proposed to estimate the risk probability of crowding (RPC) in the metro network. Each station’s real transport capacity is considered. Infection rate and the recovery rate are proposed considering the traffic difference between stations. Using the Beijing metro network as a case study, the spatial and temporal patterns of crowded propagation are analyzed, and the types of nodes suitable for regulation are further discussed. This proposed model can provide a reference for RPC identification and regulation and promote sustainable development of metro operations.

1. Introduction

Urban rail transit can be divided into three categories: metro, light rail, and tram. Among them, the metro, with the characteristics of fast, high frequency, and punctuality, meets the travel demands of many passengers. Some developing countries promote the construction of the metro to meet passengers’ commuting or other travel. For example, almost 700 km of metro and tram lines were opened in 15 Chinese cities during the closing weeks of 2020 [1]. The high frequency makes it possible to transport a large number of passengers in a short time; however, the large number of passengers puts pressure on the operation of the network. Then, the crowd occurs when the carrying capacity and the transportation capacity are not sufficient to meet passenger demand. Luo et al. found out that big passenger flows spread continuously in time and space and that huge passenger flows at a single station will affect the journey at succeeding stations [2]. Crowding has a negative impact on passenger travel and metro operations [3] and, in serious cases, can even lead to safety accidents. Higgins et al. noted that reducing travel in crowded situations could increase travel satisfaction [4]. Therefore, investigating the propagation of crowding in metro systems is of great significance.
Many scholars have studied the propagation of the crowd in transportation networks. Nagy and Simon predicted the congestion propagation by Markoc chains; the approach accurately predicted the probability of congestion occurring many times per day and the duration of congestion propagation periods [5]. Shang et al. estimated the passenger flow state by integrated Lagrangian and Eulerian observations [6]. Ding et al. studied the duration and spread of the delay in the metro system [7]. Li studied the cascade dynamics of passenger flow crowding and found that the factors of spreading scope contained the load of the nodes and the distance from the initial congested nodes [8]. Some scholars have combined complex networks and epidemic models to explore the propagation of crowds [9,10]. Ye et al. investigated the transmission in a tightly linked network using a deterministic susceptible–infected-susceptible (SIS) metapopulation model, where each node represented a huge population. They pointed out that increasing mobility helps the system return to a healthy balance [11]. Wu et al. developed an integrated flight-based SIS model to analyze the flight delay process [12]. Shi et al. studied the passenger flow crowding in the metro network by a susceptible–infected–recovered (SIR) model [13].
When studying crowding spread through the epidemic model, the initial setting of the model, as well as the infected rates and recovery rates, affect the outcome of the spread. The initial value of the model means the initially infected nodes, which can be interpreted here as the initial crowding node. There are two components that cause congestion to the nodes, one is the external entrance traffic, and the other is the inflow of passengers through the trains in the network. The former can be obtained through big data statistics. The latter is to be obtained by means of passenger flow assignment. Everyone has an origin and a destination when traveling. Origin–destination (OD) data can reflect the distribution of passengers’ trips [14]. There is a certain randomness in passengers’ choice of paths between ODs during travel. Different paths will bring flow pressure on different stations, and thus the inter-OD traffic is often allocated to efficient paths by means of passenger flow allocation. Huang found that the crowd can be relieved by sharing the passengers to the alternative routes [15]. Peng et al. divided the passenger flow into different types and created a dynamic assignment model to reflect the real passenger flow state [16]. Sun et al. explored the travel path of passengers by an integrated Bayesian approach [17]. Alexis considered both train circulation models and passenger assignment models to provide an improving quality of metro service [18]. Deng et al. used an improved C-Logit muti-path assignment model to calculate the ratio of each path to be selected [19]. All in all, a closer approximation to the actual crowding situation can be obtained by passenger flow allocation. However, it is not suitable for dynamic crowding prediction due to its slow calculation speed. Moreover, dynamic demand flow obtained by passenger flow allocation cannot characterize the process of crowded propagation.
As for the infection and recovery rates, Zeng proposed a grey system model to measure the propagation rate considering the passenger flow, initial congested station, and train capacity [20]. Wu pointed out that the average rate of infection, the average recovery rate, and the network topological will influence the spread of the crowd [21]. However, the propagation rate of crowds varies from station to station due to the passenger class and the capacity of each station. When Baspinar et al. constructed the air transportation delay propagation model, the effect of inter-route passenger flow was incorporated into the infection rates [22]. The difference between the metro system and the airline system is that the airline network is a direct propagation from O to D, while the crowd of passengers in the metro is propagated through each stop between O and D.
In summary, we proposed a modified SIS crowded propagation model to quickly and simply predict the propagation and risk probability of crowding (RPC) in the metro network, considering the actual carrying passenger flow and propagation rate of each station. The method identifies the spatial and temporal distribution of crowding risk, which helps metro operators optimally manage resource allocation and enhance the service capacity of urban metro transit systems, thus promoting the development of green and sustainable transportation systems.

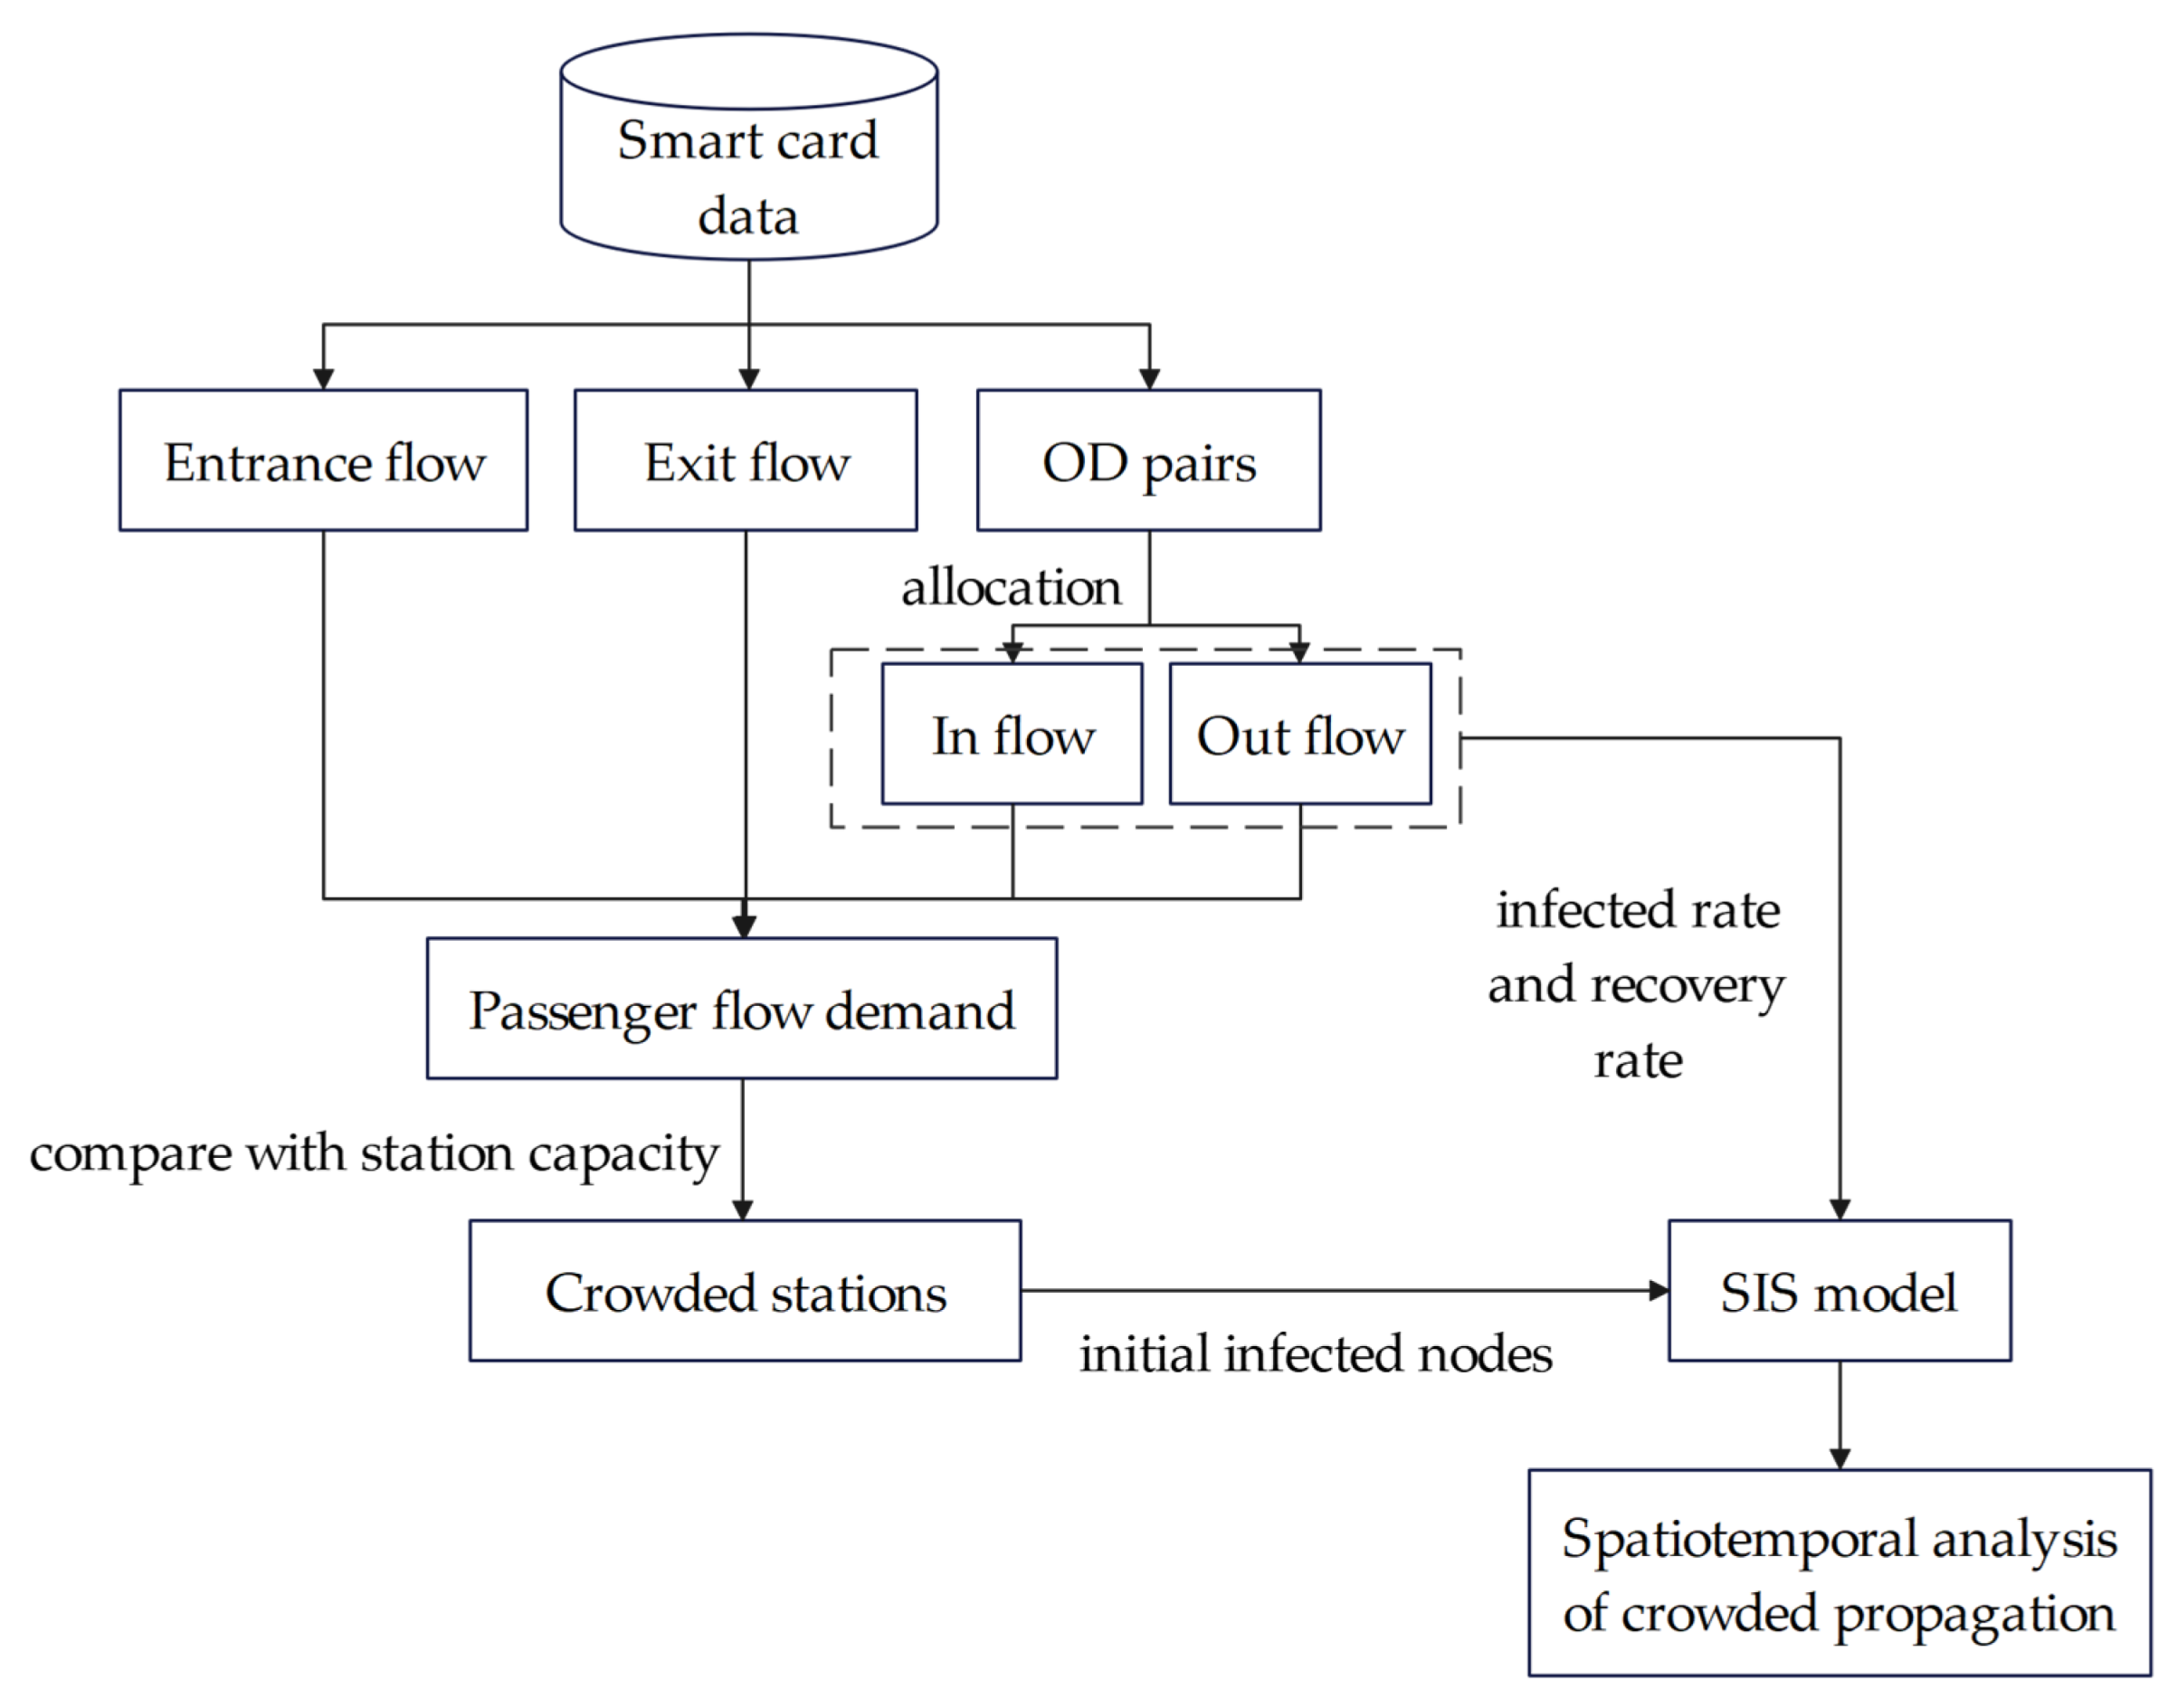
2. Materials and Methods

The whole concept is shown in Figure 1. Based on the smart card data, the basic information of passenger flow is extracted; subsequently, the passenger flow in the network is obtained through passenger flow allocation. From this, the passenger demand within the metro is acquired. The crowded stations are obtained by combining the capacity information of the stations. This is fed into the SIS model as the initial value. The infection and recovery rates in the SIS model are determined by the inflow and outflow. Finally, the spatial and temporal variation of crowding propagation is analyzed. Specific operations will be shown in the following subsections.

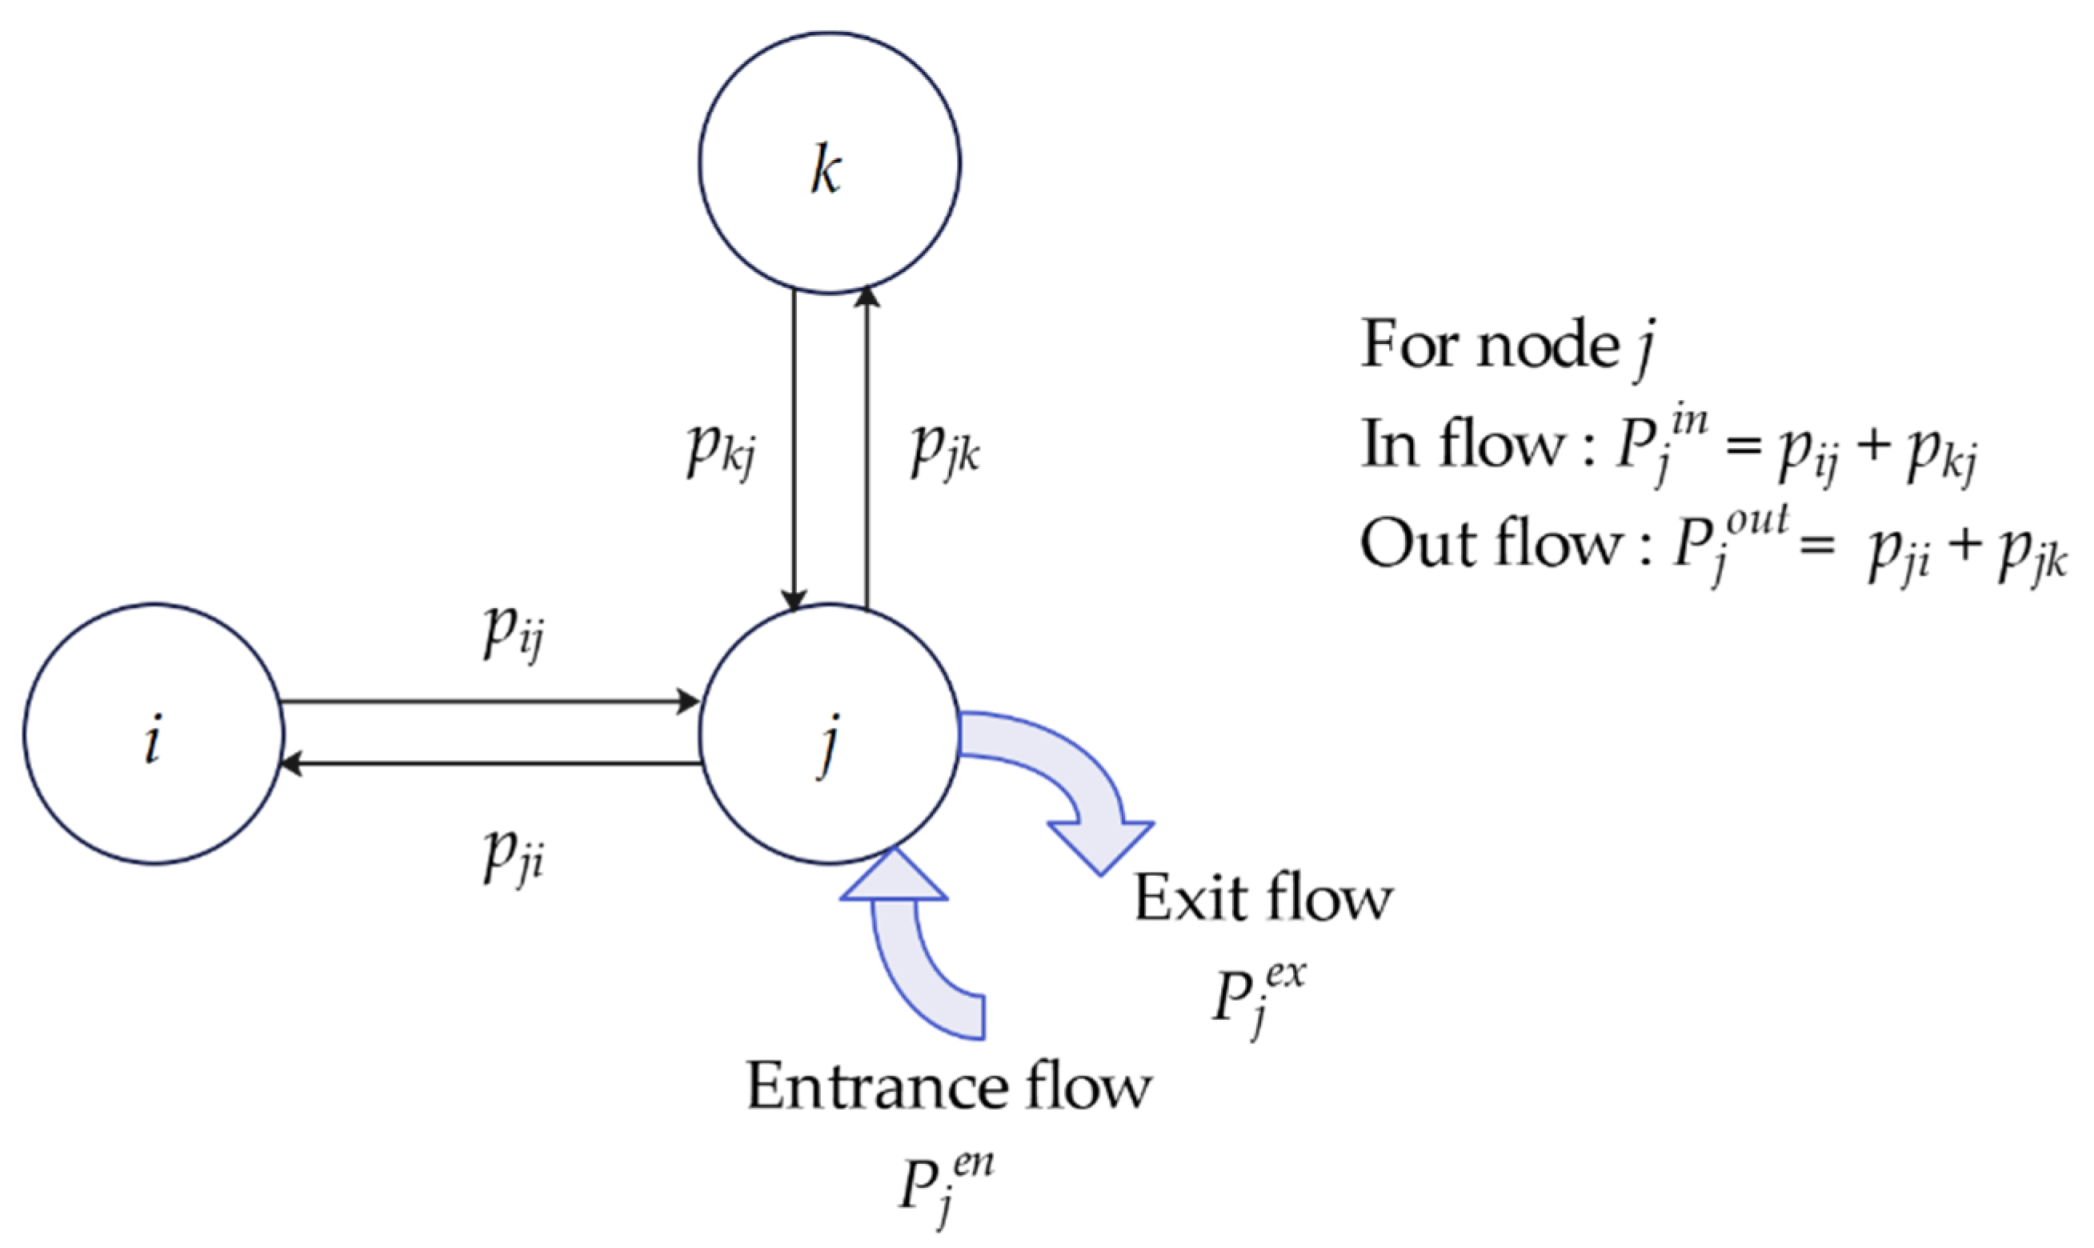
2.1. Notations and Definitions

The metro network is abstracted as an undirected graph G = ( V , E ) , where V = { 1 , 2 , , N } is the set of nodes, each station is regarded as a node, and E = { e i j | i , j V } E is the set of edges. The uncertain factors of metro transit passenger flow spreading in the network mainly include the number of entrance passenger flow and passing passenger flow. The entrance and exit of node i can be obtained by Automatic Fare Collection (AFC) system, denotes as P i e n and P i e x . The passing flow p i j means the passenger flow between node i and node j , is regarded as the edge weight. The passenger flow demand P i of node i is defined as entrance passenger flow plus passing flow minus exit passenger flow, as shown in Equation (1).
P i = P i i n + P i e n P i e x
where P i i n is the inflow of the node i , P i i n = j = 1 N p i j . A clearer representation is shown in Figure 2.
When the passenger flow demand P i within the departure interval is greater than the train capacity C , part of the entrance passengers can not board the train. Therefore, the phenomenon of detention occurs, which forms the platform crowding. Moreover, with the new passenger flow entrance to the station, the crowding will increase. As a consequence, how crowd spreads in the network and how it dissipates needs to be studied to prevent the impact of large passenger flow.

2.2. Passenger Flow Allocation

The passing flow p i j can be obtained by allocating the origin–destination (OD) flow to each link. The main process is as follows. Firstly, calculate the ridership between each OD pair according to the AFC data. Second, the k effective path between any OD pair can be found by the k short path algorithm. In this study, the value of k is 4. Third, the utility of each path can be calculated. In this study, the utility U i considers the path length, as shown in Equation (2).
U l = k l d k
where d k is the length of the link k .
Finally, the ridership is distributed to the link according to the proportion δ l of each path that be chosen. The proportion δ l is shown as Equation (3).
δ l = e U l k e U k

2.3. Passenger Flow Propagation Based on SIS Model

When crowding occurs at a few stations, passengers are transported by train, spreading crowds to other stations and alleviating crowds at the current station. This is similar to the SIS model in the infectious disease model. Nodes in the metro network are divided into two categories: one is the crowded station, represented by I ; the other is the normal operating stations that can meet the needs of passengers, represented by S . In a metro network with N stations, the sum of the two types of station is equal to N , that is n S + n I = N . The transformation relationship is shown in Figure 3.
The two types of stations can be converted into each other, and the stations that return to normal may also be crowded again. The transformation relationship between the two types in the metro network is shown in Figure 1. The propagation process is described by Equation (4).
{ d x d t = k ( 1 x ) x θ x x ( 0 ) = x 0
where x is the probability that a station in the metro network becomes I -type. It describes the risk probability of crowding (RPC). The probability of a station being of S -type is represented as 1 x . x 0 is the initial state of stations. For the entire network, the RPC at each station can be written as the set X = { x i } , i = 1 , 2 , , n . k represents the infected rate between the stations, θ indicates the recovery rate of the station to normal.
In the metro network, the flow of passengers transferred from stations to stations is different, which means the infected rate is different in stations. Similarly, the number of passengers evacuated from station to station, and their rates of returning to normal are also different.
The infected rate and recovery rate are defined below. The infected rate k i j between node i and node j is equal to the ratio of passing flow p i j to the flow out of the station, as shown in Equation (5). It describes the direction of passenger flow at the station, that is., the direction and size of the spread of crowd. The recovery rate of node i is the ratio of the flow out of the station to the sum of the in flow and out flow, as shown in Equation (6). It describes the evacuation capacity of the train.
k i j = p i j P i o u t
θ i = P i o u t P i o u t + P i i n

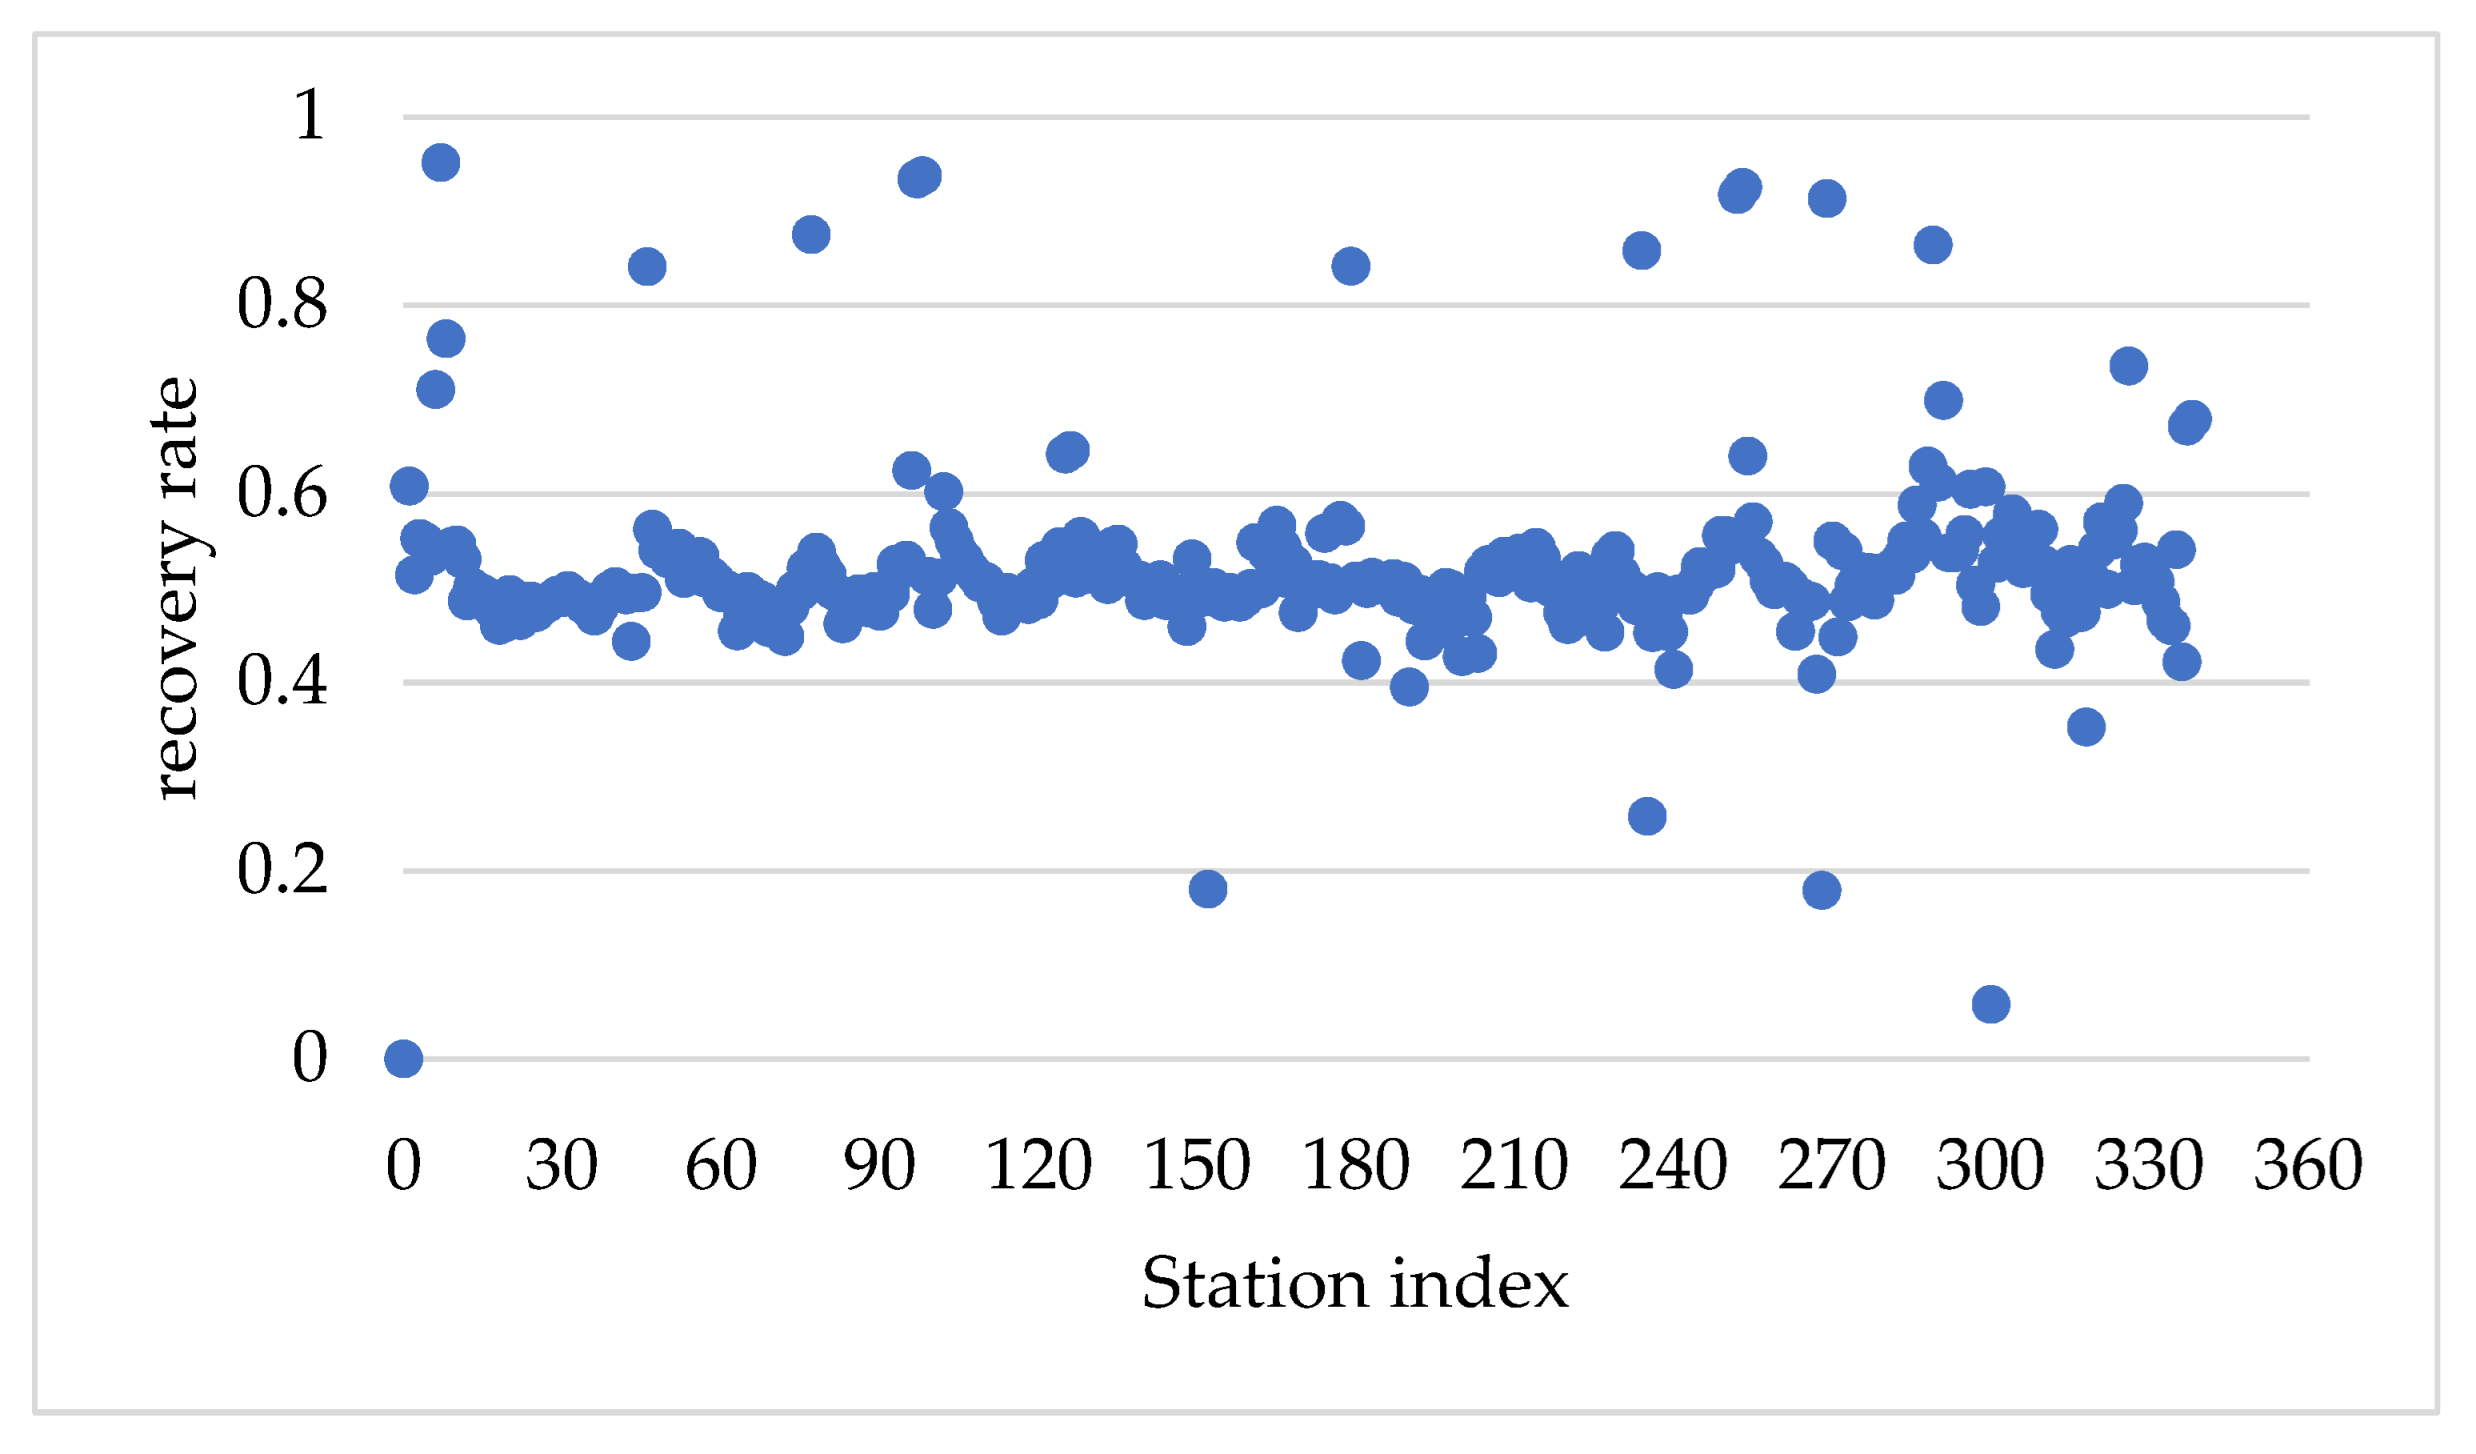
3. Experiment and Results

The metro network data of Beijing in 2020 were used for the experiment. By the end of 2020, Beijing had 339 stations. AFC data for Tuesday, October 13, were selected. No emergencies occurred on the day, and the passenger flow on that day was close to the average of that week, which can be used as an experimental representative. Aggregating passenger flows by the hour, the following discussion will focus on passenger flows in the morning rush hour (7:00–9:00) of the day.

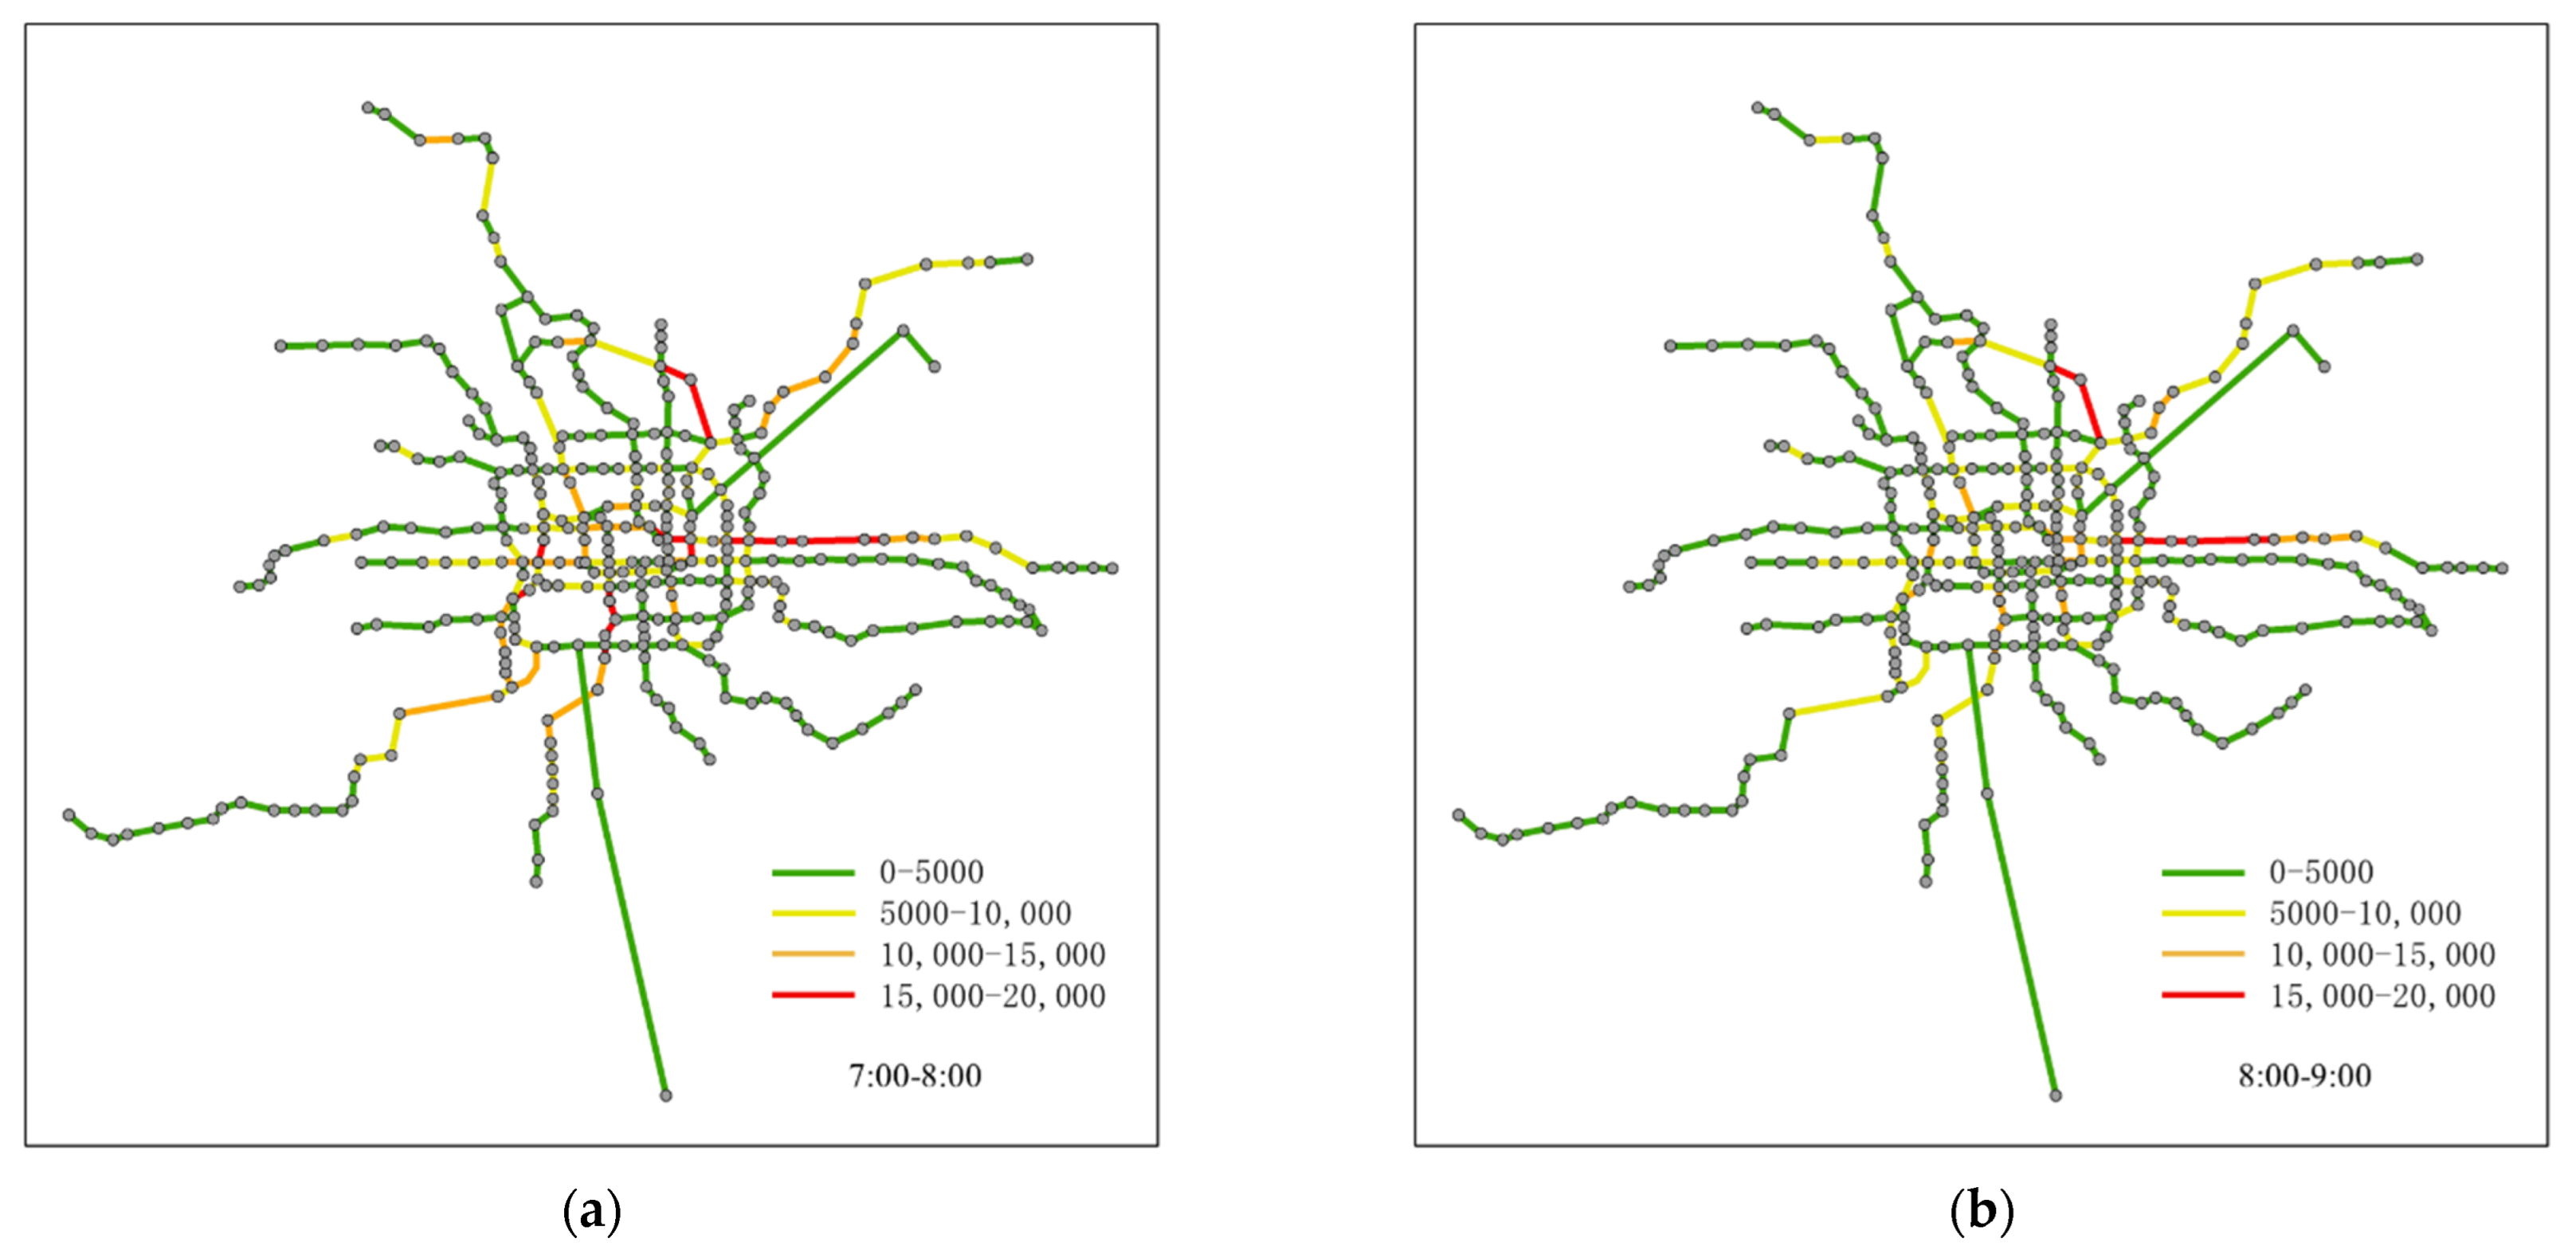
3.1. The Initial Setting

Firstly, the passing passenger flow through the network is calculated, as shown in Figure 4. The gray dots in figure represents the nodes, the riderships between the nodes are shown in color. It can be seen that during the morning rush hour, some sections are under great pressure, especially Line 6 and Line 13. This is due to the fact that these two lines cover more office locations, and the concentration of passengers taking the metro to work during the morning rush hour has caused some of the lines to have a larger flow of passengers, and with time, the crowd is slowly dissipated.
In order to clearly see the difference in infection rates between stations, the crowd infection rate k was calculated in the peak state, as shown in Figure 5. It can be seen that the infected rate of the adjacent station is large. The large values of k between nodes can be caused by two reasons, either there are fewer links connected between nodes, or the passenger flow has a very uneven directional distributivity at a node. From the calculation, the maximum value of k for the non-zero part is 1, which infers to the first reason mentioned above, which occurs at leaf nodes at the edge of the network. The minimum value of k is 0.001, and it can be presumed that the value of k in the other directions of the current departure node will be large. It infers to the second reason mentioned above, where the directional inhomogeneity is very serious. The mean value is 0.44, which reflects the average propagation level.
The recovery rate θ of each station is displayed in Figure 6. A larger recovery rate of a node represents a larger share of ridership flowing out of this node, meaning that trains departing from it can carry more passengers out, that is, having a high train evacuation capacity. In addition, it indicates that the station has a larger inbound passenger flow, which is usually the starting node or middle node of the crowded section. From the passenger’s perspective, such stations are mostly the origin of passenger travel during the morning peak period. A lower recovery rate indicates a larger flow of passengers exiting the station at that node, and such nodes are mostly destinations for passengers traveling during the morning peak period. The average recovery value in the network is 0.52, and a node close to the average means that its inflows and outflows are balanced.

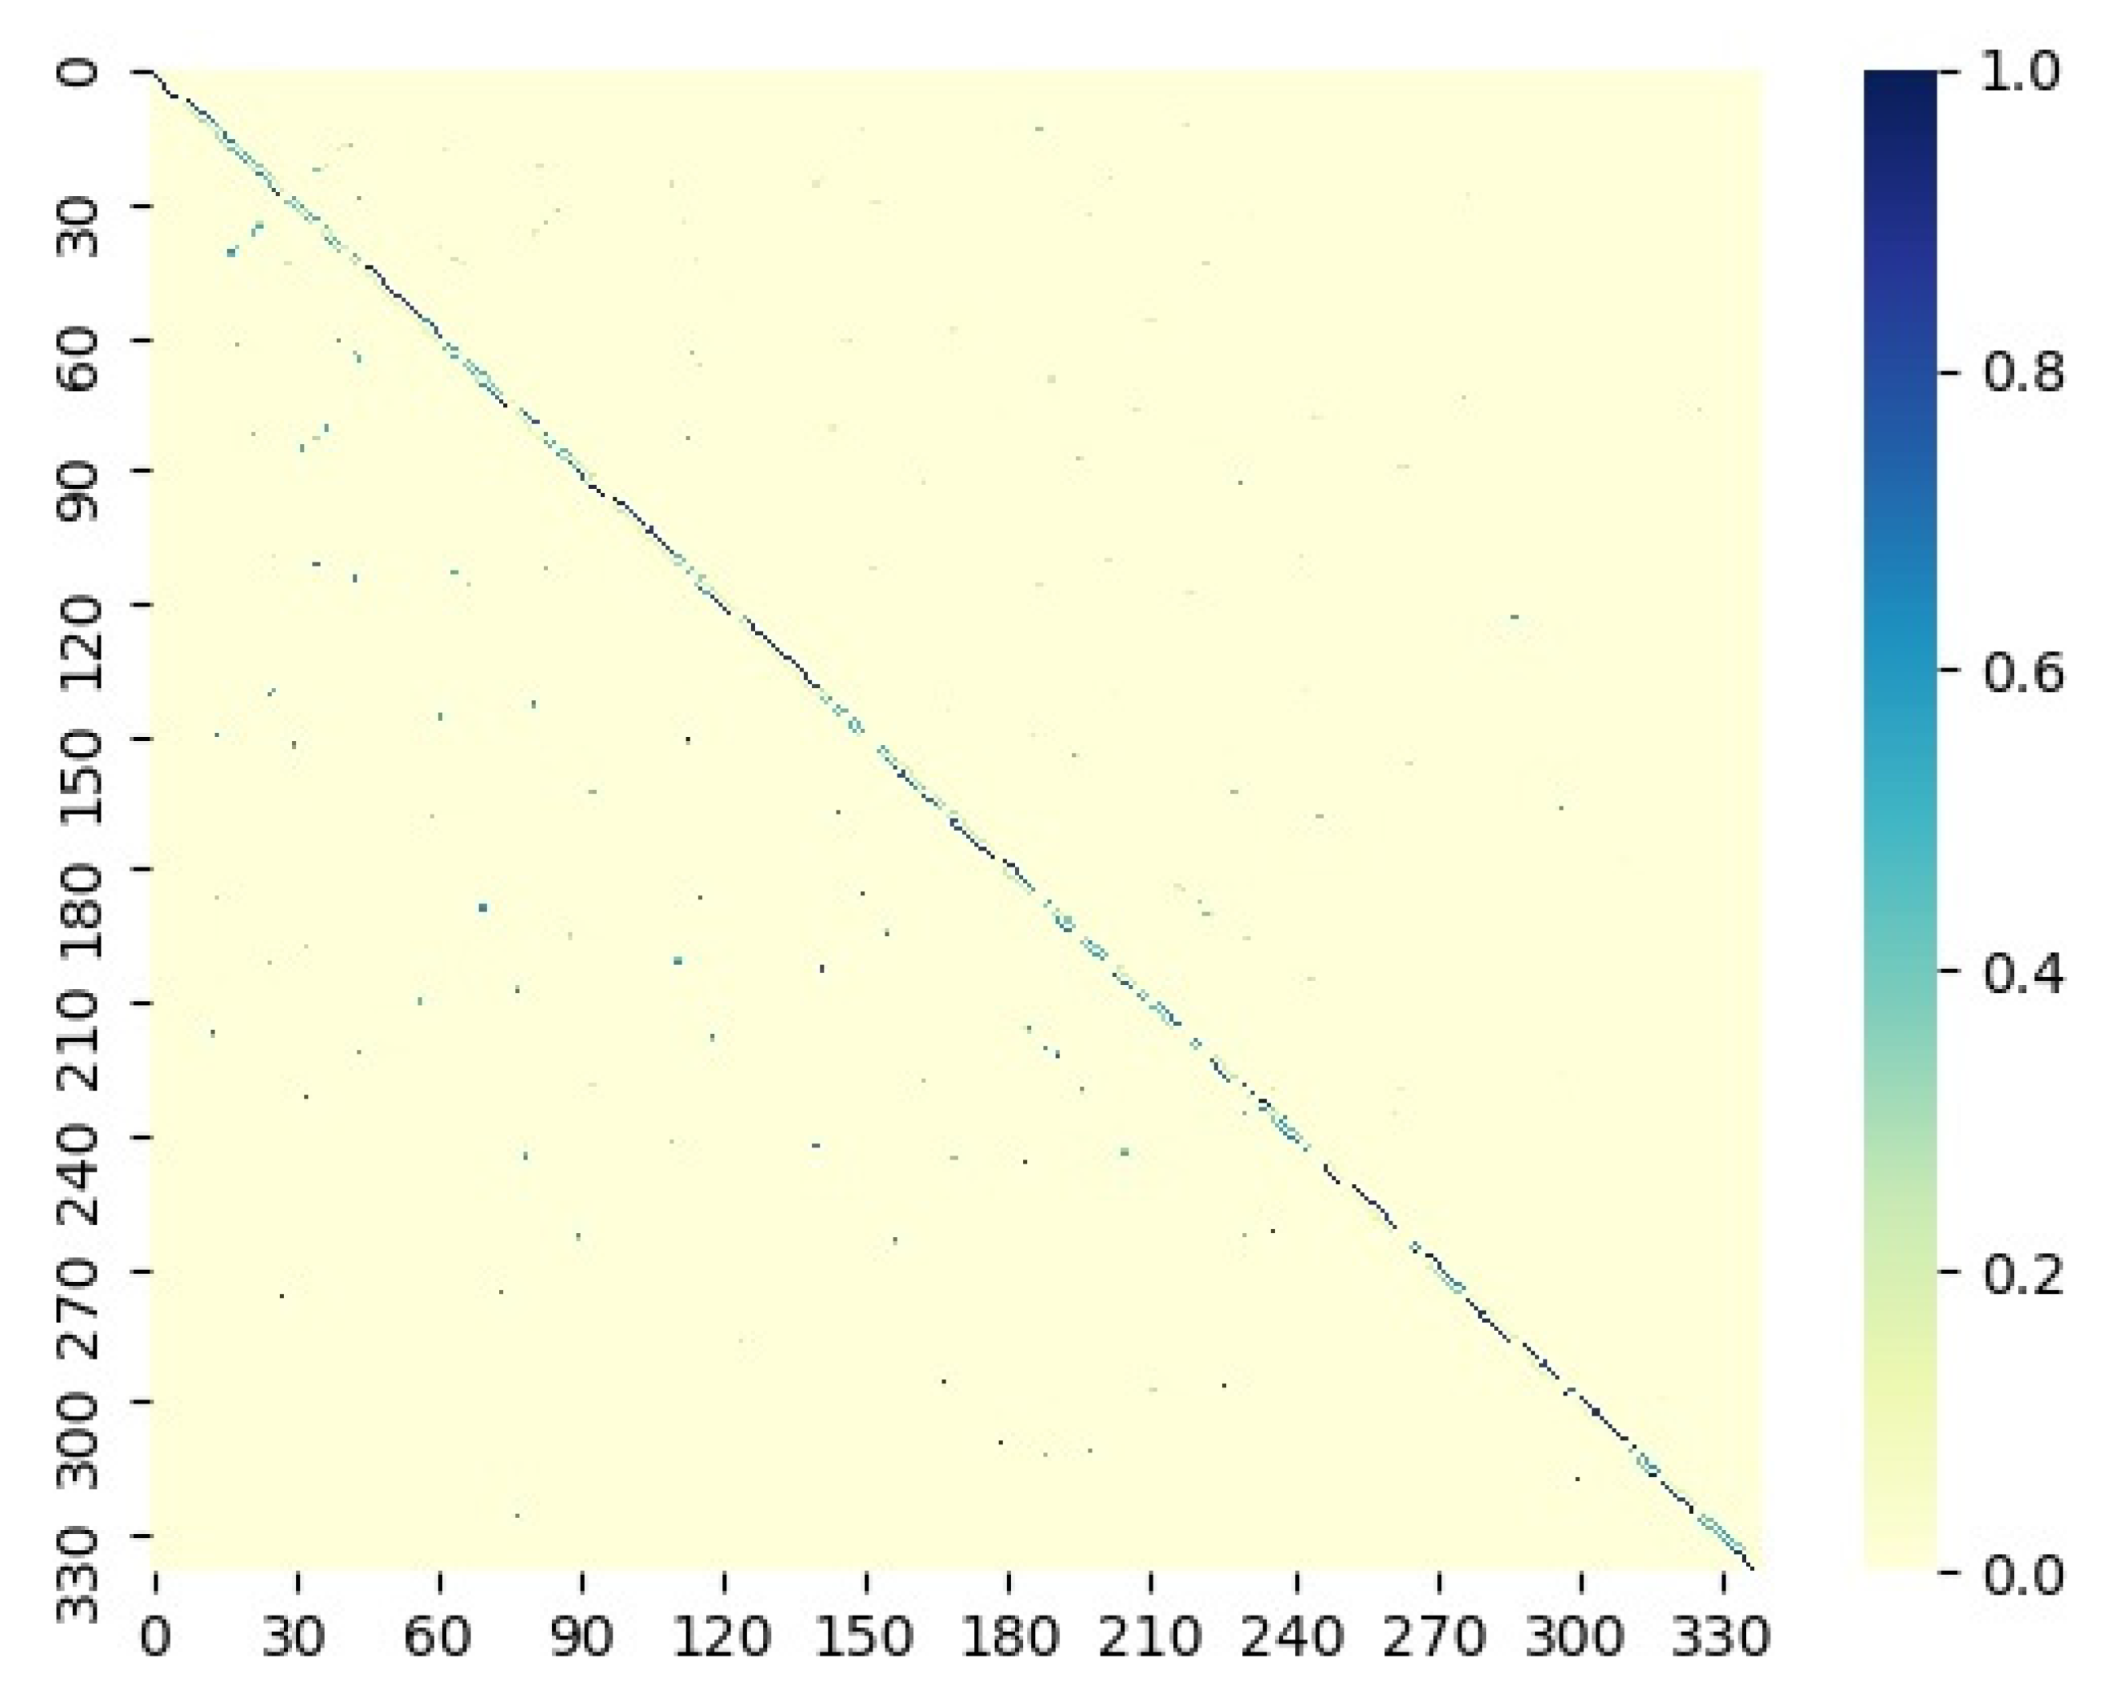
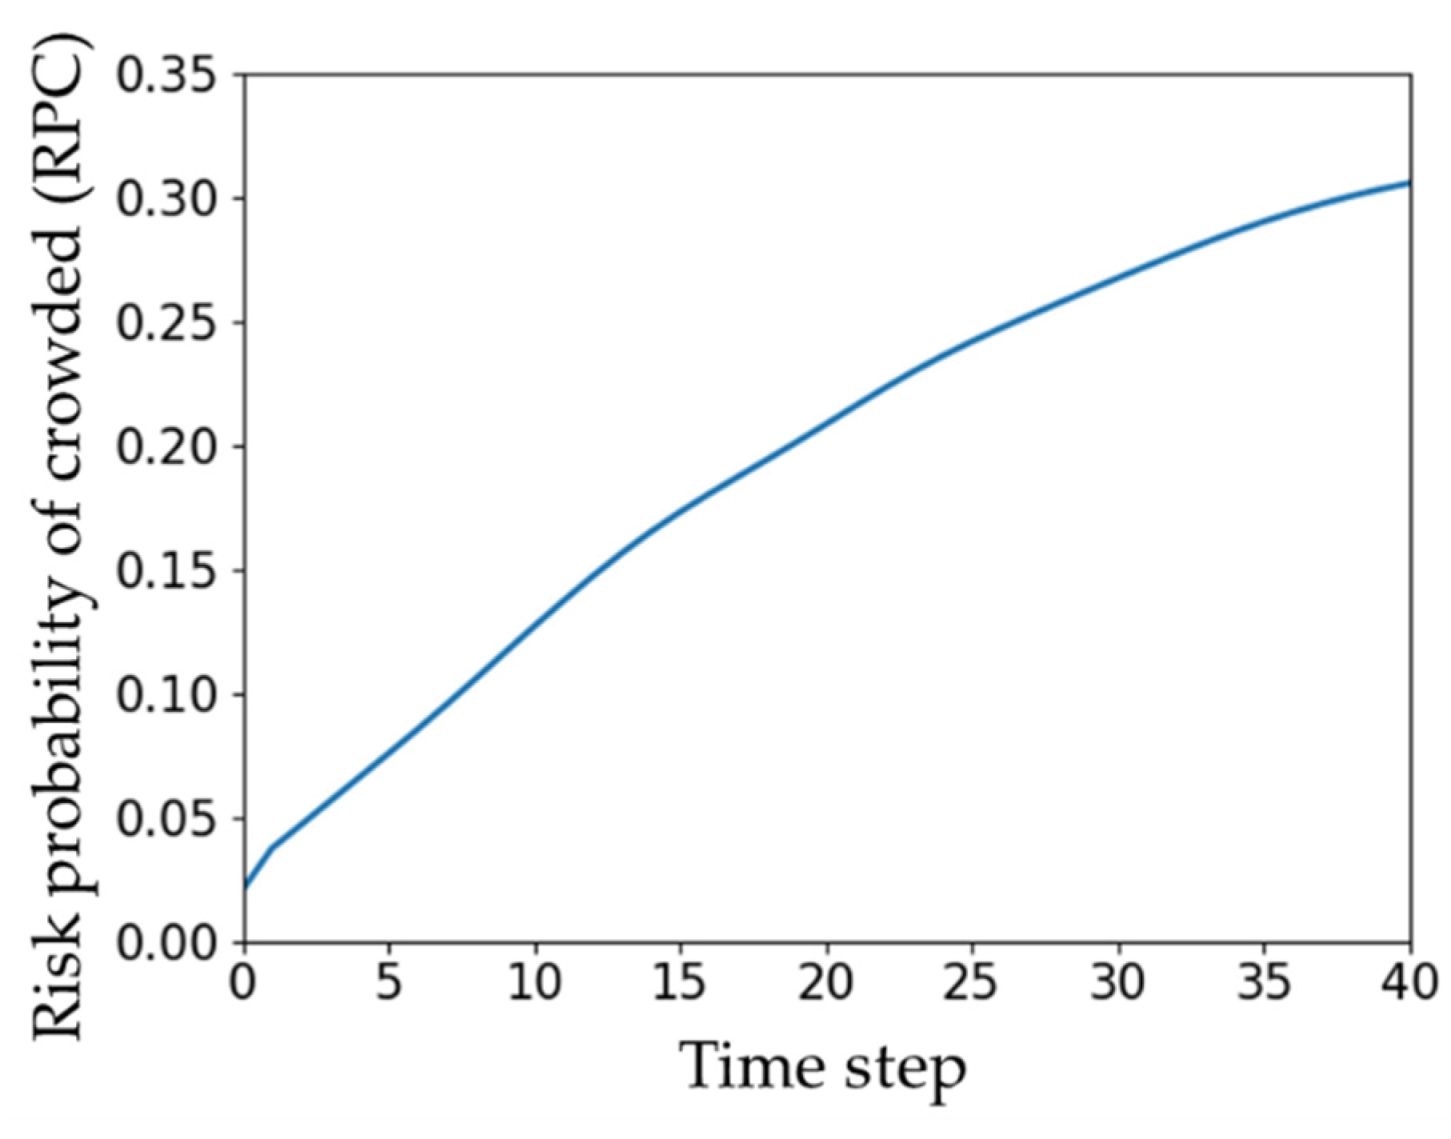
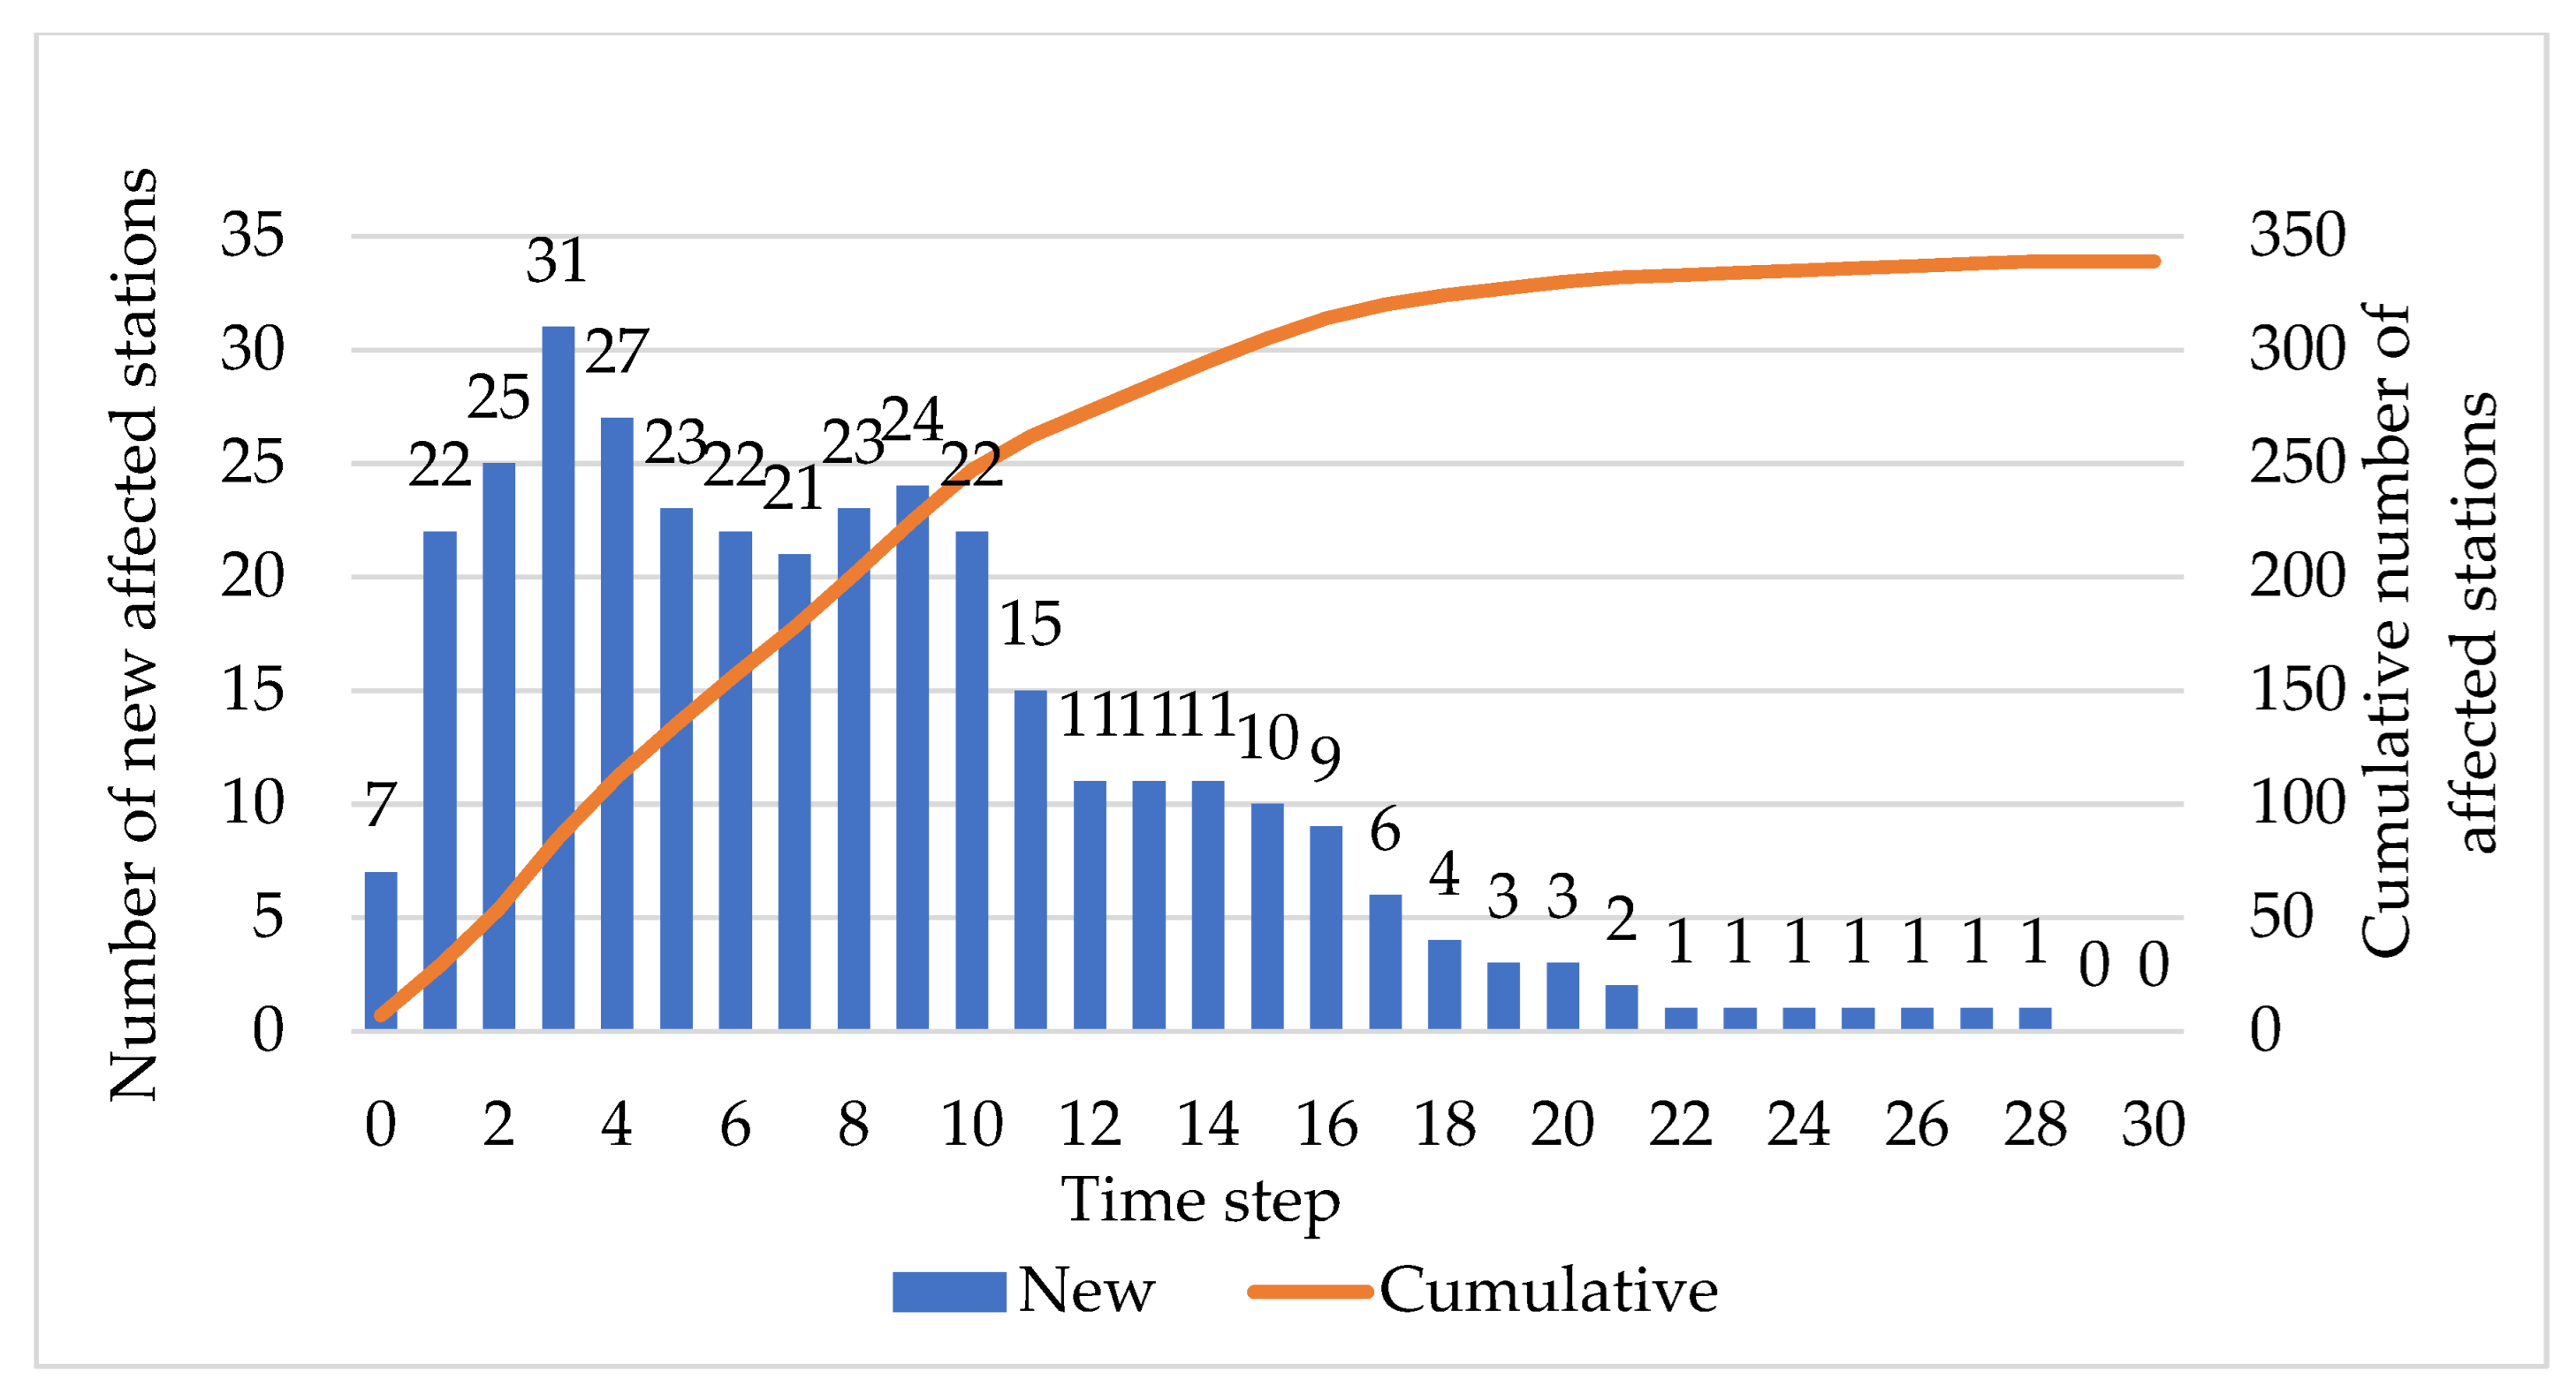
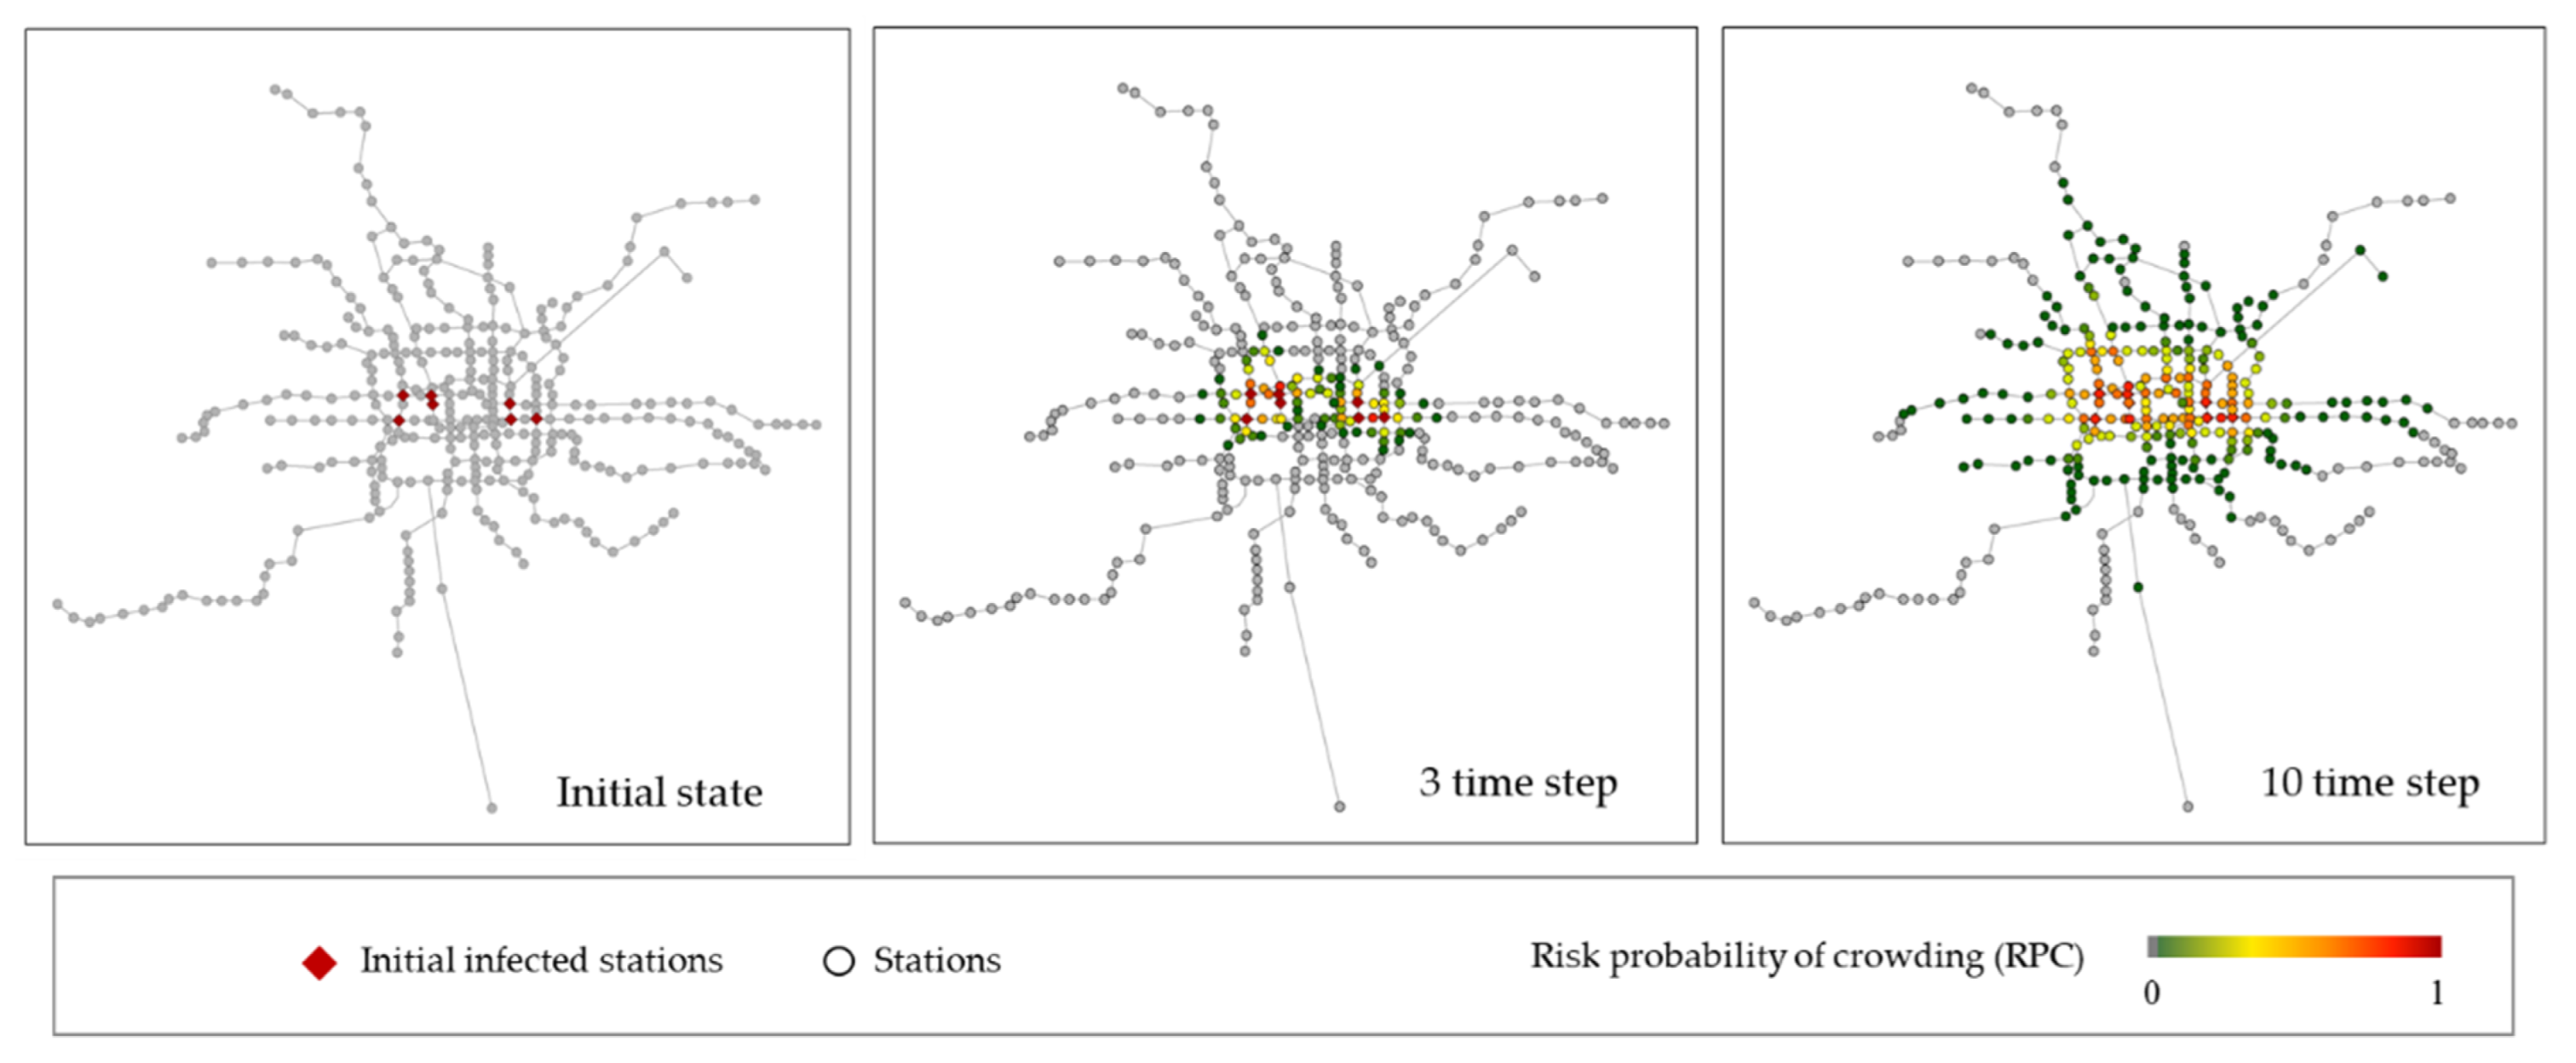
3.2. Spatiotemporal Analysis of Crowding Propagation

The crowding propagation will be analyzed in both temporal and spatial dimensions. First, we analyzed the change in the time dimension. Considering that the average departure interval of the morning peak is around 3 min, each time step is set as 3 min. For example, 20 scale places represent one hour elapsed from point 0, and 40 scale places represent two hours elapsed. The average infection probability of the whole network is shown in Figure 7. After two hours of propagation, the average RPC across the network is about 0.3. In order to obtain a clearer overview of the number of affected stations at each time step, a statistical graph is presented in Figure 8. The initial number of infected nodes was 7, and 22 more were affected in the first-time step. The highest number of stations was spread at the third time step for 31 stations, and by the 10th time step, 73% of the stations had been affected. The affected rate was faster in the early part of the process and leveled off in the later part. An hour’s time spread to almost the entire network.
The propagation is centered on the initially infected node and spreads outward, as shown in Figure 9. The color value of the node in the figure is the RPC of the node in a given time step. The nodes closer to the initially infected node are more affected over time. Figure 10 represents the average RPC of the nodes within 2 h. It is worth noting that the transfer nodes encountered in the process of diffusion have a bigger average RPC than others, which is consistent with reality and justifies the rationality of k value. Although the entire network is known to be rippled, as depicted in Figure 8, it can be seen in Figure 10 that the RPC has been greatly diminished after it has propagated to a certain range. It does not have much effect on stations far from the initial congested stations.
Based on the above spatio-temporal analysis, the following can be summarized.
(1)
After the crowd occurs at some stations, it will spread to the majority of the network within half an hour. Then the propagation speed decreases and spreads throughout the network for about one and a half hours.
(2)
The propagation distance outward is limited, and the propagation strength decreases as the distance increases. The transfer nodes are more affected during propagation.

4. Discussion

When crowding happens in the metro network, the entrance passenger flow can be reduced by means of flow restrictions. Since the control will affect the travel of some passengers, it is desirable that as few stations as possible take the measure of restricting the flow in the shortest possible time. To address this issue, we use the above case study as a basis to explore more deeply which stations can be taken measure to better reduce the spread of the crowd. The number of affected stations and the average RPC of the network at each time step are observed by applying traffic restriction measures to each of the initially congested stations. The locations and the index of the initial congested stations are depicted in Figure 11. The results are shown in Figure 12 and Table 1.
It can be seen that the intervention is more effective for nodes 25 and 44, which can reduce the spread of the crowd at the third time step and can reduce the RPC. Between them, node 44 is the transfer node of three lines and is the node with the highest passenger demand among these seven. Node 25, which has the second-last presence of the seven in terms of passenger demand, is more on the sparse periphery compared to several other nodes. Thus, its relief provides more carrying space for external flows into the city.
In addition to the above-mentioned restrictions on the station, the service capacity of the station can also be changed, such as increasing the frequency of departures on the line where the station is located during peak periods. Moreover, information technology is introduced to transmit crowding information to passengers through station announcements, etc., so that they can reconsider their travel paths when they depart. When the alternative paths are fewer crowds and the travel time is within their acceptable range, passengers will change their travel paths, thus spontaneously alleviating the crowd in the metro.

5. Conclusions

In this paper, a modified SIS crowding propagation model is proposed to quickly and simply predict the crowd propagation in the metro network, considering the actual carrying passenger flow and infected rate of each station. The main contributions are as follows:
(1)
Within half an hour, the majority of the network will become affected once it starts to happen at some stations. Following then, the propagation speed slows down.
(2)
The propagation strength diminishes with increasing distance. During propagation, the transfer nodes are significantly impacted.
(3)
Imposing control at the nodes with the highest demand or relatively peripheral nodes is more effective than other nodes.
The method proposed in this paper is generalizable for metro systems in other countries and cities. It can provide a reference for metro operating companies to develop regulation strategies, to reduce the probability of crowd occurrence and propagation in the metro network. It ensures the reliability of people’s travel and promotes the sustainable development of the metro operation. In future studies, the impact of land property near metro stations on crowd propagation can be considered.

Author Contributions

Conceptualization, S.Z. and C.J.; methodology and software, S.Z. and B.C.; writing—original draft preparation, S.Z.; writing—review and editing, C.J. and H.Q.; visualization, S.Z.; supervision, H.Q. and K.Z.; funding acquisition, C.J. and K.Z. All authors have read and agreed to the published version of the manuscript.

Funding

The research is funded by the National Key Research and Development Program of China (Grant No. 2020YFB1600703).

Conflicts of Interest

The authors declare no conflict of interest. The funders had no role in the design of the study; in the collection, analyses, or interpretation of data; in the writing of the manuscript, or in the decision to publish the results.

References

  1. Bačić, T. China: Metro Openings Hit Record High. Metro Report. 2021. Available online: https://www.railwaygazette.com/long-reads/china-metro-openings-hit-record-high/58572.article (accessed on 26 February 2021).
  2. Luo, Q.; Hou, Y.; Li, W.; Zhang, X. In Study on the Propagation Mechanism of Large Passenger Flow in Urban Rail Transit. In Proceedings of the 2018 3rd IEEE International Conference on Intelligent Transportation Engineering (ICITE), Singapore, 3–5 September 2018; pp. 100–104. [Google Scholar]
  3. Norgate, S.H.; Cooper-Ryan, A.M.; Lavin, S.; Stonier, C.; Cooper, C.L. The impact of public transport on the health of work commuters: A systematic review. Health Psychol. Rev. 2020, 14, 325–344. [Google Scholar] [CrossRef] [PubMed]
  4. Higgins, C.D.; Sweet, M.N.; Kanaroglou, P.S. All minutes are not equal: Travel time and the effects of congestion on commute satisfaction in Canadian cities. Transportation 2018, 45, 1249–1268. [Google Scholar] [CrossRef]
  5. Nagy, A.M.; Simon, V. A novel congestion propagation modeling algorithm for smart cities. Pervasive Mob. Comput. 2021, 73, 101387. [Google Scholar] [CrossRef]
  6. Shang, P.; Li, R.; Guo, J.; Xian, K.; Zhou, X. Integrating Lagrangian and Eulerian observations for passenger flow state estimation in an urban rail transit network: A space-time-state hyper network-based assignment approach. Transp. Res. Part B Methodol. 2019, 121, 135–167. [Google Scholar] [CrossRef]
  7. Ding, X.; Zhao, Y.; Liu, Z.; Hu, H. The modeling of urban rail transit emergency delay propagation scope under network operation mode. Concurr. Comput. Pract. Exp. 2020, 32, e5530. [Google Scholar] [CrossRef]
  8. Li, M.; Zhou, X.; Wang, Y.; Jia, L.; An, M. Modelling cascade dynamics of passenger flow congestion in urban rail transit network induced by train delay. Alex. Eng. J. 2022, 61, 8797–8807. [Google Scholar] [CrossRef]
  9. Li, Y.; Zhao, L.; Yu, Z.; Wang, S. Traffic Flow Prediction with Big Data: A Learning Approach Based on SIS-Complex Networks. In Proceedings of the 2017 IEEE 2nd Information Technology, Networking, Electronic and Automation Control Conference (ITNEC), Chengdu, China, 15–17 December 2017; pp. 550–554. [Google Scholar]
  10. Saberi, M.; Hamedmoghadam, H.; Ashfaq, M.; Hosseini, S.A.; Gu, Z.; Shafiei, S.; Nair, D.J.; Dixit, V.; Gardner, L.; Waller, S.T.; et al. A simple contagion process describes spreading of traffic jams in urban networks. Nat. Commun. 2020, 11, 1616. [Google Scholar] [CrossRef] [PubMed] [Green Version]
  11. Ye, M.; Liu, J.; Cenedese, C.; Sun, Z.; Cao, M. A Network SIS Meta-Population Model with Transportation Flow. IFAC-Pap. 2020, 53, 2562–2567. [Google Scholar] [CrossRef]
  12. Wu, W.; Zhang, H.; Feng, T.; Witlox, F. A Network Modelling Approach to Flight Delay Propagation: Some Empirical Evidence from China. Sustainability 2019, 11, 4408. [Google Scholar] [CrossRef] [Green Version]
  13. Shi, Z.; Zhang, N.; Zhu, L. Understanding the Propagation and Control Strategies of Congestion in Urban Rail Transit Based on Epidemiological Dynamics Model. Information 2019, 10, 258. [Google Scholar] [CrossRef] [Green Version]
  14. Yu, W.; Ye, X.; Chen, J.; Yan, X.; Wang, T. Evaluation Indexes and Correlation Analysis of Origination–Destination Travel Time of Nanjing Metro Based on Complex Network Method. Sustainability 2020, 12, 1113. [Google Scholar] [CrossRef] [Green Version]
  15. Huang, Z.; Xu, R.; Fan, W.; Zhou, F.; Liu, W. Service-Oriented Load Balancing Approach to Alleviating Peak-Hour Congestion in a Metro Network Based on Multi-Path Accessibility. Sustainability 2019, 11, 1293. [Google Scholar] [CrossRef] [Green Version]
  16. Peng, H.; Zhu, Y. Intercity Train Operation Schemes Based on Passenger Flow Dynamic Assignment. J. Transp. Syst. Eng. Inf. Technol. 2013, 13, 111–117. [Google Scholar] [CrossRef]
  17. Sun, L.; Lu, Y.; Jin, J.G.; Lee, D.; Axhausen, K.W. An integrated Bayesian approach for passenger flow assignment in metro networks. Transp. Res. Part C Emerg. Technol. 2015, 52, 116–131. [Google Scholar] [CrossRef]
  18. Poulhès, A. Dynamic assignment model of trains and users on a congested urban-rail line. J. Rail Transp. Plan. Manag. 2020, 14, 100178. [Google Scholar] [CrossRef]
  19. Deng, L.; Zeng, J.; Mei, H. Passenger Flow Pushing Assignment Method for an Urban Rail Network Based on Hierarchical Path and Line Decomposition. Sustainability 2019, 11, 6441. [Google Scholar] [CrossRef] [Green Version]
  20. Zeng, Z.; Li, T. Analyzing Congestion Propagation on Urban Rail Transit Oversaturated Conditions: A Framework Based on SIR Epidemic Model. Urban Rail Transit 2018, 4, 130–140. [Google Scholar] [CrossRef]
  21. Wu, J.; Gao, Z.; Sun, H. Simulation of Traffic Congestion with SIR Model. Mod. Phys. Lett. B 2004, 30, 1537–1542. [Google Scholar] [CrossRef]
  22. Baspinar, B.; Koyuncu, E.; Reyhanoglu, M. A Data-Driven Air Transportation Delay Propagation Model Using Epidemic Process Models. Int. J. Aerosp. Eng. 2016, 2016, 4836260. [Google Scholar] [CrossRef]
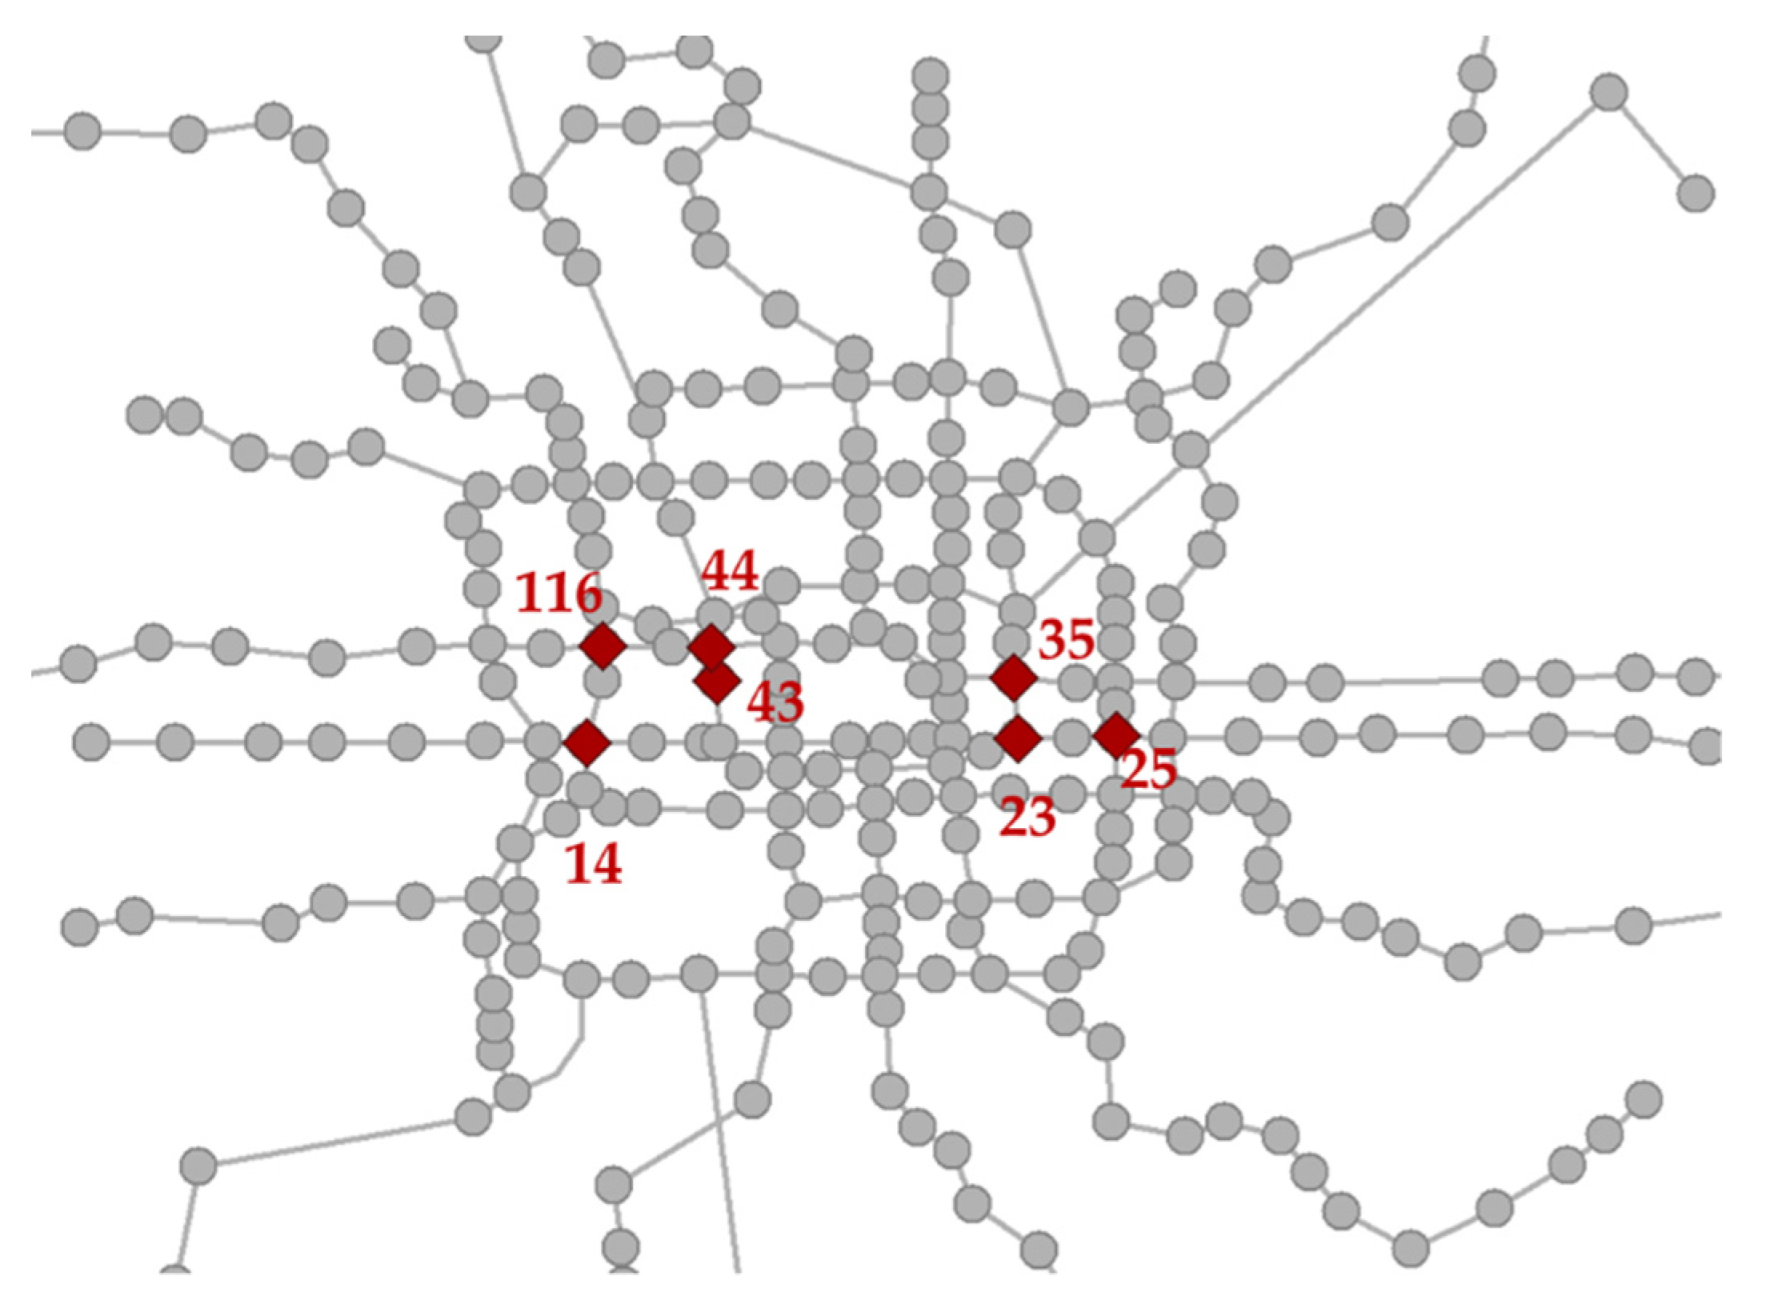
Figure 1. Flow chart of the method.
Sustainability 14 09829 g001
Figure 2. The representation of notations.
Sustainability 14 09829 g002
Figure 3. The transformation relationship between S and I in metro network.
Sustainability 14 09829 g003
Figure 4. The passing flow of Beijing metro network in morning rush hour. (a) 7:00 to 8:00. (b) 8:00 to 9:00.
Sustainability 14 09829 g004
Figure 5. The infected rate k of stations.
Sustainability 14 09829 g005
Figure 6. The recovery rate of each station.
Sustainability 14 09829 g006
Figure 7. The average probability of crowding with the time.
Sustainability 14 09829 g007
Figure 8. The number of affected stations with the time.
Sustainability 14 09829 g008
Figure 9. Spatial distribution of risk probability of crowding on different time step.
Sustainability 14 09829 g009
Figure 10. Spatial distribution of average risk probability of crowding.
Sustainability 14 09829 g010
Figure 11. The location of the initial infected stations.
Sustainability 14 09829 g011
Figure 12. The number of new affected stations in each time step.
Sustainability 14 09829 g012
Table 1. The average risk probability of crowding at the network.
Intervention Station Number142325354344116
Average RPC of the whole network among two hours0.1850.1900.1840.1900.1910.1890.190
Publisher’s Note: MDPI stays neutral with regard to jurisdictional claims in published maps and institutional affiliations.

