
Microstructure and Strength Properties of Sustainable Concrete Using Effective Microorganisms as a Self-Curing Agent


 ,
,  , and
, and 
Abstract
:1. Introduction
2. Methodology
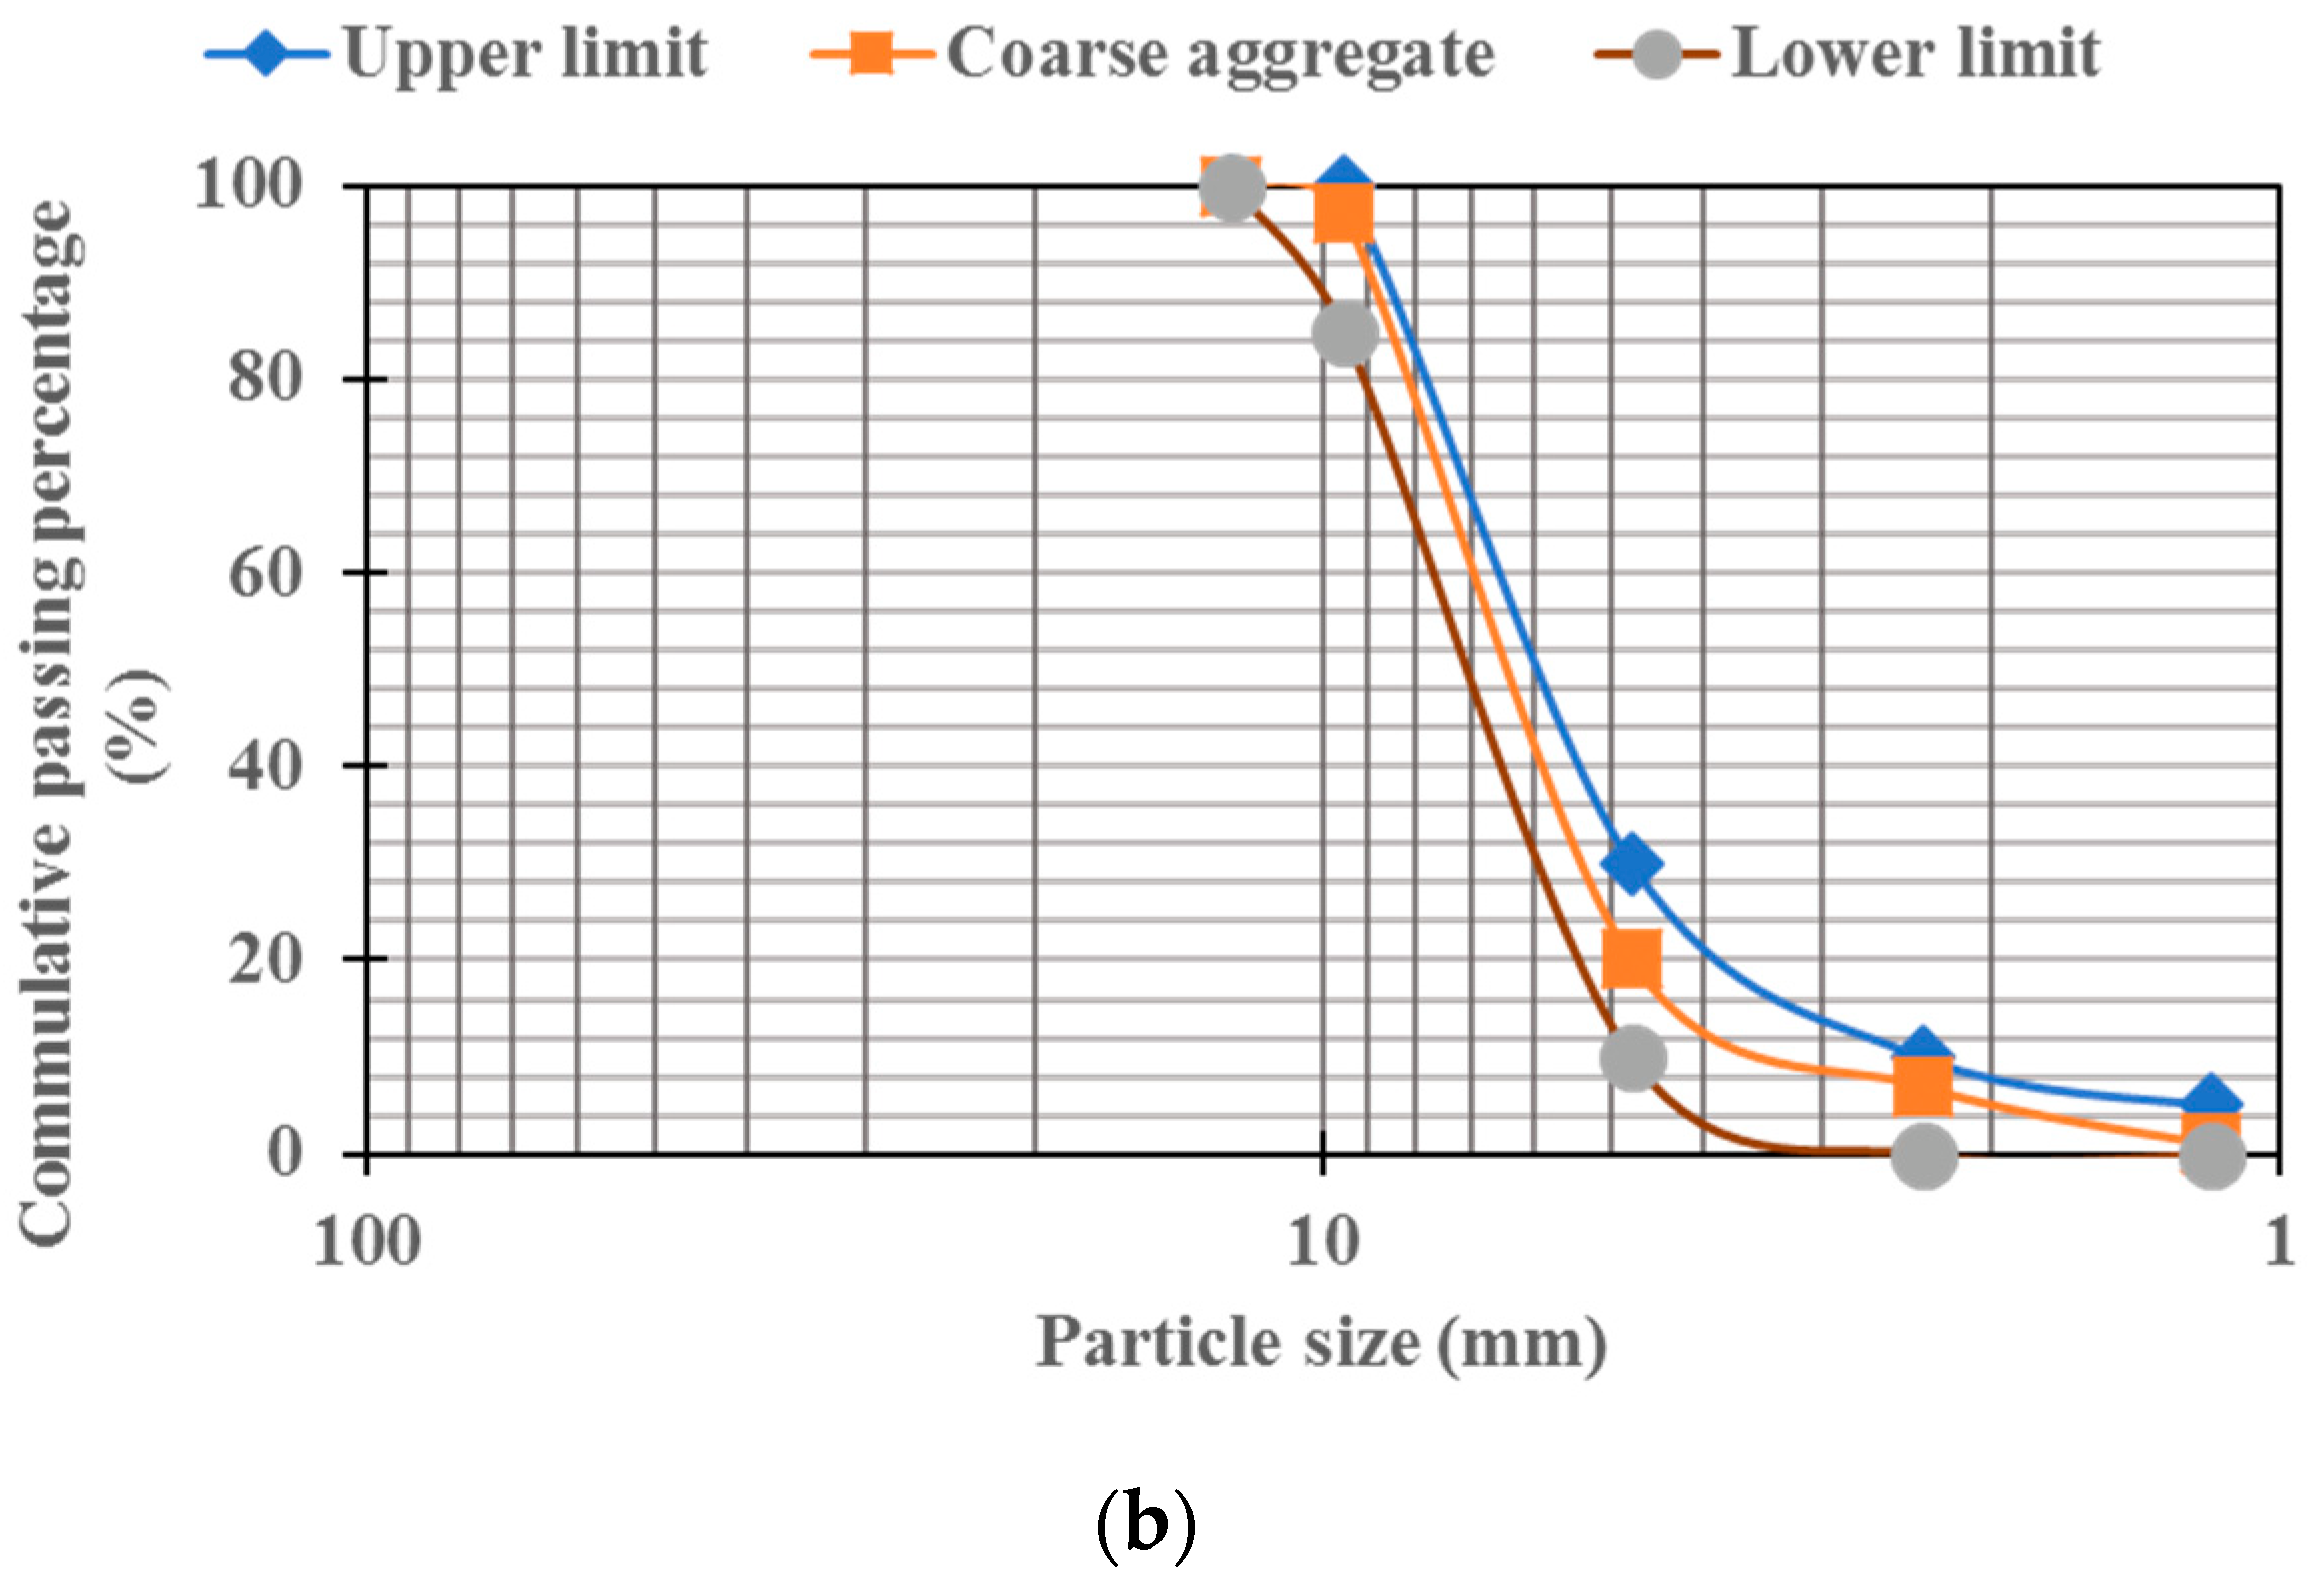
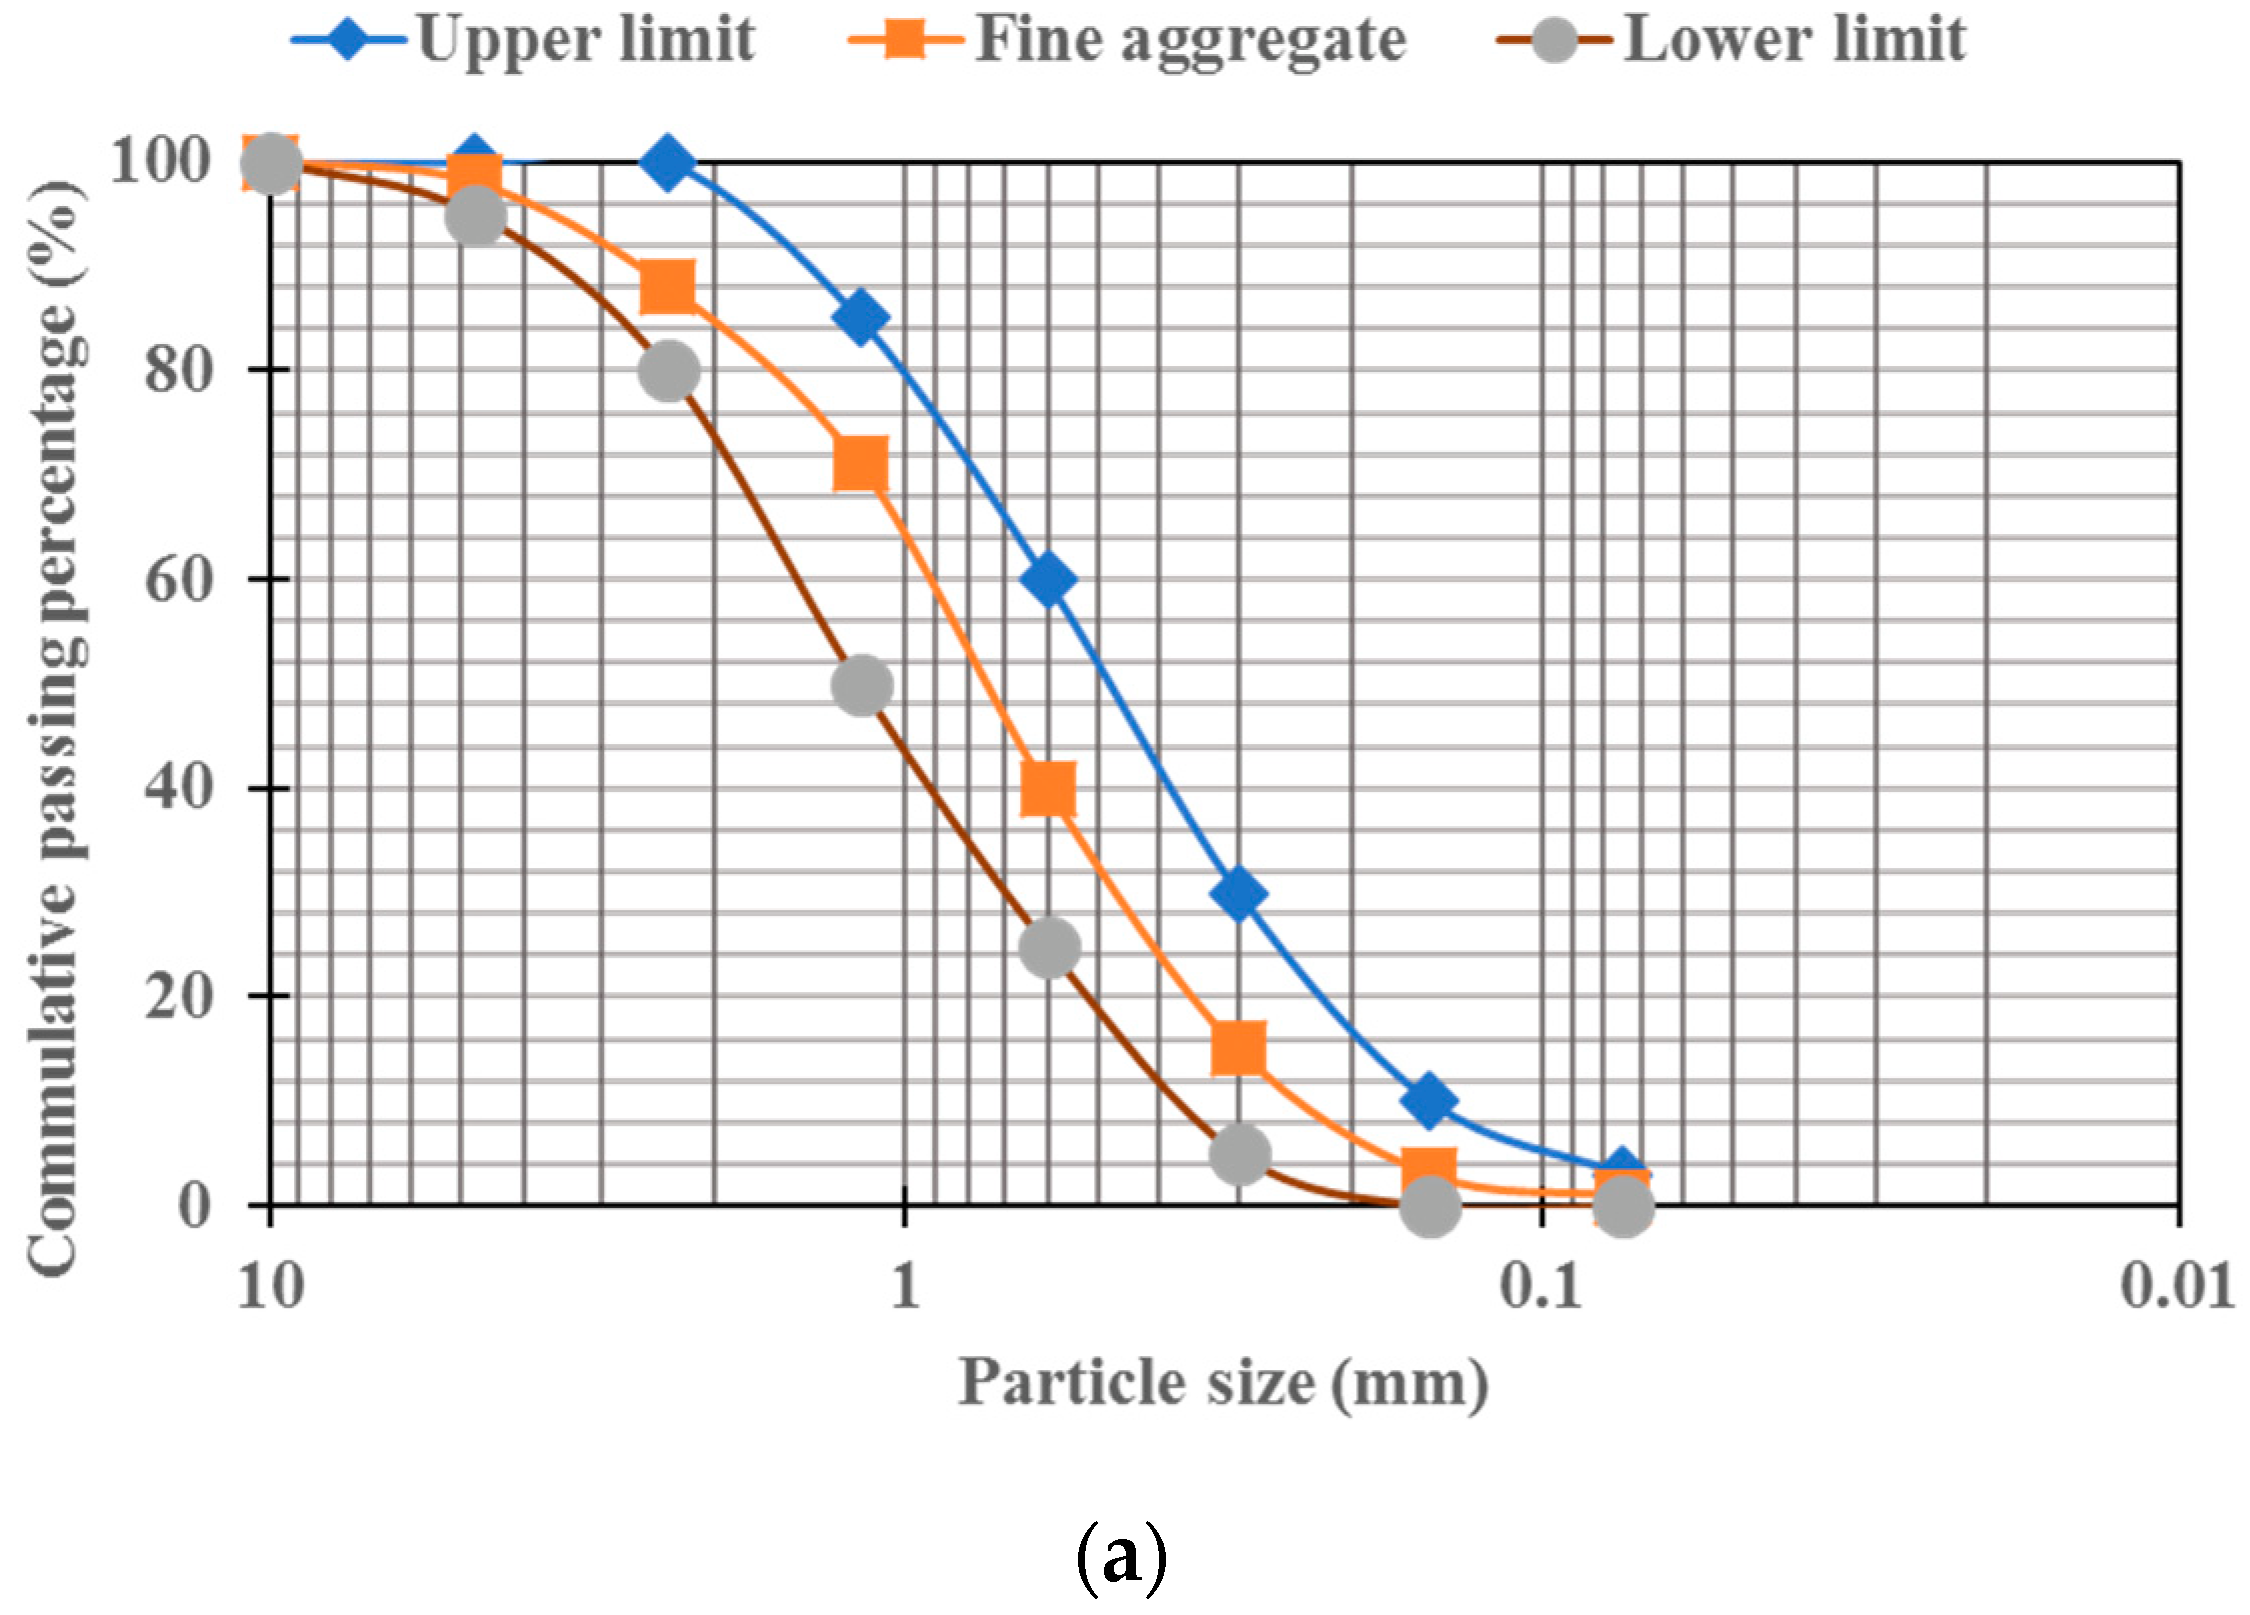
2.1. Materials
2.2. Mixes Design and Specimens’ Preparation
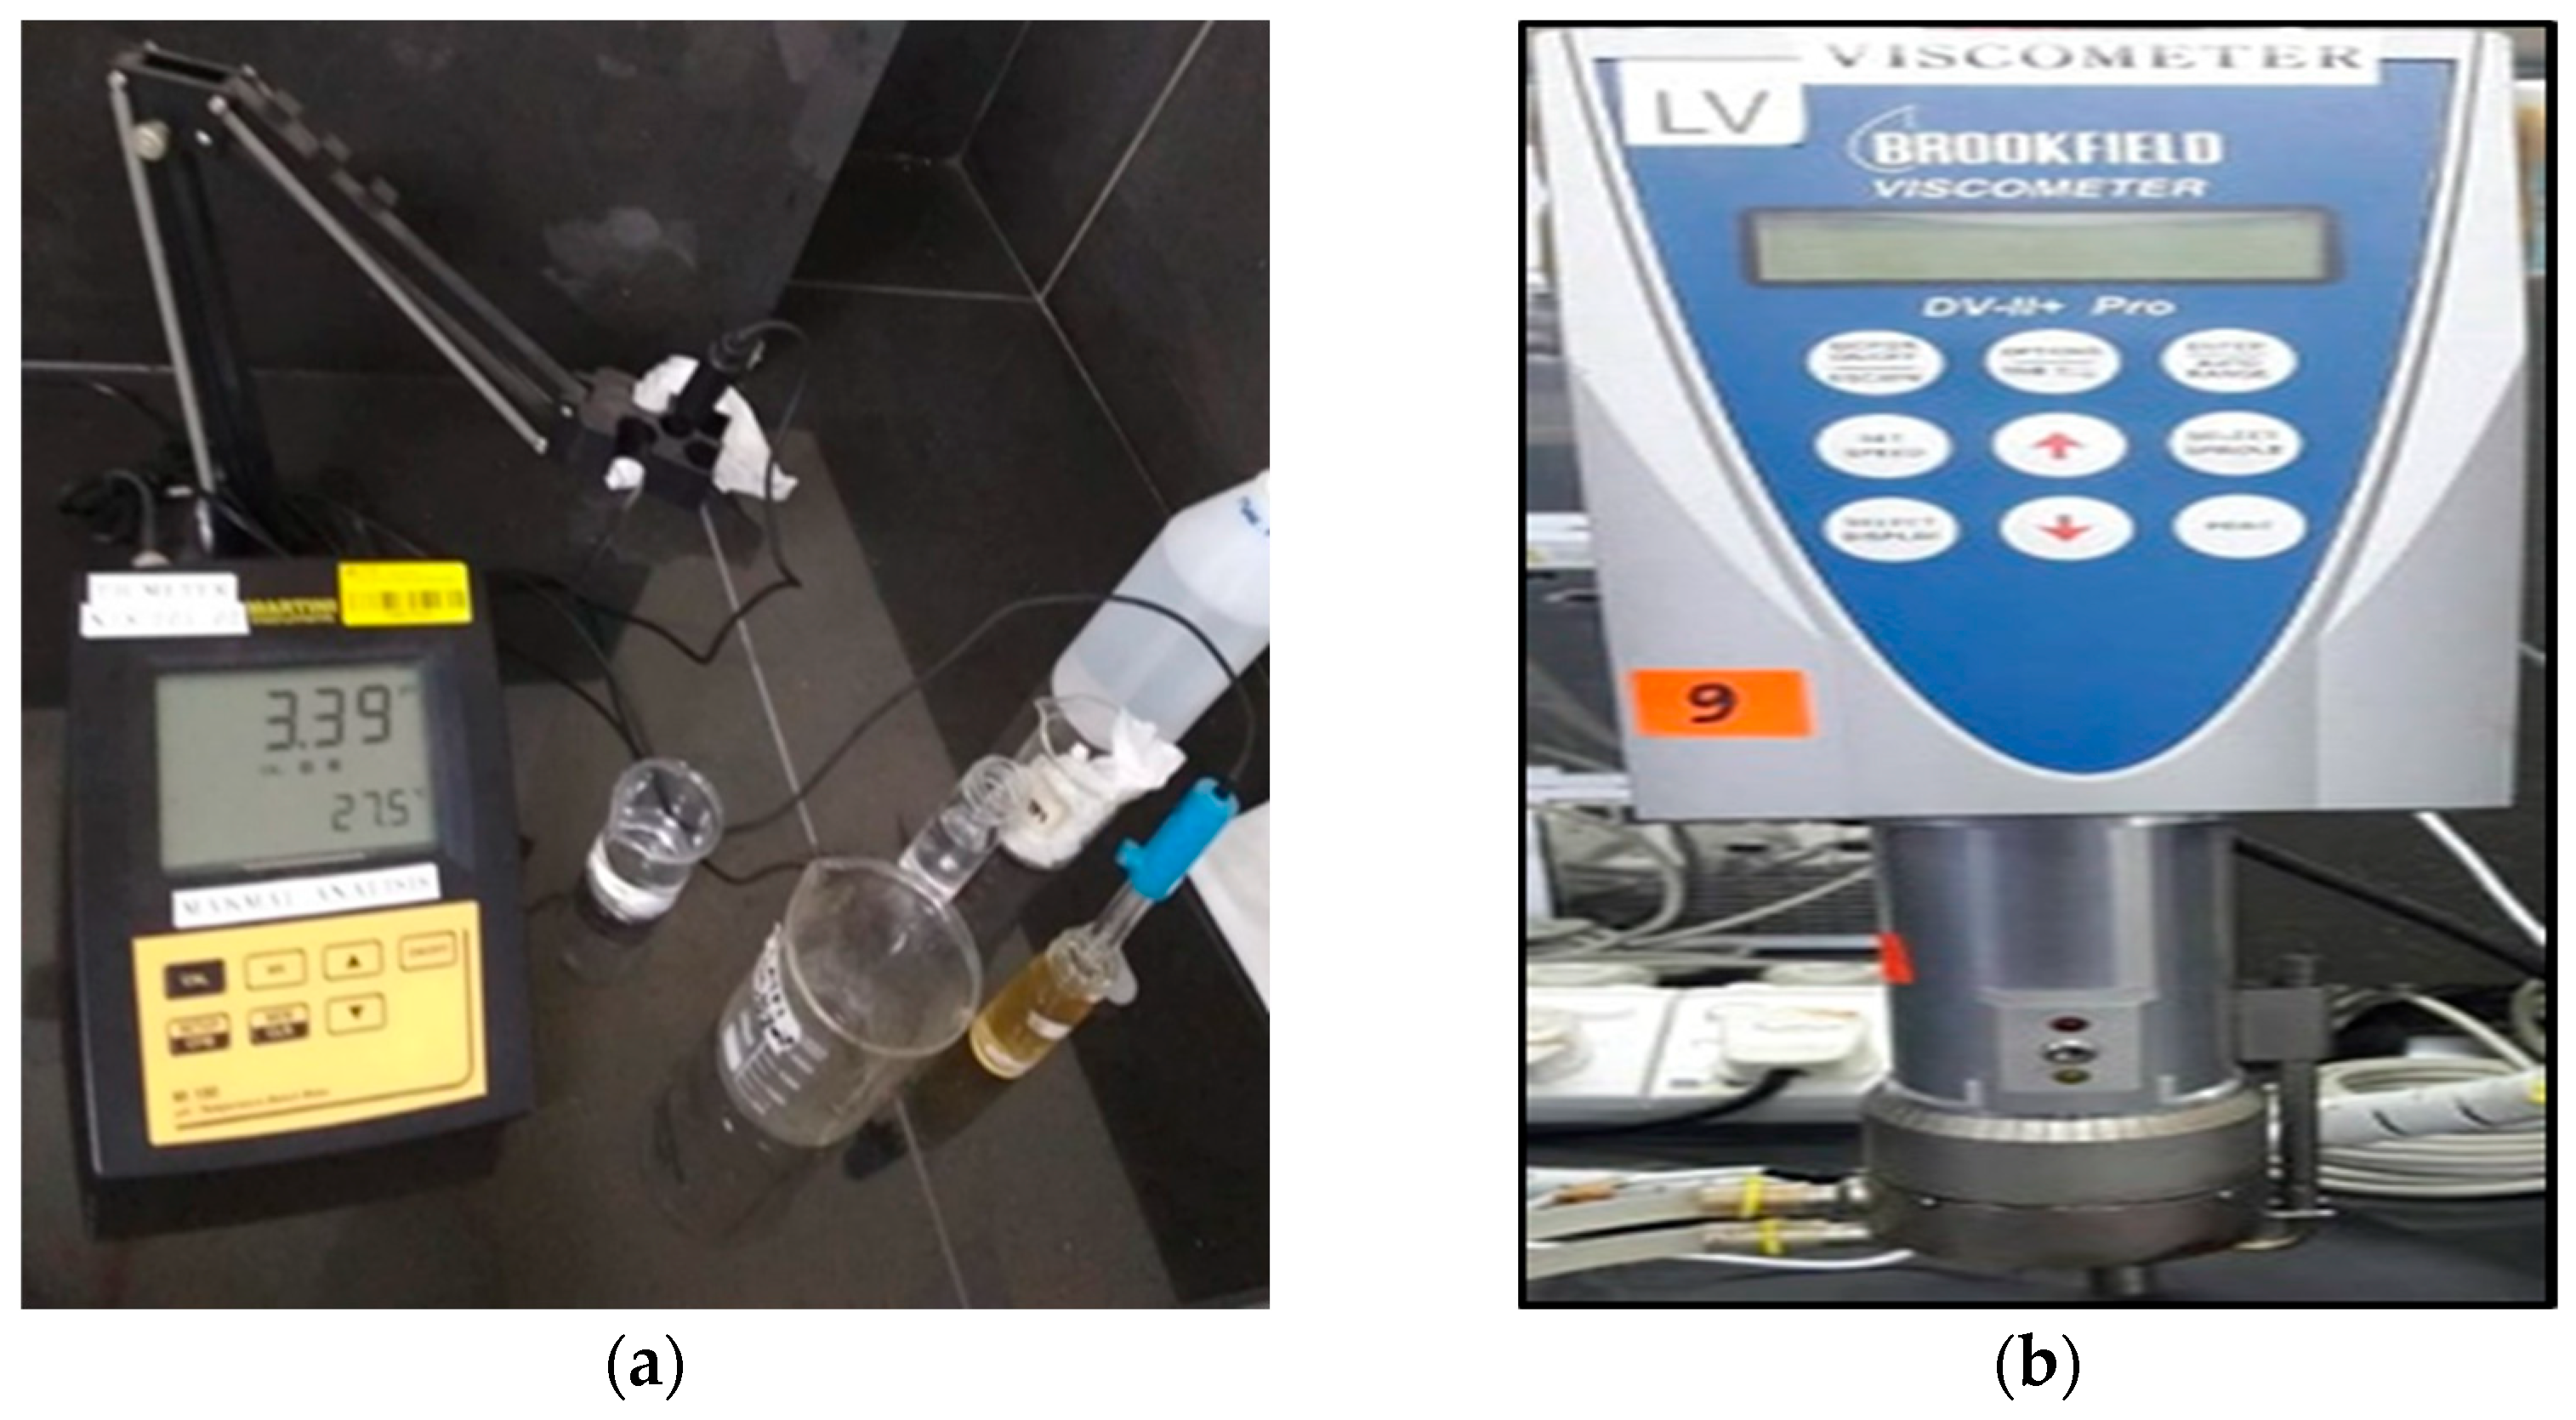
2.3. Tests for Characterizations
3. Results and Discussion
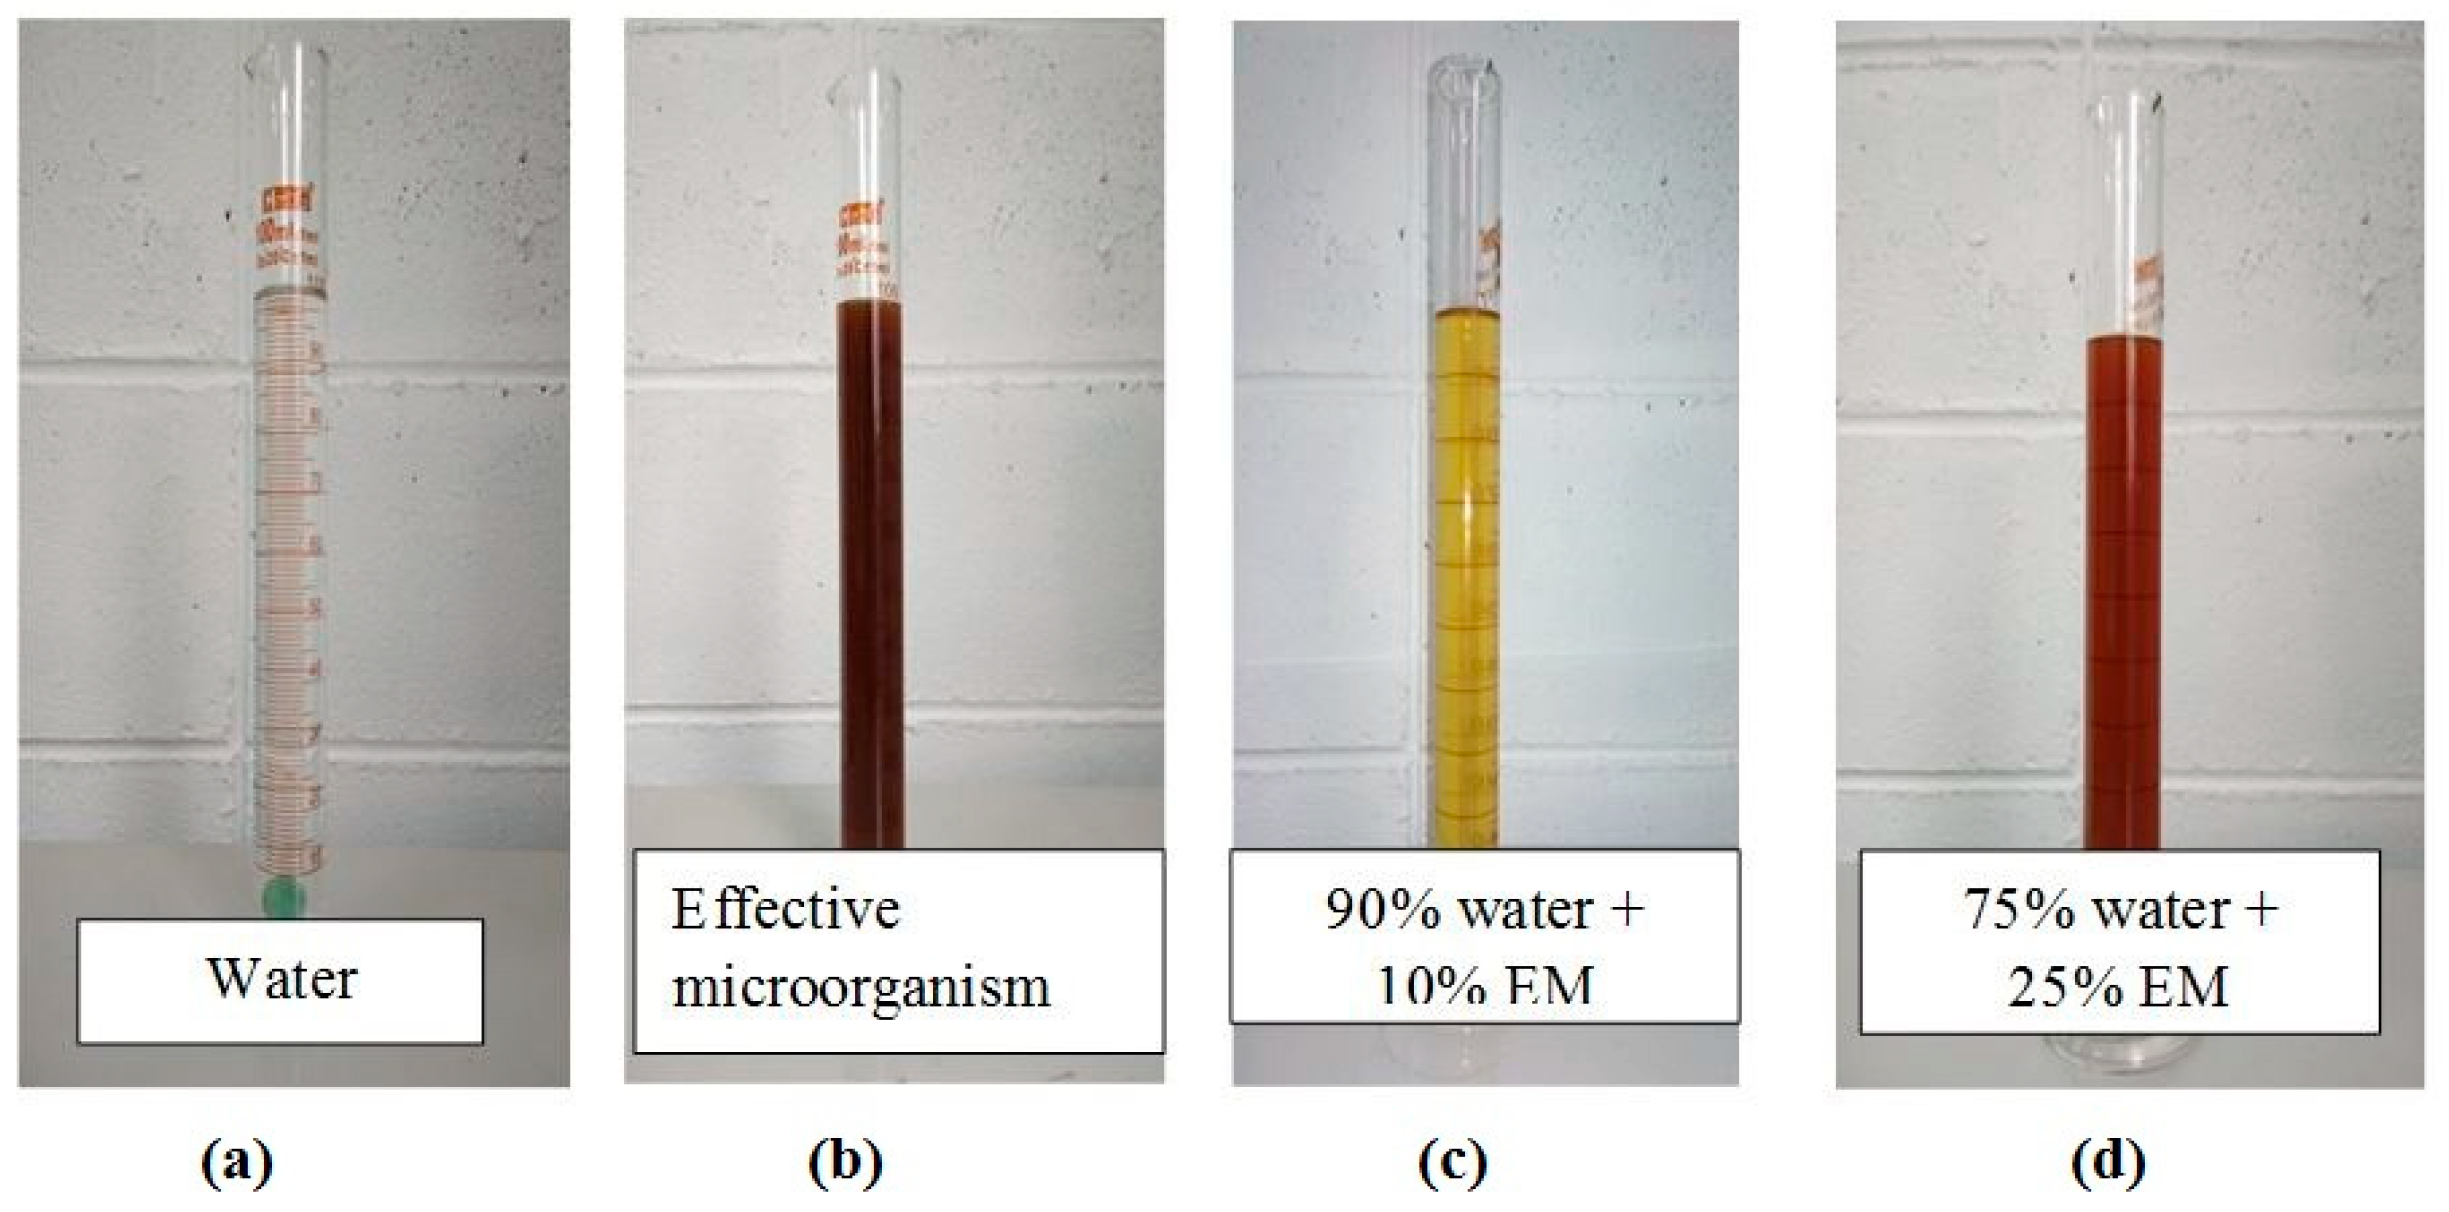
3.1. Physical Properties and Homogeneity of EM Solution
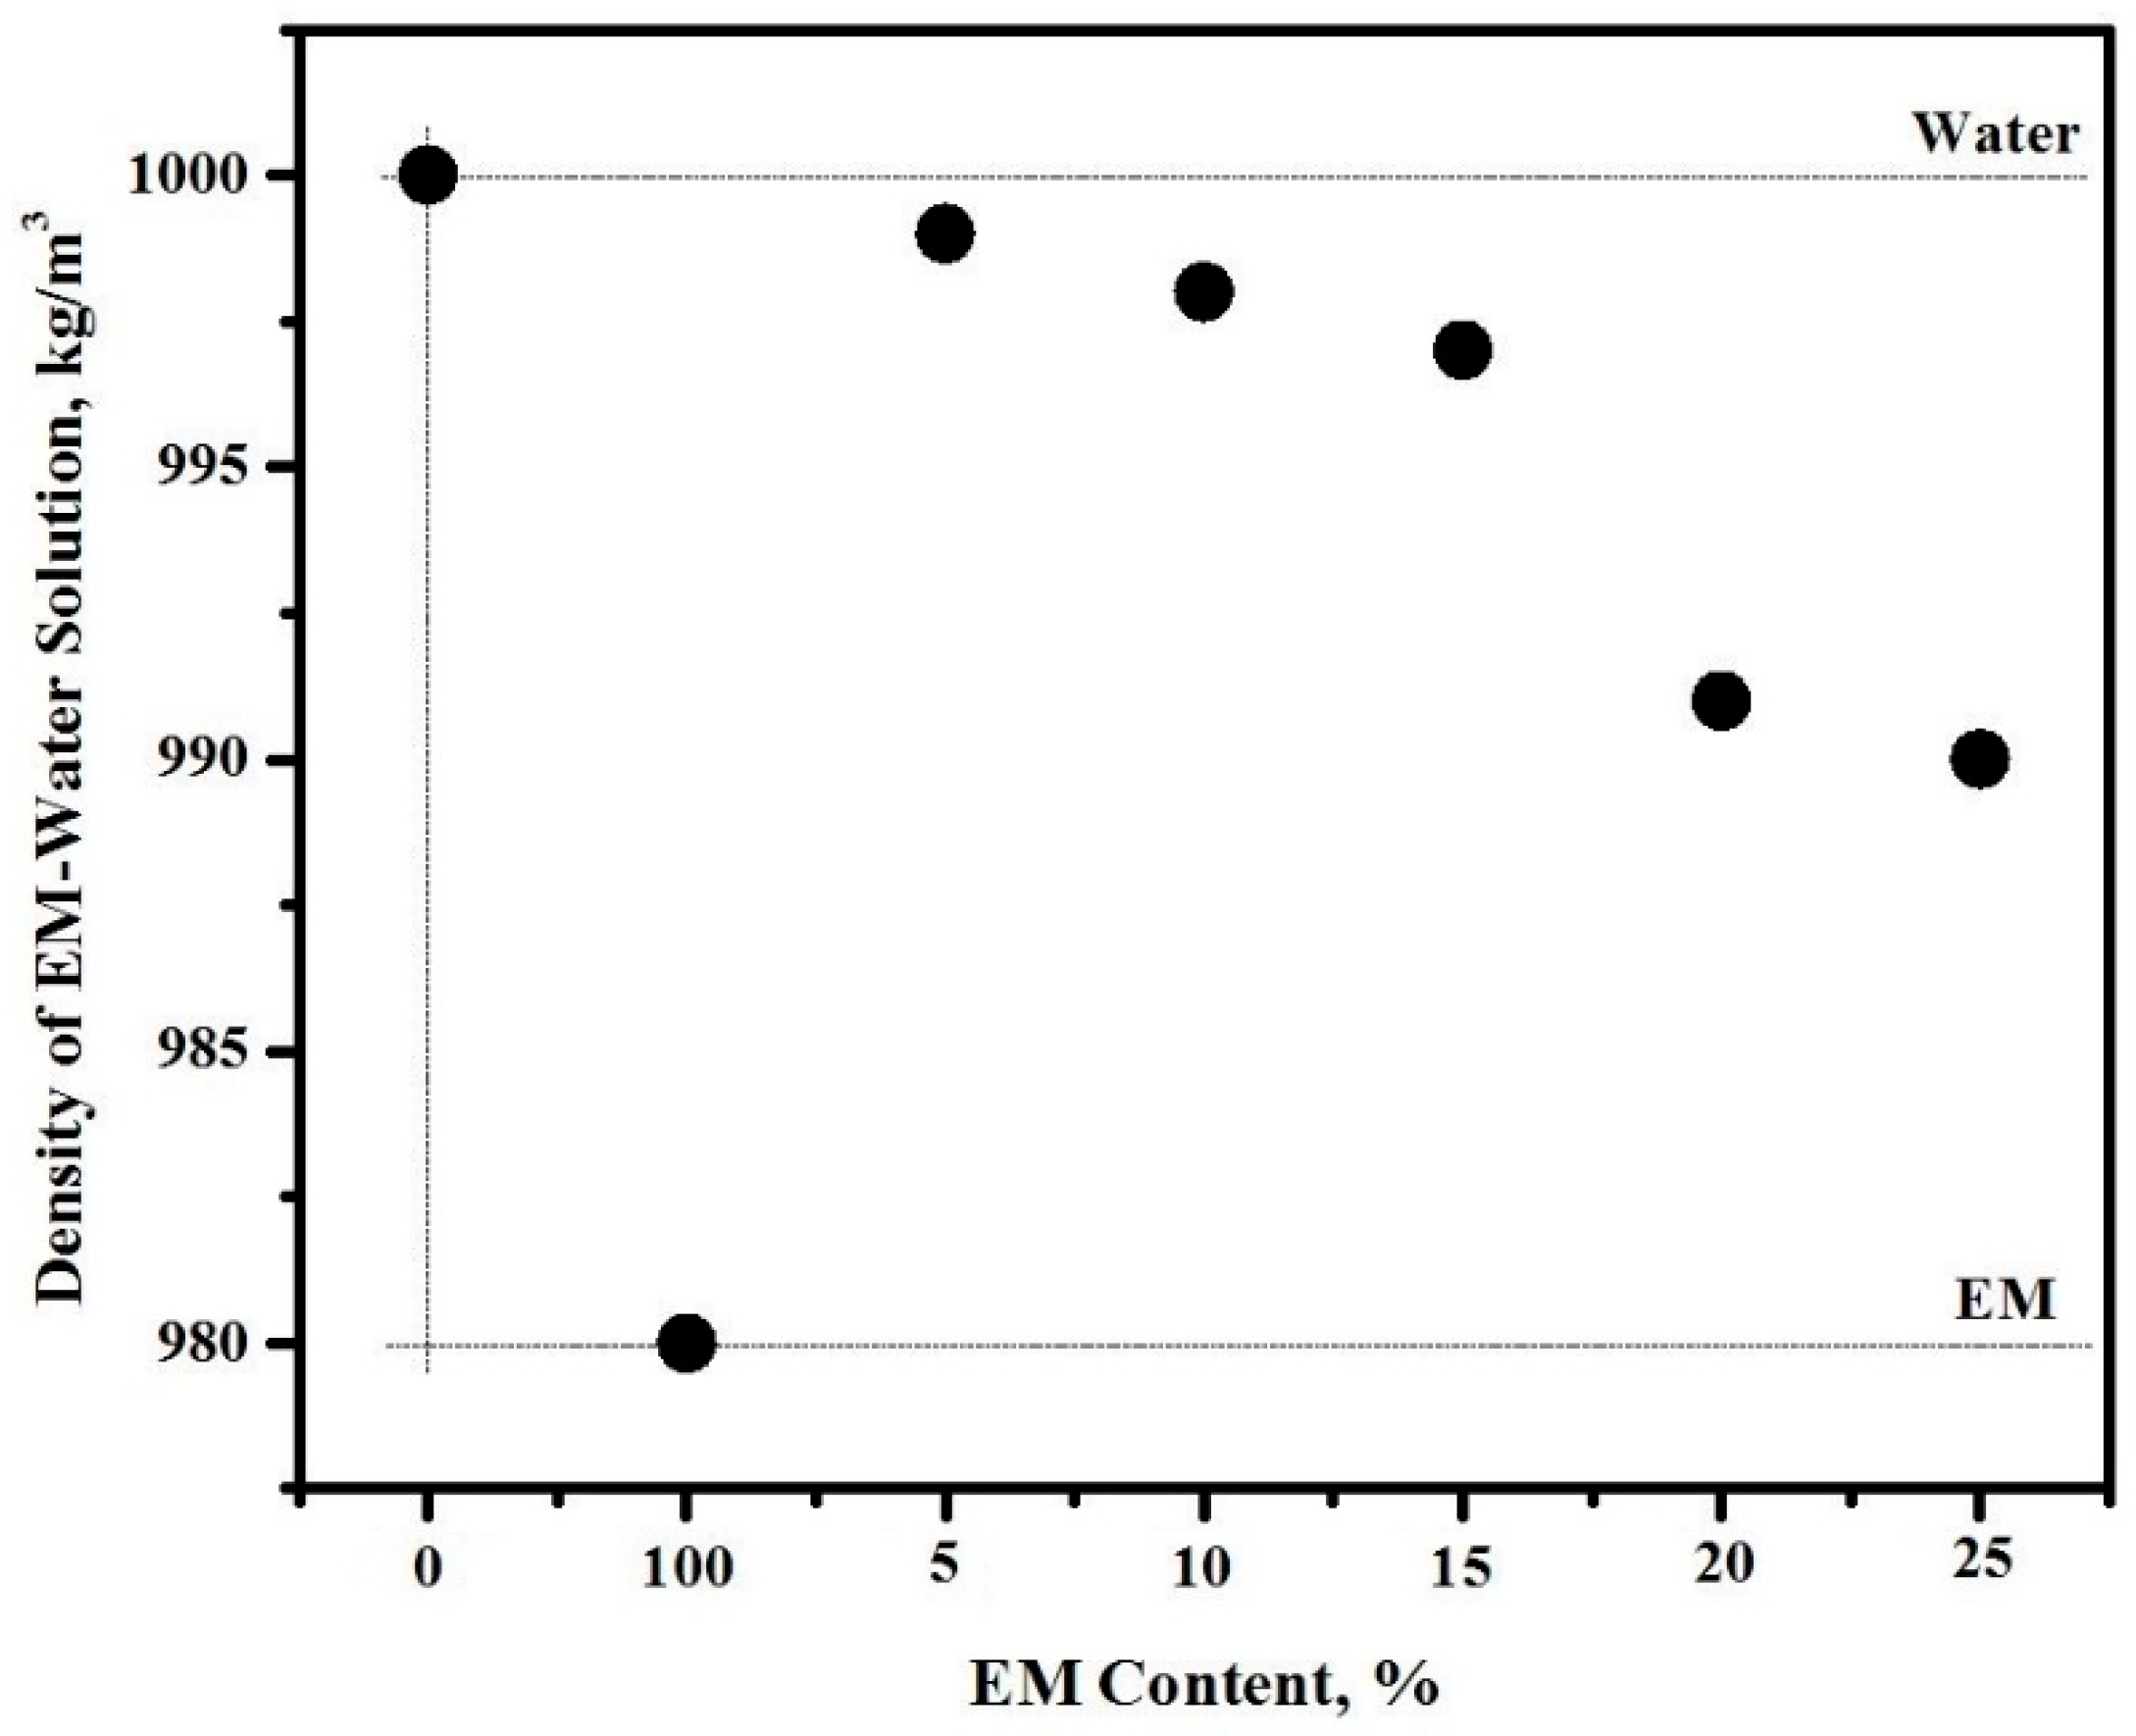
3.2. Density
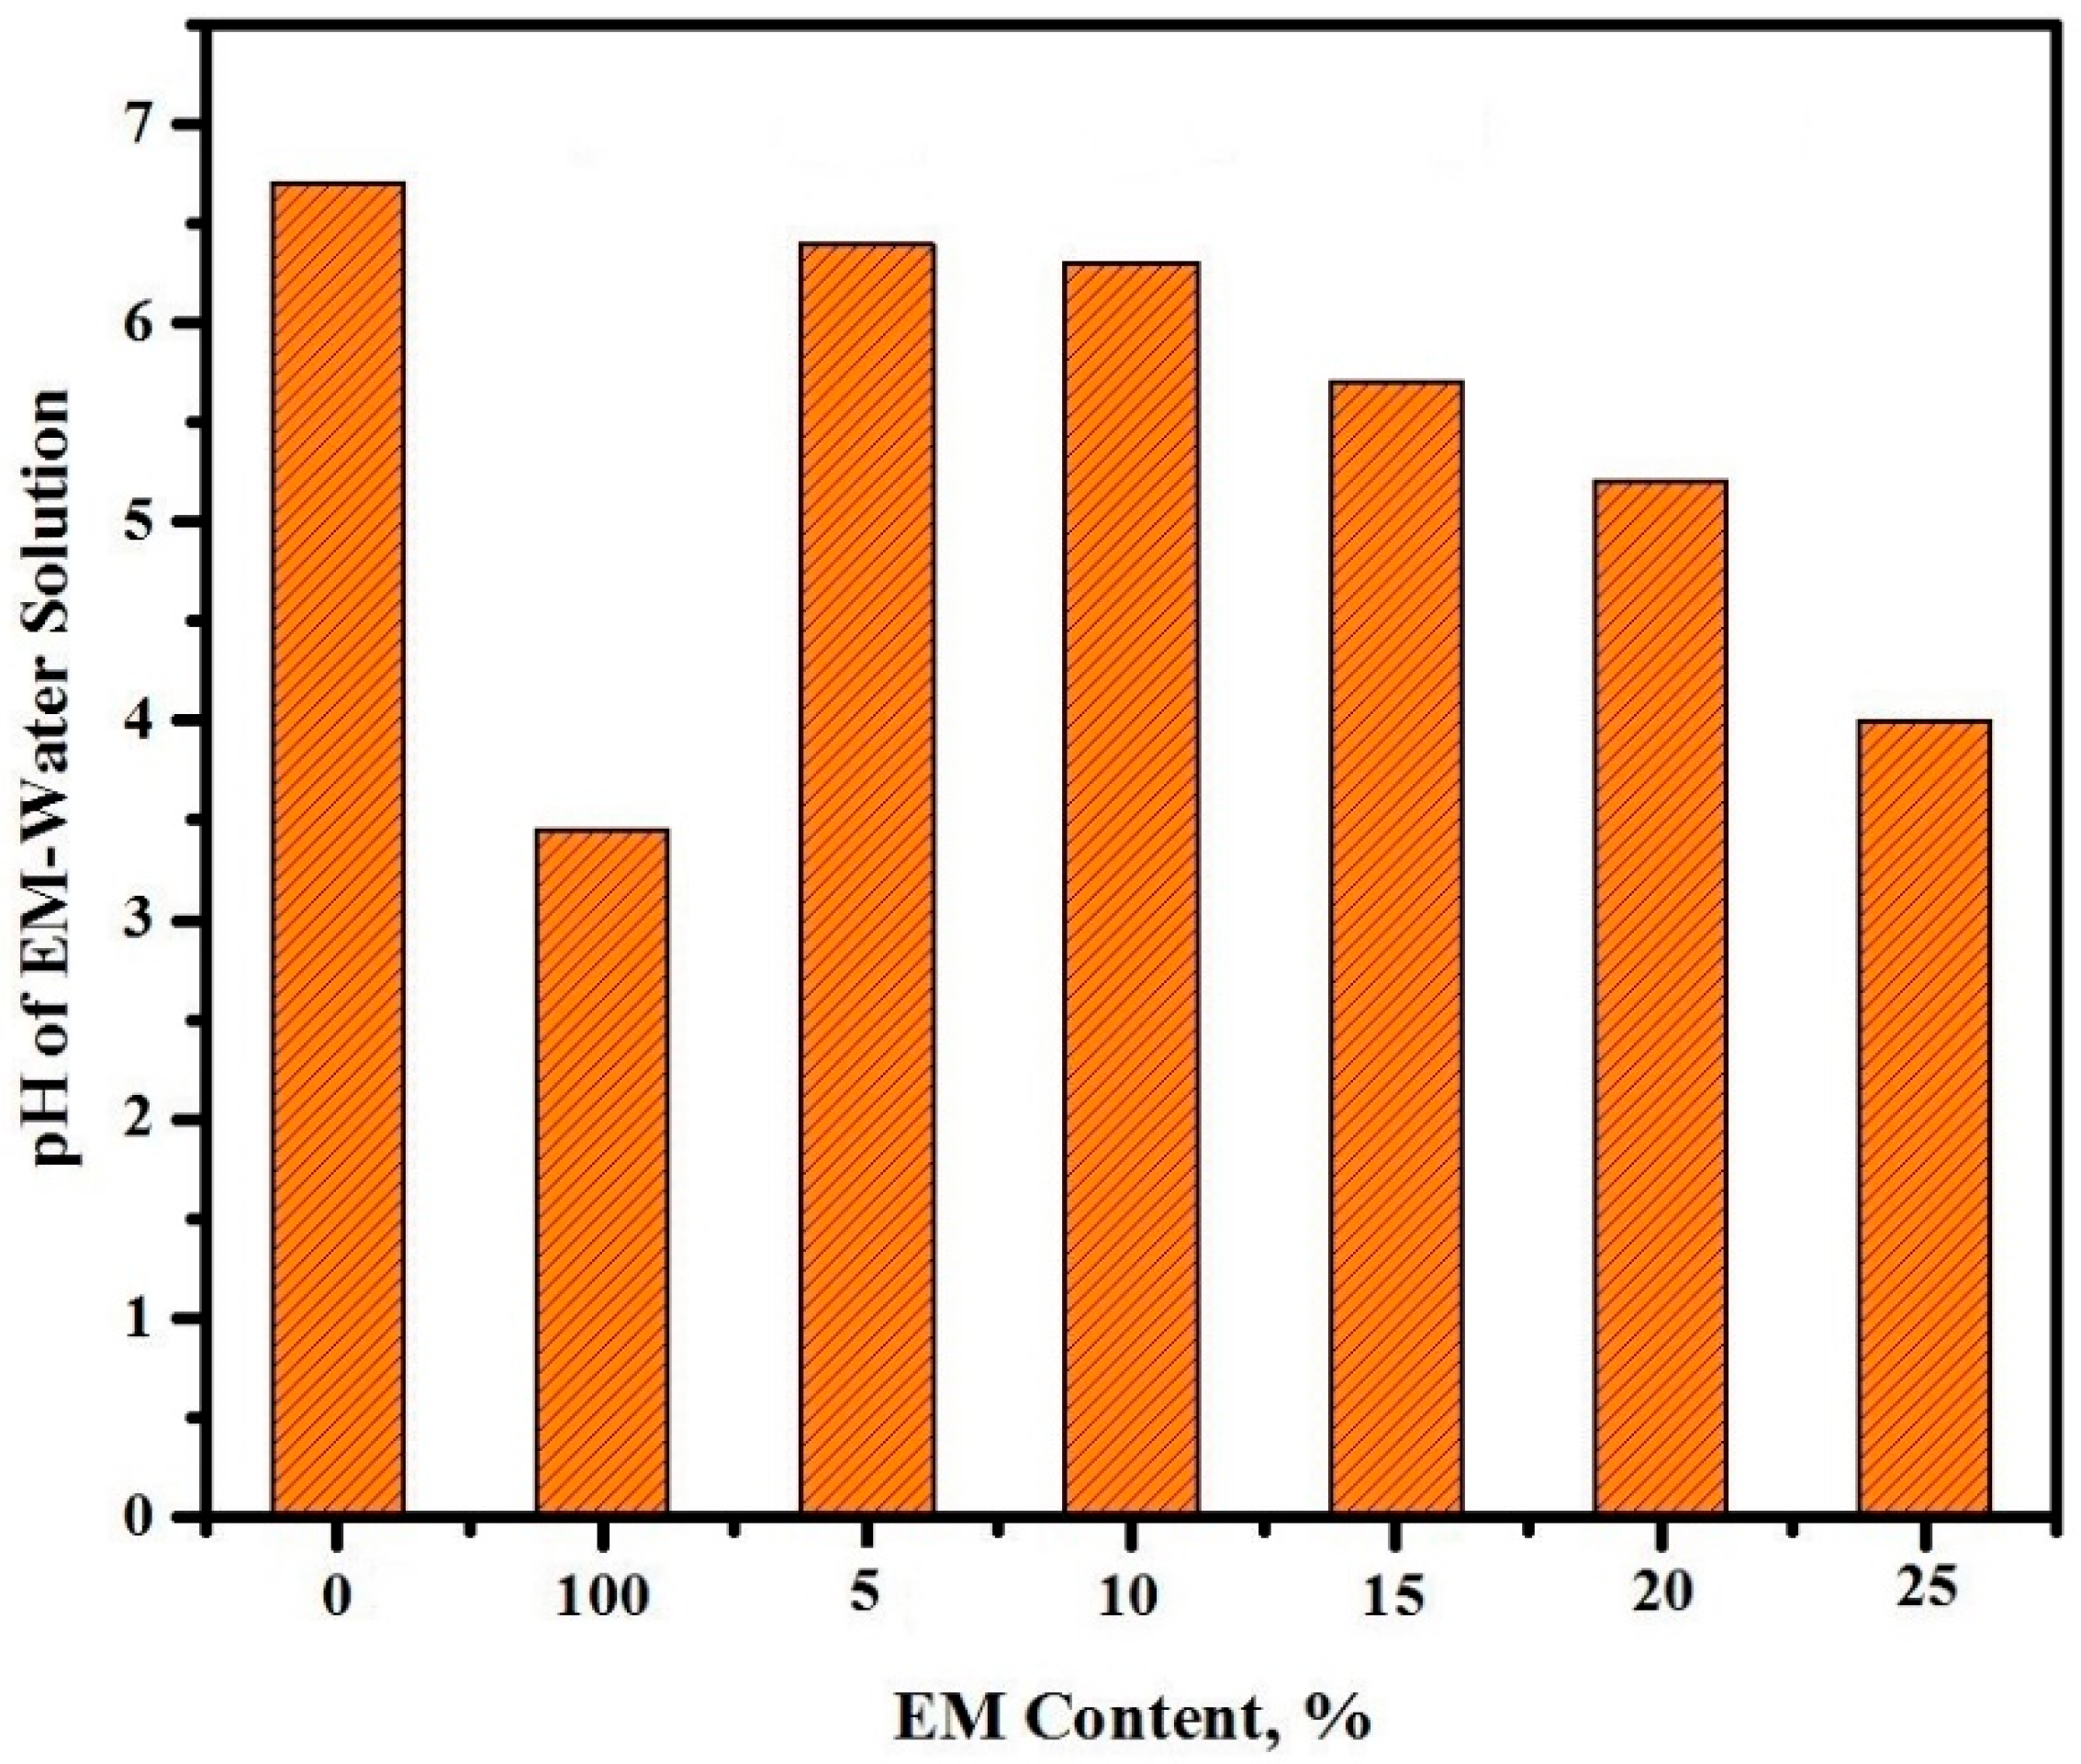
3.3. pH Values
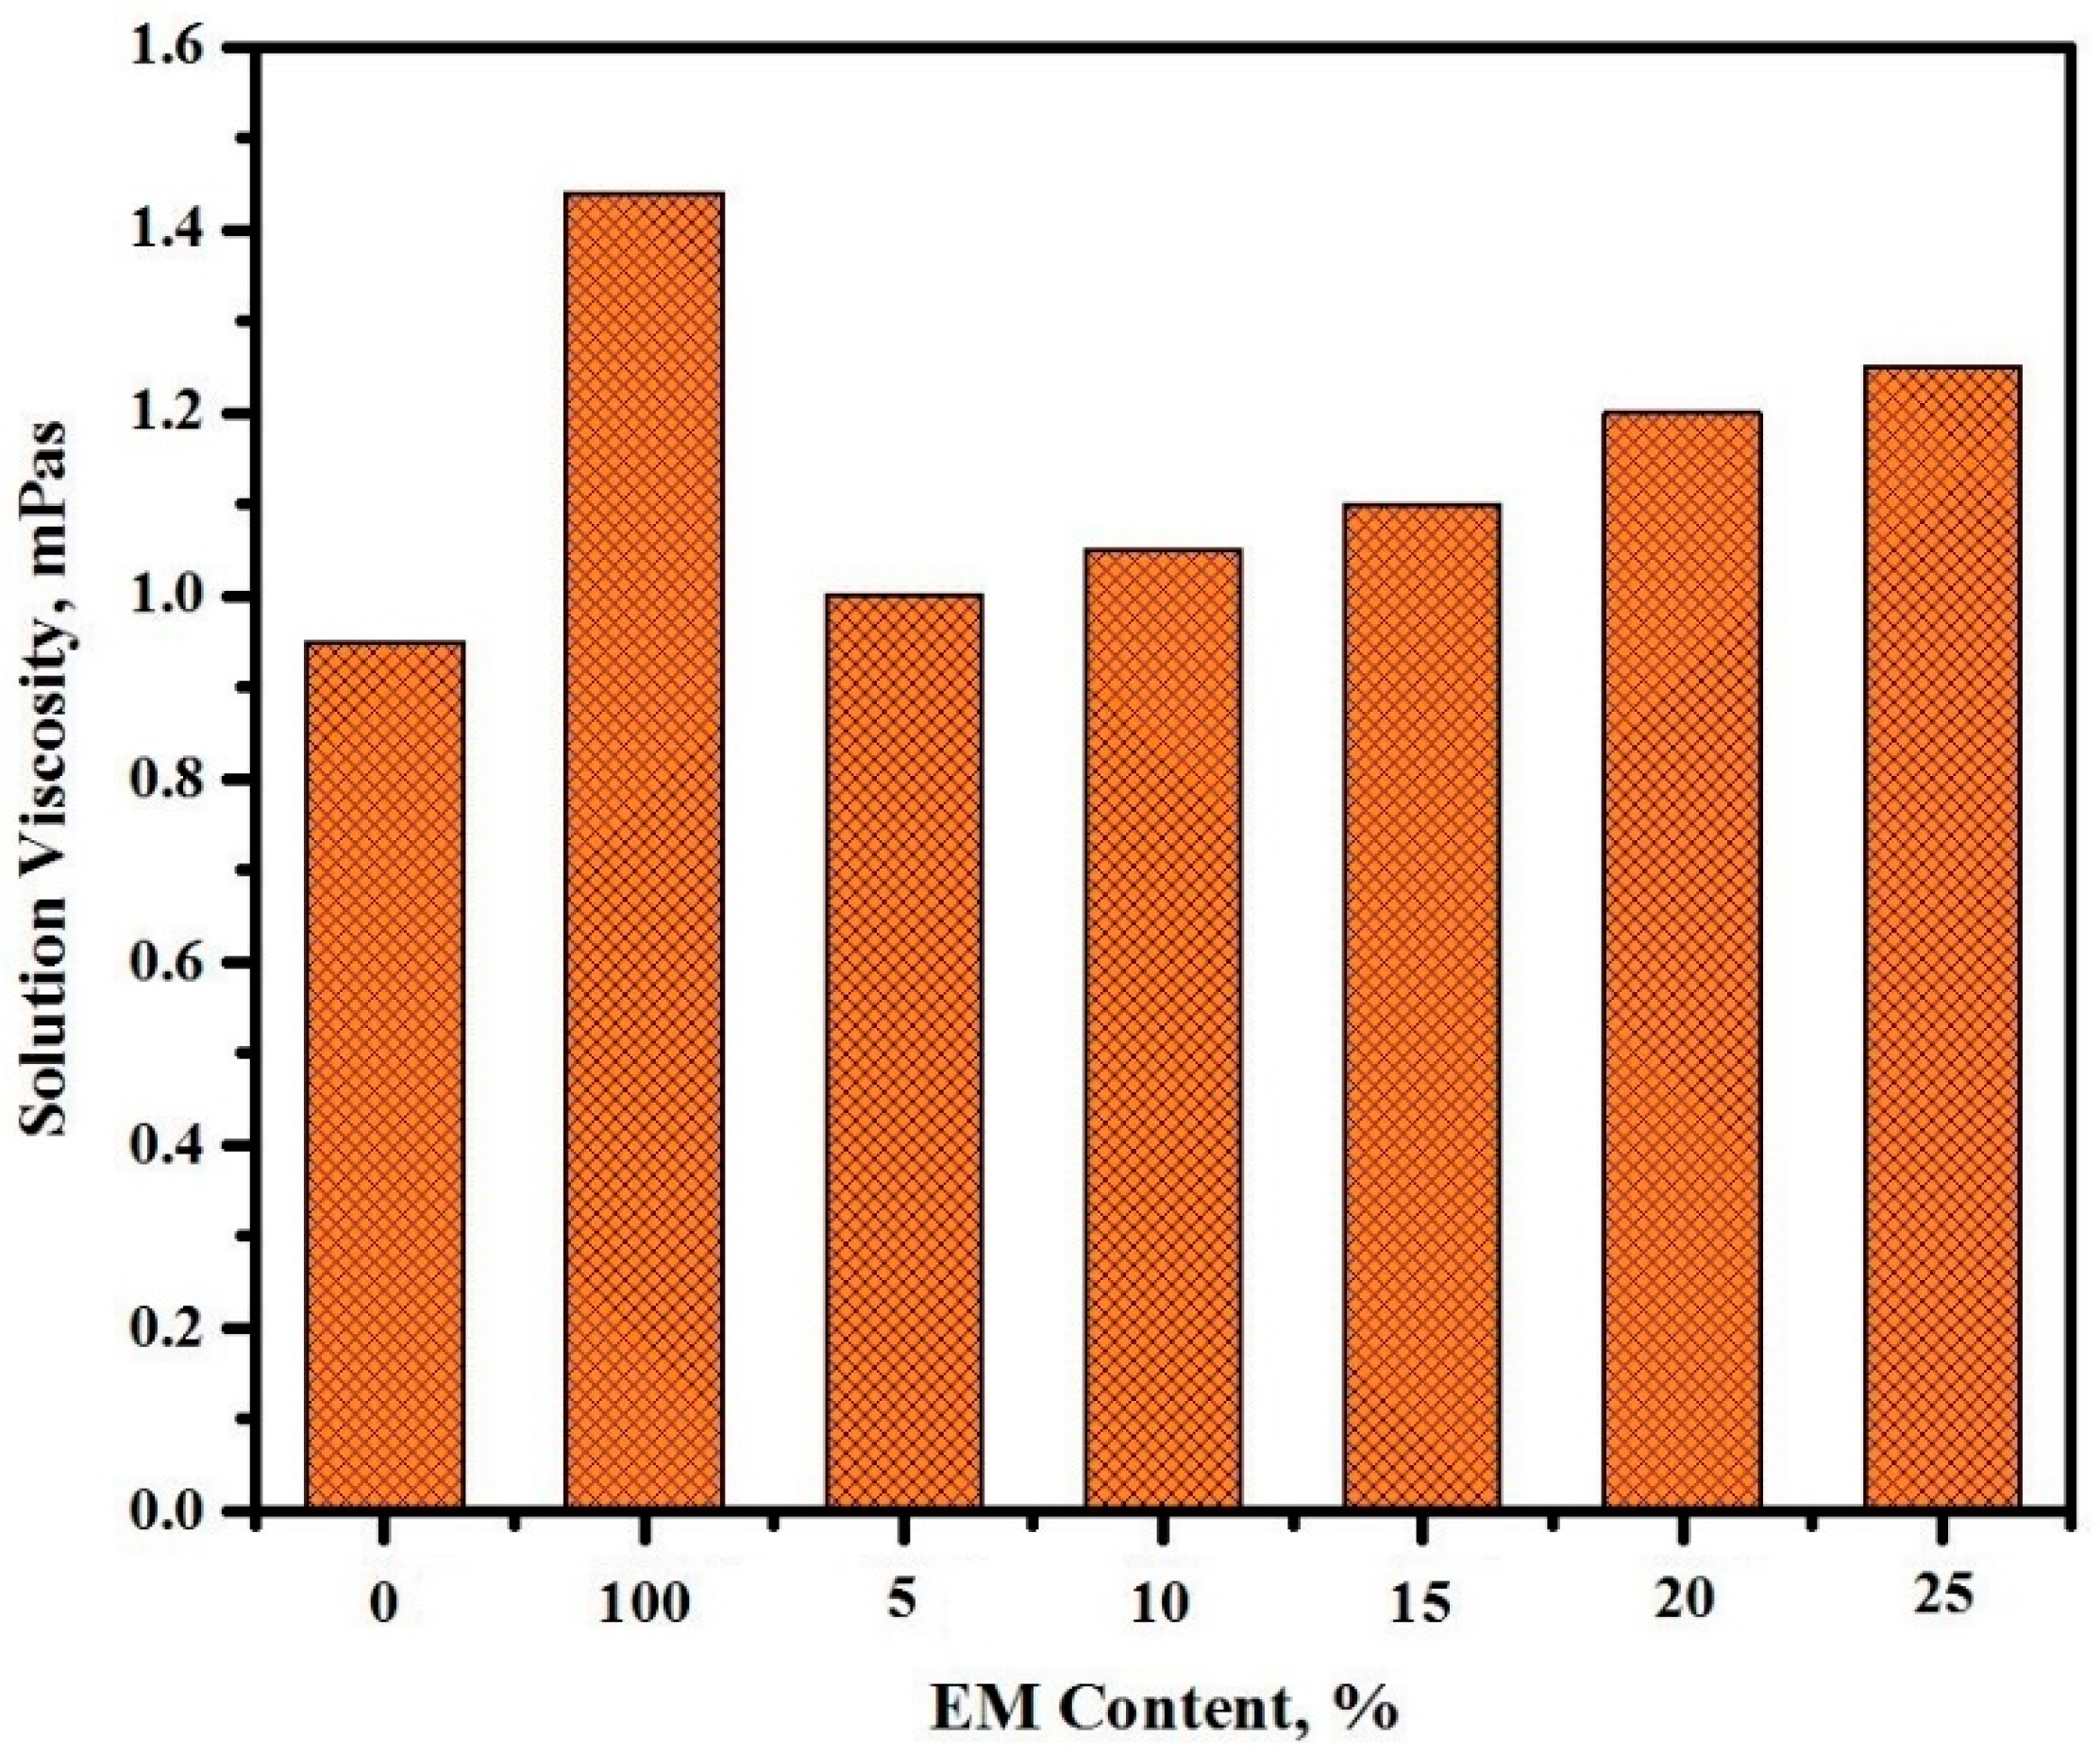
3.4. Viscosity
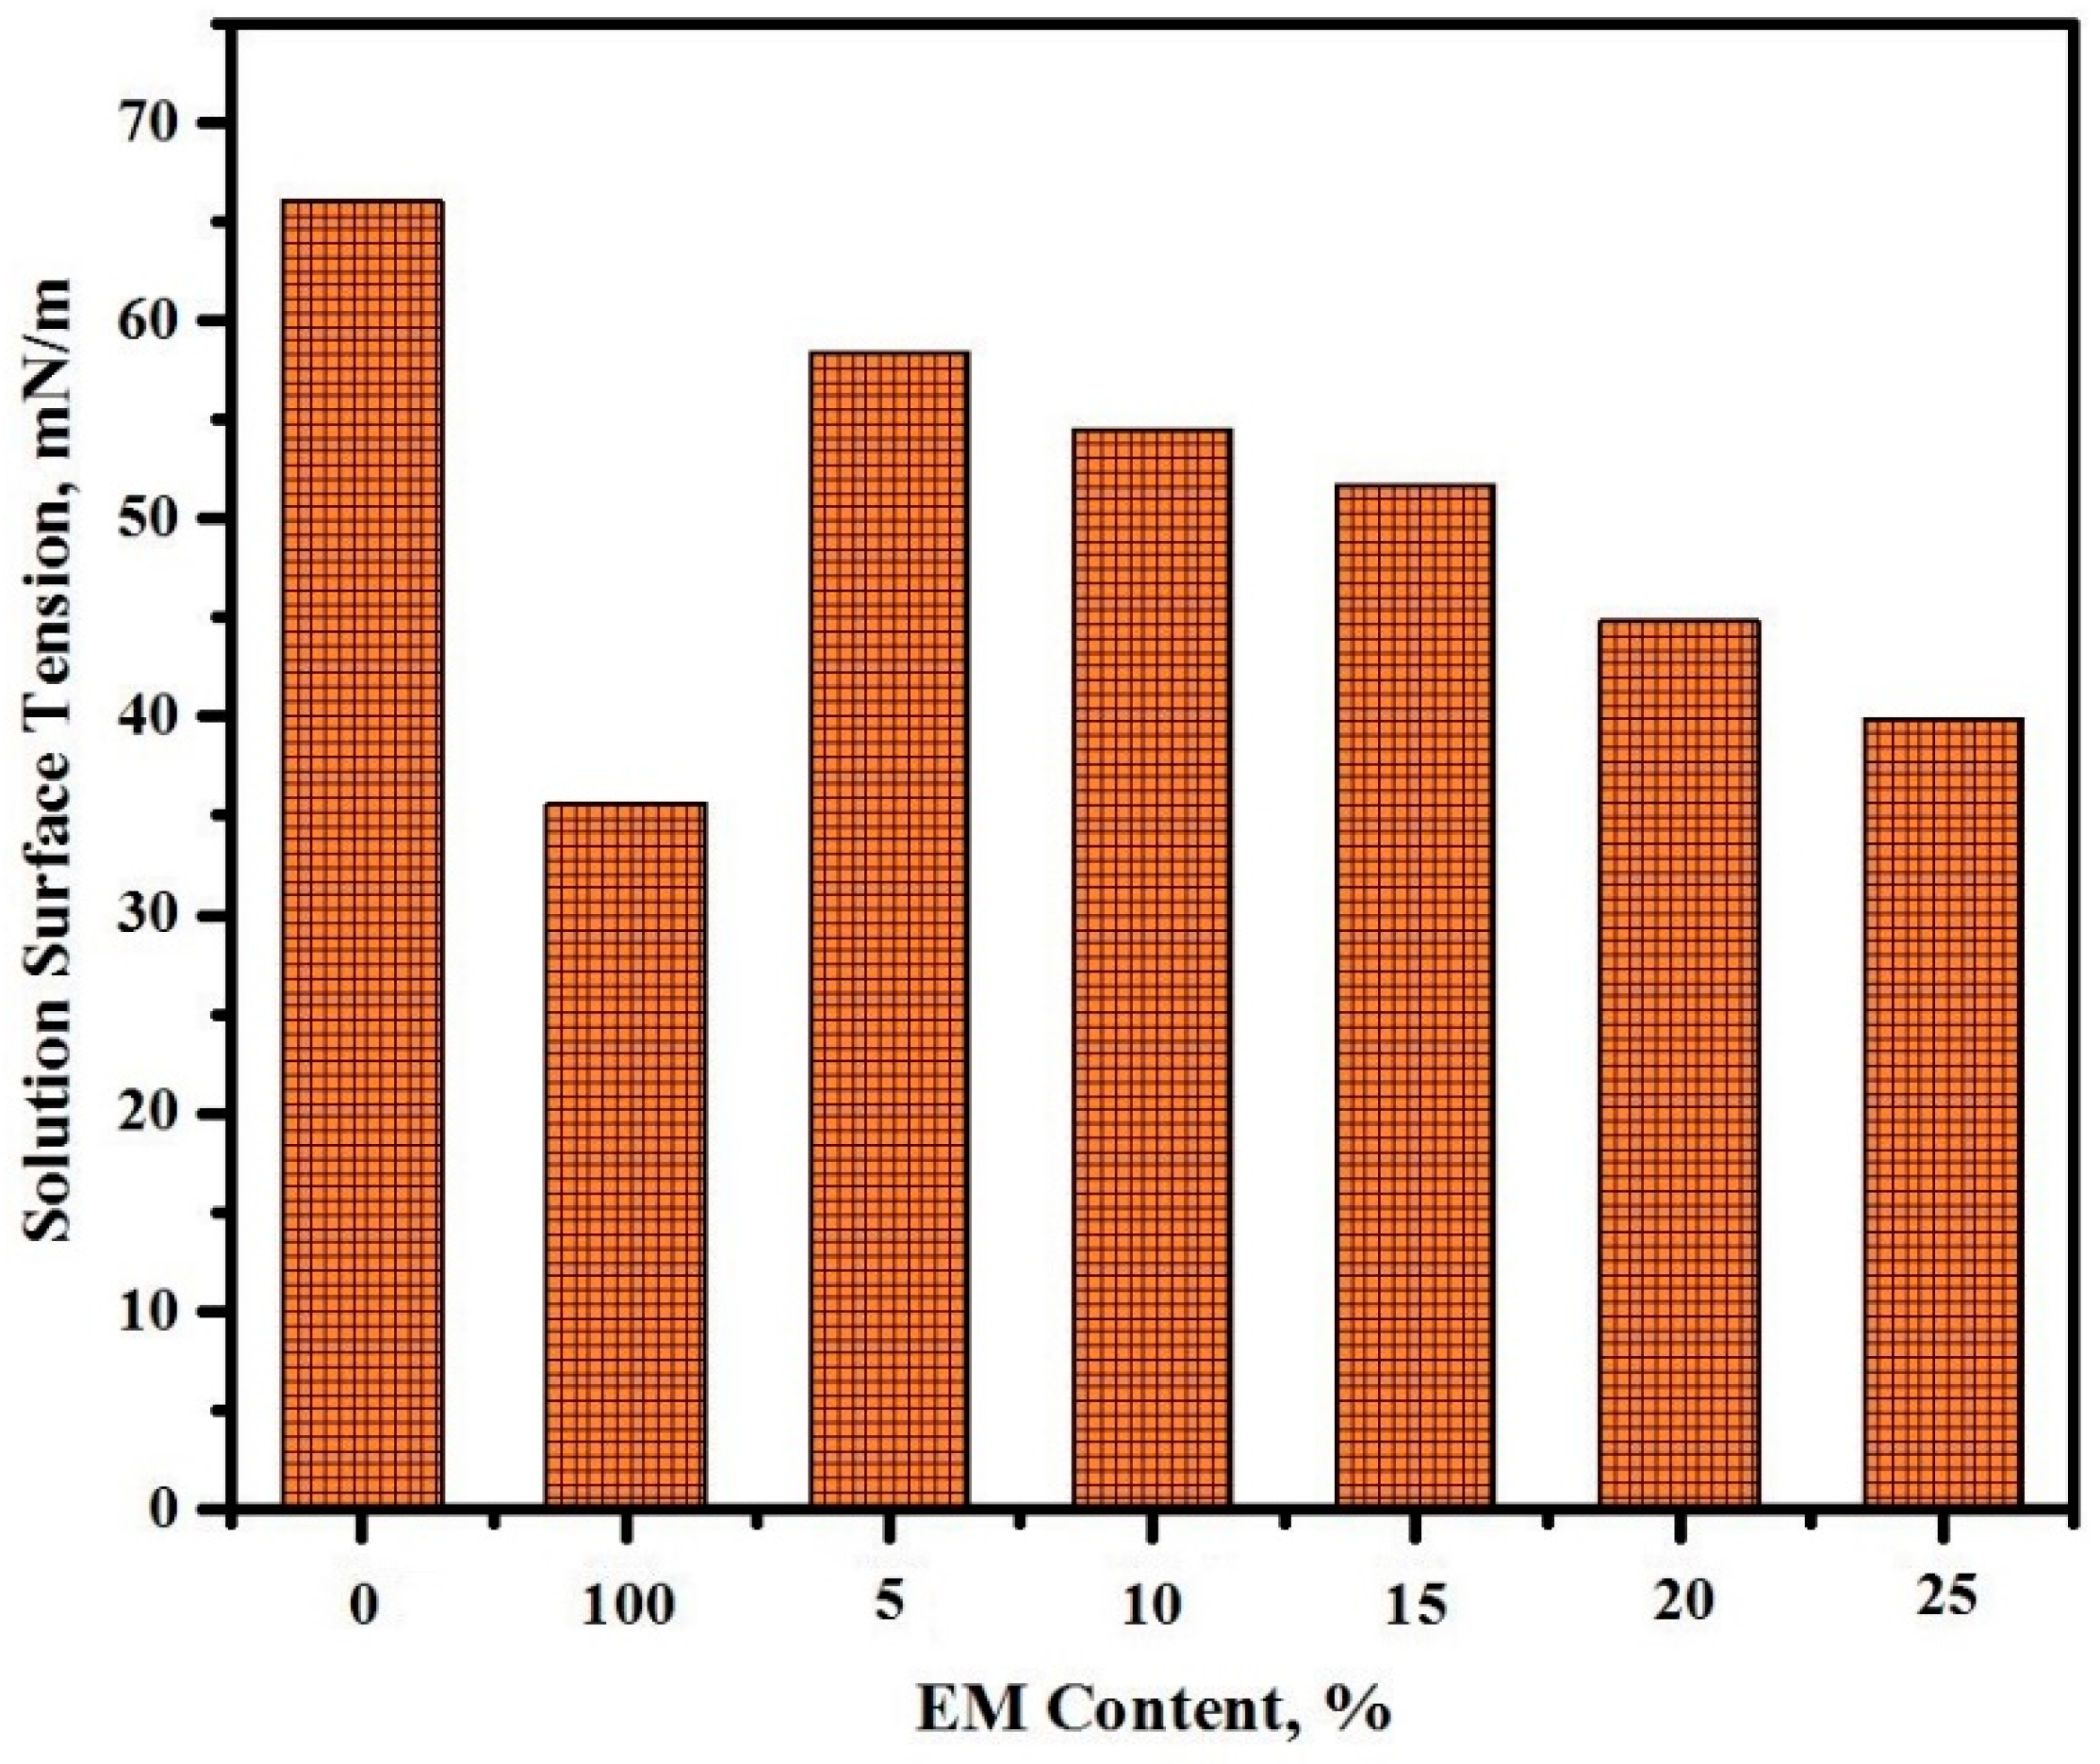
3.5. Surface Tension
3.6. Quality Index
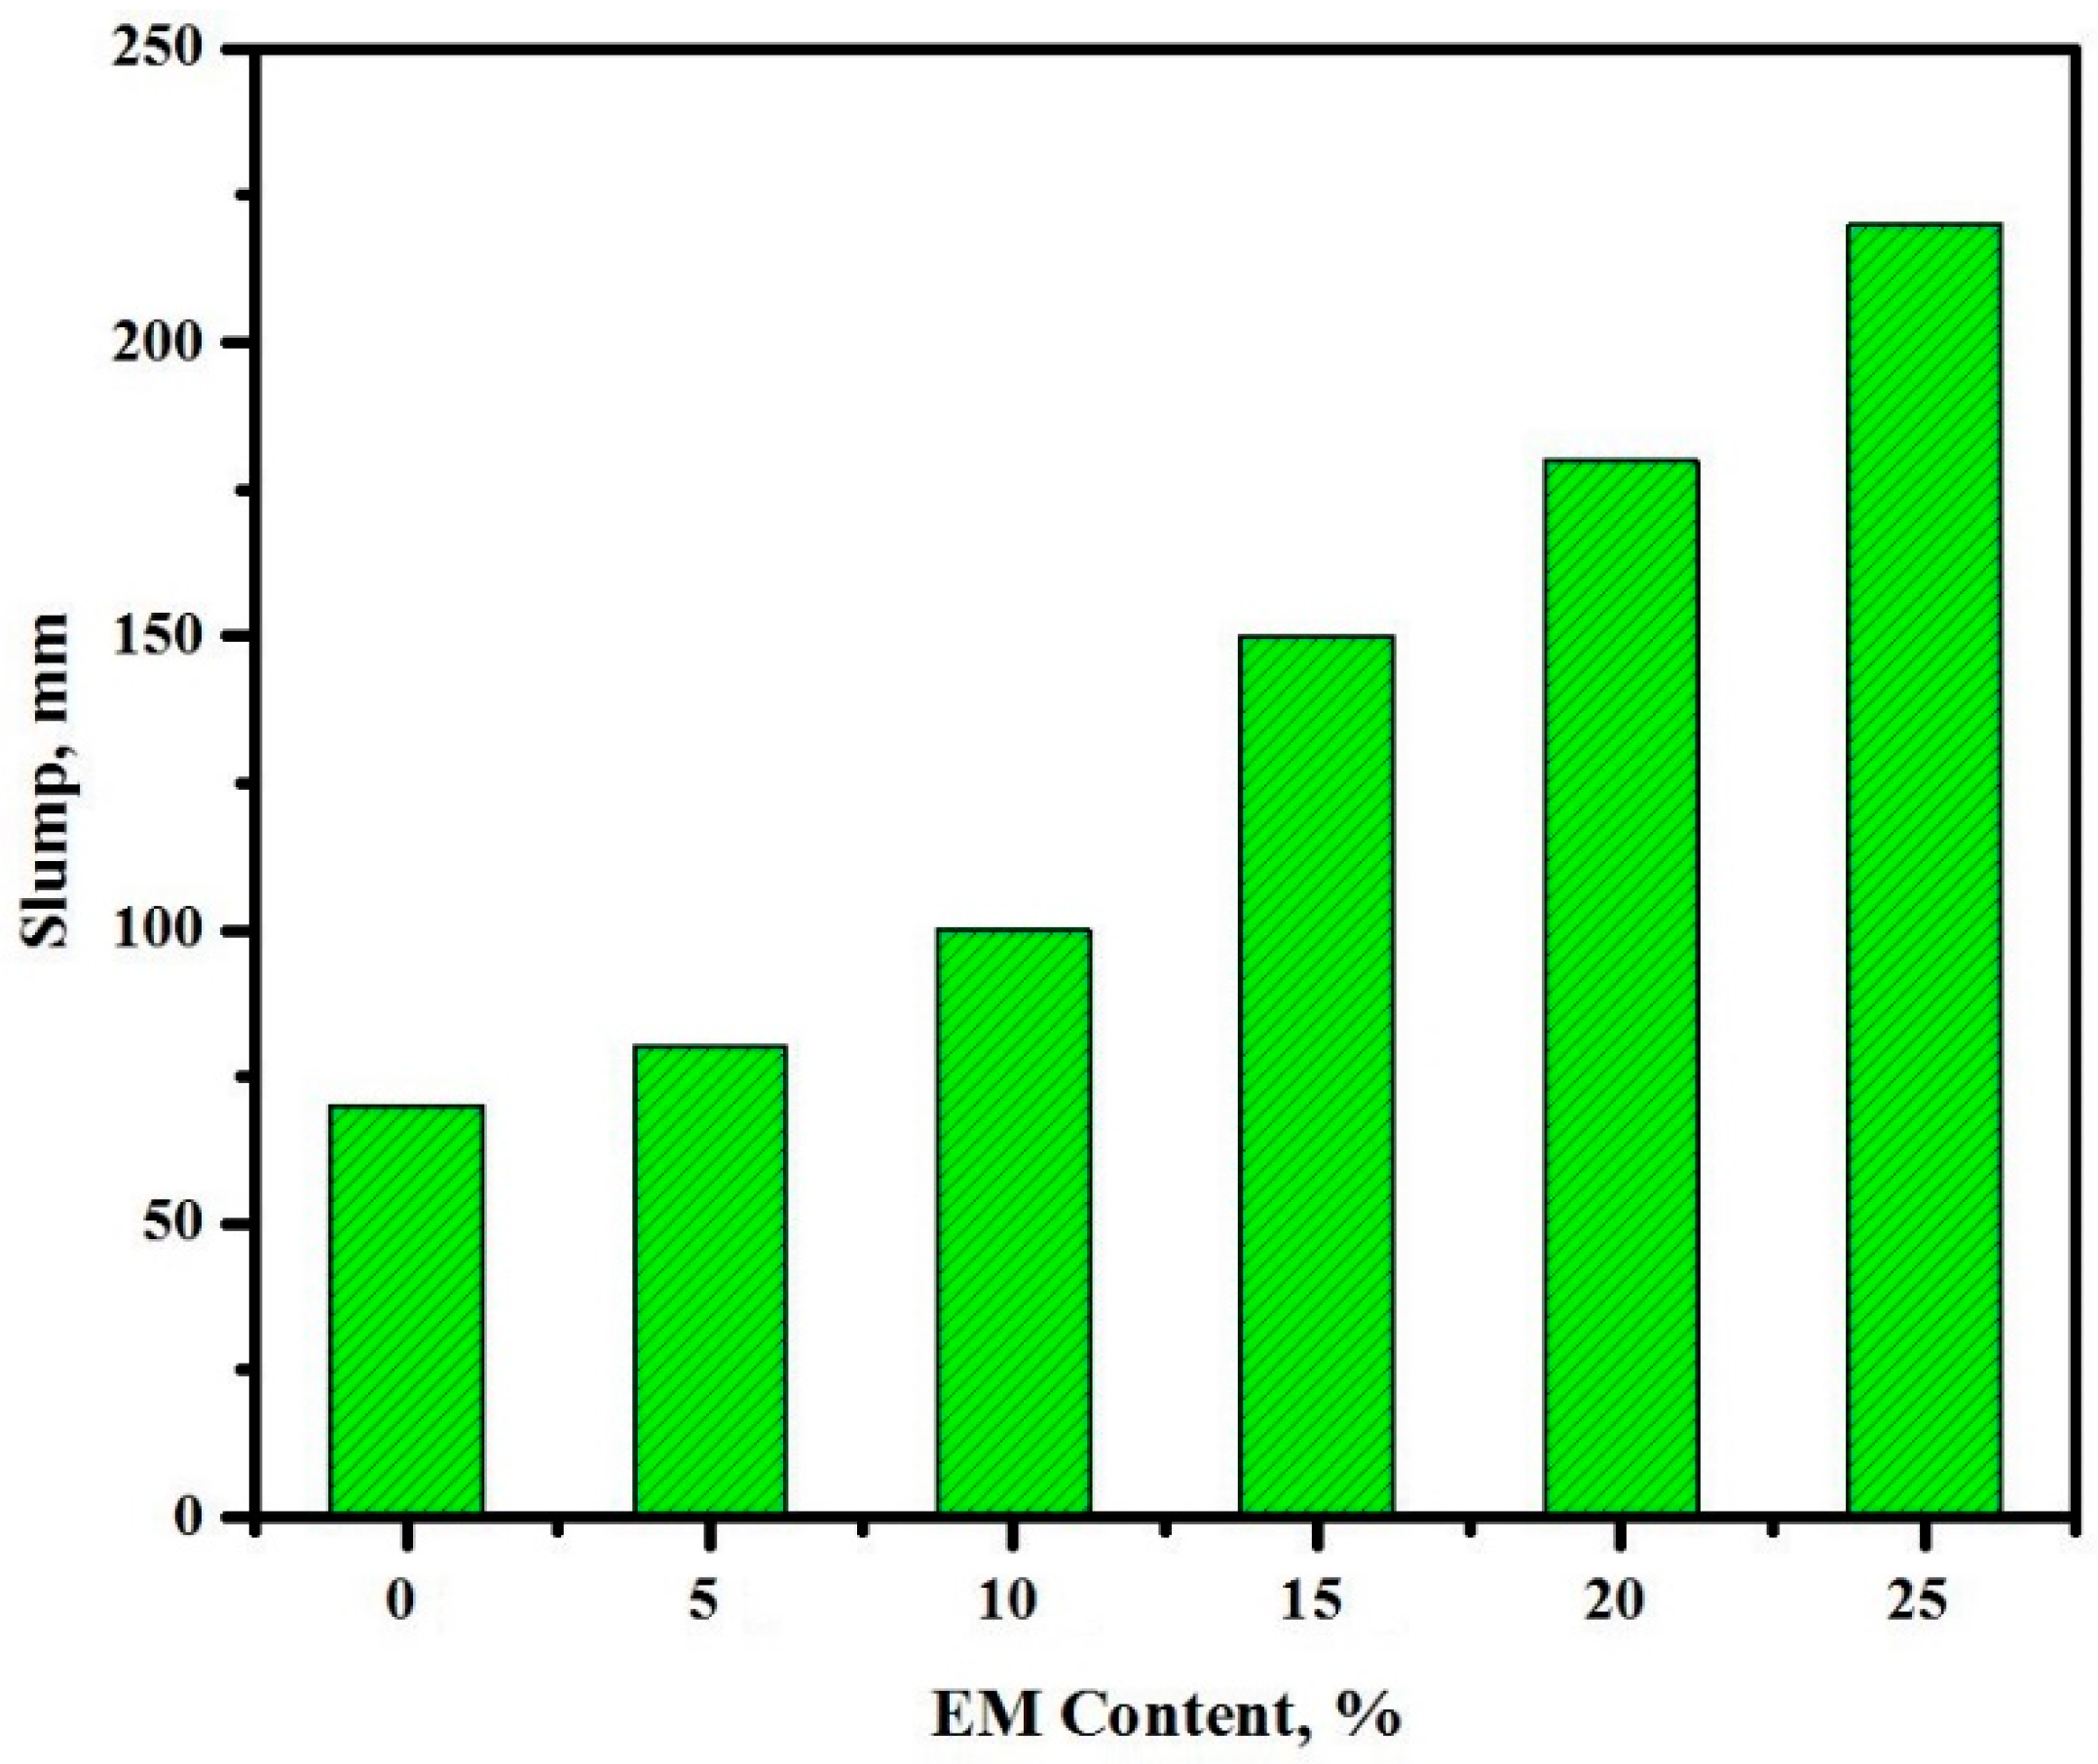
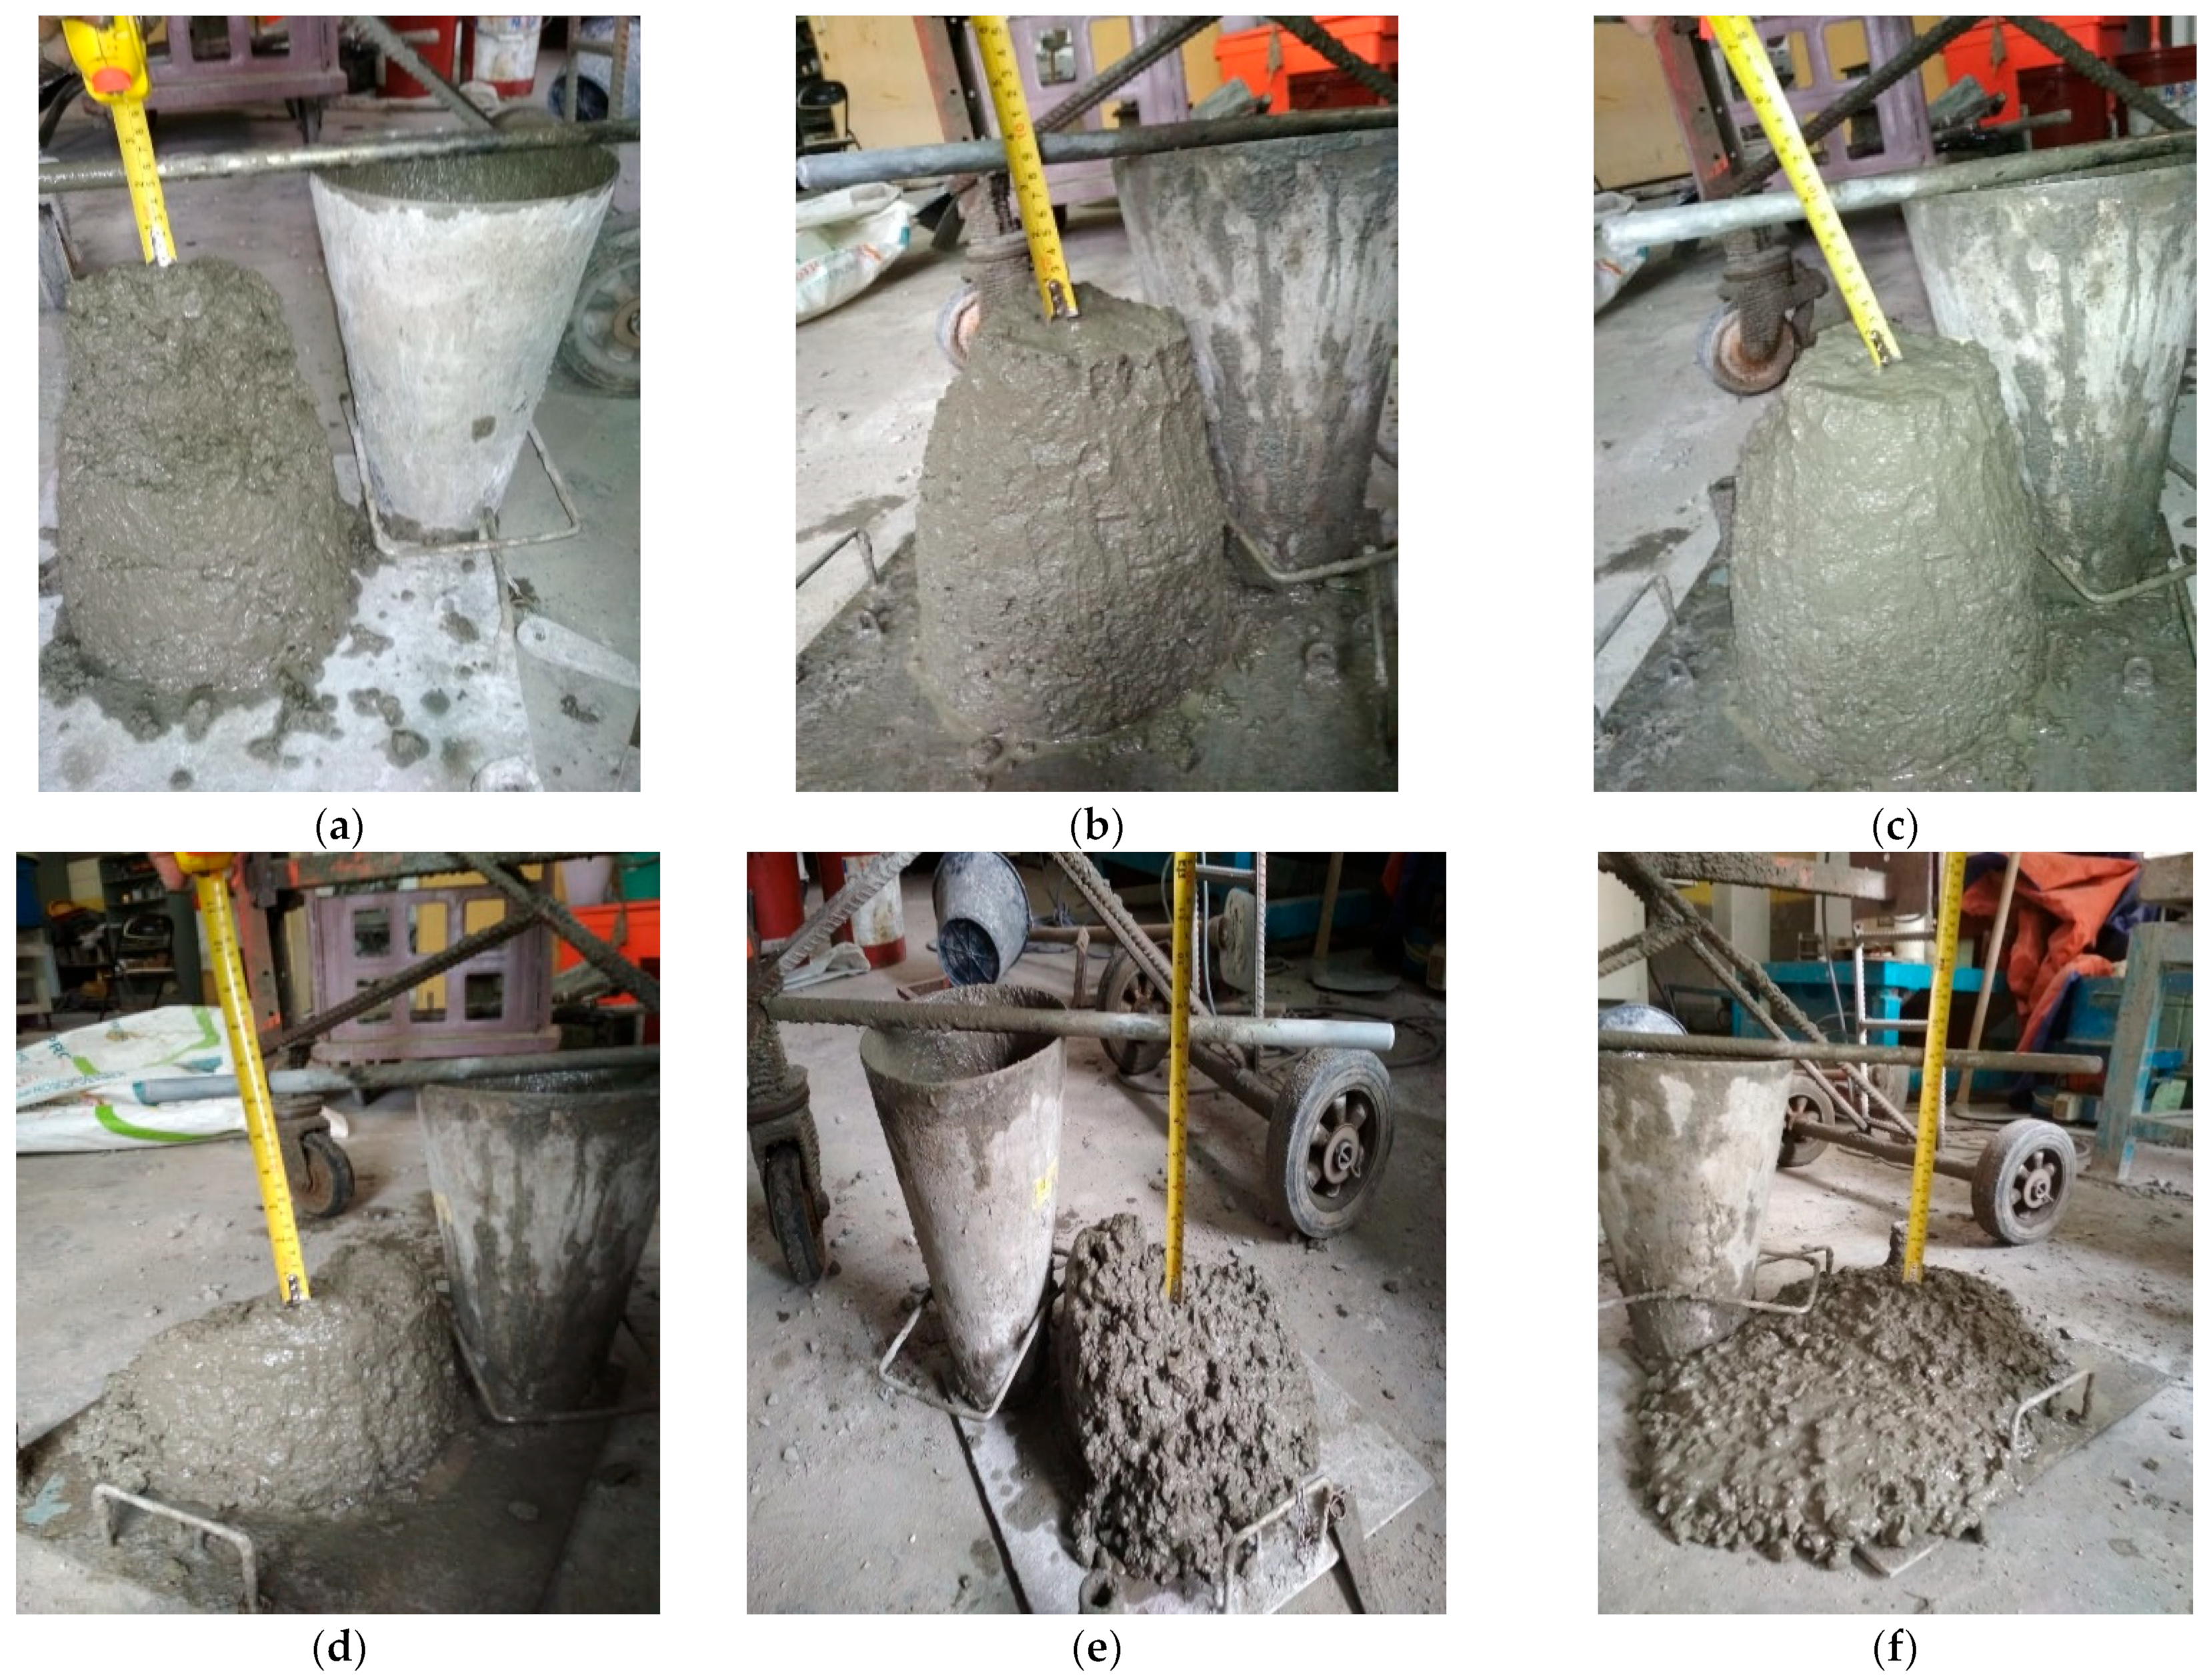
3.7. Workability
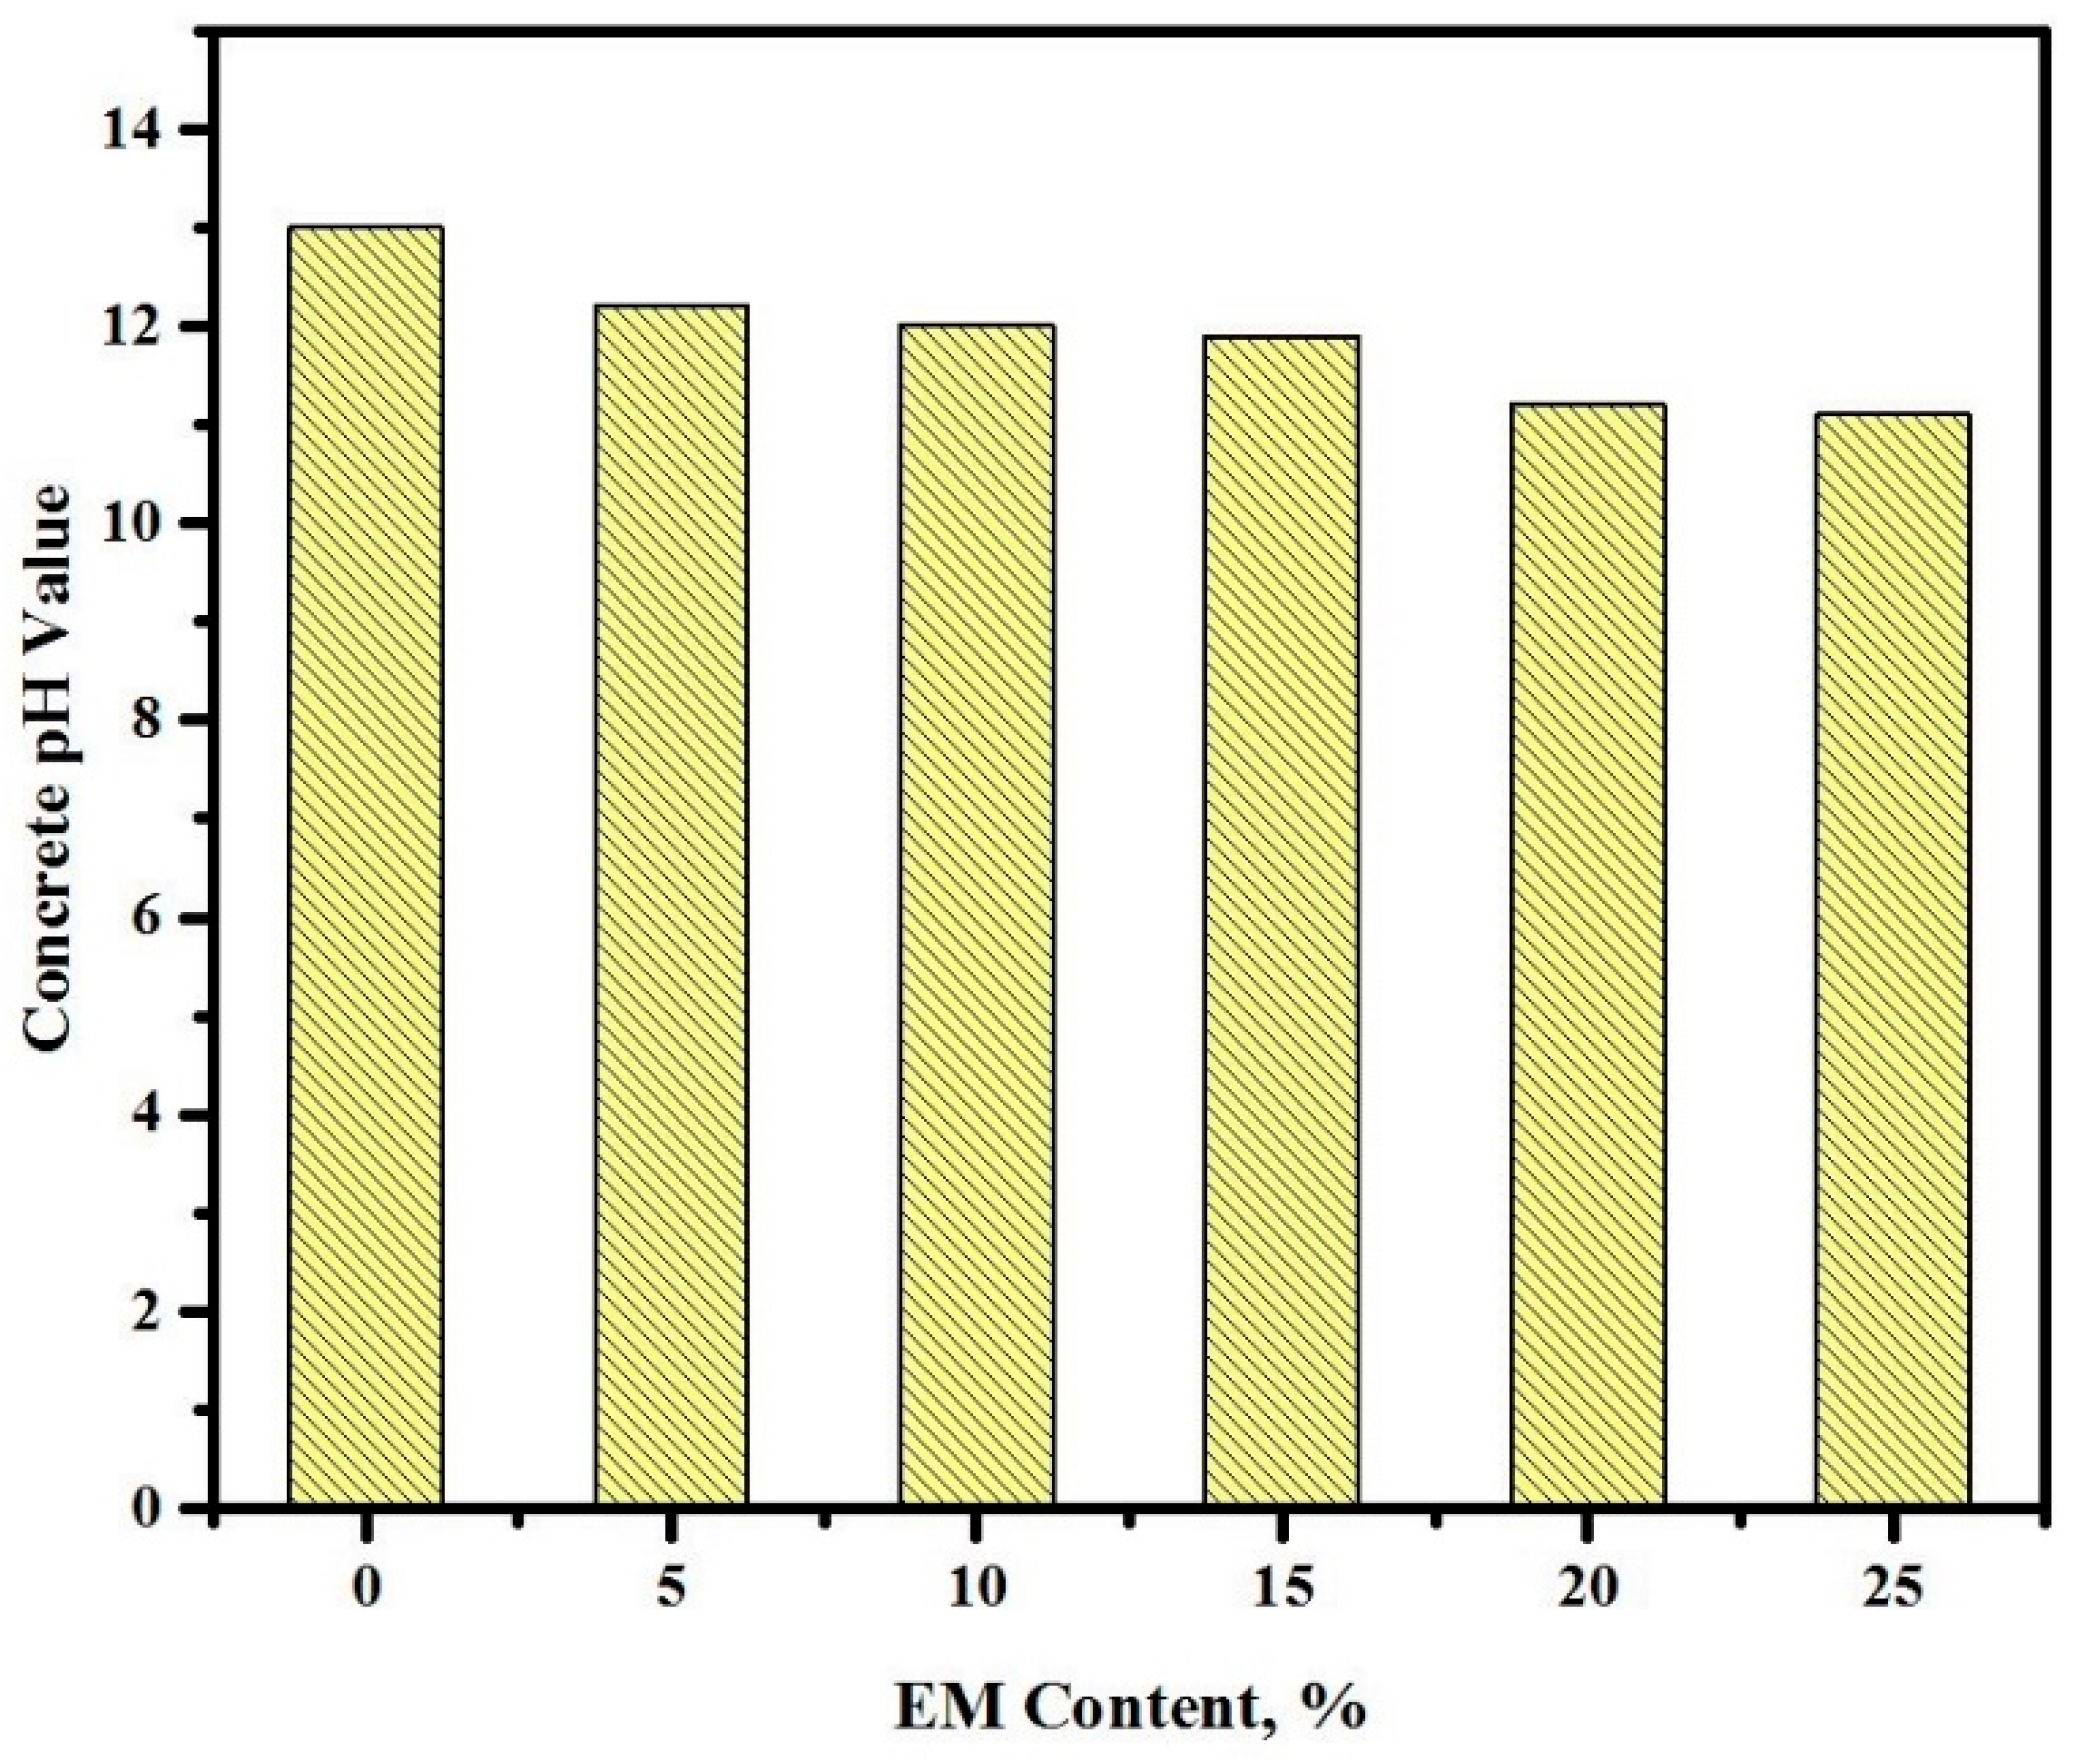
3.8. pH Value of EM-Concrete
3.9. Compressive Strength
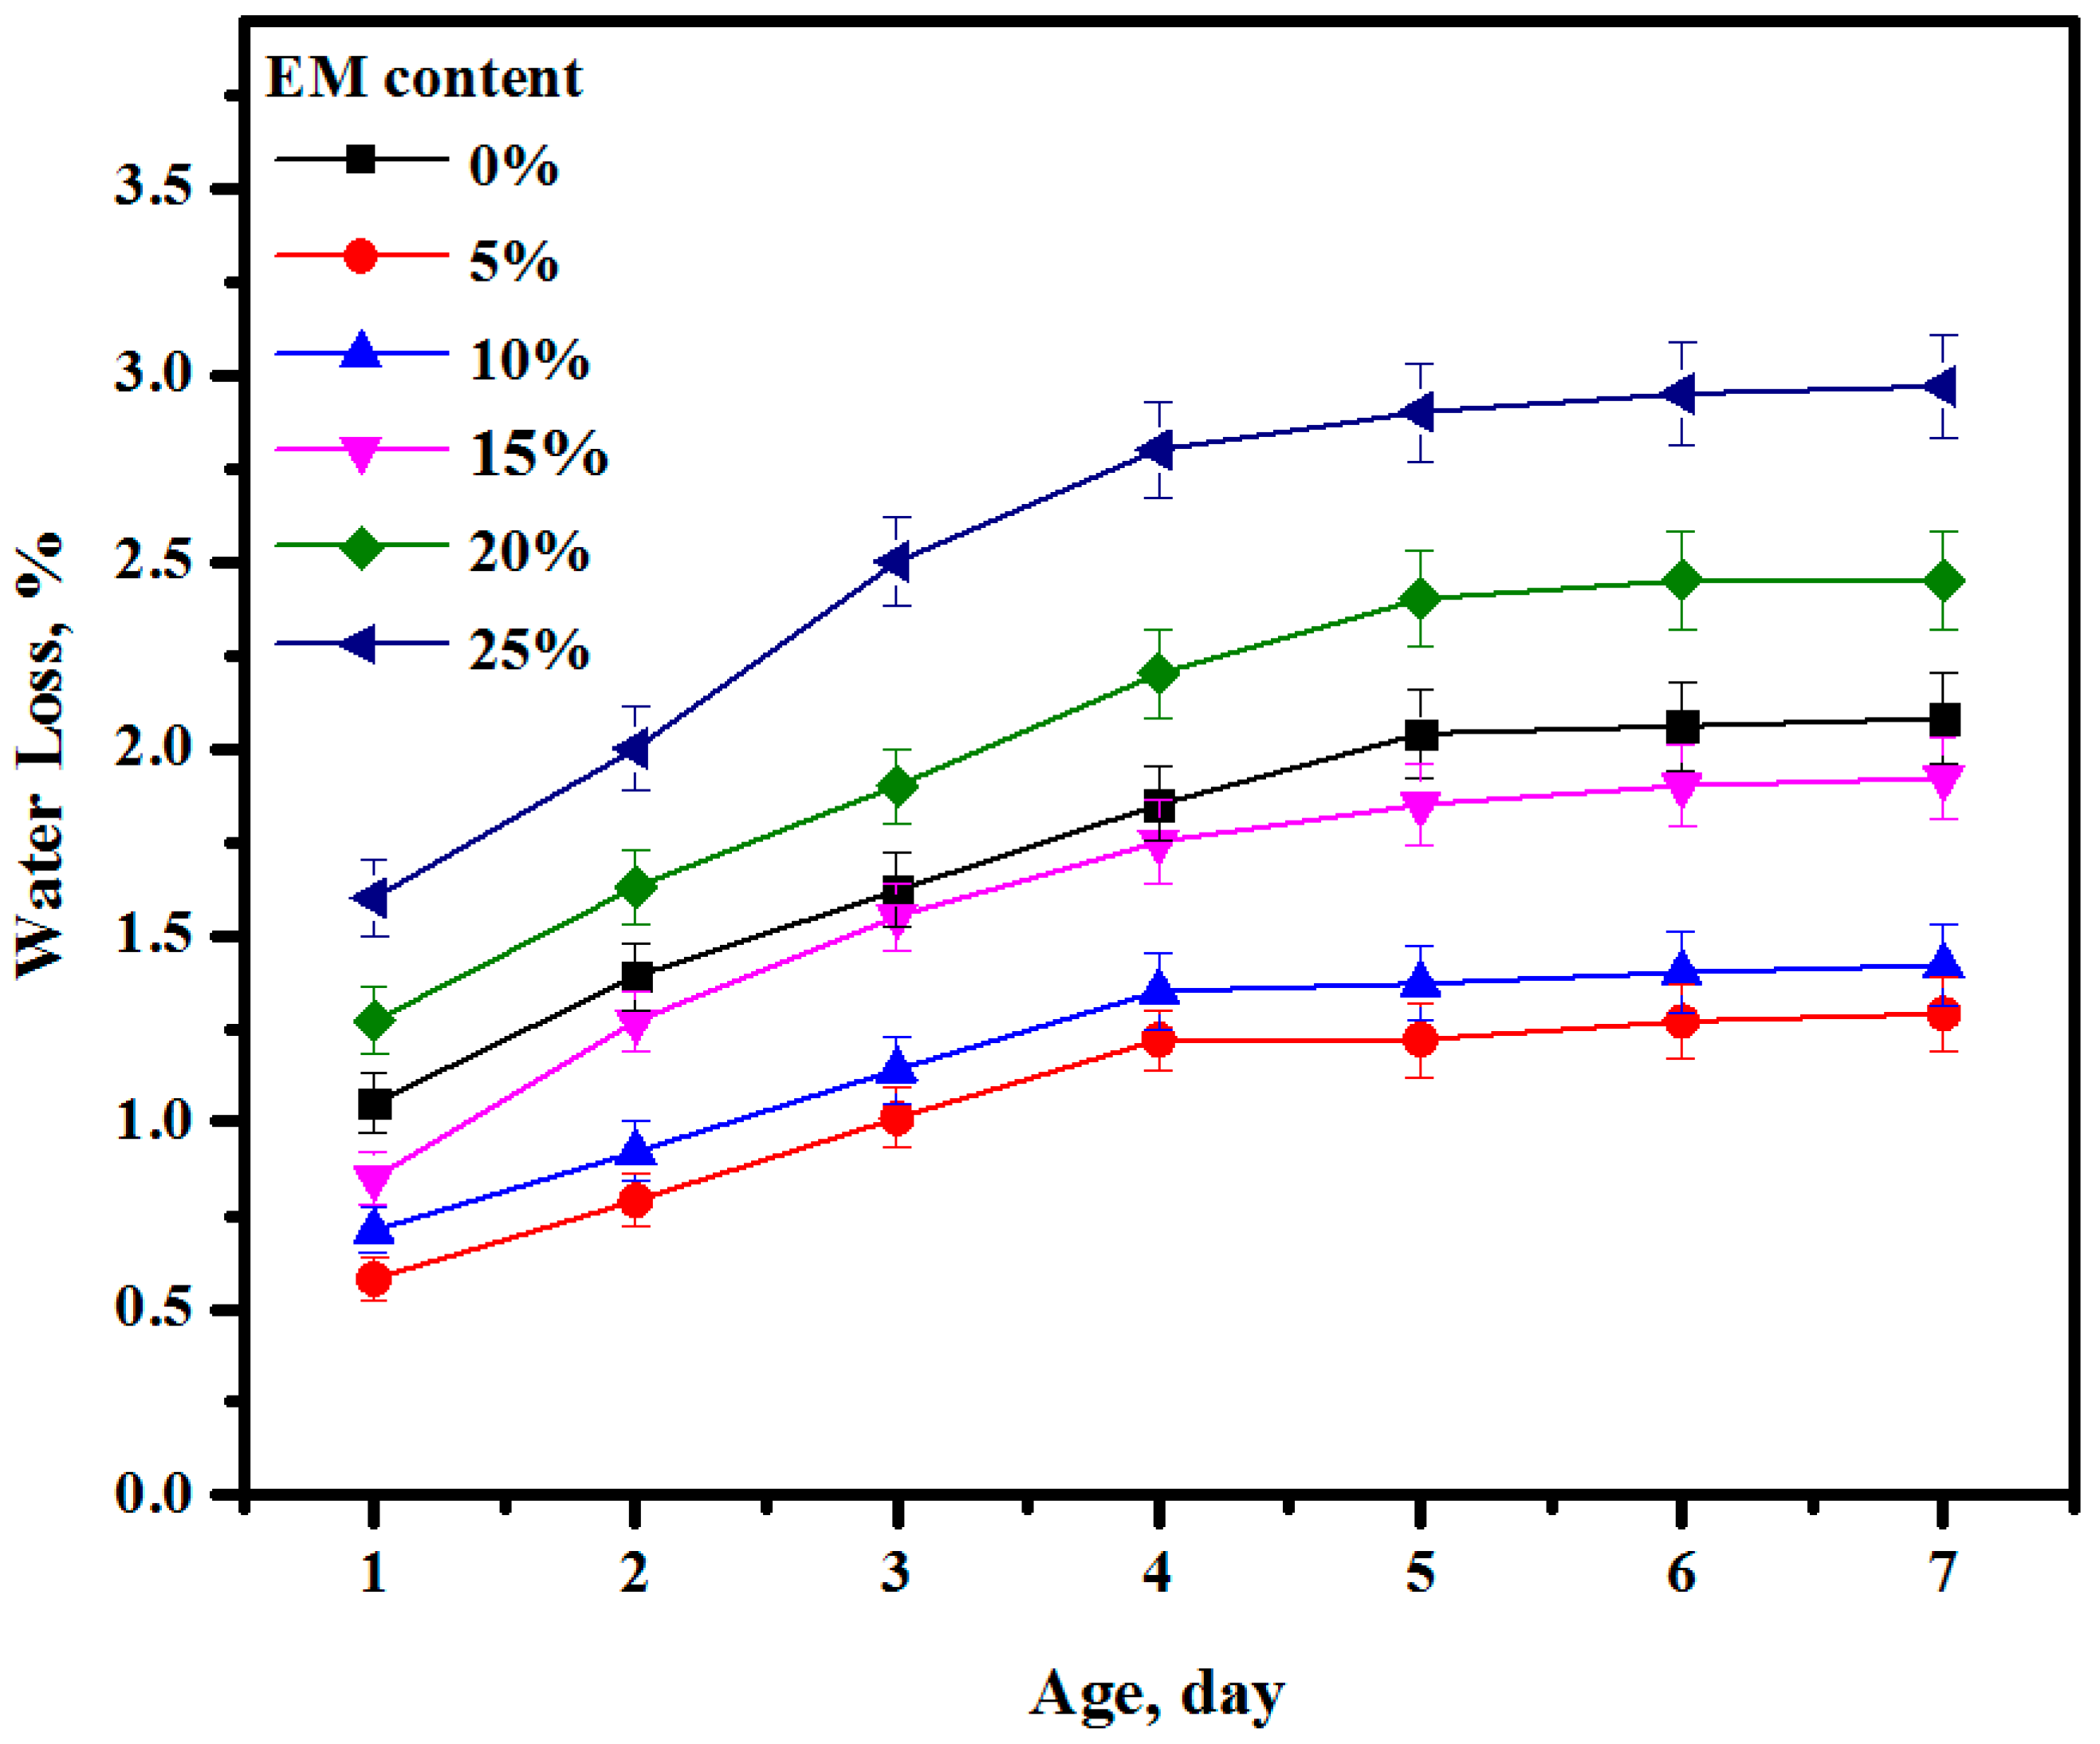
3.10. Water Loss
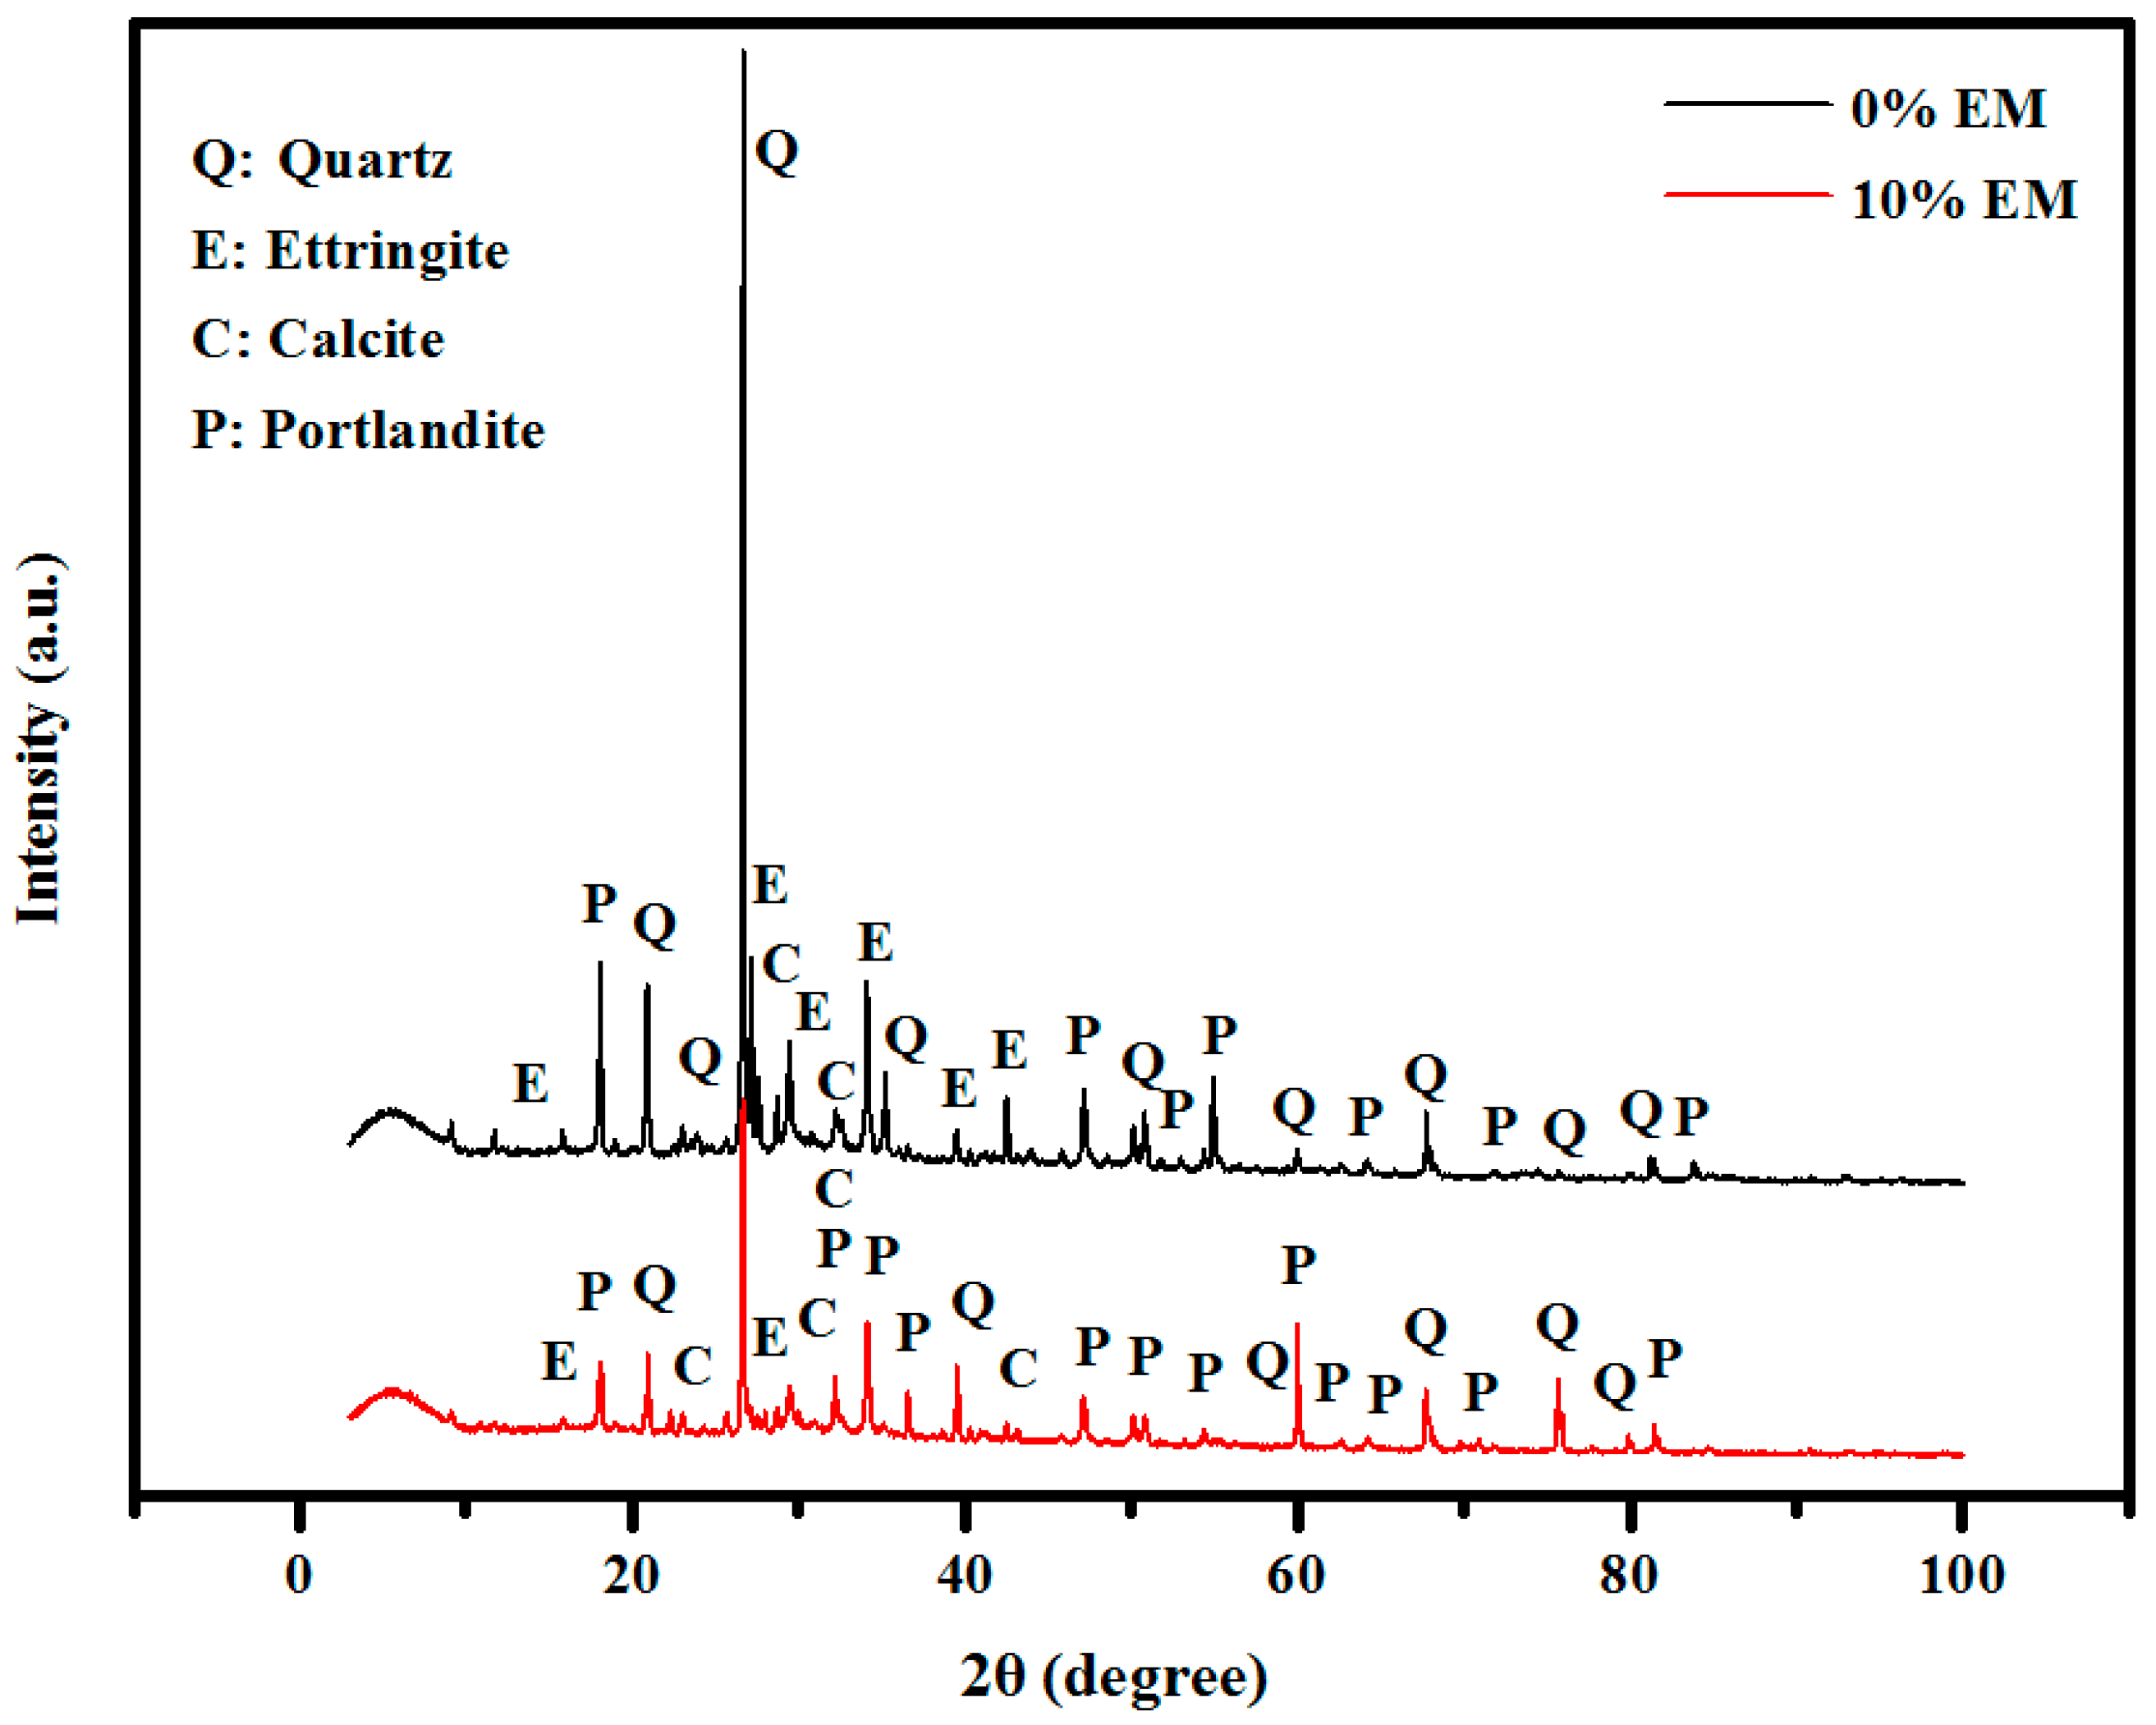
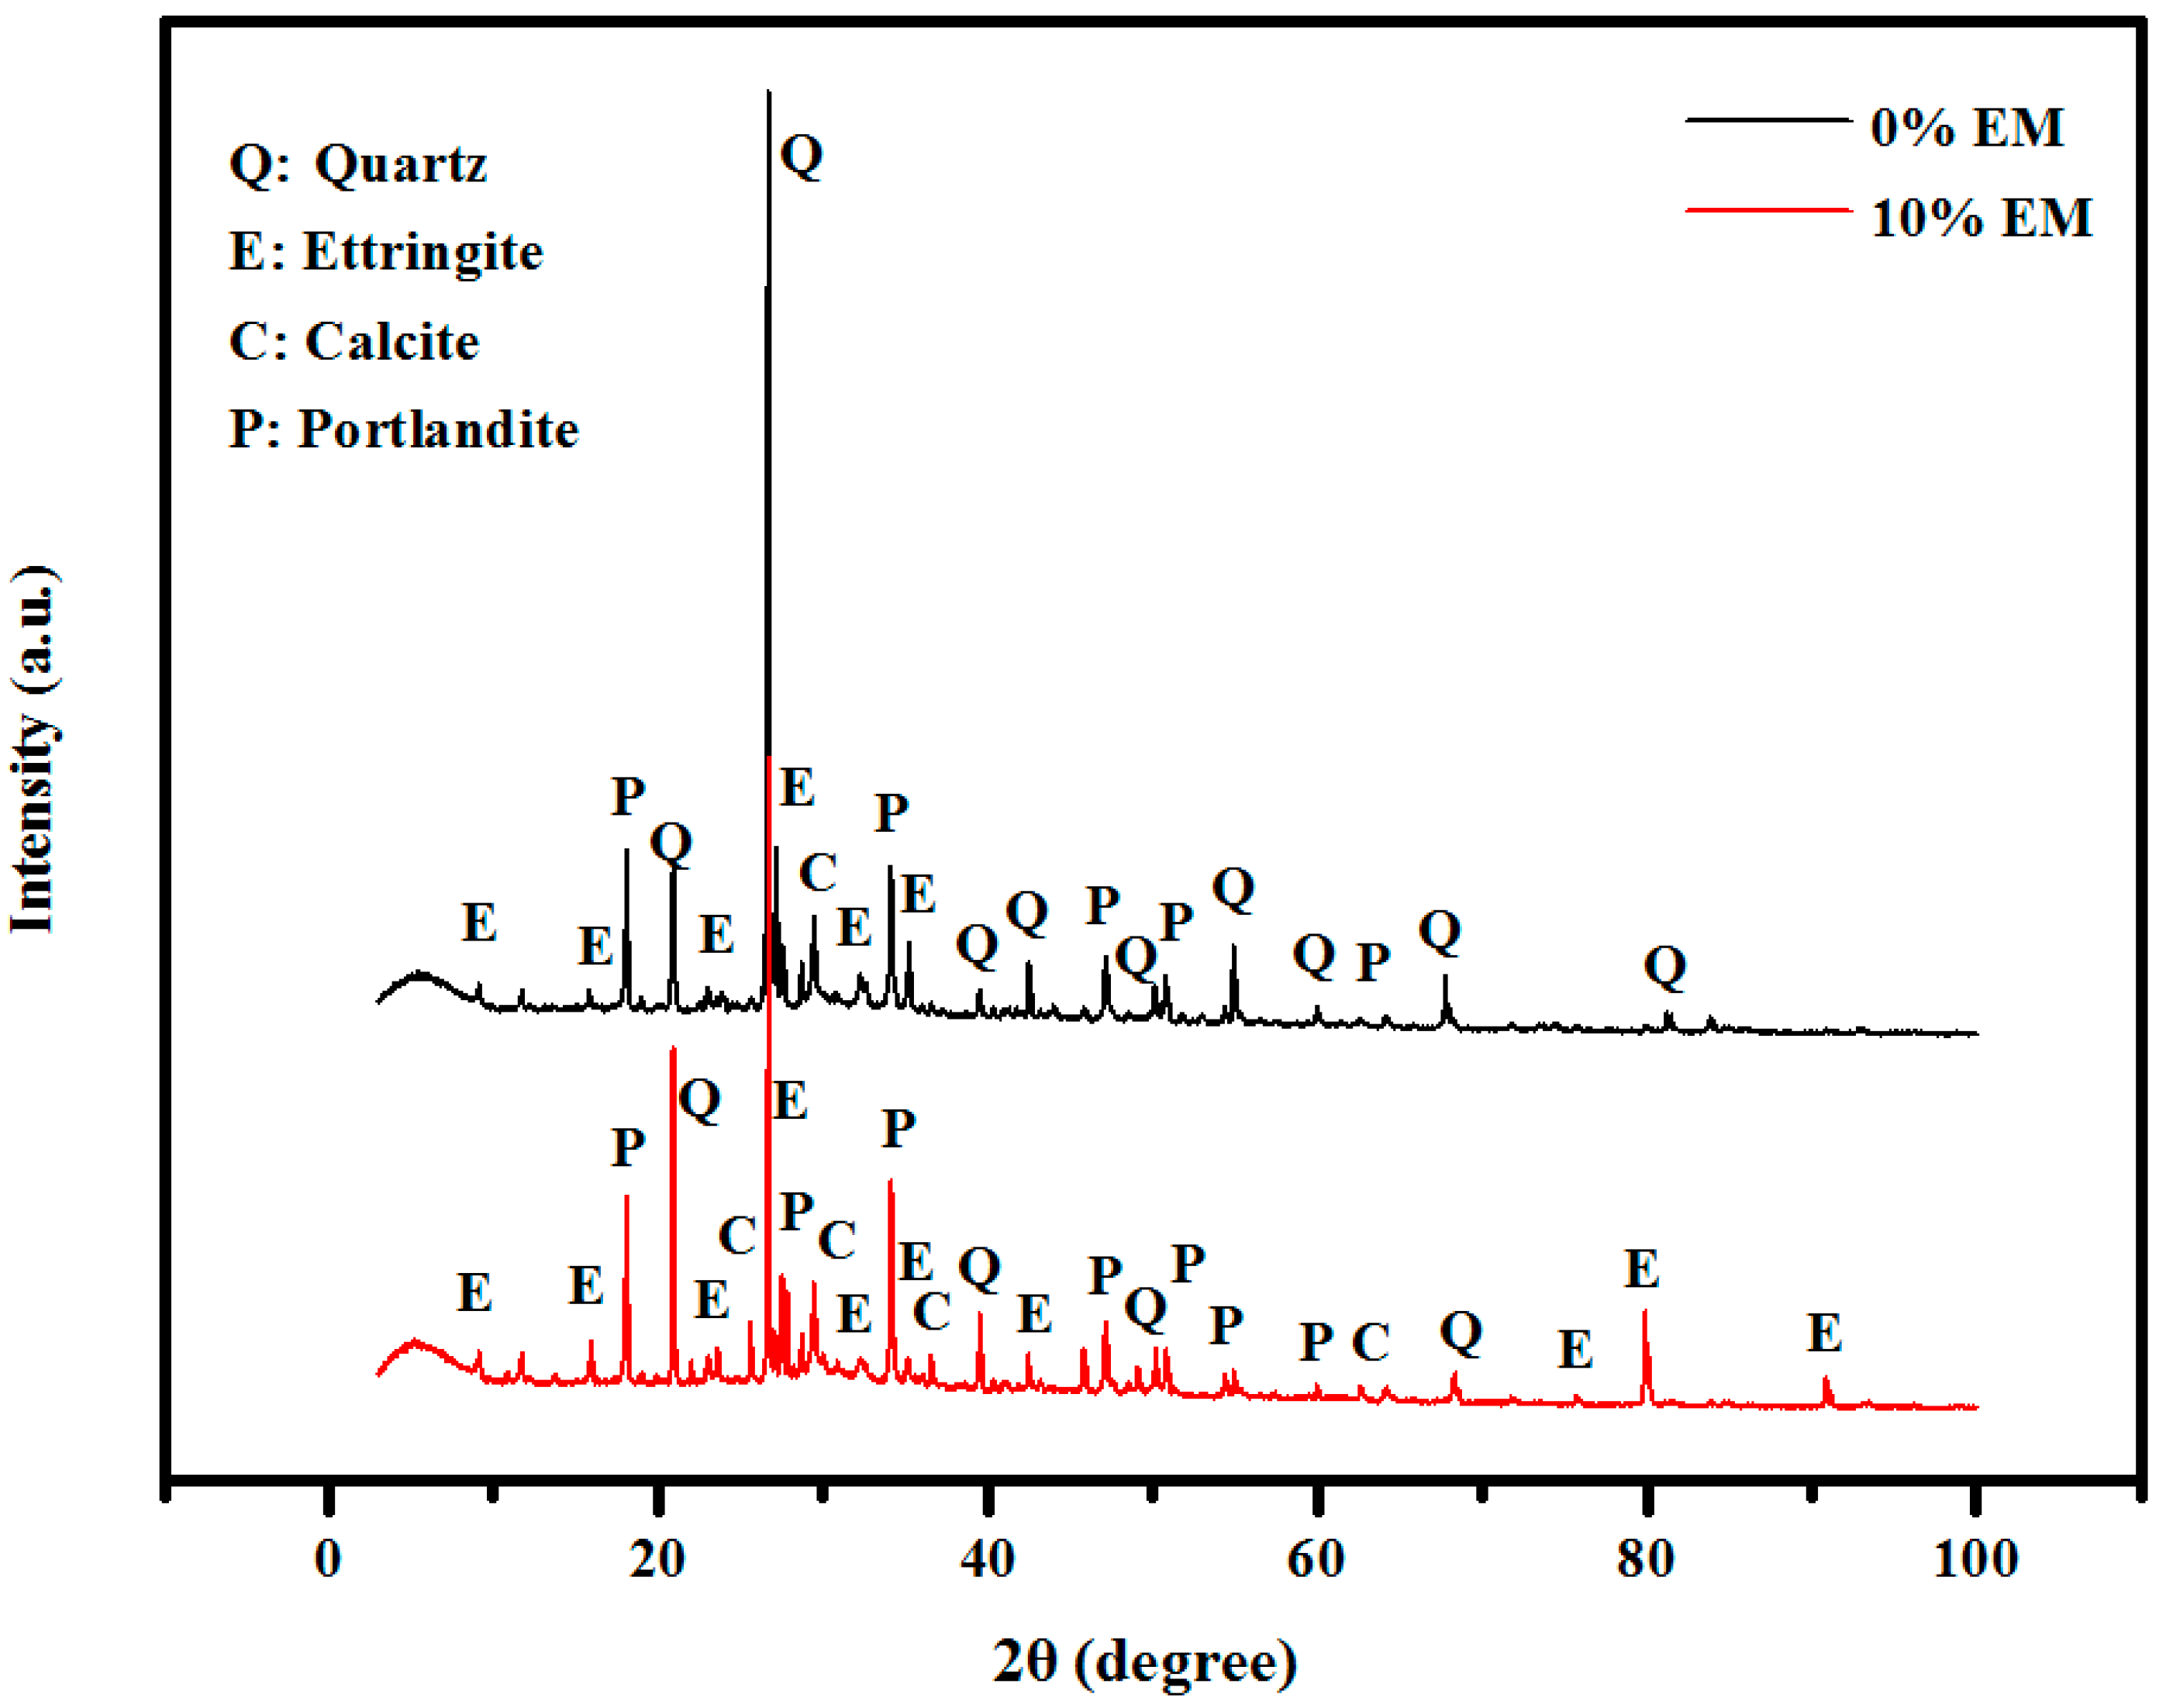
3.11. XRD Patterns
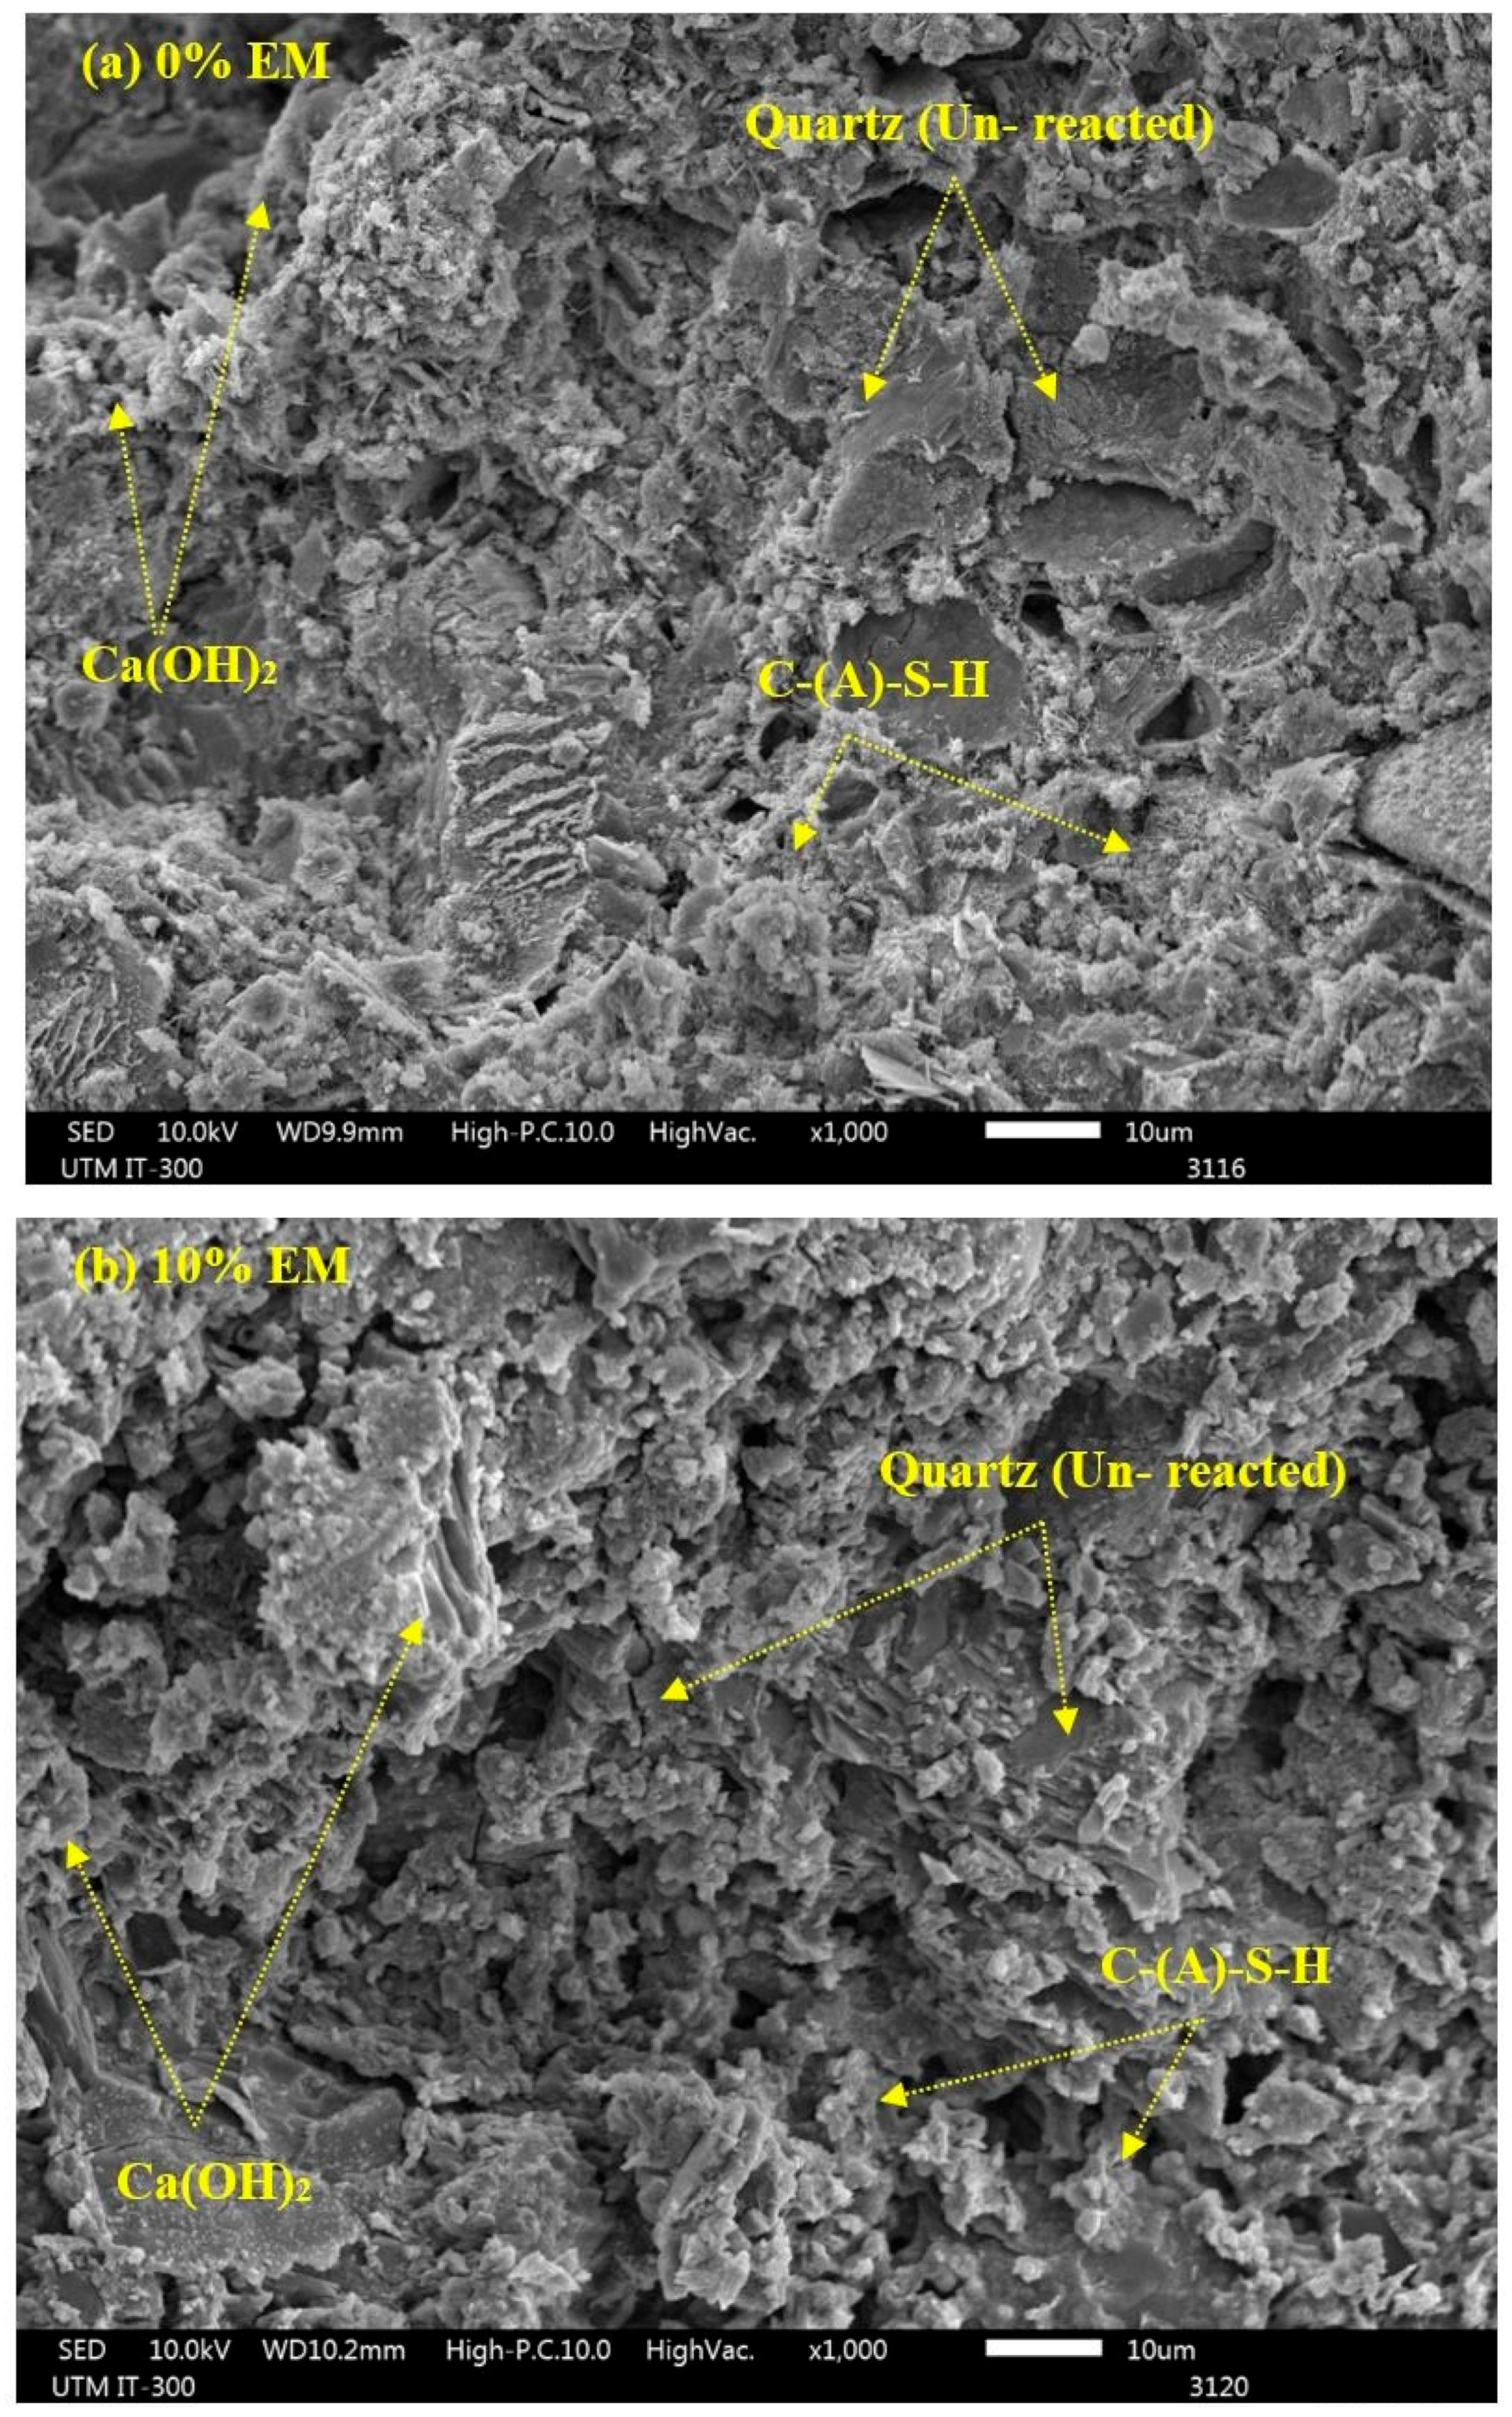
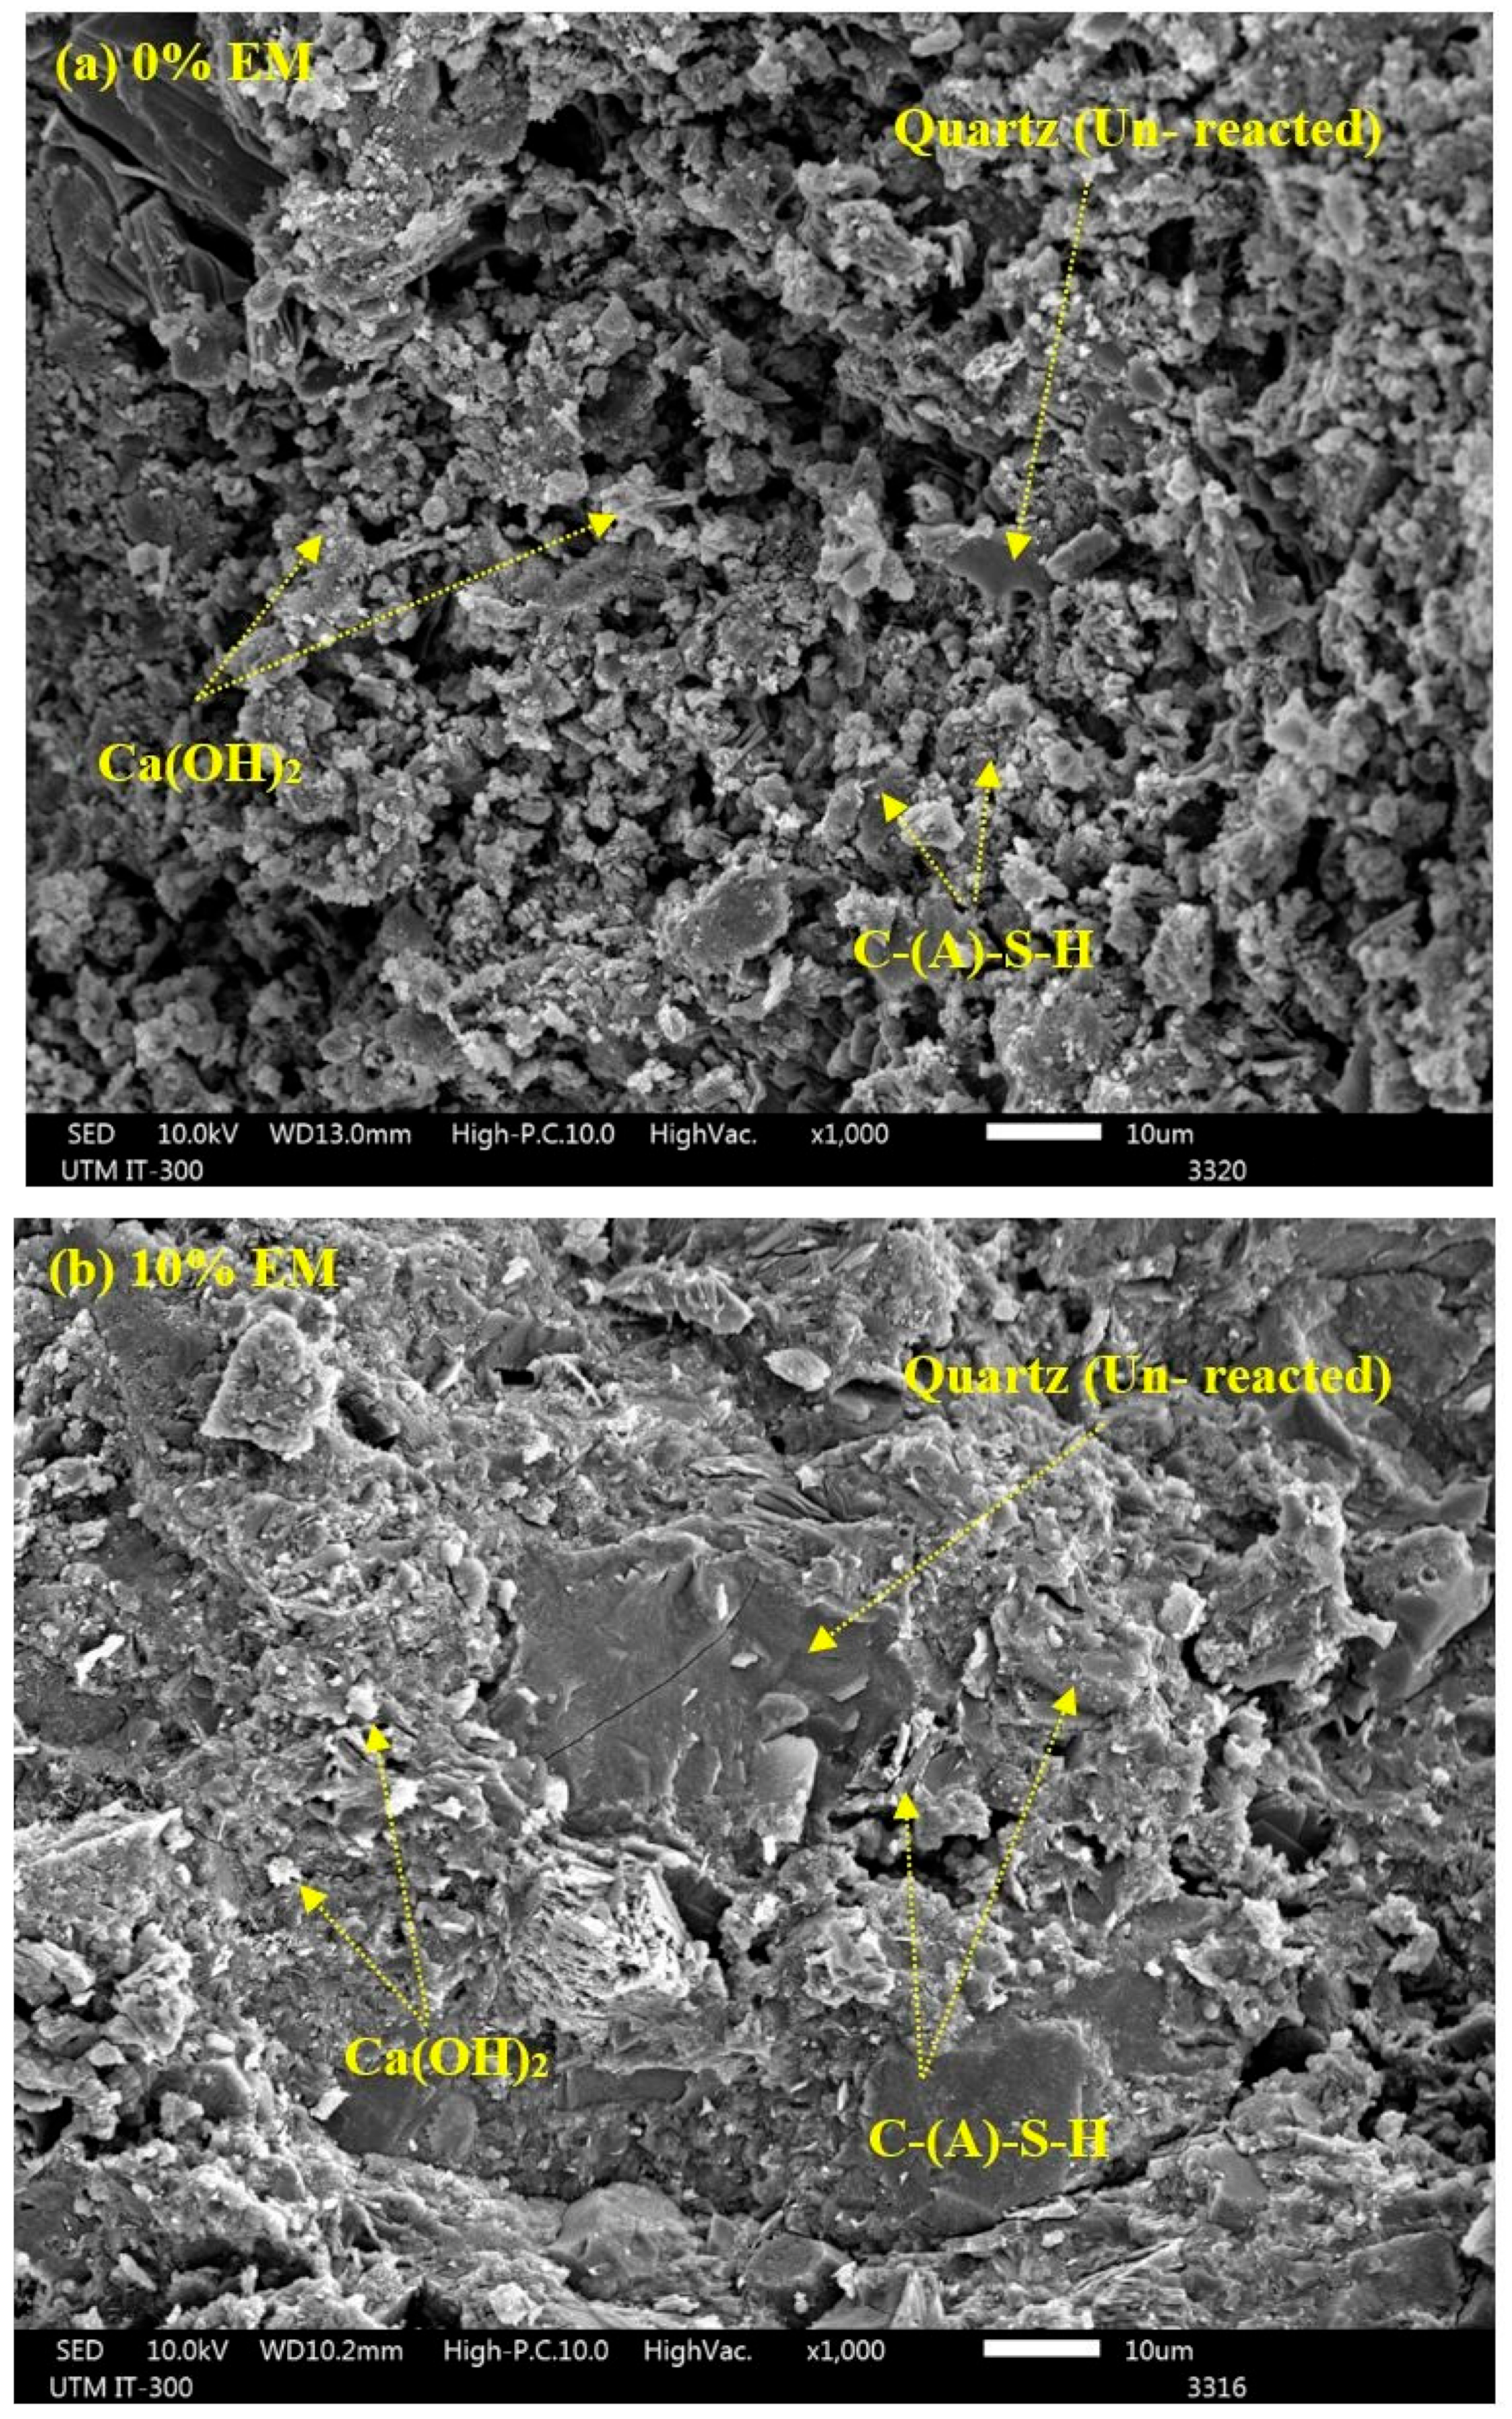
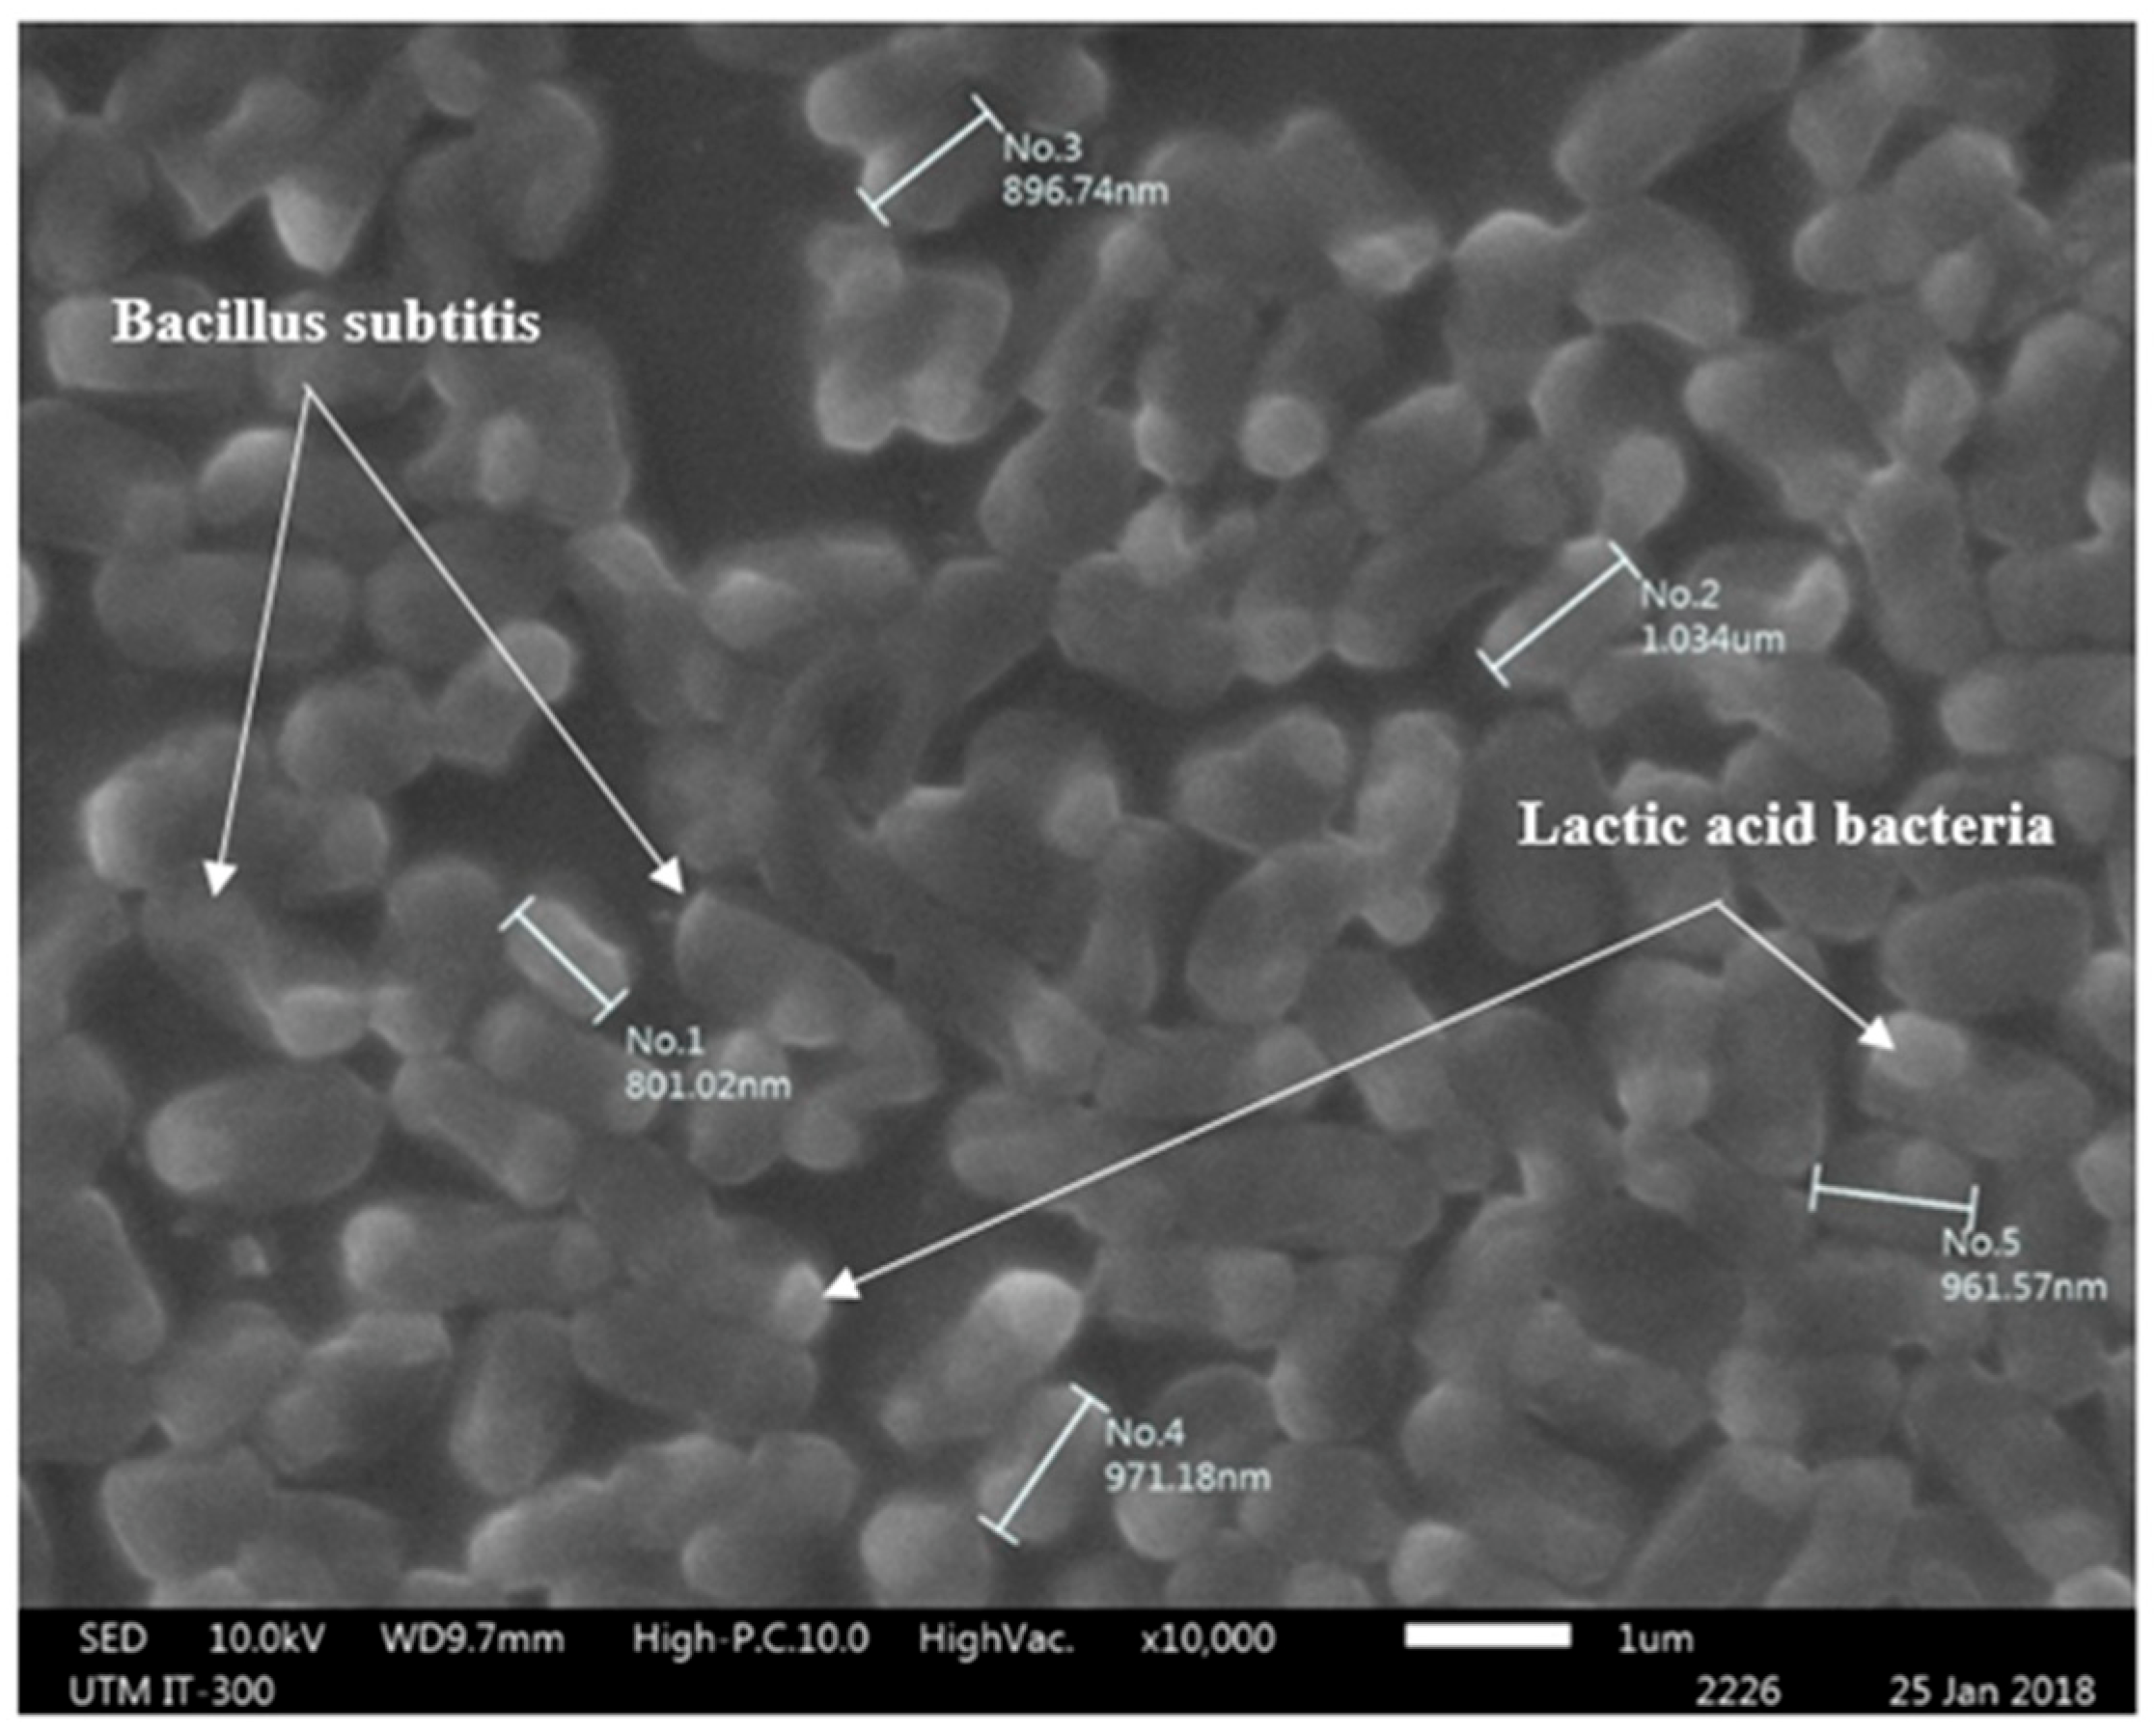
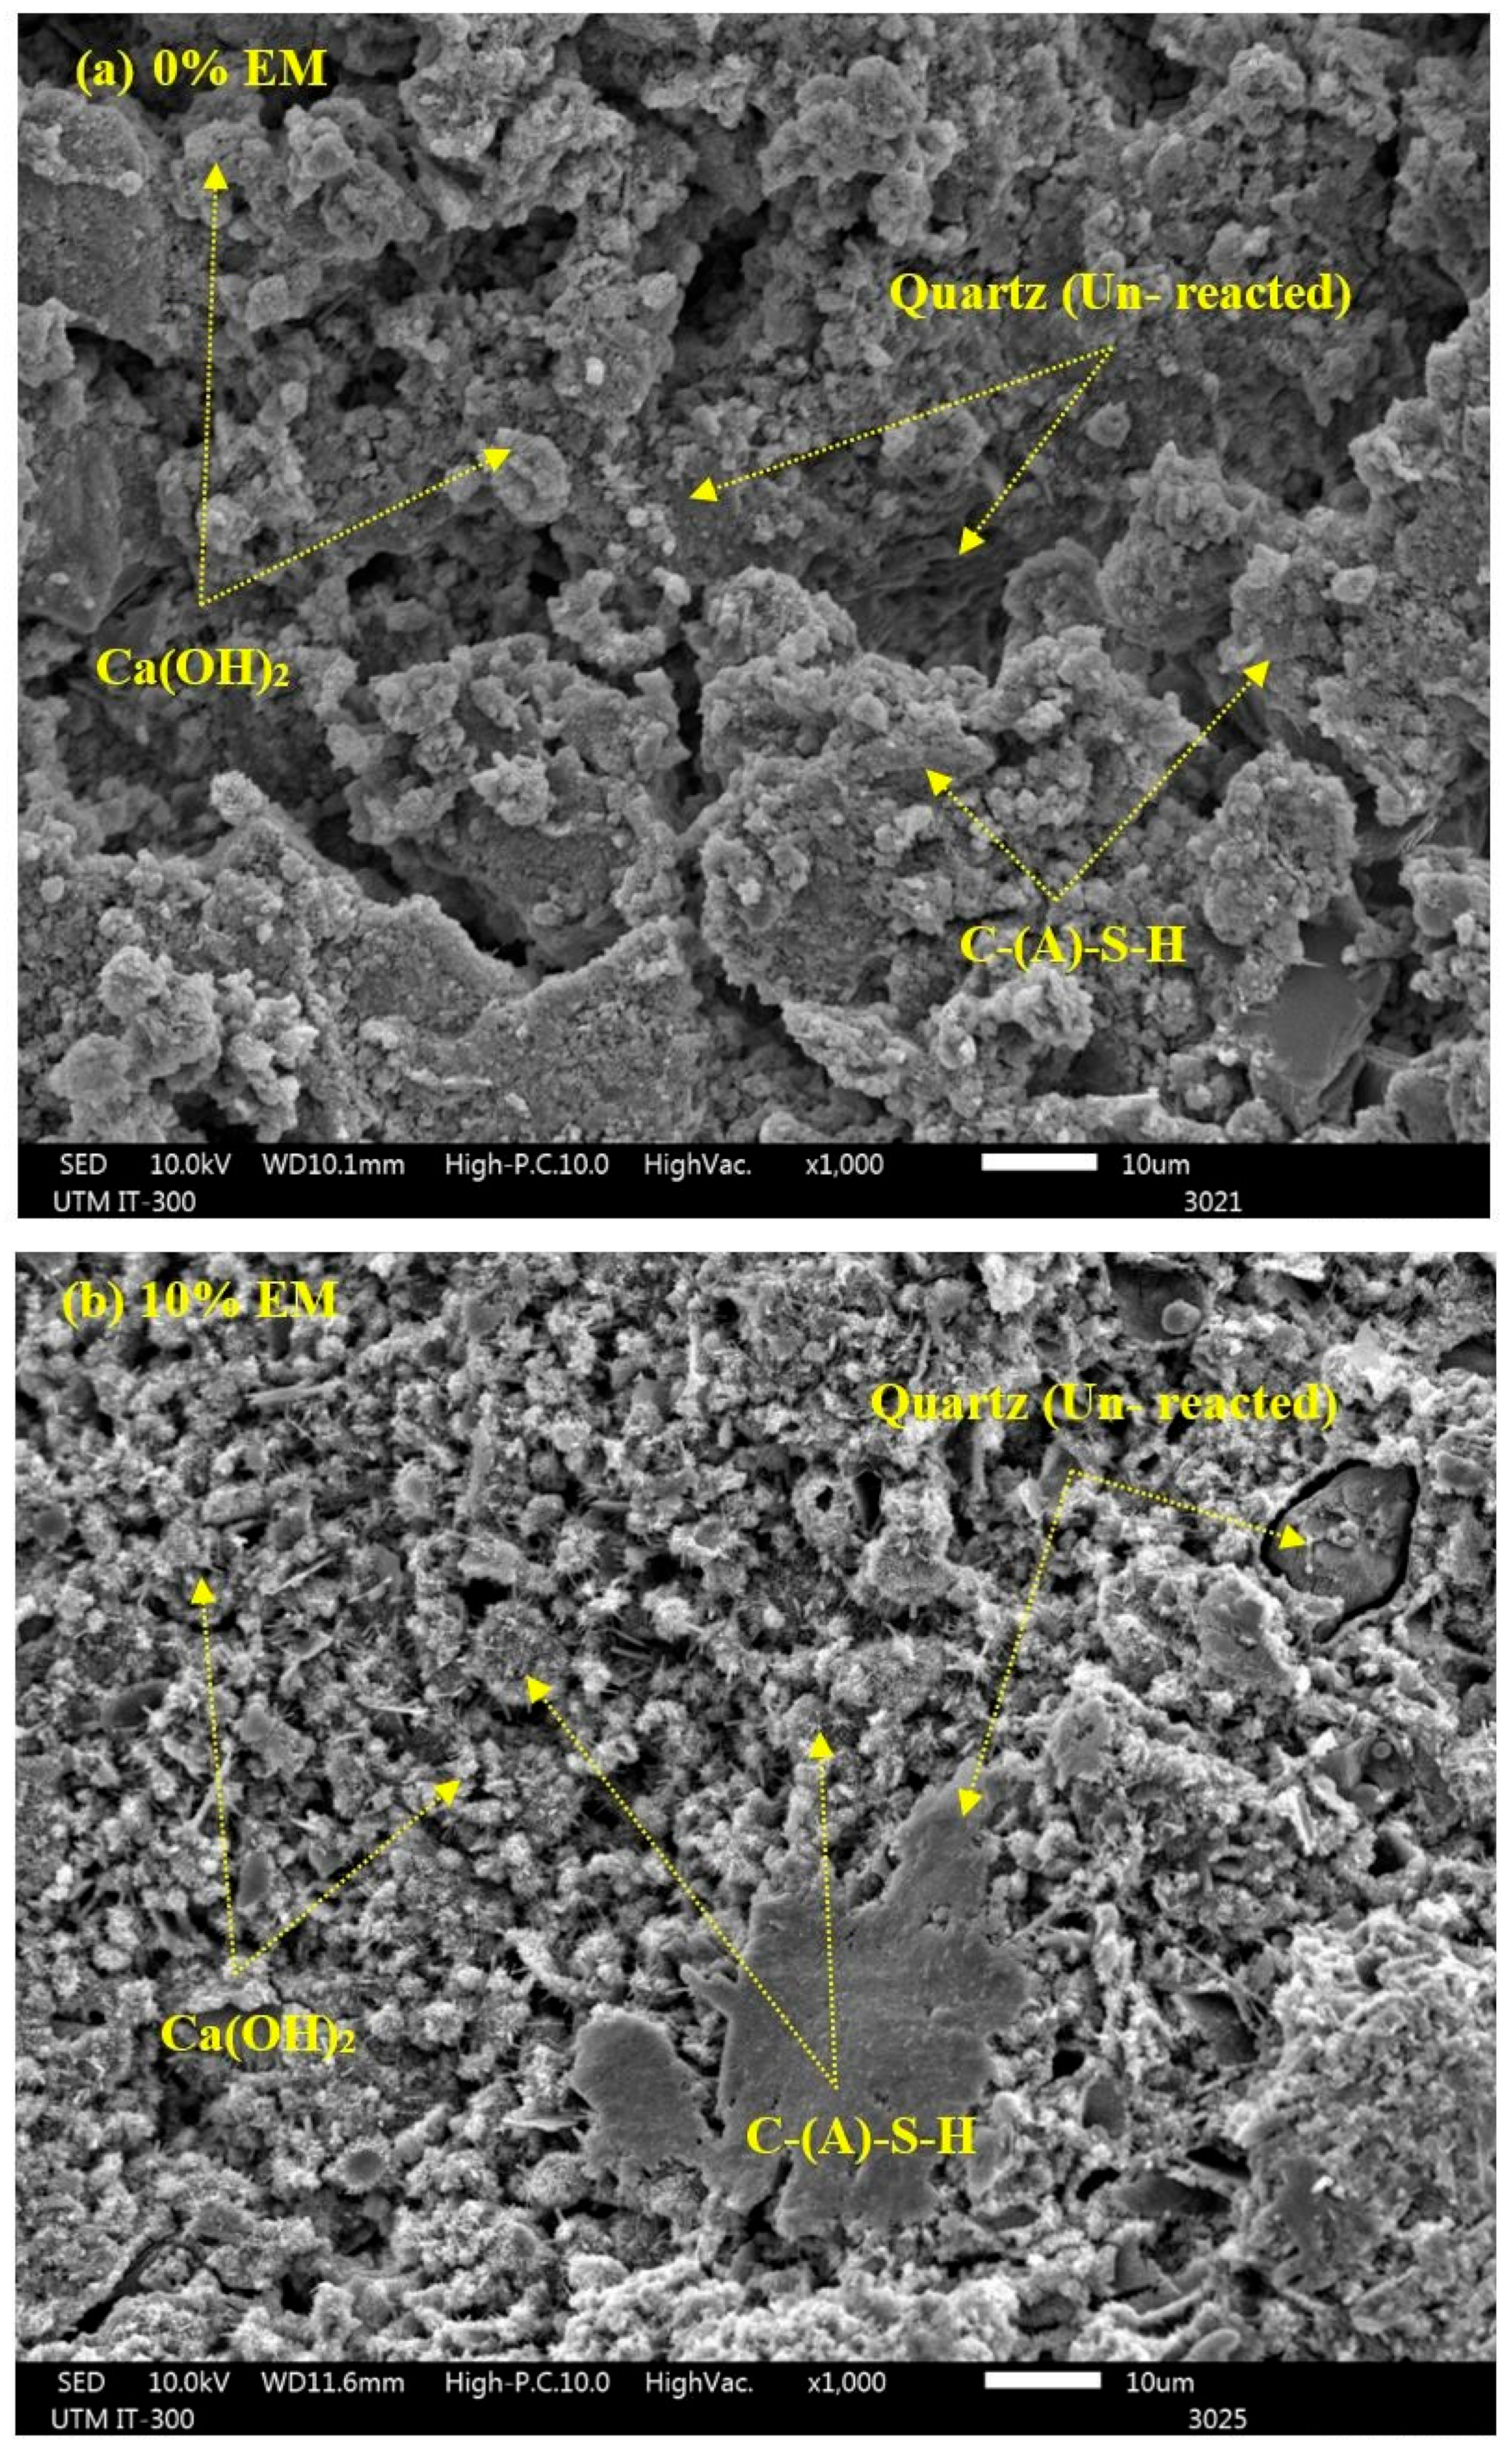
3.12. SEM Analyses
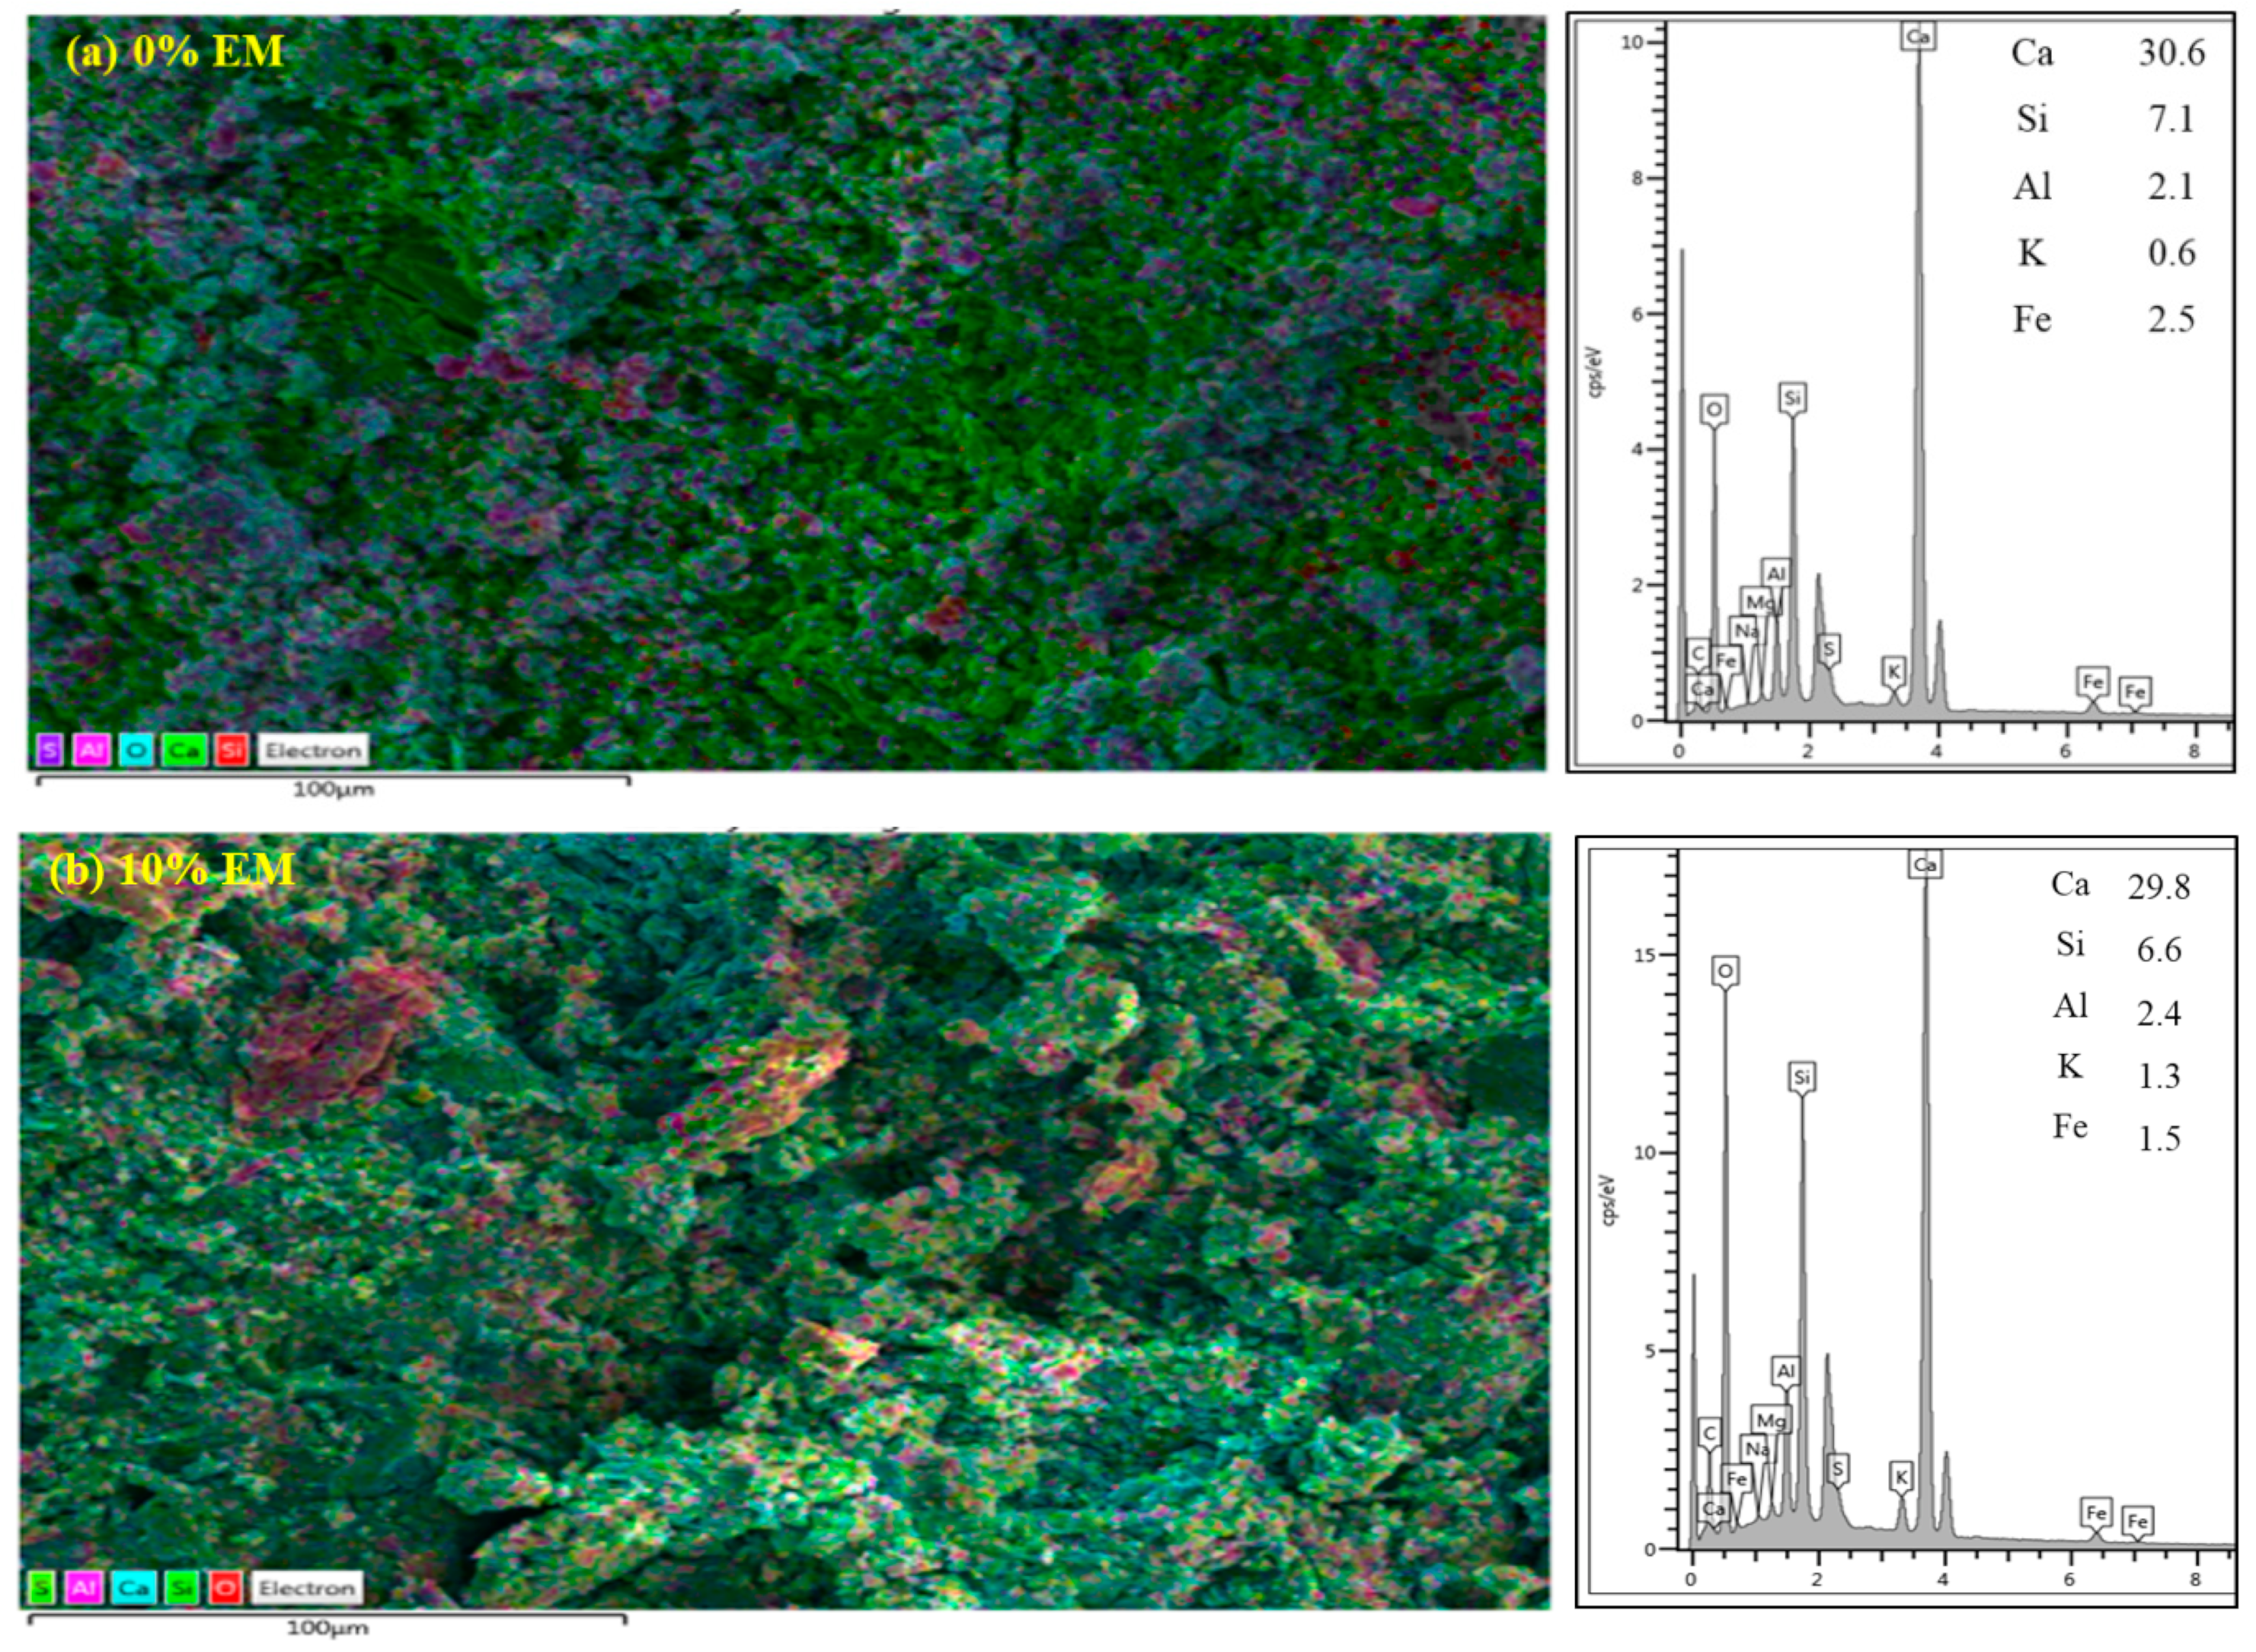
3.13. EDX Analysis
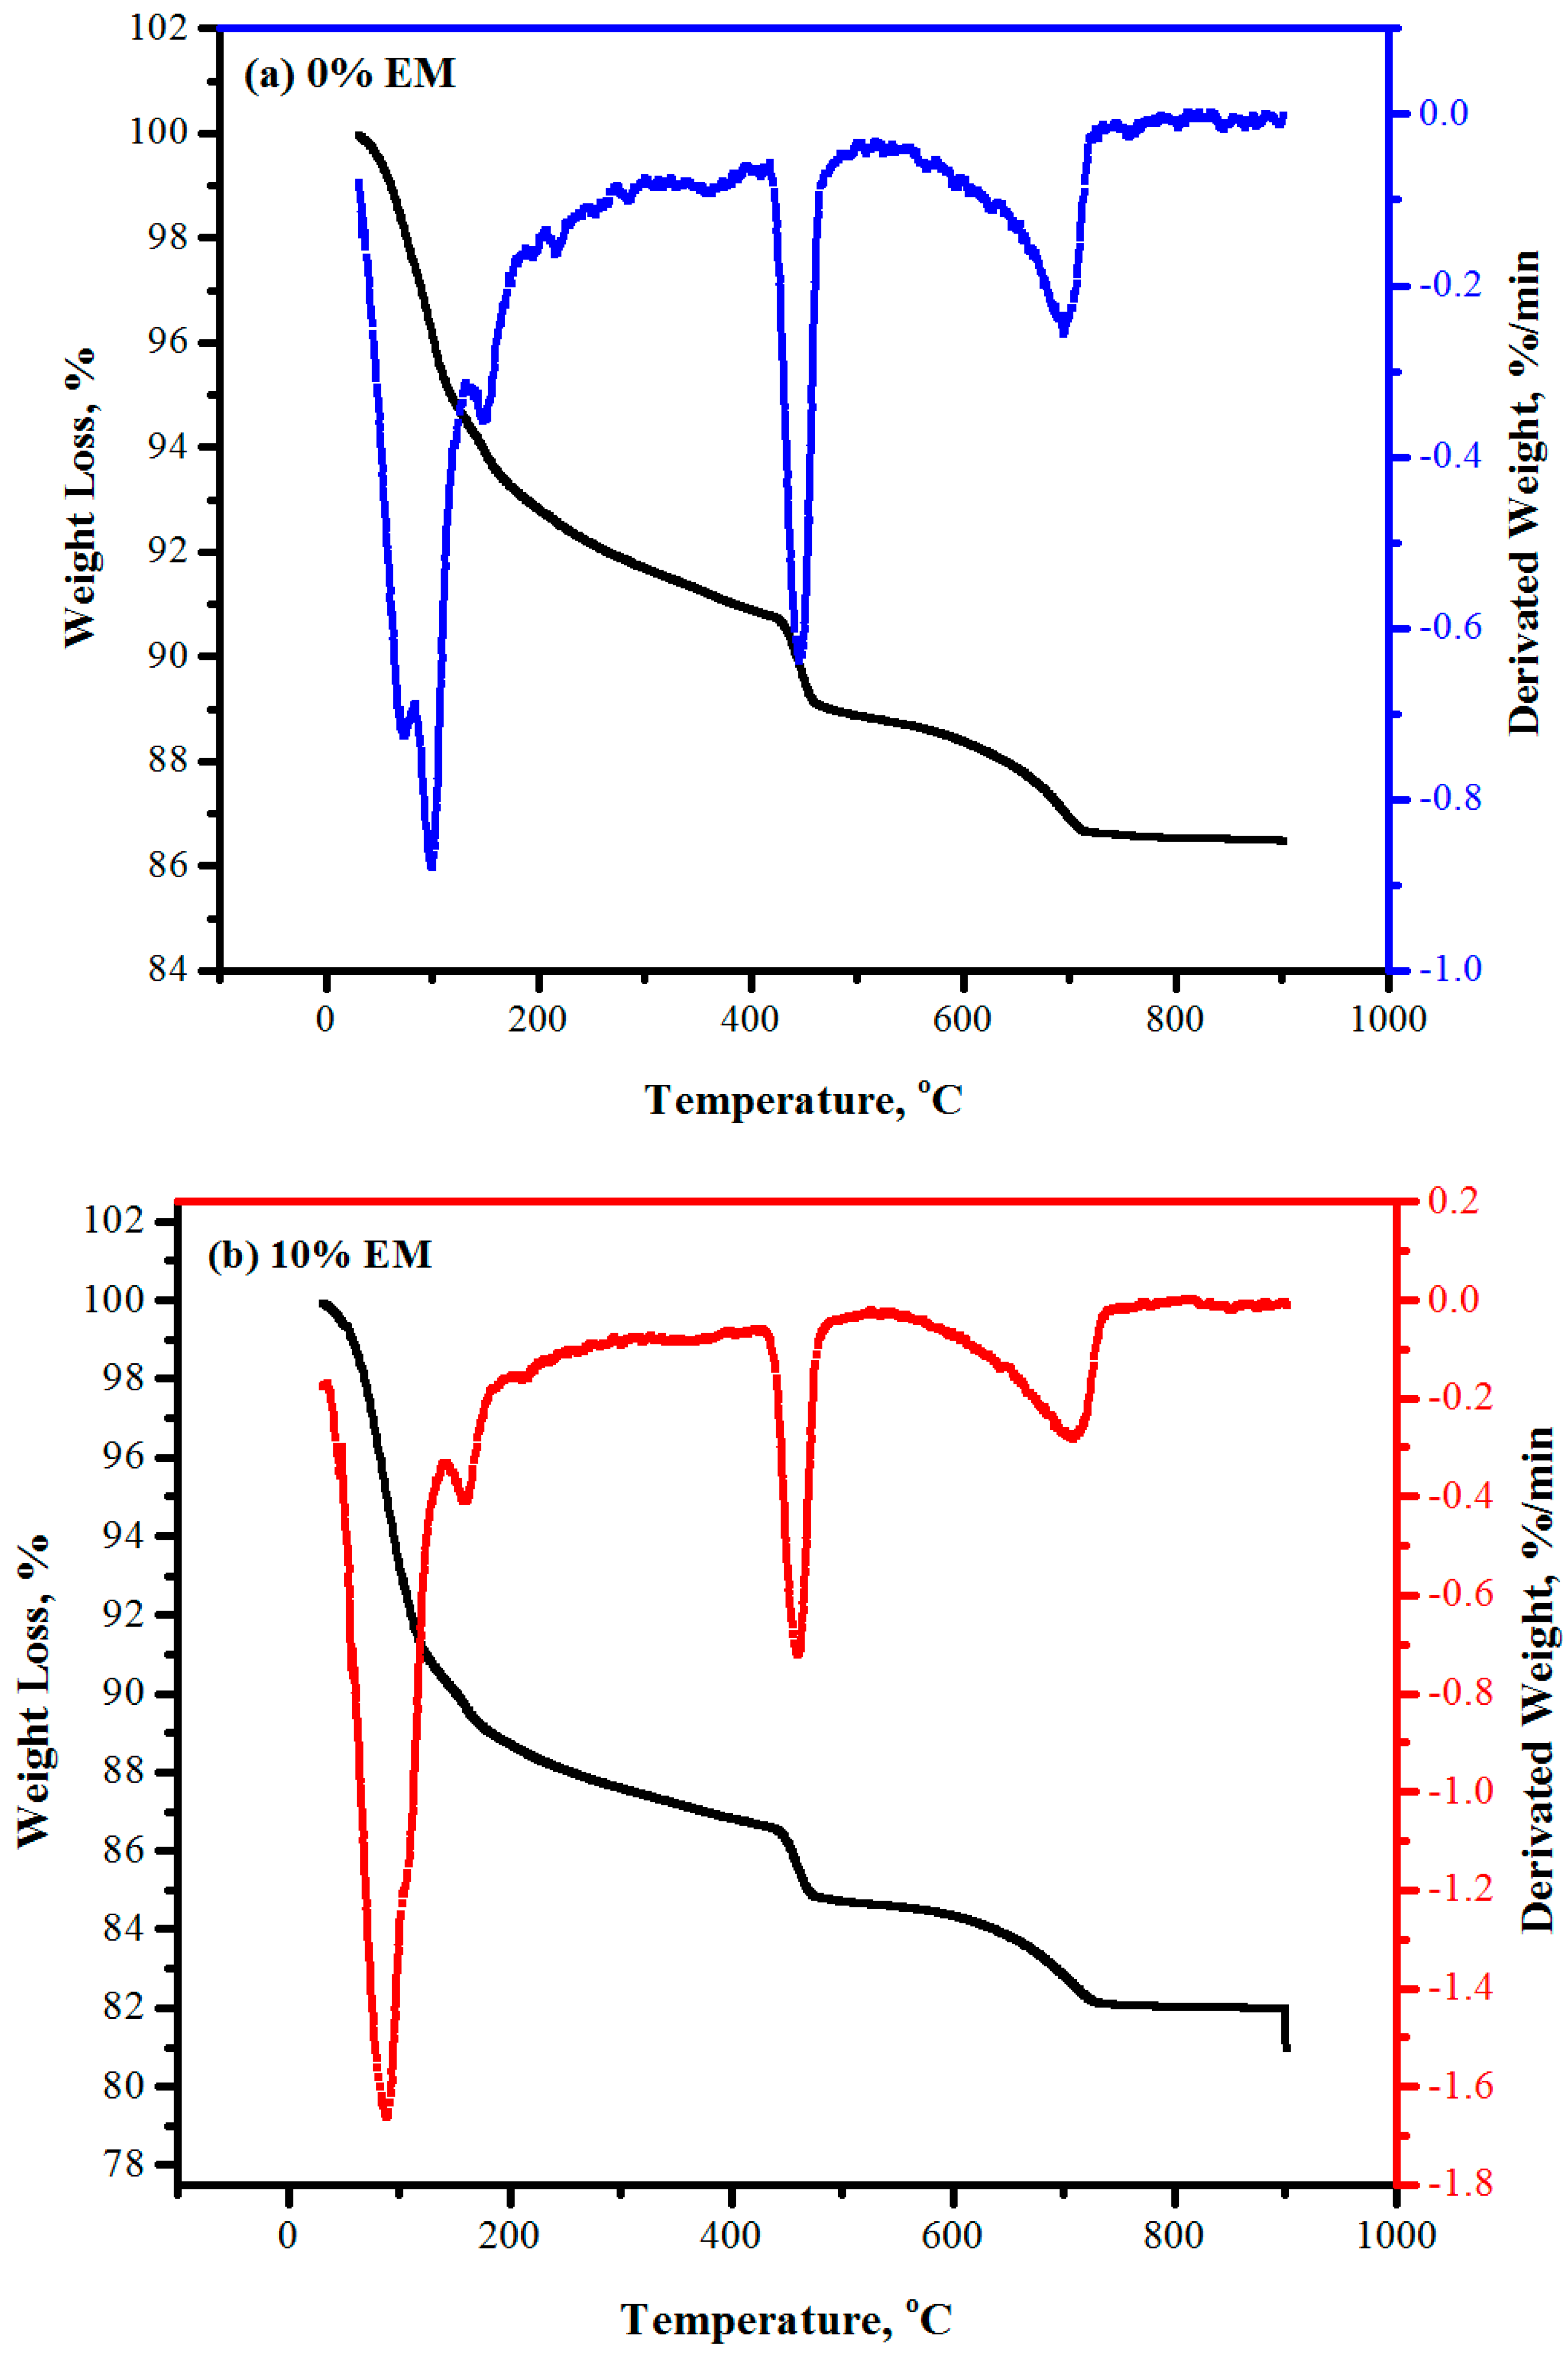
3.14. TGA and DTG Results
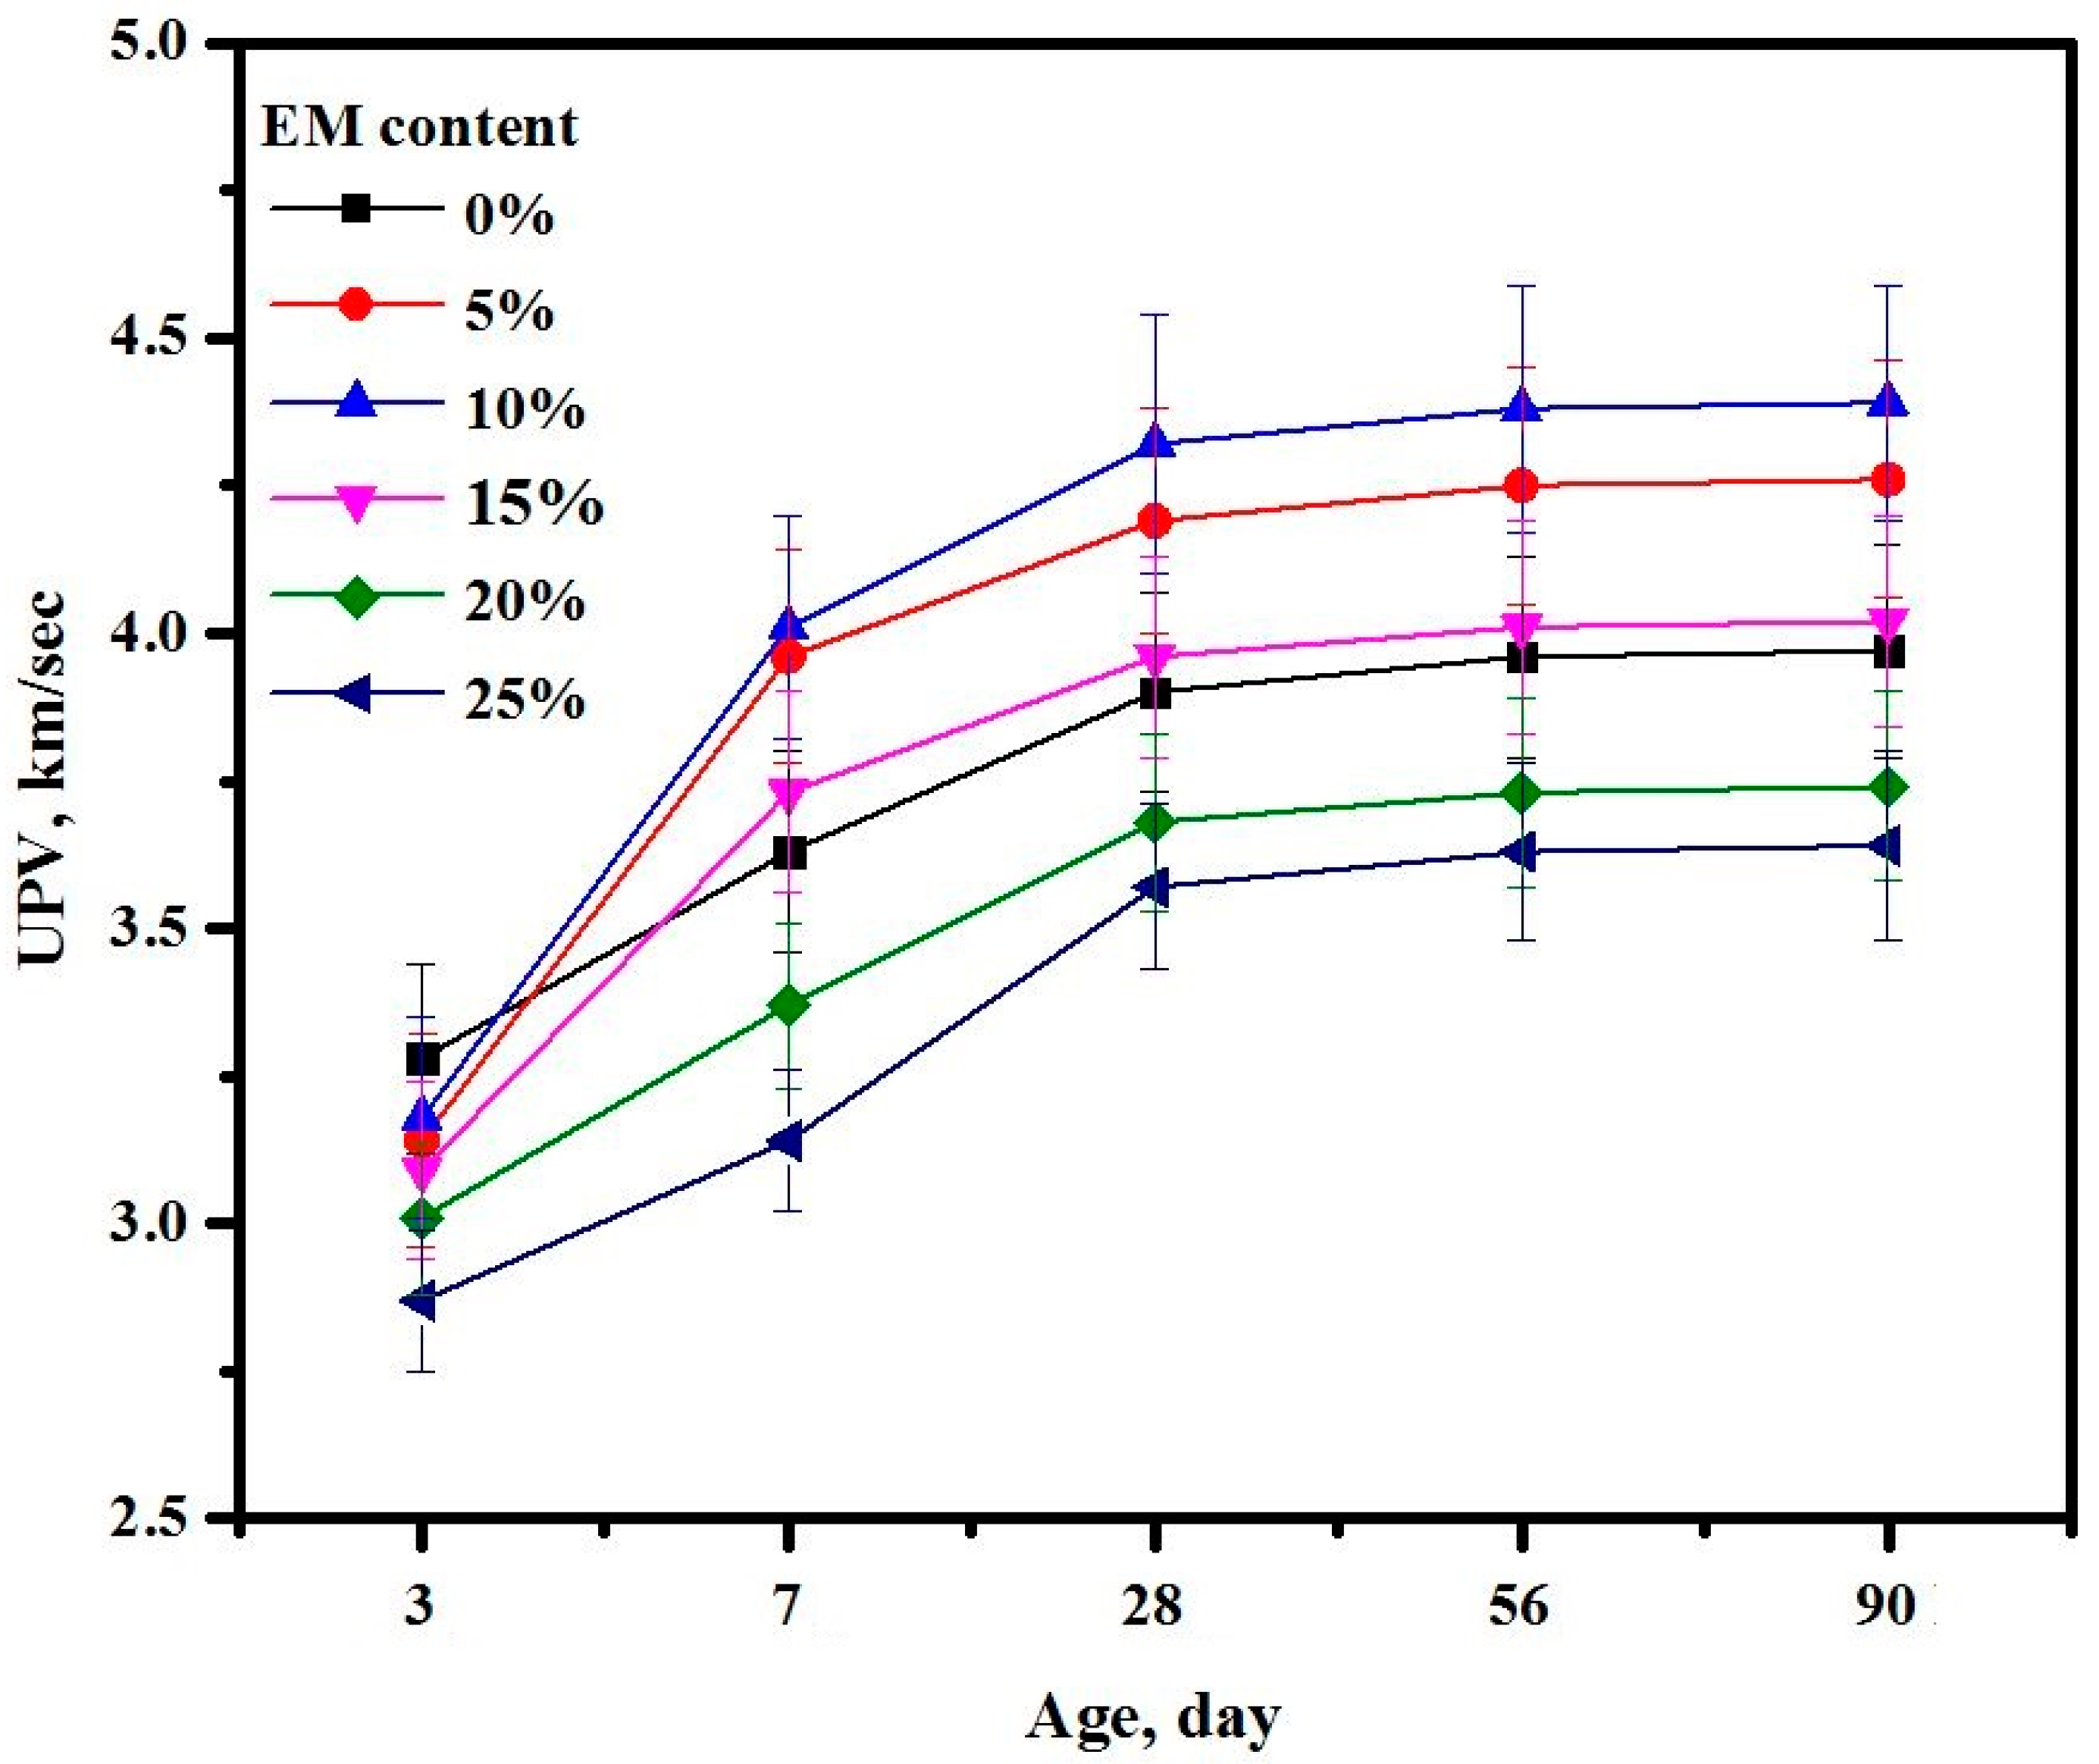
3.15. Ultrasonic Pulse Velocity
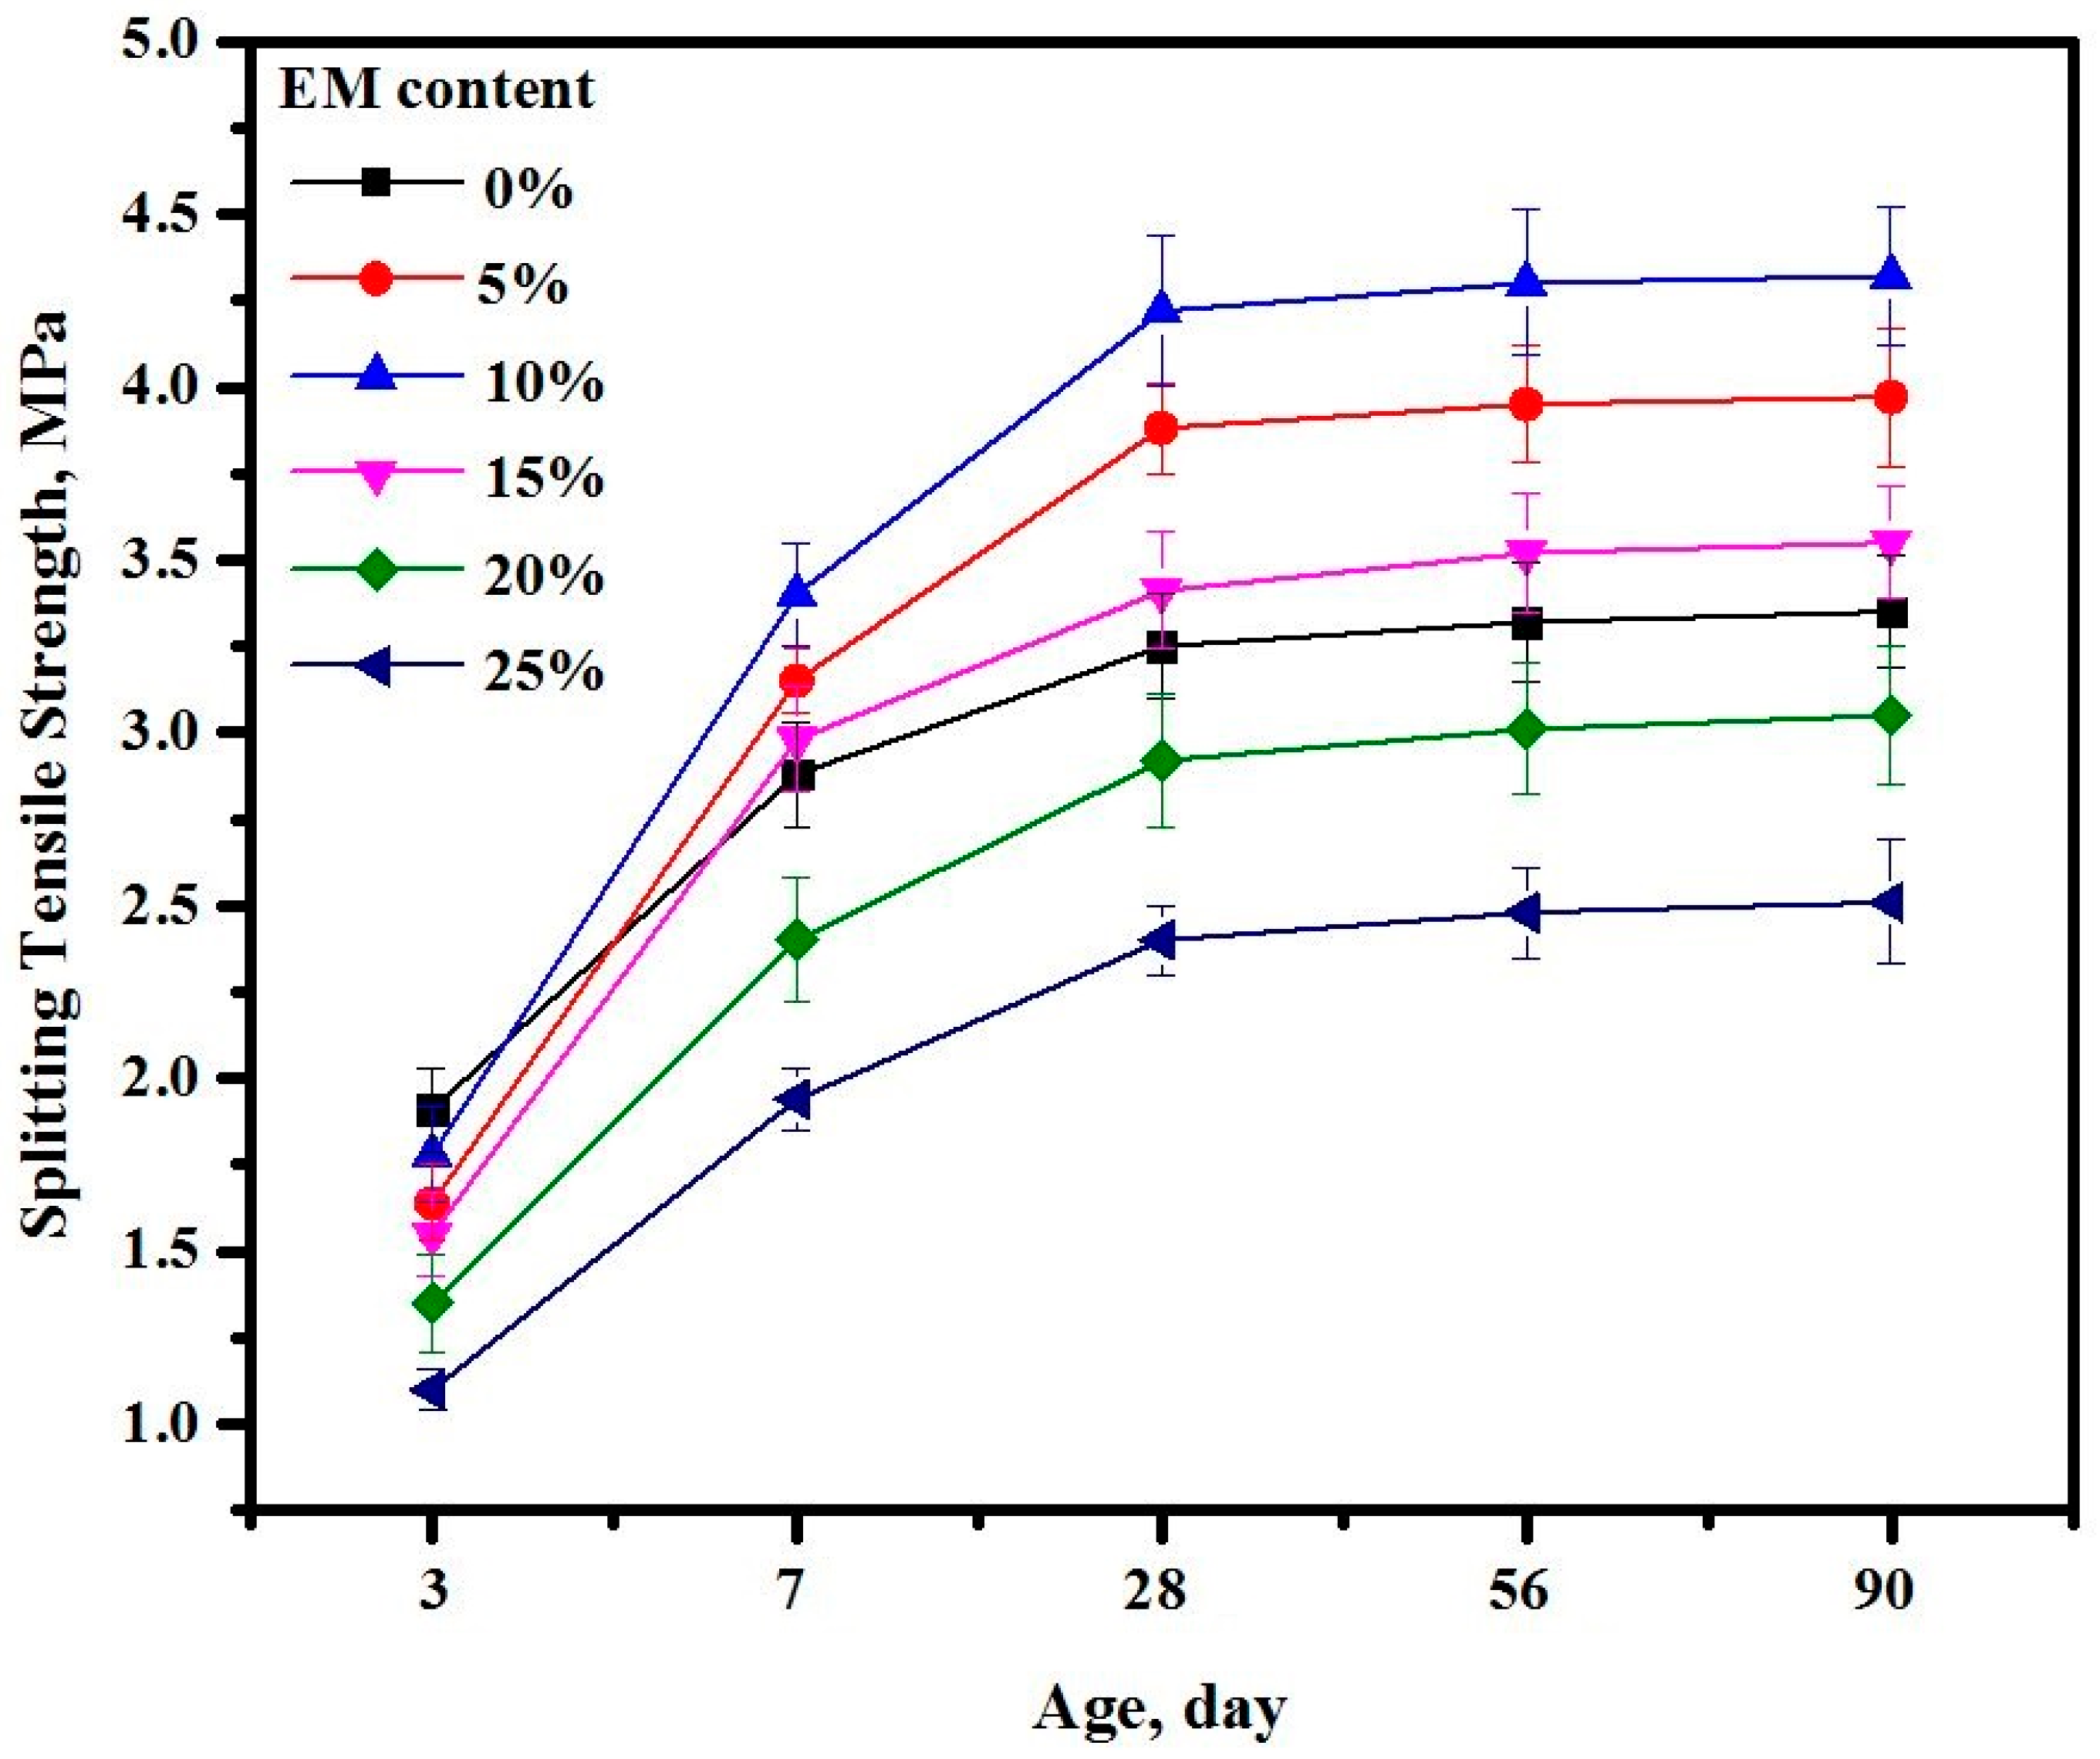
3.16. Splitting Tensile Strength
3.17. Flexural Strength
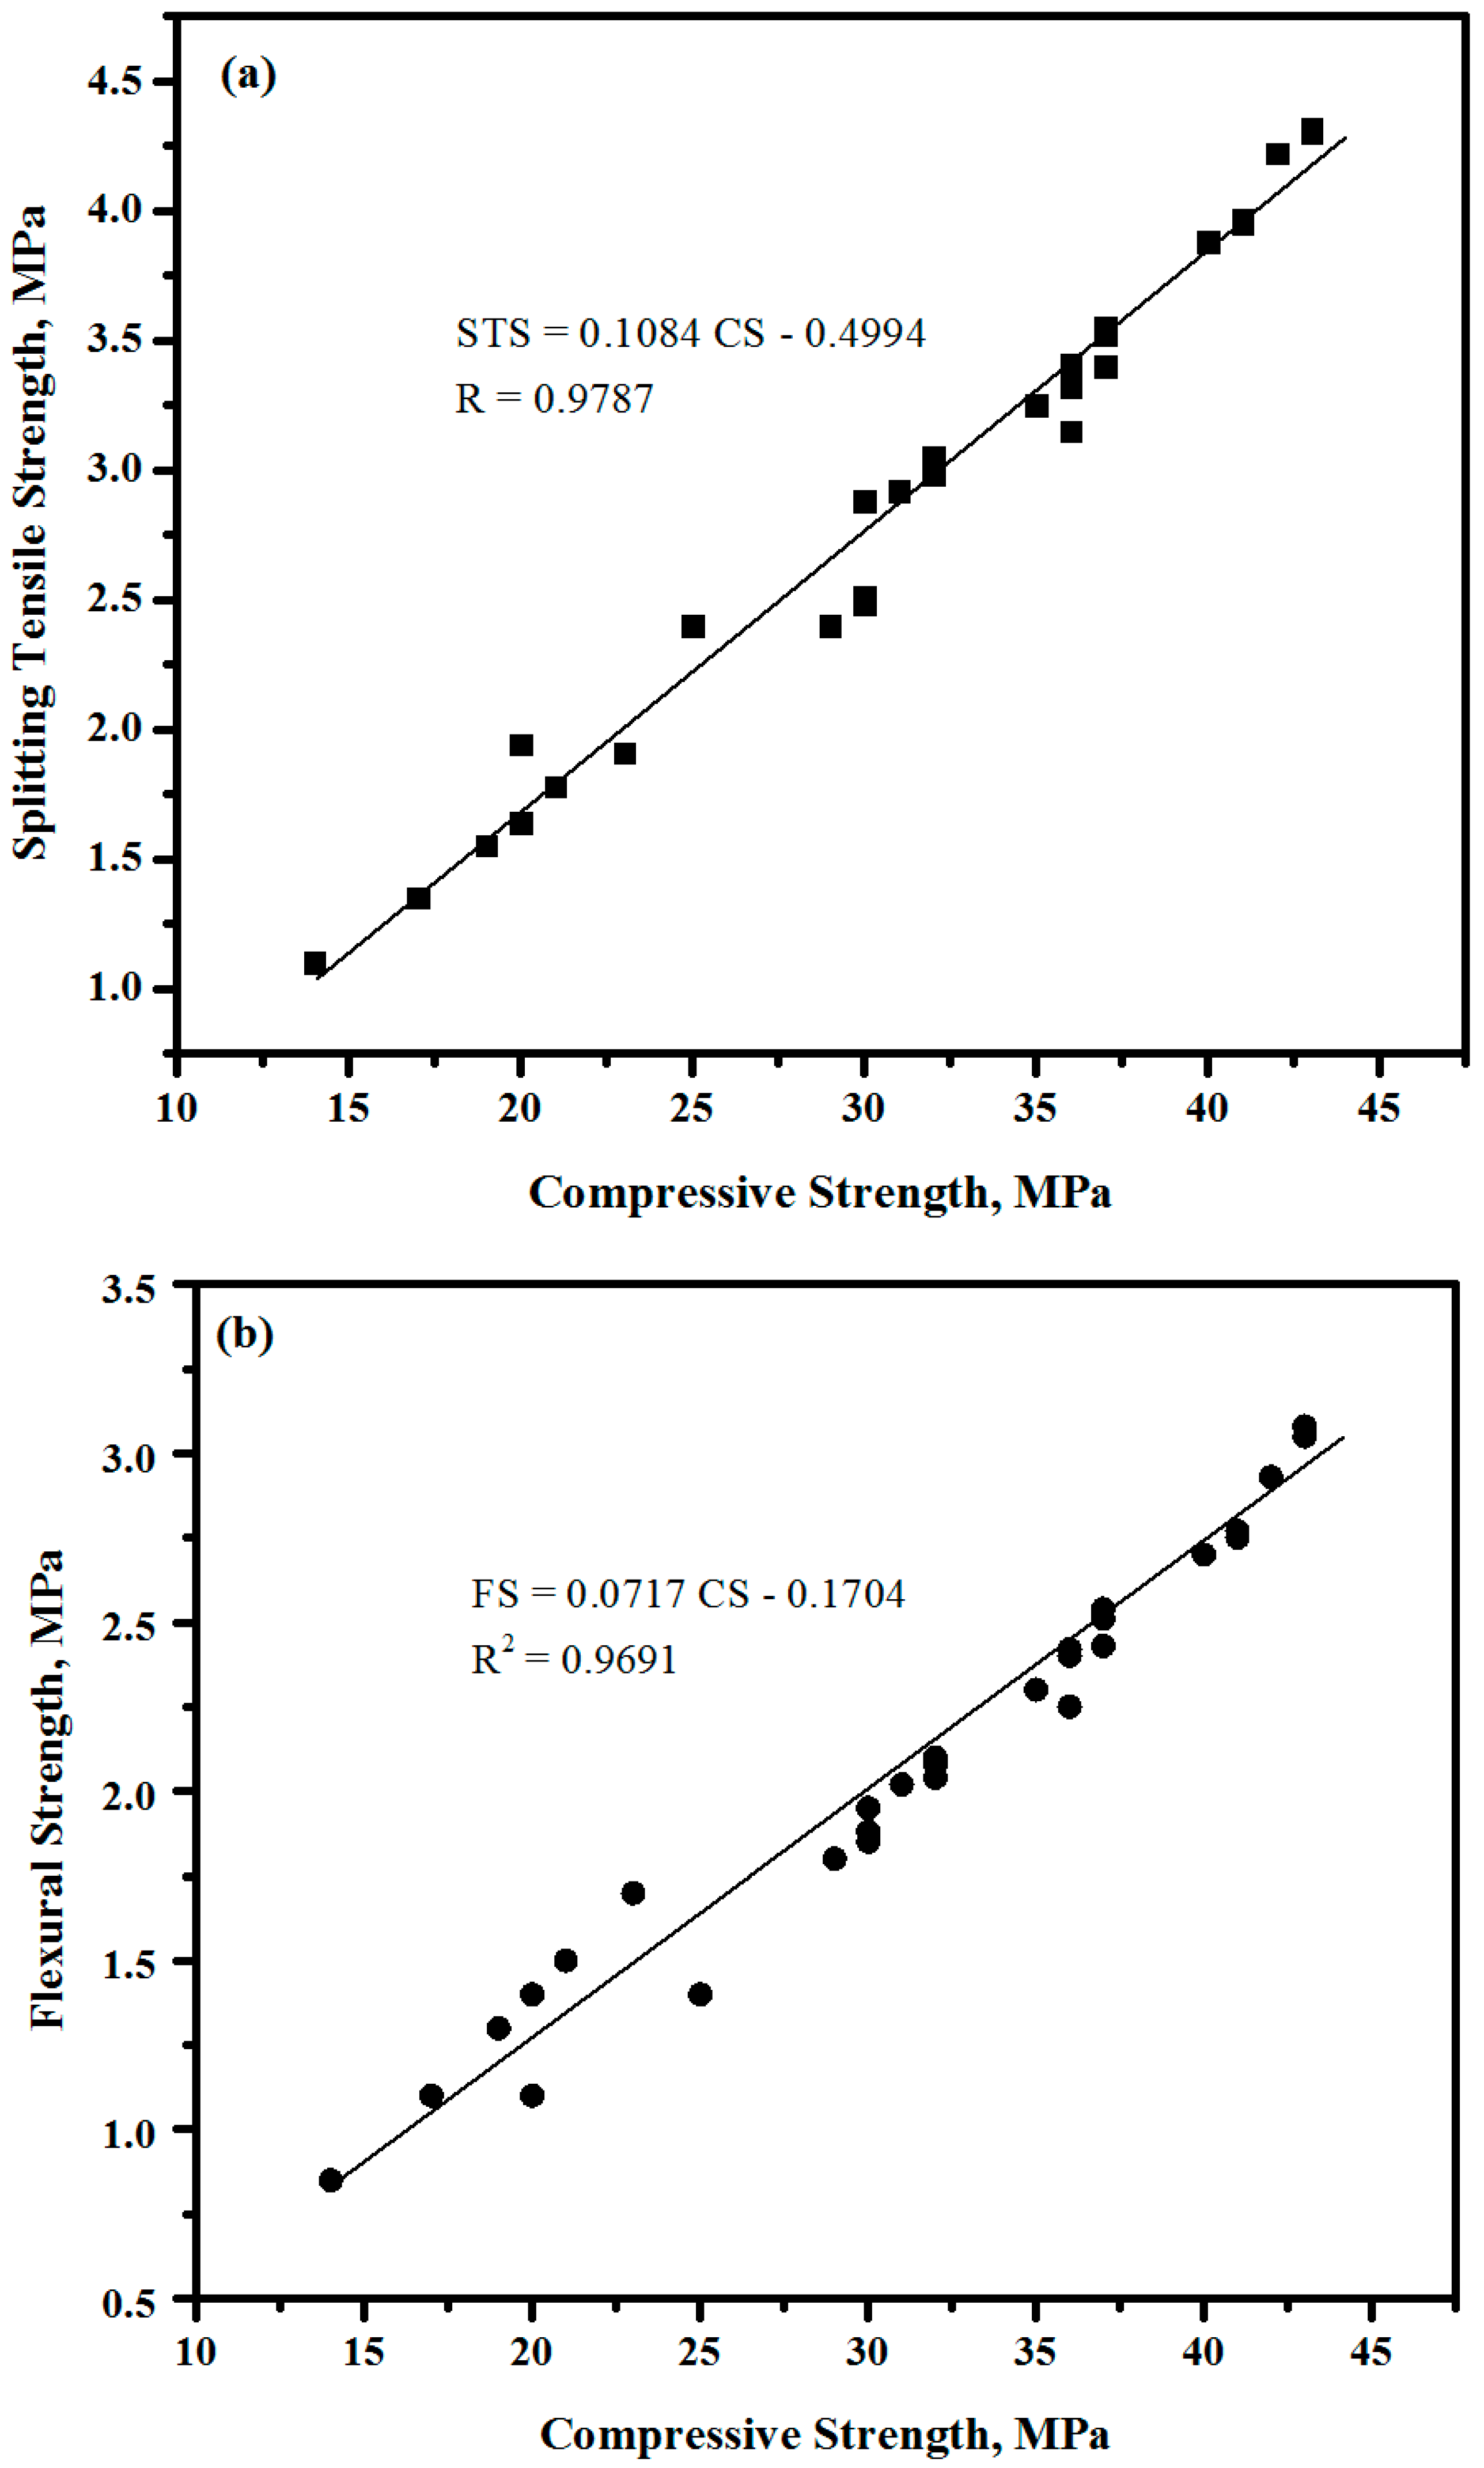
3.18. Correlation between Compressive, Splitting Tensile and Flexural Strengths
4. Conclusions
- i
- The physical and chemical properties of EM, solution with 10% of EM as water replacement and pure water were examined in terms of surface tension, viscosity, and pH. These characteristics enabled us to understand the mechanism of concretes’ strength improvement due to the inclusion of EM;
- ii
- Workability of the fresh concrete mixes was improved with the increase in EM contents as water replacement wherein a maximum replacement of water by EM caused the shear and bleeding of the fresh concrete;
- iii
- The pH values of the fresh concrete mixes made with EM were lowered compared to the control specimen;
- iv
- The water loss of the mixes made with 5, 10, and 15% of EM was reduced compared to the control specimen. The minimum water loss was obtained for the self-curing concrete made with 10% of EM as water replacement;
- v
- The effect of molasses on development of early strength of proposed were evaluated. It was found the compressive strength slightly increased which indicated to impossibility using molasses as self-curing agent;
- vi
- In normal concrete, the EM solution performs very well as a self-curing agent. Concrete mixes containing EM solution under air curing showed comparable CS properties as that of normal concrete under water curing. The strength properties of all the proposed concrete mixes made with EM (except the one made with 10% of EM) displayed similar patterns at all curing ages. The specimen made with placed with 10% of EM achieved maximum CS under water and air curing after 7 days of age;
- vii
- XRD, TGA, and DTG results indicated that the self-curing concrete made with 10% of EM have more amount of Portlandite, calcite, Ettringite and the lower amount of quartz than the control specimen;
- viii
- SEM images displayed denser structure of the specimen composed of 10% of EM as water replacement compared to the one made without EM. Concretes containing EM as a self-curing agent showed the presence of a high amount of Portland, as well as C-S-H gel and a low amount of quartz;
- ix
- Inclusion of 5 and 10% of EM in the proposed mix design significantly improved the STS and FS performance compared to the control specimen;
- x
- A good correlation was observed between the CS, STS, and FS of the designed self-curing concretes;
- xi
- The achieved enhanced microstructures and strength properties of the proposed self-curing concretes containing effective microorganism may be useful for the sustainable development in the construction industries.
Author Contributions
Funding
Institutional Review Board Statement
Informed Consent Statement
Data Availability Statement
Acknowledgments
Conflicts of Interest
Abbreviations
| EM | Effective microorganism |
| EM-AS | EM-activated solution |
| CS | Compressive strength |
| STS | Splitting tensile strength |
| FS | Flexural strength |
| C-S-H | Calcium silicate hydrate |
| CH | Portlandite (Ca(OH)2) |
| CO2 | Carbon dioxide |
| OPC | Ordinary Portland cement |
| SSD | Saturated surface dry |
| XRD | X-ray diffraction |
| SEM | Scanning electronic image |
References
- Kurtis, K.; Nanko, H.; Mohr, B. Methods for Internally Curing Cement-Based Materials and Products Made Therefrom. U.S. Patents US20070246857A1, 25 October 2007. [Google Scholar]
- Huseien, G.F.; Mirza, J.; Ismail, M.; Ghoshal, S.; Hussein, A.A. Geopolymer mortars as sustainable repair material: A comprehensive review. Renew. Sustain. Energy Rev. 2017, 80, 54–74. [Google Scholar] [CrossRef]
- Huseien, G.F.; Sam, A.R.M.; Algaifi, H.A.; Alyouef, R. Development of a sustainable concrete incorporated with effective microorganism and fly Ash: Characteristics and modeling studies. Constr. Build. Mater. 2021, 285, 122899. [Google Scholar] [CrossRef]
- Wang, J.; Liu, E.; Li, L. Characterization on the recycling of waste seashells with Portland cement towards sustainable cementitious materials. J. Clean. Prod. 2019, 220, 235–252. [Google Scholar] [CrossRef]
- Xie, J.; Fang, C.; Lu, Z.; Li, Z.; Li, L. Effects of the addition of silica fume and rubber particles on the compressive behaviour of recycled aggregate concrete with steel fibres. J. Clean. Prod. 2018, 197, 656–667. [Google Scholar] [CrossRef]
- Xie, J.; Wang, J.; Rao, R.; Wang, C.; Fang, C. Effects of combined usage of GGBS and fly ash on workability and mechanical properties of alkali activated geopolymer concrete with recycled aggregate. Compos. Part B Eng. 2019, 164, 179–190. [Google Scholar] [CrossRef]
- Kevern, J.; Farney, C. Reducing curing requirements for pervious concrete with a superabsorbent polymer for internal curing. Transp. Res. Rec. J. Transp. Res. Board 2012, 2290, 115–121. [Google Scholar] [CrossRef]
- El-Dieb, A. Self-curing concrete: Water retention, hydration and moisture transport. Constr. Build. Mater. 2007, 21, 1282–1287. [Google Scholar] [CrossRef]
- Trtik, P.; Münch, B.; Weiss, W.; Kaestner, A.; Jerjen, I.; Josic, L.; Lehmann, E.; Lura, P. Release of internal curing water from lightweight aggregates in cement paste investigated by neutron and X-ray tomography. Nucl. Instrum. Methods Phys. Res. Sect. A Accel. Spectrom. Detect. Assoc. Equip. 2011, 651, 244–249. [Google Scholar] [CrossRef]
- Jau, W.-C. Self-Curing Concrete. U.S. Patents US20080072799A1, 13 September 2011. [Google Scholar]
- Zhutovsky, S.; Kovler, K.; Bentur, A. Influence of cement paste matrix properties on the autogenous curing of high-performance concrete. Cem. Concr. Compos. 2004, 26, 499–507. [Google Scholar] [CrossRef]
- Philleo, R.E. Concrete science and reality. Mater. Sci. Concr. II 1991, 2, 1–8. [Google Scholar]
- Wang, J.; Liu, E. Upcycling waste seashells with cement: Rheology and early-age properties of Portland cement paste. Resour. Conserv. Recycl. 2020, 155, 104680. [Google Scholar] [CrossRef]
- Ryan Henkensiefken, U.; Weiss, J. Internal Curing-From The Laboratory To Implementation. In Proceedings of the International Bridge Conference, Pittsburgh, PA, USA, 14–17 June 2009. [Google Scholar]
- De Sensale, G.R.; Goncalves, A.F. Effects of fine LWA and SAP as internal water curing agents. Int. J. Concr. Struct. Mater. 2014, 8, 229–238. [Google Scholar] [CrossRef]
- Cusson, D.; Lounis, Z.; Daigle, L. Benefits of internal curing on service life and life-cycle cost of high-performance concrete bridge decks—A case study. Cem. Concr. Compos. 2010, 32, 339–350. [Google Scholar] [CrossRef] [Green Version]
- Dhir, R.; Hewlett, P.; Lota, J.; Dyer, T. An investigation into the feasibility of formulating ‘self-cure’concrete. Mater. Struct. 1994, 27, 606–615. [Google Scholar] [CrossRef]
- Kerby, J. Internal Curing Using Lightweight Fine Aggregate; University of Arkansas: Fayetteville, AR, USA, 2013; pp. 1–14. [Google Scholar]
- Espinoza-Hijazin, G.; Lopez, M. Extending internal curing to concrete mixtures with W/C higher than 0.42. Constr. Build. Mater. 2011, 25, 1236–1242. [Google Scholar] [CrossRef]
- Junaid, S.M.; Saddam, S.; Yusuf, K.; Huzaifa, S.A.; Junaid, M. Self-Curing Concrete with Shrinkage Reducing Admixture. J. Civ. Eng. Environ. Technol. 2015, 2, 506–509. [Google Scholar]
- Hamzah, N.; Mohd Saman, H.; Baghban, M.H.; Mohd Sam, A.R.; Faridmehr, I.; Muhd Sidek, M.N.; Benjeddou, O.; Huseien, G.F. A Review on the Use of Self-Curing Agents and Its Mechanism in High-Performance Cementitious Materials. Buildings 2022, 12, 152. [Google Scholar] [CrossRef]
- Zhang, B.; Zhu, H.; Cheng, Y.; Huseien, G.F.; Shah, K.W. Shrinkage mechanisms and shrinkage-mitigating strategies of alkali-activated slag composites: A critical review. Constr. Build. Mater. 2022, 318, 125993. [Google Scholar] [CrossRef]
- Weber, S.; Reinhardt, H.W. A new generation of high performance concrete: Concrete with autogenous curing. Adv. Cem. Based Mater. 1997, 6, 59–68. [Google Scholar] [CrossRef]
- Chand, M.S.R.; Giri, P.S.N.R.; Kumar, G.R.; Kumar, P.R. Paraffin wax as an internal curing agent in ordinary concrete. Mag. Concr. Res. 2014, 67, 82–88. [Google Scholar] [CrossRef]
- Isa, M.N.; Garba, M.M.; Kawu, A.L. Influence of locally made effective microorganisms on the compressive strength of concrete. J. Multidiscip. Eng. Sci. Technol. 2016, 3, 4425–4429. [Google Scholar]
- Higa, T.; Wood, M. Effective Microorganisms for Sustainable Community Development; University of Ryukyus: Okinawa, Japan, 1998; pp. 1–4. [Google Scholar]
- Diver, S. Nature Farming and Effective Microorganisms. Rhizosphere II: Publications, Resource Lists and Web Links from Steve Diver. 2001. Available online: http://ncatark.uark.edu/~steved/Nature-FarmEM (accessed on 8 July 2022).
- Zakaria, Z.; Gairola, S.; Shariff, N.M. Effective microorganisms (EM) technology for water quality restoration and potential for sustainable water resources and management. In Proceedings of the International Environmental Modelling and Software Society (iEMSs)-International Congress on Environmental Modelling and Software Modelling for Environment’s Sake, Fifth Biennial Meeting, Ottawa, ON, Canada, 1 July 2010; pp. 1–9. [Google Scholar]
- Ghosh, S.; Biswas, M.; Chattopadhyay, B.; Mandal, S. Microbial activity on the microstructure of bacteria modified mortar. Cem. Concr. Compos. 2009, 31, 93–98. [Google Scholar] [CrossRef]
- Ismail, N.; Hamidah, M.; Jelani, H.; Mansor, H.; Faizal, M.M. The studies on the effect of molasses in effective microbed cement paste. In Proceedings of the International Conference on Agriculture, Environment and Biological Science, Antalya, Turkey, 4–5 June 2014. [Google Scholar]
- Sato, N.; Higa, T.; Sugita, S.; Shuya, M. Some properties of concrete mixed with effective microorganisms and the on-site investigation of the completed structures. In Proceedings of the 28th International conference, Our world in concrete and structures, Singapore, 28–29 August 2003. [Google Scholar]
- Van Tittelboom, K.; De Belie, N.; De Muynck, W.; Verstraete, W. Use of bacteria to repair cracks in concrete. Cem. Concr. Res. 2010, 40, 157–166. [Google Scholar] [CrossRef]
- Huseien, G.F.; Shah, K.W.; Sam, A.R.M. Sustainability of nanomaterials based self-healing concrete: An all-inclusive insight. J. Build. Eng. 2019, 23, 155–171. [Google Scholar] [CrossRef]
- Rong, H.; Qian, C.-X.; Li, L.-z. Study on microstructure and properties of sandstone cemented by microbe cement. Constr. Build. Mater. 2012, 36, 687–694. [Google Scholar] [CrossRef]
- Andrew, T.C.S.; Syahrizal, I.I.; Jamaluddin, M.Y. Effective microorganisms for concrete (EMC) admixture–its effects to the mechanical properties of concrete. In Proceedings of the Awam International Conference on Civil Engineering (AICCE’12) Geohazard Information Zonation (GIZ’12), Penang, Malaysia, 28–30 August 2012. [Google Scholar]
- Rizwan, S.A.; Khan, H.; Bier, T.A.; Adnan, F. Use of Effective Micro-organisms (EM) technology and self-compacting concrete (SCC) technology improved the response of cementitious systems. Constr. Build. Mater. 2017, 152, 642–650. [Google Scholar] [CrossRef]
- Neville, A.M.; Brooks, J.J. Concrete Technology, 2nd ed.; Prentice Hall: Harlow, UK, 2011. [Google Scholar]
- Iriti, M.; Scarafoni, A.; Pierce, S.; Castorina, G.; Vitalini, S. Soil application of effective microorganisms (EM) Maintains leaf photosynthetic efficiency, increases seed yield and quality traits of bean (Phaseolus vulgaris L.) plants grown on different substrates. Int. J. Mol. Sci. 2019, 20, 2327. [Google Scholar] [CrossRef] [Green Version]
- Cabrera, M.; Galvín, A.P.; Agrela, F. Leaching issues in recycled aggregate concrete. In New Trends in Eco-Efficient and Recycled Concrete; Elsevier: Amsterdam, The Netherlands, 2019; pp. 329–356. [Google Scholar]
- Wang, H.; Li, Q. Prediction of elastic modulus and Poisson’s ratio for unsaturated concrete. Int. J. Solids Struct. 2007, 44, 1370–1379. [Google Scholar] [CrossRef] [Green Version]
- Rashad, A.M.; Ezzat, M. A Preliminary study on the use of magnetic, Zamzam, and sea water as mixing water for alkali-activated slag pastes. Constr. Build. Mater. 2019, 207, 672–678. [Google Scholar] [CrossRef]
- Shetty, M. Concrete Technology; S. Chand & Company Ltd.: New Delhi, India, 2005; pp. 420–453. [Google Scholar]
- Li, C.; Miao, L.; You, Q.; Hu, S.; Fang, H. Effects of viscosity modifying admixture (VMA) on workability and compressive strength of structural EPS concrete. Constr. Build. Mater. 2018, 175, 342–350. [Google Scholar] [CrossRef]
- Ali, B.; Qureshi, L.A. Durability of recycled aggregate concrete modified with sugarcane molasses. Constr. Build. Mater. 2019, 229, 116913. [Google Scholar] [CrossRef]
- Ali, B.; Qureshi, L.A.; Baig, H.S.; Malik, S.; Din, M.; Aslam, H.M.U. Effect of molasses and water–cement ratio on properties of recycled aggregate concrete. Arab. J. Sci. Eng. 2020, 45, 3455–3467. [Google Scholar] [CrossRef]
- Rashid, K.; Tariq, S.; Shaukat, W. Attribution of molasses dosage on fresh and hardened performance of recycled aggregate concrete. Constr. Build. Mater. 2019, 197, 497–505. [Google Scholar] [CrossRef]
- Jumadurdiyev, A.; Ozkul, M.H.; Saglam, A.R.; Parlak, N. The utilization of beet molasses as a retarding and water-reducing admixture for concrete. Cem. Concr. Res. 2005, 35, 874–882. [Google Scholar] [CrossRef]
- Weifeng, L.; Suhua, M.; Shengbiao, Z.; Xiaodong, S. Physical and chemical studies on cement containing sugarcane molasses. J. Therm. Anal. Calorim. 2014, 118, 83–91. [Google Scholar] [CrossRef]
- Grengg, C.; Müller, B.; Staudinger, C.; Mittermayr, F.; Breininger, J.; Ungerböck, B.; Borisov, S.M.; Mayr, T.; Dietzel, M. High-resolution optical pH imaging of concrete exposed to chemically corrosive environments. Cem. Concr. Res. 2019, 116, 231–237. [Google Scholar] [CrossRef]
- Yadav, S.; Das, B.B.; Goudar, S.K. Durability Studies of Steel Fibre Reinforced Concrete. In Sustainable Construction and Building Materials; Springer: Berlin/Heidelberg, Germany, 2019; pp. 737–745. [Google Scholar]
- Gao, X.; Yang, Y.; Deng, H. Utilization of beet molasses as a grinding aid in blended cements. Constr. Build. Mater. 2011, 25, 3782–3789. [Google Scholar] [CrossRef]
- Akar, C.; Canbaz, M. Effect of molasses as an admixture on concrete durability. J. Clean. Prod. 2016, 112, 2374–2380. [Google Scholar] [CrossRef]
- Tramontin, M.; Onghero, L.; Nunes Correa, B.; Selhorst, M.A.; Miranda Dias, A.; Longuini Repette, W.; Raupp Pereira, F.; Novaes de Oliveira, A.P. Novel low-cost shrinkage-compensating admixture for ordinary Portland cement. Constr. Build. Mater. 2020, 230, 117024. [Google Scholar] [CrossRef]
- Šovljanski, O.; Tomić, A.; Markov, S. Relationship between Bacterial Contribution and Self-Healing Effect of Cement-Based Materials. Microorganisms 2022, 10, 1399. [Google Scholar] [CrossRef]
- Rongbing, B.; Jian, S. Synthesis and evaluation of shrinkage-reducing admixture for cementitious materials. Cem. Concr. Res. 2005, 35, 445–448. [Google Scholar] [CrossRef]
- Dang, Y.; Shi, X.; Mery, S.; Xie, N.; Benson, A.; Yang, Z. Influence of surface sealers on the properties of internally cured cement mortars containing saturated fine lightweight aggregate. J. Mater. Civ. Eng. 2015, 27, 04015037. [Google Scholar] [CrossRef]


| Raw Materials | Elements (Weight%) | ||||||||
|---|---|---|---|---|---|---|---|---|---|
| SiO2 | Al2O3 | Fe2O3 | CaO | MgO | K2O | Na2O | SO3 | LOT | |
| OPC | 20.4 | 5.2 | 4.2 | 62.4 | 1.6 | 0.01 | 0.2 | 2.1 | 2.4 |
| Mix Code | Cement | Water | Molasses * | EM Content ** | Fine Aggregates | Coarse Aggregates | Curing Regime |
|---|---|---|---|---|---|---|---|
| C0EM | 455 | 250 | 0 | 0 | 875 | 815 | Water Air |
| C0.25-5M | 455 | 249.94 | 0.625 | 0 | 875 | 815 | Air |
| C0.5-10M | 455 | 247.75 | 1.25 | 0 | 875 | 815 | Air |
| C0.75-15M | 455 | 248.12 | 1.875 | 0 | 875 | 815 | Air |
| C1.0-20M | 455 | 247.5 | 2.5 | 0 | 875 | 815 | Air |
| C1.25-25M | 455 | 246.87 | 3.125 | 0 | 875 | 815 | Air |
| C5EM | 455 | 237.5 | 0 | 12.5 | 875 | 815 | Air |
| C10EM | 455 | 225 | 0 | 25 | 875 | 815 | Air |
| C15EM | 455 | 212.5 | 0 | 37.5 | 875 | 815 | Air |
| C20EM | 455 | 200 | 0 | 50 | 875 | 815 | Air |
| C25EM | 455 | 187.5 | 0 | 62.5 | 875 | 815 | Air |
| Quality | Water | EM | 10% EM + 90% Water | Units | Allowable Limit | Standards |
|---|---|---|---|---|---|---|
| Dissolved oxygen (DO) | 7.35 | 2.33 | 0.6 | mg/L | ≤7.8 | ASTM D888 |
| Electrical conductivity | 26.6 | 8831 | 900 | μs/cm | 1000–2000 | |
| Electrical resistivity | 37,525 | 113.24 | 707.16 | Ω·cm | 10,000–50,000 | |
| Total dissolved solids | 17.55 | 5824 | 1092 | mg/L | ≤50,000 | ASTM C1602 |
| Salinity | 0.01 | 5 | 0.85 | ppt |
| Mix Code | C0EM | C0EM | C5M | C10M | C15M | C20M | C25M |
|---|---|---|---|---|---|---|---|
| Curing regime | Water | Air | Air | Air | Air | Air | Air |
| CS values (MPa) | 43.3 | 35.8 | 35.6 | 35.9 | 36.1 | 36.4 | 36.7 |
| Mix Code | Curing Regime | pH of Fresh Concrete | CS Values (MPa) at Various Curing Ages | ||||
|---|---|---|---|---|---|---|---|
| 3 | 7 | 28 | 56 | 90 | |||
| C0EM | Water | 13 | 25.4 | 32.1 | 43.3 | 43.8 | 44.1 |
| C0EM | Air | 13 | 23.1 | 30.3 | 35.8 | 36.2 | 36.5 |
| C5EM | Air | 11 | 20.6 | 36.4 | 40.8 | 41.5 | 41.7 |
| C10EM | Air | 11 | 21.9 | 37.7 | 42.8 | 43.4 | 43.9 |
| C15EM | Air | 11 | 19.2 | 32.4 | 36.1 | 37.5 | 37.7 |
| C20EM | Air | 10 | 17.6 | 25.1 | 31.5 | 32.3 | 32.8 |
| C25EM | Air | 10 | 14.7 | 20.3 | 29.1 | 30.3 | 30.6 |
| Chemical Compounds | EM (weight%) at Different Curing Ages | |||
|---|---|---|---|---|
| 7 Days | 28 Days | |||
| 0 | 10 | 0 | 10 | |
| Quartz | 69.3 | 50 | 53.7 | 48 |
| Portlandite | 14.2 | 23.8 | 20.6 | 24.5 |
| Calcite | 9.5 | 14.2 | 13.9 | 15.4 |
| Ettringite | 7 | 12 | 11.8 | 12 |
| Chemical Compounds | 3 Days | 7 Days | 28 Days | |||
|---|---|---|---|---|---|---|
| 0% EM | 10% EM | 0% EM | 10% EM | 0% EM | 10% EM | |
| C-S-H gel | 3.15 | 2.9 | 3.64 | 4.13 | 4.34 | 5.22 |
| CH (Portlandite) | 0.45 | 0.50 | 0.30 | 0.40 | 0.28 | 0.33 |
Publisher’s Note: MDPI stays neutral with regard to jurisdictional claims in published maps and institutional affiliations. |
© 2022 by the authors. Licensee MDPI, Basel, Switzerland. This article is an open access article distributed under the terms and conditions of the Creative Commons Attribution (CC BY) license (https://creativecommons.org/licenses/by/4.0/).
Share and Cite
Memon, R.P.; Huseien, G.F.; Saleh, A.T.; K. Ghoshal, S.; Memon, U.; Alwetaishi, M.; Benjeddou, O.; Sam, A.R.M. Microstructure and Strength Properties of Sustainable Concrete Using Effective Microorganisms as a Self-Curing Agent. Sustainability 2022, 14, 10443. https://doi.org/10.3390/su141610443
Memon RP, Huseien GF, Saleh AT, K. Ghoshal S, Memon U, Alwetaishi M, Benjeddou O, Sam ARM. Microstructure and Strength Properties of Sustainable Concrete Using Effective Microorganisms as a Self-Curing Agent. Sustainability. 2022; 14(16):10443. https://doi.org/10.3390/su141610443
Chicago/Turabian StyleMemon, Ruhal Pervez, Ghasan Fahim Huseien, Ali Taha Saleh, Sib K. Ghoshal, Uroosa Memon, Mamdooh Alwetaishi, Omrane Benjeddou, and Abdul Rahman Mohd Sam. 2022. "Microstructure and Strength Properties of Sustainable Concrete Using Effective Microorganisms as a Self-Curing Agent" Sustainability 14, no. 16: 10443. https://doi.org/10.3390/su141610443
APA StyleMemon, R. P., Huseien, G. F., Saleh, A. T., K. Ghoshal, S., Memon, U., Alwetaishi, M., Benjeddou, O., & Sam, A. R. M. (2022). Microstructure and Strength Properties of Sustainable Concrete Using Effective Microorganisms as a Self-Curing Agent. Sustainability, 14(16), 10443. https://doi.org/10.3390/su141610443