Article

The Efficiency Evolution and Risks of Green Development in the Yangtze River Economic Belt, China

School of Economics and Management, Hubei University of Technology, Wuhan 430068, China
*
Author to whom correspondence should be addressed.
Sustainability 2022, 14(16), 10417; https://doi.org/10.3390/su141610417
Submission received: 28 June 2022 / Revised: 8 August 2022 / Accepted: 15 August 2022 / Published: 22 August 2022
(This article belongs to the Special Issue Sustainable Entrepreneurship and Risk Management)

Abstract

:
The sustainability of economic development is constrained by issues such as the depletion of global resources and environmental deterioration; therefore, assessing the effectiveness of green development is crucial for ensuring both economic and social sustainability. The superefficient, slacks-based measures–data envelopment analysis (SBM-DEA) model and the Malmquist–Luenberger productivity index are used in this study to quantify and analyze the level of green development efficiency of the three major city clusters in the Yangtze River Economic Belt. Using techniques such as the Dagum Gini coefficient and Kernel density estimation, this research study also focuses on the regional disparity distribution, dynamic evolution patterns, and risk factors affecting the green and balanced development of city clusters. The results show that, firstly, the green development efficiency of the city clusters presents an overall fluctuating downward trend, and that the low efficiency of resource utilization due to diseconomies of scale is the main obstacle to its growth. Secondly, super variable density and intra-cluster gap are the primary causes of the risk of green and balanced development. There is insufficient momentum to improve green development efficiency. Given these results, the focus of policy implementation to reduce the risk of green development transformation should be on maximizing the driving force of technological progress, improving resource allocation efficiency, and increasing the level of synergistic development within cities.

1. Introduction

According to relevant data from the National Bureau of Statistics, China’s contribution to the net growth of global energy consumption in 2019 exceeded 75%, and the amount of energy consumed in China in 2021 reached 3.97 times that of 1990, with a cumulative total of more than 295,517,700 tons of sulfur dioxide. In the past, China’s economy has relied heavily on high inputs and high consumption to maintain high economic growth. The overuse of natural resources, the deterioration of the ecological environment, and the imbalance in regional growth were all simultaneously caused by this reliance [1,2]. Therefore, a shift to green, sustainable development is an important tool for alleviating the unyielding pressure on resources and the environment and for broadening the scope of economic growth [3]. Green development is a sustainable development model that takes the ecological and environmental capacity as constraints to achieve the goal of overall coordinated development among the three systems of economy, society, and nature [4]. Green development efficiency is an assessment of input–output efficiency that concurrently weighs the advantages to the environment and the rate of economic growth [5]. Therefore, the level of sustainable development may be gauged by assessing how effective green development is [6], and it is crucial to urgently analyze the effectiveness of regional green development in light of the current conditions of China’s economic development.
The Yangtze River Economic Belt is one of China’s high-density economic corridors with a prominent ecological status and huge development potential. The three major national-level city clusters it covers, represented by the Yangtze River Delta, the middle reaches of the Yangtze River city cluster, and the Chengdu–Chongqing city cluster, play a crucial role in China’s pattern of regional development [7]. By measuring and evaluating the green development efficiency of the three city clusters, the downside and risk of the green development efficiency of city clusters and the risk of regional imbalance can be identified, which are important for promoting national and regional green transformation and upgrading and coordinating development.
Many scholars have conducted many studies on green development efficiency, focusing on three major aspects: measuring its level [8], evaluating regional disparities [9], and analyzing its driving factors [10]. The methods for measuring the level of development are mainly divided into two categories: the indicator system method and parametric or non-parametric mathematical models. The application of the former is reflected in the selection of indicators by Chinese scholars that are mainly based on the Green Development Indicator System issued by four ministries to calculate the weighted composite index of the green development level, while the latter is widely used to measure the efficiency of the green economy. For example, Yan constructs an indicator system by taking 287 cities in China as the research object to evaluate sustainable economic and social development by regarding natural resources and social welfare as input and output factors, respectively [11]. Given that the indicator system method is highly subjective in selecting, constructing, and assigning indicators, mathematical models are widely used to measure green development efficiency at different regional levels. Moreover, the model has also been widely extended to evaluate, for instance, the efficiency of carbon emissions [12], air environment efficiency [13], water use efficiency [14], and agricultural and industrial production efficiency [15]. In addition, some scholars have combined the model approach with the indicator system method. For example, Wu Yiqing introduced the coefficient of posture effect to construct a green total factor production model based on the extension of the C–D production function, which was used to conduct a nationwide evaluation of the level of green development in provincial areas [16].
Western scholars have pioneered and developed the choice and application of the model. The key to the problem is determining how to reasonably incorporate non-desired outputs into the model. Pitman argued that a failure to consider non-consensual output would lead to biased productivity measures and, for the first time, included pollution control costs when comparing enterprise productivity measures [17]. Fare incorporated non-desired and desired outputs into the same model by proposing directional distance functions under the “radial” and “angular” measures [18]. However, this method did not address the problem of slack variables, which led to distortions of the estimated efficiency values. Tone proposed a slacks-based measures model (SBM) based on a non-radial, non-angular measure of slack to overcome the previous defects and, in the same year, proposed a super efficient SBM model, which was further improved by Fukuyama and Weber to make the model more operational [19,20].
Drawing on previous research results, Chinese scholars have measured green development efficiency at different regional levels, including the national, provincial, river basin, and city cluster levels. To this end, they have used the three-stage model of data envelopment analysis (DEA) [21], the DEA–Banker, Charnes and Cooper (BCC) model [22], the super efficient SBM model, and the Malmquist–Luenberger productivity index to analyze the spatio-temporal evolution trends, spatially unbalanced distribution, and steady-state convergence characteristics. From the perspective of city clusters, Li Ping used the directional distance function and the Luenberger index to measure and compare the differences in environmental economic efficiency between the Yangtze River Delta and the Pearl River Delta city clusters [23]. Ke Chengdao used the SBM-DEA model to measure green total factor productivity (GTFP) at the provincial level and broke down its dynamic evolution trend in combination with the Malmquist–Luenberger index [24]. Li Kaifeng used the same modeling approach to measure GTFP in the Yellow River Basin, and the result shows that technical efficiency and technological progress jointly contribute to the improvement of GTFP [25].
The free flow of capital factors brings the risk of regional non-equilibrium in green development. Some scholars further analyzed the regional uneven development and its motivation through measuring efficiency values. Based on the results of measuring the level of GTFP in the Yangtze River Economic Belt by using the SBM-GML model, its convergence and coefficient of variation was calculated to analyze the equilibrium steady-state trend and disparities between cities in the Yangtze River Economic Belt [26]. Using the Thiel index, Wu Chuanqing analyzed the green development efficiency gap in the Yangtze River Economic Belt and examined its driving factors with the spatial Durbin model [27]. Given that the above analytical methods for regional gaps cannot measure the contribution of inter-subgroup gaps and inter-cluster cross-over to the overall gap, Guo Bingnan broke down the total green development efficiency gap in the Yangtze River Economic Belt into intra-cluster gap, inter-cluster gap, and hyper-variance density to further clarify the source of overall regional disparity using the Dagum Gini coefficient method [28].
Existing studies on measuring green development efficiency in the Yangtze River Economic Belt are relatively abundant; however, the following shortcomings exist. Firstly, the present literature on gauging green development efficiency in the Yangtze River Economic Belt rarely decomposes indices to identify the precise sources of uncertainty in green development. Secondly, most of these studies are mainly based on measurements at the provincial level, lacking evidence of testing and analysis at the city level, making it difficult to accurately identify the efficiency of the inputs and outputs at the city-circle level. Finally, the Dagum Gini coefficient and its decomposition, along with Kernel density estimation, are rarely used in the analysis of the dynamic evolution trend of green development efficiency in the Yangtze River Economic Belt. Thus, this paper takes the sample data of the three major city clusters as the research object, measures the green development efficiency of the three major city clusters using the super efficient SBM-DEA model, and further disaggregates it into green technological progress and green technological efficiency using the Malmquist–Luenberger productivity index to clarify the main driving force behind green development efficiency improvements and the specific sources of downside risks. In addition, characteristics of the uneven risk of green development efficiency are analyzed using the Dagum Gini coefficient and decomposition, and its dynamic evolution trend is visually portrayed in the form of three-dimensional images through Kernel density estimation. The marginal contribution of this article is to resolve systemic risks facing the green development transition of medium and micro entities and provide a reference for policy planning.

2. Materials and Methods

2.1. Data Collection

The Yangtze River Economic Belt covers 9 provinces and 2 cities in the basin, cutting through the three regions to the east and west, and accounting for 21.34% of China’s land area and carrying 46.2% of the country’s population. According to the National Bureau of Statistics, the regional GDP of the 11 provinces and cities reached 45.8 trillion yuan in 2019, accounting for 45% of China’s total economic scale [29]. This study divides the Yangtze River Economic Belt into three major city clusters: Chengdu–Chongqing, the middle reaches of the Yangtze River, and the Yangtze River Delta in accordance with the State Council’s city cluster economic development plan. In light of the data’s accessibility, 74 of these cities were chosen for the study, among which the Yangtze River Delta inter-cluster in the downstream region mainly includes 26 cities: Shanghai, Nanjing, Wuxi, Changzhou, Suzhou, Nantong, Yancheng, Yangzhou, Zhenjiang, Taizhou, Hangzhou, Jiaxing, Huzhou, Zhoushan, Jinhua, Shaoxing, Taizhou, Ningbo, Xuancheng, Chuzhou, Chizhou, and Hefei. The city cluster in the middle reaches of the Yangtze River includes 26 cities: Nanchang, Jingdezhen, Pingxiang, Jiujiang, Xinyu, Yingtan, Yichun, Shangrao, Wuhan, Huangshi, Jingzhou, Yichang, Xiangyang, Ezhou, Jingmen, Xiaogan, Huanggang, Xianning, Changsha, Zhuzhou, Xiangtan, Hengyang, Yueyang, Changde, Yiyang, and Loudi. Furthermore, the Chengdu–Chongqing city cluster, in the upper reaches, includes 22 cities: Chongqing, Chengdu, Zigong, Zucca, Yichang and Loudi, Chongqing, Chengdu, Zigong, Luzhou, Deyang, Mianyang, Suining, Neijiang, Leshan, Nanchong, Yibin, Guang’an, Dazhou, Ziyang, Meishan, Ya’an, Guiyang, Zunyi, Anshun, Kunming, Qujing, and Yuxi. This paper mainly selects the data from 2007 to 2019, and the data are obtained mainly from the China Urban Statistical Yearbook, the China Environmental Statistical Yearbook, as well as the statistical yearbooks of various provinces and relevant statistical bulletins, in which some missing data are completed by interpolation or moving average method.

2.2. Measurement of Green Development Efficiency

There are two main methods to comprehensively evaluate efficiency: parametric analysis represented by the stochastic frontier approach (SFA) and non-parametric analysis based on data envelopment analysis (DEA) [30]. The stochastic frontier method is based on econometrics. It uses an econometric model to statistically estimate the parameters of the frontier production function, while the non-parametric method evaluates the relative effectiveness of comparable units of the same type with the help of linear programming for multiple inputs and outputs [31]. The former method considers the influence of random errors. Although the dispersion of the calculation results is small, it requires a strict sample size. Furthermore, the calculation of the frontier function is complicated, therefore it is rarely used at present in measuring technical efficiency. The DEA is not bound by the theoretical constraints of the production function. There is no need to dimensionalize the data, and the determination of the weights is unaffected by subjective factors. As a result, the evaluation results are more comprehensive and objective [32]. Therefore, this paper uses the DEA model to measure the green development efficiency of urban clusters. The traditional DEA model does not consider the slackness of the variables and cannot accurately measure efficiency values where there are non-desired outputs. Additionally, the enhanced non-radial, non-angular SBM model cannot compare decision units with efficiency values of 1 concurrently. The efficiency values measured by the super efficient SBM model that considers non-desired outputs are not limited to 1, which improves the comparability of efficiency between different decision units [33]. Therefore, this paper includes exhaust gas, wastewater, and sludge emissions as non-expected outputs in the input–output index system of economic efficiency to measure green development efficiency.
Among them, labor, capital, as well as energy are used as input indicators [34]. Furthermore, labor input is expressed by the number of employees per unit at the end of the year and the society’s total consumption of electricity indicates energy input. Additionally, capital input is estimated by drawing on the perpetual inventory method pioneered by Goldsmith [35], the formula for which is Kit = Kit−1 (1 − δit) + Iit, where i denotes region, t denotes time, K denotes capital stock, δ indicates an economic depreciation rate, whose value is 9.6%. I denotes fixed asset investment, and 2007 is used as the basis period. The capital stock in the base period is equal to the total fixed asset investment in 2007 divided by 10%.
Real GDP is used in this study as the expected output indicator. The nominal GDP of each city is adjusted to the real GDP in order to remove the impact of price in the GDP deflator calculation, which uses 2007 as the base period. The non-desired output is expressed as a combination of the three urban waste emissions, including industrial wastewater, industrial fixed waste, and industrial sulfur dioxide emissions. Equations (1)–(5) comprise the specific formula for calculating the efficiency value. Its specific meaning is that k (k = 1, …, K) decision units used n (n = 1, …, N) inputs x n k to obtain m desired outputs y m k and i non-desired outputs b i k . Additionally, zk are the weights of the decision units [27].
ρ l * = ( 1 n n = 1 N x n l s n x x n l ) / [ 1 M + I ( m = 1 M y m l + s m y y m l + i = 1 I b i l + s i b b i l ) ]
s . t . k = 1 K z k y m k s m y = y m l , m = 1 , .... , M
k = 1 K z k b i k + s i b = b i l , i = 1 , .... , I
k = 1 K z k x n k + s n x = x n l , n = 1 , .... , N
z k 0 , s m y 0 , s i b 0 , k = 1 , .... , K ( k l )

2.3. Dagum Gini Coefficient and Its Decomposition

The coefficient of variation, the Thiel index, and the Dagum Gini coefficient can measure regional disparities. Compared to other methods, the Thiel index and Dagum Gini coefficient can disaggregate regional differences, specifically inter-regional and intra-regional disparities. Furthermore, the Dagum Gini coefficient can solve the problem of inter-cluster crossover and thus provide a more comprehensive decomposition of the source of the overall regional disparity, i.e., identifying the contribution of hyper-variance density to the overall disparity [36]. Therefore, this paper uses the Dagum Gini coefficient method to analyze the green development efficiency gap of the three major city clusters in the Yangtze River Economic Zone, by which the unbalanced risk characteristics of green development efficiency evolution and its intrinsic motivations can be reflected. The specific formula is as follows: G = j = 1 k h = 1 k i = 1 n j r = 1 n k | y j i y h r | / 2 n 2 y ¯ , where j(h) denotes any city group and i(r) denotes any city in the city group. Furthermore, yji (yhr) is the green development efficiency of any city in city group j(h), y ¯ is the average of the green economic development efficiency values for each city group, n is the number of cities, k is the number of city groups, G is the overall Gini coefficient, and nj (nh) denotes the number of cities included in city group j(h).
In addition, to facilitate the calculation of the Gini coefficient, the decomposition of the Gini coefficient is carried out by ranking the city clusters according to the average value of green development efficiency Y ¯ h Y ¯ j Y ¯ k , and by decomposing the Gini coefficient into three components: the contribution of intra-inter-cluster variation Gw, the contribution of inter-inter-cluster variation Gnb, and the contribution of hyper-density Gt, i.e., G = G w + G n b + G t . Equations (6) and (7) denote the Gini coefficient of inter-cluster j Gjj and the contribution of intra-inter-cluster variation Gw, respectively. Equations (8) and (9) denote the Gini coefficient Gjh and the contribution of intra-urban variation Gnb for urban groups j and h and Equation (10) denotes the contribution of hyper-variance density Gt [37].
G j j = 1 2 Y ¯ j i = 1 n j r = 1 n j | y j i y j r | n j 2
G w = j = 1 k G j j p j s j
G j h = i = 1 n j r = 1 n h | y j i y h r | n j n h ( Y ¯ j + Y ¯ h )
G n b = j = 2 k h = 1 j 1 G j h ( p j s h + p h s j ) D j h
G t = j = 2 k h = 1 j 1 G j h ( p j s h + p h s j ) ( 1 D j h )
where pj = nj/n, sj = njY/ny, Djh denotes the relative impact of green economic efficiency between city clusters j and h, which is defined in Equation (11). Furthermore, djh denotes the difference in green economic efficiency between city clusters, and pjh denotes the hypervariable first-order moment, both of which are defined in Equations (12) and (13), respectively.
D j h = d j h p j h d j h + p j h
d j h = 0 d F j ( y ) 0 y ( y x ) d F h ( x )
p j h = 0 d F h ( y ) 0 y ( y x ) d F j ( x )

2.4. Kernel Density Estimation

The Kernel density estimation can visually portray the evolutionary trend of a random variable through a continuous smooth kernel density curve, which helps to reflect the dynamic information, such as the overall evolutionary pattern and polarization characteristics of the study’s object. The basic principle is that the kernel estimate of the density function is obtained from the empirical distribution function, where the empirical distribution function is F n ( y ) = 1 N i = 1 N I ( X i y ) , where N denotes the number of observations, I(z) denotes the indicative function, Z denotes the conditional relationship equation, I(z) = 1 when Z is true. Conversely, I(z) = 0. The kernel density is estimated as f ( x ) = 1 N h i = 1 N K ( X i x h ) , where h is the bandwidth, Xi is the independent identically distributed observations, x is the mean value, and K(x) is the kernel function. As a weighting or smoothing function, different expressions of the density function correspond to different types of kernel functions. Drawing on the practice of most scholars, this paper uses the radial basis function for estimation, the specific expression of which is K ( x ) = 1 2 π exp ( x 2 2 ) . The choice of bandwidth is particularly important in estimating the kernel density function. The following conditions are generally satisfied between the bandwidth (h) and the observations (N): lim N h ( N ) = 0 lim N N h ( N ) = N [38].

3. Results

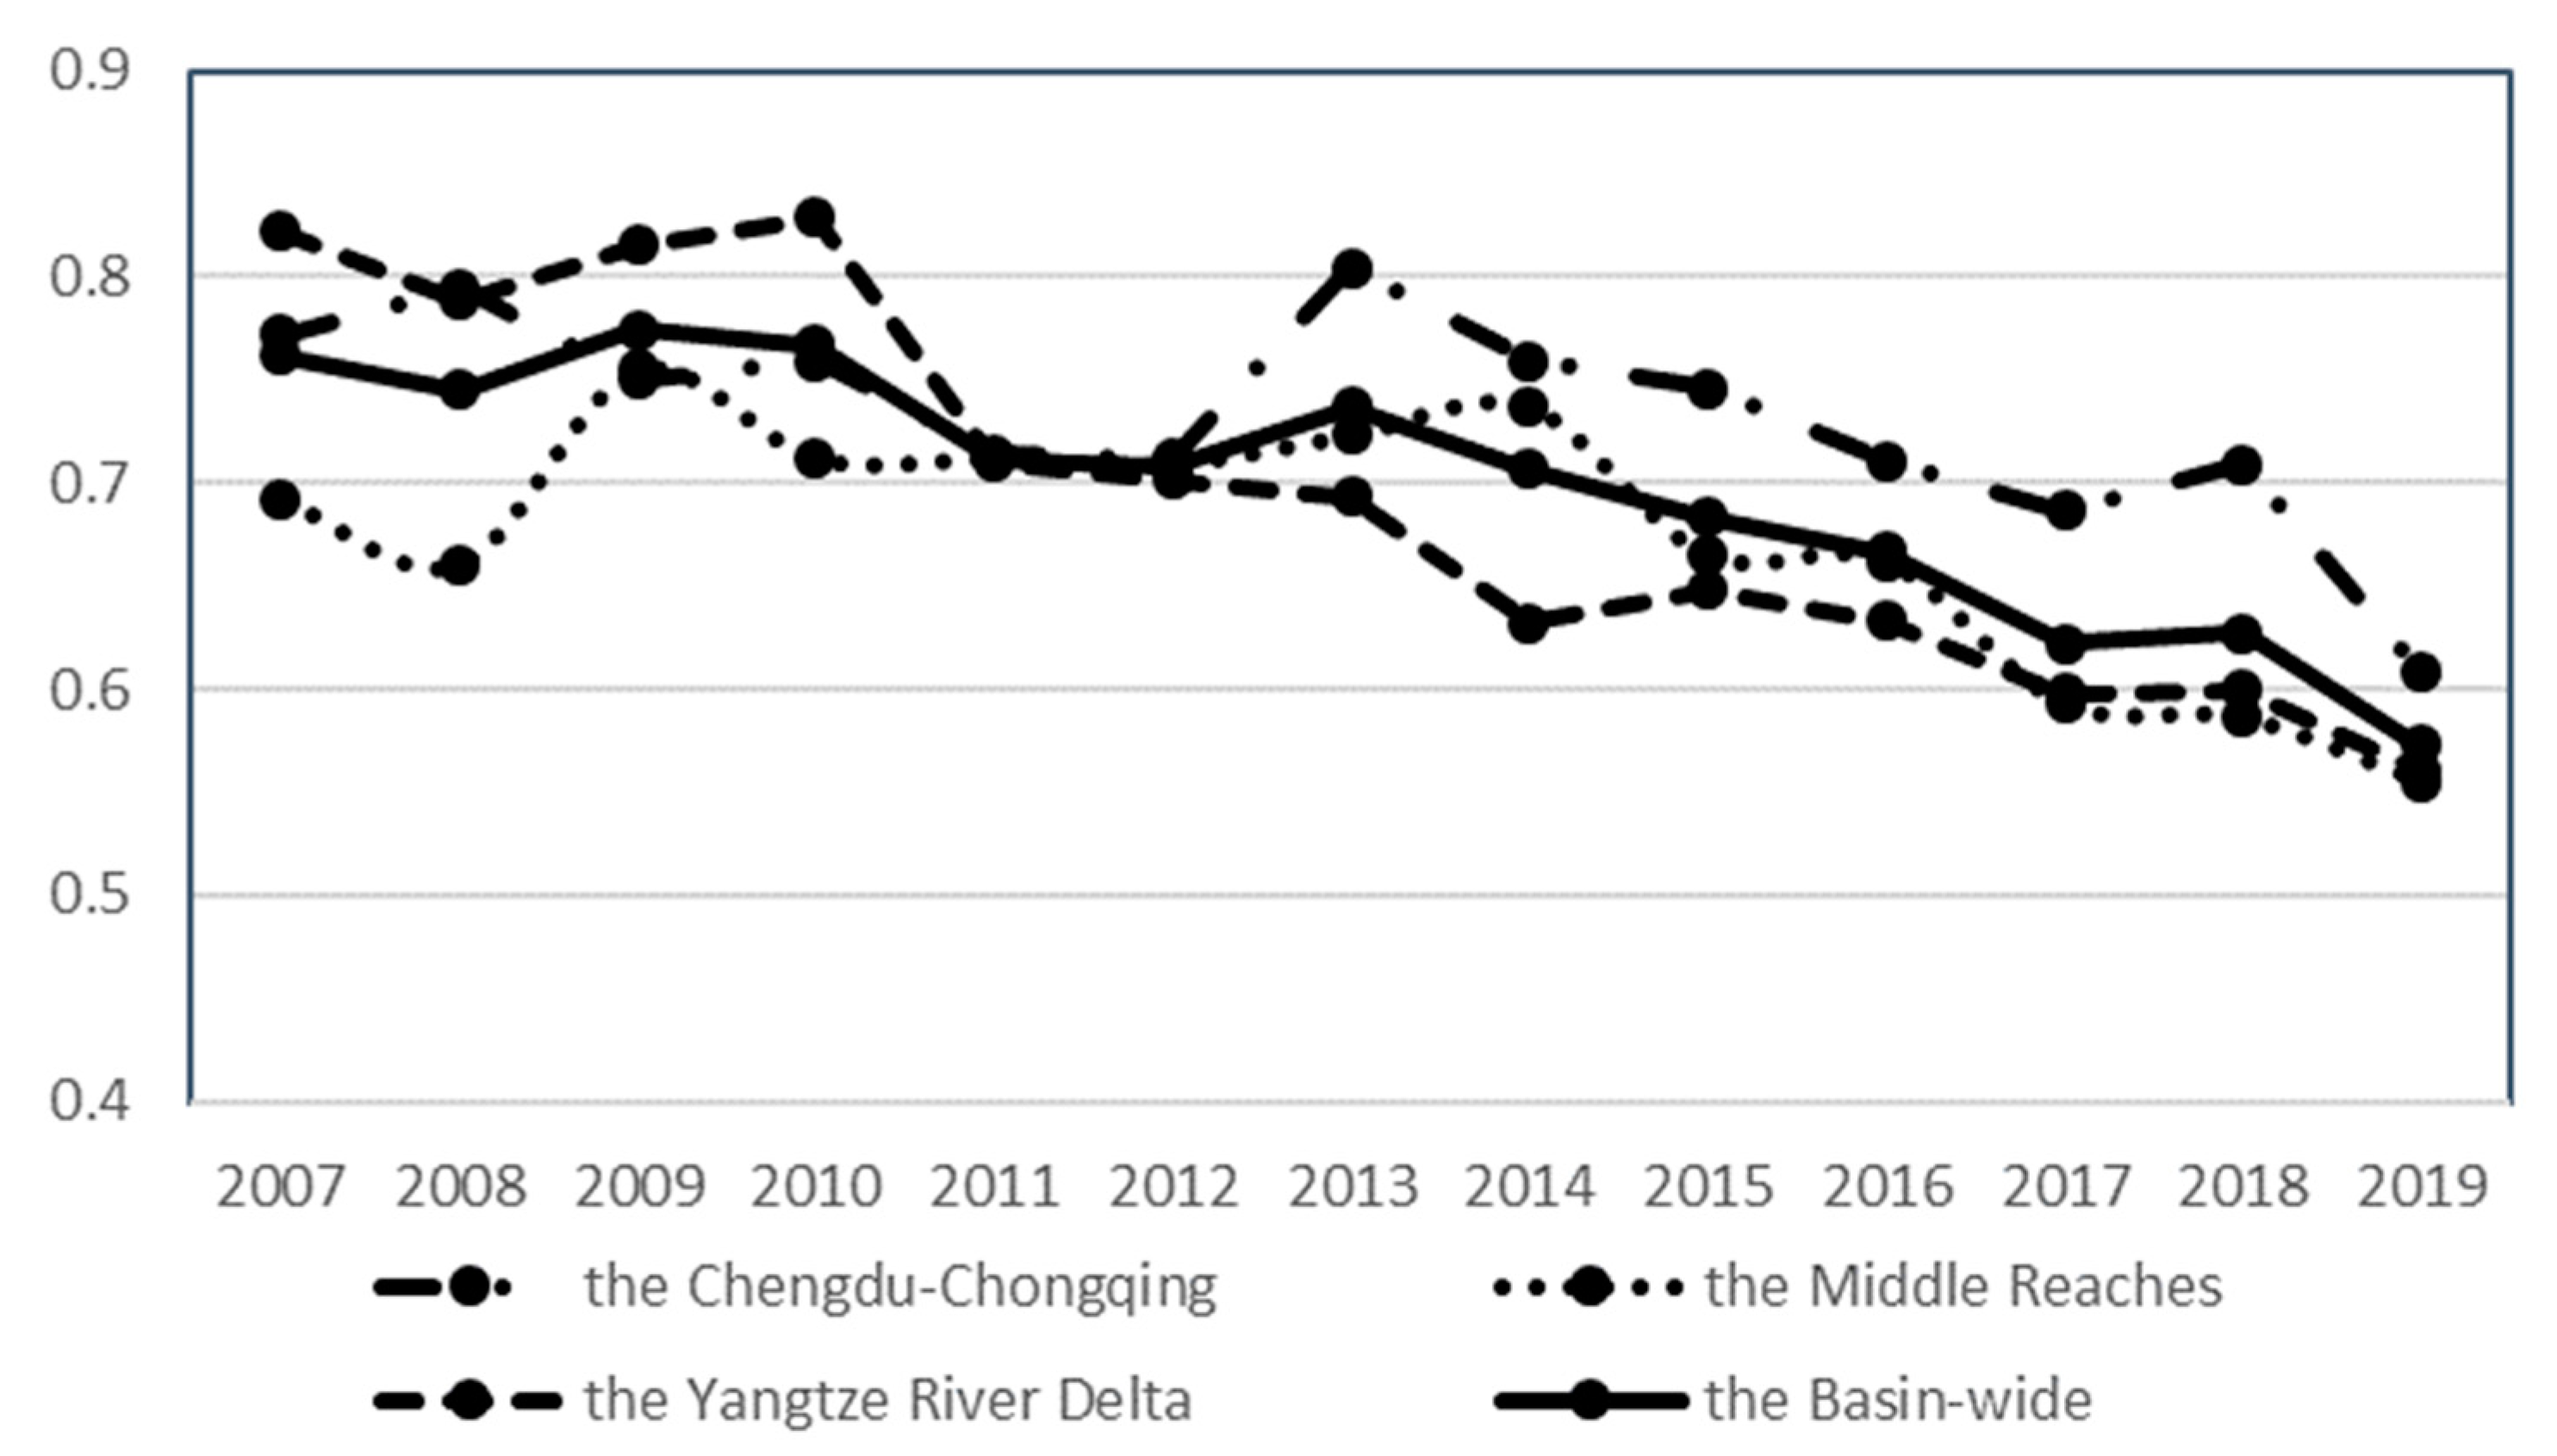
3.1. Evolution of Overall Green Development Efficiency and Its Risk Analysis

As is shown in Figure 1, overall, green development efficiency evolution faces greater uncertainty. The green development efficiency of the Yangtze River basin shows a fluctuating downward trend, with the average value decreasing from 0.7613 to 0.5729 over the period 2007–2019. Prior to 2012, the Yangtze River Delta, the Chengdu–Chongqing city cluster, and the middle reaches of the Yangtze River city cluster all showed a reduction in the efficiency of green development. The distribution of the Chengdu–Chongqing city cluster, the middle reaches of the Yangtze River, and the Yangtze River Delta, in that order, decreased progressively after 2012.
The results of the Malmquist–Luenberger productivity index and its measured decomposition terms are shown in Table 1. The Malmquist–Luenberger index and its decomposition reflect changes from period t to period t + 1, and, in this work, all of the index values for the base period 2007 are “1”. Therefore, Table 1 only reports results for period 2008–2019. In general, the Malmquist–Luenberger indices of the three major city clusters show a general “W-shaped” fluctuation trend. The average value of the basin-wide Malmquist–Luenberger index is greater than one but tends to decline overall. In the past five years, the Yangtze River Delta and Chengdu–Chongqing and Middle Yangtze River city clusters all saw a decline in the Malmquist–Luenberger productivity index. Notably, the Yangtze River Delta saw the most significant drop. In terms of decomposition, the green technology efficiency of the Yangtze River Economic Zone is less than 1 during the sample period. In contrast, green technical progress is greater than 1 except in 2013, which shows that the contribution of both green technical efficiency and green technical progress to green development efficiency is significantly different.

3.2. Spatial Gap Evolution and Uneven Risk of Green Development Efficiency

3.2.1. Basin-Wide Analysis of Differences in Green Development Efficiency and Their Sources

As is shown in Table 2, the overall Gini coefficient ranges from 0.22 to 0.15 over the sample period and shows a slight downward trend, which indicates a small risk of non-equilibrium across the region. The evolution shows a “V-shaped” change before 2013 with a local minimum around 2010. The overall Gini coefficient is decomposed into intra-urban cluster disparity, inter-urban cluster disparity, and hyper-variable density to analyze the source of non-equilibrium risk, where the hyper-variable density contribution reflects the impact of cross-over effects between regions on overall differences. In terms of contribution, the contribution of hyper-variable density to the overall disparity is largest during the sample period, and remains at around 50%, followed by intra-urban cluster disparity, whose contribution remains at around 31%. Furthermore, the disparity between city clusters has the smallest contribution, which shows that the disparity in green development efficiency mainly comes from the contribution of hypervariable density. Specifically, there is little fluctuation in the intra-urban cluster gap contribution, from 31.93% in 2007 to 32.44% in 2019, with an average annual increase of 0.15%, while the inter-urban cluster gap contribution rate has greater fluctuations with an overall decline. Additionally, its local minimum appeared in 2011 and 2012 when the inter-urban cluster gap contribution rate was 0.6365% and 1.66%, respectively. In contrast, the contribution rate of hyper-density reached its highest in 2011 and showed an overall fluctuating upward trend with an average annual increase of 2.01%.

3.2.2. Evolution of Intra-Cluster Variation in Green Development Efficiency and the Risk of Non-Equilibrium

From the results of the intra-cluster Gini coefficient and its evolution, it is evident that the intra-cluster gap fluctuates less and is on a downward trend. Specifically, the intra-cluster Gini coefficient of the Chengdu–Chongqing city cluster has undergone a “W-shaped” change, first falling from 0.211 in 2007 to a low of 0.196 in 2010, and then reaching local maximum in 2013 and 2017, respectively. The reason for this outcome is that the creation of a “golden waterway” for domestic navigation and the implementation of the goal of constructing a sustainable civilization in the basin, coupled with the promotion of the Western Development Strategy, brings opportunities for green development in the upper reaches of the Yangtze River. Against this background, Chongqing and Chengdu have the advantage of factor accumulation to widen the development gap between them and neighboring cities under the siphon effect [39].
The intra-cluster Gini coefficient of the middle reaches has been declining almost linearly over the sample period, with an average annual decline of 4.05%. The Yangtze River Delta follows the same trend as the Chengdu–Chongqing city cluster, evolving in a “downward–upward” cycle and reaching a local minimum in 2010 and 2016, respectively. A very large value appeared in 2012 and 2018 with a Gini coefficient of 0.181 and 0.175, respectively.

3.2.3. Evolution of Inter-Cluster Differences in Green Development Efficiency and the Risk of Non-Equilibrium

The results of the inter-cluster Gini coefficients of the three major city clusters show that, overall, the inter-cluster Gini coefficients are less volatile and are all on a downward trend. Specifically, the gap between the Chengdu–Chongqing city cluster and the middle Yangtze River city clusters and the gap between the Chengdu–Chongqing city cluster and the Yangtze River Delta show a “falling–rising” cycle, while the gap between the middle Yangtze River and Yangtze River Delta city cluster shows a stepped-down cycle. The first stage was from 2007 to 2009, when the inter-cluster Gini coefficients fell from 0.203 to 0.193, a drop of 25.72%. The second stage was from 0.177 in 2010 to 0.151 in 2015, a drop of 14%, and then continued to fall until it reached 0.146 in 2019. The gap between the midstream Yangtze River and the Yangtze River Delta inter-cluster is the smallest, at around 0.15 in the past five years, with an average annual decrease of 3.54%. In contrast, the difference between the Chengdu–Chongqing city cluster and the midstream or Yangtze River Delta is relatively large.

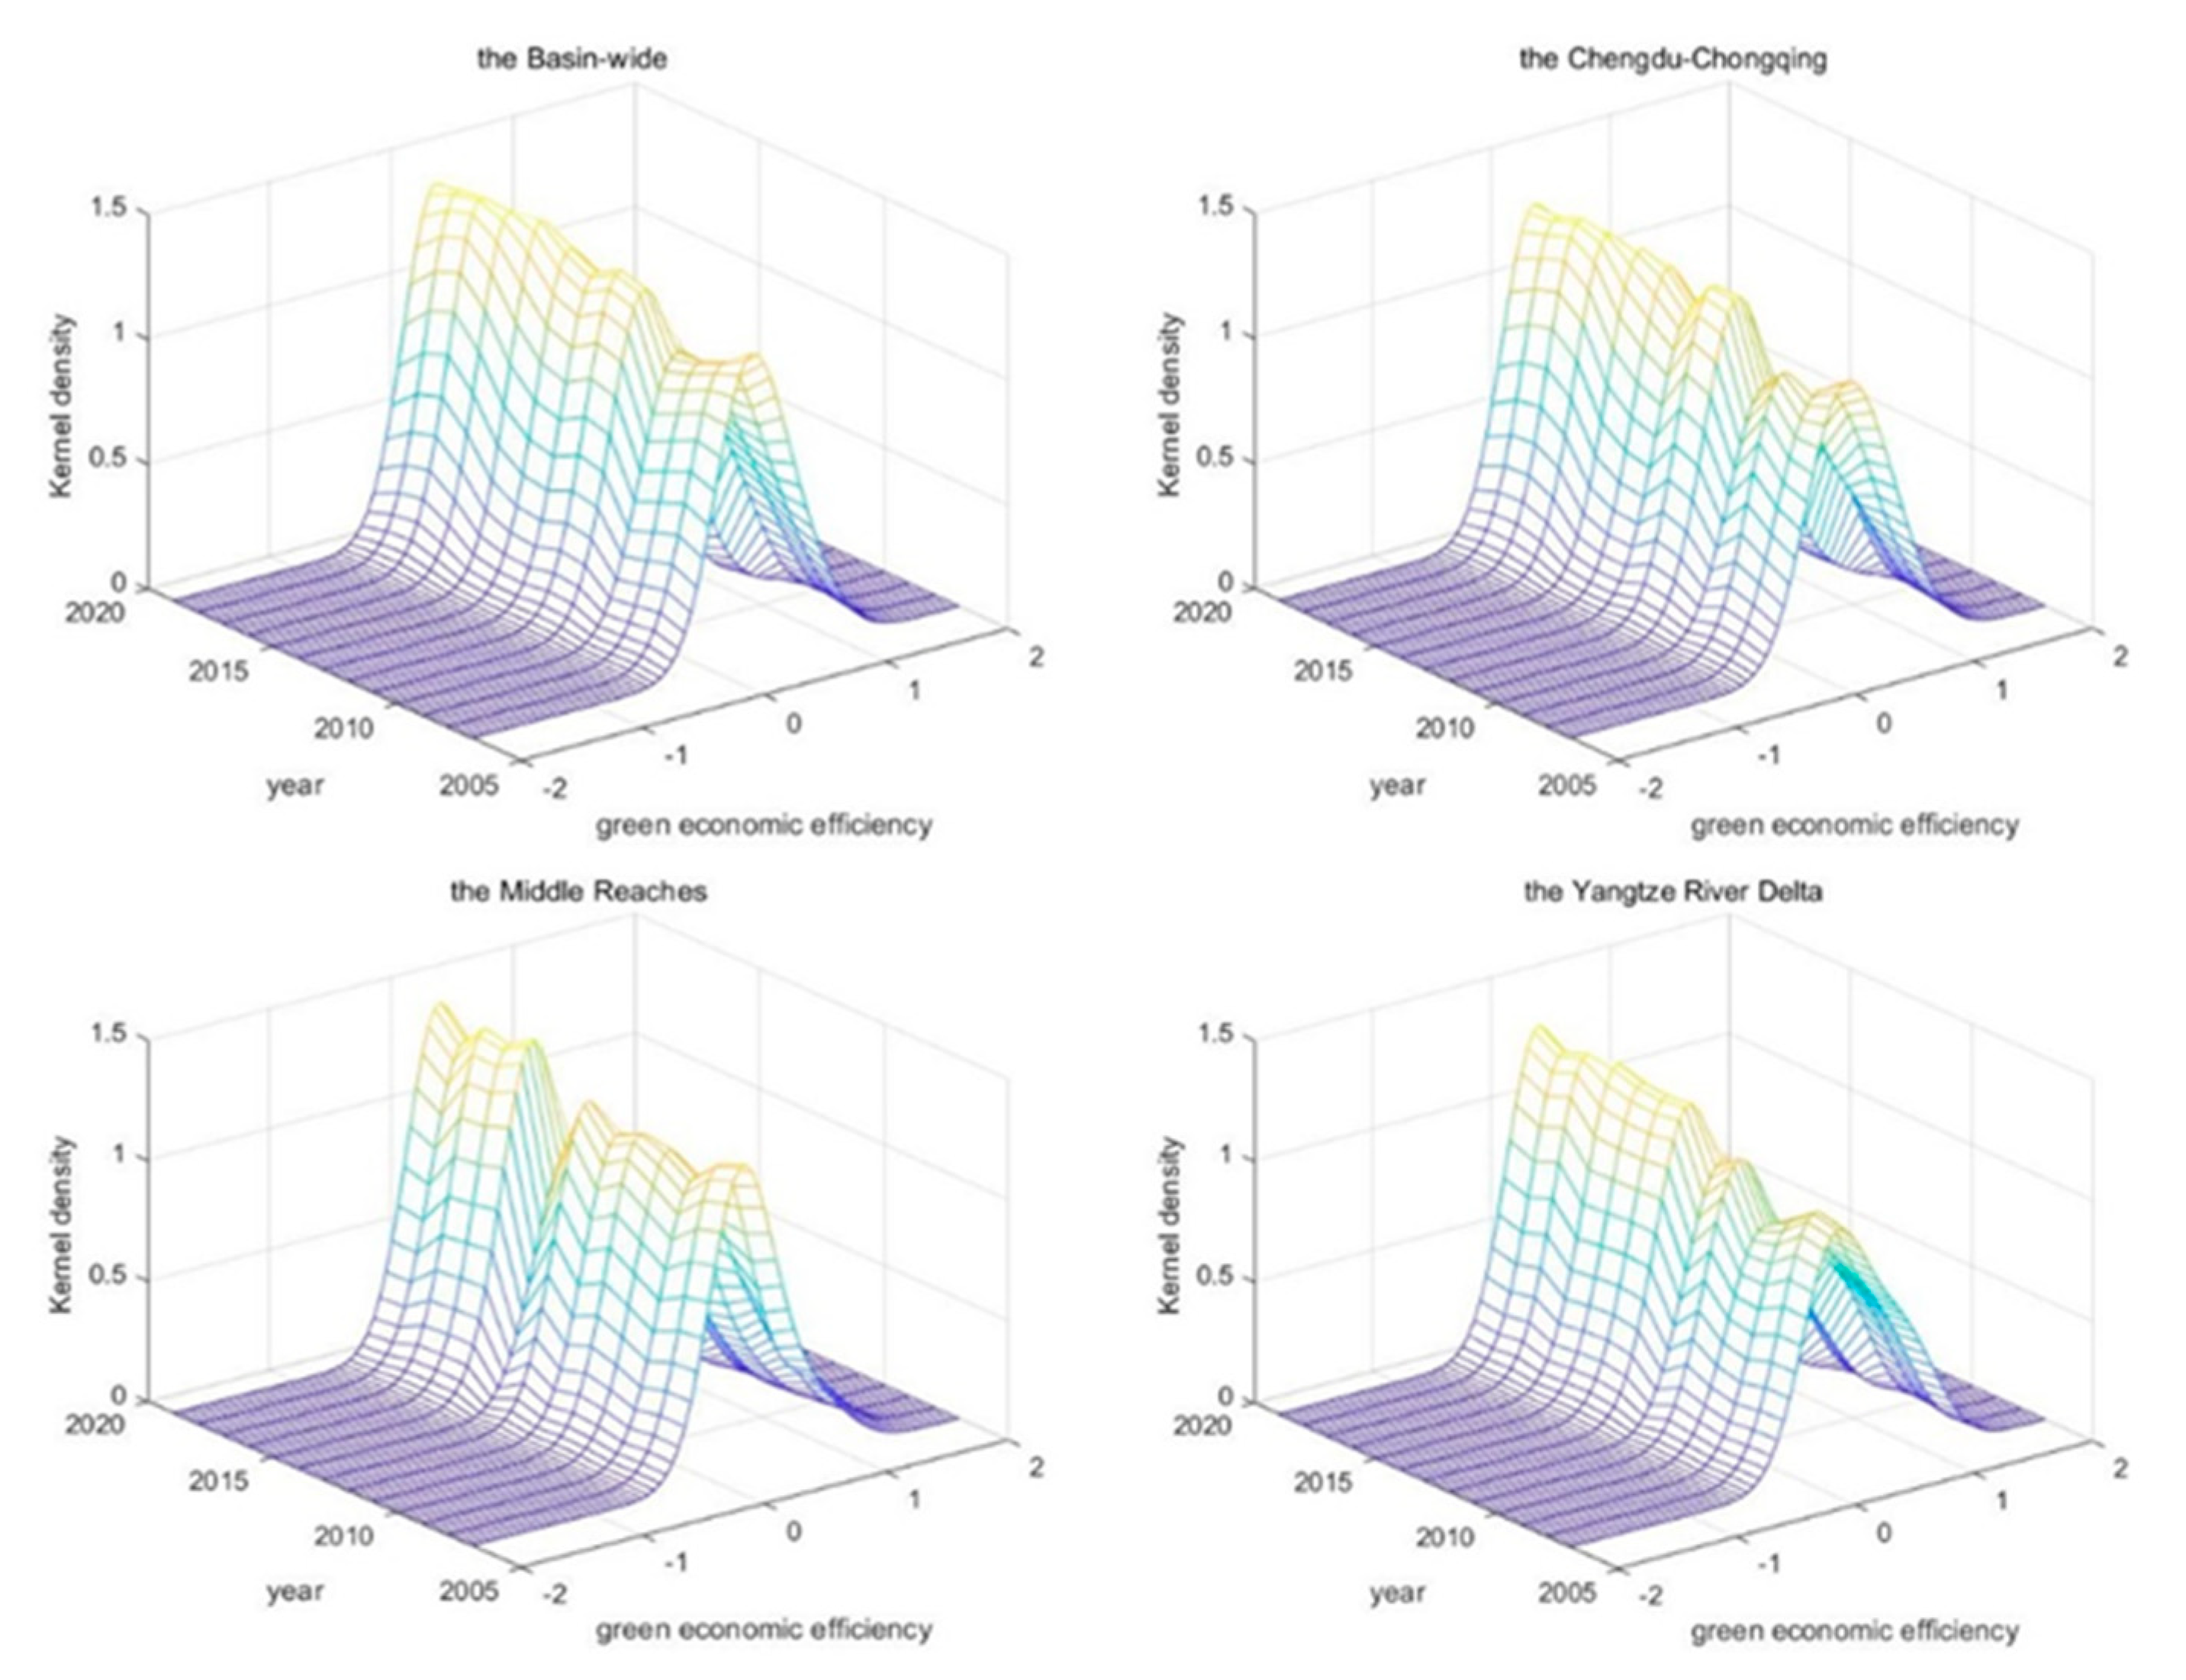
3.3. Dynamic Distribution and Multipolar Analysis of Green Development Efficiency

As is shown in Figure 2, from the distribution position, the overall curve does not show an obvious rightward shift. Furthermore, even the leftward shift in 2010 indicates that the green development efficiency level of the whole Yangtze River Basin has not been significantly improved. According to the previous static evolution trend of green development efficiency, it was discovered that the Yangtze River Basin’s total degree of green development efficiency is fluctuating and dropping, and that it needs to be raised. In addition, from the distribution pattern, the height of the main peak is gradually increasing, and the width of the peak is narrowing, reflecting that the gap between the green development efficiency of the whole river basin is gradually narrowing [40].
From the results of the Kernel density estimation of the three major city clusters, it can be seen that, firstly, from the distribution position, the center of the estimated curve of the three major city clusters had different degrees of leftward shifts before 2010. Furthermore, in recent years, the trend of change in the center of the curve is not obvious, indicating that the three major city clusters have insufficient momentum to improve green development efficiency, and the development of green efficiency has slowed. Secondly, regarding distribution patterns, the main peak heights of the three major city clusters are all on an upward trend, with the Chengdu–Chongqing city cluster remaining stable after a sharp rise in 2010, whereas the middle reaches of the Yangtze River remain basically flat at the beginning and then rise rapidly in 2015, and the Yangtze River Delta shows a slow increase in average speed after two phased rises.
In addition, the crest widths of the three major city clusters are narrowing, with the Yangtze River Delta showing the most pronounced trend of narrowing crest widths. This outcome shows that the green development efficiency gap in the Yangtze River Delta has narrowed considerably compared to the middle and upper reaches of the river and that the integrated and synergistic development strategy has been effective. Finally, in terms of polarization and extension, in line with the basin-wide trend, all three major city clusters show a single-peaked distribution and no obvious polarization or trailing distribution. Evidently, the three major city clusters have insufficient backward force to improve green development efficiency. The above findings also show that, although the strategic context of the Yangtze River basin’s collaborative development has led to an increase in synergistic interactions among cities and a gradual narrowing of regional non-equilibrium development risk, the central cities within the city clusters have outstanding levels of green development efficiency development by virtue of their comparative advantages in factor concentration; however, problems such as their weak radiation-driving capacity to neighboring cities still exist [41], which are not conducive to the free flow and rational allocation of factors, resulting in increasing uncertainty of the green development efficiency improvement.

4. Discussion

Taking 2012 as the time point, the three major city clusters in the Yangtze River basin show different trends in green economic efficiency (Figure 1). The potential explanation for this outcome is that the Yangtze River Delta inter-cluster has a comparative advantage in factor concentration due to its earlier accumulated economic base. Risk resilience has specifically been improved by the accumulating effects of factors such as technological innovation and human capital [42]. At the same time, the rapid economic development is also coupled with a large consumption of resources and increasingly serious environmental pollution in the blind pursuit of economic growth goals, which tends to reduce green development efficiency. The Chengdu–Chongqing inter-cluster, in contrast, began slowly and had a poor starting point. Therefore, with fewer inputs, it can quickly achieve a corresponding output, consume fewer resources, and have a less negative external impact on the environment. In addition, China’s current emphasis on western development has increased investment in the upstream area, which promotes the release of the backward advantage of the Chengdu–Chongqing twin-city economic circle [43]. Therefore, in recent years, the green development efficiency of the Chengdu–Chongqing twin-city economic zone has been faster and even higher than other metropolitan clusters.
The magnitudes of the two decomposition terms of green development efficiency, green technology progress, and green technology efficiency values differed significantly within the sample period (Table 1), with green technology efficiency values being relatively low and smaller than the standard value of 1. This indicates that the wastage of resources caused by excessive scale expansion and the failure of the “efficiency dividend” are the main factors impeding the improvement of green development efficiency [44], while the green technology progress is the main path to green development efficiency improvement. Moreover, in the past five years, the Yangtze River Delta city cluster has the largest contribution of green technology progress to green development efficiency, and the Yangtze River midstream city cluster has the lowest. Therefore, one of the paths to cope with the risk of green development efficiency evolution involves integrating and optimizing resource allocation and avoiding redundant inputs and inefficient outputs. In the meanwhile, it is imperative to boost R&D spending, encourage technical advancement, and encourage the use of resource-saving technologies [39].
In terms of the green development efficiency gap, the low overall Gini coefficient indicates that the green development efficiency gap in the Yangtze River basin is small and the unbalanced risk across the basin is low (Table 2). The main source of non-equilibrium risk in green development efficiency in the Yangtze River Economic Zone is the overlap and crossover effect between regions, which is expressed by the hyperdensity contribution. Thus, there remain cities within the high green development efficiency city clusters that are less efficient as those in the low green development efficiency city clusters. The primary contributor to this instability is the unequal spatial distribution and discrepancy in development that characterize city clusters.
In terms of intra-cluster disparity, the inter-cluster Gini coefficients of the Chengdu–Chongqing inter-cluster is largest, and the midstream city clusters follows. The Yangtze River Delta inter-cluster has the lowest Gini coefficient due to its integration process, which strongly encourages interconnection and collaboration among cities [45]. Within the middle reaches of the Yangtze River inter-cluster, under the strategic layout of Wuhan, Changzhutan, and the Nanchang urban areas, the three provincial capitals play a leading role, driving the synergistic development of the sub-centers. This role is the main reason for the narrowing of the green development efficiency gap within the middle reaches of the Yangtze River inter-cluster [41]. The overall lower level of reduction indicates the persistence of the gap between the city clusters in the Yangtze River basin and the unbalanced spatial distribution of green development efficiency (Table 2), and the steady-state development trend of the narrowing gap among the three major city clusters also reflects that, as the Yangtze River Economic Belt’s development strategy is further developed and implemented, the gap is becoming less pronounced. The conclusions reflected are generally consistent with a previous paper [26]. The results of the basin-wide and three major urban clusters nuclear density estimation (Figure 2) can dynamically and intuitively reflect the changing trends of green development efficiency and disparity [38], and the conclusions thus reflected are generally consistent with those derived from the Gini coefficient estimation in the previous paper, which proves the robustness of the above conclusions.
This paper provides methodological and conceptual guidance for regional sustainable development efficiency level measurement, evaluation, and risk analysis, as well as empirical reference for the overall balanced sustainable development of the region. The limitations of this paper and potential areas for future research lie mainly in the following aspects. Firstly, there are not enough indicators chosen. In this study, the input–output index system for evaluating the effectiveness of green development is built using GDP as the desired outcome and industrial wastewater, industrial fixed waste, and industrial sulfur dioxide emissions as the non-desired outputs. However, the positive and negative externalities of economic and social activities cannot be fully covered by these indicators. In addition, the research methodology needs to be improved. This paper focuses on the degree of green development efficiency, regional differences, and the dynamic evolution of the three major city clusters and analyzes the potential risk factors on this basis; however, according to the neoclassical growth theory, economic development will eventually converge to a steady state [46], therefore the convergence of green development efficiency needs to be explored in the future. Finally, empirical analysis can also be used to further examine the explanations of the results. The analysis of the causes of the results in this paper is primarily based on comparative inferences from previous studies; however, further empirical analysis of other relevant factors affecting green development efficiency and its disequilibrium differences through causal tests is required in subsequent studies.

5. Conclusions

In this study, we measure the green development efficiency of the three major city clusters in the Yangtze River Economic Belt from 2007 to 2019 by means of the super efficient SBM model. Further, the spatial and temporal evolution of green development efficiency is represented by using the Dagum Gini coefficient and the Kernel density non-parametric estimation method. In this regard, our results suggest the following:
(1)
The green development efficiency of the city clusters in the Yangtze River Economic Zone exhibits an overall fluctuating downward tendency, and green development efficiency evolution is characterized by large uncertainties. The green development efficiency level of the whole basin decreases from west to east. It is primarily enhanced by advancements in green technology, and an underutilization of resources is the primary factor contributing to the risk of ineffective green development;
(2)
The difference in green development efficiency has a tendency to gradually decrease; however, the overall green development efficiency is not in a fully effective state, combined with gradually decreasing green development efficiency levels. In terms of intra-cluster disparity, the disparity within the Yangtze River Delta city cluster is the smallest, followed by the midstream, and it is the largest within the Chenghai-Chongqing city cluster. In terms of inter-cluster disparity, the disparity between the Yangtze River Delta and the midstream city cluster is the smallest, and the inter-cluster disparity between the Chenghai-Chongqing and the other two city clusters is larger. The sources of non-equilibrium risk in green development are mainly hyper-variable density and intra-inter-cluster disparity;
(3)
The Kernel density estimates, whether in the Yangtze River Economic Zone as a whole or within the three major city clusters, suggest a single main peak distribution with insufficient momentum for horizontal improvement. Furthermore, the gradually increasing peak height and narrowing width further indicate a narrowing trend of spatial differences.
In response to these findings, the following recommended measures should be considered. Firstly, technology should be used as a guide and efforts should be made to increase efficiency in resource utilization. The research results show that the green development efficiency of the three major urban clusters has not reached a fully effective state, and there is still much room for improvement. Given that green technology progress is essential for promoting the advancement of green development efficiency, importance should be attached to investing in technological factors and encouraging R&D and innovation, especially the R&D of green and low-carbon technologies, to improve the efficiency of resource utilization and reduce pollutant emissions. In addition, salary incentives and support facilities for talents should be increased, while establishing a sound two-way circulation mechanism for talents to contribute to high-quality labor supply for technological innovation.
Secondly, it is recommended that the division of functions within city clusters and stimulating the radiation function effect of the central cities be optimized. Given that the unbalanced development within city clusters is the main cause of the green development efficiency gap, on the one hand, each city cluster should fully stimulate the radiation-driven role of the central cities, promoting the efficient flow and orderly interaction of factors between the central cities and the surrounding cities. On the other hand, each city should combine the endowment structure of each city, fully exploit its competitive strength, rationalize the distribution of industries, and deepen the division of labor and cooperation between cities to promote the upgrading of industrial structures and the extension of industrial chains, as well as to enhance the inter-city linkage effect and the overall synergistic development.
Thirdly, the Yangtze River Delta city cluster is dealing with a shift in the development of green initiatives. According to this study, the Yangtze River Delta city cluster’s green economy is less effective than those of city clusters with less established economies. Environmental management and oversight should be strengthened in this area. Additionally, while continuing to advocate for an integrated economic development plan, the synergistic development of the ecological environment needs to be treated seriously in order to create a reliable mechanism for cooperation for environmental conservation.

Author Contributions

Methodology, Y.Y.; data curation, Z.Y.; writing—original draft preparation, Y.Y. and Z.Y.; writing—review and editing, Y.Y. and J.J.; supervision, Y.Y. and J.J. All authors have read and agreed to the published version of the manuscript.

Funding

This research was funded by the General Project of Humanities and Social Science Planning Fund of the Ministry of Education (Grant No. 21YJA630109).

Institutional Review Board Statement

Not applicable.

Informed Consent Statement

Not applicable.

Data Availability Statement

Data available within the article.

Acknowledgments

We sincerely thank the research platforms for sharing the data.

Conflicts of Interest

The authors declare no conflict of interest.

References

  1. Ma, X.J.; Li, Y.D.; Wang, C.X.; Yu, Y.B. Eco-efficiency in China’s Circular Economy Development under Constraints-Based on the Optimized Super efficient SBM-Malmquist-Tobit model. China Environ. Sci. 2018, 38, 3584–3593. [Google Scholar] [CrossRef]
  2. Yao, S.M.; Feng, C.C.; Wang, C.X. Urbanization in China and its Resource and Environmental Basis; Science Press: Beijing, China, 2010. [Google Scholar]
  3. Qi, Y.Y.; Deng, X.; Ren, C.Q. Trade Openness, Environmental Regulation and Urban Green Development Efficiency—Evidence from 282 cities in China, 2010–2018. Explor. Econ. Issues 2022, 43, 145–160. [Google Scholar]
  4. Hu, A.G.; Zhou, S.J. Green Development: Functional Definition, Mechanism Analysis and Development Strategy. China Popul. Resour. Environ. 2014, 24, 14–20. [Google Scholar]
  5. Wu, C.Q.; Zhang, B.Q. Study on the efficiency of green development of manufacturing industry in Yangtze River Economic Zone. Learn. Pract. 2022, 5, 32–40. [Google Scholar] [CrossRef]
  6. Chen, Y.; Wen, C.H.; Shen, T.Y. A Study on the Evaluation of Green Development Efficiency and Spatial and Temporal Evolution in the Twin-City Economic Circle of Chengdu-Chongqing region. Yangtze River Basin Resour. Environ. 2022, 31, 1137–1151. [Google Scholar]
  7. Li, J.J.; Miao, C.H. The Impact of Population Mobility on Regional Economic Differences in the Yangtze River Economic Belt. J. Geogr. 2017, 72, 197–212. [Google Scholar]
  8. He, Y.; Tian, J.X.; Chen, Z.Z. Research on Green Development Efficiency of Chinese Cities in the Context of Carbon Neutrality. Ecol. Econ. 2022, 38, 92–98. [Google Scholar]
  9. Han, J.C.; Zhou, L.F. Regional Heterogeneity and Factor Decomposition of Green Development Efficiency. Stat. Decis. Mak. 2022, 14, 39–44. [Google Scholar] [CrossRef]
  10. Tian, G.H.; Li, J.S.; Miao, C.H.; Du, P.P. Analysis of Green Development Efficiency and Influencing Factors of Chinese Cities Based on Non-expected Output. Econ. Geogr. 2022, 42, 83–91. [Google Scholar] [CrossRef]
  11. Yan, Y.; Wang, C.; Quan, Y.; Wu, G.; Zhao, J. Urban Sustainable Development Efficiency Towards the Balance between Nature and Human Well-Being: Connotation, Measurement, and Assessment. J. Clean. Prod. 2018, 178, 67–75. [Google Scholar] [CrossRef]
  12. Ning, L.C.; Zheng, W.; Zeng, L.E. Research on China’s Carbon Dioxide Emissions Efficiency from 2007 to 2016: Based on Two Stage Super Efficiency SBM Model and Tobit Model. J. Peking Univ. Nat. Sci. Edition. 2021, 57, 181–188. [Google Scholar] [CrossRef]
  13. Aparicio, J.; Barbero, J.; Kapelko, M.; Pastor, J.T.; Zofío, J.L. Testing the consistency and feasibility of the standard Malmquist-Luenberger index: Environmental productivity in world air emissions. J. Environ. Manag. 2017, 196, 148–160. [Google Scholar] [CrossRef] [PubMed]
  14. Maziotis, A.; Molinos-Senante, M.; Sala-Garrido, R. Assesing the Impact of Quality of Service on the Productivity of Water Industry: A Malmquist-Luenberger Approach for England and Wales. Water Resour. Manag. 2017, 31, 2407–2427. [Google Scholar] [CrossRef]
  15. Cui, H.R.; Wang, H.R.; Zhao, Q.Z. Research on the dynamic evolution characteristics and drivers of green total factor productivity in Chinese industry. Stat. Decis. 2021, 37, 117–120. [Google Scholar] [CrossRef]
  16. Wu, Y.Q.; Zhang, X. Evaluation on the Green Development of Provincial Economy in China—Based on the Perspective of Green Total Factor Productivity. J. Hebei Univ. Econ. Business. 2022, 43, 67–81. [Google Scholar] [CrossRef]
  17. Pittman, R.W. Multilateral Productivity Comparisons with Undesirable Outputs. Econ. J. 1983, 93, 883–891. [Google Scholar] [CrossRef]
  18. Fare, R.; Grosskopf, S.; Lovell, C.A.K.; Pasurka, C. Multilateral Productivity Comparisons when Some Outputs Are Undesirable: A nonparametric Approach. Rev. Econ. Stat. 1989, 71, 90–98. [Google Scholar] [CrossRef]
  19. Tone, K. A Slacks-based Measure of Efficiency in Data Envelopment Analysis. Eur. J. Op. Res. 2001, 130, 498–509. [Google Scholar] [CrossRef] [Green Version]
  20. Hirofumi, F.; William, L.W. A directional slacks-based measure of technical inefficiency. Socio-Econ. Plan. Sci. 2009, 43, 274–287. [Google Scholar] [CrossRef]
  21. Li, H.D.; Wu, B.L. Research on Efficiency of China’s economic efficiency Based on Three-stage DEA Model. J. Gui Zhou Univ. Financ. Econ. 2013, 3, 14–22. [Google Scholar]
  22. Zhang, W.D.; Zhao, S.H.; Long, H.X.; Liu, M.R. Economic Growth Efficiency Based on SBM Method and Decomposition of Total Factor Productivity Taking Sichuan Province as an Example. Financ. Econ. 2015, 8, 100–111. [Google Scholar]
  23. Li, P. Environment Technical Efficiency, Green Productivity and Sustainable Development. J. Quant. Tech. Econ. 2017, 34, 3–23. [Google Scholar] [CrossRef]
  24. Ke, H.; Fu, J.; Cai, Q.Q.; Cao, J.F. Regional Differences and Dynamic Evolution of Green Total Factor Productivity. J. Tech. Econ. Manag. 2021, 5, 112–116. [Google Scholar]
  25. Li, K.F.; Li, Z.H. Green total factor productivity measurement in the Yellow River Basin. Stat. Decis. 2022, 38, 98–101. [Google Scholar] [CrossRef]
  26. Yu, S.B.; Zhang, J.T. The Calculation and Convergence Analysis of Provincial Green Total Factor Productivity in the Yangtze River Economic Belt. Reform 2021, 4, 68–77. [Google Scholar]
  27. Wu, C.Q.; Zhou, X.Y.M. Research on the Spatiotemporal Evolution and the Influencing Factors of Green development efficiency in the Yangtze River Economic belt. J. Macro Qual. Res. 2020, 8, 120–128. [Google Scholar] [CrossRef]
  28. Guo, B.N.; Tang, L.; Zhang, H. Regional Difference and Stochastic Convergence of Green development efficiency in Yangtze River Economic Belt. Ecol. Econ. 2021, 37, 46–53. [Google Scholar]
  29. Chen, Y.; Lu, Y. Industrial Structure Upgrading of Commerce and Distribution Industry and High-quality Economic Development—An Empirical Analysis Based on the Yangtze River Economic Belt. Bus. Econ. Res. 2022, 13, 18–22. [Google Scholar]
  30. Li, J.H.; Wang, B. Measurement and Analysis of Total Factor Productivity of Science and Technology in Beijing, Tianjin and Hebei. China Sci. Technol. Forum 2019, 5, 116–122. [Google Scholar] [CrossRef]
  31. Li, S.J.; Fan, C. A Review and Comparison of Stochastic Frontier Analysis and Data Envelopment Analysis Methods. Stat. Decis. Mak. 2009, 7, 25–28. [Google Scholar]
  32. Xu, W.; Sun, X.F.; Chi, G.T. Study on Technical Efficiency and Internal Influence Relationship of Chinese Commercial Banks. J. Harbin Inst. Technol. 2009, 41, 251–253. [Google Scholar]
  33. Liu, X.L.; Guo, Y.S. Evaluation of Eco-efficiency of Mining Areas in the Context of “Double Carbon”—Shanxi Province as an Example. Econ. Issues 2022, 6, 123–129. [Google Scholar] [CrossRef]
  34. Yu, Y.S.; Wei, P. Study on Urban Green Total Factor Productivity Measurement in China. Ecol. Econ. 2021, 37, 43–52. [Google Scholar]
  35. Zhang, J.; Wu, G.Y.; Zhang, J.P. The Estimation of China’s provincial capital stock: 1952–2000. Econ. Res. J. 2004, 10, 35–44. [Google Scholar]
  36. Dagum, C. A New Approach to the Decomposition of the Gini Income Inequality Ratio. In Income Inequality, Poverty, and Economic Welfare; Physica-Verlag HD: Heidelberg, Germany, 1998; pp. 47–63. [Google Scholar]
  37. Li, Q.Y.; Zhong, S.Y. Spatial Differences and Dynamic Evolution of the Distribution of Fiscal Health Expenditures in China—An Empirical Study Based on Dagum Gini Coefficient Decomposition and Kernel Density Estimation. Financ. Econ. Ser. 2016, 10, 19–28. [Google Scholar] [CrossRef]
  38. Shen, L.; Bao, J.H. The Dynamic Evolution of the Distribution of Financial Development in China: 1978~2008—An Empirical Study Based on Nonparametric Estimation Method. Res. Quant. Econ. Technol. Econ. 2013, 30, 33–47. [Google Scholar] [CrossRef]
  39. Lu, L.W.; Song, D.Y.; Li, X.F. Green efficiency of urban development in the Yangtze River Economic Belt. China Popul. Resour. Environ. 2016, 26, 35–42. [Google Scholar]
  40. Zhang, Z.Q.; Zhang, T.; Feng, D.F. Regional Differences, Dynamic Evolution and Convergence of Carbon Emission Intensity in China. Quant. Econ. Tech. Econ. Res. 2022, 39, 67–87. [Google Scholar] [CrossRef]
  41. Zhang, Y.; Chen, W.; Chen, Y.Y.; Ren, D.H. Inter-city connectivity among and within the three major city clusters in the Yangtze River Economic Belt. Econ. Geogr. 2022, 42, 93–102. [Google Scholar] [CrossRef]
  42. Xu, X.G.; Wang, Y.C.; Luo, D.K. Technology Heterogeneity, Regional Gap and Innovation Efficiency of High-tech Industries. Forum Sci. Technol. China 2020, 2, 110–121. [Google Scholar] [CrossRef]
  43. Zhang, M.D.; Li, Y. Research on Spatial-temporal Pattern and Convergence of Urban Economic High-quality Development in the Yangtze River Economic Belt. East China Econ. Manag. 2022, 36, 24–34. [Google Scholar] [CrossRef]
  44. Liu, X.J.; Wang, L.L.; He, B.W.; Li, D. Spatial and Temporal Evolution of PM (2.5) in Yangtze River Economic Zone and its Influencing Factors. Yangtze River Basin Resour. Environ. 2022, 31, 647–658. [Google Scholar]
  45. Zhou, J.J.; Jiang, N.H.; Zhao, Z.Y. Study on the Impact of Market Integration of Yangtze River Delta on Industrial Air Pollution Emission Reduction and the Mechanism of its Effect. J. Nantong Univ. 2022, 38, 44–55. [Google Scholar]
  46. Pan, W.Q. Regional Economic Disparities and Convergence in China. China Soc. Sci. 2010, 6, 72–84. [Google Scholar]
Figure 1. Evolution and comparison of green development efficiency values among the three major city clusters.
Sustainability 14 10417 g001
Figure 2. Results of basin-wide and three major urban clusters’ nuclear density estimates.
Sustainability 14 10417 g002
Table 1. Comparison of the results of the decomposition of the green development efficiency.
Malmquist–Luenberger IndexGreen Technology EfficiencyGreen Technology Progress
UpMidDownUpMidDownUpMidDown
20081.24021.14231.16011.04920.98560.96821.20021.16811.2025
20091.07471.25031.12320.98071.19541.04791.11081.05811.0753
20101.16281.08161.12411.03300.95291.02831.12791.13541.0978
20111.10421.12651.00500.94091.01630.85941.17671.11661.1767
20121.12361.11641.12610.99301.01480.99291.13391.10081.1360
20131.09391.03860.96821.14611.04281.02710.96501.00840.9413
20141.07921.12431.04010.96601.04260.95871.12141.08511.0905
20151.13041.03291.18500.97930.92991.03841.15691.11921.1438
20161.22861.20071.33470.95440.99740.98621.29141.20591.3514
20171.02460.93041.05860.98040.93010.94151.04510.99221.1261
20181.21031.09581.12311.08651.02260.99851.11841.08221.1240
20191.04211.05021.09090.91120.94770.95091.16261.11051.1498
Table 2. Comparison of Dagum Gini Coefficient decomposition results.
Intra-Cluster Gini CoefficientInter-Cluster Gini CoefficientSource of Contribution
YearOverall Gini CoefficientUpMidDownUp–MidUp–DownMid–DownContribution of Intra-Cluster (%)Contribution of Inter-Cluster (%)Hypervariable Density Contribution (%)
20070.2200.2110.2410.1820.2420.2000.23331.92917.73750.334
20080.2070.2150.2070.1690.2360.1980.21031.29819.64449.058
20090.1850.2130.1810.1530.2000.1930.17332.43810.38457.178
20100.1770.1960.1750.1460.1930.1780.17631.92219.51348.565
20110.1940.2230.1880.1720.2080.2000.18232.9760.63666.388
20120.2000.2460.1740.1810.2140.2170.17932.7961.66465.540
20130.2050.2470.1760.1790.2230.2270.18032.17015.67952.150
20140.1880.2230.1800.1400.2050.2020.17431.75321.41646.831
20150.1820.2330.1660.1320.2130.1970.15131.80416.72951.467
20160.1870.2430.1880.1200.2210.1960.15932.10213.56654.332
20170.1970.2530.1730.1540.2250.2160.16632.07815.99951.923
20180.1880.2400.1290.1750.2030.2220.15731.60521.96446.431
20190.1660.2030.1380.1520.1780.1840.14632.44311.85155.706
Publisher’s Note: MDPI stays neutral with regard to jurisdictional claims in published maps and institutional affiliations.

