Article

Dynamic Response Mechanism of Silt Ground under Vibration Load

1
School of Civil Engineering and Architecture, Zhengzhou University of Aeronautics, Zhengzhou 450046, China
2
School of Civil Engineering and Architecture, Guilin University of Technology, Guilin 541004, China
3
School of Geociences and Engineering, North China University of Water Resources and Electric Power, Zhengzhou 450046, China
*
Author to whom correspondence should be addressed.
Sustainability 2022, 14(16), 10335; https://doi.org/10.3390/su141610335
Submission received: 29 June 2022 / Revised: 11 August 2022 / Accepted: 17 August 2022 / Published: 19 August 2022
(This article belongs to the Special Issue Sustainability in Geology and Civil Engineering)

Abstract

:
The frequent vibration loads during the operation of trains can cause vibration deformation of the tunnel structure and surrounding weak strata, thereby endangering the safe operation of trains. The purpose of this paper is to study the dynamic response of surrounding soil layers caused by train vibrations through the finite difference method with FLAC3D. Based on existing research, we studied the artificially deterministic exciting force function. Then, we simulated the tunnel working conditions of a train with a 3D model, and applied the artificially deterministic exciting force function to the tunnel model. To study the vibration caused by trains in silty soil, we divided the trains into two cases, one-way and two-way. We compared the displacement–time curves of one-way and two-way trains. When the horizontal distance between the monitoring point and the vibration source increases, the peak value of the displacement–time curve decreases. As the speed of the train increases, the peak value of the displacement–time curve increases. The vertical displacement of the ground under the dynamic load of the two-way train is greater than that of the one-way train. In the acceleration–time curve, there is a lag in the ground acceleration response. The faster the speed of the subway train, the greater the peak value of the acceleration–time curve. This study can provide a guide for the evaluation and prevention of ground vibration subsidence and uneven subsidence of strata in the silt area of the Yellow River Region.

1. Introduction

The vibration generated by the interaction between the subway train and the track during operation has an impact on the surrounding environment, buildings, and the structural stability of the tunnel–soil. This issue has received more and more attention. As cities grow in size and population, the available urban underground space becomes limited. This results in the construction of parallel tunnels and overlapping tunnels. The problem becomes more prominent as the speed of the train increases. The vibrations generated during the operation of subway trains do not immediately lead to the failure of the tunnel structure. However, under the action of long-term and frequent vibration loads, the tunnel structure and the surrounding weak strata will produce vibration-sag deformation. Ultimately, this jeopardizes the safe operation of subway trains. Therefore, it is of great significance to quantify the vibration subsidence deformation caused by subway train vibration to ensure the stability of the tunnel.
How to simulate the vibration load generated by subway trains in operation has been studied by many scholars. For example, when the numerical simulation method is used for calculation, the train vibration load is often simplified as the deterministic exciting force function. Pan and Xie [1] and Liang [2] et al. conducted vibration tests on Beijing subway trains for the train’s dynamic load spectrum, and further proposed the excitation force function to show the characteristics of the train’s dynamic load. Ma [3] analyzed the dynamic response of adjacent subway structures under the action of train dynamic load, and concluded that the train dynamic load would cause the displacement and stress of the tunnel segment structure and surrounding strata to fluctuate. Based on Tianjin Metro Line 5, Zhu [4] analyzed the dynamic response of the tunnel structure passing through the saturated silt layer under the action of a strong earthquake. The results show that the displacement of the tunnel structure is greater when the saturated silt layer is closer to the tunnel structure. Yang et al. [5] established a physical model of the tunnel, and used an electromagnetic vibration exciter to continuously apply the dynamic load of the train at the inverted arch of the tunnel. The results show that the acceleration peak value of the soil around the tunnel increases approximately linearly with the increase in the loading period. Zhang et al. [6] studied the dynamic response of the tunnel’s weak surrounding rock base under the dynamic load of the train with different axle loads, and obtained the response law of the tunnel base displacement and base stress. Zheng et al. [7] studied the effect of train dynamic load on the strength performance of concrete structures at the bottom of tunnels. Fu et al. [8] studied the deformation law of deep foundation pit supporting structure under the action of train dynamic load. The research shows that the deformation law of the foundation pit support structure obtained by simulating the dynamic load of the train and applying it to the model is consistent with the field measurement. Li et al. [9] studied the influence of train dynamic load on the excavation stability of adjacent foundation pits. They found that the faster the train runs, the more significant the dynamic load of the train, and the greater the impact on the displacement of the adjacent foundation pit wall and the surface settlement. Professor Degrande [10,11] carried out the monitoring of the horizontal and vertical vibration of the building at a distance of 70 m from the London Underground Tunnel. The results show that with the increase in train speed, the building vibration was not significantly increased. However, there was a significant difference between indoor and outdoor horizontal vibrations.
The interaction between the train and the track generates vibration, which is transmitted to the tunnel structure through the track bed and then to the surface and nearby buildings through the surrounding soil. Many scholars have studied the dynamic response of buildings around tunnels under train vibration load. Shi et al. [12] analyzed the wall side-displacement and adjacent surface settlement of the underground diaphragm wall project during the foundation pit construction process through numerical simulation methods. The results show that the load of the train has a significant effect on the settlement of the ground connection wall adjacent to the ground surface, and the range was about 1–10 mm. Meng et al. [13] studied the dynamic response of close-distance two-way tunnels under the action of train vibration. The results show that the dynamic response of the tunnel lining is the greatest when two trains pass at the same time. The maximum vibration displacement of 6.4 mm occurs near the middle area of the two-way tunnels. Wang et al. [14] established a three-dimensional analysis model through finite element software; they compared and analyzed the dynamic responses of soil and lining at different train speeds. With the increase in train speed, the dynamic stress and dynamic displacement of the tunnel structure and soil increased. Xiao et al. [15] took the first phase of Zhengzhou Metro Line 1 as the background to study the effect of the moving load of the train on the dynamic response and settlement of the soil layer around the tunnel under different speed conditions. The results show that the impact of the train vibration load in the silt soil layer on the soil layer around the curved tunnel was within 0–15 m at the bottom of the tunnel. Due to the limited available space under the city interior, most of the existing subway tunnels are double-track parallel. The dynamic response of tunnel structure and surrounding soil under two-way train vibration load has also been studied by many scholars. Lu et al. [16] analyzed the time-frequency and distribution of vertical acceleration on the ground under different train operating conditions. The results show that the vibration acceleration within 40 m of the central line of the two-way train changes more than that of the one-way train when the two-way train is running. Li et al. [17] established 3D finite element models of trains, tunnel linings, and saturated strata, and studied the ground dynamic response. When there is no difference in the vibration subsidence, the surface vibration velocity and acceleration response can reach 40 to 60 times that of the static state. Qu et al. [18] conducted on-site monitoring of the vibration source characteristics and propagation laws when a two-way train passes under an urban main road. The measurement shows that there was vibration amplification in the area close to the subway line, and the horizontal acceleration also increased. Yuan et al. [19] proposed an analytical solution for calculating half-space double tunnel vibration to evaluate the influence of the presence of adjacent tunnels on ground vibration. Wu et al. [20] discussed the influence of the train vibration load on adjacent tunnels under different buried depths of two-way tunnels through the proportional test model and discrete element method. He et al. [21] found that there is a strong dynamic interaction between adjacent tunnels by analyzing the soil vibration of different tunnel models under different loads. Zhou et al. [22] established an analytical model of the train track–double tunnel–soil system in a poroelastic half-space to study the train vibration of two parallel tunnels in the half-space. The results show that adjacent tunnels and water saturation have significant effects on soil vibration. Through the above analysis, it can be seen that the vibration of the train will cause the vibration of the tunnel structure and nearby buildings, and the vibration intensity is related to the running speed of the train. The vibration intensity caused by the two-way subway train is greater than that caused by the one-way subway train.
Most of the above studies are to analyze the dynamic response of tunnel structure, adjacent foundation pit, and surrounding buildings under the action of train dynamic load. Further research is needed on the ground dynamic response of the silt area under the action of train dynamic load, especially the research on the silt area in the Yellow River Region. This paper took Zhengzhou silt as an example, and a subway tunnel model was established by using FLAC3D finite difference method software. We input the exciting force function for the dynamic load of the subway train. Through the FISH language, we applied the dynamic load of the subway train to the tunnel structure, and monitored the vibration response and settlement of the ground surface under the action of the dynamic load. This paper studied the dynamic response mechanism of silt strata under the action of subway dynamic load. It is of great significance to the evaluation of subway operation status and the guidance of subway safe operation.

2. Materials and Methods

This paper studied the dynamic response mechanism of the silt strata in the Yellow River Region under the dynamic load of subway trains. In this paper, any constitutive model can be used when FLAC3D is used for dynamic calculation [23]. The parameters are also the ones corresponding to the static constitutive model. This simplified the calculation process.

2.1. Model Parameter Selection

According to the data from the engineering geological survey report in Zhengzhou, the groundwater was buried at a depth of 14 m. To simplify the calculation model, this paper divided the soil layer of the study area into four layers from top to bottom. The depth and parameters of the soil layer are shown in Table 1.
In this paper, we used the Mohr–Coulomb model in the soil constitutive model; the lining material was C50 concrete, and the elastic constitutive model was used. In FLAC3D, the command flow input soil parameters were bulk modulus K and shear modulus G. Therefore, the bulk modulus K and shear modulus G of the soil were needed, and can be obtained through Equations (1) and (2), respectively. The results are shown in Table 2.
K = E 3 1 2 μ
G = E 2 1 + μ
where K is the bulk modulus; G is the shear modulus; μ is Poisson’s ratio; E is elastic modulus.

2.2. The Establishment of Computational Model

The top vertex of the subway tunnel studied in this paper was 15 m away from the soil surface (Figure 1). The distance between the centers of the two-way tunnel was 10 m. The outer diameter of the lining segment of the subway tunnel was 6 m, and the inner diameter was 5.4 m. The inner lining was made of C50 reinforced concrete. According to the subsidence range of the stratum that may be caused by tunnel construction, the size of the model selected in this paper was 100 m × 50 m × 50 m (X, Y, Z). There were 150,000 elements and 158,886 nodes in this model.
According to the buried depth of the groundwater level in the study area of 14 m, we input the parameters into the model to obtain the cloud map of the pore pressure field, vertical stress cloud map, and lining force cloud map (Figure 2). The pore pressure field cloud map shows the value of the pore water pressure gradient below the groundwater level. In the vertical stress cloud map and the lining force cloud map, the lining was squeezed by the surrounding soil layer, and the tensile stress was near the midpoint of the top and bottom ends. The further into the surrounding soil layer, the tensile stress gradually weakened. Then, it was converted into compressive stress, and the stress of the two sides of the lining was compressive stress.

2.3. Boundary Conditions

The dynamic calculation in this paper was carried out on the basis of static calculation. This requires removing the original static boundary conditions on the model and applying static boundary conditions to the model. The static boundary condition is to set dampers in the normal and tangential directions of the model boundary to achieve the absorption of incident waves. Acceleration time-history and velocity time-history cannot be directly applied to static boundaries. This is because the force on the static boundary is calculated from the velocity component on the boundary. Continuing to apply the velocity load creates a conflict that will invalidate the static boundary. If the input dynamic load needs to be applied on the static boundary, the acceleration time-history and the velocity time-history need to be converted into the stress time-history through Equations (3)–(6) and then applied on the static boundary.
σ n = 2 ρ C p υ n
σ n = 2 ρ C p υ n
C p = K + 4 G / 3 ρ
C s = G / ρ
where σ n is the normal stress; σ s is the tangential stress; ρ is the density; C p is the wave velocity of the p wave; C s is the wave velocity of the s wave; υ n is the normal velocity time-history; υ s is the tangential velocity time-history; K is the bulk modulus; G is the shear modulus.

2.4. Damping Parameters

Vibration decays over time, and vibrational energy is transformed into other forms of energy. Damping refers to the gradual weakening of vibration caused by external or own factors, and its magnitude is quantified by the amount of damping.
The case of delay damping treats the soil as an ideal viscoelastic body, uses the delay characteristics of the soil to consume vibration energy, and is not related with the properties of the relevant materials. In the dynamic calculation, the delay damping satisfies the Masing double method, so as to construct the delay loop of the soil under the dynamic action. The material model that delay damping can be applied to is very wide. It can directly use the modulus degradation curve obtained from the dynamic test. In this paper, the default secant modulus degradation curve model of delay damping in FLAC3D was used in the dynamic calculation. The M s curve in the default model can be approximated by Equations (7)–(9).
M s = s 2 3 2 s
s = L 2 L L 2 L 1
L = log 10 γ
L1 and L2 are the two parameters of the default model, and L1 = −3.156, L2 = 1.904 [24].

2.5. Dynamic Load Input

Determining the vibration load of subway trains is the key to study the ground dynamic response and formation subsidence under vibration load. The dynamic load of the train comes from the impact of the train on the track, the wheel vibration, and the irregularity of the track caused by long-term operation, as well as the periodic exciting vibration caused by the eccentricity of the wheel. The load of the train is transmitted through the rails to the sleepers and then on. It can be represented by a simple excitation-like force that reflects its periodic characteristics. The vertical wheel-rail force generated by the train operation is mainly distributed in three frequency ranges: high, medium, and low. The high frequency of 100–400 Hz is generated by the movement of the wheel-rail contact surface against the rail. The intermediate frequency of 30~60 Hz is generated by the rebound effect of the unsprung wheel and rail mass on the rail. The low frequency of 0.5~10 Hz is generated by the relative movement of the car body to the suspension part. The dynamic load of the train can be simulated by the exciting force functions corresponding to the high, medium, and low frequency, and the track irregularity, additional dynamic load and the wear effect of the track surface wave. In the absence of on-site monitoring data, we used the exciting force function briefly described by Liang et al. [25] to express the train load.
F t = A 0 + A 1 sin ω 1 t + A 2 sin ω 2 t + A 3 sin ω 3 t
A i = M 0 α i ω i 2
ω i = 2 π υ / L i
where A 0 is the static load of the train; A i is the vibration load generated by the measured subway train from low speed to high speed; ω is the vibration frequency; t is the action time of the vibration load; α i is the geometric irregularity vector height corresponding to the non-stationary control condition (basic vibration amplitude of the railway track); M 0 is the unsprung mass of the train; L i is the wavelength of the geometric irregularity curve of the rail; υ is the speed of the train.
Bo et al. [25] obtained the exciting force waveform from Formula (10) by calculating the exciting force function of the high-speed train. The waveform diagram and the wheel-rail waveform diagram obtained by the simulation test are very close in terms of form and size. Through the dynamic finite element analysis of the high-speed railway subgrade, we applied the exciting force function to the rail, and measured the acceleration, velocity, and dynamic stress under the rail, the track bed, and the railway subgrade. These are consistent with the results in the existing studies [2]. Based on parameters of the B-type subway train, we calculated the pressure of the wheel load. The value was 70 kN with no-load of the train. According to the research by Liang et al., the unsprung mass of the train was 750 kg, and the wavelengths of the geometric irregularity sag and irregularity curve of the railway track corresponding to the non-stationary conditions were: L 1 = 10     m ,   α 1 = 3.5     m m ;   L 2 = 2     m ,   α 2 = 0.4     m m ;   L 3 = 0.5     m ,   α 3 = 0.08     m m . The speed of current trains was concentrated at 30–90 km/h. Therefore, this paper used three speeds as representative values to calculate the dynamic load. The values of subway operating speed υ were 30 km/h, 54 km/h, and 90 km/h, and were substituted into Equations (10)–(12), respectively. Then, we have the dynamic load expression of the train:
F t = 70 + 0.084 sin 1.8 π t + 0.240 sin 9 π t + 0.767 sin 36 π t
F t = 70 + 0.233 sin 3 π t + 0.666 sin 15 π t + 2.130 sin 60 π t
F t = 70 + 0.647 sin 5 π t + 1.849 sin 25 π t + 5.915 sin 100 π t
According to the calculation results of Equations (13)–(15), the loading curve is shown in Figure 3. It can be seen from Figure 3 that the excitation force load is an irregular load, and the peak value of the load changes constantly with the increase in the action time. With the increase in the train speed, the loading frequency of the dynamic load becomes denser, and the peak value becomes greater.

2.6. Distribution of Monitoring Points

This paper studied the dynamic response of the ground when the speed of subway trains was 30 km/h, 54 km/h, and 90 km/h, respectively. The duration of the dynamic load of the train was 1 s. The distribution of detection points set in the model is shown in Figure 4.

3. Results and Analysis

The dynamic load of the train is actually the process of the interaction between the wheels and the track during the operation of the train, and the train and the track form a complex vibration system. The vibration generated when the train is running was transmitted to the ballast bed through the rails. Then, the vibration was transmitted from the track bed to the tunnel structure and finally to the surface through the tunnel structure and the surrounding soil layer. Due to the existence of soil damping, the energy generated by vibration can be attenuated when it propagates to the surface.

3.1. Dynamic Response Analysis of One-Way Train Running

As shown in Figure 5, with the action of the train dynamic load, the stratum near the tunnel has the largest displacement response. The faster the speed, the greater the impact on the formation. The soil mass close to the top of the tunnel produces upward displacement. However, the displacement is small and will not cause damage to the soil, and the soil under the tunnel will vibrate. The maximum vibration trap values were 2.79 cm, 1.59 cm, and 1.02 cm when the speed was 90 km/h, 54 km/h, and 30 km/h, respectively. Therefore, the value of stratum vibration sink caused by train dynamic load increases with the increase in speed.
The four curves in Figure 6 represent the displacements at the surface monitoring points in Figure 4 according to the serial numbers, respectively. Under the same speed and the same action time, the vertical displacement at the monitoring point gradually decreases as the horizontal distance from the vibration source increases. In Figure 5, the displacement time-history curve shows that the soil layer will vibrate up and down under the action of the subway train. The ground monitoring point B shows that the maximum vertical displacements were 0.76 mm, 1.52 mm, and 1.84 mm when the speed was 30 km/h, 54 km/h, and 90 km/h. Therefore, under the action of the train vibration load, the vertical displacement of the ground surface above the tunnel will increase with the increase in speed.
The acceleration time-history curve shows that the acceleration response at the surface location lags behind the vibration load (Figure 6). When the speed of the train is 30 km/h, 54 km/h, and 90 km/h, the maximum acceleration responses are 2.59 m/s2, 5.12 m/s2, and 7.20 m/s2, respectively. Under the same speed and the same action time, the acceleration peak value of each monitoring point also gradually decreased with the increase in the horizontal distance. The greater the speed of the train, the greater the magnitude of the ground acceleration response.
The vertical displacement time-history curve shows that the vibration-sag values at the monitoring point E were 3.24 mm, 3.39 mm, and 3.60 mm under the action of the dynamic load of the train at different speeds, respectively (Figure 7). The acceleration response at monitoring point E was faster than that at the surface. The peak value was greater than that at the surface. When the speed of the train is 30 km/h, 54 km/h, and 90 km/h, the maximum acceleration responses are 3.20 m/s2, 7.40 m/s2, and 10.35 m/s2, respectively.

3.2. Dynamic Response Analysis of Two-Way Trains in Operation

The variation of stratum displacement is the same as that of the one-way train under the action of vibration, and the stratum displacement response near the tunnel was the greatest (Figure 8). The vibration trap values caused by the train were 2.95 cm, 1.62 cm, and 1.04 cm when the speed was 90 km/h, 54 km/h, and 30 km/h, respectively. The induced settlement increased as the velocity increased. The vibration trap value caused by the two-way train’s dynamic load was greater than that by the one-way train’s dynamic load.
The displacement time-history curve shows that Point C was located in the middle of the two-way tunnel at the surface (Figure 9). The vertical displacement of Point C was greater than that of the other three points. The vertical displacements of Point C reached 1.45 mm, 2.49 mm, and 3.04 mm when the speed was 90 km/h, 54 km/h, and 30 km/h, respectively. Point B is directly above the left tunnel, and the vertical displacement caused by vibration is also relatively large. When the train speeds are 30 km/h, 54 km/h, and 90 km/h, the maximum vertical displacement is 1.04 mm, 1.88 mm, and 2.28 mm respectively. The two points A and D were at the same horizontal distance as the action position of the vibration load, and their vertical displacement changes were basically close.
The acceleration time-history curve shows that the peak value of the acceleration time-history curve at Point C was the greatest among that of the four points A, B, C, and D located on the ground. In addition, the acceleration response at the ground was delayed. When the speed of the train was 30 km/h, the maximum acceleration response was 3.30 m/s2. When the speed of the train was 54 km/h, the maximum acceleration response was 6.10 m/s2. When the speed of the train was 90 km/h, the maximum acceleration response was 7.89 m/s2. The peak value of the acceleration time-history curve increases as the speed of the subway train increases. Under the same speed and the same action time, the peak value of the acceleration time-history curve decreases as the horizontal distance increases.
The vertical displacement time-history curve shows that the maximum values of the vibration trap at the monitoring point E at the tunnel interlayer were 3.25 mm, 3.30 mm, and 4.24 mm when the speed was 30 km/h, 54 km/h, and 90 km/h, respectively (Figure 10). Therefore, the vertical displacement of the tunnel interlayer will increase with the increase in speed under the action of the train vibration load. The settlement caused by the dynamic load of the two-way train was greater than that of the one-way train. The acceleration time-history curve at monitoring point E shows that the higher the speed is, the greater the peak value of the acceleration time-history curve is. The peak value of the acceleration time-history curve under the dynamic load of the two-way train was greater than that under the dynamic load of the one-way train. When the speed of the train was 30 km/h, 54 km/h, and 90 km/h, the maximum acceleration responses were 5.22 m/s2, 8.40 m/s2, and 26 m/s2, respectively. When the train running speed was 90 km/h, the peak value of the acceleration time-history curve caused by the dynamic load of the two-way train is twice that of the one-way train.
The vertical displacement time-history curves generated by the train vibration load at three different speeds all showed a downward trend in the later period. The energy generated by the vibration was decreased because of the damping effect in the soil, the degree of vibration to the soil is also gradually reduced, and the soil layer will gradually tend to a stable and compact state. Then, the vibration subsidence occurs. The vertical displacement of the ground monitoring point under the action of the dynamic load when the two-way train is running is greater than that when the one-way train is running.
There is a delay in the acceleration response of the ground. Under the dynamic load of one-way and two-way trains, the higher the speed is, the greater the peak value of the acceleration time-history curve is. However, the acceleration peak gradually decreased over time. Under the dynamic load of the two-way train, the peak value of the acceleration time-history curve was greater than that under the dynamic load of the one-way train.
Subway tunnels are expensive, difficult to be constructed, and with a long service life. To avoid stratum vibration subsidence caused by frequent and long-term action of train dynamic load, we carried out a vibration reduction design in both the tunnel structure and the train itself. When a subway tunnel is built, dampers can be placed around the tunnel. In addition, adding a protective layer on the basis of the lining segment in the tunnel or adopting methods such as rubber vibration damping pad floating slab integral track bed and steel spring floating slab track bed can prevent the vibration generated by the dynamic load of the train from being transmitted to the surrounding strata. This effectively avoids the damage to the subway tunnel structure because of the stratum vibration. Subway trains can use damped wheels with damping structures on the tires of the wheels. The mechanism is to use damping materials to convert the vibration energy of the wheel into heat energy for reducing vibration. The use of heavy-duty steel rails for the train track can not only enhance the stability of the track, but also reduce the impact load of the train. Placing damping plates with damping properties on the rails also has a certain damping effect. In the later stage of subway train operation, the tunnel structure and the train should be inspected and maintained regularly to achieve safe operation.

4. Conclusions

(1)
Under the action of train dynamic load, the stratum around the tunnel will produce vibration subsidence. When the subway train runs in one direction, the maximum vibration-sag caused by the train at the speed of 30 km/h, 54 km/h, and 90 km/h is 1.02 cm, 1.59 cm, and 2.79 cm, respectively. When the subway train runs in two directions, the maximum vibration-sag caused by the train at the speed of 30 km/h, 54 km/h, and 90 km/h is 1.04 cm, 1.62 cm, and 2.95 cm, respectively.
(2)
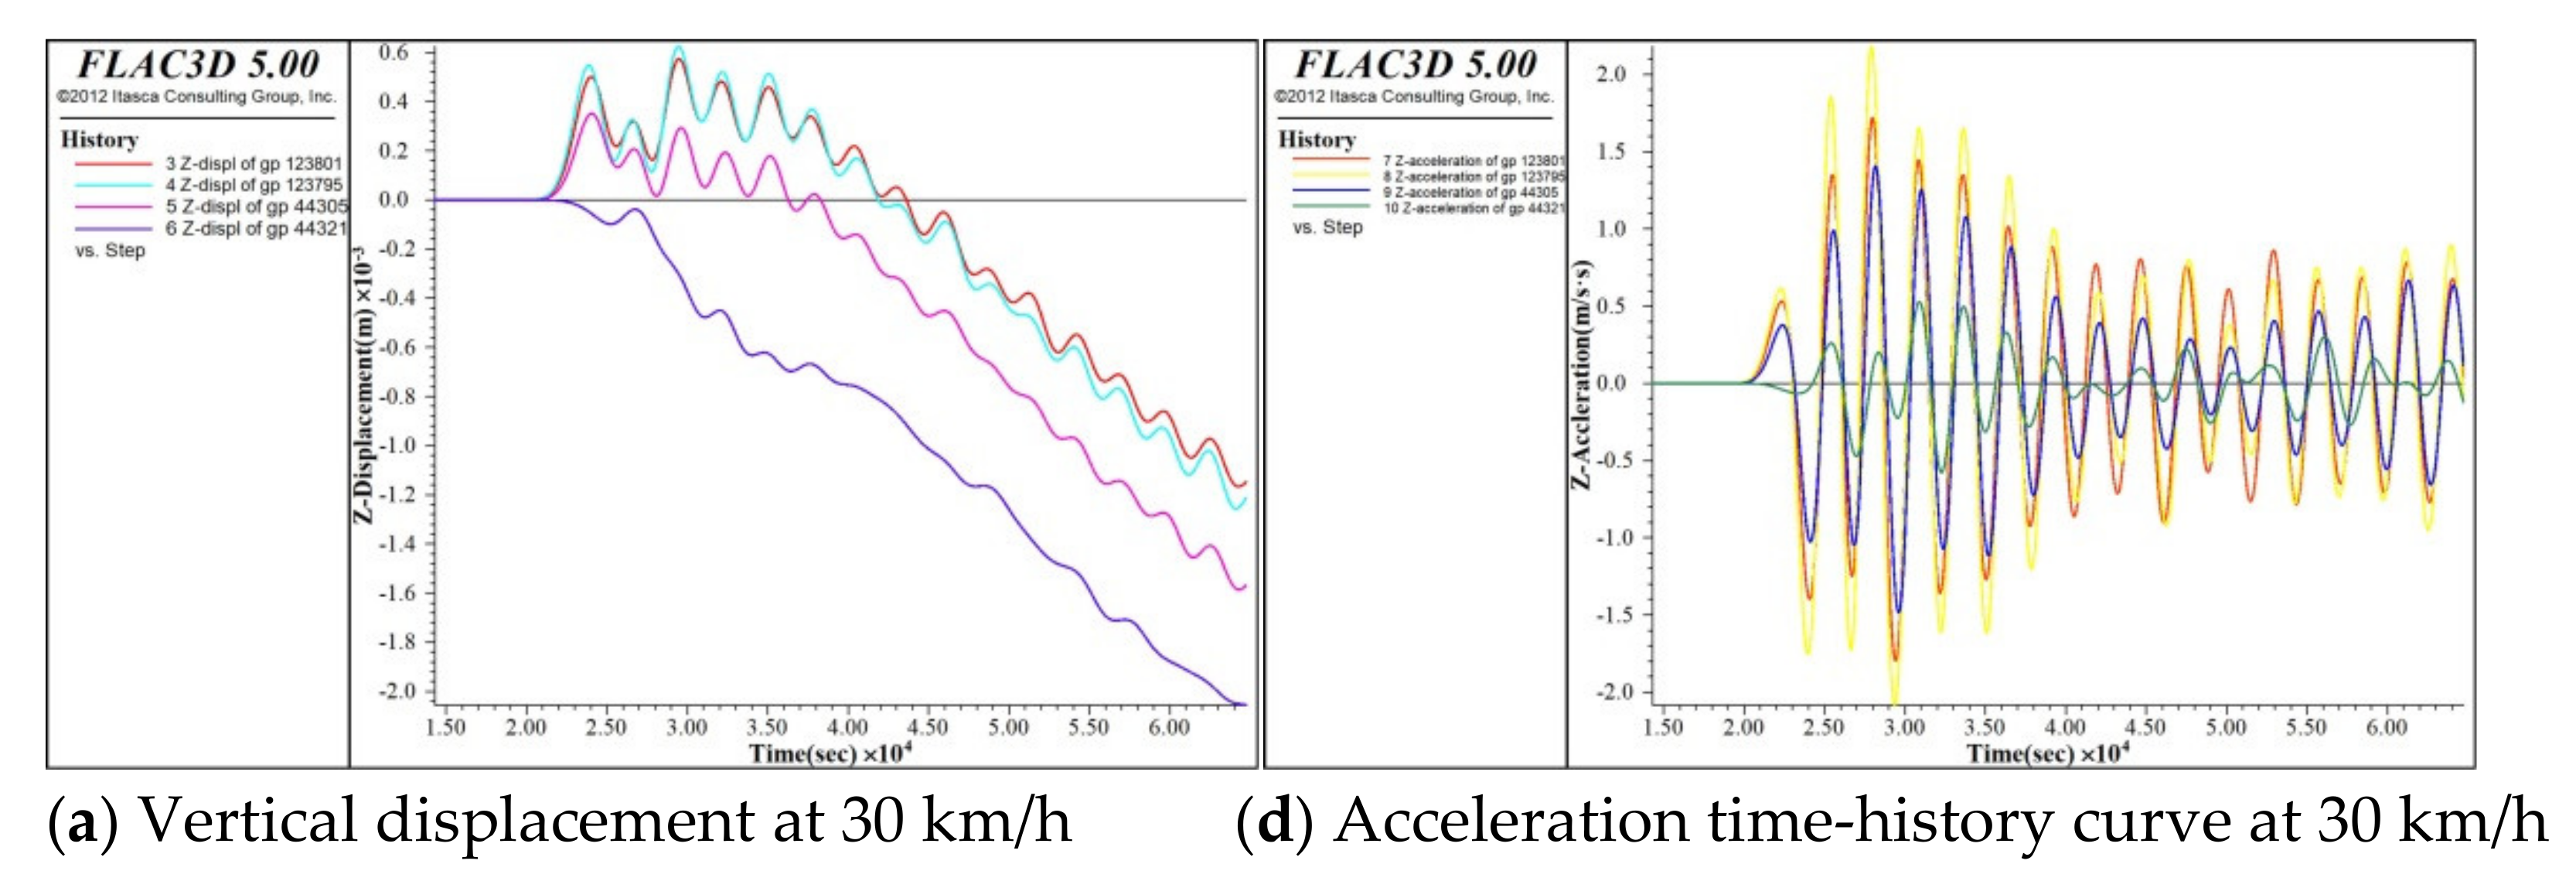
Under the action of train dynamic load, from the change trend of the displacement time-history curve, it can be seen that with the increase in train speed, the peak value of the displacement time-history curve also increases. With the increase in horizontal distance between surface monitoring points and vibration sources, the peak value of the displacement time-history curve decreases. When the speed of monitoring point B above the vibration source is 30 km/h, 54 km/h, and 90 km/h, the maximum vertical displacement caused by one-way running of the train is 0.76 mm, 1.52 mm, and 1.84 mm, respectively. The maximum vertical displacements caused by two-way running are 1.04 mm, 1.88 mm, and 2.28 mm, respectively. Compared with one-way train dynamic load, the vertical displacement caused by two-way train dynamic load is much larger.
(3)
Under the action of train vibration load, the acceleration response of the stratum around the tunnel lags behind. From the change trend of the acceleration time-history curve, it can be seen that acceleration response will be delayed for a period of time. When the train speed is 30 km/h, 54 km/h, and 90 km/h, the acceleration peaks are 2.59 m/s2, 5.12 m/s2, and 7.20 m/s2, respectively. The acceleration peaks of trains passing through the tunnel in two directions are 3.30 m/s2, 6.10 m/s2, and 7.89 m/s2, respectively. The faster the train runs, the greater the peak value of the acceleration time-history curve. The peak value of the acceleration time-history curve under bidirectional train vibration load is larger than that under unidirectional train vibration load. However, with the passage of time, the peak value of the acceleration time-history curve is gradually attenuating. Under the condition of the same speed and the same action time, the peak value of the acceleration time-history curve decreases with the increase in horizontal distance from the vibration source.
(4)
There is a lack of long-term measured data in the simulation of train dynamic load. This may result in the difference between the simulation and the real situation. This is the problem that needs to be solved in a future study.

Author Contributions

This paper was written by Z.G. in collaboration with all co-authors. Data was collected by H.W.; The first and final drafts were written by Z.G. and H.W.; The results were analyzed by Z.G. and M.Z.; The research and key elements of the models were reviewed by Z.L.; The writing work for corresponding parts and the major revisions of this paper were completed by Z.G. and Z.L. All authors have read and agreed to the published version of the manuscript.

Funding

This research was funded by the National Natural Science Foundation of China (Grant No. 41867039 and 41902266); Key R&D and Promotion Projects in Henan Province (tackling key problems in science and technology) (Grant Nos. 212102310964, 212102310275, and 222102320177), and the project was funded by key scientific research projects of colleges and universities in Henan Province (Grant No. 22A560019 and 22A560006); Postgraduate quality curriculum projects of Zhengzhou University of Aeronautics (Grant No. 2022YJSKC05).

Institutional Review Board Statement

Not applicable.

Informed Consent Statement

Not applicable.

Data Availability Statement

The research data of the paper can be obtained from Zhanfei Gu by email.

Conflicts of Interest

The authors declare no conflict of interest.

References

  1. Pan, C.S.; Xie, Z.G. Measurement and analysis of vibrations caused by passing trains in subway running tunnel. China Civ. Eng. J. 1990, 23, 21–28. [Google Scholar]
  2. Liang, B.; Cai, Y. Dynamic analysis on subgrade of high sped railway in geometric iregular condition. J. China Railw. Soc. 1999, 21, 85–87. [Google Scholar]
  3. MA, Z. The dynamiac response analysis of nearby existing line subway tunnel under train dynamic loads. J. Wuhan Univ. Technol. (Transp. Sci. Eng.) 2017, 41, 109–112+118. [Google Scholar]
  4. Zhu, S.Y. Research on liquefaction characteristics of shield tunnel passing through silt layers in different positions under strong earthquakes. Railw. Stand. Des. 2021, 65, 98–102. [Google Scholar] [CrossRef]
  5. Yang, W.B.; Li, L.G.; Shang, Y.C.; Yan, Q.; Fang, Y.; He, C.; Xu, Z. An experimental study of the dynamic response of shield tunnels under long-term train loads. Tunn. Undergr. Space Technol. 2018, 79, 67–75. [Google Scholar] [CrossRef]
  6. Zhang, Z.X.; Zhang, Z.Q. Research on dynamic response difference of soft base under dynamic load of different axle load trains. Sichuan Archit. 2021, 41, 51–53. [Google Scholar]
  7. Zheng, Y.C.; Yang, J.F.; Liao, B.L.; Ma, S.; Zhong, H.; Lei, J. Investigation on the concrete strength performance of underlying tunnel structure subjected to train-induced dynamic loads at an early age. Constr. Build. Mater. 2022, 337, 127622. [Google Scholar] [CrossRef]
  8. Fu, Z.F.; Zhou, W.S.; Zhu, Y.; Pan, H.B.; Luo, X.; Luo, X.D. Analysis on deformation of deep foundation pit and vibration isolation effect under the influence of train dynamic load. J. Fuzhou Univ. (Nat. Sci. Ed.) 2021, 49, 537–543. [Google Scholar]
  9. Li, S.Z.; Song, G.F. The influence of train dynamic load on the stability of adjacent foundation pit excavation. J. Shandong Agric. Univ. (Nat. Sci. Ed.) 2020, 51, 1085–1091. [Google Scholar]
  10. Degrande, G.; Schevenels, M.; Chatterjee, P.; Van de Velde, W.; Hölscher, P.; Hopman, V.; Wang, A.; Dadkah, N. Vibrations due to a test train at variable speeds in a deep bored tunnel embedded in London clay. J. Sound Vib. 2006, 293, 626–644. [Google Scholar] [CrossRef]
  11. Degrande, G.; Schillemans, L. Free field vibrations during the passage of a thalys high-speed train at variable speed. J. Sound Vib. 2001, 247, 131–144. [Google Scholar] [CrossRef]
  12. Shi, W.Q.; Yang, S.S.; Niu, S.Q.; Chen, H. Comparative analysis on disturbance effects of different simplified modes of train load on adjacent foundation pits. Min. Res. Dev. 2022, 42, 76–81. [Google Scholar]
  13. Meng, X.C.; Zhang, X.D.; Wu, L.; Zhu, H.J.; Li, Z.F. Analysis of the dynamic response of twin-tunnel rail sleepers and lining under the action of trains. Mod. Tunn. Technol. 2022, 59, 1–8. [Google Scholar]
  14. Wang, G.C.; Xu, Q.P.; Liu, Y.Y.; Hang, Z.Y.; Zhang, Y. Research on the dynamic response and long-term setlement of soft soil under metro loadings. J. Zhejiang Univ. Technol. 2022, 50, 186–191. [Google Scholar]
  15. Xiao, Z.R.; Wang, Y.G.; Zhang, W.C.; Ren, L. The effect of train load in silt formation on the settlement of curved tunnel. J. Liaoning Tech. Univ. (Nat. Sci.) 2021, 40, 327–332. [Google Scholar]
  16. Lu, D.C.; Ma, Y.D.; Wang, G.S. Numerical Study on Ground Surface Vibration Response under Train Load in Multi Adjacent Tunnels. J. Jilin Univ. (Earth Sci. Ed.) 2021, 51, 1452–1462. [Google Scholar]
  17. Shi, L.; He, J.; Huang, Z.; Sun, H.; Yuan, Z. Numerical investigations on influences of tunnel differential settlement on saturated poroelastic ground vibrations and lining forces induced by metro train. Soil Dyn. Earthq. Eng. 2022, 156, 107202. [Google Scholar] [CrossRef]
  18. Qu, S.; Yang, J.J.; Zhu, S.Y.; Zhai, W.; Kouroussis, G.; Zhang, Q. Experimental study on ground vibration induced by double-line subway trains and road traffic. Transp. Geotech. 2021, 29, 100564. [Google Scholar] [CrossRef]
  19. Yuan, Z.H.; Cai, Y.Q.; Sun, H.L.; Shi, L.; Pan, X. The influence of a neighboring tunnel on the critical velocity of a three-dimensional tunnel-soil system. Int. J. Solids Struct. 2021, 212, 23–45. [Google Scholar] [CrossRef]
  20. Wu, L.; Zhang, X.D.; Kuang, F.M.; Sui, J.; Xilong, Z.; Guo, H. Dynamic characteristics of adjacent tunnel and surroundings under the vibration of trains in the first tunnel with different buried depths. Arab. J. Sci. Eng. 2021, 46, 5105–5119. [Google Scholar] [CrossRef]
  21. He, C.; Zhou, S.H.; Di, H.G.; Yang, X. Effect of dynamic interaction of two neighboring tunnels on vibrations from underground railways in the saturated soil. KSCE J. Civ. Eng. 2019, 23, 4651–4661. [Google Scholar] [CrossRef]
  22. Zhou, S.H.; He, C.; Guo, P.J.; Di, H.; Zhang, X. Modeling of vehicle-track-tunnel-soil system considering the dynamic interaction between twin tunnels in a poroclastic half-space. Int. J. Geomech. 2020, 20, 04019144. [Google Scholar] [CrossRef]
  23. Peng, W.B. FLAC 3D Practical Tutorial, 2nd ed.; China Machine Press: Beijing, China, 2020. [Google Scholar]
  24. Chen, Y.M.; Xu, D.P. FLAC/FLAC3D Fundamentals and Engineering Examples, 2nd ed.; Water Resources and Hydropower Press: Beijing, China, 2013. [Google Scholar]
  25. Liang, B.; Luo, H.; Sun, C.X. Simulated study on vibration load of high sped railway. J. China Railw. Soc. 2006, 28, 89–94. [Google Scholar]
Figure 1. Schematic diagram of the subway tunnel model.
Sustainability 14 10335 g001
Figure 2. Model stress field cloud map.
Sustainability 14 10335 g002aSustainability 14 10335 g002b
Figure 3. Dynamic load waveform of subway train.
Sustainability 14 10335 g003aSustainability 14 10335 g003b
Figure 4. Distribution of monitoring points.
Sustainability 14 10335 g004
Figure 5. Vertical displacement cloud map of one-way train running.
Sustainability 14 10335 g005aSustainability 14 10335 g005b
Figure 6. Displacement time-history curve and acceleration time-history curve of surface monitoring point of one-way train running.
Sustainability 14 10335 g006aSustainability 14 10335 g006b
Figure 7. Displacement time-history curve and acceleration time-history curve of monitoring point at tunnel interlayer of one-way train running.
Sustainability 14 10335 g007aSustainability 14 10335 g007b
Figure 8. Vertical displacement cloud map of two-way train running.
Sustainability 14 10335 g008aSustainability 14 10335 g008b
Figure 9. Displacement time-history curve and acceleration time-history curve of surface monitoring point of two-way train running.
Sustainability 14 10335 g009
Figure 10. Displacement time-history curve and acceleration time-history curve of monitoring point at tunnel interlayer of two-way train running.
Sustainability 14 10335 g010
Table 1. The depth and parameters of the soil layer.
No.Soil LayerThickness
/m
γ /
(kN/m3)
c /
kPa
φ /
( ° )
E s /
MPa
μ
1Fill2.0018.5020.009.005.770.30
2Silty clay5.0019.7027.5023.0017.550.30
3Silt-15.0020.0018.0032.0018.000.30
4Silt-236.0010.0018.0032.0018.000.30
Table 2. Values of parameters in model.
No.Soil LayerElastic Modulus
/MPa
Poisson’s Ratio
μ
Volume Modulus
K /MPa
Shear Modulus
G /MPa
γ
(kN/m3)
1fill5.770.304.812.2218.50
2Silty clay17.550.3014.636.7519.70
3silt-118.000.3015.006.9220.00
4silt-218.000.3015.006.9210.00
5lining34,500.000.3019,166.6714,375.0025.00
Publisher’s Note: MDPI stays neutral with regard to jurisdictional claims in published maps and institutional affiliations.

