1. Introduction
Plants in controlled environments are grown in restricted root-zones that use liquid hydroponics or a soilless substrate irrigated with nutrient solution. The pinnacle of precision nutrition is to achieve long-term optimal nutrient balance with no leaching or discarding of nutrients to the environment. Completely closed systems eliminate nutrient discharge but require a refill/irrigation solution that replaces both the water and nutrients as they are removed by the plants.
Many hydroponic growers dump and replace nutrient solution at weekly intervals; growers using soilless media apply excess water and leach nutrients from containers, all in an effort to maintain optimal nutrition.
In hydroponic systems, water removed during transpiration is often replaced with deionized water without replacing the nutrients. Although the solution is eventually discarded and replaced, extrapolation of results from these systems is difficult because the nutrient concentrations are not steady state [
1].
Optimal nutrition in closed systems can be achieved throughout the crop life cycle when nutrient management principles are followed. This approach is based on measurements and modelling of water use efficiency (WUE) and tissue nutrient concentrations. The nutrients remain in leaves as water evaporates through transpiration. The desired concentration of each nutrient in the plant multiplied by the WUE determines the required concentration of each nutrient in the nutrient solution, assuming 100% water utilization.
This approach minimizes the need to monitor ions in the recirculating solution. We described this conceptual approach almost 20 years ago [
2], but have made many refinements since the original review and present them in this article.
2. Nutrient Management by Mass Balance
Optimal nutrient solutions can be developed using the principle of mass balance [
2,
3]. This is an application of the conservation of mass [
4] (
https://en.wikipedia.org/wiki/Mass_balance, accessed on 7 June 2022). Mass balance principles are widely used in analyzing complex environmental systems, but they have not been widely used in closed root-zone environments.
What has come to be called the “Hoagland solution” was originally developed by Hoagland and Snyder in 1933 [
5], refined by Hoagland and Arnon in 1938 [
6], and revised by Arnon in 1950 [
7]. Hoagland, Snyder, and Arnon are generally acknowledged as developing hydroponic solutions with ratios of nutrients based on nutrient ratios in plant leaves, but they recommend discarding and replacing the solution at weekly intervals to reduce the accumulation of salts. Hoagland Solution One is based on all nitrate nitrogen; Hoagland Solution Two includes a combination of nitrate and ammonium nitrogen [
8]. None of these solutions have incorporated the principle of mass balance to facilitate nutrient recycling.
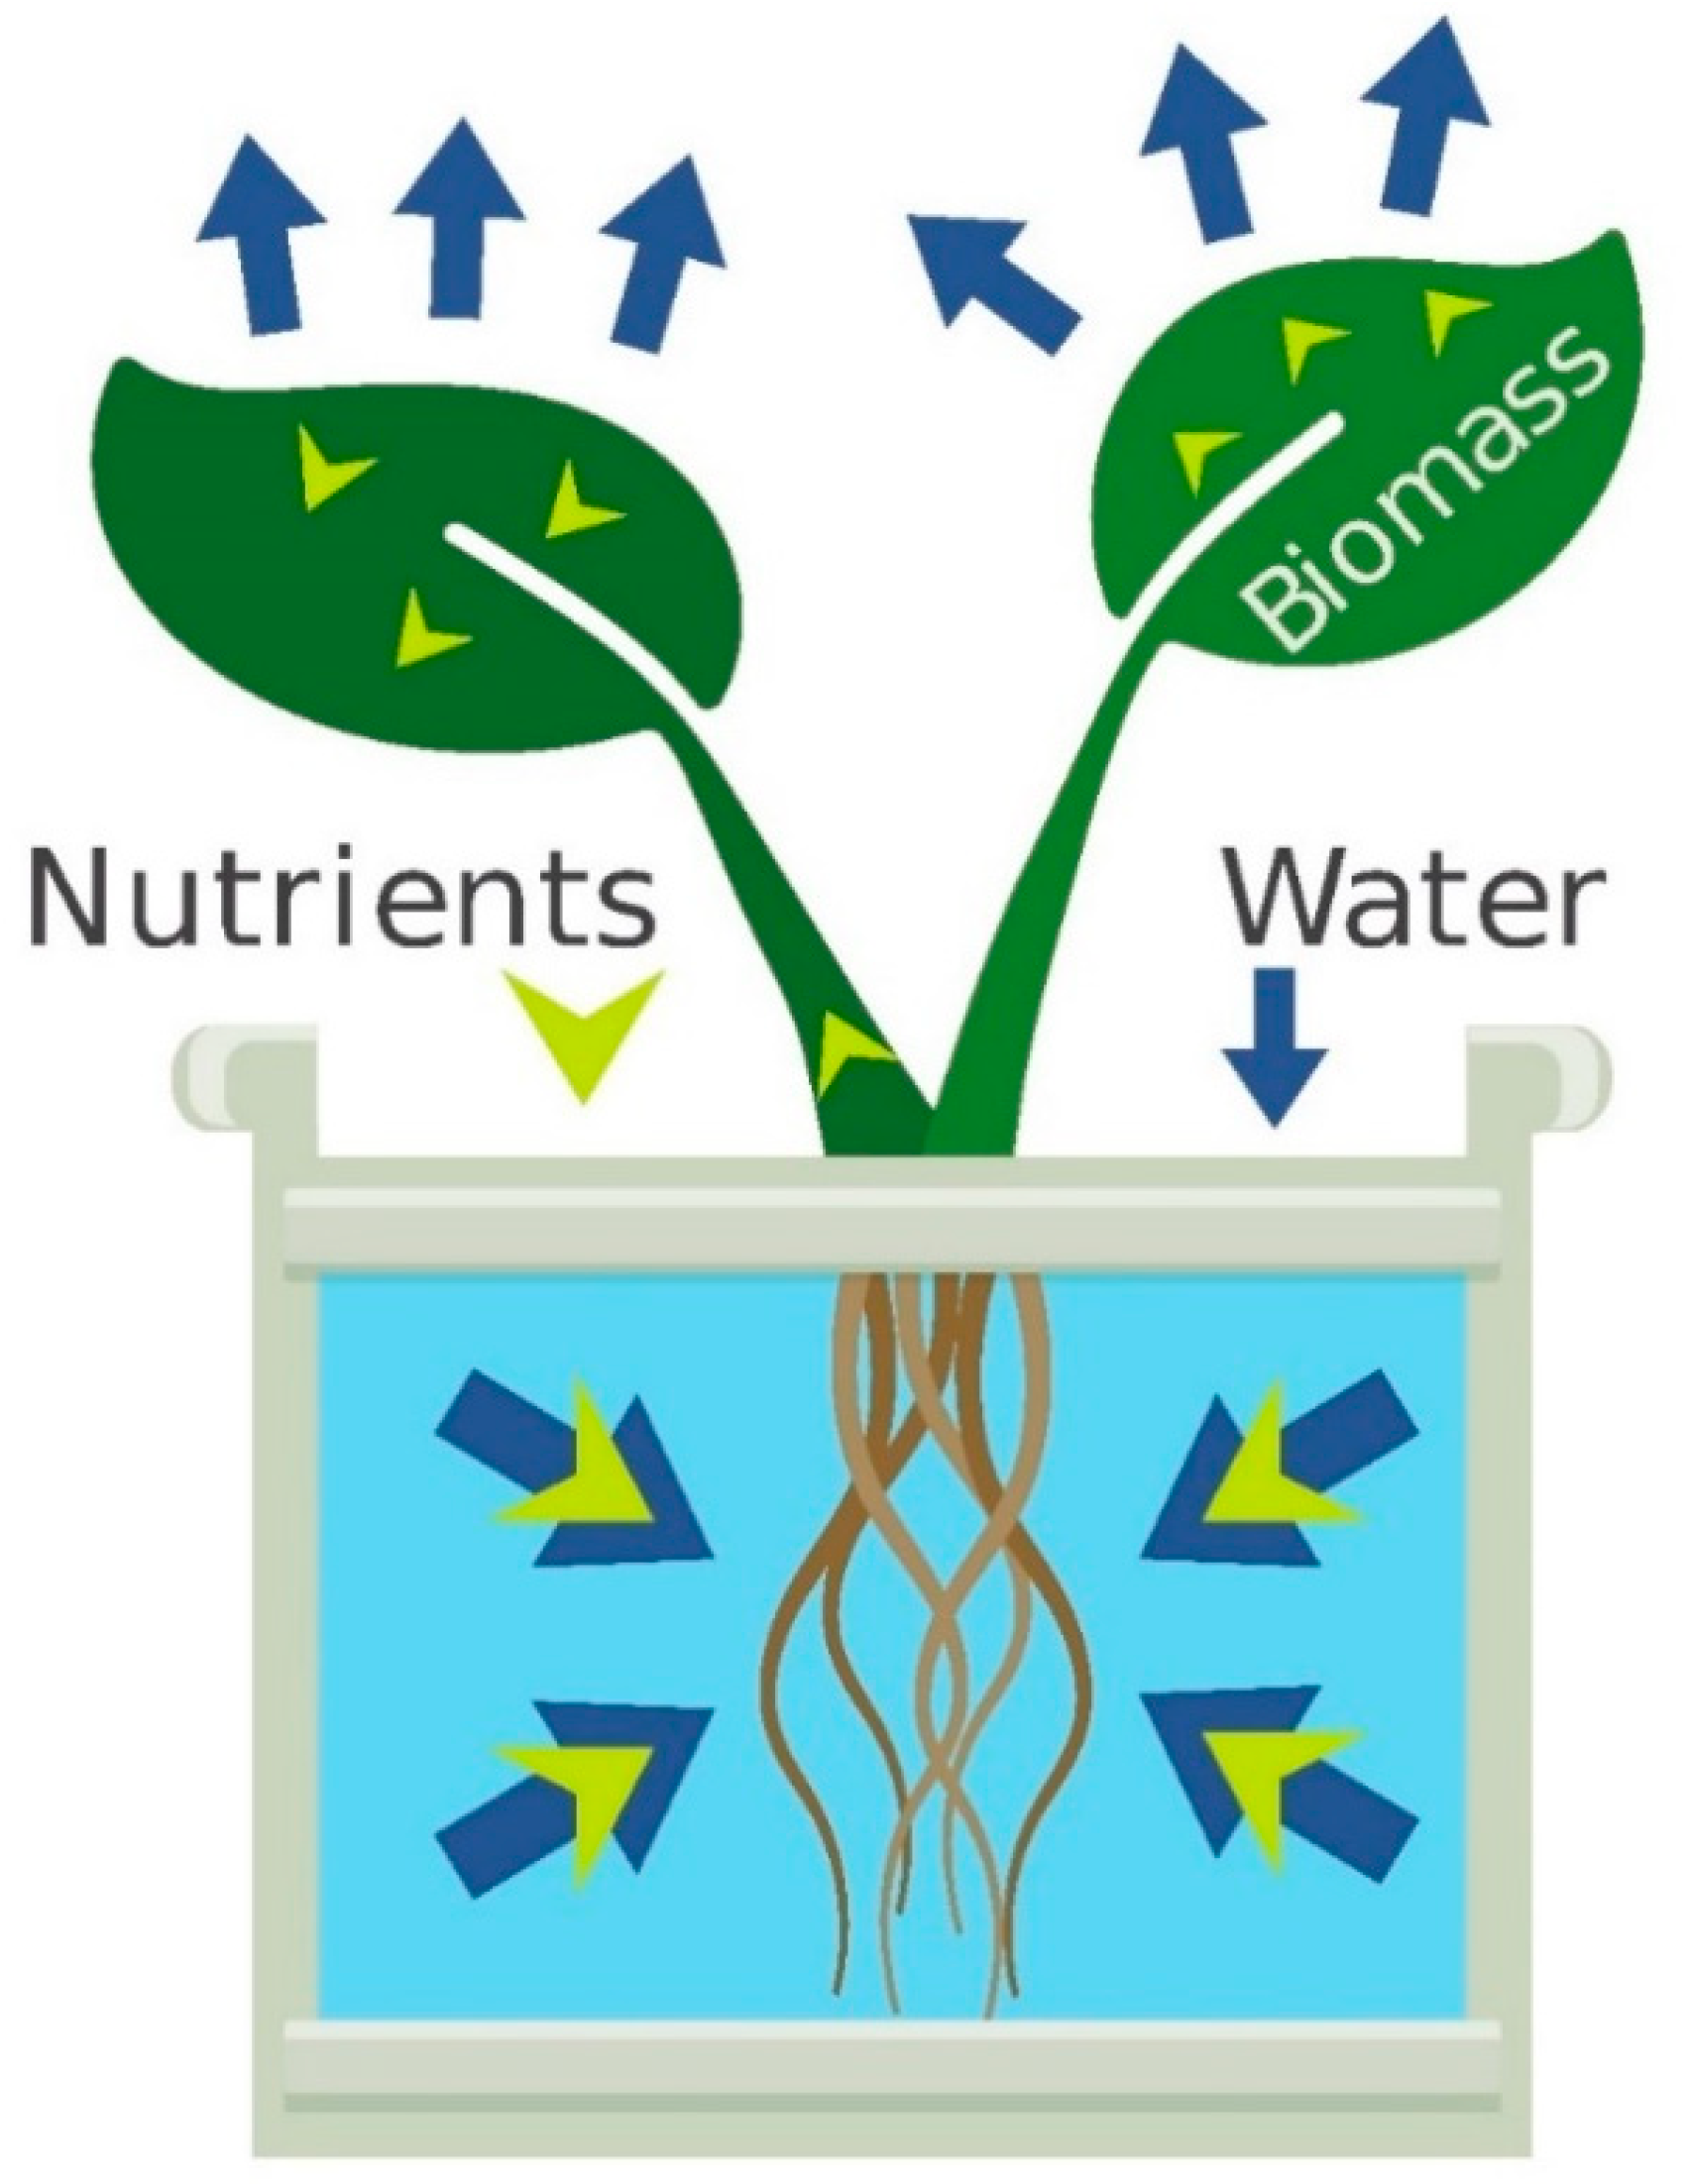
Mass balance means that nutrients in hydroponics are either in the nutrient solution or in the plant (
Figure 1). The potentially high cation exchange capacity of substrate components means that nutrients can be adsorbed and desorbed by the substrate, but the same principles apply.
2.1. Solution Concentration: The Importance of Water Use Efficiency
WUE is defined as biomass produced per unit of water transpired [
9,
10,
11]. WUE can be calculated by dividing the total dry mass of the plants at harvest by the cumulative volume of water added to the root-zone. WUE is determined by both the driving gradient for transpiration and by stomatal conductance. WUE ranges from 3 g of dry biomass per liter of water, with ambient carbon dioxide (CO
2) at 40% relative humidity, to 6 g of dry biomass per liter of water transpired in elevated CO
2 at 70% relative humidity [
12,
13].
Water moves into the roots and travels up the stem to the leaves, where it evaporates in transpiration through the stomata. The transpiration rate is partly determined by the vapor pressure deficit (VPD) in the air, which is the driving gradient for transpiration [
14,
15]. An increase in relative humidity from 40% to 70% decreases the VPD by 50%, and will decrease transpiration by 50% if there is no change in stomatal conductance or other environmental conditions. Air temperature indirectly affects the driving gradient for transpiration through changes in VPD.
WUE is also determined by changes in stomatal conductance. The effect of elevated atmospheric CO
2 on WUE is often not fully appreciated. Elevated CO
2 partially closes stomata, which decreases transpiration, increases growth, and increases WUE [
16]. Bugbee [
17] found that stomatal conductance can decrease by more than 30% as CO
2 concentration increases from 400 to 1200 ppm. In a comprehensive meta-analysis, Ainsworth and Rogers [
18] found that stomatal conductance decreased by 22% as the average CO
2 concentration increased from 366 to 567 ppm. Elevated CO
2 and high relative humidity, which are common in closed, controlled environments, can combine to increase WUE from 3 to 6 g L
−1. In practice, we typically measure a WUE of about 5 g per L at 1200 ppm CO
2 and 60% relative humidity (1.3 kPa VPD at 25 °C).
The WUE is reduced if there are evaporative losses from the media or solution. Surface evaporation in field environments can reduce WUE from 3 to 1 g L
−1 [
13]. In water-limited environments, drip irrigation is often used to minimize surface evaporation and improve WUE.
The bubbling associated with aeration causes an evaporative loss of water in hydroponics, but this loss is typically less than 5% of transpiration. If the air introduced for bubbling comes in at 40% relative humidity and leaves at 80% relative humidity at 25 °C, this is an increase in absolute humidity from 9 to 19 g of water per kg of air, an increase of 10 mg of water vapor per L of air at sea level. Evaporation associated with bubbling would thus remove 72 mL of water per day, at a flow rate of 5 L of air per minute and 40% ambient relative humidity. For a 50 L container, this is equal to 0.14% of the solution volume per day. This volume of water is accounted for in the determination of whole-plant WUE because the evaporative loss must be replaced with refill solution. The low evaporation rate in aerated hydroponics is part of the reason the WUE of hydroponically grown crops can be higher than container grown crops where significant amounts of water can evaporate from the media surface.
WUE is also altered by increased air velocity, which reduces the boundary layer and humidity at the leaf surface and can increase transpiration and decrease WUE [
19].
The photosynthetic photon flux density (PPFD) varies widely in controlled environments, but this has a small effect on WUE. Increasing photon flux increases photosynthesis and demand for nutrients, but simultaneously increases transpiration, so the WUE stays relatively constant [
20]. This means that the mass balance approach for nutrient management is self-correcting across cloudy and sunny days [
21].
WUE can also vary among species, but these differences are smaller than is often thought [
22]. When grown in equivalent conditions in a greenhouse environment in Logan, UT, USA, at ambient CO
2, we found that the WUE over the lifecycle of wheat (
Triticum aestivum), tomato (
Solanum lycopersicum), and lettuce (
Latuca sativa) was 3.5, 3.8, and 3.3 g L
−1, respectively. This WUE is representative of C
3 crops in this environment. C
4 crops (corn (
Zea mays), sorghum (
Sorghum bicolor), and sugarcane (
Saccharum officinarum)) are not widely grown in controlled environments, but they have about two-fold higher WUEs than C
3 species [
23,
24].
2.2. Measuring Water Use Efficiency
The WUE multiplier is best determined after harvest of a crop by dividing the total dry biomass by the cumulative water added. As a starting point, we have found that the WUE can be reasonably estimated from the average ambient humidity and CO2. The lowest WUE values have occurred in our greenhouse at 400 ppm CO2 and 40% relative humidity and have been 3 g L−1; the highest values, with CO2 enrichment and 70% humidity, can approach 6 g L−1. Nutrient concentrations can initially be based between these two environments and refined with each subsequent crop.
2.3. Optimal Nutrient Concentration in Leaf Tissue
Nutrient imbalances eventually become evident through visual symptoms, but tissue analysis provides a more definitive indication of nutrient status.
Thousands of empirical studies have been conducted to determine the optimal concentration of nutrients in the leaf tissue [
25,
26,
27,
28,
29]. A detailed and comprehensive summary of the early studies was published by Homer Chapman in 1963 [
30]. Additional summaries have been published by Robinson [
31] and Bennett [
32]. A thorough discussion of principles and a concise table of optimal nutrient concentrations is provided by Marschner ([
33], Table 11.5). Nutrient requirements are surprisingly similar across a wide range of species.
Plant dry biomass is 90 to 95% carbon, hydrogen, and oxygen; the remaining 5 to 10% is the mass of the 15 essential and beneficial elements.
2.4. Calculating Solution Concentrations
The concentration of the nutrient solution is calculated by multiplying the tissue nutrient concentrations by the WUE (Equations (1) and (2), and
Figure 2).
An example of calculating the concentration of nitrogen (N) in solution, assuming a desired 3% tissue concentration and 3 g L
−1 WUE, is shown in Equation (2).
The calculation is the same when the WUE is doubled from 3 to 6 g L−1, but the final solution concentration also doubles to yield 180 mg L−1 = 180 ppm N (12.8 mM N).
This same process can be applied to all nutrients to calculate the desired concentrations in solution (
Table 1).
2.5. Solution Examples
Examples of nutrient solutions for specific crops are available online [
34]. To facilitate making multiple types of solutions, we prepare molar stock solutions of the common nutrient salts (e.g., calcium nitrate, potassium nitrate, monopotassium phosphate, and magnesium sulfate) with concentrations that are 100 to 1000 times greater than the final solution. Each stock solution is diluted 1 to 10 mL per L into deionized water to prepare the final nutrient solution. This approach simplifies the development of solutions with concentrations in molar units.
Table 1.
An example of optimal tissue concentration values of most crop plants for all leaves (young and old) used for determining solution concentration for each nutrient with low (3 g L−1) and high (6 g L−1) water-use efficiency (WUE). The final two columns show the hydroponic solution currently used by Utah State University (USU). The footnotes describe the reasons for deviation from the calculated minimum solution concentration.
| Nutrient | Optimal
Leaf
Tissue
Concentration | Calculated
Solution Concentration
----Water Use Efficiency---- | USU Hydroponic Solution |
|---|
| ----Water Use Efficiency---- |
|---|
| 3 g per L | 6 g per L 1 | 3 g per L | 6 g per L 1 |
|---|
| Macro | (%) | ---------- (mg per L; ppm) --------- | ---------- (mg per L; ppm) --------- |
| N | 3 | 90 | 180 | 101 2 | 202 |
| P | 0.4 | 12 | 25 | 12 | 25 |
| K | 4 | 117 | 235 | 117 | 235 |
| Ca | 1.5 | 44 | 88 | 60 | 120 |
| Mg | 0.5 | 15 | 29 | 19 | 39 |
| S | 0.5 | 16 | 32 | 26 | 51 |
| Si | 0.5 3 | 14 | 18 | 17 | 34 |
| Micro | (mg per kg; ppm) | | |
| Fe | 100 | 0.3 | 0.6 | 0.4 | 0.8 |
| B | 50 | 0.15 | 0.3 | 0.4 | 0.9 |
| Mn | 50 | 0.15 | 0.3 | 0.2 | 0.3 |
| Zn | 50 | 0.15 | 0.3 | 0.2 | 0.4 |
| Cu | 10 | 0.03 | 0.06 | 0.1 | 0.3 |
| Cl | 100 | 0.3 | 0.6 | 1.2 | 2.5 |
| Mo | 0.001 | 2.9 ppt 4 | 5.8 ppt | 9.6 ppb 4,5 | 19 ppb |
| Ni | 0.000001 | 0.003 ppt 4 | 0.006 ppt | 5.9 ppb 4,5 | 12 ppb |
If nutrient solution concentrations are in mass units (ppm) the calculations are often more complicated. The software program HydroBuddy (
https://github.com/danielfppps/hydrobuddy, accessed 7 June 2022) is designed to facilitate the development of nutrient solutions based on common fertilizer salts. The software calculates the mass of each salt necessary to make a desired final solution. It works particularly well with fertilizer injectors and continuous liquid fertilizer application in soilless media.
2.6. Example Calculations for Low and High WUE
Table 1 shows the calculations for each nutrient at the highest and lowest WUEs. An equivalent table with molar units is provided in
Supplementary Information 1. The optimal leaf tissue concentration is typical for most species; values can be adjusted as needed for specific species.
Several adjustments to the calculated values in
Table 1 are made to the USU Hydroponic Solution [
34] to improve nutrient availability and uptake.
Values for N are adjusted to account for N from the pH control system.
Phosphorus and Potassium are not adjusted.
Calcium (Ca) is high to provide ample Ca for lettuce, which is susceptible to tipburn.
Magnesium (Mg) is high to provide ample Mg for lettuce, which typically has about 50% of the desired level in leaves (0.2% typical vs. 0.5% optimal).
Sulfur (S) is high because it is an anion carrier for cations. Higher levels of SO42− are rarely toxic.
Iron (Fe) is chelated with diethylenetriaminepentaacetic acid (DTPA) to ensure solubility at higher pH levels (see section on chelates and iron). Fe is higher than the minimum to provide ample Fe for sensitive crops.
Boron (B) is high to provide ample B for lettuce. At the same WUE, lettuce commonly has tissue concentrations of 20 ppm B compared to 80–100 ppm B in tomatoes. The optimum leaf concentration is considered to be 20 to 80 ppm for both species, so plant uptake from this high level of B in solution is barely adequate for lettuce and is on the high end for tomatoes. The concentration of B in solution increases throughout the lifecycle of lettuce, indicating that lettuce absorbs B more slowly than tomato [
36].
Manganese (Mn) is chelated with ethylenediaminetetraacetic acid (EDTA) to minimize precipitation as manganese oxides.
Zinc is elevated by 33% to provide ample Zn for sensitive crops.
Copper is chelated with EDTA to minimize precipitation with phosphates. Copper concentration is four times higher than necessary to inhibit bacterial and fungal diseases in hydroponic solutions (see section on copper). Peat moss and coco coir bind up to 18 mg of Cu per g of substrate [
37], so Cu can be increased further in these soilless substrates without plant tissue toxicities, but these higher rates do not always provide reliable inhibition of diseases.
Chlorine is higher than necessary because of its inclusion as a balancing anion for the required cations.
Molybdenum (Mo) and nickel (Ni) are higher than necessary to provide ample Mo and Ni, and because of ease of preparation of the small amounts in the stock solutions. These elements rarely accumulate in solution and are not toxic at these trace levels.
2.7. Mass and Molar Units for Solution Concentrations
Nutrient concentrations in solution are usually given in mass units. Elements in solution react on a molar basis. The amount of N on a molar basis is greater than the sum of all other elements. One mole of Ca precipitates with one mole of sulfate. Electrical conductivity and charge balance are based on moles of charge [
38]. One mole of Fe is bound by one mole of chelate. The concentration of boron exceeds iron on a molar basis. For this reason, it helps to be “bilingual” in discussing units for nutrient concentrations in solution. To facilitate this thinking, a version of
Table 1 in molar units is included as
Supplementary Information 1.
2.8. Mass Balance Recovery at Harvest
The mass balance approach assumes that nutrients are not lost by precipitation and that there is a high recovery of nutrients over the life cycle. Nutrient additions over the life cycle should be equal to the sum of nutrients in the plants and solution at harvest. It is helpful to determine nutrient recovery in long-term studies. This relies on accurate measurement of nutrients in both plant tissue and in solution (see section on leaf tissue analysis).
Lettuce grown in a deep-water culture (DWC) system can have high recovery for most nutrients (
Table 2). A recovery greater than 100% indicates contamination or analytical error. Even with chelated Fe, Fe frequently precipitates and typically has lower recovery.
Without chelation, Mn can have a low recovery in hydroponic systems due to a high oxidation reduction potential and subsequent precipitation as Mn oxides [
39], which are unavailable for plant uptake (see review by Alejandro et al. [
40]). In a comprehensive analysis of Mn solubility in natural waters, Hem [
41] found that the Mn
2+ ion frequently oxidizes to Mn
3+ and subsequently to manganese oxides. Aerated hydroponic solutions can have a standard hydrogen electrode potential of 500 mV which translates to a redox potential of 700 mV. At these redox potentials, Mn starts to precipitate above a pH of about 6 (see diagrams in [
41]). For this reason, we now use Mn-EDTA to maintain solubility.
Lettuce is a short-term crop (30 days), and the large volume to cultivation area (V:CA) ratio of the DWC system means that most nutrients with intermediate uptake and all nutrients with passive uptake remain in the nutrient solution.
2.9. Adjusting for Nutrient Concentrations in Stems and Roots
WUE values are based on total plant mass, which includes fruits, stems, and roots. These plant parts can have lower nutrient concentrations than leaves. This means that the nutrient calculations can overestimate actual nutrient needs of the whole plant biomass. In plants with a significant fraction of stem mass, the refill solution can thus be decreased in the later part of the life cycle. If no adjustment is made, the nutrients added to the solution tend to exceed plant requirements. We have, however, not found this change to be necessary in tomatoes, which continue to have significant fruit and stem biomass during the second half of the life cycle.
2.10. Precision Nutrient Delivery to Enhance Quality and Morphology
N and P concentrations are sometimes reduced to enhance visual appearance of the plant, even at the cost of maximum growth rate.
Reduced N is used to decrease leaf size in crops such as gerbera, geranium, and primula. Although 3% N in leaves is typically adequate for maximum growth, a lower N concentration can result in more compact growth with a minimal reduction in yield [
42].
Similarly, reduced delivery of P can decrease stem elongation [
43]. For floriculture crops, height control is essential because shipping efficiency decreases as plant height increases. Reducing the concentration of P from about 15 to 8 ppm is commonly used for small seedlings and vegetatively propagated plants. For larger floriculture crops grown for flowering, a P concentration of less than 14 ppm (at ambient CO
2) helps promote compact growth.
High nutrient concentrations have been used to make the osmotic water potential more negative in solution, which can reduce vegetative growth and improve fruit quality. However, high nutrient levels have significant potential to result in toxic accumulation in leaves. High salinity from Na reduces growth of most crops, but elevated K in tomato can lead to higher quality and better-tasting fruit [
44].
3. Differential Rates of Nutrient Uptake
Frequent monitoring of individual nutrients in solution is often recommended, but the need for monitoring can be minimized by deriving a refill solution using the mass balance principles. Monitoring approaches usually attempt to maintain the concentration of each nutrient in solution. However, rapidly growing plants are hungry for nutrients with active uptake. They will continue absorbing nutrients with no sense of when to stop. If the nutrient concentration is maintained at initial levels, the plant will continue absorbing them, sometimes to toxic levels [
45]. Loneragan et al. [
46] found that excess phosphorus (P) can induce deficiencies in other nutrients, such as iron (Fe) and zinc (Zn). Parry and Bugbee [
47] found excessive P in nutrient solutions can also precipitate Fe, even with ample Fe chelation.
Nutrients can be divided into three uptake categories: active, intermediate, and passive (
Table 3). Nutrients with active uptake are rapidly removed from solution, and frequent replenishment can result in excessive uptake [
48]. Nutrients with passive uptake are taken up at the same rate as water, and their concentrations remain close to their initial level [
49]. Nutrients with intermediate uptake can be taken up faster than water but at lower rates than those with active uptake.
An understanding of uptake rate is essential for interpreting the concentration of nutrients in solution [
2]. Nutrients with active uptake are typically at extremely low levels, even with high concentrations in the refill solution. This indicates a healthy, actively growing crop. The appropriate nutrients are added with the refill solution.
Bugbee [
2] appears to be the first to include Mn among the nutrients with active uptake, but its rapid uptake has not been widely reported. The active uptake of Mn is based on its rapid disappearance from solution and the resulting high concentration in leaf tissue. Castaings et al. [
50] indicated that active Mn
2+ uptake may be accomplished by the transporter IRT1. Mn uptake and acquisition were recently reviewed by Alejandro et al. [
40].
Mn availability increases as pH decreases. The concentration of Mn must be maintained at low levels in the root zone to avoid toxic levels in the leaf tissue. Multiple studies have found Mn levels above 500 mg kg
−1 (500 ppm) in leaf tissue [
51,
52], which is associated with necrotic lesions on the leaves. Maintaining a root-zone pH of 6 to 6.5 can minimize Mn toxicity.
3.1. Uptake of Nitrate and Ammonium
N is taken up from solution faster than the sum of all other nutrients [
53,
54], and it is the only nutrient taken up as both a cation (ammonium, NH
4+) and anion (nitrate, NO
3−) [
55]. The uptake of these two ions alters pH due to the principle of charge balance [
33]. NO
3− uptake causes hydroxide ions to be released (or protons to be absorbed), which raises the pH. NH
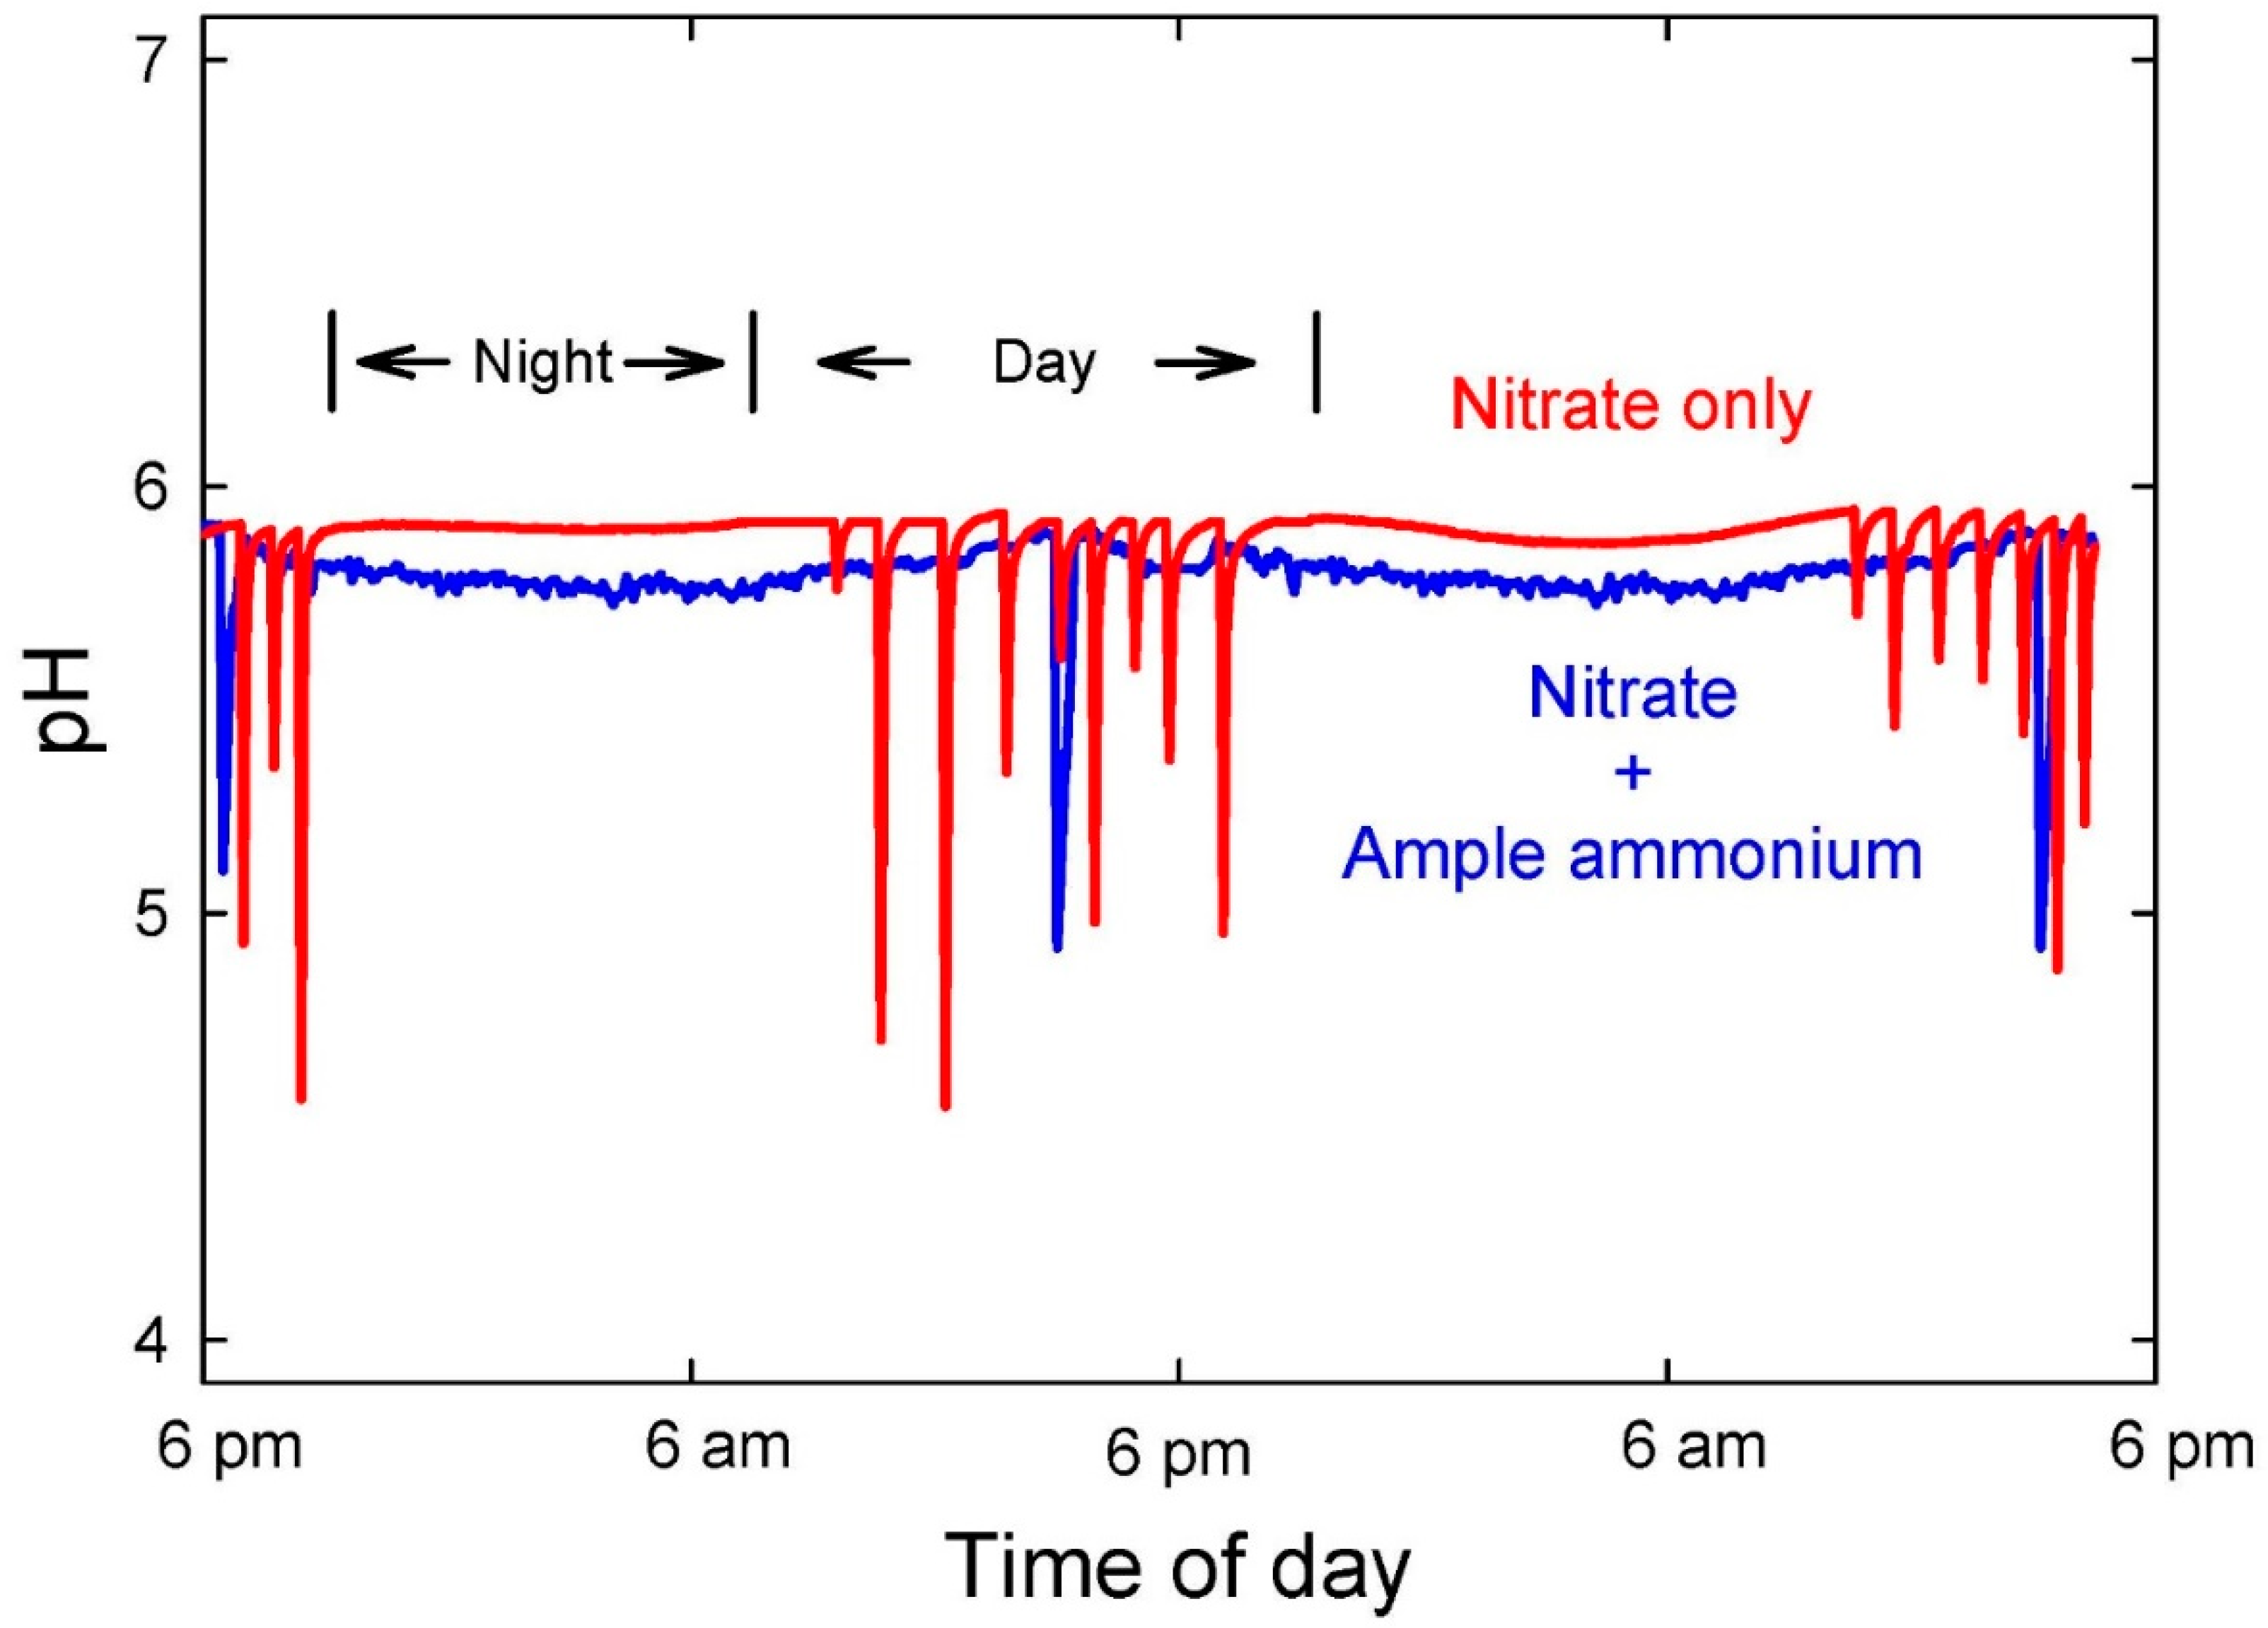
4+ uptake releases protons, which lowers the pH. It is possible to stabilize pH by controlling the concentration of these two ions in solution (
Figure 3), but NH
4+ is taken up 100 to 1000 times faster than NO
3− [
56], and an elevated concentration of NH
4+ thus causes a rapid pH decrease [
57]. With most species, we have found that the NH
4+ concentration must be maintained at micromolar concentrations with millimolar concentrations of NO
3− to stabilize pH in systems without a solid substrate. NH
4+ must be added in frequent small amounts in liquid hydroponic solutions that have low buffering capacity.
Excessive uptake of ammonium can inhibit the uptake of other cations. For this reason, maintaining ammonium at consistent low levels usually results in balanced nutrient uptake and optimal growth.
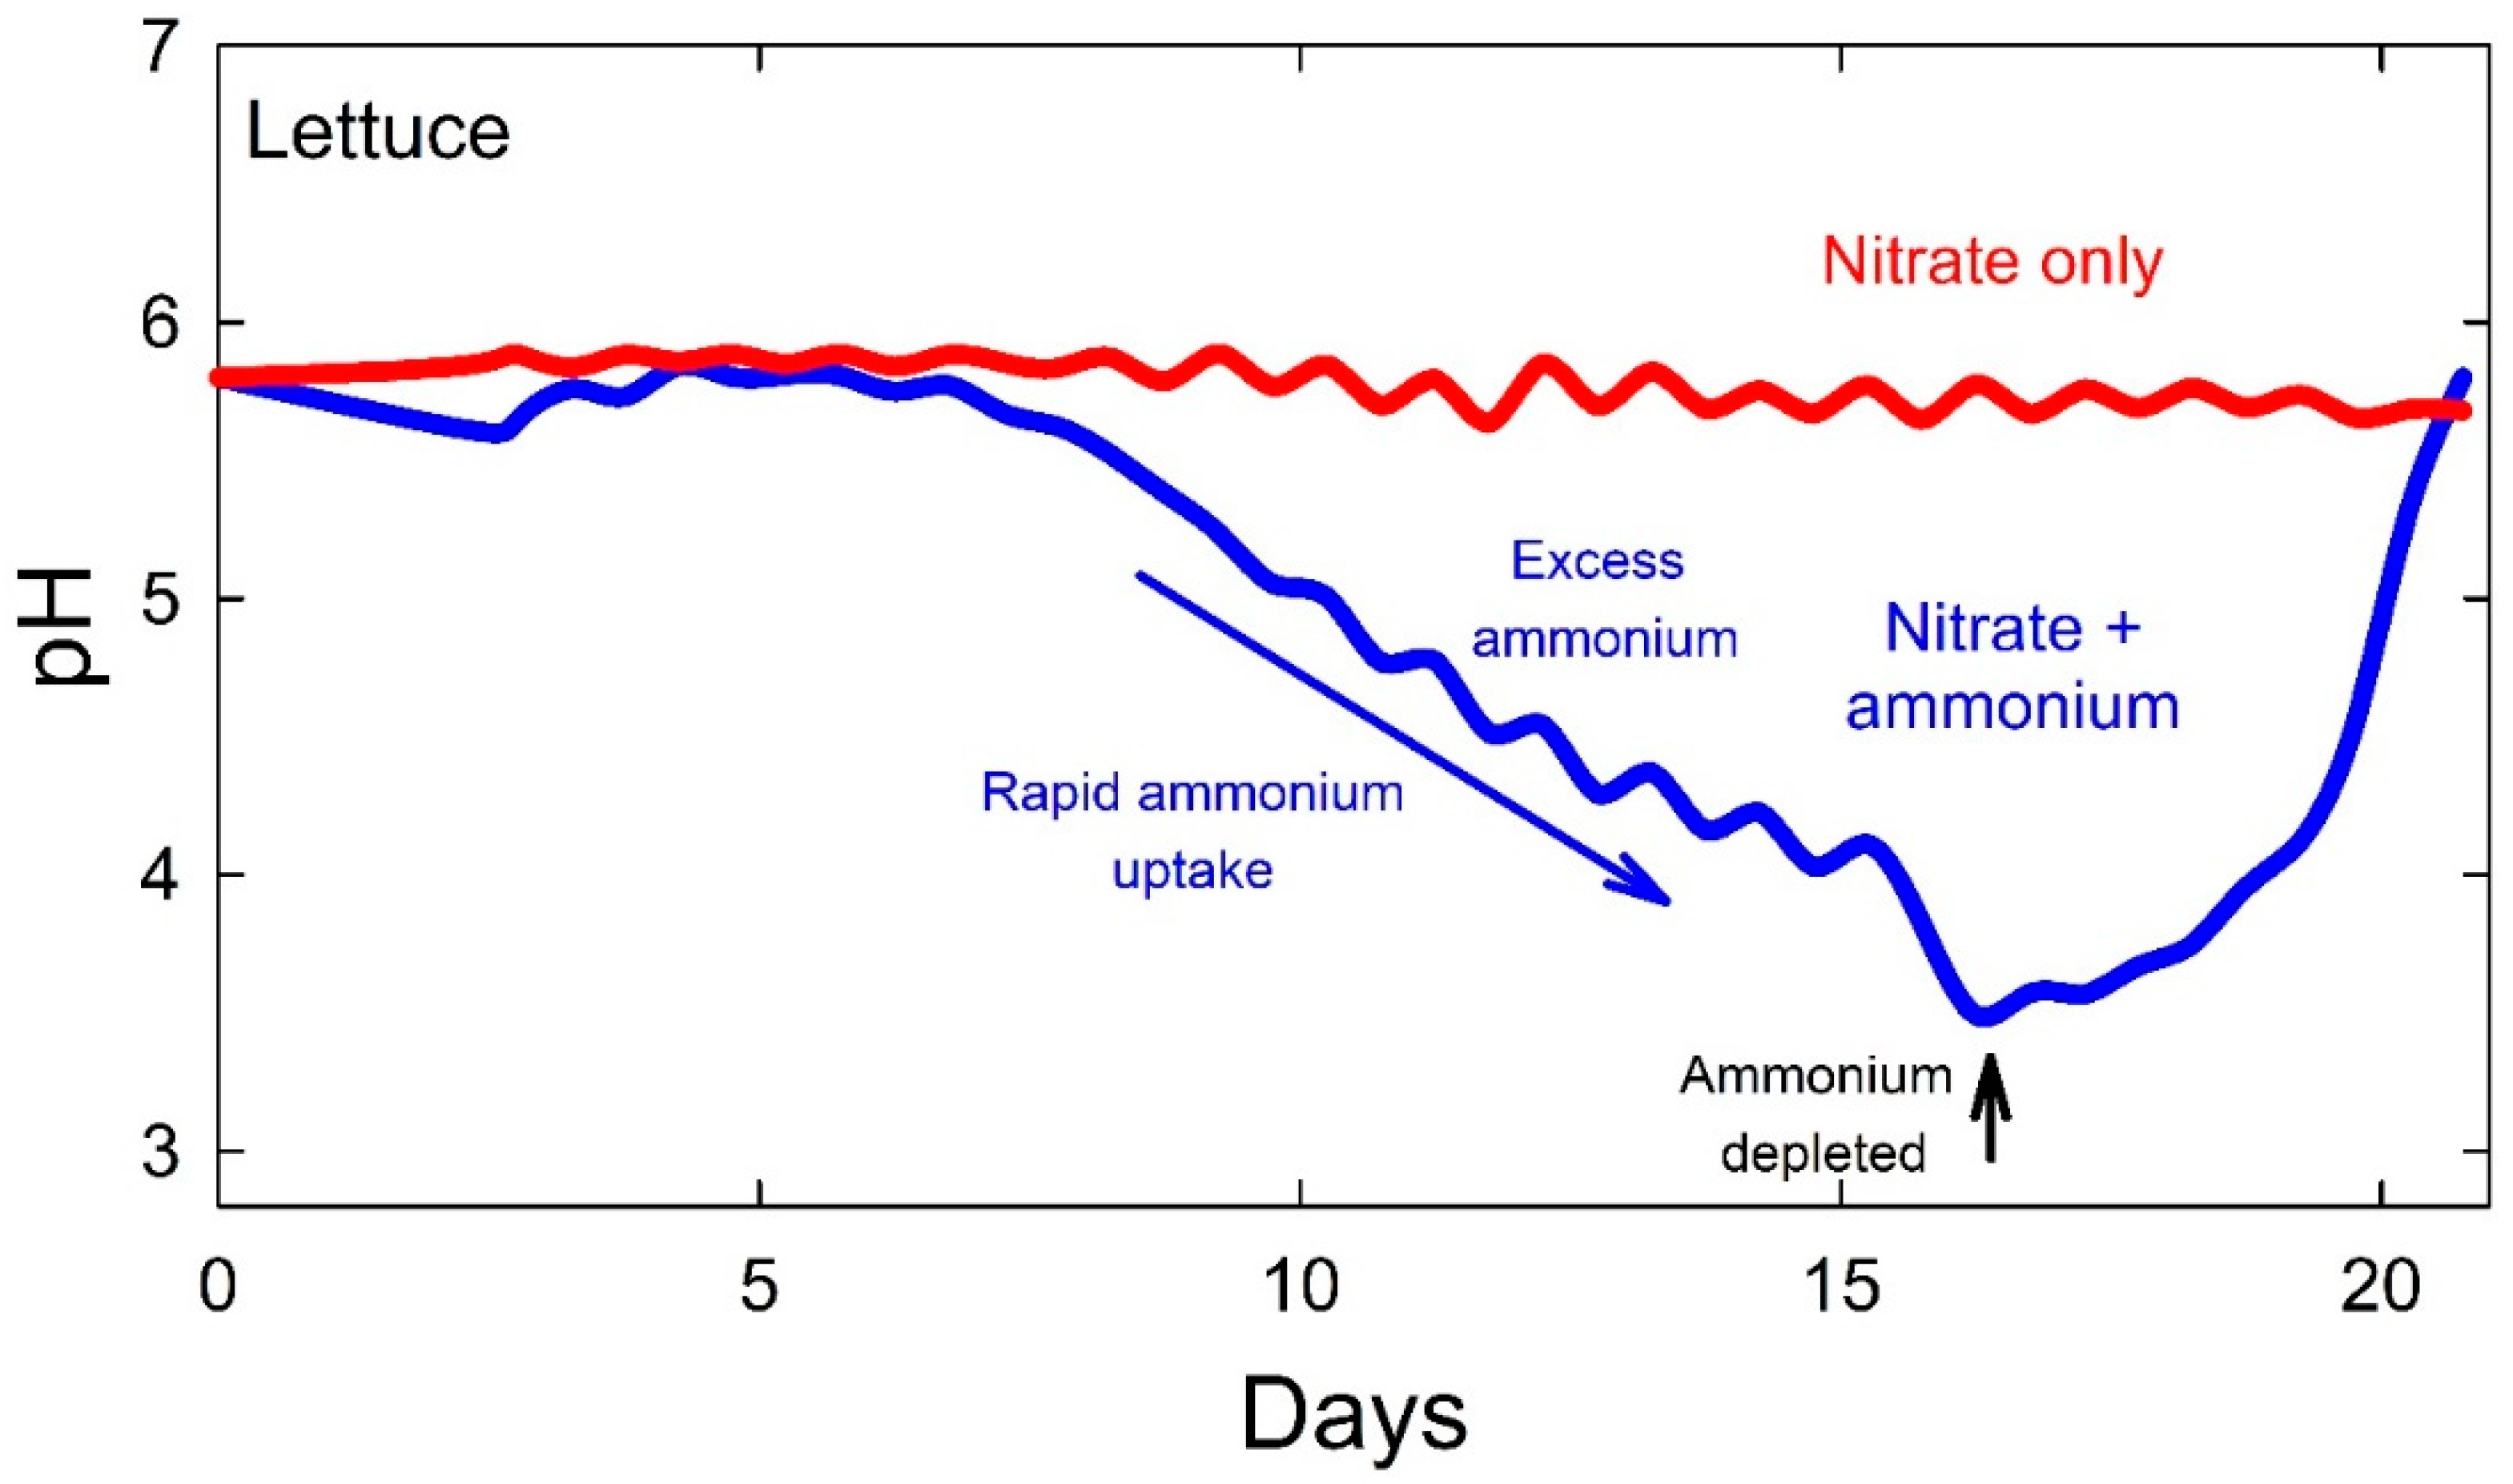
Excessive NH
4+ in solution can decrease pH below 4 (
Figure 4), which causes increased solubility of metals in soilless media, resulting in excessive uptake and potential toxicity. The pH typically increases due to predominance of NO
3− uptake after the NH
4+ has been absorbed. For most crops, including lettuce, tomato, wheat, and petunia, the NO
3− to NH
4+ ratio in the hydroponic solution must be at least 20:1 to avoid decreasing pH.
Plants typically grow better if both N forms are provided. With rigorous pH control, we have grown lettuce with up to 50% NH
4+ and wheat with up to 85% NH
4+ [
58,
59]. However, high NH
4+ typically reduces calcium uptake [
56], which can accentuate calcium transport-related diseases (e.g., tipburn in lettuce and blossom end rot in tomatoes). The effect of the NO
3− to NH
4+ ratio on pH is not uniform among species; lettuce, tomato, wheat, and petunias require more NH
4+ to balance pH than geranium [
60] and impatiens [
61].
The effect of the NO3− to NH4+ ratio on pH can be less significant in soilless substrates, because of the buffering capacity of the substrate and increased microbial nitrification of the NH4+.
3.2. Urea in Hydroponics
Urea absorption by plants is slow compared to NO
3− and NH
4+, and it is usually microbially converted to NH
4+ in solution before uptake. Urea is the most widely used N source in field agriculture, but it is rarely used in hydroponics because of the difficulty of controlling hydrolysis (conversion of urea to NH
4+). Urea hydrolysis to NH
4+ results in a net production of one hydroxide ion per urea molecule [
62], which causes an initial pH increase, but this is later reversed as subsequent plant uptake of the NH
4+ releases protons. Subsequent nitrification can further decrease pH. We have found that hydrolysis in liquid hydroponics can be slow for days or even weeks, followed by rapid conversion and increases in NH
4+ as bacterial populations grow exponentially, which can cause the pH to decrease by two units over 12 h. We recently refined a colorimetric assay to quantify hydrolysis rates of urea in solution [
63].
Some hydroponic studies have shown adequate growth of tomato with urea [
64], but other studies have found that high levels inhibit growth [
65]. Luo et al. [
66] found a reduction in cation uptake when urea was used in place of NO
3− as a N source because the presence of NH
4+ favored anion uptake. We have also found erratic dry mass accumulation in plants grown with urea and do not recommend its use in hydroponics. Urea hydrolysis is more predictable in soilless media where there is ample media surface area to support microbial activity [
67].
3.3. Synergisms and Antagonisms among Nutrients
Plant cells and solutions must have electroneutrality, which means that the concentration of cations and anions must be equal. This principle also means that the uptake of cations is associated with the uptake of anions, and vice versa. The principle is the underlying basis for most synergisms and antagonisms in nutrient uptake. Cation uptake inhibits the uptake of other cations, and anions inhibit anions. Conversely, cation uptake promotes the uptake of anions and vice versa.
The form of N uptake dominates synergisms. A high fraction of NH4+ inhibits other cations, especially Ca2+. Solutions with 100% N as NO3− tend to increase cation uptake, especially macronutrient cations like K+, Ca2+, and Mg2+.
In soilless substrates, these nutrient interactions are more complex as cations are absorbed and desorbed from the solid phase depending on pH, but these interactions are simplified in hydroponics where nutrients are uniformly distributed, and availability can be rigorously quantified.
One highly beneficial aspect of managing nutrients by mass balance is that ion concentration in solution is low and nutrient antagonisms are thus minimized. At higher concentrations, several nutrients are insoluble (ferric phosphate, calcium phosphates), and this precipitation reduces their bioavailability. Chapter 2 in Marschner [
33] reviews the effects of the form of N uptake on other elements and reviews the literature on specific synergisms and antagonisms.
The “Mulders Chart”, also called the soil mineral wheel, is a commonly referenced diagram that includes lines connecting the nutrient elements that have proposed synergisms and antagonisms (
https://www.n-xt.com/en/soil-health/limiting-minerals, accessed 7 June 2022). No physiological basis is given for the many connecting lines on the chart. Surprisingly, this chart does not separate the two forms of N, and it thus neglects some of the most significant nutrient interactions. It was developed from data for mineral soils, where interactions with the solid phase affected nutrient availability.
4. Nutrient Monitoring Using Electrical Conductivity
Ions in solution conduct electricity, so a higher electrical conductivity (EC) indicates a higher ion concentration [
68]. An increase in EC over time indicates a low WUE with nutrients removed slower than water. Conversely, a decrease in EC over time indicates a high WUE with nutrients removed faster than water.
4.1. Theoretical Background
EC is related to ionic strength, which is a measure of the electric field created by the ions [
69]. The ability of ions to conduct electricity is complex and is related to concentration, ionic charge, diffusion coefficient, and limiting molar conductivity. The Nernst–Einstein equation incorporates each of these parameters to predict EC from ion concentration. This is used to calculate EC in the Hydrobuddy software. For a comprehensive discussion of this relationship, we recommend the well-documented, publicly available Aqion software (
www.aqion.de, accessed 7 June 2022).
We have used a simpler version of the Nernst–Einstein equation based on ionic strength, which is the sum of the concentration of each ion multiplied by its charge [
70]. In a widely cited paper, Griffin and Jurinak [
71] found that EC across many natural waters was linearly related to the ionic strength with a slope coefficient of 79 (Equation (3)).
where:
EC = electrical conductivity of the nutrient solution (mS cm−1)
79 = an empirical coefficient based on nutrient ion combinations (mS L cm−1 mol−1)
½ = a multiplier that accounts for anions and cations with the same electric field [
72]
c = molar concentration of each ion
z = charge of each ion
This relationship means that divalent ions have a four-fold greater effect on EC (z2) than monovalent ions. Therefore, EC is not a direct measurement of the total ion concentration when the ratio of mono- and divalent nutrients change. We have, however, measured a similar slope coefficient (73) for our nutrient solutions. This relationship is linear for all nutrient solutions used to grow plants.
Despite the significant effect of charge on EC, measurement of EC helps to estimate changes in the concentration of nutrients in solution [
73]. The EC of the USU nutrient solution made from deionized water is 0.9 mS cm
−1 for a WUE of 3 g L
−1 (
Table 1); the EC of the solution for a WUE of 6 g L
−1 is 1.8 mS cm
−1.
Once the proper concentration and ratio of nutrients is determined, the EC of the refill does not need to be increased to maintain the original set-point. The EC in solution can be low because fast-growing plants remove active-uptake nutrients more rapidly than water.
4.2. Non-SI Units of EC Measurement
The units used for EC are not standard and are thus confusing. EC is the conductance across a given distance between two electrodes and has units of conductance over distance. The historic unit has been millimhos per cm. The unit “mhos” represents conductance and is “ohms” spelled backwards. Ohm is a measure of resistance, so mhos is the inverse (opposite) of resistance, i.e., conductance. The derived système international (SI) unit for conductance is the Siemen (S, 1/ohms), and this is now widely used. Common units for the numerator are mS and µS. The most common unit for the denominator is cm, but cm is not an SI unit. The SI unit for distance is the meter. Some instruments read out in deciSiemens (dS) per meter, but deci- is not an SI prefix (1 dS per m = 1 mS per cm). Few, if any, meters provide a readout in the proper derived SI unit, which is Siemens per meter. Conversions among instruments are often necessary. For reference, tap water in many locations has an EC of about 0.4 mS cm
−1 or 400 µS cm
−1. This is equivalent to 40 S m
−1. An EC conversion table is provided in
Supplementary Information 2.
5. Change in Electrical Conductivity over the Life Cycle
Nutrients with active uptake are rapidly depleted in the solution. This often results in a decreasing EC as plant growth becomes exponential. These nutrients are in the plant and the refill solution does not need to be increased to restore the original EC (
Table 3). As discussed previously, maintaining set point nutrient levels often results in nutrient imbalances and toxicity, especially with P and Mn.
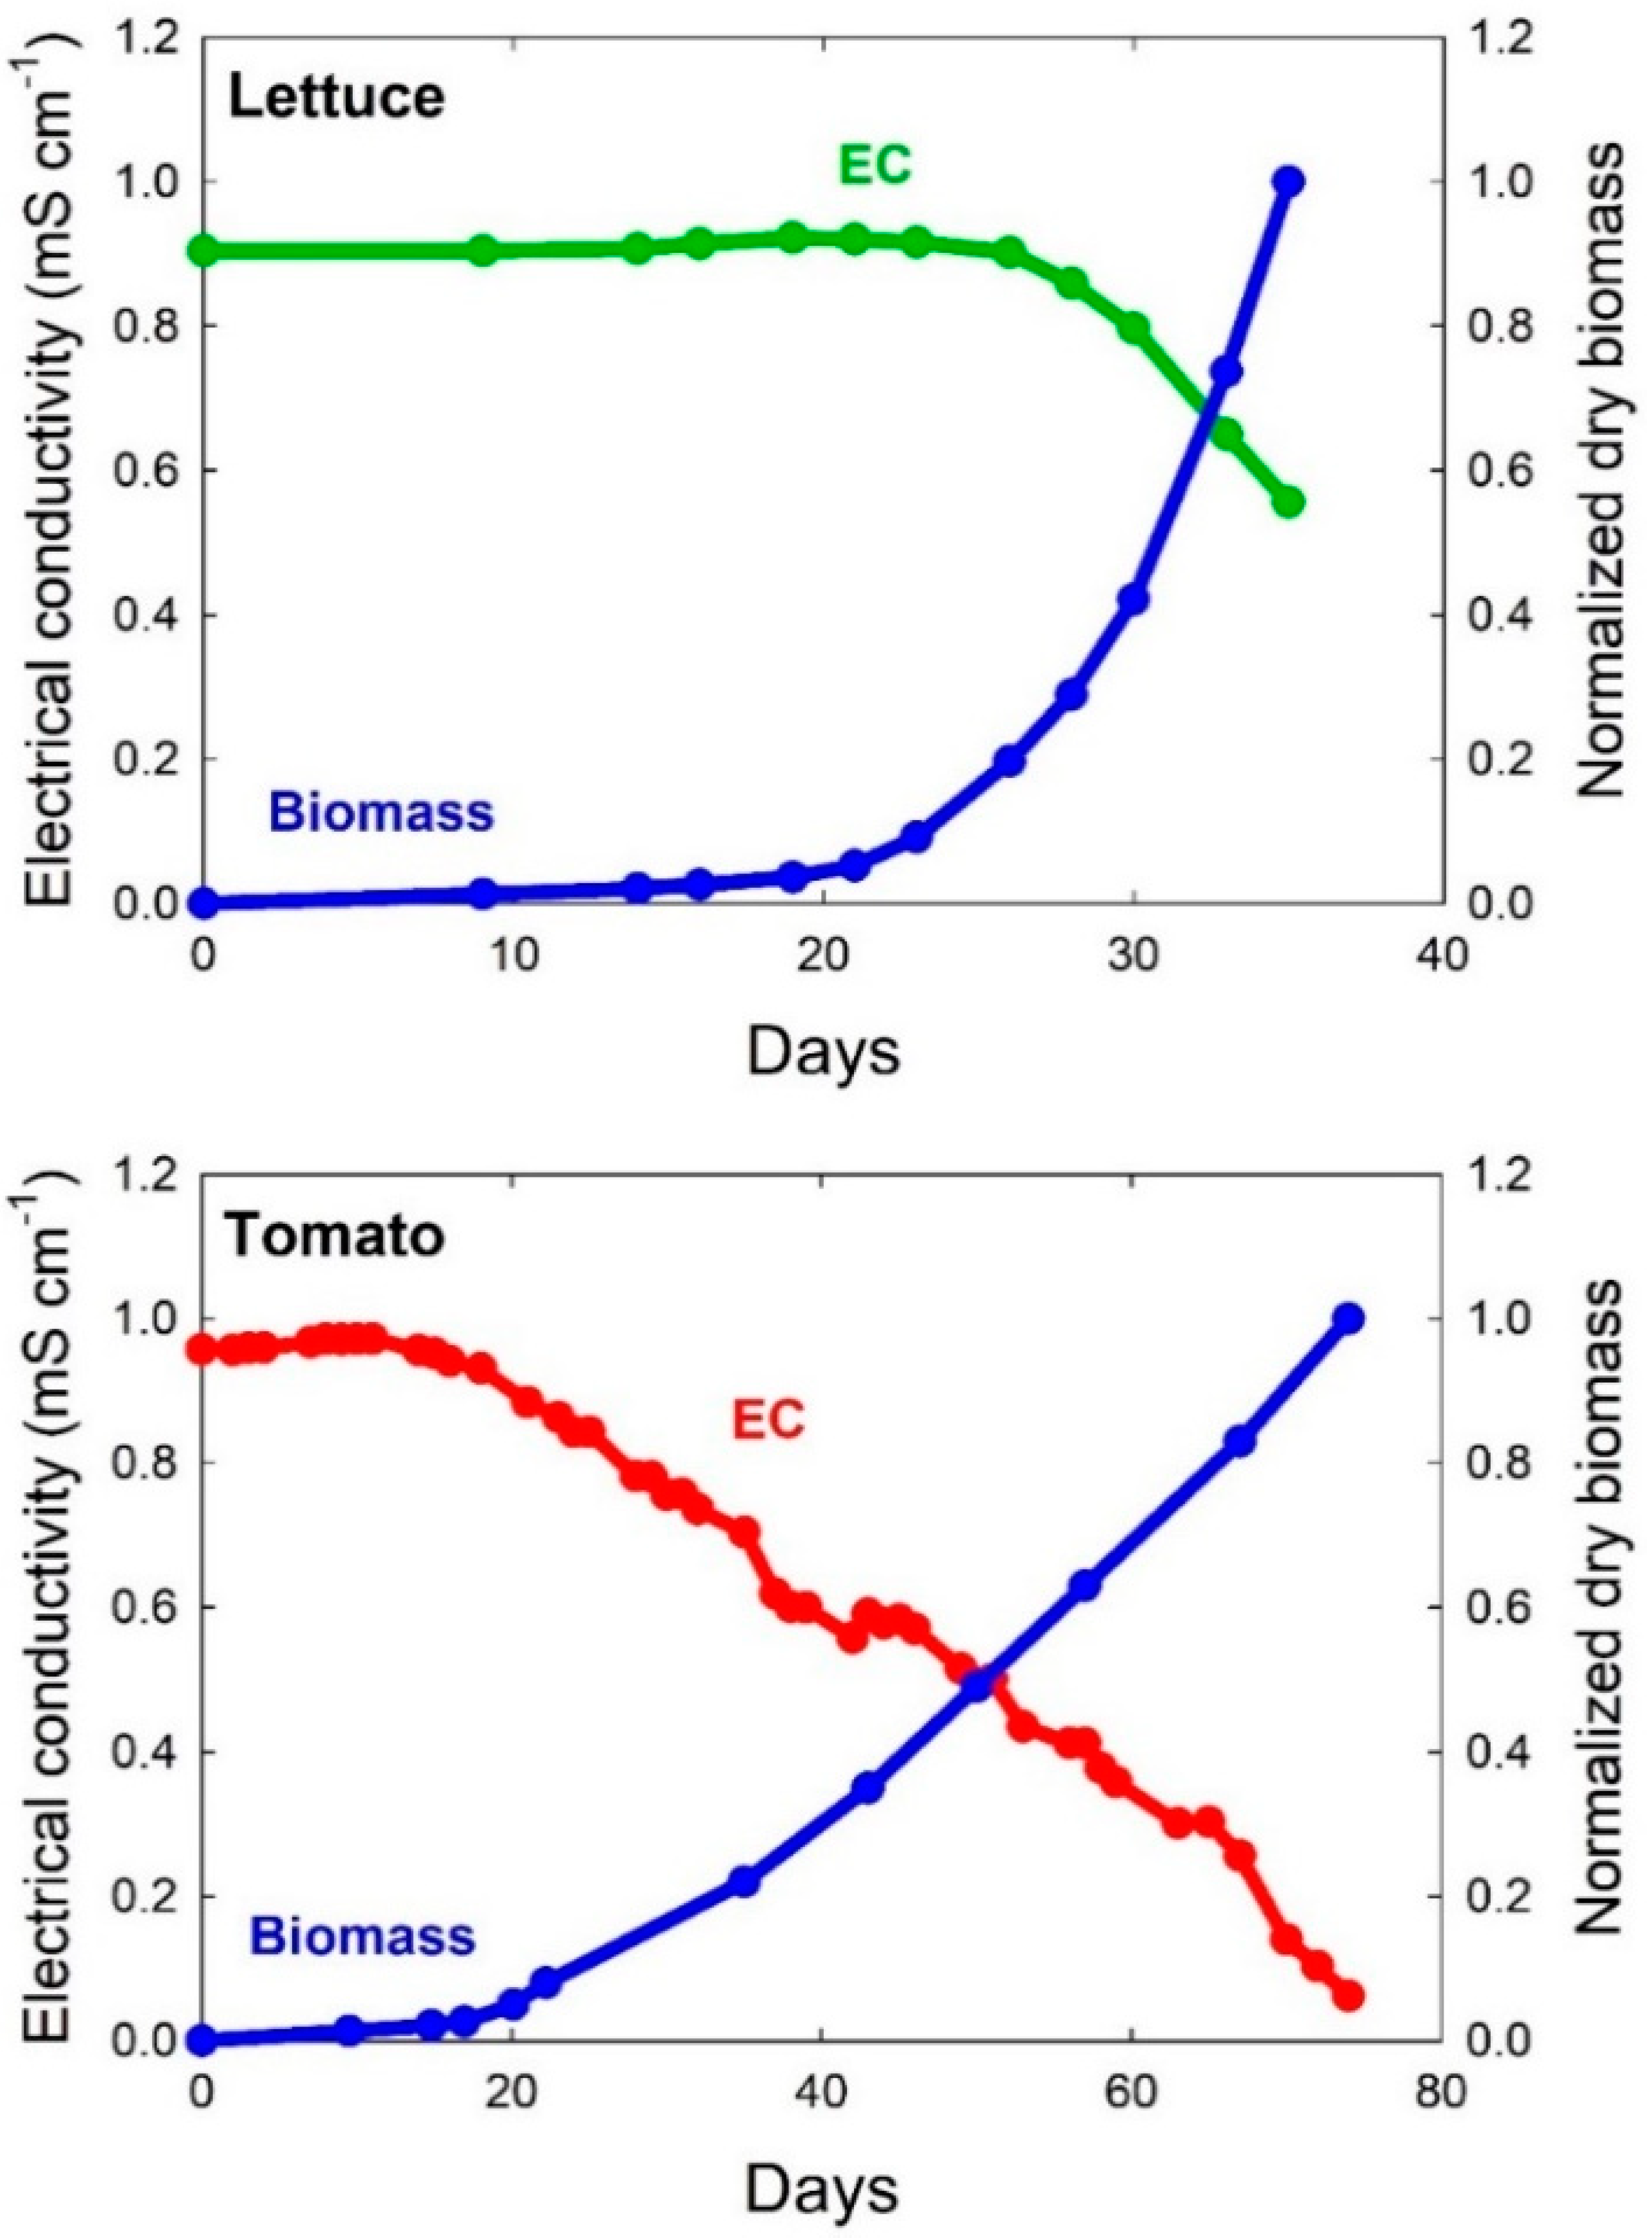
We have found that the EC can be below 0.1 mS cm
−1 and still have healthy plants with optimal nutrient levels (
Figure 5 and
Table 4). Heins and Yelanich [
74] found that leachate EC can be low, yet nutrient uptake is adequate to produce healthy plants with desired tissue concentrations.
The tomatoes in the study in
Figure 5 had ample leaf nutrient concentrations (
Table 4) despite a dilute nutrient concentration in solution at harvest. Nutrients were added each day in the refill solution with an EC of 0.9 mS cm
−1, but these nutrients were removed within one day. The plants were healthy and the fruit yield at day 74 was high. Even passively absorbed nutrients such as calcium were removed from the solution more quickly than they were restored in the refill solution.
The trace amount of sodium in solution comes from the di-sodium DTPA chelate. The sodium ions dissociate from the chelate and are bioavailable. Sodium is beneficial for several crops and these trace amounts would often be quickly removed from solution. Marschner includes a discussion of the beneficial effects of sodium in plant nutrition (pages 250–257 in [
33]).
Nutrient toxicities can often be a bigger problem than nutrient deficiencies. Even when the EC decreases, we recommend following the mass balance approach and analyzing the solution before making changes to nutrient composition and concentration.
6. Ion Concentration and Osmotic Potential of Nutrient Solutions
Elevated nutrient concentrations are sometimes used to create osmotic water stress, and it is useful to know how to calculate the osmotic potential of solutions to enable comparison with osmotic and matric potential in field soils.
The osmotic potential (solute potential, Ψ
s) of solutions can be determined from the Van’t Hoff equation (Equation (4)), which is discussed in most plant physiology textbooks [
75,
76]. The Ψ
s of pure water is zero, and the value becomes increasingly negative as nutrients are added to solution.
where:
Ψs = osmotic (solute) potential (a negative value, MPa)
C = molality of the nutrient (mol nutrient per kg water)
i = ionization status of the compound
R = universal gas constant (0.00831 kg × MPa per mol × K)
T = temperature (K)
The total Ψs is the sum of all osmotic potentials for all nutrients. The osmotic potential of typical nutrient solutions is low at -0.04 MPa (for a WUE of 3 g L−1) to -0.08 MPa (for a WUE 6 g L−1). This low osmotic potential helps facilitate a high plant water potential. For comparison, the water potential of field soils after watering is called field capacity and is considered to be −0.03 MPa.
The Ψ
s can be directly estimated from the solution EC (Equation (5)).
where:
Ψs = osmotic (solute) potential (MPa)
EC = electrical conductivity in mS per cm (or dS per m)
The constant −0.036 is empirically derived from measurements of solutions in field soils with ion ratios similar to nutrient solutions [
77,
78]. Calculations from our hydroponic solutions indicate this multiplier is about −0.04.
7. Measurement of Individual Nutrient Ions in Solution
The concentration of nutrients in a solution can be determined by the following methods: (1) colorimetric, (2) spectrophotometric, (3) ion selective electrodes, or (4) emission spectroscopy.
Colorimetric tests require a colorimeter (about
$1500 in 2022) and are easy to use because they use preformulated reagents (available from several manufacturers, e.g., LaMotte and Hach). These test kits provide accurate measurements of all the macronutrient ions, and for most of the micronutrient ions [
79,
80,
81], but the kits are expensive, and adding the colorimetric reagents to each sample is labor intensive.
Spectrophotometric measurements require a more complex spectrophotometer (
$500 to
$10,000 in 2022), prepared reagents, and a calibration curve, but a wider range of nutrients can be measured. We use our spectrophotometer to measure urea [
63].
Ion selective electrodes require careful calibration and rigorous maintenance of the membrane but work well when many measurements of the same ion are needed in multiple solutions. Ion selective electrodes are available for NO3−, NH4+, K+, Ca2+, Cl−, and Cu2+, but are subject to interferences from similarly sized ions (e.g., NH4+ and K+ interfere with each other).
Atomic emission spectroscopy (AES) uses inductively coupled plasma to excite nebulized atoms and can measure nearly all nutrients based on their emission spectra. Commercial laboratories use this technology to simultaneously measure all essential nutrients, except N. Sample cost ranges from
$30 to
$100 depending on the laboratory. See
Supplemental Information 3 for more information.
8. Leaf Tissue Analysis
The most definitive method for determining optimal nutrition is analysis of leaf tissue combined with crop yield, but leaves vary based on their position and age of the plant. Standardized sampling techniques are reviewed in the Handbook of Reference Methods for Plant Analysis [
82]. The uppermost fully expanded leaves are a standard for analysis because they are actively growing tissue. These leaves provide a good indication of whole-plant nutrient status. Lower leaves are less representative because they can have low concentrations of mobile nutrients such as N, P, and K (especially when these nutrients are in limited supply) and high concentrations for immobile nutrients such as calcium and boron [
75]. Tissue analysis of upper leaves may not reveal deficiencies in lower leaves. Upper and lower leaves should be analyzed if there are visible nutrient deficiencies or toxicities.
The sampled tissue should be lightly rinsed with distilled water to remove potential surface contaminants and dried for 48 h at 80 °C. Jones and Case [
83] found that temperatures below 80 °C may not remove all the water, and temperatures above 80 °C may cause volatilization of carbon compounds that are part of the dry mass. Completely dried tissue should be ground into a fine powder prior to analysis. We have found that a stainless-steel coffee grinder works well for grinding and can be quickly cleaned between samples. Analytical labs will grind samples for about
$8 (2022) per sample. A discussion of analytical techniques for tissue analysis is included in
Supplementary Information 3.
Fruiting crops (e.g., tomatoes, peppers, and cucumbers) often accumulate potassium. In these cases, it is helpful to separately analyze fruit tissue to confirm that the desired tissue concentrations are achieved.
9. Unique Characteristics of Chelated Iron, Silicon and Copper
Three nutrients have characteristics that warrant additional discussion.
9.1. Chelates and Iron
A chelate is a compound that strongly binds a metal cation using multiple metal coordination sites. Chelates bind metals, such as Fe, that may otherwise precipitate and become unavailable for uptake [
84]. Chelate-metal interactions are complex. Chelate concentration in excess of the target metal in hydroponics can reduce availability of other metal cations by decreasing their activity, but it can also act as a buffer to mediate high concentrations of metals and prevent toxicities in the root zone [
85].
Chelates have a wide range of affinity for metals. Ethylenediaminetetraacetic acid (EDTA), diethylenetriaminepentaacetic acid (DTPA), ethylenediamine-
N,
N′-bis-2-hydroxyphenylacetic acid (EDDHA), and hydroxyethylethylenediaminetriacetic acid (HEDTA) are common chelates used in nutrient solutions to improve Fe availability [
86]. The stability is dependent on solution pH [
87]. EDDHA is widely used and has a high affinity for Fe up to pH 9, but it has a distinct red color in solution and interferes with colorimetric solution analysis. DTPA has a lower affinity for Fe and is stable up to about pH 8. EDTA is stable up to about pH 7. We use DTPA for optical clarity and stability over a wide pH range.
HEDTA is a less common chelate and has a weaker affinity for Fe. We have found it valuable for monocots, which obtain Fe by releasing siderophores into the rhizosphere [
88]. Since it is difficult for plants to form a rhizosphere in flowing hydroponic solutions, monocots struggle to absorb Fe. The USU monocot solution [
34] recommends HEDTA for monocots such as wheat, rice, and corn. Dicots can get Fe out of all types of chelates, regardless of binding strength.
Chelates are usually recycled back to solution once Fe is removed, but Bell et al. [
89] found that chelates can potentially be taken up into plant tissues. Chelated nutrients are added in the refill solution, but we have not found detrimental effects of chelate accumulation. Synthetic chelates are resistant to microbial degradation, but some degradation will occur over time.
There has been significant research on nanoparticle-bound nutrients over the past 10 years and it has shown that they have potential to increase bioavailability in field applications [
90,
91]. We have not studied the use of nanoparticles in hydroponics, but they have the potential to be of lower cost than synthetic chelates.
9.2. Silicon
Silicon (Si) is not an essential nutrient, but it is beneficial for tolerance of drought stress [
92], and it can accumulate in cell walls, helping to prevent fungal and bacterial infections [
93,
94]. Si occurs in sand as silicon dioxide, but this compound is not soluble in water and is therefore not available to the plant. Potassium silicate is widely used as both a potassium and Si source for nutrient solutions. Commercial grade potassium silicates are widely available and are made from varying combinations of potassium hydroxide and silicon dioxide.
For greater purity, we make reagent-grade potassium silicate in our laboratory by combining potassium hydroxide and fumed silica in equimolar ratios to make a stock solution at 200 mM Si. The highly alkaline solution is about pH 11 and must be heated and stirred to dissolve the Si. The pH rises when this reagent is added to the bulk solution and must be titrated back to the desired pH with acid. A cloudy precipitate also forms, but this redissolves after mixing and acid titration.
Si must be completely dissolved in the concentrated solution if an injector system is used. High pH in this tank must be maintained using potassium hydroxide to ensure Si remains in solution. If the Si is not completely in solution, it is abrasive to injectors [
95]. High solubility is achieved by first adding potassium hydroxide to the stock solution until reaching a pH of at least 11 and then adding potassium silicate. Calcium silicate is insoluble. When an injector system is used, the Si should be injected first, followed by the fertilizer, which contains calcium.
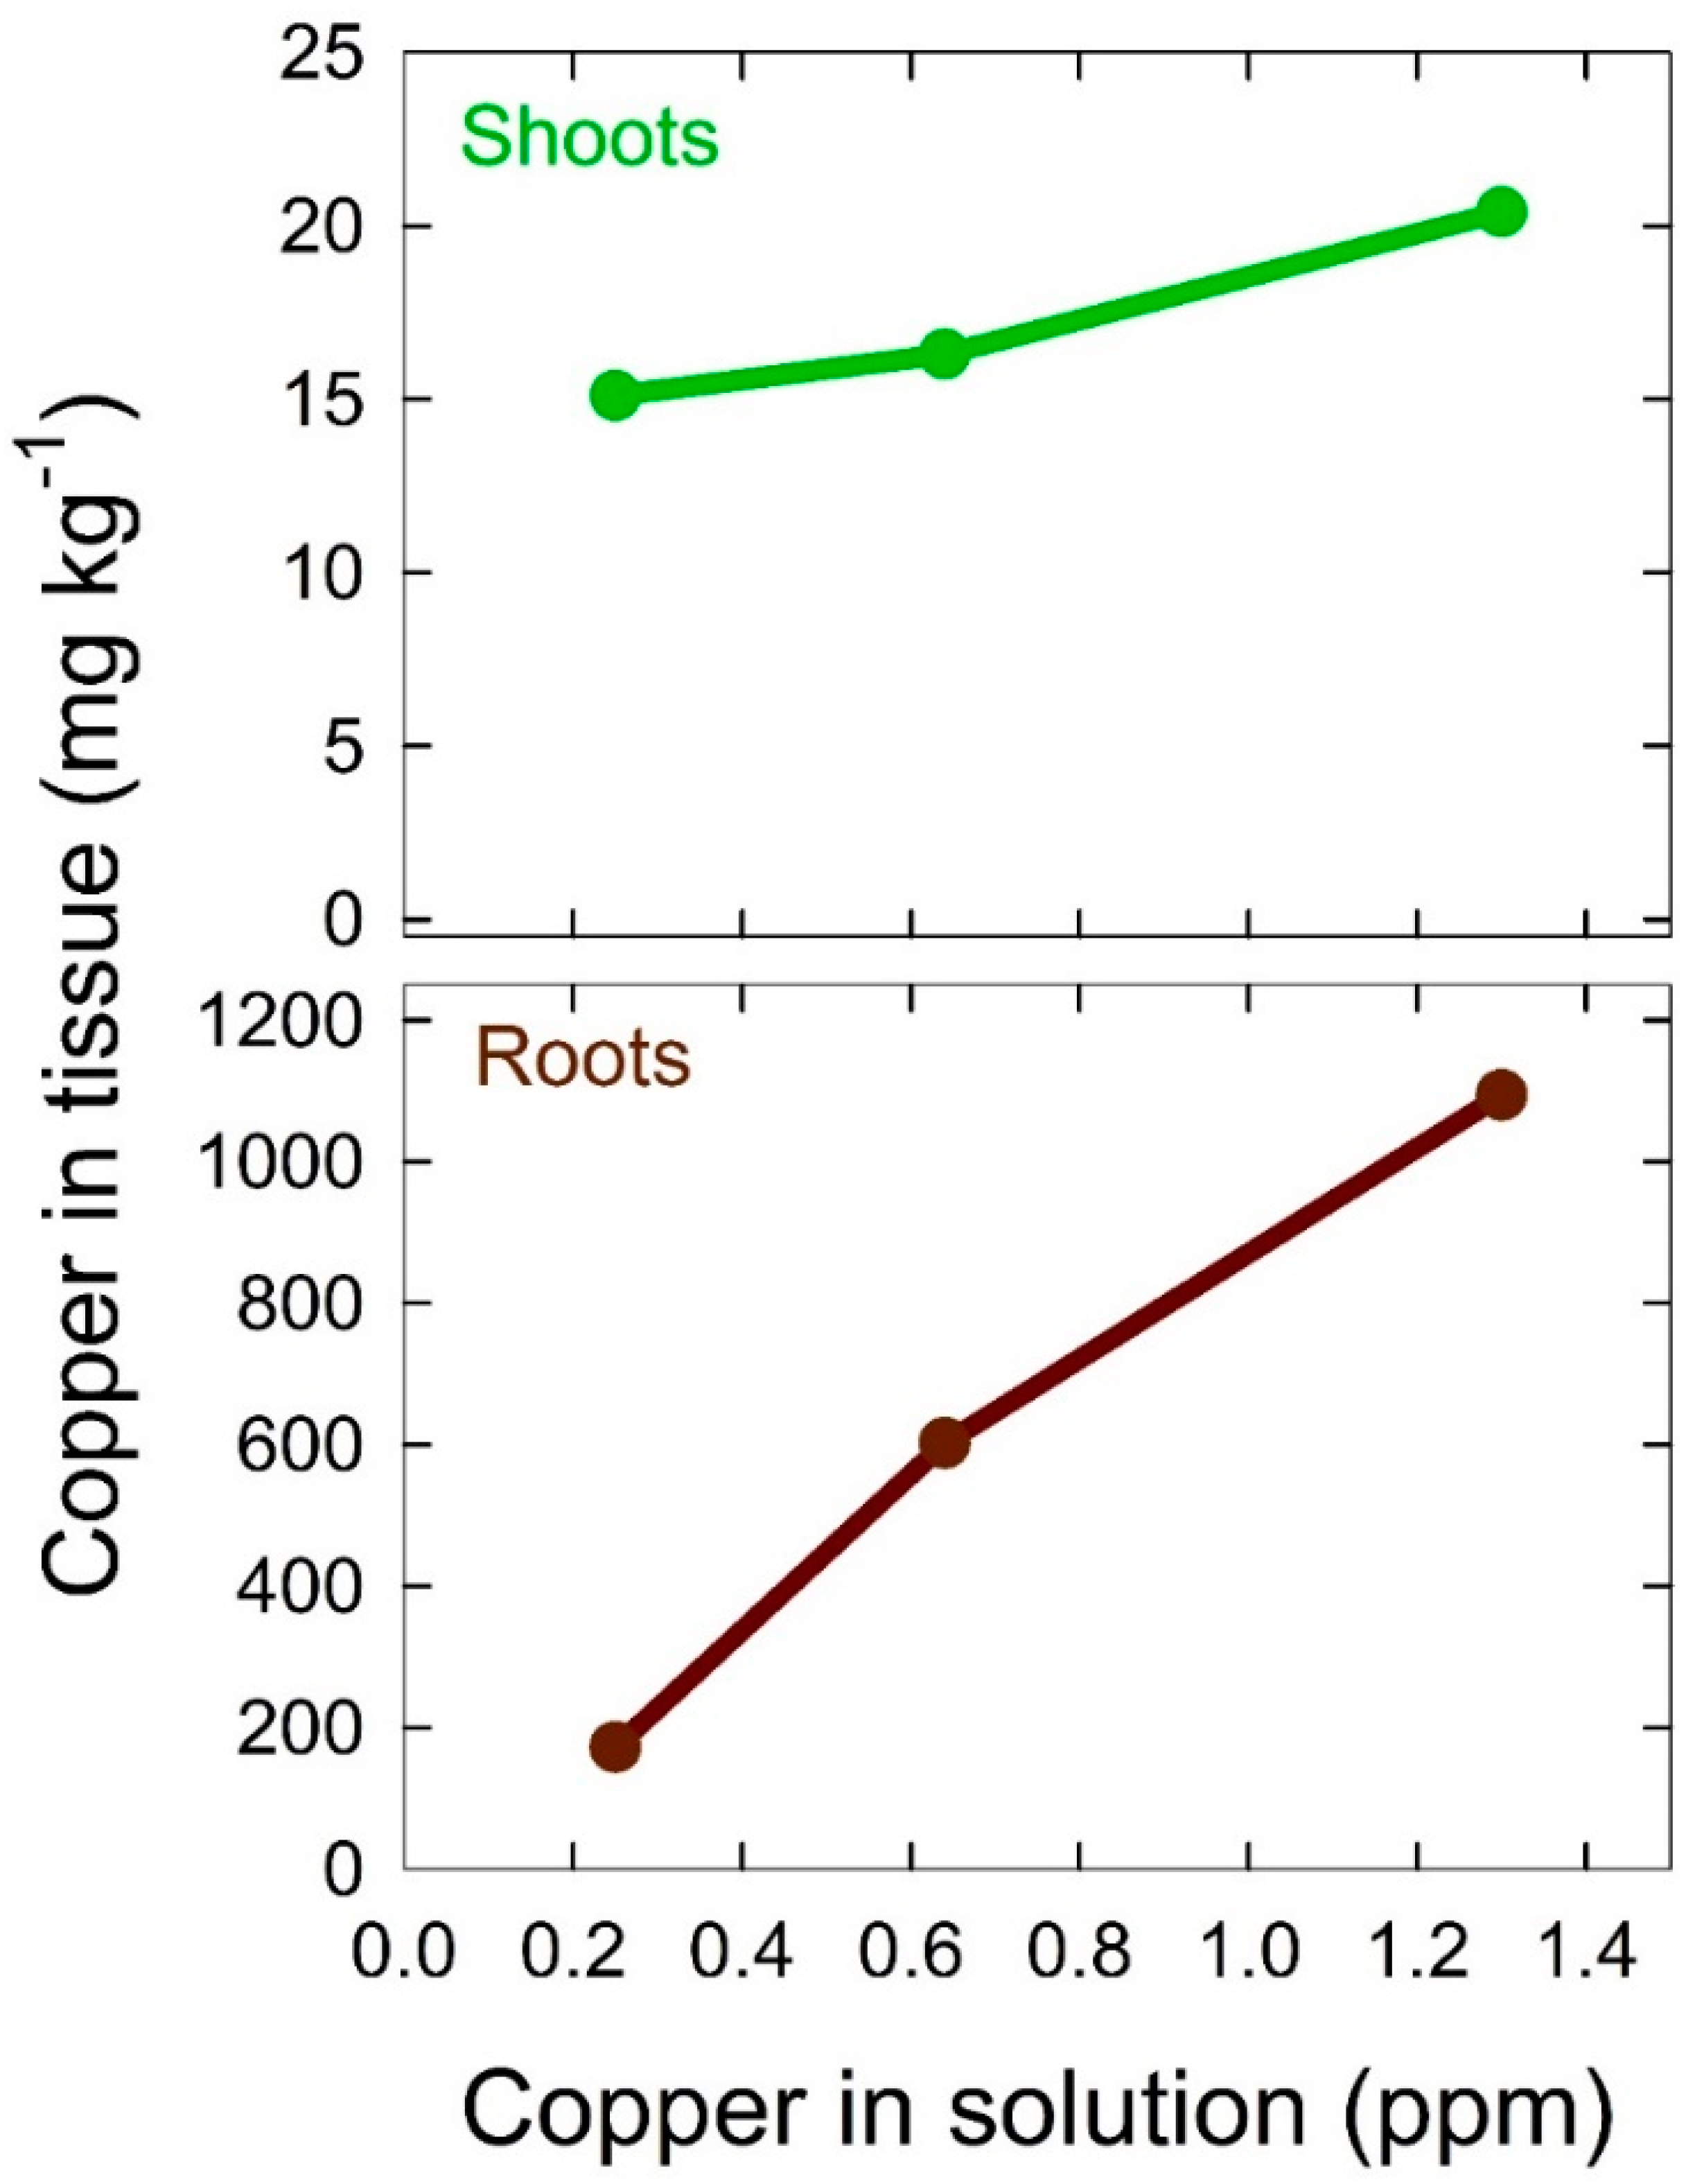
9.3. Copper
Copper (Cu) is an essential nutrient for plant nutrition and is used in the photosynthetic electron transport chain [
96]. Cu is easily added to a solution as either copper (II) chloride or copper (II) sulfate. Zhang et al. [
97] found that Cu levels of 25 µM (1.6 ppm) in hydroponic culture significantly reduced root rot and oospore production from
Pythium spp.. Raudales et al. (2014) [
98] found that concentrations up to 79 µM (5 ppm) in some species inhibit disease and produce no phytotoxic effects. We thus add Cu at a concentration higher than is necessary by mass balance. We have seen Cu accumulation on root surfaces without phytotoxic effects in lettuce when Cu was added up to 20 µM (1.3 ppm) in the nutrient solution (
Figure 6).
10. Root-Zone Microbial Activity and Disease
Roots have beneficial microbial activity in the rhizosphere, even in hydroponics, but excessive carbon leakage into the bulk solution from unhealthy roots provides an energy source that can result in excessive microbial growth in the bulk solution. Hosseinzadeh et al. [
99] and Razzak et al. [
100] review approaches to remove organics from hydroponic solutions. These compounds (largely carboxylic acids) can be toxic to plants if they accumulate to elevated concentrations [
99,
100].
Healthy roots minimally leach nutrients into solution [
101]. In our experience, increased turbidity usually indicates unhealthy roots with carbohydrate leakage. We have found that the solution in well-aerated DWC remains clear throughout the crop cycle (months) indicating low microbial activity in the bulk solution.
Several water treatment technologies have been used to reduce disease. These include chlorination, hydrogen peroxide, filtration, and ozonation [
102,
103,
104,
105]. Some sanitizers can degrade chelates in solution [
106]. Ultraviolet light has been used in recirculating systems to reduce microbial activity in solution and to help prevent disease [
107], but UV photons break down chelates [
108], and the chelates must be re-added. Acidic root zone conditions have also been shown to reduce disease persistence [
109,
110].
We have not found any of the above treatments necessary. Root-zone disease has been minimal in our systems, perhaps because the root surfaces are uniformly well aerated and the steady-state nutrient levels that come from the daily refill solution result in healthier roots.
11. System Design for Hydroponic Culture
Optimal hydroponic system design facilitates application of mass balance principles. Systems with adequate solution volume, oxygen delivery, and automated pH control are essential to optimal growth.
11.1. Volume to Cultivation Area Ratio (V:CA)
A high V:CA ratio helps to buffer fluctuations in the root-zone ion concentrations. Buffering capacity is proportional to solution volume; demand for nutrients is proportional to the cultivation area for plants (leaf area index of all crops increases from planting to harvest, but this is a response variable, not a design parameter). Hydroponic systems vary in their V:CA ratio [
111,
112].
Deep water culture systems hold plants above nutrient solution tanks that are 10 to 30 cm deep (a V:CA ratio of 10 to 30 cm3 per cm2). These systems have a high V:CA ratio.
Recirculating flood and drain systems use an inert substrate, irrigate the plants from a nutrient solution reservoir, and usually have a lower V:CA ratio. These systems require precise timing to ensure roots are not saturated or dried for extended periods of time.
Drip irrigation systems that use an inert substrate, such as mineral wool (Rockwool) or perlite, can be designed to recirculate the nutrient solution, and usually have a low V:CA ratio. Frequent irrigation from multiple points is recommended due to the poor horizontal hydraulic conductivity of mineral wool and perlite substrates.
The nutrient film technique (NFT) uses sloped channels with a thin layer of nutrient solution running from top to bottom and typically has a low V:CA ratio. NFT systems commonly have preferential flow and channeling, which leads to uneven oxygen (O2) transfer and nutrient delivery to root surfaces.
Aeroponic systems suspend the roots in a saturated humidity environment where they are misted with nutrient solution. These systems often have an extremely low V:CA ratio and are susceptible to nozzle clogging and uneven nutrient delivery as the root systems tend to clump together as they get larger.
Since DWC systems result in excellent uniformity and stability, we have used them for research applications. We typically refill solution at daily intervals, which restores 5 to 10% of the total solution. We have not found that automated refill is necessary when the solution depth is 25 cm or greater.
The principles discussed in this manuscript apply to all types of hydroponics but are especially suitable for DWC systems.
11.2. Delivery of Oxygen to Root Surfaces
Although O
2 is only soluble at micronutrient concentrations, its uptake rate is 100 times faster than any other nutrient [
113]. The concentration of O
2 in air is 209,500 ppm (20.95%), but it is only soluble in water to 9 ppm (250 µM) at 20 °C [
114]. Continuous replenishment of O
2 is therefore necessary to maintain about 8 ppm dissolved O
2 (DO) at the root surface. Previous studies have not found a benefit from elevating O
2 in DWC above 8 ppm by using 100% O
2 for aeration [
115].
In addition to low solubility, the diffusion of O
2 in water is 10,000 times slower than in air [
116]. Therefore, systems need to move O
2 to root surfaces by mass flow, which is facilitated either by a flowing solution or by agitating the solution back and forth with bubbling air. Mass flow is so important to O
2 delivery that the gentle agitation of the solution associated with bubbling may be more important than the newly supplied O
2 introduced by the bubbles.
We have used a bubbling flow rate of 5 L of air per minute in a 50 L container. This high flow rate has been ample even for long-term crops with dense root growth. Lower airflow rates may be adequate for smaller, shorter-term crops.
The flow rate of the nutrient solution is important in NFT systems. Many systems have inadequate flow rates to maintain a high O2 concentration at the outlet. Frequent measurement of O2 at the outlet is critical in NFT systems. Faster flow rates also reduce channeling of the solution. Users should consider reducing the flow rate if rapid flow causes roots to break off into the bulk solution.
The greatest demand for aeration typically occurs when the root system is dense and there is rapid growth (high demand for O
2). We have measured DO during peak growth with a DO microelectrode and found that the agitation caused by the bubbling was adequate to maintain O
2 above 90% of saturation in all parts of the root-zone. We recommend measuring DO to confirm high levels in the center of dense root systems. Our studies, however, indicate that the lowest cost DO electrode may not be adequate for this measurement [
117].
Although root surfaces are always hydrated with a water film, maintenance of a thin film of solution allows air to be close to root surfaces, which can improve O
2 transfer. Flood and drain, drip, NFT, and aeroponic systems were developed to improve aeration. However, we have found that solution channels around areas of dense root growth in NFT systems and have observed difficulty in aeroponic systems providing aerated solution to the interior of large root systems hanging in the air. Root surfaces on the exterior of a root clump can absorb O
2 more quickly than those on the interior, but the exposure to O
2 is not uniform among all root surfaces. DWC systems with adequate volume allow the suspended roots to separate, which facilitates mass transfer of aerated solution to all root surfaces. We have thus found that continuously agitated and aerated DWC systems are the most effective in providing O
2 for uniform root respiration [
118].
11.3. Automated pH Control
Hydroponic nutrient solutions are poorly buffered, which can result in rapid pH changes. Automated pH control is therefore highly useful. Most nutrients are cations and anions that have conjugate bases and acids with strong dissociations, and therefore have a limited effect on solution pH. The pH is initially dictated by the carbonate equilibrium in solution, which is due to the CO2 in air dissolved in the water. The chemical equilibrium of phosphate species helps to buffer pH. The pKa between HPO42− and H2PO4− is 7.2. This helps buffer the solution if the pH increases, but minimally helps with decreasing pH. Phosphate levels in solution are typically low so their value as buffers is limited.
Solution pH remains steady when plants are small, but changes rapidly as plant size increases relative to the size of the hydroponic system. The pH changes during growth because of increased nutrient uptake and the ratio of NO
3− to NH
4+. The charge balance requirements of the plant mean that NO
3− uptake results in proton removal, and an increase in solution pH; NH
4+ uptake results in proton addition and a decrease in solution pH. If the percentage of NH
4+ is increased in hydroponics, the pH must be rigorously controlled by automated addition of a base, such as potassium hydroxide. It is also possible to stabilize pH by adding a buffer. We have used 2-(N-morpholino)ethanesulfonic acid (MES) up to 10 mM to stabilize pH, but this is expensive [
119].
11.3.1. Optimal Set-Point pH
The optimal pH is considered to be between 5.5 and 6.5, but there is a minimal direct effect of pH on roots. We have grown plants at a steady-state pH as low as 4 and as high as 7 with minimal effects on growth rate, provided that the nutrients are adjusted to maintain adequate nutrient uptake. High pH reduces availability of Fe, Mn, Zn, Cu, and P; low pH tends to reduce K, S, Ca, Mg, and P availability [
33]. A low pH also increases metal solubility, which increases the risk of micronutrient toxicity. The powerful EDDHA chelate for iron is usually required at a high pH (see section on chelates and iron).
Short-term failures of pH control between 4 and 7 are alarming, but if the failure is quickly corrected, we have found that the long-term effects on nutrient uptake are minimal.
11.3.2. Composition of the pH Control Solution
Without NH4+ in solution, the pH of most crops increases over time. We have used a pH control solution with a 2:1 molar combination of nitric acid and ammonium sulfate to maintain steady, low levels of NH4+ in solution. This solution is 50 mM nitric acid and 25 mM ammonium sulfate. Nitric acid immediately decreases the pH while ammonium sulfate provides NH4+ for longer-term pH control. This combination provides more steady-state pH control and reduces the necessary volume of pH control solution. This approach only requires pH adjustment downward; thus, no alkaline adjustments are required.
Sulfuric acid and phosphoric acid can also be used for pH control but providing additional N from nitric acid is beneficial due to the rapid uptake of N from solution. A discussion of best practices for long-term pH monitoring and control is included as
Supplementary Information 4.
12. Water Quality
Tap water can be used if it does not contain high levels of sodium, heavy metals, boron, and bicarbonate. Some water sources can have fertilizer concentrations of Ca, Mg, S, and micronutrients. These nutrients are bioavailable and must be included when formulating the nutrient solution. When tap water cannot be used, the most cost-effective water purification method is reverse osmosis (RO), which removes about 97% of the ions in tap water. For critical applications, RO water is often additionally filtered through a deionization column, which removes 90 to 99% of the remaining ions.
In some locations, the use of tap water can result in accumulation of sodium (Na) in recirculating solutions, which reduces plant growth. Elevated salinity reduces leaf growth and development [
120], so keeping Na concentrations below 6 mM (138 ppm) is recommended to avoid salinity problems [
121]. Reducing Na and other undesirable ions in solution typically requires discarding some of the solution.
High concentrations of bicarbonate in some tap waters increase the alkalinity of the nutrient solution. Bicarbonate can be neutralized to water and carbon dioxide (which leaves solution) through the addition of acid. Continuous acid injection through an injector may be necessary if bicarbonate concentrations are continuously present.
Although we have high-quality tap water with low levels of undesirable elements at Utah State University, we use RO water for hydroponic research studies.
13. Conclusions
This paper provides guidelines for the composition and concentration of refill solutions for hydroponics and irrigation solutions for soilless media. We describe the application of a mass balance approach that combines WUE and tissue analysis to optimize nutrient delivery. The need for frequent monitoring of nutrients in solution is minimized. Irrigation can be accomplished without the need for leaching, and solutions can be recirculated through multiple crop cycles.
Understanding active and passive nutrient uptake facilitates interpretation of changes in the concentration of the recirculating solution (or leachates) over time. Nutrients with active uptake are often quickly removed from solution and do not need to be immediately replaced. The root-zone pH can be controlled with small, automated additions of nitric acid and ammonium sulfate. We provide examples of specific species with unique nutrient requirements that may benefit from adjustments to the baseline concentrations.
This knowledge-based approach requires an understanding of the principles of plant nutrition, coupled with simple measurements of pH and EC. This approach minimizes nutrient discharge to the environment and increases the sustainability of indoor agriculture.
Supplementary Materials
The following supporting information can be downloaded at:
https://www.mdpi.com/article/10.3390/su141610204/s1, Supplementary Information 1, Supplementary Information 2, Supplementary Information 3, Supplementary Information 4. References [
82,
122,
123,
124,
125,
126,
127,
128] are cited in the supplementary materials.
Author Contributions
Conceptualization, N.J.L. and B.B.; methodology, N.J.L. and B.B.; formal analysis, N.J.L. and B.B.; investigation, N.J.L.; resources, B.B.; writing—original draft preparation, N.J.L.; writing—review and editing, N.J.L., D.F.P., J.E.F., R.H. and B.B.; visualization, N.J.L. and B.B.; supervision, B.B.; project administration, B.B., funding acquisition, B.B. All authors have read and agreed to the published version of the manuscript.
Funding
This research was funded by the Utah Agricultural Experiment Station, Utah State University, and approved as journal paper number 9555; NASA, Center for the Utilization of Biological Engineering in Space (grant number NNX17AJ31G).
Institutional Review Board Statement
Not applicable.
Informed Consent Statement
Not applicable.
Data Availability Statement
Acknowledgments
We thank Sandra Crespo for her design of
Figure 1; Alec Hay and Lauren Payne for their technical assistance; and Madigan Hawkins and Emma Tripp for their review and comments.
Conflicts of Interest
The authors declare no conflict of interest. The funders had no role in the design of the study; in the collection, analyses, or interpretation of data; in the writing of the manuscript, or in the decision to publish the results.
References
- Bevan, L.; Jones, M.; Zheng, Y. Optimisation of Nitrogen, Phosphorus, and Potassium for Soilless Production of Cannabis Sativa in the Flowering Stage Using Response Surface Analysis. Front. Plant Sci. 2021, 12, 764103. [Google Scholar] [CrossRef] [PubMed]
- Bugbee, B. Nutrient Management in Recirculating Hydroponic Culture. Acta Hortic. 2004, 648, 99–112. [Google Scholar] [CrossRef]
- Bugbee, B.; Salisbury, F.B. Exploring the Limits of Crop Productivity. Plant Physiol. 1988, 88, 869–878. [Google Scholar] [CrossRef] [PubMed]
- Christian, G.D.; Dasgupta, P.K.; Schug, K. Analytical Chemistry, 7th ed.; John Wiley and Sons, Inc.: Hoboken, NJ, USA, 2014; ISBN 978-0-470-88757-8. [Google Scholar]
- Hoagland, D.R.; Snyder, W.C. Nutrition of Strawberry Plant under Controlled Conditions. (a) Effects of Deficiencies of Boron and Certain Other Elements, (b) Susceptibility to Injury from Sodium Salts. Proc. Am. Soc. Hortic. Sci. 1933, 30, 288–294. [Google Scholar]
- Hoagland, D.R.; Arnon, D.I. The Water-Culture Method for Growing Plants without Soil, 347th ed.; California Agricultural Experiment Station: Davis, CA, USA, 1938. [Google Scholar]
- Hoagland, D.R.; Arnon, D.I. The Water-Culture Method for Growing Plants without Soil, 347th ed.; California Agricultural Experiment Station: Davis, CA, USA, 1950. [Google Scholar]
- Hewitt, E.J. Sand and Water Culture Methods Used in the Study of Plant Nutrition. In Technical Communication No. 22 of the Commonwealth Bureau of Horticulture and Plantation Crops; The Commonwealth Agricultural Bureau: Farnham Royal, UK, 1952. [Google Scholar] [CrossRef]
- Howell, T.A. Enhancing Water Use Efficiency in Irrigated Agriculture. Agron. J. 2001, 93, 281–289. [Google Scholar] [CrossRef]
- Leakey, A.D.B.; Ferguson, J.N.; Pignon, C.P.; Wu, A.; Jin, Z.; Hammer, G.L.; Lobell, D.B. Water Use Efficiency as a Constraint and Target for Improving the Resilience and Productivity of C3 and C4 Crops. Annu. Rev. Plant Biol. 2019, 70, 781–808. [Google Scholar] [CrossRef]
- Ullah, H.; Santiago-Arenas, R.; Ferdous, Z.; Attia, A.; Datta, A. Improving Water Use Efficiency, Nitrogen Use Efficiency, and Radiation Use Efficiency in Field Crops under Drought Stress: A Review. In Advances in Agronomy; Elsevier: Amsterdam, The Netherlands, 2019; Volume 156, pp. 109–157. ISBN 978-0-12-817598-9. [Google Scholar]
- Jiang, S.; Liang, C.; Cui, N.; Zhao, L.; Liu, C.; Feng, Y.; Hu, X.; Gong, D.; Zou, Q. Water Use Efficiency and its Drivers in Four Typical Agroecosystems Based on Flux Tower Measurements. Agric. For. Meteorol. 2020, 295, 108200. [Google Scholar] [CrossRef]
- Wang, T.; Tang, X.; Zheng, C.; Gu, Q.; Wei, J.; Ma, M. Differences in Ecosystem Water-Use Efficiency among the Typical Croplands. Agric. Water Manag. 2018, 209, 142–150. [Google Scholar] [CrossRef]
- Adeyemi, O.; Grove, I.; Peets, S.; Domun, Y.; Norton, T. Dynamic Modelling of Lettuce Transpiration for Water Status Monitoring. Comput. Electron. Agric. 2018, 155, 50–57. [Google Scholar] [CrossRef]
- Rawson, H.M.; Begg, J.E.; Woodward, R.G. The Effect of Atmospheric Humidity on Photosynthesis, Transpiration and Water Use Efficiency of Leaves of Several Plant Species. Planta 1977, 134, 5–10. [Google Scholar] [CrossRef]
- McDonald, E.P.; Erickson, J.E.; Kruger, E.L. Research Note: Can Decreased Transpiration Limit Plant Nitrogen Acquisition in Elevated CO2? Funct. Plant Biol. 2002, 29, 1115. [Google Scholar] [CrossRef] [PubMed]
- Bugbee, B. Determining the Potential Productivity of Food Crops in Controlled Environments. Adv. Space Res. 1992, 12, 85–95. [Google Scholar] [CrossRef]
- Ainsworth, E.A.; Rogers, A. The Response of Photosynthesis and Stomatal Conductance to Rising [CO2]: Mechanisms and Environmental Interactions: Photosynthesis and Stomatal Conductance Responses to Rising [CO2]. Plant Cell Environ. 2007, 30, 258–270. [Google Scholar] [CrossRef]
- Thongbai, P.; Kozai, T.; Ohyama, K. CO2 and Air Circulation Effects on Photosynthesis and Transpiration of Tomato Seedlings. Sci. Hortic. 2010, 126, 338–344. [Google Scholar] [CrossRef]
- Pan, T.; Wang, Y.; Wang, L.; Ding, J.; Cao, Y.; Qin, G.; Yan, L.; Xi, L.; Zhang, J.; Zou, Z. Increased CO2 and Light Intensity Regulate Growth and Leaf Gas Exchange in Tomato. Physiol. Plant. 2020, 168, 694–708. [Google Scholar] [CrossRef] [PubMed]
- Pennisi, G.; Pistillo, A.; Orsini, F.; Cellini, A.; Spinelli, F.; Nicola, S.; Fernandez, J.A.; Crepaldi, A.; Gianquinto, G.; Marcelis, L.F.M. Optimal Light Intensity for Sustainable Water and Energy Use in Indoor Cultivation of Lettuce and Basil under Red and Blue LEDs. Sci. Hortic. 2020, 272, 109508. [Google Scholar] [CrossRef]
- Cernusak, L.A.; Aranda, J.; Marshall, J.D.; Winter, K. Large Variation in Whole-Plant Water-Use Efficiency among Tropical Tree Species. New Phytol. 2007, 173, 294–305. [Google Scholar] [CrossRef]
- Way, D.A.; Katul, G.G.; Manzoni, S.; Vico, G. Increasing Water Use Efficiency along the C3 to C4 Evolutionary Pathway: A Stomatal Optimization Perspective. J. Exp. Bot. 2014, 65, 3683–3693. [Google Scholar] [CrossRef]
- Zhen, S.; Bugbee, B. Steady-State Stomatal Responses of C3 and C4 Species to Blue Light Fraction: Interactions with CO2 Concentration. Plant Cell Environ. 2020, 43, 3020–3032. [Google Scholar] [CrossRef]
- Almaliotis, D.; Velemis, D.; Bladenopoulou, S.; Karapetsas, N. Leaf Nutrient Levels of Strawberries (Cv. Tudla) in Relation to Crop Yield. Acta Hortic. 2002, 567, 447–450. [Google Scholar] [CrossRef]
- Pond, A.P.; Walworth, J.L.; Kilby, M.W.; Gibson, R.D.; Call, R.E.; Núñez, H. Leaf Nutrient Levels for Pecans. HortScience 2006, 41, 1339–1341. [Google Scholar] [CrossRef]
- Sugiura, D.; Tateno, M. Optimal Leaf-to-Root Ratio and Leaf Nitrogen Content Determined by Light and Nitrogen Availabilities. PLoS ONE 2011, 6, e22236. [Google Scholar] [CrossRef] [PubMed]
- Yang, T.; Kim, H.-J. Characterizing Nutrient Composition and Concentration in Tomato-, Basil-, and Lettuce-Based Aquaponic and Hydroponic Systems. Water 2020, 12, 1259. [Google Scholar] [CrossRef]
- Hochmuth, G.; Maynard, D.; Vavrina, C.; Simonne, E. Plant Tissue Analysis and Interpretation for Vegetable Crops in Florida; University of Florida: Gainesville, FL, USA, 2018. [Google Scholar]
- Chapman, H. Diagnostic Criteria for Plants and Soils; Division of Agricultural Sciences, University of California: Oakland, CA, USA, 1966. [Google Scholar]
- Winsor, G.; Adams, P. Diagnosis of Mineral Disorders in Plants: Glasshouse Crops; Robinson, J.B.D., Ed.; Her Majesty’s Stationery Office: London, UK, 1987; ISBN 978-0-11-242723-0. [Google Scholar]
- Stevens, G.; Motavalli, P.; Scharf, P.; Nathan, M.; Dunn, D. Nutrient Deficiencies and Toxicities in Crop Plants; Bennett, W.F., Ed.; APS Press: St. Paul, MN, USA, 1993; ISBN 978-0-89054-151-7. [Google Scholar]
- Marschner, H. Marschner’s Mineral Nutrition of Higher Plants, 3rd ed.; Marschner, H., Marschner, P., Eds.; Elsevier: Amsterdam, The Netherlands; Academic Press: London, UK, 2012; ISBN 978-0-12-384905-2. [Google Scholar]
- Bugbee, B.; Langenfeld, N. Utah Hydroponic Solutions. Digit. Commons USU 2022, 1–9. Available online: https://digitalcommons.usu.edu/cgi/viewcontent.cgi?article=1001&context=cpl_nutrients (accessed on 7 June 2022).
- Jones, L.H.P.; Handreck, K.A. Silica in Soils, Plants, and Animals. In Advances in Agronomy; Elsevier: Amsterdam, The Netherlands, 1967; Volume 19, pp. 107–149. ISBN 978-0-12-000719-6. [Google Scholar]
- Bellaloui, N.; Brown, P.H. Cultivar Differences in Boron Uptake and Distribution in Celery (Apium Graveolens), Tomato (Lycopersicon Esculentum) and Wheat (Triticum Aestivum). Plant Soil 1998, 198, 153–158. [Google Scholar] [CrossRef]
- Sen Gupta, B.; Curran, M.; Hasan, S.; Ghosh, T.K. Adsorption Characteristics of Cu and Ni on Irish Peat Moss. J. Environ. Manag. 2009, 90, 954–960. [Google Scholar] [CrossRef]
- Wenzel, T. Mass and Charge Balances. LibreTexts. 2022. Available online: https://batch.libretexts.org/print/url=https://chem.libretexts.org/Bookshelves/Analytical_Chemistry/Supplemental_Modules_(Analytical_Chemistry)/Analytical_Sciences_Digital_Library/JASDL/Courseware/Chemical_Equilibrium/02_Text/04_Mass_and_Charge_Balances.pdf (accessed on 7 June 2022).
- Sonneveld, C.; Voogt, W. Nutrient Solutions for Soilless Cultures. In Plant Nutrition of Greenhouse Crops; Springer: Dordrecht, The Netherlands, 2009; pp. 257–275. ISBN 978-90-481-2531-9. [Google Scholar]
- Alejandro, S.; Höller, S.; Meier, B.; Peiter, E. Manganese in Plants: From Acquisition to Subcellular Allocation. Front. Plant Sci. 2020, 11, 300. [Google Scholar] [CrossRef]
- Hem, J. Chemical Equilibria and Rates of Manganese Oxidation: Chemistry of Manganese in Natural Water; United States Government Printing Office: Washington, DC, USA, 1963. [Google Scholar]
- Huett, D. Prospects for Manipulating the Vegetative-Reproductive Balance in Horticultural Crops through Nitrogen Nutrition: A Review. Aust. J. Agric. Res. 1996, 47, 47. [Google Scholar] [CrossRef]
- Justice, A.; Faust, J.E. Phosphorus-Restriction as a Potential Technique to Control Impatiens Stem Elongation. Acta Hortic. 2015, 1104, 9–14. [Google Scholar] [CrossRef]
- Ramírez S, L.F.; Díaz S, F.R.; Muro E, J. Relation between soilless tomato quality and potassium concentration in nutritive solution. Acta Hortic. 2012, 947, 215–221. [Google Scholar] [CrossRef]
- Bhatti, A.S.; Loneragan, J.F. Phosphorus Concentrations in Wheat Leaves in Relation to Phosphorus Toxicity. Agron. J. 1970, 62, 288–290. [Google Scholar] [CrossRef]
- Loneragan, J.F.; Grove, T.S.; Robson, A.D.; Snowball, K. Phosphorus Toxicity as a Factor in Zinc-Phosphorus Interactions in Plants. Soil Sci. Soc. Am. J. 1979, 43, 966–972. [Google Scholar] [CrossRef]
- Parry, C.; Bugbee, B. Reduced Root-Zone Phosphorus Concentration Decreases Iron Chlorosis in Maize in Soilless Substrates. HortTechnology 2017, 27, 490–493. [Google Scholar] [CrossRef]
- Šimůnek, J.; Hopmans, J.W. Modeling Compensated Root Water and Nutrient Uptake. Ecol. Model. 2009, 220, 505–521. [Google Scholar] [CrossRef]
- Mitra, G. Essential Plant Nutrients and Recent Concepts about Their Uptake. In Essential Plant Nutrients; Naeem, M., Ansari, A.A., Gill, S.S., Eds.; Springer International Publishing: Cham, Switzerland, 2017; pp. 3–36. ISBN 978-3-319-58840-7. [Google Scholar]
- Castaings, L.; Caquot, A.; Loubet, S.; Curie, C. The High-Affinity Metal Transporters NRAMP1 and IRT1 Team up to Take up Iron under Sufficient Metal Provision. Sci. Rep. 2016, 6, 37222. [Google Scholar] [CrossRef]
- Graham, R.D.; Hannam, R.J.; Uren, N.C. Manganese in Soils and Plants: Proceedings of the International Symposium on “Manganese in Soils and Plants” Held at the Waite Agricultural Research Institute, the University of Adelaide, Glen Osmond, South Australia, August 22–26, 1988 as an Australian Bicentennial Event; Springer: Dordrecht, The Switzerland, 1988; ISBN 978-94-009-2817-6. [Google Scholar]
- Le Bot, J.; Kirkby, E.A.; van Beusichem, M.L. Manganese Toxicity in Tomato Plants: Effects on Cation Uptake and Distribution. J. Plant Nutr. 1990, 13, 513–525. [Google Scholar] [CrossRef]
- Epstein, E.; Bloom, A.J. Mineral Nutrition of Plants: Principles and Perspectives, 2nd ed.; Sinauer Associates: Sunderland, MA, USA, 2005; ISBN 978-0-87893-172-9. [Google Scholar]
- Taiz, L.; Zeiger, E. Plant Physiology, 5th ed.; Sinauer Associates: Sunderland, MA, USA, 2010; ISBN 978-0-87893-866-7. [Google Scholar]
- Xu, G.; Fan, X.; Miller, A.J. Plant Nitrogen Assimilation and Use Efficiency. Annu. Rev. Plant Biol. 2012, 63, 153–182. [Google Scholar] [CrossRef]
- Siddiqi, M.Y.; Malhotra, B.; Min, Z.; Glass, A. Effects of Ammonium and Inorganic Carbon Enrichment on Growth and Yield of a Hydroponic Tomato Crop. J. Plant Nutr. Soil Sci. 2002, 165, 191–197. [Google Scholar] [CrossRef]
- Youngdahl, L.J.; Pacheco, R.; Street, J.J.; Vlek, P.L.G. The Kinetics of Ammonium and Nitrate Uptake by Young Rice Plants. Plant Soil 1982, 69, 225–232. [Google Scholar] [CrossRef]
- Hooten, T. Ammonium and Nitrate Effects on Growth, Development and Nutrient Uptake of Hydroponic Wheat. Ph.D. Thesis, Utah State University, Logan, UT, USA, 1998. [Google Scholar]
- Weil, S.; Barker, A.V.; Zandvakili, O.R.; Etemadi, F. Plant Growth and Calcium and Potassium Accumulation in Lettuce under Different Nitrogen Regimes of Ammonium and Nitrate Nutrition. J. Plant Nutr. 2021, 44, 270–281. [Google Scholar] [CrossRef]
- Johnson, C.N.; Fisher, P.R.; Huang, J.; Yeager, T.H.; Obreza, T.A.; Vetanovetz, R.P.; Argo, W.R.; Jeremy Bishko, A. Effect of Fertilizer Potential Acidity and Nitrogen form on the PH Response in a Peat-Based Substrate with Three Floricultural Species. Sci. Hortic. 2013, 162, 135–143. [Google Scholar] [CrossRef]
- Dickson, R.W.; Fisher, P.R.; Argo, W.R.; Jacques, D.J.; Sartain, J.B.; Trenholm, L.E.; Yeager, T.H. Solution Ammonium: Nitrate Ratio and Cation/Anion Uptake Affect Acidity or Basicity with Floriculture Species in Hydroponics. Sci. Hortic. 2016, 200, 36–44. [Google Scholar] [CrossRef]
- Mazzei, L.; Musiani, F.; Ciurli, S. The Structure-Based Reaction Mechanism of Urease, a Nickel Dependent Enzyme: Tale of a Long Debate. J. Biol. Inorg. Chem. 2021, 26, 171–173. [Google Scholar] [CrossRef] [PubMed]
- Langenfeld, N.J.; Payne, L.E.; Bugbee, B. Colorimetric Determination of Urea Using Diacetyl Monoxime with Strong Acids. PLoS ONE 2021, 16, e0259760. [Google Scholar] [CrossRef] [PubMed]
- Tan, X.W.; Ikeda, H.; Oda, M. The Absorption, Translocation, and Assimilation of Urea, Nitrate or Ammonium in Tomato Plants at Different Plant Growth Stages in Hydroponic Culture. Sci. Hortic. 2000, 84, 275–283. [Google Scholar] [CrossRef]
- Zhu, Z.; Gerendas, J.; Sattelmacher, B. Effects of Replacing of Nitrate with Urea or Chloride on the Growth and Nitrate Accumulation in Pak-Choi in the Hydroponics. In Plant Nutrition for Sustainable Food Production and Environment; Ando, T., Fujita, K., Mae, T., Matsumoto, H., Mori, S., Sekiya, J., Eds.; Springer: Dordrecht, The Netherlands, 1997; pp. 963–964. ISBN 978-94-010-6510-8. [Google Scholar]
- Luo, J.; Lian, Z.; Yan, X. Urea Transformation and the Adaptability of Three Leafy Vegetables to Urea as a Source of Nitrogen in Hydroponic Culture. J. Plant Nutr. 1993, 16, 797–812. [Google Scholar] [CrossRef]
- Elliot, G. Urea Hydrolysis in Potting Media. J. Am. Soc. Hortic. Sci. 1986, 111, 862–866. [Google Scholar] [CrossRef]
- Ding, X.; Jiang, Y.; Zhao, H.; Guo, D.; He, L.; Liu, F.; Zhou, Q.; Nandwani, D.; Hui, D.; Yu, J. Electrical Conductivity of Nutrient Solution Influenced Photosynthesis, Quality, and Antioxidant Enzyme Activity of Pakchoi (Brassica Campestris L. Ssp. Chinensis) in a Hydroponic System. PLoS ONE 2018, 13, e0202090. [Google Scholar] [CrossRef]
- Belessiotis, V.; Kalogirou, S.; Delyannis, E. Water, the Raw Material for Desalination. In Thermal Solar Desalination; Elsevier: Amsterdam, The Netherlands, 2016; pp. 21–102. ISBN 978-0-12-809656-7. [Google Scholar]
- Solomon, T. The Definition and Unit of Ionic Strength. J. Chem. Educ. 2001, 78, 1691. [Google Scholar] [CrossRef]
- Griffin, B.A.; Jurinak, J.J. Estimation of Activity Coefficients from the Electrical Conductivity of Natural Aquatic Systems and Soil Extracts. Soil Sci. 1973, 116, 26–30. [Google Scholar] [CrossRef]
- Lewis, G.N.; Randall, M. Thermodynamics and the Free Energy of Chemical Substances; McGraw-Hill: New York, NY, USA, 1923. [Google Scholar]
- Cooper, A.J.; Charlesworth, R.R. Nutritional Control of a Nutrient-Film Tomato Crop. Sci. Hortic. 1977, 7, 189–195. [Google Scholar] [CrossRef]
- Heins, R.D.; Yelanich, M. Fertilization Regimes Exceed Nutritional Requirements of Greenhouse Crops. IFAC Proc. Vol. 2013, 46, 5–8. [Google Scholar] [CrossRef]
- Salisbury, F.B.; Ross, C.W. Plant Physiology, 4th ed.; Wadsworth Pub. Co.: Belmont, CA, USA, 1992; ISBN 978-0-534-15162-1. [Google Scholar]
- Campbell, G.S.; Norman, J.M. Introduction to Environmental Biophysics, 2nd ed.; Springer: New York, NY, USA, 1998; ISBN 978-0-387-94937-6. [Google Scholar]
- Richards, L. Diagnosis and Improvement of Saline and Alkali Soils; United States Department of Agriculture: Washington, DC, USA, 1954. [Google Scholar]
- Campbell, R.B.; Bower, C.A.; Richards, L.A. Change of Electrical Conductivity With Temperature and the Relation of Osmotic Pressure to Electrical Conductivity and Ion Concentration for Soil Extracts. Soil Sci. Soc. Am. J. 1949, 13, 66–69. [Google Scholar] [CrossRef]
- Naigaga, S.; Boyd, C.E.; Gaillard, P.; Abdelrahman, H.A.; Molnar, J.J. Assessing the Reliability of Water-Test Kits for Use in Pond Aquaculture: Assessing the Reliability of Water-Test Kits. J. World Aquac. Soc. 2017, 48, 555–562. [Google Scholar] [CrossRef]
- Ormaza-González, F.I.; Villalba-Flor, A.P. The Measurement of Nitrite, Nitrate and Phosphate with Test Kits and Standard Procedures: A Comparison. Water Res. 1994, 28, 2223–2228. [Google Scholar] [CrossRef]
- Unger-Heumann, M. Strategy of Analytical Test Kits. Anal. Bioanal. Chem. 1996, 354, 803–806. [Google Scholar] [CrossRef] [PubMed]
- Kalra, Y.P.; Soil and Plant Analysis Council, Inc. (Eds.) Handbook of Reference Methods for Plant Analysis; CRC Press: Boca Raton, FL, USA, 1998; ISBN 978-1-57444-124-6. [Google Scholar]
- Jones, J.B.; Case, V.W. Sampling, Handling, and Analyzing Plant Tissue Samples. In SSSA Book Series; Westerman, R.L., Ed.; Soil Science Society of America: Madison, WI, USA, 2018; pp. 389–427. ISBN 978-0-89118-862-9. [Google Scholar]
- Lucena, J.J.; Chaney, R.L. Response of Cucumber Plants to Low Doses of Different Synthetic Iron Chelates in Hydroponics. J. Plant Nutr. 2007, 30, 795–809. [Google Scholar] [CrossRef]
- Halvorson, A.D.; Lindsay, W.L. Equilibrium Relationships of Metal Chelates in Hydroponic Solutions. Soil Sci. Soc. Am. J. 1972, 36, 755–761. [Google Scholar] [CrossRef]
- Brown, J.C. Agricultural Use of Synthetic Metal Chelates. Soil Sci. Soc. Am. J. 1969, 33, 59–61. [Google Scholar] [CrossRef]
- Norvell, W.A. Reactions of Metal Chelates in Soils and Nutrient Solutions. In SSSA Book Series; Mortvedt, J.J., Ed.; Soil Science Society of America: Madison, WI, USA, 2018; pp. 187–227. ISBN 978-0-89118-878-0. [Google Scholar]
- Kusuma, P.; Bugbee, B. Reduced Chelate Strength Increases Iron Bioavailability for Monocots in Hydroponics; Utah State University: Logan, UT, USA, 2022. [Google Scholar]
- Bell, P.F.; McLaughlin, M.J.; Cozens, G.; Stevens, D.P.; Owens, G.; South, H. Plant Uptake of 14C-EDTA, 14C-Citrate, and 14C-Histidine from Chelator-Buffered and Conventional Hydroponic Solutions. Plant Soil 2003, 253, 311–319. [Google Scholar] [CrossRef]
- Bindra, P.; Kaur, K.; Rawat, A.; De Sarkar, A.; Singh, M.; Shanmugam, V. Nano-Hives for Plant Stimuli Controlled Targeted Iron Fertilizer Application. Chem. Eng. J. 2019, 375, 121995. [Google Scholar] [CrossRef]
- Rui, M.; Ma, C.; Hao, Y.; Guo, J.; Rui, Y.; Tang, X.; Zhao, Q.; Fan, X.; Zhang, Z.; Hou, T.; et al. Iron Oxide Nanoparticles as a Potential Iron Fertilizer for Peanut (Arachis Hypogaea). Front. Plant Sci. 2016, 7. [Google Scholar] [CrossRef] [PubMed]
- Tibbitts, S. Effect of Silicon on Wheat Growth and Development in Drought and Salinity Stress; Utah State University: Logan, UT, USA, 2018. [Google Scholar]
- Kaushik, P.; Saini, D.K. Silicon as a Vegetable Crops Modulator—A Review. Plants 2019, 8, 148. [Google Scholar] [CrossRef]
- Ma, J.F.; Miyake, Y.; Takahashi, E. Silicon as a Beneficial Element for Crop Plants. In Studies in Plant Science; Elsevier: Amsterdam, The Netherlands, 2001; Volume 8, pp. 17–39. ISBN 978-0-444-50262-9. [Google Scholar]
- Fatzinger, B.; Bugbee, B. pH 11.3 Enhances the Solubility of Potassium Silicate for Liquid Fertilizer; Utah State University: Logan, UT, USA, 2021; pp. 1–2. [Google Scholar]
- Yruela, I. Copper in Plants: Acquisition, Transport and Interactions. Funct. Plant Biol. 2009, 36, 409. [Google Scholar] [CrossRef] [PubMed]
- Zhang, X.; Johnson, C.; Reed, D.T. Management of Pythium Myriotylum in Tobacco Transplant Production Greenhouses. Plant Health Prog. 2021, 22, PHP-03-21-0062-FI. [Google Scholar] [CrossRef]
- Raudales, R.E.; Parke, J.L.; Guy, C.L.; Fisher, P.R. Control of Waterborne Microbes in Irrigation: A Review. Agric. Water Manag. 2014, 143, 9–28. [Google Scholar] [CrossRef]
- Hosseinzadeh, S.; Verheust, Y.; Bonarrigo, G.; Van Hulle, S. Closed Hydroponic Systems: Operational Parameters, Root Exudates Occurrence and Related Water Treatment. Rev. Environ. Sci. Biotechnol. 2017, 16, 59–79. [Google Scholar] [CrossRef]
- Razzak, M.A.; Talukder, M.R.; Asaduzzaman, M.; Tanaka, H.; Asao, T. Appropriate Strategies of Electrodegradation for the Alleviation of Growth Retardation during Autotoxicity of Lettuce in Recycled Hydroponics. N. Z. J. Crop Hortic. Sci. 2021, 1–18. [Google Scholar] [CrossRef]
- Rolfe, S.A.; Griffiths, J.; Ton, J. Crying out for Help with Root Exudates: Adaptive Mechanisms by Which Stressed Plants Assemble Health-Promoting Soil Microbiomes. Curr. Opin. Microbiol. 2019, 49, 73–82. [Google Scholar] [CrossRef]
- Ehret, D.L.; Alsanius, B.; Wohanka, W.; Menzies, J.G.; Utkhede, R. Disinfestation of Recirculating Nutrient Solutions in Greenhouse Horticulture. Agronomie 2001, 21, 323–339. [Google Scholar] [CrossRef]
- Hong, C.X.; Moorman, G.W. Plant Pathogens in Irrigation Water: Challenges and Opportunities. Crit. Rev. Plant Sci. 2005, 24, 189–208. [Google Scholar] [CrossRef]
- Graham, T.; Zhang, P.; Dixon, M. Aqueous Ozone in the Root Zone: Friend or Foe? J. Hortic. For. 2011, 3, 58–62. [Google Scholar]
- Graham, T.; Zhang, P.; Woyzbun, E.; Dixon, M. Response of Hydroponic Tomato to Daily Applications of Aqueous Ozone via Drip Irrigation. Sci. Hortic. 2011, 129, 464–471. [Google Scholar] [CrossRef]
- Fisher, P.R.; Mohammad-Pour, G. Interactions of Fertilizer and Chemical Sanitizing Agents in Water. Acta Hortic. 2022, 25–32. [Google Scholar] [CrossRef]
- Buyanovsky, G.; Gale, J.; Degani, N. Ultra-Violet Radiation for the Inactivation of Microorganisms in Hydroponics. Plant Soil 1981, 60, 131–136. [Google Scholar] [CrossRef]
- Sillanpaa, M.; Pirkanniemi, K. Recent Developments in Chelate Degradation. Environ. Technol. 2001, 22, 791–801. [Google Scholar] [CrossRef]
- Gillespie, D.P.; Papio, G.; Kubota, C. High Nutrient Concentrations of Hydroponic Solution can Improve Growth and Nutrient Uptake of Spinach (Spinacia Oleracea L.) Grown in Acidic Nutrient Solution. Horts 2021, 56, 687–694. [Google Scholar] [CrossRef]
- Gillespie, D.P.; Kubota, C.; Miller, S.A. Effects of Low PH of Hydroponic Nutrient Solution on Plant Growth, Nutrient Uptake, and Root Rot Disease Incidence of Basil (Ocimum Basilicum L.). Horts 2020, 55, 1251–1258. [Google Scholar] [CrossRef]
- Lee, S.; Lee, J. Beneficial Bacteria and Fungi in Hydroponic Systems: Types and Characteristics of Hydroponic Food Production Methods. Sci. Hortic. 2015, 195, 206–215. [Google Scholar] [CrossRef]
- Son, J.E.; Kim, H.J.; Ahn, T.I. Hydroponic Systems. In Plant Factory; Elsevier: Amsterdam, The Netherlands, 2020; pp. 273–283. ISBN 978-0-12-816691-8. [Google Scholar]
- Blok, C.; Jackson, B.E.; Guo, X.; de Visser, P.H.B.; Marcelis, L.F.M. Maximum Plant Uptakes for Water, Nutrients, and Oxygen Are Not Always Met by Irrigation Rate and Distribution in Water-Based Cultivation Systems. Front. Plant Sci. 2017, 8. [Google Scholar] [CrossRef]
- Butcher, J.B.; Covington, S. Dissolved-Oxygen Analysis with Temperature Dependence. J. Environ. Eng. 1995, 121, 756–759. [Google Scholar] [CrossRef]
- Zheng, Y.; Wang, L.; Dixon, M. An Upper Limit for Elevated Root Zone Dissolved Oxygen Concentration for Tomato. Sci. Hortic. 2007, 113, 162–165. [Google Scholar] [CrossRef]
- Colmer, T.D. Long-Distance Transport of Gases in Plants: A Perspective on Internal Aeration and Radial Oxygen Loss from Roots. Plant Cell Environ. 2003, 26, 17–36. [Google Scholar] [CrossRef]
- Langenfeld, N.J.; Bugbee, B. Evaluation of Three Electrochemical Dissolved Oxygen Meters. Hortte 2021, 31, 428–431. [Google Scholar] [CrossRef]
- Monje, O.; Garland, J.; Stutte, G.W. Factors Controlling Oxygen Delivery in ALS Hydroponic Systems; Society of Automotive Engineers: Warrendale, PA, USA, 2001; pp. 1–4. [Google Scholar]
- Bugbee, B.G.; Salisbury, F.B. An Evaluation of MES (2(N-Morpholino)Ethanesulfonic Acid) and Amberlite IRC-50 as PH Buffers for Nutrient Solution Studies. J. Plant Nutr. 1985, 8, 567–583. [Google Scholar] [CrossRef]
- Bernstein, N.; Lauchli, A.; Silk, W.K. Kinematics and Dynamics of Sorghum (Sorghum Bicolor L.) Leaf Development at Various Na/Ca Salinities. Plant Physiol. 1993, 103, 1107–1114. [Google Scholar] [CrossRef]
- van Ruijven, J.; van Os, E.; Beerling, E.; Blok, C.; Janse, J. Towards Zero-Liquid Discharge in Hydroponic Cultivation. Acta Hortic. 2019, 1242, 863–872. [Google Scholar] [CrossRef]
- Hansen, T.H.; de Bang, T.C.; Laursen, K.H.; Pedas, P.; Husted, S.; Schjoerring, J.K. Multielement Plant Tissue Analysis Using ICP Spectrometry. In Plant Mineral Nutrients; Maathuis, F.J.M., Ed.; Methods in Molecular Biology; Humana Press: Totowa, NJ, USA, 2013; Volume 953, pp. 121–141. ISBN 978-1-62703-151-6. [Google Scholar]
- U.S. EPA Method 6010D (SW-846): Inductively Coupled Plasma-Atomic Emission Spectrometry; United States Environmental Protection Agency: Washington, DC, USA, 2014.
- Soltanpour, P.N.; Jones, J.B.; Workman, S.M. Optical Emission Spectrometry. In Agronomy Monographs; Page, A.L., Ed.; American Society of Agronomy; Soil Science Society of America: Madison, WI, USA, 2015; pp. 29–65. ISBN 978-0-89118-977-0. [Google Scholar]
- de Hoffmann, E. Mass Spectrometry. In Kirk-Othmer Encyclopedia of Chemical Technology; John Wiley & Sons, Inc.: Hoboken, NJ, USA, 2005; ISBN 978-0-471-23896-6. [Google Scholar]
- Böhme, M.; Höhn, P.; Günther, D.; Kniep, R.; Auffermann, G. Quantitative Determination of Nitrogen by LA-ICP-MS Using 15N Enriched Binary Calcium Nitrides. J. Anal. At. Spectrom. 2010, 25, 856. [Google Scholar] [CrossRef]
- U.S. EPA Method 300: Determination of Inorganic Anions by Ion Chromatography; United States Environmental Protection Agency: Washington, DC, USA, 1993.
- Munro, W.A.; Thomas, C.L.P.; Simpson, I.; Shaw, J.; Dodgson, J. Deterioration of PH Electrode Response Due to Biofilm Formation on the Glass Membrane. Sens. Actuators B Chem. 1996, 37, 187–194. [Google Scholar] [CrossRef]
| Publisher’s Note: MDPI stays neutral with regard to jurisdictional claims in published maps and institutional affiliations. |
© 2022 by the authors. Licensee MDPI, Basel, Switzerland. This article is an open access article distributed under the terms and conditions of the Creative Commons Attribution (CC BY) license (https://creativecommons.org/licenses/by/4.0/).


 ,
, 

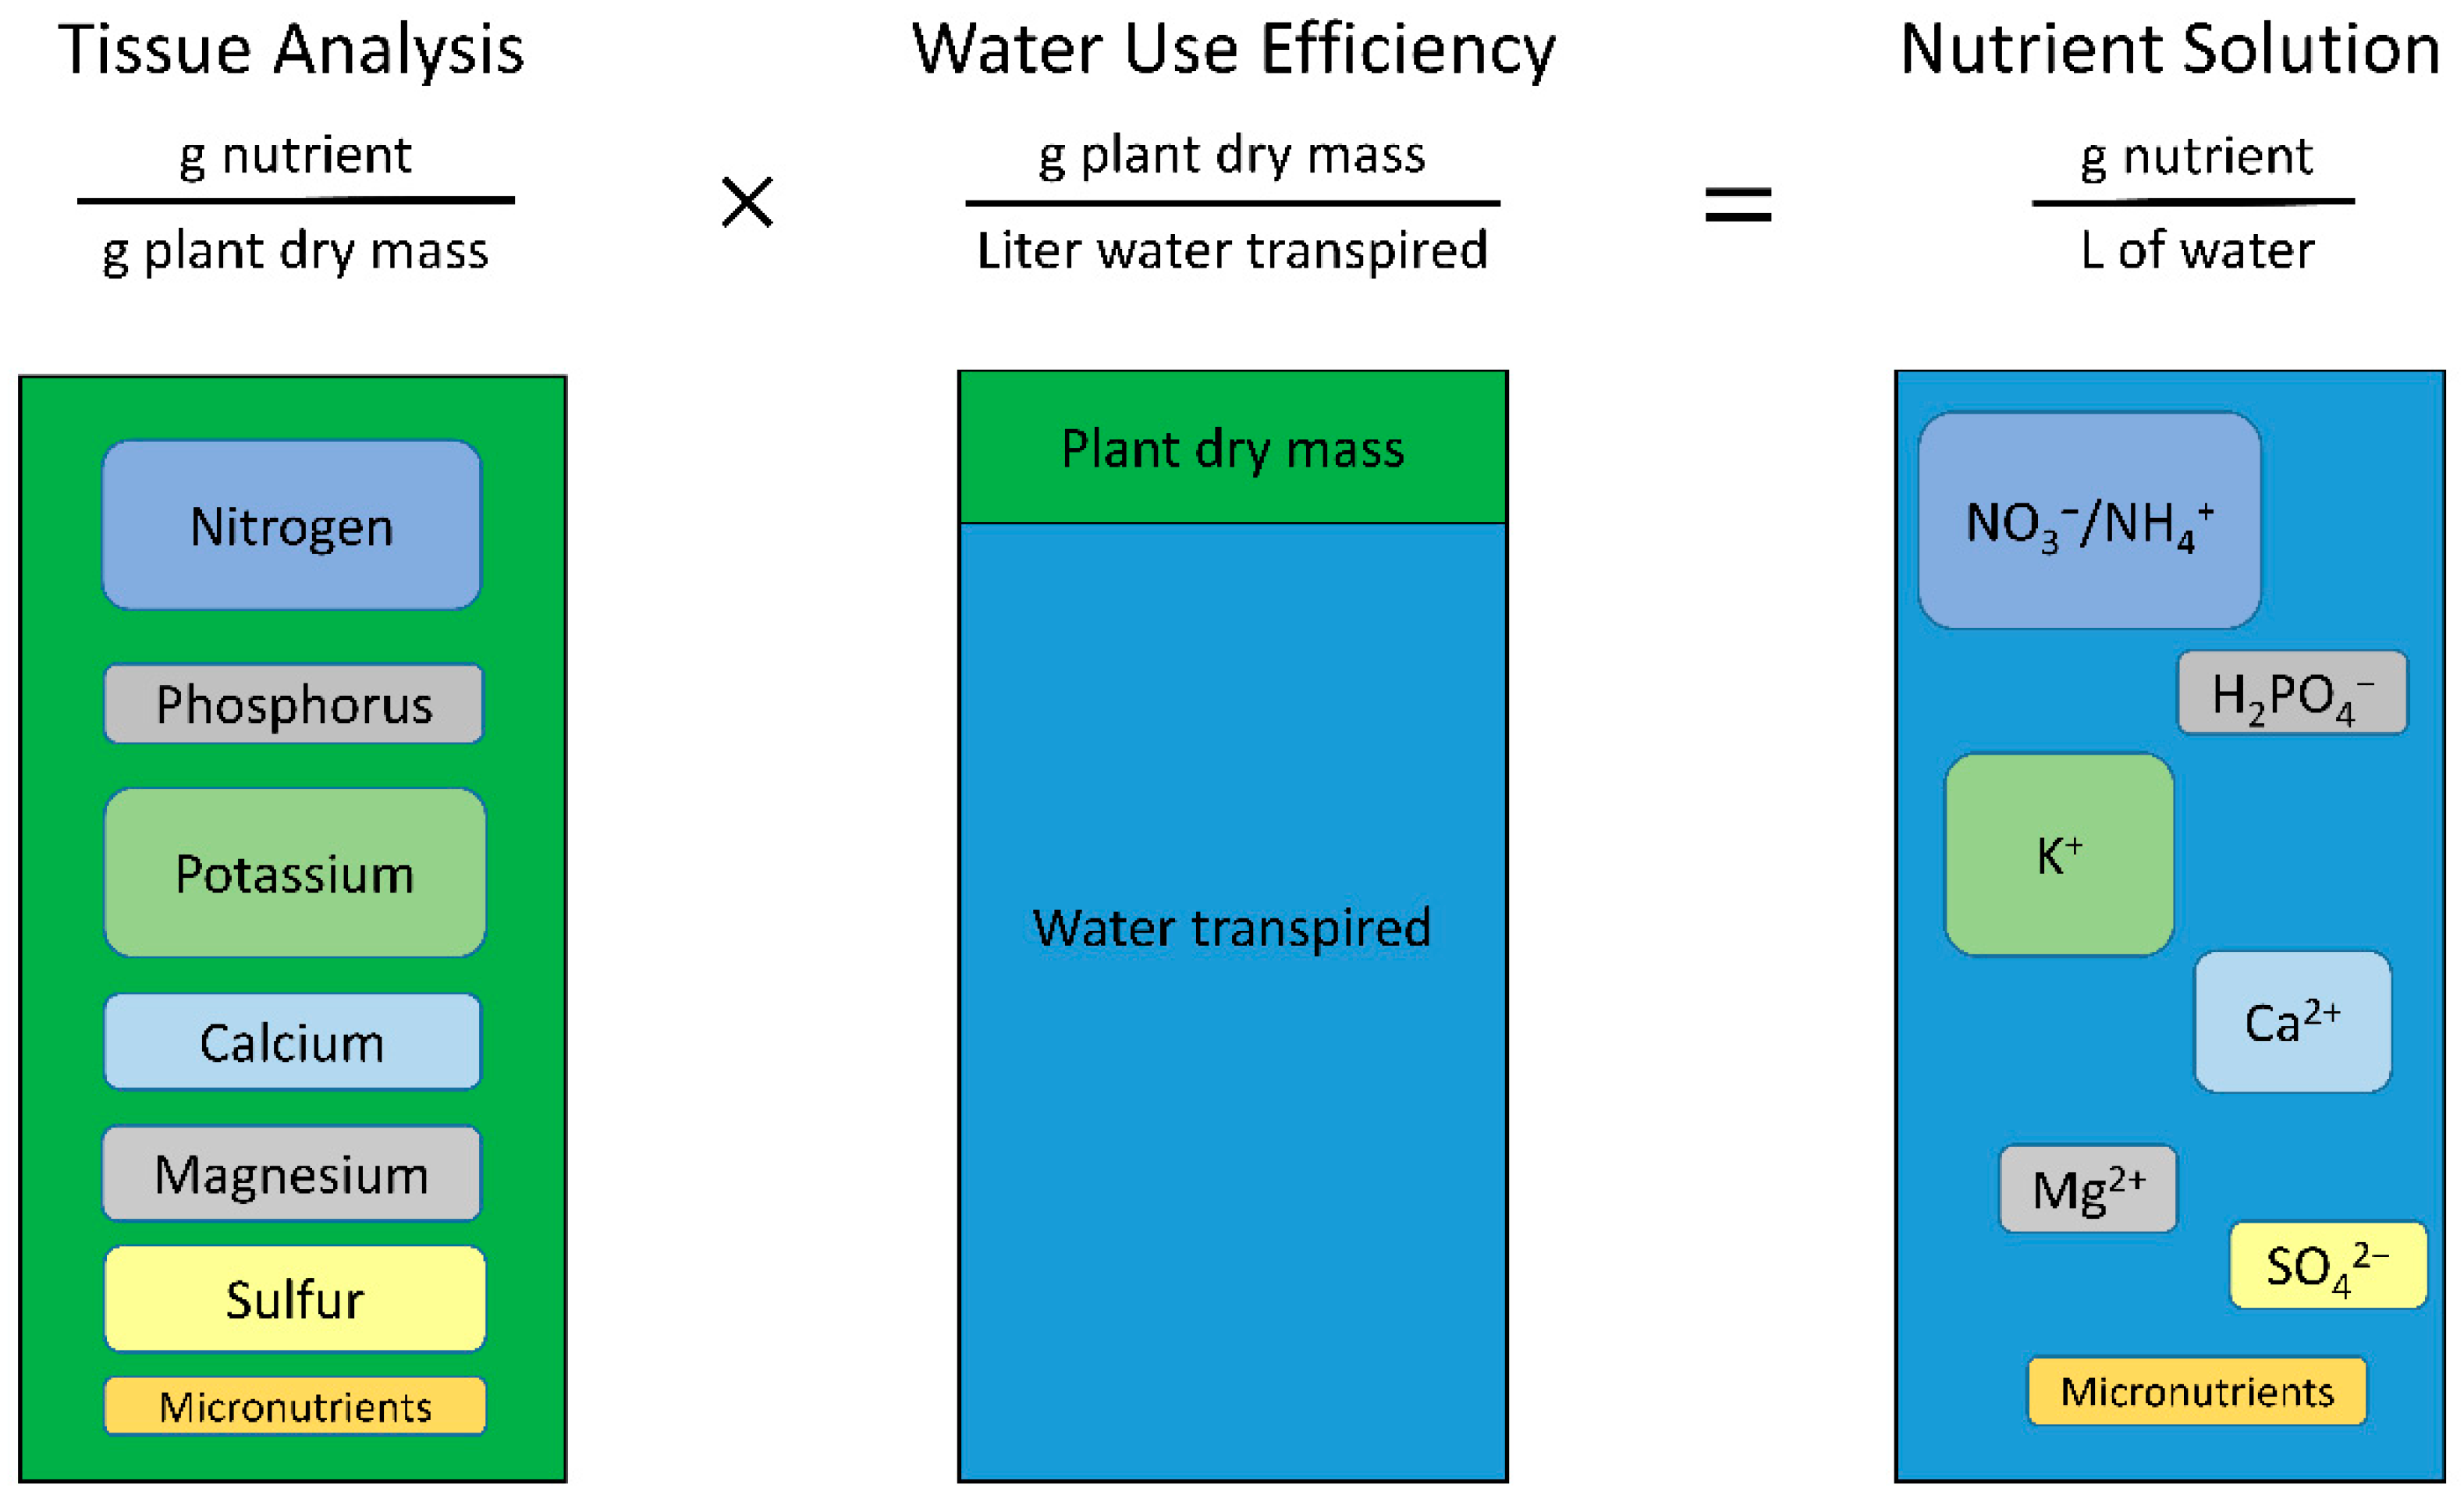