
Buy Three to Waste One? How Real-World Purchase Data Predict Groups of Food Wasters


Abstract
:1. Introduction
2. Materials and Methods
2.1. Material
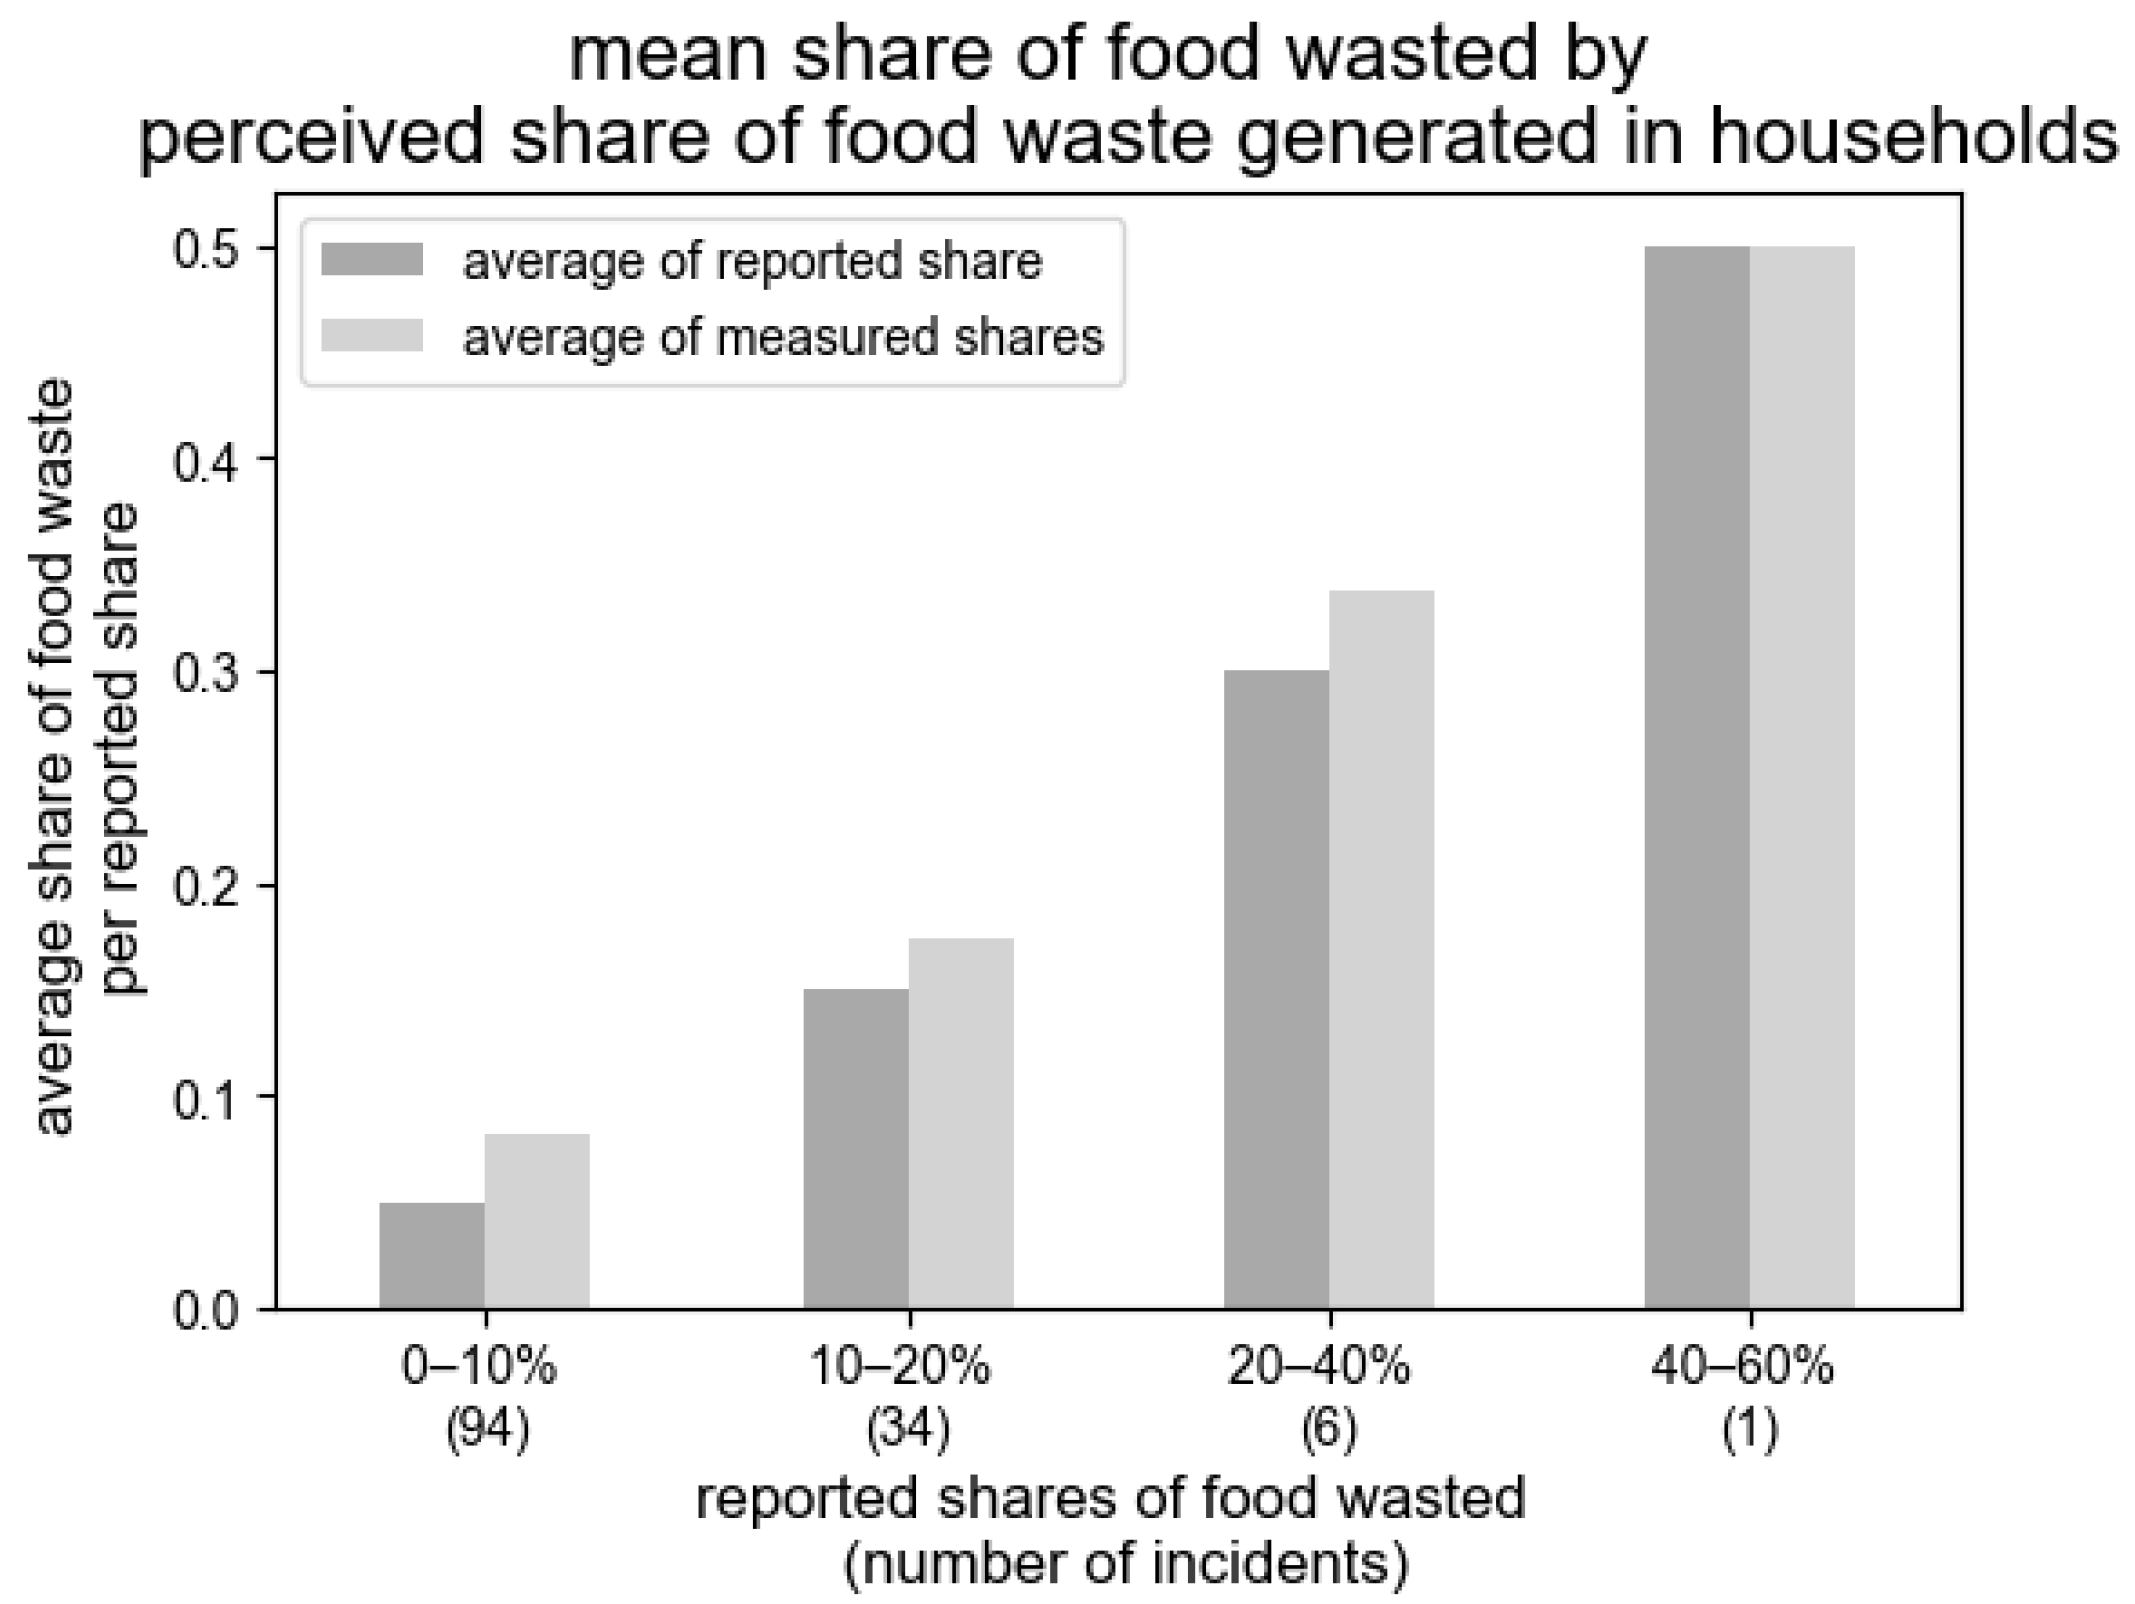
2.1.1. Food Waste Self-Reports
2.1.2. Actual Food Waste Behavior
2.1.3. Digital Purchase Data
2.1.4. Food Waste Intention and Behaviors
2.1.5. Self-Control
2.2. Sample
2.3. Preregistration, Data, and Code Availability
2.4. Ethics
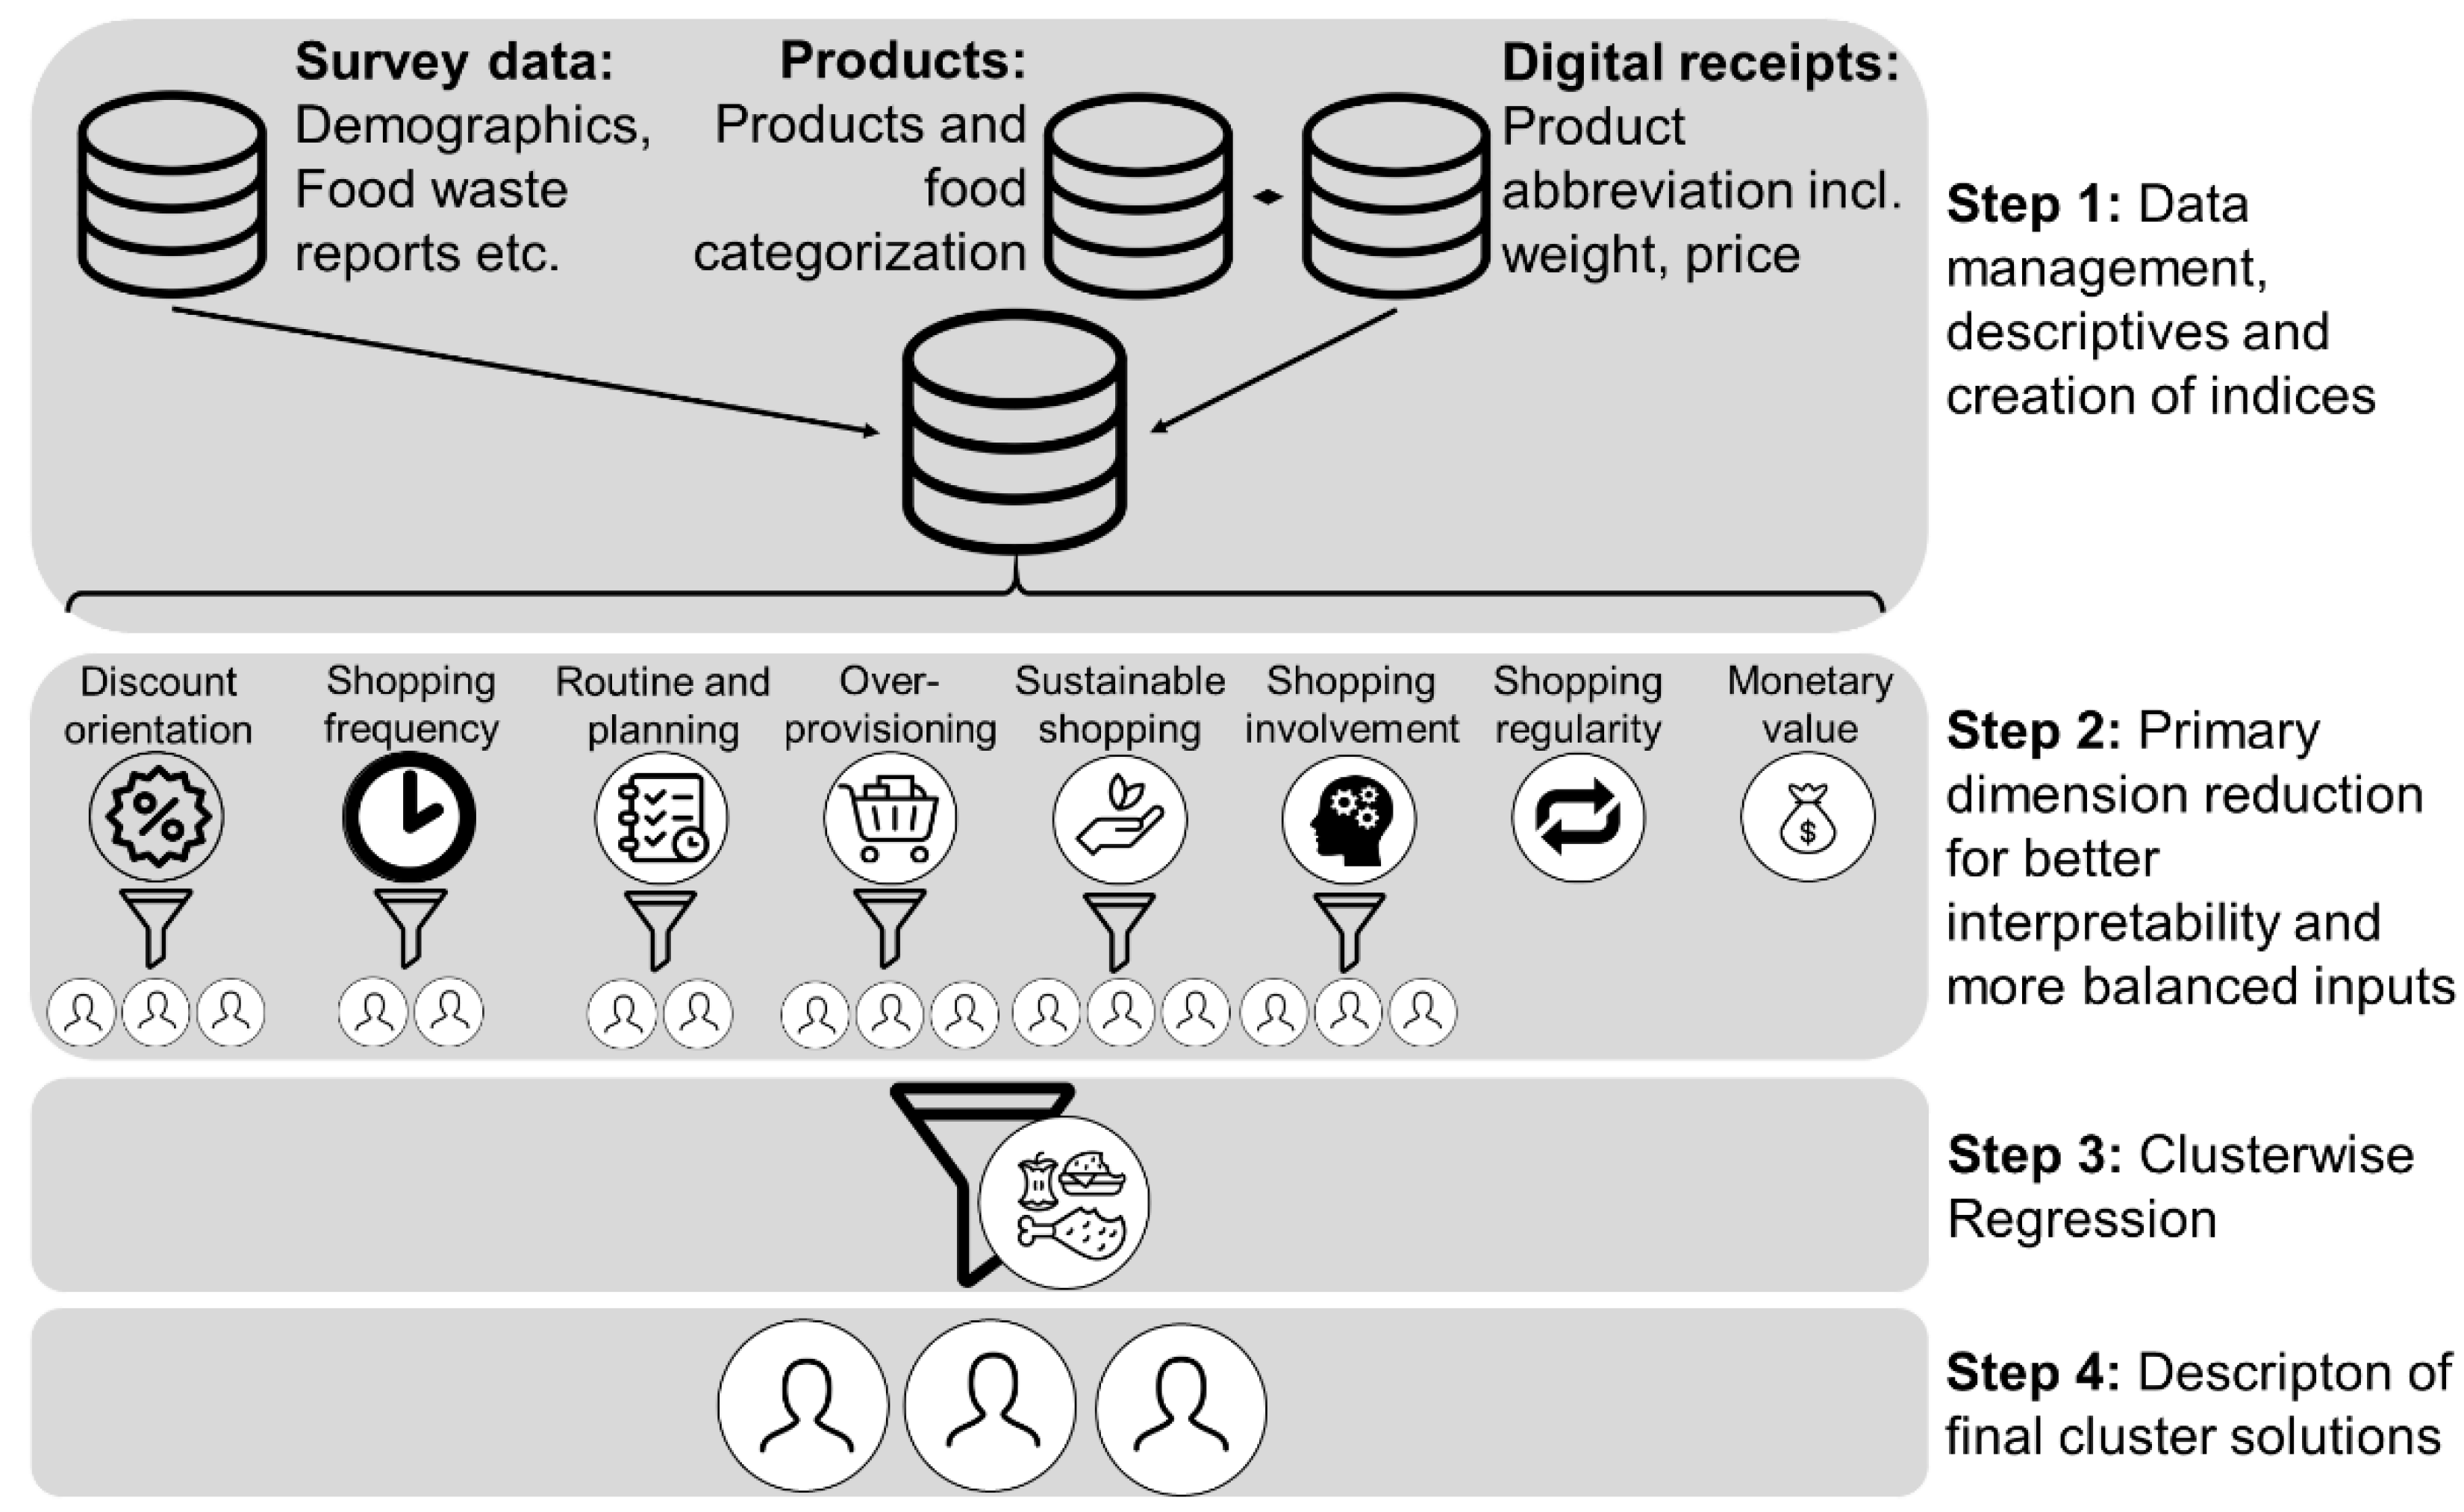
2.5. Analysis
3. Results
3.1. Preliminary Clustering-Based Dimension Reduction
3.2. Identifying Food Waste Consumer Segments with a Cluster-Wise Regression Approach
4. Discussion
4.1. Theoretical Implications
4.2. Practical Implications
4.3. Limitations and Future Research
5. Conclusions
Supplementary Materials
Author Contributions
Funding
Institutional Review Board Statement
Informed Consent Statement
Data Availability Statement
Acknowledgments
Conflicts of Interest
Appendix A

| Segmentation Basis/Cluster Name | Age | Gender (% m) | BMI | Self- Control | Education | Income | Household Size | Number of Kids |
|---|---|---|---|---|---|---|---|---|
| Non-discount shopper | 34.3 (1.14) c | 0.69 | 23.9 (0.42) | 30.2 (1.92) | 2.59 (0.07) | 3.27 (0.15) | 2.42 (0.16) | 0.46 (0.09) |
| Discount hunter | 32.5 (2.16) a | 0.78 | 25.7 (0.80) | 30.8 (3.62) | 2.70 (0.13) | 3.79 (0.27) | 2.74 (0.30) | 0.74 (0.17) |
| Discount optimizer | 39.7 (1.73) a,b | 0.74 | 25.1 (0.64) | 27.0 (2.90) | 2.67 (0.12) | 3.27 (0.22) | 2.95 (0.24) | 0.55 (0.14) |
| Non-frequent shopper | 35.6 (1.06) | 0.74 | 24.5 (0.39) | 28.8 (1.73) | 2.70 (0.07) | 3.37 (0.13) | 2.77 (0.14) b | 0.61 (0.08) |
| Frequent shopper | 34.8 (1.66) | 0.65 | 24.5 (0.60) | 31.2 (2.71) | 2.48 (0.10) | 3.34 (0.21) | 2.21 (0.22) a | 0.33 (1.13) |
| Fill-up shopper | 35.6 (0.99) | 0.72 | 24.7 (0.36) | 27.4 (1.58) b | 2.62 (0.06) | 3.36 (0.12) | 2.61 (0.13) | 0.49 (0.08) |
| Big shopper | 34.3 (2.06) | 0.68 | 23.8 (0.75) | 38.3 (3.29) a | 2.65 (0.11) | 3.35 (0.27) | 2.58 (0.28) | 0.71 (0.16) |
| Stay-home shopper | 35.5 (1.39) | 0.74 | 24.2 (0.50) | 32.3 (2.24) | 2.50 (0.08) | 3.11 (0.17) | 2.49 (0.18)c | 0.16 (0.05) c |
| Eat-out shopper | 34.9 (1.38) | 0.73 | 24.5 (0.50) | 26.2 (2.23) | 2.76 (0.09) | 3.51 (0.17) | 2.39 (0.18) c | 0.23 (0.05) c |
| Kids-provider Shopper | 36.3 (2.26) | 0.62 | 25.3 (0.82) | 30.7 (3.66) | 2.65 (0.14) | 3.58 (0.28) | 3.50 (0.30) a,b | 2.31 (0.09) a,b |
| Non-sustainable shopper | 36.3 (1.03) | 0.70 | 24.8 (0.50) | 27.8 (1.68) | 2.55 (0.06) c | 3.50 (0.13) | 2.53 (0.14) | 0.54 (0.07) |
| Pseudo-sustainable shopper | 30.6 (3.04) | 0.86 | 24.4 (0.50) | 34.1 (4.98) | 2.62 (0.17) | 3.03 (0.38) | 2.43 (0.41) | 0.29 (0.24) |
| Organic shopper | 33.8 (2.15) | 0.71 | 23.2 (0.82) | 34.8 (3.52) | 2.91 (0.13) a | 2.88 (0.27) | 2.54 (0.29) | 0.61 (0.17) |
| Producer-label shopper | 35.4 (1.14) | 0.68 | 24.7 (0.41) | 29.5 (1.84) | 2.73 (0.07) | 3.34 (0.14) | 2.47 (0.15) | 0.47 (0.08) |
| Private-label shopper | 35.4 (2.46) | 0.82 | 24.7 (0.89) | 22.5 (3.96) | 2.38 (0.16) | 3.55 (0.31) | 2.64 (0.33) | 0.36 (0.19) |
| Uninvolved shopper | 35.3 (1.80) | 0.76 | 23.8 (0.65) | 33.1 (2.90) | 2.51 (0.11) | 3.30 (0.22) | 2.93 (0.24) | 0.76 (0.14) |
Appendix B
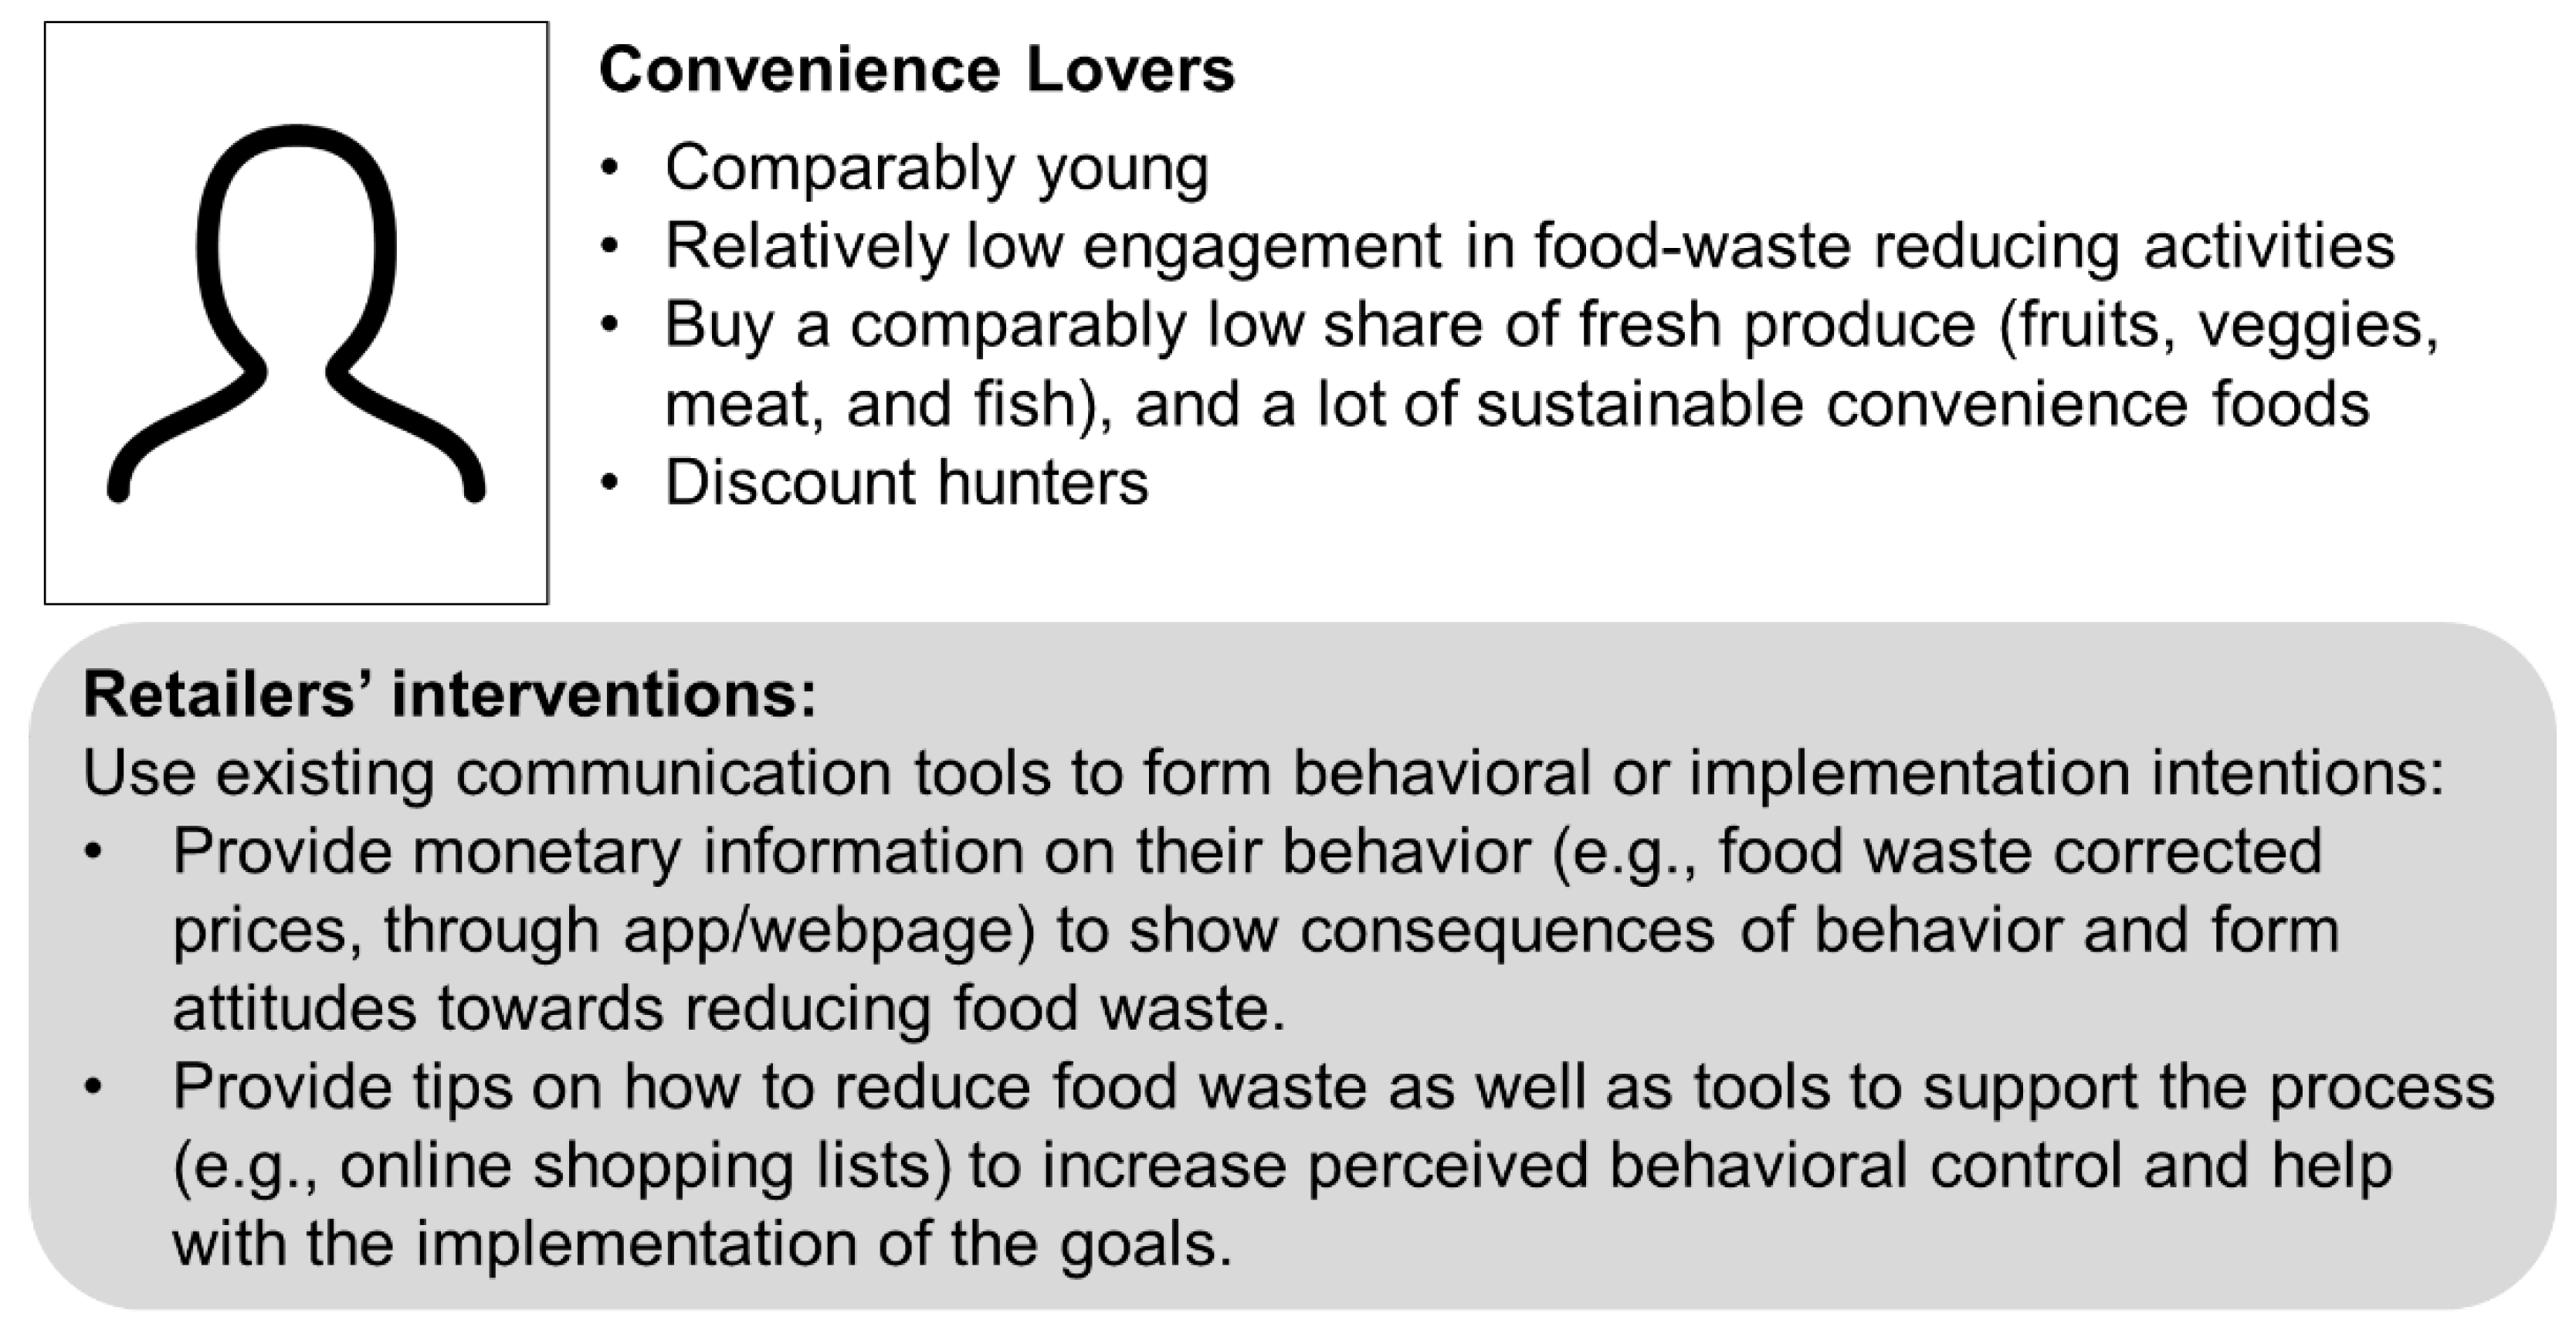
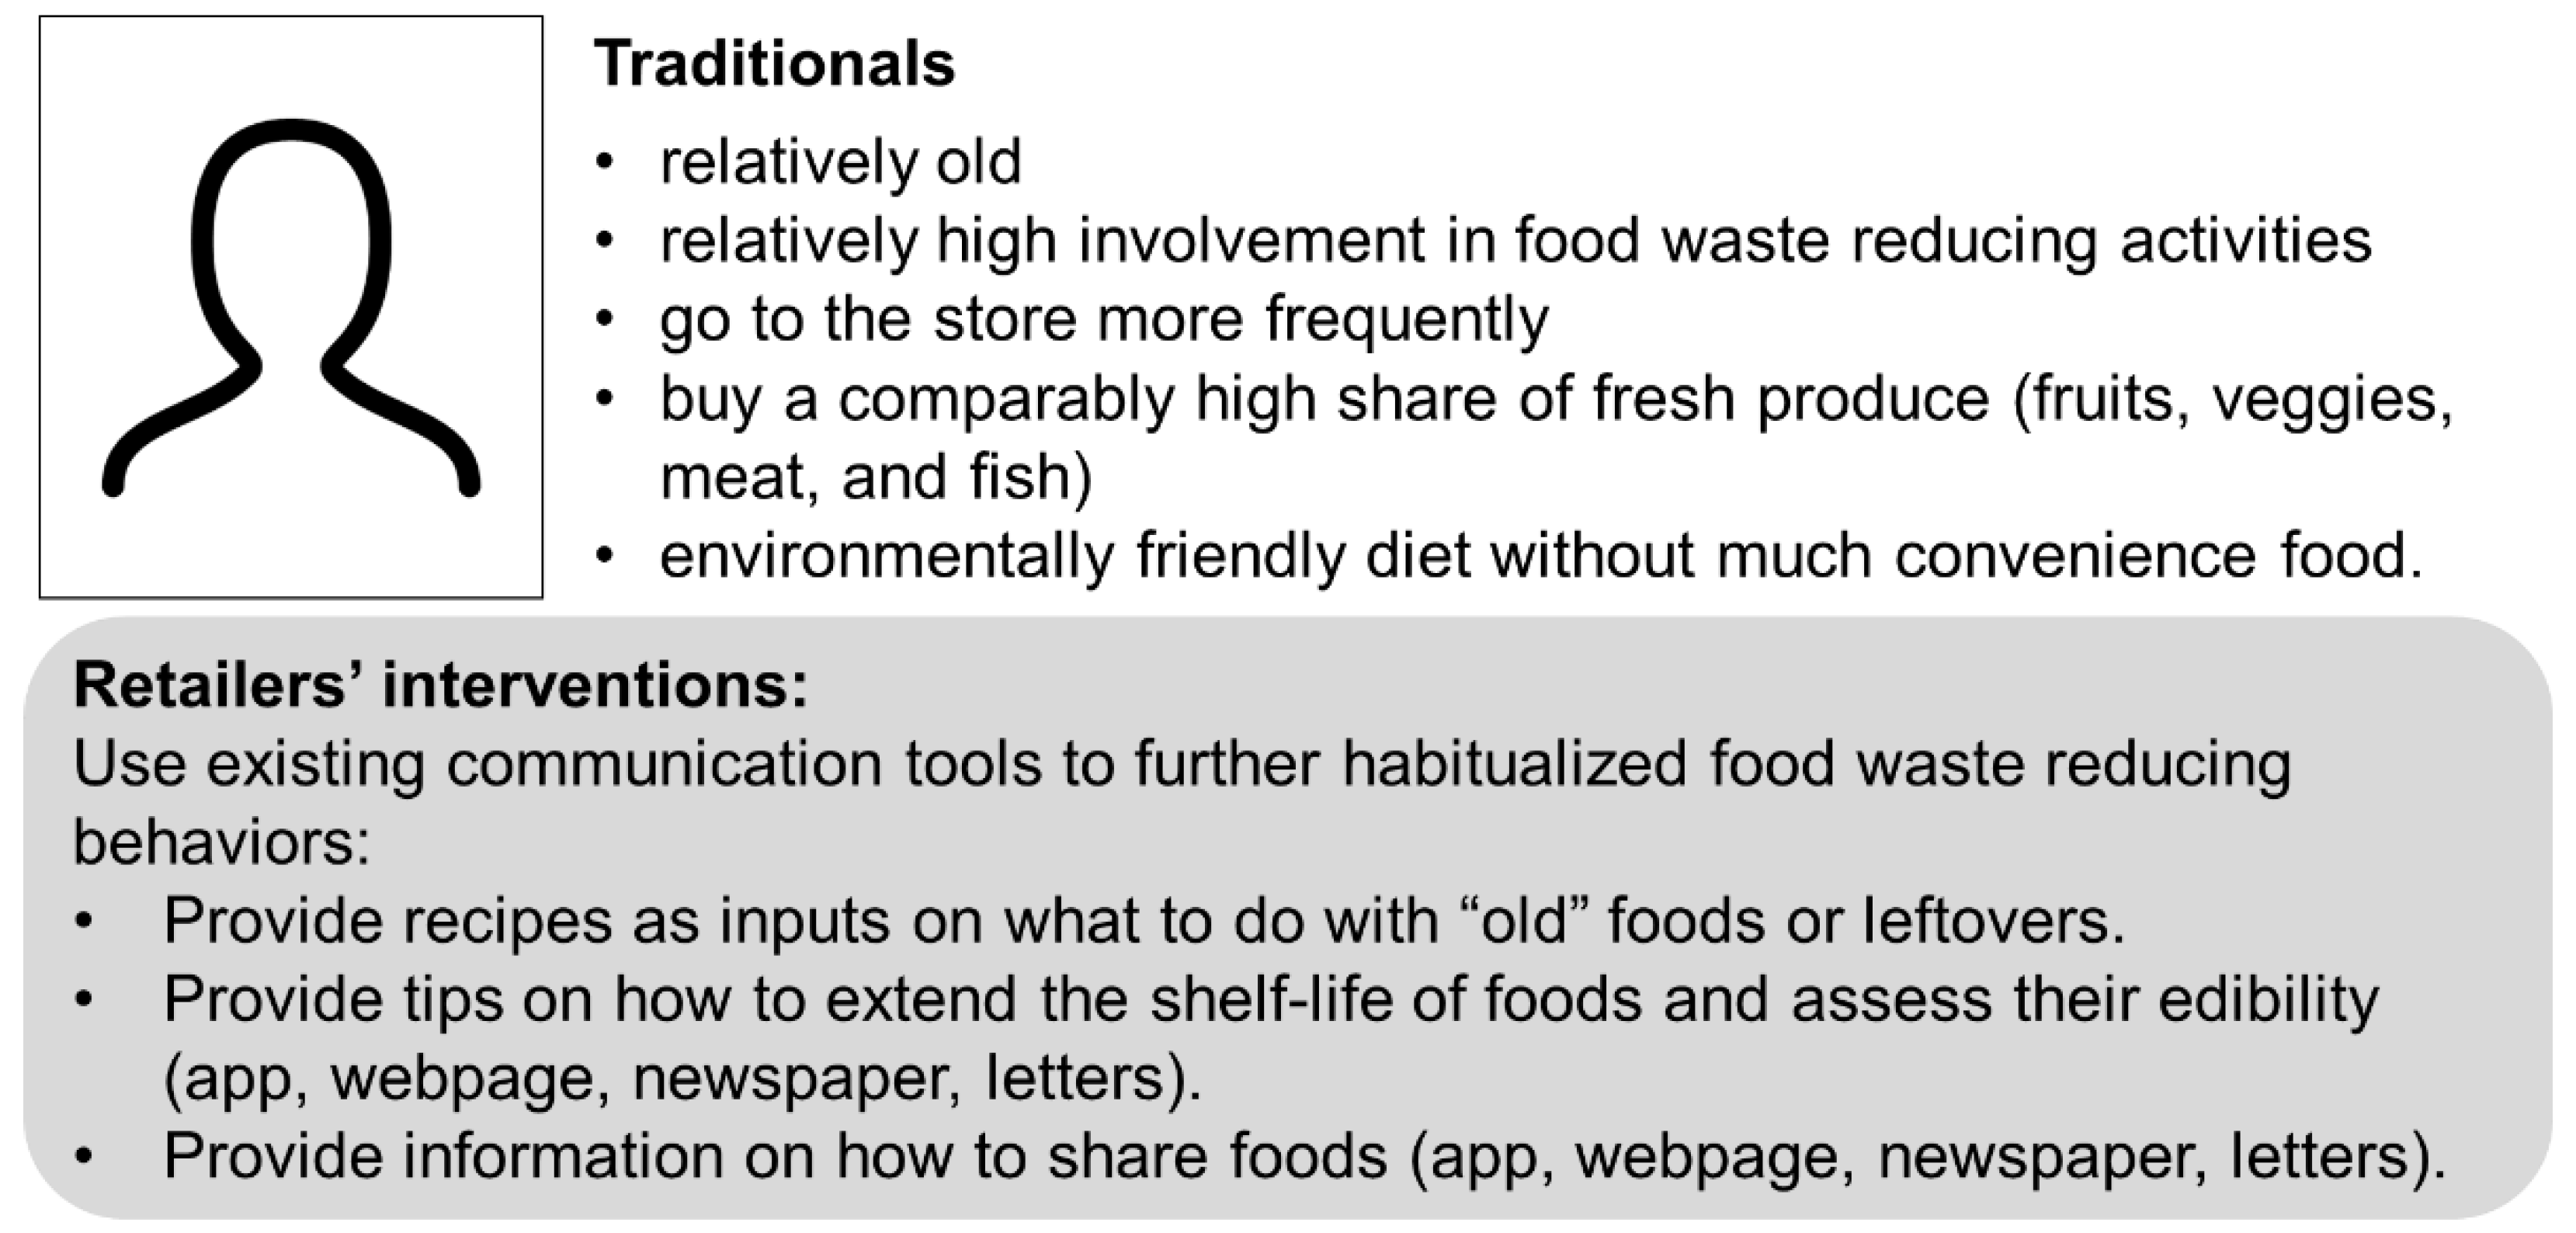
| Cluster Name/Segmentation Basis | Traditionals (49%) | Time-Constrained (39%) | Convenience Lovers (12%) |
|---|---|---|---|
| Gender (share of men) | 0.675 | 0.76 | 0.71 |
| Age | 32.3 (0.989) b | 39.2 (0.89) a,c | 26.3 (1.81) b |
| BMI | 24.1 (0.38) | 24.5 (0.34) | 24.2 (0.70) |
| Education | 2.62 (0.06) | 2.62 (0.06) | 2.6 (0.12) |
| Number of kids | 0.46 (0.08) | 0.60 (0.07) | 0.38 (0.14) |
| Household size | 2.74 (0.14) | 2.41 (0.13) | 2.76 (0.27) |
| Education | 2.62 (0.06) | 2.62 (0.06) | 2.60 (0.12) |
| Income | 3.55 (0.14) | 3.17 (0.13) | 3.51 (0.26) |
| Intention to waste no food at all | 6.57 (0.05) b,c | 6.80 (0.05) a,c | 6.15 (0.11) a,b |
| Intention to eat all purchased food | 6.70 (0.07) c | 6.55 (0.07) c | 5.79 (0.14) a,b |
| Intention to waste only little food | 6.77 (0.06) c | 6.60 (0.06) c | 6.21 (0.12) a,b |
| Intention to reuse leftovers | 6.74 (0.07) c | 6.48 (0.07) c | 5.50 (0.15) a,b |
| Systematic storing | 4.69 (0.18) | 4.18 (0.20) | 3.86 (0.38) |
| Overpreparing food | 3.26 (0.15) c | 3.67 (0.17) | 4.29 (0.32) a |
| Redistributing food | 3.00 (0.18) b,c | 3.64 (0.20) a,c | 4.86 (0.37) a,b |
| Assessing the edibility | 5.80 (0.06) | 6.17 (0.12) | 5.86 (0.24) |
| Planning | 5.09 (0.14) c | 5.72 (0.13) a,c | 4.43 (0.27) a |
| Storing | 4.69 (0.18) | 4.18 (0.20) | 3.86 (0.38) |
| Reuse of leftovers | 6.04 (0.01) b,c | 6.50 (0.09) a,c | 5.29 (0.18) a,b |
| Vegetarian diet | 0.08 | 0.11 | 0.20 |
| Environmentally friendly diet | 0.29 b | 0.14 a | 0.12 |
| Healthy (= no disease) | 0.76 | 0.83 | 0.91 |
| Share of savings | 0.07 (0.01) b,c | 0.06 (0.01) a | 0.04 (0.01) a |
| Share of private labels | 0.28 (0.01) | 0.25 (0.01) | 0.31 (0.02) |
| Share of producer labels | 0.09 (0.01) b | 0.11 (0.01) a | 0.10 (0.01) |
| Share of fruits and vegetables | 0.27 (0.01) | 0.30 (0.01) c | 0.23 (0.02) b |
| Share of meat and fish | 0.35 (0.01) c | 0.37 (0.01) c | 0.30 (0.02) a,b |
| Share of bread | 0.29 (0.01) c | 0.30 (0.01) c | 0.23 (0.02) a,b |
| Perishability of basket (1–3) | 1.42 (0.02) c | 1.41 (0.02) c | 1.54 (0.03) a,b |
| Share of meat and fish | 0.35 (0.01) | 0.37 (0.01) c | 0.30 (0.02) b |
| Share of bread | 0.29 (0.01) c | 0.30 (0.01) c | 0.23 (0.02) a,b |
| Share of multi-packages | 0.01 (0.00) | 0.02 (0.00) | 0.01 (0.00) |
| Share of straight price discounts | 0.03 (0.00) | 0.03 (0.00) | 0.02 (0.01) |
| Share of discounted multi-packages | 0.00 (0.00) b | 0.01 (0.00) a | 0.00 (0.00) |
| Share expiry date-related discounts | 0.02 (0.00) | 0.02 (0.00) | 0.02 (0.00) |
| Share of value spent per person | 1683 (172) | 1206 (192) | 1073 (351) |
| Ave. inter-purchase time (in days) | 8.54 (0.69) b | 6.09 (0.77) a | 5.97 (1.4) |
| Standard deviation of inter-purchase time | 9.65 (1.02) | 7.27 (1.14) | 6.32 (2.08) |
| Share of products bought at weekends | 0.22 (0.01) b | 0.30 (0.02) a | 0.24 (0.03) |
| Share of pseudo-sustainable products | 0.00 (0.00) c | 0.01 (0.00) c | 0.01 (0.00) a,b |
| Share organic products | 0.18 (0.01) | 0.16 (0.02) | 0.17 (0.03) |
| Share social (fairtrade) products | 0.02 (0.00) | 0.02 (0.00) | 0.02 (0.00) |
References
- Flanagan, A.; Priyadarshini, A. A Study of Consumer Behaviour towards Food-Waste in Ireland: Attitudes, Quantities and Global Warming Potentials. J. Environ. Manag. 2021, 284, 112046. [Google Scholar] [CrossRef] [PubMed]
- FAO; IFAD; UNICEF; WEP; WHO. The State of Food Security and Nutrition in the World 2018. In Food Security and Nutrition in the World; WFP: Rome, Italy, 2018. [Google Scholar]
- Priefer, C.; Jörissen, J.; Bräutigam, K.-R. Food Waste Prevention in Europe—A Cause-Driven Approach to Identify the Most Relevant Leverage Points for Action. Resour. Conserv. Recycl. 2016, 109, 155–165. [Google Scholar] [CrossRef]
- Evans, D.; Welch, D.; Swaffield, J. Constructing and Mobilizing ‘the Consumer’: Responsibility, Consumption and the Politics of Sustainability. Environ. Plan A 2017, 49, 1396–1412. [Google Scholar] [CrossRef]
- Welch, D.; Swaffield, J.; Evans, D. Who’s Responsible for Food Waste? Consumers, Retailers and the Food Waste Discourse Coalition in the United Kingdom. J. Consum. Cult. 2021, 21, 236–256. [Google Scholar] [CrossRef]
- de Moraes, C.C.; de Oliveira Costa, F.H.; Roberta Pereira, C.; da Silva, A.L.; Delai, I. Retail Food Waste: Mapping Causes and Reduction Practices. J. Clean. Prod. 2020, 256, 120124. [Google Scholar] [CrossRef]
- Huang, I.Y.; Manning, L.; James, K.L.; Grigoriadis, V.; Millington, A.; Wood, V.; Ward, S. Food Waste Management: A Review of Retailers’ Business Practices and Their Implications for Sustainable Value. J. Clean. Prod. 2021, 285, 125484. [Google Scholar] [CrossRef]
- van Lin, A.; Aydinli, A.; Bertini, M.; van Herpen, E.; Schuckmann, J. Does Cah Really Mean Trash? An Empircal Investigation into the Effect of Retailer Price Promotions on Household Food Waste; SSRN: Amsterdam, The Netherlands, 2020. [Google Scholar]
- Gustavo, J.U.; Trento, L.R.; de Souza, M.; Pereira, G.M.; Lopes de Sousa Jabbour, A.B.; Ndubisi, N.O.; Chiappetta Jabbour, C.J.; Borchardt, M.; Zvirtes, L. Green Marketing in Supermarkets: Conventional and Digitized Marketing Alternatives to Reduce Waste. J. Clean. Prod. 2021, 296, 126531. [Google Scholar] [CrossRef]
- de Hooge, I.E.; van Dulm, E.; van Trijp, H.C.M. Cosmetic Specifications in the Food Waste Issue: Supply Chain Considerations and Practices Concerning Suboptimal Food Products. J. Clean. Prod. 2018, 183, 698–709. [Google Scholar] [CrossRef]
- Teller, C.; Holweg, C.; Reiner, G.; Kotzab, H. Retail Store Operations and Food Waste. J. Clean. Prod. 2018, 185, 981–997. [Google Scholar] [CrossRef]
- Ghosh, R.; Eriksson, M. Food Waste Due to Retail Power in Supply Chains: Evidence from Sweden. Glob. Food Secur. 2019, 20, 1–8. [Google Scholar] [CrossRef]
- Eriksson, M.; Ghosh, R.; Mattsson, L.; Ismatov, A. Take-Back Agreements in the Perspective of Food Waste Generation at the Supplier-Retailer Interface. Resour. Conserv. Recycl. 2017, 122, 83–93. [Google Scholar] [CrossRef]
- Gollnhofer, J.F.; Weijo, H.A.; Schouten, J.W. Consumer Movements and Value Regimes: Fighting Food Waste in Germany by Building Alternative Object Pathways. J. Consum. Res. 2019, 46, 460–482. [Google Scholar] [CrossRef]
- de Souza, M.; Pereira, G.M.; Lopes de Sousa Jabbour, A.B.; Chiappetta Jabbour, C.J.; Trento, L.R.; Borchardt, M.; Zvirtes, L. A Digitally Enabled Circular Economy for Mitigating Food Waste: Understanding Innovative Marketing Strategies in the Context of an Emerging Economy. Technol. Forecast. Soc. Chang. 2021, 173, 121062. [Google Scholar] [CrossRef]
- Young, C.W.; Russell, S.V.; Barkemeyer, R. Social Media Is Not the ‘Silver Bullet’ to Reducing Household Food Waste, a Response to Grainger and Stewart (2017). Resour. Conserv. Recycl. 2017, 122, 405–406. [Google Scholar] [CrossRef]
- Conlin, R.; Labban, A. Clustering Attitudes and Behaviors of High/ Low Involvement Grocery Shopper. J. Food Prod. Mark. 2019, 25, 647–667. [Google Scholar] [CrossRef]
- Le Borgne, G.; Sirieix, L.; Costa, S. Perceived Probability of Food Waste: Influence on Consumer Attitudes towards and Choice of Sales Promotions. J. Retail. Consum. Serv. 2018, 42, 11–21. [Google Scholar] [CrossRef]
- Peker, S.; Kocyigit, A.; Eren, P.E. LRFMP Model for Customer Segmentation in the Grocery Retail Industry: A Case Study. Mark. Intell. Plan. 2017, 35, 544–559. [Google Scholar] [CrossRef]
- Daamen, D.D.L.; Staats, H.; Wilke, H.A.M.; Engelen, M. Improving Environmental Behavior in Companies. Environ. Behav. 2001, 33, 229–248. [Google Scholar] [CrossRef]
- Bamberg, S. Applying the Stage Model of Self-Regulated Behavioral Change in a Car Use Reduction Intervention. J. Environ. Psychol. 2013, 33, 68–75. [Google Scholar] [CrossRef]
- Aschemann-Witzel, J.; Hooge, I.E.; Almli, V.L. My Style, My Food, My Waste! Consumer Food Waste-Related Lifestyle Segments. J. Retail. Consum. Serv. 2021, 59, 102353. [Google Scholar] [CrossRef]
- Coskun, A.; Zimmermann, J.; Erbug, C. Promoting Sustainability through Behavior Change: A Review. Des. Stud. 2015, 41, 183–204. [Google Scholar] [CrossRef]
- Armitage, C.J.; Conner, M. Efficacy of the Theory of Planned Behaviour: A Meta-Analytic Review. Br. J. Soc. Psychol. 2001, 40, 471–499. [Google Scholar] [CrossRef] [PubMed]
- Bamberg, S.; Möser, G. Twenty Years after Hines, Hungerford, and Tomera: A New Meta-Analysis of Psycho-Social Determinants of pro-Environmental Behaviour. J. Environ. Psychol. 2007, 27, 14–25. [Google Scholar] [CrossRef]
- Otto, S.; Kröhne, U.; Richter, D. The Dominance of Introspective Measures and What This Implies: The Example of Environmental Attitude. PLoS ONE 2018, 13, e0192907. [Google Scholar] [CrossRef] [PubMed]
- Tsalis, G. The Dual Relationship between Retail Price Promotions and Household Level Food Waste. Part of the Problem or Part of the Solution? Ph.D. Thesis, Aarhus University, Aarhus, Denmark, 2020. [Google Scholar]
- Giordano, C.; Alboni, F.; Cicatiello, C.; Falasconi, L. Do Discounted Food Products End up in the Bin? An Investigation into the Link between Deal-Prone Shopping Behaviour and Quantities of Household Food Waste. Int. J. Consum. Stud. 2019, 43, 199–209. [Google Scholar] [CrossRef]
- Stefan, V.; van Herpen, E.; Tudoran, A.A.; Lähteenmäki, L. Avoiding Food Waste by Romanian Consumers: The Importance of Planning and Shopping Routines. Food Qual. Prefer. 2013, 28, 375–381. [Google Scholar] [CrossRef]
- Graham-Rowe, E.; Jessop, D.C.; Sparks, P. Identifying Motivations and Barriers to Minimising Household Food Waste. Resour. Conserv. Recycl. 2014, 84, 15–23. [Google Scholar] [CrossRef]
- Bravi, L.; Francioni, B.; Murmura, F.; Savelli, E. Factors Affecting Household Food Waste among Young Consumers and Actions to Prevent It. A Comparison among UK, Spain and Italy. Resour. Conserv. Recycl. 2020, 153, 104586. [Google Scholar] [CrossRef]
- Parizeau, K.; Massow, M.; Martin, R. Household-Level Dynamics of Food Waste Production and Related Beliefs, Attitudes, and Behaviours in Guelph, Ontario. Waste Manag. 2015, 35, 207–217. [Google Scholar] [CrossRef]
- Belavina, E. Grocery Store Density and Food Waste. Manuf. Serv. Oper. Manag. 2021, 23, 1–266. [Google Scholar] [CrossRef]
- Jörissen, J.; Priefer, C.; Bräutigam, K.-R. Food Waste Generation at Household Level: Results of a Survey among Employees of Two European Research Centers in Italy and Germany. Sustainability 2015, 7, 2695–2715. [Google Scholar] [CrossRef]
- Setti, M.; Falasconi, L.; Segrè, A.; Cusano, I.; Vittuari, M. Italian Consumers’ Income and Food Waste Behavior. Br. Food J. 2016, 118, 1731–1746. [Google Scholar] [CrossRef]
- Aktas, E.; Sahin, H.; Topaloglu, Z.; Oledinma, A.; Huda, A.K.S.; Irani, Z.; Sharif, A.M.; Wout, T.V.; Kamrava, M. A Consumer Behavioural Approach to Food Waste. J. Enterp. Inf. Manag. 2018, 31, 658–673. [Google Scholar] [CrossRef]
- Stancu, V.; Haugaard, P.; Lähteenmäki, L. Determinants of Consumer Food Waste Behaviour: Two Routes to Food Waste. Appetite 2016, 96, 7–17. [Google Scholar] [CrossRef]
- Bell, D.R.; Corsten, D.; Knox, G. From Point of Purchase to Path to Purchase: How Preshopping Factors Drive Unplanned Buying. J. Mark. 2011, 75, 31–45. [Google Scholar] [CrossRef]
- Evans, D. Beyond the Throwaway Society: Ordinary Domestic Practice and a Sociological Approach to Household Food Waste. Sociology 2012, 46, 41–56. [Google Scholar] [CrossRef]
- Quested, T.E.; Palmer, G.; Moreno, L.C.; McDermott, C.; Schumacher, K. Comparing Diaries and Waste Compositional Analysis for Measuring Food Waste in the Home. J. Clean. Prod. 2020, 262, 121263. [Google Scholar] [CrossRef]
- Lee, K.C.L. Grocery Shopping, Food Waste, and the Retail Landscape of Cities: The Case of Seoul. J. Clean. Prod. 2018, 172, 325–334. [Google Scholar] [CrossRef]
- Williams, H.; Wikström, F.; Otterbring, T.; Löfgren, M.; Gustafsson, A. Reasons for Household Food Waste with Special Attention to Packaging. J. Clean. Prod. 2012, 24, 141–148. [Google Scholar] [CrossRef]
- Roodhuyzen, D.M.A.; Luning, P.A.; Fogliano, V.; Steenbekkers, L.P.A. Putting Together the Puzzle of Consumer Food Waste: Towards an Integral Perspective. Trends Food Sci. Technol. 2017, 68, 37–50. [Google Scholar] [CrossRef]
- Elimelech, E.; Ert, E.; Ayalon, O. Bridging the Gap between Self-Assessments and Measured Household Food Waste: A Hybrid Valuation Approach. Waste Manag. 2019, 95, 259–270. [Google Scholar] [CrossRef] [PubMed]
- European Commission. Flash Eurobarometer 388 (Attitudes of Europeans towards Waste Management and Resource Efficiency); GESIS Data Archive: Cologne, Germany, 2014. [Google Scholar] [CrossRef]
- Stenmarck, A.; Jensen, C.; Quested, T.E.; Graham, M. Estimates of European Food Waste Levels; IVL Swedish Environmental Research Institute: Stockholm, Sweden, 2016; Volume 80. [Google Scholar]
- van Herpen, E.; van der Lans, I. A Picture Says It All? The Validity of Photograph Coding to Assess Household Food Waste. Food Qual. Prefer. 2019, 75, 71–77. [Google Scholar] [CrossRef]
- Quested, T.E.; Marsh, E.; Stunell, D.; Parry, A.D. Spaghetti Soup: The Complex World of Food Waste Behaviours. Resour. Conserv. Recycl. 2013, 79, 43–51. [Google Scholar] [CrossRef]
- Visschers, V.; Wickli, N.; Siegrist, M. Sorting out Food Waste Behaviour: A Survey on the Motivators and Barriers of Self-Reported Amounts of Food Waste in Households. J. Environ. Psychol. 2016, 45, 66–78. [Google Scholar] [CrossRef]
- Yang, C.; Zhou, Y.; Cao, Q.; Xia, M.; An, J. The Relationship Between Self-Control and Self-Efficacy Among Patients with Substance Use Disorders: Resilience and Self-Esteem as Mediators. Front. Psychiatry 2019, 10, 388. [Google Scholar] [CrossRef]
- Tangney, J.P.; Boone, A.L.; Baumeister, R.F. High Self-Control Predicts Good Adjustment, Less Pathology, Better Grades, and Interpersonal Success. In Self-Regulation and Self-Control. Selected Works of Roy Baumeister; Baumeister, R.F., Ed.; Routledge: New York, NY, USA, 2018; pp. 173–212. ISBN 978-1-315-17577-5. [Google Scholar]
- Grün, B.; Leisch, F. FlexMix Version 2: Finite Mixtures with Concomitant Variables and Varying and Constant Parameters. J. Stat. Soft. 2008, 28, 1–35. [Google Scholar] [CrossRef]
- Delley, M.; Brunner, T.A. Foodwaste within Swiss Households: A Segmentation of the Population and Suggestions for Preventive Measures. Resour. Conserv. Recycl. 2017, 122, 172–184. [Google Scholar] [CrossRef]
- Gaiani, S.; Caldeira, S.; Adorno, V.; Serge, A.; Vittuari, M. Food wasters: Profiling consumers’attidute to waste food in Italy. Waste Manag. 2018, 72, 17–24. [Google Scholar] [CrossRef]
- Di Talia, E.; Simeone, M.; Scarpato, D. Consumer Behaviour Types in Household Food Waste. J. Clean. Prod. 2019, 214, 166–172. [Google Scholar] [CrossRef]
- Mallinson, L.J.; Russell, J.M.; Barker, M.E. Attitudes and Behaviour towards Convenience Food and Food Waste in the United Kingdom. Appetite 2016, 103, 17–28. [Google Scholar] [CrossRef]
- Lichtenstein, D.R.; Ridgway, N.M.; Netemeyer, R.G. Price Perceptions and Consumer Shopping Behavior: A Field Study. J. Mark. Res. 1993, 30, 234–245. [Google Scholar] [CrossRef]
- Reynolds, C.; Goucher, L.; Quested, T.; Bromley, S.; Gillick, S.; Wells, V.K.; Evans, D.; Koh, L.; Carlsson Kanyama, A.; Katzeff, C.; et al. Review: Consumption-Stage Food Waste Reduction Interventions—What Works and How to Design Better Interventions. Food Policy 2019, 83, 7–27. [Google Scholar] [CrossRef]
- Stöckli, S.; Niklaus, E.; Dorn, M. Call for Testing Interventions to Prevent Consumer Food Waste. Resour. Conserv. Recycl. 2018, 136, 445–462. [Google Scholar] [CrossRef]
- Weibel, C.; Kossmann, K.; Schaffner, D.; Ohnmacht, T. Reducing Individual Meat Consumption: The Role of Socio-Psychological Factors and the Stage Model of Behavioral Change. Food Qual. Prefer. 2018, 73, 8–18. [Google Scholar] [CrossRef]
- Ohnmacht, T.; Schaffner, D.; Weibel, C.; Schad, H. Rethinking Social Psychology and Intervention Design: A Model of Energy Savings and Human Behavior. Energy Res. Soc. Sci. 2017, 26, 40–53. [Google Scholar] [CrossRef]
- Altarriba Bertran, F.; Wilde, D.; Berezvay, E.; Isbister, K. Playful Human-Food Interaction Research: State of the Art and Future Directions. In Proceedings of the Annual Symposium on Computer-Human Interaction in Play, Amsterdam, The Netherlands, 17 October 2019; ACM: Barcelona, Spain; pp. 225–237. [Google Scholar]
- Gollwitzer, P.M. Implementation Intentions: Strong Effects of Simple Plans. Am. Psychol. 1999, 54, 493–503. [Google Scholar] [CrossRef]
- Bamberg, S. Changing Environmentally Harmful Behaviors: A Stage Model of Self-Regulated Behavioral Change. J. Environ. Psychol. 2013, 34, 151–159. [Google Scholar] [CrossRef]
- Messner, R.; Johnson, H.; Richards, C. From Surplus-to-Waste: A Study of Systemic Overproduction, Surplus and Food Waste in Horticultural Supply Chains. J. Clean. Prod. 2021, 278, 123952. [Google Scholar] [CrossRef]
- Devin, B.; Richards, C. Food Waste, Power, and Corporate Social Responsibility in the Australian Food Supply Chain. J. Bus. Ethics 2018, 150, 199–210. [Google Scholar] [CrossRef]


| Predictors | Literature | Operationalization |
|---|---|---|
| Discount orientation (1) | There are mixed findings regarding the influence of discounts on food waste (see [27] for an overview). | We used the share of different kinds of discounts (straight price discounts, multi-packages, price-reduced multi-packages, and expiry-date-related discounts) and the number of coupons (general or food-category/product-specific) used per trip as indicators of a discount orientation. This distinction is very interesting as the existing literature on the association between different kinds of discounts and food waste is fragmented. Some studies differentiate between sole price discounts and multibuys [8], whereas others only look at subdimensions or do not clearly distinguish between them [34,35]. By including different kinds of discounts as well as coupons, we contribute to a better understanding of the relationship between food waste and discounts. |
| Shopping frequency (2) | Shopping frequency is related to food waste. A better day-to-day management of food as a result of frequent purchases could be outweighed by being more exposed to in-store temptations [34]. Some studies have also found that less frequent shopping was associated with more food waste [28]. | We used the average inter-purchase time of all food categories (fruits, veggies and salads, bread, dairy products, meat and fish, meals, sweets and snacks) as indicators of shopping frequency. |
| Planned shopping (3) | Planning behaviors such as meal planning or inventory checks prior to the grocery run were associated with less food waste [29,34]. It was proposed that planning reduces the amount of surplus foods/unplanned purchases [36,37]. | To operationalize different dimensions of routine shopping and planning, we used the average number of bags purchased per trip, the average time between shopping trips (referred to as average inter-purchase time), and the variance of the basket size. We assumed that a high number of bags purchased was associated with unplanned purchases as consumers either did not bring their bags or bought more than intended. Going to the store less frequently was associated with more unplanned purchases as the goal of the purchase was more abstract [38]. We also assumed that the variance in the basket size was associated with routine shopping/planning. Low variances could either mean that people always bought the same number of products or typically bought low amounts of products, both indicators of concrete shopping goals and, therefore, fewer unplanned purchases [38]. |
| Overprovisioning (4) | Buying too much was recognized as a direct cause of food waste [36]. | We used the amount of kilo calories purchased per household member and day as well as the number of kids (as a proxy for a good provider identity [30]) and the share of meals eaten outside [32,39] as indicators of overprovisioning. |
| Sustainable behavior (5) | An aspect that has not gained much attention in the literature on food waste is how sustainable purchase practices relate to food waste. | We used the share of organic, fairtrade, regional, and pseudo-sustainable products (products labeled as sustainable but without a specific standard, mostly plant-based convenience food) as indicators of sustainable behavior. |
| Shopping involvement (6) | While Le Borgne et al. [18] found that involvement in a specific category was related to a lower perceived probability of waste, involvement in shopping has not gained much attention. | We used the share of private and producer labels and shopping trips made on weekends (both absolute and weighted by the number of products purchased) as indicators of shopping involvement as previous research found that individuals who are more involved in grocery shopping are more likely to shop on weekends and that they prefer brand names over generic [17]. |
| Shopping regularity (7) | It was argued that buying food at relatively fixed intervals could contribute to food waste [39]. | We used the standard deviation of the inter-purchase time as a predictor of shopping regularity. |
| Monetary value (8) | A lower valued basket was previously associated with less food waste [33] but also with more organic food waste [32] | We used the monetary value spent per day and person as a proxy for the total monetary value. |
| Demographic Variable | Frequency | Percentage |
|---|---|---|
| Gender | ||
| Male | 118 | 72% |
| Female | 47 | 28% |
| Age | ||
| 18–29 | 64 | 38.8% |
| 30–39 | 47 | 28.5% |
| 40–49 | 30 | 18.2% |
| 50–59 | 21 | 12.7% |
| 60–69 | 3 | 1.8% |
| Household Size | ||
| 1 | 38 | 23.0% |
| 2 | 56 | 33.9% |
| 3 | 33 | 20.0% |
| 4 | 25 | 15.2% |
| 5 | 7 | 4.2% |
| 6 | 4 | 2.4% |
| 11 | 2 | 1.2% |
| Number of Kids | ||
| 0 | 112 | 67.9% |
| 1 | 27 | 16.4% |
| 2 | 19 | 11.5% |
| 3 | 6 | 3.6% |
| 4 | 1 | 0.6% |
| Annual Income | ||
| <~$60,000 (1) | 22 | 13.3% |
| ~$60,001–~$88,000 (2) | 21 | 12.7% |
| ~$88,001–~$120,000 (3) | 25 | 15.2 % |
| ~$120,001–~$165,000 (4) | 22 | 13.3% |
| >~$165,001 (5) | 25 | 15.2% |
| No answer | 50 | 30.3% |
| Education | ||
| Basic education | 10 | 6.1% |
| Intermediate education | 28 | 17.0% |
| Advanced education | 90 | 54.5% |
| No answer | 37 | 22.4% |
| Dimension | Segmentation Variables | Results and Cluster Description | ||
|---|---|---|---|---|
| Discount orientation (1) |
| No-discount shoppers Relatively young (compared to discount optimizers, p-values < 0.05) individuals who bought only few discounts | Discount hunters Relatively young (compared to discount optimizers, p-values < 0.05) individuals who bought more regular discounts and multibuys (compared to others, p-values < 0.0001) | Discount optimizers Older individuals (compared to other clusters, p-values < 0.05) who used coupons and bought expiry-date-related discounts (compared to others, p-values < 0.0001) |
| Shopping frequency (2) | Average inter-purchase time for fruits, veggies and salads, dairy products, meat and fish, bread, and sweets and snacks | Non-frequent shoppers Shoppers who went to the store more infrequently (for all categories, p-values < 0.05) and had bigger households and better education (both p-values < 0.1) | Frequent shoppers Shoppers who went to the store more frequently (for all categories, p-values < 0.05) and had smaller households and better education (both p-values < 0.1) | |
| Routine & planned shopping (3) |
| Fill-up shoppers Shoppers with lower self-control (p-values < 0.05), comparably constant basket sizes, who purchased fewer bags and went to the store more often (all p-values < 0.05) | Big shoppers Shoppers with higher self-control (p-values < 0.05) and varying basket sizes, who bought more bags and went to the store less frequently (all p-values < 0.05) | |
| Overprovisioning (4) |
| Stay-home shoppers Shoppers who ate at home more often than eat-out shoppers (p-value < 0.0001) and had fewer children than the kids-provider shoppers (p-value < 0.0001) | Eat-out shoppers Shoppers who ate out frequently (compared to stay-home shoppers, p-value < 0.0001) | Kids Provider shoppers Shoppers with more kids (compared to other clusters, p-values < 0.0001) and who lived in larger households (compared to other clusters, p-values < 0.05) |
| Sustainable shopping (5) |
| Non-sustainable shoppers Shoppers who bought a lower share of organic (compared to other clusters, p-values < 0.0001), social, and pseudo- (compared to social-pseudo-shoppers, p-value < 0.001) sustainable products | Social Pseudo sustainable shoppers Shoppers who bought a higher share of products with social and pseudo-sustainability labels than other clusters (p-values < 0.001) | Organic shoppers Shoppers who bought a higher share of organic products (compared to other clusters, p-values ≤ 0.0001) and are, compared to the non-sustainable shoppers, better educated (p-value < 0.05) and earn more (p-value < 0.1) |
| Shopping involvement(6) |
| Uninvolved shoppers Shoppers who did not score high on any dimension and therefore tend to be univolved [17] | Producer-label shoppers Shoppers who bought a higher share of producer-label products (compared to other clusters, p-values < 0.0001) | Private-label shoppers Shoppers who bought a higher share of private-label products (compared to other clusters, p-values < 0.0001) |
| Cluster Name | Segmentation Basis | ||||||
|---|---|---|---|---|---|---|---|
| Wasted Fruits | Wasted Veggies + Salad | Wasted Bread | Wasted Meals | Wasted Meat + Fish | Wasted Dary Products | Wasted Snacks + Sweets | |
| Traditionals (n = 81) | 0.05 (0.01) b,c | 0.05 (0.00) b,c | 0.05 (0.01) b,c | 0.05 (0.01) b,c | 0.05 (0.01) b,c | 0.05 (0.01) b,c | 0.05 (0.01) b,c |
| Time-constrained (n = 65) | 0.11 (0.01) a,c | 0.12 (0.00) a,c | 0.11 (0.01) a,c | 0.09 (0.01) a,c | 0.06 (0.01) a,c | 0.07 (0.01) a,c | 0.07 (0.01) a,c |
| Convenience lovers (n = 19) | 0.18 (0.01) a,b | 0.16 (0.01) a,b | 0.25 (0.01) a,b | 0.19 (0.01) a,b | 0.13 (0.01) a,b | 0.17 (0.01) a,b | 0.17 (0.01) a,b |
| Variables | Traditionals (49%) | Time−Constrained (39%) | Convenience Lovers (12%) |
|---|---|---|---|
| Intercept | 0.36 (0.01) *** | 0.07 (0.06) | 1.43 (0.52) ** |
| Discount orientation: discount hunter | 0.00 (0.02) | −0.07 (0.08) | 3.33 (1.64) * |
| Discount orientation: discount optimizer | 0.00 (0.01) | −0.04 (0.09) | −0.31 (0.55) |
| Shopping frequency: non−frequent shopper | 0.00 (0.01) | 0.04 (007) | −0.46 (0.79) |
| Routine & planned shopping: big shopper | 0.00 (0.01) | −0.12 (0.09) | −0.36 (0.94) |
| Overprovisioning: eat-out shopper | 0.00 (0.01) | 0.19 (0.06) ** | −0.10 (0.56) |
| Overprovisioning: kids-provider shopper | 0.00 (0.02) | −0.02 (0.07) | −0.56 (0.71) |
| Sustainable shopping: pseudo-sustainable shopper | 0.00 (0.03) | 0.03 (0.10) | −0.12 (0.54) |
| Sustainable shopping: organic shopper | 0.00 (0.01) | −0.13 (0.11) | −0.16 (0.61) |
| Shopping involvement: private-label shopper | 0.00 (0.01) | −0.12 (0.07) | 1.24 (0.98) |
| Shopping involvement: producer-label shopper | 0.00 (0.02) | −0.17 (0.08) * | 0.06 (0.64) |
| Shopping regularity | 0.00 (0.05) | −0.05 (0.05) | 1.06 (1.02) |
| Monetary value | 0.00 (0.05) | 0.00 (0.05) | 0.17 (0.29) |
Publisher’s Note: MDPI stays neutral with regard to jurisdictional claims in published maps and institutional affiliations. |
© 2022 by the authors. Licensee MDPI, Basel, Switzerland. This article is an open access article distributed under the terms and conditions of the Creative Commons Attribution (CC BY) license (https://creativecommons.org/licenses/by/4.0/).
Share and Cite
Merian, S.; Stöeckli, S.; Fuchs, K.L.; Natter, M. Buy Three to Waste One? How Real-World Purchase Data Predict Groups of Food Wasters. Sustainability 2022, 14, 10183. https://doi.org/10.3390/su141610183
Merian S, Stöeckli S, Fuchs KL, Natter M. Buy Three to Waste One? How Real-World Purchase Data Predict Groups of Food Wasters. Sustainability. 2022; 14(16):10183. https://doi.org/10.3390/su141610183
Chicago/Turabian StyleMerian, Sybilla, Sabrina Stöeckli, Klaus Ludwig Fuchs, and Martin Natter. 2022. "Buy Three to Waste One? How Real-World Purchase Data Predict Groups of Food Wasters" Sustainability 14, no. 16: 10183. https://doi.org/10.3390/su141610183
APA StyleMerian, S., Stöeckli, S., Fuchs, K. L., & Natter, M. (2022). Buy Three to Waste One? How Real-World Purchase Data Predict Groups of Food Wasters. Sustainability, 14(16), 10183. https://doi.org/10.3390/su141610183