Abstract
Key message: Overexpression of OsiSAP8 driven by Port Ubi2.3 from Porteresia coarctata imparts drought and salinity stress tolerance in transgenic rice. Stress associated proteins (SAPs) possess the zinc-finger domains that are wildly evolving functional and conserved regions/factors in plants to combat abiotic stresses. In this study, the promoter region of OsiSAP8, an intron-less, multiple stress inducible gene, was compared in silico with a strong constitutive promoter, Port Ubi2.3. This resulted in developing rice, resistant to drought and salinity expressing OsiSAP8 promoted by Port Ubi2.3. (Porteresia coarctata), through Agrobacterium-mediated transformation in the popular rice varieties, IR36 and IR64. Southern blot hybridization confirmed the integration of OsiSAP8, and the T0 transgenic lines of IR36 and IR64 were evaluated for their drought and salinity tolerance. The IR36-T1 progenies showed an enhanced tolerance to water withhold stress compared to wild type and IR64-T1 progenies. Physiological parameters, such as the panicle weight, number of panicles, leaf wilting, and TBARS assay, showed the transgenic IR36 to be superior. The transgenic lines performed better with higher 80–95% relative leaf water content when subjected to drought for 14 days. Gene expression analysis of OsiSAP8 in IR36 T1 showed a 1.5-fold upregulation under mannitol stress. However, IR64 T1 showed a two-fold upregulation in NaCl stress. An enhanced drought and salinity stress tolerance in the transgenic IR36 cultivar through overexpression of OsiSAP8 was observed as it had a native copy of OsiSAP8. This is perhaps the first study using a novel ubiquitin promoter (Port Ubi2.3) to generate drought and salinity stress-tolerant transgenic rice. Thus, we report the overexpression of a rice gene (OsiSAP8) by a rice promoter (Port Ubi2.3) in rice (IR36) to resist drought and salinity.
1. Introduction
Rice (Oryza sativa L.), being the most popular and domesticated kharif crop, is the staple source of carbohydrate to nearly half of the world’s population [1,2,3,4]. The sessile and acquiescent nature of higher plants makes them prone to various biotic and abiotic cues. Such environmental stresses constrain their growth, resulting in a reduced yield and quality. Drought and salinity are the major stresses that affect almost 50% of the crop production worldwide [5,6]. Since the 1960s, the rice trait/breed perfection has been performed by the incorporation of different candid genes. With the advent of the green revolution and the development of the semi-dwarf rice IR8 using the sd-1 gene, there was a substantial increase in the rice grain yield leading to new horizons in rice research [7,8]. During the second segment of the green revolution, elite rice varieties, such as IR36 and IR64, were developed. IR36, the most cultivated rice variety (11 million hectares/year), is a semi dwarf type containing the defective semi-dwarfing allele (sd-1) [9] with a faulty gibberellin 20-oxidase gene which might be due to gene introgression [10] and led to the drought susceptibility [11]. Certain key elements, such as DRE/CRT-binding transcription factors (TF) (DREBs/CBFs), mitogen-activated protein kinases (MAPKs), and heat shock factor/proteins (HSF/HSPs), are highly conserved in plants with respect to abiotic stresses [12,13,14]. Many vital proteins are produced that are regulated by key TF that contemplate stress tolerance [15]. Such proteins have been reported to act on other systems, e.g., bacteria and animals, and play a key role in the immune response [16,17,18].
Dixit et al. (1990) first reported the A20 zinc-finger domain and multiple cys2/cys2 motifs from human endothelial cells at the C-terminus part of TNFα [19]. The International Rice Genome Project [20] and the genome-wide analysis of these proteins report the presence of 18 members of the A20/AN1 -type zinc finger domain proteins [20,21]. These proteins were categorized for their protagonist role in the immune response and hence associated with multiple abiotic stresses [20,22,23,24]. OSiSAP1 was classified to be a multiple stress responsive gene coding Stress Associated Protein (SAP) [25,26]. Transgenic tobacco plants expressing OSiSAP1 were tolerant against dehydration, salinity, and cold stress. Jin et al. (2007) [27] reported that a large number of these genes are involved in the abiotic stress response, thus signifying the importance of the A20/AN1-type zinc-finger proteins in combating stress. Although the abiotic stress tolerance mechanism is well known, their induction by multiple stresses is poorly understood [28]. Sharma et al. (2015) studied the expression of OSiSAP7 on Arabidopsis thaliana with respect to abscisic acid (ABA) stress and their twin localization was observed in the nucleus and subcellular granules. The involvement of the E3 ubiquitin ligase activity was observed on YFP-tagged OSiSAP7 overexpression which led to ABA insensitivity on water deficit stress [21]. Kanneganti and Gupta (2008) reported OsiSAP8 from IR50 to be a single copy intronless gene conferring tolerance to numerous abiotic stresses such as salinity, heat, cold, dryness, submergence, wounding, abscisic acid, and some heavy metals, e.g., zinc, copper, cadmium, and lithium. Salination of soil affects about half of the global crop production [29]. The use of an appropriate promoter is a prerequisite for an efficient gene expression [28]. CaMV 35S promoter, though routinely used for heterologous transformation [30], confers a lower expression in monocots [31]. Rice Act1 [32,33] and maize Ubi1 [34] are the predominantly used monocot promoters. Port Ubi2. promoter derived from P. coarctata is a salt secreting halophytic wild rice that thrives in the coastal-riverine interface [35,36]. Recent reports on overexpressing DNA helicase (PDH45), co-transformation of DREB (EaDREB2 from Erianthus arundinaceus) with DNA helicase or expressing heat shock protein (EaHSP70 from E. arundinaceus) driven by Port Ubi2.3 have been successfully validated in sugarcane, which gave the maximum tolerance against salt and drought stresses [37,38,39].
In this study, we report the overexpression of OsiSAP8 gene in IR36 and its superior variety IR64, driven by a ubiquitin promoter from Porteresia coarctata, a stress-tolerant wild rice. Port Ubi2.3 was reported to promote strong GUS expression in rice (monocot), nearly sevenfold higher than the CaMV 35S promoter [40]. We also compared the expression of OsiSAP8 and correlated the resistance to drought and salinity between wild type (WT) and transgenic rice (IR36 and IR64), through various physiological and molecular parameters.
2. Materials and Methods
2.1. Identification of OsiSAP8 Gene and Their Attributes in Rice
OsiSAP8 gene was subjected to Oryazabase to fetch the RAP ID, then RAP ID were loaded onto RiceNetDB to retrieve the CDS coordinates, nucleotide and amino acid length, chromosome number, molecular weight, probeset ID, Pfam ID, isoelectric point (pI), subcellular localization, UniProtKB, KEGG, Ensemble, EMBL, Regulatory genes.
2.2. Gene Expression Analysis
OsiSAP gene RAP ID were loaded onto plant developmental and plant hormonal datasets which are included in RiceXPro database [41] for analyzing the spatio-temporal and plant hormonal expression patterns throughout growth in the natural field condition.
2.3. Protein-Protein Interaction of OsiSAP8
Molecular cross-talks of OsiSAP8 gene were analyzed by STRING v10.5 and the cross-talks were used to understand the functional and physical associations of the candid gene involved [42].
2.4. In Silico Analysis of OsiSAP8 Regulatory Region and Its Comparison with Port Ubi2.3 Promoter
Phytozome (http://phytozome.jgi.doe.gov/pz/portal.html# accessed on 10 May 2022) was used to retrieve the putative regulatory region of OsiSAP8 and the cis acting regulatory elements were predicted by using PLACE database [43]. The transcription start site was assigned based on the position of the predicted TATA box and the arrangement of cis-regulatory elements was plotted using Cytoscape V 3.2.1 software [44]. In addition, the cis regulatory elements pertaining to abiotic stresses and expression enhancement, present in both OsiSAP8 and Port Ubi2.3 promoters were compared to obtain a better understanding of their role in gene regulation.
2.5. Explant Source and Tissue Culture Processing
O. sativa L. ssp. Indica seeds of IR64 and IR36 were procured from the Tamil Nadu Rice Research Station, Aduthurai, Tamil Nadu, India. The mature embryos of IR64 and IR36 were processed and inoculated in the respective callus induction medium [45,46]. The cultures were incubated in dark (25 ± 2 °C) for 4 weeks and subsequently transferred to a proliferation medium for 3 weeks. Friable, nodular, and embryogenic calli (4–5 mm diameter) were used for the transformation experiments.
2.6. Vector Construction and Generation of Transgenic Rice
pCAMBIA1305.1 with the Port Ubi2.3 promoter was restricted with SpeI and PmlI to replace the GUS gene with the OsiSAP8 gene (Genbank Acc. No. AY345599) flanked with SpeI and PmlI (5′ and 3′ ends respectively) synthesized in Bio Basic Inc. (Markham, ON, Canada). The presence of the gene was checked using gene-specific PCR and confirmed by restriction analysis. The plasmid construct was named as pCAM-Port2.3-OsiSAP8 and transferred to LBA4404 [47] by triparental mating [48] for Agrobacterium-mediated transformation.
2.7. Generation of Rice Transgenics
The super virulent strain LBA4404 with the binary vector pCAM-Port2.3-OsiSAP8 was infiltrated in the mature seed derived nodular, friable, and embryogenic callus of IR36 [45] and IR64 [46]; subsequently they were subjected to hygromycin (40 mg L−1) selection. After two rounds of hygromycin selection, actively proliferating hygromycin resistant calli were subjected to regeneration. The putative transgenic plantlets were then transferred to a versatile plant growth chamber (SANYO) in Soilrite (Kel Tech Energies, Pvt. Ltd. Bengaluru). Six-week-old WT and the transgenic rice (IR36 and IR64) were later transferred to D-262 H AXIVA-plantation pots (Axiva Sichem Biotech, NSP, Delhi, India) with garden soil:soilrite:farmyard manure (1:1:1) and established in a greenhouse. The OsiSAP8 gene integration was confirmed by DNA blot. The pots were watered until seed setting and maturation. Later, the T1 seeds were harvested and analyzed for the presence of transgene and subsequently tested for drought and salinity.
2.8. Molecular Analysis of Transgenic Plants and Events Selection
The genomic DNA of WT and the transgenic lines were isolated from the leaves of the putative transgenics by CTAB [49] method and the integration of T-DNA in the putatively transformed plantlets were determined by polymerase chain reaction (PCR). Gene-specific primers for OsiSAP8 and hpt genes (Supplementary Table S1) were used for PCR amplification in a programmable thermal cycler (Mastercycler gradient, Eppendorf, Germany) under the following conditions. PCR was performed with a reaction mixture containing 50 ng of DNA template, 2.5 µL of 10X PCR buffer, 1.5 µL of MgCl2 (1.5 mM), 2 µL (20 pmol) of each primer, 0.625 µL of dNTPs mix (0.25 mM), 1.0 U of Taq polymerase and made upto 25 µL with sterile nuclease free water. The PCR products (5 µL) were resolved on an ethidium-bromide-stained 0.8% agarose gel and were visualized and photographed using Gel Doc XR + (BIO RAD, Quarry Bay, Hong Kong).
2.9. Southern Blot Hybridization
To check the OsiSAP8 gene integration and the copy number, Southern blot hybridization was performed. Twenty micrograms of genomic DNA from PCR-positive transgenic IR36 and IR64 were digested with PmlI and BamHI respectively, resolved on 1% agarose gel electrophoresis and blotted on BioBondTM Nylon transfer membrane (Sigma Aldrich, Bangalore, India). The OsiSAP8 gene was amplified from pCAMBIA1305.1 and used as probe to check the integration in transformed IR36 and IR64 lines. AlkPhos direct labelling (AmershamTM, Citiva, New York, NY, USA) was used to label the probe as described by Sambrook et al. [50] After hybridization for 16 h at 65 °C, the membrane was processed with posthybridization buffers. The membrane was air dried, and the detection reagent (AmershamTM CDP-StarTM, Citiva) was run over the membrane. The air-dried membrane was kept for exposure on Amersham HyperfilmTM (Citiva) ECL in Amersham Hypercassette Autoradiography Cassette. The film was developed using KODAK GBX Fixer and Replenisher.
2.10. Segregation Analysis of T1 Progeny
Hundred seeds from the southern blot-positive T0 transformants from IR36 (T0–1 to T0–5) and IR64 (T0–1 to T0–6) were germinated on half-strength MS medium incorporated with 40 mg L−1 of hygromycin for 2 weeks. The data was observed and analyzed for Mendelian style of inheritance. Further, segregation analyses on the hygromycin resistance for T1 progeny (100 seeds) were done in accordance with the expected and observed frequency and χ2 test was performed to confirm the Mendelian Law of segregation (3:1) in all the five transgenics (T0).
2.11. Analysis of Abiotic Stress Tolerance in WT and T1 Lines
The T1 seeds of confirmed transgenic lines (T0) with a single copy transgene were used for physiological and qPCR analysis.
2.12. Relative Leaf Water Content (RWLC)
The RLWC was calculated following the protocol described by [51]. Fresh weights of the fully expanded leaves were noted and immersed in distilled water in petri dishes and left for 2 h; later the leaves were blot dried and the turgid weight was noted. The samples were then dried in an oven (70 °C) to a constant weight. Subsequently, RLW was calculated using the following formula:
where FW is the fresh weight; DW is the dry weight; and TW is the turgid weight.
RLWC% = [(FW − DW)/(TW − DW)] × 100
2.13. Visual Scoring on Stress Resistance
In the first set of experiments, the seeds (WT and T1) were sown in 7 cm (diameter) × 9 cm (height) transparent plastic cups filled with 125 g of soilrite (pH 6 ± 0.5) with 75% humidity and an average irradiance of 50 mmol m−2 s−1 was maintained in a versatile plant growth chamber. It was ensured that the physiological conditions were the same for the experimental set up. After germination and acclimatization for 45 days (d), the plantlets were subjected to drought stress by withholding water and the day was noted as day 0. Through a modified approach of [52], the leaves were visually scored for drought stress tolerance by witnessing leaf wilting on the 7th and 14th days. Leaf wilting was scored with gauge (1 = no wilting; 2 = marginal wilting; 3 = wilting, shown in leaves during hot hours which later recovered; and 4 = chronic wilting, where leaves became pale and severe wilting was observed). The stress assay was stopped, plants were irrigated after 14 days of water being withheld, and the physiological parameters were observed.
2.14. Leaf Disc Bioassay
The leaf chlorophyll withholding capacity on IR36 and IR64 (WT and T1 lines) were performed according to [53]. One cm leaf was cut from the second leaf and immersed in half-strength MS medium supplemented with various concentrations of NaCl (100, 200, 300, 400, and 500 mM) for 7 days and the leaf bleaching was observed [54].
2.15. Effect of Mannitol on Plantlet Growth
Four-days-old, germinated seeds of transformed (T1 lines) IR36 and IR64 were transferred to half-strength MS medium with a varied concentration of mannitol (100, 200, 300, 400, and 500 µM). Later, the cultures were kept in vitro at 25 ± 2 °C in long daylight conditions (16/8 h day/night photoperiod), with an average irradiance of 50 mmol m−2 s−1. The physiological parameters were observed and recorded.
2.16. Thiobarbituric Acid Reactive Substances (TBARS) Assay
Leaf tissues (100 mg) were homogenized by adding 0.5 mL 0.1% (w/v) TCA and centrifuged for 10 min (15,000× g, 4 °C). The supernatant was collected and 0.5 mL of the supernatant was mixed with 1.5 mL 0.5% ΤΒA diluted in 20% TCA. The mixture was incubated in a water bath at 95 °C for 25 min and the reaction was stopped by incubating on ice. The absorbance was measured at 532 nm and the results were expressed as μmol MDA 100 mg−1 FW [55].
2.17. OsiSAP8 Gene Expression Analysis Using qPCR
The total RNA was extracted from the second leaf (100 mg), of 15 days old drought and salinity treated transgenic (T1 lines) and non-transgenic (control) rice lines of IR36 and IR64, using TRI Reagent® (SIGMA-ALDRICH) and was treated with DNAse and subsequently quantified using BioSpec-Nano. The RNA was then reverse transcribed with 10× RT Buffer, 25× dNTPs Mix (100 mM), 10× oligodT primer and MultiScribeTM Reverse Transcriptase, RNase inhibitor as per the manufacturer’s instructions by using High-Capacity cDNA Reverse Transcription Kit (Applied-Biosystems, Waltham, MA, USA). For qPCR analysis, OsiSAP8 gene-specific primers (Table S1) and housekeeping primer, 25SrRNA were used [56]. The fold difference in the expression (2−ΔΔct) was calculated by comparative Ct value analysis with 25SrRNA normalization. [57].
2.18. Statistical Analysis
The Relative water content, Lipid peroxidation, Chlorophyll content, Mannitol stress, and qPCR were done in biological and experimental triplicates, which were subjected to one way analysis of variance (ANOVA) using IBM SPSS 20.0. Chi-square (χ2) test was done manually to study the segregation ratio in T1 progeny (Pagano and Gauvreau 2004). Values at p < 0.05 level of significance were used for mean comparison.
3. Results
3.1. OsiSAP8 Gene Attributes
OsiSAP8 gene with their corresponding RAP-ID, CDS coordinates, nucleotide and amino acid length, chromosome number, molecular weight, probeset ID, Pfam ID, pI, subcellular localization, UniProtKB, KEGG, Ensemble, EMBL, Regulatory genes were retrieved from Oryzabase and RiceNetDB (Table 1).

Table 1.
OsiSAP8 gene and their molecular attributes.
3.2. Spatio-Temporal and Plant Hormone Expression Analysis of OsiSAP8
OsiSAP8 and their developmental (Spatio-temporal) tissues specific expression signature was noted for 48 tissues and/or organs at various growth stages (Figure 1). OsiSAP8 gene revealed higher expression signature in multiple tissues and/or organs such as leaf blade (reproductive—00:00), leaf sheath (reproductive—12:00; 00:00), Root (reproductive—12:00; 00:00), stem (reproductive—00:00, ripening—00:00), embryo (14, 28, 42 DAF) and endosperm (07, 10, 14, 28 and 42 DAF) (Figure 1) as imputed by RiceXPro. In addition, this gene showed the hormonal signatures in various time intervals such as 1, 3, 6, 12 h and 15, 30 min, 1, 3, 6 h on shoot and root, respectively (Figure 2 and Figure 3). Phyto-hormonal expression signature of OsiSAP8 gene was expressed under field conditions. In shoot, candidate gene showed an increased level of abscisic acid (ABA) (6 and 12 h) and negligible levels of expression were observed in jasmonic acid (JA) (6 and 12 h) and auxin (3 and 6 h) (Figure 2). In root, a negligible level of expression was observed in ABA (30 min), gibberellic acid (6 h), and auxin (1 h) (Figure 3).
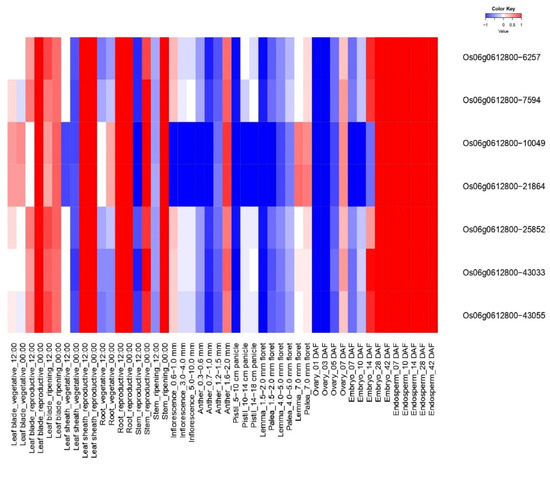
Figure 1.
Heatmap represent the spatio—temporal expression profiling OsiSAP8 gene in the tissues/organs at various developmental stages in field conditions. Blue color—down regulation; Red color—up regulation; White color—unchanged. The colored scale bar at right side top indicates relative expression value, where −1 and 1 represent down and up regulation of AbS responsible OsSAP genes respectively.
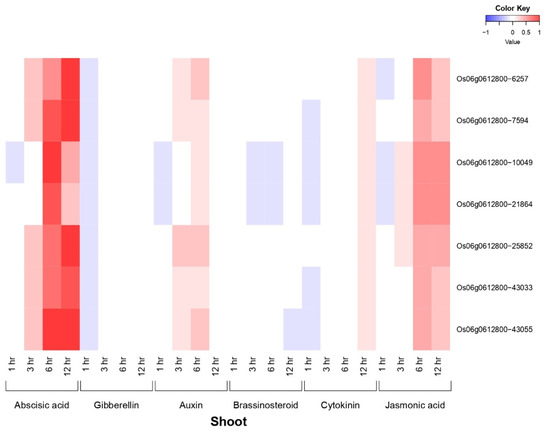
Figure 2.
Heatmap denotes the OsiSAP8 gene and their plant hormonal expression pattern in shoot which are differentially regulated across the throughout growth in the natural field conditions. Blue color—down regulation; Red color—up regulation; White color—unchanged. The colored scale bar at right side top indicates relative expression value, where −1 and 1 represent down and up regulation of AbS responsible OsSAP genes respectively.
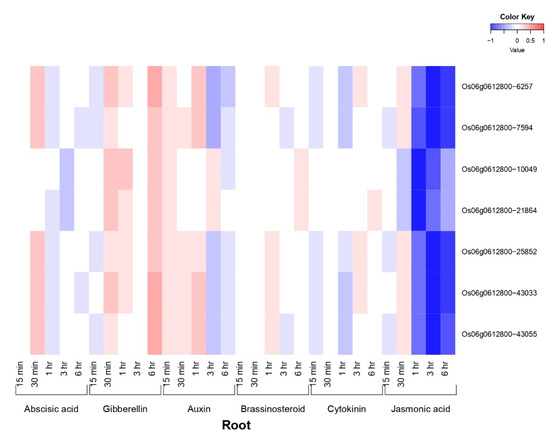
Figure 3.
Heatmap denotes the OsiSAP8 gene and their plant hormonal expression pattern in root which are differentially regulated across the throughout growth in the natural field conditions. Blue color—down regulation; Red color—up regulation; White color—unchanged. The colored scale bar at right side top indicates relative expression value, where −1 and 1 represent down and up regulation of AbS responsible OsSAP genes respectively.
3.3. Signalome of OsiSAP8 Gene
OsiSAP8 seed proteins were copied from O. sativa ssp. indica for signalome analysis. Figure 4 revealed that OsiSAP8 gene had complexity and its proving quantitative and multigenic nature.
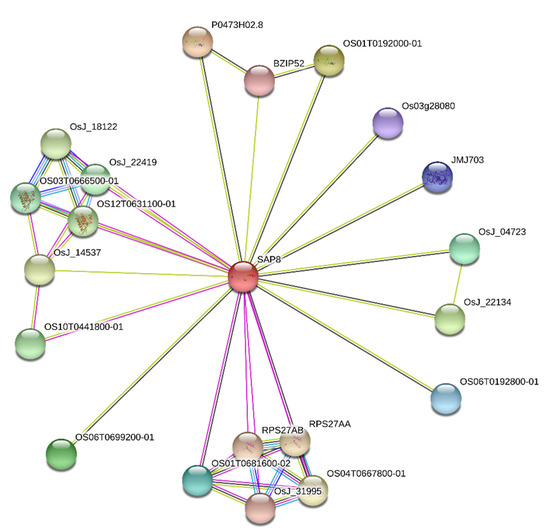
Figure 4.
OsiSAP8 gene and their interaction network. Indica rice OsiSAP gene interaction showing inter-connected functional components. Colored lines between the proteins encode various types of interaction signals. Black color, co-expression; green color, gene neighbourhood; blue color, gene co-occurrence; pink color, experimentally determined. Protein nodes filled with ribbon like structure indicates the availability of protein 3D structural information is predicted or known.
3.4. Comparative In Silico Analysis between Port Ubi2.3 and OsiSAP8 Regulatory Region
The regulatory elements of OsiSAP8 were grouped as tissue specific, biotic, and abiotic stress and were plotted using Cytoscape V 3.2.1 (Figure 5). The presumed promoter region of OsiSAP8 had putative core element TATA box, scattered all along the promoter region at 7 places under bZIP protein binding site, light and anaerobic specific elements. A large portion of these elements are involved in root and seed-specific expression. MYCCONSENSUSAT regions were found profoundly along a wide range in cold, drought, seed, and osmotic regulatory regions that codes for protein binding factors like CBF1 and CBF3. PRECONSCRHSP70A and heat shock factors (CCAAT box)/SE (heat shock element) regulate the proteins required for developmental processes. The predicted elements were compared with Port Ubi2.3 promoter wherein the CAATBOX (CAAT) functions as a quantitative element. Apart to it presence of ARR1AT (NGATT) for salinity stress at 15 locations and ACGTATERD (ACGT) for bZIP protein binding site at 4 locations are present along the positive strand at both sides of TSS. Light regulative genes GT1CONSENSUS (GRWAAW) elements of OsiSAP8 were predicted at 12 sites that have GT1 regulatory genes. Root-specific elements, RAV1AAT, were predicted at three regions and these encode a novel DNA-binding protein specific to the root and shoot system in higher plants. The OsiSAP8 regulatory region is devoid of MART Box and has only five NGATT regions that act as enhancers as predicted by PLACE. Four drought specific cis-elements WAACCA are present in the Port Ubi2.3 promoter as compared with only one element present on OsiSAP8 regulatory region. IBOX elements that are regulated by light and tissue specific responses are scattered over four regions along the promoter region. In addition, TTWTWTTWTT (MART Box) and NGATT that act as enhancers of transgene expression were present in three and 32 numbers respectively [58]. The dehydration stress specific regions MYB (CNGTTR) and MYC (CANNTG) were predicted to be present at 18 and eight sites respectively thus making it superior in promoting expression during abiotic stresses [40]. Hence, for the present study, we used Port Ubi2.3 promoter to drive OsiSAP8 gene. A comparison between OsiSAP8 and Port Ubi2.3 promoter core putative cis-elements is depicted in Table 2.
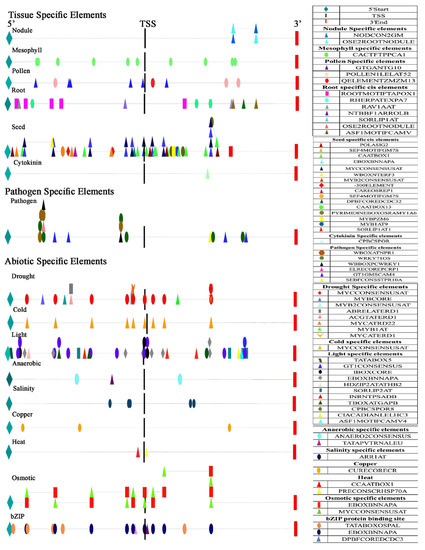
Figure 5.
Cis-acting elements distribution pattern in predicted promoter of OsiSAP8. Divided as three major groups. Abiotic, biotic, and tissue-specific elements. Each line represents OsiSAP8 promoter sequence and shapes correspond to predicted cis-elements in the positive strand. TSS-transcription start site.
Table 2.
A comparison of cis-acting elements identified using PLACE program in Port Ubi2.3 and OsiSAP8 promoters.
3.5. Genetic Transformation with Port Ubi2.3-OsiSAP8 Gene and Molecular Analysis of Transgenic Plants
The OsiSAP8 gene was sub-cloned in the T-DNA region of pCAMBIA 1305.1 driven by the Port Ubi promoter (2.3 kb) using SpeI and PmlI devoid of GUS reporter gene (Figure 6). The hygromycin resistant calli (Figure 7a,f) were efficiently regenerated on a half-strength MS [73] medium (Figure 7b,g) and shoots developed efficiently on the shoot induction medium (Figure 7c,h). The transgenic lines appeared normal with well-acclimatized roots and shoots (Figure 7d,i). Further, the gene-specific PCR confirmed the presence of the transgene and hpt. The positive transformants were hardened to get T1 seeds of IR36 and IR64 (Figure 7e,j and Figure 8a,b).
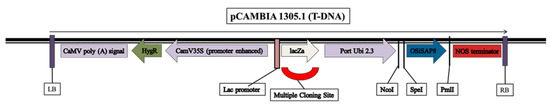
Figure 6.
Vector construct in pCAMBIA1305.1. Vector construct of OsiSAP8 gene in the T-DNA region of pCAMBIA 1305.1 driven by Port Ubi promoter (2.3 kb).
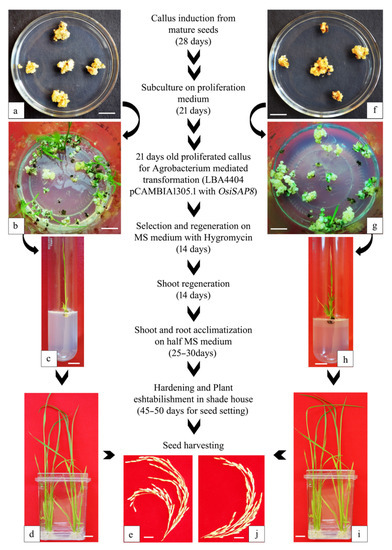
Figure 7.
Overall workflow: Generation of OsiSAP8 transgenic rice. Gene transfer process in (a–e): IR36 and (f–i): IR64. (a,f) Transformed callus kept for secondary selection in hygromycin medium, (b,g) efficiently regenerated callus with shoot primordia, (c,h) shoot development in half MS medium, (d,i) well developed plantlet with acclimatized roots and shoots, (e,j) harvested seeds from hardened transgenic rice (T0) established in shade house.
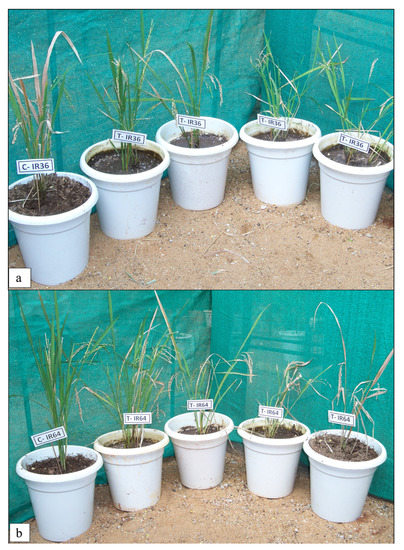
Figure 8.
Transgenic rice. 145-days-old transgenic and WT rice. (a) IR36. (b) IR64. The transformed plantlets were transferred to the plantation pots.
3.6. Southern Blot Hybridization and Segregation Analysis of T1 Progeny Plants
The stable integration of the OsiSAP8 genes in randomly selected putatively transformed T0–1 to T0–5 (IR36) and T0–1 to T0–6 (IR64) plants were confirmed by Southern blot analysis. Molecular evidence and the number of copies of gene integration were shown in Figure 9a,b. The T1 progenies were used to check the hygromycin resistance to discriminate the transgene carrier and a non-carrier. The observed Chi-square (χ2) value correlated with Mendelian segregation (3:1) on the basis of the expected and observed frequencies (Table 3). The resistant T1 seeds grew normally when compared with the non-transgenic, which stopped germinating after the coleoptile growth or did not germinate and resulted in the browning of the embryo. The observed segregation ratio was reliable in three of the six transgenic lines with a single T-DNA insertion locus in IR64 T1, whereas the other two progenies of IR36 T1 showed the expected monogenic segregation ratio of 3:1 (Table 3). The χ2 values of all that lines which had a two copy of transgene were found non-significant (p < 0.5), indicating a variation between the observed and the expected frequencies. However, the IR36 T1 that had more than two transgene loci showed a ratio of 3:1.
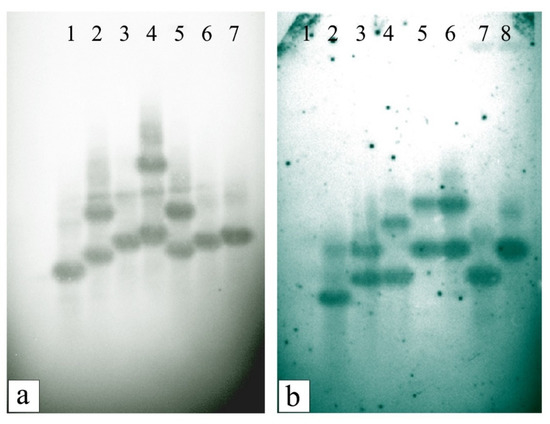
Figure 9.
DNA blot analysis: Validating OsiSAP8 gene integration. (a) Lane 1. Plasmid control- pCAM-Port2.3-OsiSAP8, Lanes 2–6. IR36 T0 lines, Lane 7. WT IR36; (b) Lane 1. WT IR64, Lane 2. Plasmid control- pCAM-Port2.3-OsiSAP8, Lanes 3–8. IR64 T0 lines.
Table 3.
Segregation analysis of T1 progeny plants.
3.7. Relative Leaf Water Content
The IR36 T1 lines could maintain 76–92% RLWC on day 7 (Figure 10), which was superior to IR64 (T1 lines) that had just 40% of events and could maintain a level of 75–85% RLWC. As the stress increased, a change in the RLWC value was observed. IR64 (T1 lines) showed a decline in RLWC in 46% of events tested but only 26% of IR36 (T1) showed reduction in RLWC. Eighty percent of the IR36 T1 events had above 80–95% RLWC, which declined up to 60–75% on the 14th day of stress. IR36 (T1 lines) reasonably maintained a higher RLWC. The factors observed were correlated with leaf wilting (Table 3).
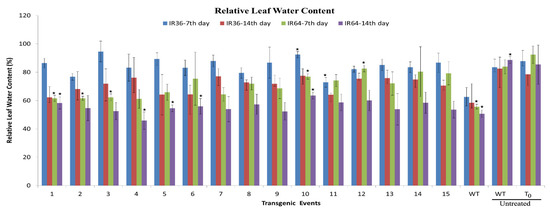
Figure 10.
Relative leaf water content. Relative leaf water content in 15 transgenic events and WT of IR36 and IR64 after water withholds. Comparison with the untreated wildtype and transgenic. * indicates significance at the level of p < 0.5.
3.8. Visual Scoring on Stress Resistance
Fifteen plantlets were randomly used for this experiment of which the IR64 WT (4, 10, and 11) succumbed to death (Table 4). The IR36 T1 lines were stable or slightly wilted during the second week of water-drought stress. Other features such as the number of tillers, panicles, and the average total grain weight per tiller were also assessed (Figure 11 and Figure 12). By the 14th day, 40% of IR36 showed severe wilting and 20% of IR64 succumbed to death; there was a corresponding variation in the IR36 and IR64 transgenic events. Eighty percent of the IR36 T1 transgenics showed slight wilting, with a corresponding good tiller setting in them after 14 days of water withholding and yielded 13 g/tiller as total grain weight. However, the IR64 lines had only 66% of events that were slightly wilted after which the tillers were set and thus resulted with only 8 g/tiller.
Table 4.
Visual scoring of OsiSAP8 transgenic events upon water deficit stress.
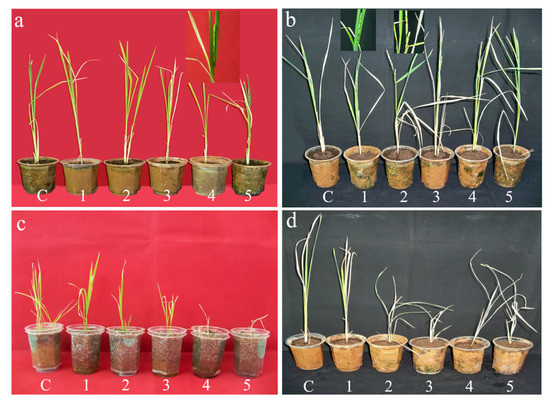
Figure 11.
Water withhold stress on wildtype and transgenic (T1) plants. The 45-days-old mature plantlets were analyzed for water deficit for 14 days. (a,b) Transgenic (T1) IR36 and IR64, respectively. (a5,b1,b2) showing the panicles set for seed filling, (c,d) WT IR36 and IR64 respectively.
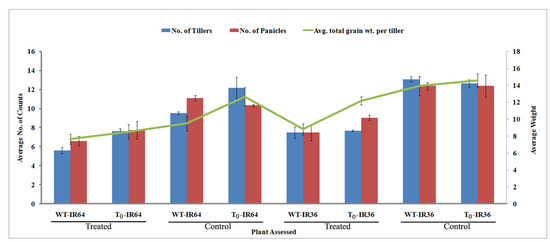
Figure 12.
Assessment of tillers. Graph depicting the number of tillers, no. of panicles and average number of tiller per plant observed after the water deficit stress. The treated and control represent plants under water withhold and normal watering respectively. Values represent mean ± Standard deviation; with significance between control and stress treated at the level of p < 0.05.
3.9. Evaluating Dehydration Stress by Mannitol on Plantlet Growth
The drought response due to mannitol stress was observed on the germinated seeds. No significant difference was observed on germination by T1 progeny with increase in mannitol stress. Coleoptile formation was delayed as the mannitol stress peaked. At 100 mM, coleoptile formed by sixth day and was delayed by 5 days at 500 mM in the IR36 T1 progeny. The superior variety IR64 (T1 progeny) produced coleoptile on the 13th day when exposed to 500 mM mannitol. The mat root and the seminal root system were predominantly formed till 200 mM mannitol stress. A better root formation and biomass was observed in the IR36 T1 progeny (Figure 13 and Figure 14). The transgenic lines showed resistance at 400 and 500 mM mannitol for 15 days, after which they succumbed to chlorophyll pigment retardation and eventually to leaf browning. Comparatively, IR64 (T1 progeny) sustained up to 200 mM mannitol stress and later succumbed to drought when exposed to a 300 mM mannitol stress. The seminal and nodal root length was greater in IR36 (T1 progeny) compared with IR64 (T1). A greater number of mat roots formed in IR36 (T1 lines) as the mannitol concentration increased, while IR64 (T1 progeny) showed increase in the seminal root length (Figure 14b5) with a gradual decline in the shoot height.
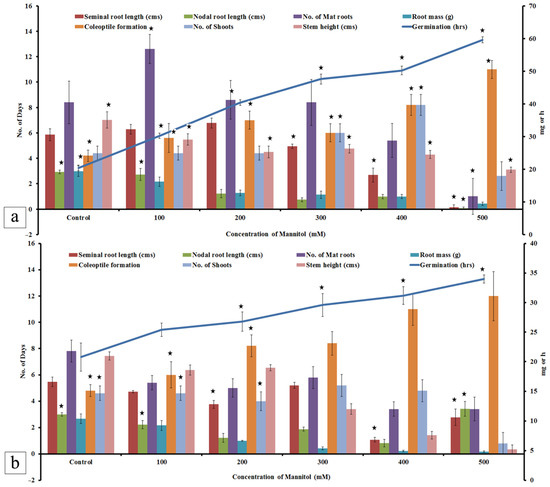
Figure 13.
Analysis of physiological parameters during mannitol stress. Effect of mannitol stress on (a) IR36 T1 and (b) IR64 T1 lines. Values represent mean ± Standard deviation; * indicates the significance between control and stress treated at the level of p < 0.05.
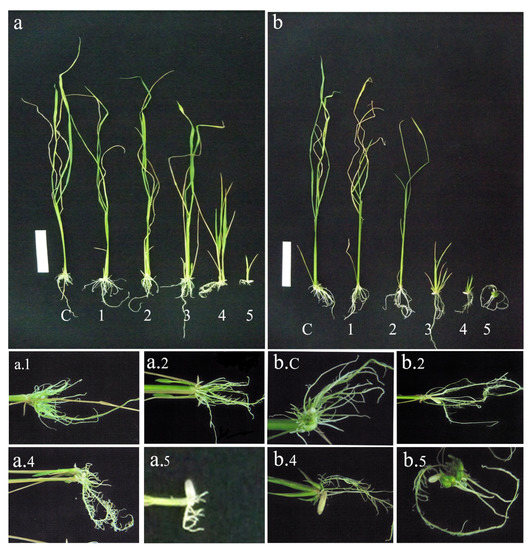
Figure 14.
Drought assay on transgenic seeds of IR36 and IR64. Drought assay using mannitol in MS medium with a concentration 100–500 mM corresponding to 1–5, respectively, and C represents control. (a) IR36 T1 and (b) IR64 T1 seed derived plantlets. White line: Scale bar. 5 cm.
3.10. Leaf Disc Bioassay
A standard assay for the chlorophyll withholding capacity was performed. The transgenic leaf segments retained the chlorophyll to a maximum of 4 days and thereafter the retention increased gradually from 400 to 500 mM NaCl stress compared with that of WT that could withstand only 48 h with retention from a 200–500 mM concentration. The wound triggered by stress was significantly simulated in the level of whitening in the leaf tissue after 72 h. It was noted that the salinity-induced loss of chlorophyll was lower in the T1 progeny (IR36), compared with IR64 (Figure 15 and Table S2). The study revealed that the transgenic rice overexpressing OsiSAP8 has a healthier ability to resist salinity stress than WT.
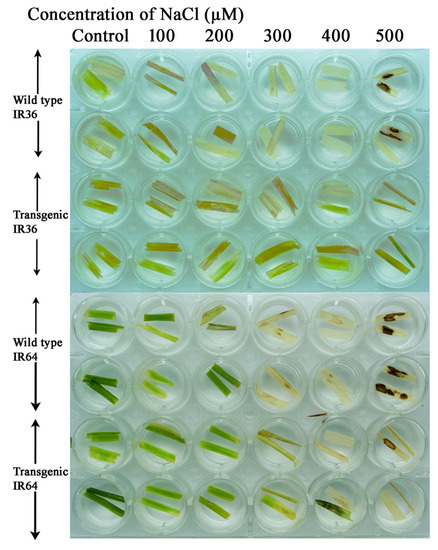
Figure 15.
Leaf disc assay of IR36 and IR64 germinated plants. Increase in chlorophyll retention as the NaCl concentration (100–500 mM) increases. The chlorophyll retention and leaf wilting speeds are more in comparison with WT.
3.11. Thiobarbituric Acid Reactive Substances (TBARS) Assay
There was no significant difference in the level of lipid peroxidation between the WT and 100 mM treated T1 (IR36 and IR64) progeny that had 0.35 ± 0.001 nmol/g F.Wt. of malondialdehyde (MDA). The MDA content showed a gradual increase from 0.4 to 0.6 ± 0.003 (Table 5) as the concentration of NaCl was increased, but the T1 lines maintained their MDA value (0.36 to 0.41 ± 0.001). Correspondingly the observations correlated with the leaf disc assay, wherein bleaching of leaves occurred from an NaCl concentration 300 mM (Figure 15). IR64 (T1 lines) showed a stable increase in the MDA content with maximum wilting at 600–700 mM as the stress level was raised, while the WT showed leaf wilting and retention in chlorophyll withholding (Figure 15). IR36 (T1 lines) were recessive till 500 mM stress while IR64 could withstand a stress of about 300 mM.
Table 5.
TBARS assay.
3.12. OsiSAP8 Gene Expression Analysis
At a lower concentration of mannitol (100–200 mM) stress down regulation of OsiSAP8 was observed by onefold in both IR64 T1 and IR36 T1 progenies. The transcript level was upregulated to 1.5-fold (IR36 T1) at 300 mM and it peaked to 2 folds when treated at 400 mM mannitol dearth. IR64 T1 progeny showed a fluctuating fold change at higher concentrations. At a higher concentration (500 mM) of mannitol, the transcript level downregulated by twofold (Figure 16a). A significant increase in the OsiSAP8 transcript level of IR64 T1 progeny was observed from one-fold to 2.5-fold when exposed to NaCl (100–300 mM). Down regulation (0.5-fold) of OsiSAP8 transcript was observed in the IR36 T1 progeny at 100 mM which gradually peaked by threefold at 300 mM salinity stress (Figure 16b). Both transgenic progenies (IR64 and IR36) showed a dearth (two-fold) in their OsiSAP8 transcript level at 500 mM NaCl stress.
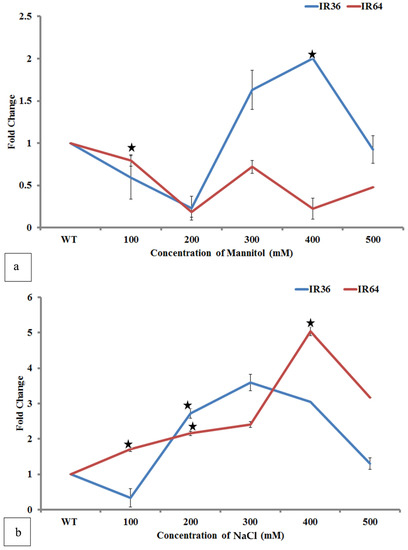
Figure 16.
qPCR analysis for drought and salinity tolerance. (a) Gene expression analysis for drought tolerance. (b) Gene expression analysis for salinity tolerance. * Indicates significance at the level of p < 0.5.
4. Discussion
In silico prediction of OsiSAP8 upstream regulatory region revealed superiority of Port Ubi2.3 promoter as an abiotic stress regulator. In this study, a constitutive ubiquitin promoter (Port Ubi2.3) was used to drive the OsiSAP8 gene. So as to have a comparative knowledge on the regulatory cis-elements, the SAP promoter was analyzed. In silico analysis of the 2.0 kb 5’ regulatory region revealed multiple cis-acting elements involved in the regulation of the OsiSAP8 gene. The transcription start site (TSS) was predicted using PLACE and was assigned +1 site based on the TATA box position. Putative cis-elements like ARR1AT [59,74,75], which are most common for salinity stress regulation, were observed at 15 sites (in Port Ubi2.3) when compared to five sites in the OsiSAP8 regulatory region. The MARTBOX elements were most predominant in Port Ubi2.3 regulating scaffold attachment [60] and plays a major role as an enhancer and OsiSAP8 is devoid of it. The OsiSAP8 promoter has WRKY71OS and GT1CONSENSUS elements that encode for WRKY, which are the largest families of TFs in higher plants, and WRKY genes are crucial protagonists in plant growth and react to environmental stresses [76,77,78]. These are DNA binding proteins that are present in a scattered style all over the OsiSAP8 promoter regulatory region (Figure 1). Numerous annotated rice genome projects paved the way for the identification of members of diverse gene families that code different proteins and have been linked with the Rice Genome Annotation Project (RGAP) [2]. Pathogenesis-related cis-regulatory elements, SEBFCONSSTPR10A is present at the 524th region from the TSS encoding for pathogenesis-related gene, PR-10a. In plants overexpressing OsWRKY IIa, the PR10a gene is upregulated [79], which enhances the basal defense against Xanthomonas oryzae pv. Oryzae (Xoo). ROOTMOTIFTAPOX1 (ATATT) and RAV1AAT (CAACA) were prominent among the root specific cis-acting elements, reported to be an important factor in the root specific expression of PZmCBF3 [80], an AP2/ERF transcription factor family. The MYCCONSENSUSAT element is present in a wide range that combats multiple abiotic stresses and code for CBF/DREB1, originally identified in Arabidopsis, which plays a significant role in combating drought and salinity stress. The stress elements also have homologs, e.g., MYB and MYC, to combat abiotic stresses [81]. Heat shock factors (CCAAT box)/SE (Heat shock element) play a vital role in the regulation of proteins responsible for developmental processes [18,62] like flowering and is proximal to PRECONSCRHSP70A that induces HSP70A gene. Heat induces the heat shock factors to respond and the heat shock elements do not have any organ specificity [82]. Conversely, the bZIP protein binding site has DPBFCOREDCDC3, a unique class of TF with DPBF-1 and 2 (Dc3 promoter-binding factor-1 and 2) binding core sequence expression that are normally embryo specific and can also be induced by ABA. The Port Ubi2.3 promoter has four bZIP protein binding sites under abiotic stress [61]. In addition to these regulatory elements, a large number of regulons are involved in pathogen-related stresses, such as WBOXATNPR1 (TTGAC) as DNA binding proteins and WRKY71OS, which are TGAC-containing W box elements within the pathogenesis-related class10 (PR-10) genes and regulate the gibberellin signaling pathway. GT1CONSENSUS (GRWAAW) regulons are reported to be found in Pisum sativum, Avena sativa, O. sativa, Nicotiana tabacum, Arabidopsis thaliana, and Spinacia oleraceaare putative cis-acting elements that control the GT-1 binding site in many light-regulated genes. GT1CONSENSUS and WRKY have been studied [78,83,84] to combat stress by binding of GT-1-like factors to the PR-1a promoter, influencing the level of salicylic acid (SA)-inducible gene expression. The OsiSAP8 promoter has more light regulated and tissue specific cis-elements as compared with Port Ubi2.3 with GT1 (GRWAAW) and GATABOX [63,64]. Similarly, tissue specific cis-elements DOFCOREZM (AAAG), CACTFTPPCA (YACT), and WBOX (TGACT) were recorded at numerous positions and they are responsible for signal responsive and/or tissue specific gene expression [67,68,69]. A total of 52 biotic stress (Plant pathogen responsive/interaction) cis-elements were predicted on OsiSAP8 regulatory region with WRKY (TGAC) and EBOX (CANNTG) [71,72]. On the other side, Port Ubi2.3 promoter 16 cis-elements (CANNTG) specific to seed/stress, 10 water stress cis-elements (CNGTTR), and 12 TGAC elements act as good defense regulators [65,66,72]. Added to this, the presence of a whooping 32 NGATT enhancer elements makes it a better and more unique promoter then the others being used for monocot specific expression research. Ubiquitin promoters are known to enhance the transgene expression upon exposure to stresses [85,86,87]. Augustine et al. (2015a) reported that use of the Port Ubi2.3 promoter could enhance the tolerance levels of transgenic sugarcane on drought and salinity stresses to a greater extent. This may be attributed to the high number of stress responsive cis-acting regulatory elements present throughout the sequence [40]. In addition, they also reported an enhanced GUS expression upon drought stress when Port Ubi2.3 promoter was used [40].
OsiSAP8 is a member of the SAP gene family, characterized by the presence of the A20/AN1 domains and a class of the zinc-finger protein [28,88]. The inherent OsiSAP8 in IR36 outwits IR64. It is a single-copy gene in WT IR36 which was overexpressed to resist abiotic stresses, drought, and salinity, thus validating the report by Kanneganti and Gupta (2008) [29]. OsiSAP8 was absent in WT IR64, whereas the T1 lines had one or two homologous copies. The hygromycin sensitivity assay of the T1 lines reiterates the Mendelian segregation. The T1 seeds (IR36 and IR64) were tested with hygromycin; those carrying a functional copy of hpt remained green, while those lacking the transgene or a functional form became bleached. The lines with more than one copy number of the OsiSAP8 gene showed a slightly higher ratio (3 > :1) but were up to the expected χ2 value.
Sharma et al. (2015) studied rice OSiSAP7 in A. thaliana and inferred downregulation during abscisic acid stress and also sensitivity to water dearth [21]. In this study, OsiSAP8 overexpression is observed to be resistant to water deficit and a saline environment. A 2.5-fold upregulation was shown by the transgenic IR36, which possesses the native OsiSAP8 and also the transgene. Hence, comparatively, it had greater tolerance than the transgenic IR64. Earlier reports on the transcript level were performed on eight-day-old seedlings [28] within 2 h of salt and drought stress. To face the extreme saline environment, plants maintain ionic and osmotic balance, which could inhibit the normal metabolism of a plant and its productivity [89]. Our studies on the physiological parameters in 40-day-old rice plants correlated with that of Jongdee et al. (2002) [90]. Drought was imposed on both four-day old germinated seeds and 45-day-old acclimatized plants and the tolerance level was measured based on the visual scoring of leaf damage [51,52,91,92]. Visual scoring revealed that 40% of both IR36 and IR64 WT showed immediate leaf wilting symptoms. Transpiration and the leaf surface texture play a candid role in the metabolism of a plant. The IR64 T1 lines could withstand water deficit for two weeks and tillers were set on all the plants. IR36 WT could resist for up to a week upon drought after which leaf rolling and wilting appeared. The wildtype and T1 transgenic lines showed a similar number of tillers and panicles, but the treated T1 lines showed significant tiller setting, producing more panicles compared with WT. The stressed T1 lines of IR36 had a greater average weight of the tiller per panicle. The lower the RLWC, the higher the transpiration and susceptibility to stress. The RLWC content in 80% of IR36 transgenic showed a tolerance to withhold stress up to the 7th day after water withhold; later 86% of the events had an average of 60–75% RLWC content, which were comparatively more that IR64 transgenic events. This validates the present data on the water withhold stress. The water deficit significantly reduced the leaf biomass in transgenic events, which was lower than WT [93,94]. A superior recovering ability was observed with plants having a larger leaf length at the end of the drought stress [93,94]. Moreover, biomass under stress correlates with the yield [95] and was used as an index for drought tolerance. The water withholding capacity and the total grain per tiller (13 g) indicates significantly higher stress tolerated by the IR36 T1 lines. Thus, T1 progenies showed enhanced stress tolerance compared with WT These results show that OsiSAP8 overexpression in transgenic rice have a profound increase in the abiotic stress tolerance compared with WT rice.
Thiobarbituric acid reactive substances are naturally existent in organic specimens and include lipid hydroperoxides and aldehydes, which increase in concentration as a response to oxidative stress [96]. Once lipid peroxidation is enhanced during salinity stress, the inhibition of plant growth is initiated. TBARS assay values are usually reported in malonaldehyde (MDA) equivalents, a compound that results from the decomposition of polyunsaturated fatty acid lipid peroxides [97]. A comparison of the lipid peroxidation levels during NaCl stress revealed that with increasing concentrations of NaCl, the MDA content increased. However, the IR64 (WT) showed a fluctuating MDA value and succumbed to leaf wilting. The salt stress tolerance of transgenic plants of T1 generation in comparison with the WT plants was manifested by an increase in the shoot height, biomass production (data not shown), higher chlorophyll retention and a lower rate of lipid peroxidation on exposure to salinity.
Gene expression analysis is the next mandatory step to know the expression pattern under varied stresses which revealed that transgenic IR36 was better than IR64 during drought and salinity conditions [98]. Both the cultivars withstood a maximum of 400 mM (mannitol or NaCl) but the yield and the panicles count were comparatively more in IR36. Transcription factors (TFs) are dynamic elements to transduce any signal in a living body. Apart from the recognized zinc fingers, several new types of Zn fingers that are governed by key TFs [99,100] and are expressed differentially during reproductive, development and abiotic stresses were identified. Three housekeeping genes were used in this study. To our surprise, the elongation factor (eEF-1α), which is normally used as an internal housekeeping gene [56,101,102], varied during the gene expression analysis (data not shown) in the overexpressed IR36 but was absent in transgenic IR64 and wildtype. Wu et al. (2005) [103] reported that the subtraction library obtained from drought/cold stress-treated upland rice yielded a number of regulatory proteins [104]. eEF-1α was reported to provide significant catalytic activity in plants during abiotic stress [104]. In plants, the eEF-1α is induced by salinity, wounding, and low temperature [105,106,107], wherein α subunit of eEF-1α, plays a candidate role in the polypeptide chain elongation to deter abiotic stress. Many transcripts homologous with ribosomal proteins were upregulated in rice (IR29 and Pokkali) upon salt treatment for just 1 h [108]. Salinity tolerant [109] IR36, was more resistant and productive than IR64, which is salinity and drought sensitive [110]. Pokkali being resistant to salinity stress had a time precise synthesis of transcripts, whereas the salinity liable IR29 did not show any tolerance and it was inferred that the production of ribosomal proteins, and eEF-1α could have a role in reorganizing the protein synthesis mechanism [111,112]. Despite being a house keeping gene, it also is reported to express constitutively during abiotic stresses like drought and salinity [29].
Crop plants unceasingly feel and react to their surrounding environment so as to protect themselves from abiotic and biotic abnormalities. Their stress response signaling involves numerous key promoters that are highly conserved and have evolved as promising targets to combat abiotic stress in a variety of crop plants [12,13,14]. During dehydration assays, the transgenic IR36 and IR64 had molecular changes but physiological changes such as leaf wilting were observed at a later stage compared with that of the wildtype correspondingly the eEF-1α varied in, gene expression. Drought induces dehydration, which instigates pathways related to desiccation. Griffiths et al. (2014) [113] reported a high level of eEF-1α expression in Sporobolus stapfianus leaves that were fully hydrated [114]. Rapid growth of the coleoptile is a prerequisite for successful establishment in a plant to access oxygen. The WT IR36 and IR64 formed coleoptile within 4 to 5 days after germination (Figure 4) when compared with the stress-exposed transgenic seeds on mannitol deprived of sucrose source. There was a significant difference between the transgenic IR36 and IR64. IR36, which has a native gene (OsiSAP8), was comparatively fastidious in developing a coleoptile and the same was validated by gene expression analysis. The coleoptile length and the gene expression have been correlated with stress tolerance.
To study the multiple stress-inducing characters of SAPs, transgenic plants that resist stress and yield more could be studied for the drought yield index (DYI) so as to screen the highly tolerant events. The DYI and mean yield index (MYI) has been studied from a group of 129 advanced rice yield lines, and 39 genomes (including IR64 and IR36) were tested [114]. This could lead to the selection of the superior cultivar and edify the signaling mechanism of abiotic stress resistance by the A20/AN1 zinc-finger domains of SAP proteins.
5. Conclusions
In order to achieve crop improvement, genetic transformation plays a pivotal role in the development of genetically engineered crops with desirable traits. Despite considerable efforts, the genetic transformation of rice remains a demanding process due to the variation in its reproducibility. Moreover, rice is highly susceptible to drought and salinity stress. In the present study, rice (var. IR36 and IR64) was transformed with the OsiSAP8 gene driven by Port Ubi2.3 promoter. Overexpression of OsiSAP8 in IR36 delayed leaf wilting by maintaining RLWC during drought stress over its superior variety, IR64. The transgenic rice overexpressing zinc-finger protein driven by Port Ubi2.3 showed reliable resistance and tiller setting than the WT. This study reiterates that OsiSAP8 acts as key abiotic stress regulator in plants. Our investigation also provides a platform to unravel the OsiSAP8 regulatory region, which will manifest an altered relationship between stress tolerance and its multiple stress inducible nature.
Supplementary Materials
The following supporting information can be downloaded at: https://www.mdpi.com/article/10.3390/su141610174/s1. References [45,49,115,116,117,118] are cited in the supplementary materials.
Author Contributions
Conceptualization: S.R.K., A.M.P., A.K.G. and M.R.; data curation: S.R.K., P.M., A.M.P. and K.G.; formal analysis: S.R.K., P.M., M.I.P., K.G., C.M., K.B. and M.R.; funding acquisition: S.R.K., A.M.P. and M.R.; investigation: S.R.K., M.I.P., K.G., C.M. and M.R.; methodology: S.R.K., P.M., A.M.P., M.I.P., C.M. and K.B.; project administration; S.R.K., A.M.P., A.K.G. and M.R; resources: S.R.K., M.I.P., K.G., C.M., K.M. and M.R.; software: S.R.K., P.M., K.G. and K.M.; supervision: S.R.K. and M.R.; validation: S.R.K. and K.G.; visualization: S.R.K.; writing—original draft: S.R.K. and P.M.; writing—review & editing: S.R.K., P.M., K.G. and M.R. All authors have read and agreed to the published version of the manuscript.
Funding
Council of Scientific and Industrial Research (CSIR), New Delhi Grant No. 38(1315)/12/EMR-II dt 03/04/2012].
Institutional Review Board Statement
Not applicable.
Informed Consent Statement
Not applicable.
Data Availability Statement
Genbank Submission: NCBI Accession No. MN256433.1.
Acknowledgments
The authors gratefully acknowledge the financial assistance rendered by Council of Scientific and Industrial Research (CSIR), New Delhi The strains DH5α harboring the binary plasmid pCAMBIA 1305.1 with Port Ubi promoter were kindly granted by N. Subramonian, Emeritus Scientist, ICAR-Sugarcane Breeding Institute, Coimbatore. The strain LBA 4404 was kindly granted by P. Balasubramanian, Centre for Plant Molecular Biology, Tamil Nadu Agricultural University, Coimbatore, Tamil Nadu, India. The authors are very much grateful to A. Ganapathi, (Former position—UGC-BSR Emeritus Faculty, Department of Biotechnology and Genetic Engineering, Bharathidasan University) for helping us in standardizing the Southern blot procedures to check the copy numbers of the transgene integrated. We are also thankful for the support rendered by R. Sathish Kumar (Department of Biotechnology, Bharathiar University, Tamil Nadu, India) for providing the Greenhouse facility for analyzing transgenic rice lines.
Conflicts of Interest
The authors declare that they have no conflict of interest.
Abbreviations
| cDNA | Complementary DNA; |
| CTAB | Cetyl trimethyl ammonium bromide; |
| DW | Dry weight; |
| FW | Fresh weight; |
| MDA | Malondialdehyde; |
| RLWC | Relative leaf water content; |
| TBA | Thiobarbituric acid; |
| TW | Turgid weight; |
| WT | Wild type |
References
- Khush, G.S. What It Will Take to Feed 5.0 Billion Rice Consumers in 2030. Plant Mol. Biol. 2005, 59, 1–6. [Google Scholar] [CrossRef] [PubMed]
- Agarwal, P.; Parida, S.K.; Raghuvanshi, S.; Kapoor, S.; Khurana, P.; Khurana, J.P.; Tyagi, A.K. Rice Improvement Through Genome-Based Functional Analysis and Molecular Breeding in India. Rice 2016, 9, 1. [Google Scholar] [CrossRef] [PubMed]
- Mesterházy, Á.; Oláh, J.; Popp, J. Losses in the Grain Supply Chain: Causes and Solutions. Sustainability 2020, 12, 2342. [Google Scholar] [CrossRef]
- Liu, Y.; Khan, A.R.; Gan, Y. C2H2 Zinc Finger Proteins Response to Abiotic Stress in Plants. Int. J. Mol. Sci. 2022, 23, 2730. [Google Scholar] [CrossRef]
- Bray, E.; Bailey-Serres, J.; Weretilnyk, E. Responses to Abiotic Stresses. In Biochemistry and Molecular Biology of Plants; Gruissem, W., Buchannan, B., Jones, R., Eds.; American Society of Plant Physiologists: Rockville, MD, USA, 2000; pp. 1158–1203. [Google Scholar]
- Boshkovski, B.; Doupis, G.; Zapolska, A.; Kalaitzidis, C. Hyperspectral Imagery Detects Water Deficit and Salinity Effects on Photosynthesis and Antioxidant Enzyme Activity of Three Greek Olive Varieties. Sustainability 2022, 14, 1432. [Google Scholar] [CrossRef]
- Leung, H.; Raghavan, C.; Zhou, B.; Oliva, R.; Choi, I.R.; Lacorte, V.; Jubay, M.L.; Cruz, C.V.; Gregorio, G.; Singh, R.K.; et al. Allele Mining and Enhanced Genetic Recombination for Rice Breeding. Rice 2015, 8, 34. [Google Scholar] [CrossRef]
- Oladosu, Y.; Rafii, M.Y.; Arolu, F.; Chukwu, S.C.; Muhammad, I.; Kareem, I.; Salisu, M.A.; Arolu, I.W. Submergence Tolerance in Rice: Review of Mechanism, Breeding and, Future Prospects. Sustainability 2020, 12, 1632. [Google Scholar] [CrossRef]
- Spielmeyer, W.; Ellis, M.H.; Chandler, P.M. Semidwarf (Sd-1), “Green Revolution” Rice, Contains a Defective Gibberellin 20-Oxidase Gene. Proc. Natl. Acad. Sci. USA 2002, 99, 9043–9048. [Google Scholar] [CrossRef]
- Brar, D.S.; Khush, G.S. Alien Introgression in Rice. Plant Mol. Biol. 1997, 35, 35–47. [Google Scholar] [CrossRef]
- Vikram, P.; Swamy, B.P.M.; Dixit, S.; Singh, R.; Singh, B.P.; Miro, B.; Kohli, A.; Henry, A.; Singh, N.K.; Kumar, A. Drought Susceptibility of Modern Rice Varieties: An Effect of Linkage of Drought Tolerance with Undesirable Traits. Sci. Rep. 2015, 5, 14799. [Google Scholar] [CrossRef]
- Mizoi, J.; Shinozaki, K.; Yamaguchi-Shinozaki, K. AP2/ERF Family Transcription Factors in Plant Abiotic Stress Responses. Biochim. Biophys. Acta-Gene Regul. Mech. 2012, 1819, 86–96. [Google Scholar] [CrossRef]
- Nakashima, K.; Takasaki, H.; Mizoi, J.; Shinozaki, K.; Yamaguchi-Shinozaki, K. NAC Transcription Factors in Plant Abiotic Stress Responses. Biochim. Biophys. Acta-Gene Regul. Mech. 2012, 1819, 97–103. [Google Scholar] [CrossRef]
- Scharf, K.-D.; Berberich, T.; Ebersberger, I.; Nover, L. The Plant Heat Stress Transcription Factor (Hsf) Family: Structure, Function and Evolution. Biochim. Biophys. Acta 2012, 1819, 104–119. [Google Scholar] [CrossRef]
- Kavar, T.; Maras, M.; Kidrič, M.; Šuštar-Vozlič, J.; Meglič, V. Identification of Genes Involved in the Response of Leaves of Phaseolus Vulgaris to Drought Stress. Mol. Breed. 2008, 21, 159–172. [Google Scholar] [CrossRef]
- Huang, J.; Teng, L.; Li, L.; Liu, T.; Li, L.; Chen, D.; Xu, L.-G.; Zhai, Z.; Shu, H.-B. ZNF216 Is an A20-like and I Kappa-B Kinase Gamma -Interacting Inhibitor of NF Kappa-B Activation. J. Biol. Chem. 2004, 279, 16847–16853. [Google Scholar] [CrossRef]
- Hishiya, A.; Iemura, S.; Natsume, T.; Takayama, S.; Ikeda, K.; Watanabe, K. A Novel Ubiquitin-Binding Protein ZNF216 Functioning in Muscle Atrophy. EMBO J. 2006, 25, 554–564. [Google Scholar] [CrossRef]
- Zhang, J.; Li, Y.; Jia, H.; Li, J.; Huang, J.; Lu, M.; Hu, J.-J. The Heat Shock Factor Gene Family in Salix Suchowensis: A Genome-Wide Survey and Expression Profiling during Development and Abiotic Stresses. Front. Plant Sci. 2015, 6, 748. [Google Scholar] [CrossRef]
- Dixit, V.M.; Green, S.; Sarma, V.; Holzman, L.B.; Wolf, F.W.; O’Rourke, K.; Ward, P.A.; Prochownik, E.V.; Marks, R.M. Tumor Necrosis Factor-Alpha Induction of Novel Gene Products in Human Endothelial Cells Including a Macrophage-Specific Chemotaxin. J. Biol. Chem. 1990, 265, 2973–2978. [Google Scholar] [CrossRef]
- Vij, S.; Tyagi, A.K. Emerging Trends in the Functional Genomics of the Abiotic Stress Response in Crop Plants. Plant Biotechnol. J. 2007, 5, 361–380. [Google Scholar] [CrossRef]
- Sharma, G.; Giri, J.; Tyagi, A.K. Rice OsiSAP7 Negatively Regulates ABA Stress Signalling and Imparts Sensitivity to Water-Deficit Stress in Arabidopsis. Plant Sci. 2015, 237, 80–92. [Google Scholar] [CrossRef]
- Fan, S.C.; Li, C.; Li, S.H.; Tang, J.; Shi, H.D.; Yang, T.M.; Liang, M.Z.; Liu, D.D. Genome-Wide Analyses of Tea Plant Stress-Associated Proteins (SAPs) Reveal the Role of CsSAP12 in Increased Drought Tolerance in Transgenic Tomatoes. Horticulturae 2022, 8, 363. [Google Scholar] [CrossRef]
- Fatima, S.; Zafar, Z.; Gul, A.; Bhatti, M.F. Genome-Wide Identification of Stress-Associated Proteins (Saps) Encoding A20/An1 Zinc Finger in Almond (Prunus Dulcis) and Their Differential Expression during Fruit Development. Plants 2022, 11, 117. [Google Scholar] [CrossRef] [PubMed]
- Ali, F.; Wang, Q.; Fazal, A.; Wang, L.J.; Song, S.; Kong, M.J.; Mahmood, T.; Lu, S. The DnaJ-like Zinc Finger Protein ORANGE Promotes Proline Biosynthesis in Drought-Stressed Arabidopsis Seedlings. Int. J. Mol. Sci. 2022, 23, 3907. [Google Scholar] [CrossRef] [PubMed]
- Mukhopadhyay, A.; Vij, S.; Tyagi, A.K. Overexpression of a Zinc-Finger Protein Gene from Rice Confers Tolerance to Cold, Dehydration, and Salt Stress in Transgenic Tobacco. Proc. Natl. Acad. Sci. USA 2004, 101, 6309–6314. [Google Scholar] [CrossRef]
- Vij, S.; Tyagi, A.K. Genome-Wide Analysis of the Stress Associated Protein (SAP) Gene Family Containing A20/AN1 Zinc-Finger(s) in Rice and Their Phylogenetic Relationship with Arabidopsis. Mol. Genet. Genom. 2006, 276, 565–575. [Google Scholar] [CrossRef]
- Jin, Y.; Wang, M.; Fu, J.; Xuan, N.; Zhu, Y.; Lian, Y.; Jia, Z.; Zheng, J.; Wang, G. Phylogenetic and Expression Analysis of ZnF-AN1 Genes in Plants. Genomics 2007, 90, 265–275. [Google Scholar] [CrossRef]
- Kanneganti, V.; Gupta, A.K. Overexpression of OsiSAP8, a Member of Stress Associated Protein (SAP) Gene Family of Rice Confers Tolerance to Salt, Drought and Cold Stress in Transgenic Tobacco and Rice. Plant Mol. Biol. 2008, 66, 445–462. [Google Scholar] [CrossRef]
- Basu, D.; South, P.F. Design and Analysis of Native Photorespiration Gene Motifs of Promoter Untranslated Region Combinations Under Short Term Abiotic Stress Conditions. Front. Plant Sci. 2022, 13, 1–18. [Google Scholar] [CrossRef]
- Fang, R.X.; Nagy, F.; Sivasubramaniam, S.; Chua, N.H. Multiple Cis Regulatory Elements for Maximal Expression of the Cauliflower Mosaic Virus 35S Promoter in Transgenic Plants. Plant Cell 1989, 1, 141–150. [Google Scholar] [CrossRef]
- Jang, I.-C.; Choi, W.-B.; Lee, K.-H.; Song, S.I.; Nahm, B.H.; Kim, J.-K. High-Level and Ubiquitous Expression of the Rice Cytochrome c Gene OsCc1 and Its Promoter Activity in Transgenic Plants Provides a Useful Promoter for Transgenesis of Monocots. Plant Physiol. 2002, 129, 1473–1481. [Google Scholar] [CrossRef]
- Mcelroy, D.; Zhang, W.; Cao, J.; Wu, R. Lsolation of an Efficient Actin Promoter for Use in Rice Transformation. Plant Cell 1990, 2, 163–171. [Google Scholar] [CrossRef]
- McElroy, D.; Blowers, A.D.; Jenes, B.; Wu, R. Construction of Expression Vectors Based on the Rice Actin 1 (Act1) 5′ Region for Use in Monocot Transformation. MGG Mol. Gen. Genet. 1991, 231, 150–160. [Google Scholar] [CrossRef]
- Christensen, A.H.; Sharrock, R.A.; Quail, P.H. Maize Polyubiquitin Genes: Structure, Thermal Perturbation of Expression and Transcript Splicing, and Promoter Activity Following Transfer to Protoplasts by Electroporation. Plant Mol. Biol. 1992, 18, 675–689. [Google Scholar] [CrossRef]
- Sengupta, S.; Majumder, A.L. Porteresia Coarctata (Roxb.) Tateoka, a Wild Rice: A Potential Model for Studying Salt-Stress Biology in Rice. Plant Cell Environ. 2010, 33, 526–542. [Google Scholar] [CrossRef]
- Jegadeeson, V.; Kumari, K.; Pulipati, S.; Parida, A.; Venkataraman, G. Expression of Wild Rice Porteresia Coarctata PcNHX1 Antiporter Gene (PcNHX1) in Tobacco Controlled by PcNHX1 Promoter (PcNHX1p) Confers Na+ -Specific Hypocotyl Elongation and Stem-Specific Na+ Accumulation in Transgenic Tobacco. Plant Physiol. Biochem. 2019, 139, 161–170. [Google Scholar] [CrossRef]
- Augustine, S.M.; Ashwin Narayan, J.; Syamaladevi, D.P.; Appunu, C.; Chakravarthi, M.; Ravichandran, V.; Tuteja, N.; Subramonian, N. Introduction of Pea DNA Helicase 45 into Sugarcane (Saccharum Spp. Hybrid) Enhances Cell Membrane Thermostability and Upregulation of Stress-Responsive Genes Leads to Abiotic Stress Tolerance. Mol. Biotechnol. 2015, 57, 475–488. [Google Scholar] [CrossRef]
- Augustine, S.M.; Ashwin Narayan, J.; Syamaladevi, D.P.; Appunu, C.; Chakravarthi, M.; Ravichandran, V.; Tuteja, N.; Subramonian, N. Overexpression of EaDREB2 and Pyramiding of EaDREB2 with the Pea DNA Helicase Gene (PDH45) Enhance Drought and Salinity Tolerance in Sugarcane (Saccharum Spp. Hybrid). Plant Cell Rep. 2015, 34, 247–263. [Google Scholar] [CrossRef]
- Augustine, S.M.; Narayan, J.A.; Syamaladevi, D.P.; Appunu, C.; Chakravarthi, M.; Ravichandran, V.; Subramonian, N. Erianthus Arundinaceus HSP70 (EaHSP70) Overexpression Increases Drought and Salinity Tolerance in Sugarcane (Saccharum Spp. Hybrid). Plant Sci. 2015, 232, 23–34. [Google Scholar] [CrossRef]
- Philip, A.; Syamaladevi, D.P.; Chakravarthi, M.; Gopinath, K.; Subramonian, N. 5′ Regulatory Region of Ubiquitin 2 Gene from Porteresia Coarctata Makes Efficient Promoters for Transgene Expression in Monocots and Dicots. Plant Cell Rep. 2013, 32, 1199–1210. [Google Scholar] [CrossRef]
- Sato, Y.; Takehisa, H.; Kamatsuki, K.; Minami, H.; Namiki, N.; Ikawa, H.; Ohyanagi, H.; Sugimoto, K.; Antonio, B.A.; Nagamura, Y. RiceXPro Version 3.0: Expanding the Informatics Resource for Rice Transcriptome. Nucleic Acids Res. 2013, 41, 1206–1213. [Google Scholar] [CrossRef]
- Szklarczyk, D.; Franceschini, A.; Wyder, S.; Forslund, K.; Heller, D.; Huerta-Cepas, J.; Simonovic, M.; Roth, A.; Santos, A.; Tsafou, K.P.; et al. STRING V10: Protein-Protein Interaction Networks, Integrated over the Tree of Life. Nucleic Acids Res. 2015, 43, D447–D452. [Google Scholar] [CrossRef] [PubMed]
- Higo, K. PLACE: A Database of Plant Cis-Acting Regulatory DNA Elements. Nucleic Acids Res. 1998, 26, 358–359. [Google Scholar] [CrossRef] [PubMed]
- Shannon, P.; Markiel, A.; Ozier, O.; Baliga, N.S.; Wang, J.T.; Ramage, D.; Amin, N.; Schwikowski, B.; Ideker, T. Cytoscape: A Software Environment for Integrated Models of Biomolecular Interaction Networks. Genome Res. 2003, 13, 2498–2504. [Google Scholar] [CrossRef] [PubMed]
- Krishnan, S.; Priya, A.; Ramesh, M. Rapid Regeneration and Ploidy Stability of ‘Cv IR36’ Indica Rice (Oryza sativa. L) Confers Efficient Protocol for in Vitro Callus Organogenesis and Agrobacterium Tumefaciens Mediated Transformation. Bot. Stud. 2013, 54, 47. [Google Scholar] [CrossRef] [PubMed][Green Version]
- Priya, A.M.; Krishnan, S.R.; Ramesh, M. Ploidy Stability of Oryza Sativa. L Cv IR64 Transformed with the Moth Bean P5CS Gene with Significant Tolerance against Drought and Salinity. Turk. J. Biol. 2015, 39, 407–416. [Google Scholar] [CrossRef]
- Hoekema, A.; de Pater, B.S.; Fellinger, A.J.; Hooykaas, P.J.J.; Schilperoort, R.A. The Limited Host Range of an Agrobacterium Tumefaciens Strain Extended by a Cytokinin Gene from a Wide Host Range T-Region. EMBO J. 1984, 3, 3043–3047. [Google Scholar] [CrossRef] [PubMed]
- Ditta, G.; Stanfield, S.; Corbin, D.; Helinski, D.R. Broad Host Range DNA Cloning System for Gram-Negative Bacteria: Construction of a Gene Bank of Rhizobium Meliloti. Proc. Natl. Acad. Sci. USA 1980, 77, 7347–7351. [Google Scholar] [CrossRef] [PubMed]
- Rogers, S.O.; Bendich, A.J. Extraction of DNA from Plant Tissues. In Plant Molecular Biology Manual; Springer: Dordrecht, The Netherlands, 1989; Volume 10, pp. 73–83. ISBN 978-94-009-0951-9. [Google Scholar]
- Sambrook, J.; Russel, D.W. Molecular Cloning: A Laboratory Manual, 3rd ed.; Cold Spring Harbor Laboratory Press: New York, NY, USA, 2000; Volume 3, p. 999. [Google Scholar]
- Turner, N.C. Techniques and Experimental Approaches for the Measurement of Plant Water Status. Plant Soil 1981, 58, 339–366. [Google Scholar] [CrossRef]
- Engelbrecht, B.M.J.; Tyree, M.T.; Kursar, T.A. Visual Assessment of Wilting as a Measure of Leaf Water Potential and Seedling Drought Survival. J. Trop. Ecol. 2007, 23, 497–500. [Google Scholar] [CrossRef]
- Potrykus, I. Gene Transfer to Plants: Assessment of Published Approaches and Results. Annu. Rev. Plant Physiol. Plant Mol. Biol. 1991, 42, 205–225. [Google Scholar] [CrossRef]
- Porra, R.J. The Chequered History of the Development and Use of Simultaneous Equations for the Accurate Determination of Chlorophylls a and B. Photosynth. Res. 2002, 73, 149–156. [Google Scholar] [CrossRef] [PubMed]
- Heath, R.L.; Packer, L. Photoperoxidation in Isolated Chloroplasts. Arch. Biochem. Biophys. 1968, 125, 189–198. [Google Scholar] [CrossRef]
- Jain, M.; Nijhawan, A.; Tyagi, A.K.; Khurana, J.P. Validation of Housekeeping Genes as Internal Control for Studying Gene Expression in Rice by Quantitative Real-Time PCR. Biochem. Biophys. Res. Commun. 2006, 345, 646–651. [Google Scholar] [CrossRef] [PubMed]
- Livak, K.J.; Schmittgen, T.D. Analysis of Relative Gene Expression Data Using Real-Time Quantitative PCR and the 2(-Delta Delta C(T)) Method. Methods 2001, 25, 402–408. [Google Scholar] [CrossRef]
- Donald, R.G.; Cashmore, A.R. Mutation of Either G Box or I Box Sequences Profoundly Affects Expression from the Arabidopsis RbcS-1A Promoter. EMBO J. 1990, 9, 1717–1726. [Google Scholar] [CrossRef]
- Sakai, H.; Aoyama, T.; Oka, A. Arabidopsis ARR1 and ARR2 Response Regulators Operate as Transcriptional Activators. Plant J. 2000, 24, 703–711. [Google Scholar] [CrossRef]
- Terzaghi, W.B.; Cashmore, A.R. Light-Regulated Transcription. Annu. Rev. Plant Physiol. Plant Mol. Biol. 1995, 46, 445–474. [Google Scholar] [CrossRef]
- Simpson, S.D.; Nakashima, K.; Narusaka, Y.; Seki, M.; Shinozaki, K.; Yamaguchi-Shinozaki, K. Two Different Novel Cis-Acting Elements of Erd1, a ClpA Homologous Arabidopsis Gene Function in Induction by Dehydration Stress and Dark-Induced Senescence. Plant J. 2003, 33, 259–270. [Google Scholar] [CrossRef]
- Shirsat, A.; Wilford, N.; Croy, R.; Boulter, D. Sequences Responsible for the Tissue Specific Promoter Activity of a Pea Legumin Gene in Tobacco. MGG Mol. Gen. Genet. 1989, 215, 326–331. [Google Scholar] [CrossRef]
- Rubio-Somoza, I.; Martinez, M.; Abraham, Z.; Diaz, I.; Carbonero, P. Ternary Complex Formation between HvMYBS3 and Other Factors Involved in Transcriptional Control in Barley Seeds. Plant J. 2006, 47, 269–281. [Google Scholar] [CrossRef]
- Buchel, A.S.; Th, F.; Bol, J.F.; Linthorst, H.J.M. Mutation of GT-1 Binding Sites in the Pr-1A Promoter in Uences the Level of Inducible Gene Expression in Vivo. Plant Mol. Biol. 1999, 84, 387–396. [Google Scholar] [CrossRef]
- Solano, R.; Nieto, C.; Avila, J.; Cañas, L.; Diaz, I.; Paz-Ares, J. Dual DNA Binding Specificity of a Petal Epidermis-Specific MYB Transcription Factor (MYB.Ph3) from Petunia Hybrida. EMBO J. 1995, 14, 1773–1784. [Google Scholar] [CrossRef]
- Agarwal, M.; Hao, Y.; Kapoor, A.; Dong, C.H.; Fujii, H.; Zheng, X.; Zhu, J.K. A R2R3 Type MYB Transcription Factor Is Involved in the Cold Regulation of CBF Genes and in Acquired Freezing Tolerance. J. Biol. Chem. 2006, 281, 37636–37645. [Google Scholar] [CrossRef]
- Finkelstein, R.R.; Lynch, T.J. The Arabidopsis Abscisic Acid Response Gene ABI5 Encodes a Basic Leucine Zipper Transcription Factor. Plant Cell 2000, 12, 599–609. [Google Scholar] [CrossRef]
- Gowik, U.; Burscheidt, J.; Akyildiz, M.; Schlue, U.; Koczor, M.; Streubel, M.; Westhoff, P. Cis-Regulatory Elements for Mesophyll-Specific Gene Expression in the C4 Plant Flaveria Trinervia, the Promoter of the C4 Phosphoenolpyruvate Carboxylase Gene. Plant Cell 2004, 16, 1077–1090. [Google Scholar] [CrossRef]
- Sun, C.; Palmqvist, S.; Olsson, H.; Boren, M.; Ahlandsberg, S.; Jansson, C. A Novel WRKY Transcription Factor, SUSIBA2, Participates in Sugar Signaling in Barley by Binding to the Sugar-Responsive Elements of the Iso1 Promoter. Plant Cell 2003, 15, 2076–2092. [Google Scholar] [CrossRef]
- Rogers, H.J.; Bate, N.; Combe, J.; Sullivan, J.; Sweetman, J.; Swan, C.; Lonsdale, D.M.; Twell, D. Functional Analysis of Cis-Regulatory Elements within the Promoter of the Tobacco Late Pollen Gene G10. Plant Mol. Biol. 2001, 45, 577–585. [Google Scholar] [CrossRef]
- Eulgem, T.; Rushton, P.J.; Robatzek, S.; Somssich, I.E. The WRKY Superfamily of Plant Transcription Factors. Trends Plant Sci. 2000, 5, 199–206. [Google Scholar] [CrossRef]
- Seitz, S.B.; Voytsekh, O.; Mohan, K.M.; Mittag, M. The Role of an E-Box Element. Plant Signal. Behav. 2010, 5, 1077–1080. [Google Scholar] [CrossRef][Green Version]
- Murashige, T.; Skoog, F. A Revised Medium for Rapid Growth and Bio Agsays with Tohaoco Tissue Cultures. Physiol. Plant 1962, 15, 473–497. [Google Scholar] [CrossRef]
- Pagano, A.; Gualtieri, C.; Mutti, G.; Raveane, A.; Sincinelli, F.; Semino, O.; Balestrazzi, A.; Macovei, A. Identification and Characterization of SOG1 (Suppressor of Gamma Response 1) Homologues in Plants Using Data Mining Resources and Gene Expression Profiling. Genes 2022, 13, 667. [Google Scholar] [CrossRef] [PubMed]
- Muthuramalingam, P.; Jeyasri, R.; Selvaraj, A.; Shin, H.; Chen, J.-T.; Satish, L.; Wu, Q.-S.; Ramesh, M. Global Integrated Genomic and Transcriptomic Analyses of MYB Transcription Factor Superfamily in C3 Model Plant Oryza sativa (L.) Unravel Potential Candidates Involved in Abiotic Stress Signaling. Front. Genet. 2022, 13, 946834. [Google Scholar] [CrossRef] [PubMed]
- Chen, L.; Song, Y.; Li, S.; Zhang, L.; Zou, C.; Yu, D. The Role of WRKY Transcription Factors in Plant Abiotic Stresses. Biochim. Biophys. Acta (BBA)-Gene Regul. Mech. 2012, 1819, 120–128. [Google Scholar] [CrossRef] [PubMed]
- Rushton, P.J.; Somssich, I.E.; Ringler, P.; Shen, Q.J. WRKY Transcription Factors. Trends Plant Sci. 2010, 15, 247–258. [Google Scholar] [CrossRef]
- Shu, W.; Zhou, Q.; Xian, P.; Cheng, Y.; Lian, T.; Ma, Q.; Zhou, Y.; Li, H.; Nian, H.; Cai, Z. GmWRKY81 Encoding a WRKY Transcription Factor Enhances Aluminum Tolerance in Soybean. Int. J. Mol. Sci. 2022, 23, 6518. [Google Scholar] [CrossRef]
- Peng, Y.; Bartley, L.E.; Canlas, P.; Ronald, P.C. OsWRKY IIa Transcription Factors Modulate Rice Innate Immunity. Rice 2010, 3, 36–42. [Google Scholar] [CrossRef]
- Liu, J.; Li, J.; Qu, J.; Yan, S. Development of Genome-Wide Insertion and Deletion Polymorphism Markers from Next-Generation Sequencing Data in Rice. Rice 2015, 8, 27. [Google Scholar] [CrossRef]
- Abe, H.; Yamaguchi-Shinozaki, K.; Urao, T.; Iwasaki, T.; Hosokawa, D.; Shinozaki, K. Role of Arabidopsis MYC and MYB Homologs in Drought- and Abscisic Acid-Regulated Gene Expression. Plant Cell 1997, 9, 1859–1868. [Google Scholar] [CrossRef]
- Strittmatter, G.; Chua, N.H. Artificial Combination of Two Cis-Regulatory Elements Generates a Unique Pattern of Expression in Transgenic Plants. Proc. Natl. Acad. Sci. USA 1987, 84, 8986–8990. [Google Scholar] [CrossRef]
- Hwang, S.-H.; Hwang, D.-J. Isolation and Characterization of the Rice NPR1 Promoter. Plant Biotechnol. Rep. 2010, 4, 29–35. [Google Scholar] [CrossRef]
- Finatto, T.; de Oliveira, A.C.; Chaparro, C.; da Maia, L.C.; Farias, D.R.; Woyann, L.G.; Mistura, C.C.; Soares-Bresolin, A.P.; Llauro, C.; Panaud, O.; et al. Abiotic Stress and Genome Dynamics: Specific Genes and Transposable Elements Response to Iron Excess in Rice. Rice 2015, 8, 13. [Google Scholar] [CrossRef]
- Cornejo, M.J.; Luth, D.; Blankenship, K.M.; Anderson, O.D.; Blechl, A.E. Activity of a Maize Ubiquitin Promoter in Transgenic Rice. Plant Mol. Biol. 1993, 23, 567–581. [Google Scholar] [CrossRef]
- Garbarino, J.E.; Oosumi, T.; Belknap, W.R. Isolation of a Polyubiquitin Promoter and Its Expression in Transgenic Potato Plants. Plant Physiol. 1995, 109, 1371–1378. [Google Scholar] [CrossRef]
- Chakravarthi, M.; Philip, A.; Subramonian, N. Truncated Ubiquitin 5′ Regulatory Region from Erianthus Arundinaceus Drives Enhanced Transgene Expression in Heterologous Systems. Mol. Biotechnol. 2015, 57, 820–835. [Google Scholar] [CrossRef]
- Giri, J.; Dansana, P.K.; Kothari, K.S.; Sharma, G.; Vij, S.; Tyagi, A.K. SAPs as Novel Regulators of Abiotic Stress Response in Plants. BioEssays News Rev. Mol. Cell. Dev. Biol. 2013, 35, 639–648. [Google Scholar] [CrossRef]
- Kumar, K.; Kumar, M.; Kim, S.-R.; Ryu, H.; Cho, Y.-G. Insights into Genomics of Salt Stress Response in Rice. Rice 2013, 6, 27. [Google Scholar] [CrossRef]
- Jongdee, B.; Fukai, S.; Cooper, M. Leaf Water Potential and Osmotic Adjustment as Physiological Traits to Improve Drought Tolerance in Rice. Field Crops Res. 2002, 76, 153–163. [Google Scholar] [CrossRef]
- Webb, L.; Casula, A.; Ravanan, R.; Caskey, F. Chapter 3: Demographic and Biochemistry Profile of Kidney Transplant Recipients in the UK in 2009: National and Centre-Specific Analyses. Nephron Clin. Pract. 2011, 119, c53–c84. [Google Scholar] [CrossRef]
- Hsiao, T.C.; Otoole, J.C.; Yambao, E.B.; Turner, N.C. Influence of Osmotic Adjustment. Plant Physiol. 1984, 75, 338–341. [Google Scholar] [CrossRef]
- Fukai, S.; Cooper, M. Development of Drought-Resistant Cultivars Using Physiomorphological Traits in Rice. Field Crops Res. 1995, 40, 67–86. [Google Scholar] [CrossRef]
- Kamoshita, A.; Rodriguez, R.; Yamauchi, A.; Wade, L.J. Genotypic Variation in Response of Rainfed Lowland Rice to Prolonged Drought and Rewatering. Plant Prod. Sci. 2004, 7, 406–420. [Google Scholar] [CrossRef]
- Saxena, N.P.; O’Toole, J.C. (Eds.) 2002 Field Screening for Drought Tolerance in Crop Plants with Emphasis on Rice. In Proceedings of the International Workshop on Field Screening for Drought Tolerance in Rice, ICRISAT, Patancheru, India, 11–14 December 2000. [Google Scholar]
- Parvanova, D.; Ivanov, S.; Konstantinova, T.; Karanov, E.; Atanassov, A.; Tsvetkov, T.; Alexieva, V.; Djilianov, D. Transgenic Tobacco Plants Accumulating Osmolytes Show Reduced Oxidative Damage under Freezing Stress. Plant Physiol. Biochem. 2004, 42, 57–63. [Google Scholar] [CrossRef]
- Lam, E.; Del Pozo, O.; Pontier, D. BAXing in the Hypersensitive Response. Trends Plant Sci. 1999, 4, 419–421. [Google Scholar] [CrossRef]
- Agarwal, P.; Parida, S.K.; Mahto, A.; Das, S.; Mathew, I.E.; Malik, N.; Tyagi, A.K. Expanding Frontiers in Plant Transcriptomics in Aid of Functional Genomics and Molecular Breeding. Biotechnol. J. 2014, 9, 1480–1492. [Google Scholar] [CrossRef]
- Agarwal, P.; Arora, R.; Ray, S.; Singh, A.K.; Singh, V.P.; Takatsuji, H.; Kapoor, S.; Tyagi, A.K. Genome-Wide Identification of C2H2 Zinc-Finger Gene Family in Rice and Their Phylogeny and Expression Analysis. Plant Mol. Biol. 2007, 65, 467–485. [Google Scholar] [CrossRef]
- Kumari, A.; Dogra, V.; Joshi, R.; Kumar, S. Stress-Responsive Cis-Regulatory Elements Underline Podophyllotoxin Biosynthesis and Better Performance of Sinopodophyllum Hexandrum Under Water Deficit Conditions. Front. Plant Sci. 2022, 12, 751846. [Google Scholar] [CrossRef]
- Yokotani, N.; Sato, Y.; Tanabe, S.; Chujo, T.; Shimizu, T.; Okada, K.; Yamane, H.; Shimono, M.; Sugano, S.; Takatsuji, H.; et al. WRKY76 Is a Rice Transcriptional Repressor Playing Opposite Roles in Blast Disease Resistance and Cold Stress Tolerance. J. Exp. Bot. 2013, 64, 5085–5097. [Google Scholar] [CrossRef]
- Ding, X.; Li, X.; Xiong, L. Insight into Differential Responses of Upland and Paddy Rice to Drought Stress by Comparative Expression Profiling Analysis. Int. J. Mol. Sci. 2013, 14, 5214–5238. [Google Scholar] [CrossRef]
- Wu, Y.; Wang, Q.; Ma, Y.; Chu, C. Isolation and Expression Analysis of Salt Up-Regulated ESTs in Upland Rice Using PCR-Based Subtractive Suppression Hybridization Method. Plant Sci. 2005, 168, 847–853. [Google Scholar] [CrossRef]
- Sasikumar, A.N.; Perez, W.B.; Kinzy, T.G. The Many Roles of the Eukaryotic Elongation Factor 1 Complex. Wiley Interdiscip. Rev. RNA 2012, 3, 543–555. [Google Scholar] [CrossRef]
- Dunn, M.A.; Morris, A.; Jack, P.L.; Hughes, M.A. A Low-Temperature-Responsive Translation Elongation Factor 1 Alpha from Barley (Hordeum vulgare L.). Plant Mol. Biol. 1993, 23, 221–225. [Google Scholar] [CrossRef] [PubMed]
- Morelli, J.K.; Shewmaker, C.K.; Vayda, M.E. Biphasic Stimulation of Translational Activity Correlates with Induction of Translation Elongation Factor 1 Subunit [Alpha] upon Wounding in Potato Tubers. Plant Physiol. 1994, 106, 897–903. [Google Scholar] [CrossRef] [PubMed]
- Li, Z.Y.; Chen, S.Y. Inducible Expression of Translation Elongation Factor 1A Gene in Rice Seedlings in Response to Environmental Stresses. Acta Bot. Sin. 1999, 41, 800–806. [Google Scholar]
- Kawasaki, S.; Borchert, C.; Deyholos, M.; Wang, H.; Brazille, S.; Kawai, K.; Galbraith, D.; Bohnert, H.J. Gene Expression Profiles during the Initial Phase of Salt Stress in Rice. Plant Cell 2001, 13, 889–905. [Google Scholar] [CrossRef] [PubMed]
- Rao, P.S.; Mishra, B.; Gupta, S.R. Effects of Soil Salinity and Alkalinity on Grain Quality of Tolerant, Semi-Tolerant and Sensitive Rice Genotypes. Rice Sci. 2013, 20, 284–291. [Google Scholar] [CrossRef]
- Garg, R.; Narayana Chevala, V.; Shankar, R.; Jain, M. Divergent DNA Methylation Patterns Associated with Gene Expression in Rice Cultivars with Contrasting Drought and Salinity Stress Response. Sci. Rep. 2015, 5, 14922. [Google Scholar] [CrossRef]
- Gao, Y.; Ma, J.; Zheng, J.C.; Chen, J.; Chen, M.; Zhou, Y.B.; Fu, J.D.; Xu, Z.S.; Ma, Y.Z. The Elongation Factor GmEF4 Is Involved in the Response to Drought and Salt Tolerance in Soybean. Int. J. Mol. Sci. 2019, 20, 3001. [Google Scholar] [CrossRef]
- Talapatra, S.; Wagner, J.D.O.; Thompson, C.B. Elongation Factor-1 Alpha Is a Selective Regulator of Growth Factor Withdrawal and ER Stress-Induced Apoptosis. Cell Death Differ. 2002, 9, 856–861. [Google Scholar] [CrossRef]
- Griffiths, C.A.; Gaff, D.F.; Neale, A.D. Drying without Senescence in Resurrection Plants. Front. Plant Sci. 2014, 5, 36. [Google Scholar] [CrossRef]
- Raman, A.; Verulkar, S.; Mandal, N.; Variar, M.; Shukla, V.; Dwivedi, J.; Singh, B.; Singh, O.; Swain, P.; Mall, A.; et al. Drought Yield Index to Select High Yielding Rice Lines under Different Drought Stress Severities. Rice 2012, 5, 31. [Google Scholar] [CrossRef]
- GSL Biotech; SnapGene Software. Available online: Snapgene.com (accessed on 1 November 2015).
- Hoekema, A.; Hirsch, P.; Hooykaas, P.; Schilperoort, R. A binary plant vector strategy based on separation of vir- and T-region of the Agrobacterium tumefaciens Ti-plasmid. Nature 1983, 303, 179–180. [Google Scholar] [CrossRef]
- Morgulis, A.; Coulouris, G.; Raytselis, Y.; Madden, T.L.; Agarwala, R.; Schäffer, A.A. Database Indexing for Production MegaBLAST Searches. Bioinformatics 2008, 24, 1757–1764. [Google Scholar] [CrossRef]
- Zhang, Z.; Schwartz, S.; Wagner, L.; Miller, W. A greedy algorithm for aligning DNA sequences. J. Comput. Biol. 2000, 7, 203–214. [Google Scholar] [CrossRef]


Publisher’s Note: MDPI stays neutral with regard to jurisdictional claims in published maps and institutional affiliations. |
© 2022 by the authors. Licensee MDPI, Basel, Switzerland. This article is an open access article distributed under the terms and conditions of the Creative Commons Attribution (CC BY) license (https://creativecommons.org/licenses/by/4.0/).