Abstract
This study aims to develop a multi-objective second-generation-based socially responsible supply chain (SGB-SRSC) network design model that considers all dimensions of sustainability: economy, environment, and social. The dynamic nature of the biodiesel supply chain (SC) impairs the SGB-SRSC model decisions; thus, a grey-fuzzy solution approach is developed. Biodiesel is a promising renewable energy resource produced from a variety of easily accessible domestic wastes. For a swift transition towards commercially feasible biodiesel production, integrated optimization of the biodiesel SC system is critical. Using the latest social impact assessment tools, this study provides a decision-support system for developing a biodiesel SC network. A comprehensive computational analysis is performed on a case study to validate the proposed model. The results show that significant investment is required to achieve social well-being goals and secure decisions against uncertainty associated with SGB-SRSC model parameters. Further, it is observed that the expenses of biodiesel production and biodiesel plant installation accounted for a large portion of the overall SC cost. As a result, finding more cost-effective biodiesel production methods is critical to the industry’s economic viability. Regulators and policymakers involved in biodiesel production projects may find the framework useful in obtaining a compromise solution for socio-economic goals based on their preferences.
1. Introduction
There is a global rise in energy demand due to advancements in technology, massive industrialization, and an increasing population rate [1]. As a vital energy resource, fossil fuels provide energy to meet the exponentially increasing energy need of the world. Conventional resources such as methane, petroleum products, and coal are all nonrenewable. Additionally, decreasing environmental health, increased import costs, and an exponential rise in energy prices have further highlighted the importance of exploring alternative sources [2]. Biomass obtained from energy crops, domestic wastes, and agricultural leftovers has enormous potential to replace conventional fuels [3]. Biodiesel can be produced from biomass and then used as an energy source. Biodiesel is a sustainable and environment-friendly energy source with several distinguishing properties like greater efficiency, lower sulfur content, and enhanced lubricant properties [4].
The production of biodiesel from first-generation feedstock is not appreciable as it offers a threat to food security [5]. Among the indigenous low-cost and high-energy potential second-generation biomasses that are cheaper and easily accessible are animal fat, waste cooking oil, and agricultural residues. Because these wastes are byproducts of primary goods, their availability cannot be forecasted with certainty. Additionally, the availability of these biomass resources can be insufficient to meet the demand for biodiesel. In that case, additional biomass sources must be available. In this aspect, several second-generation plants and seeds can be grown to fulfill the demand. Mirhashemi et al. [6] work suggests that moringa oleifera is a potential resource for biodiesel production. It can grow on marginal lands, and its seeds contain sufficient oil. Apart from this, industrial hemp is another biomass-rich plant with many desirable features, including high yield, drought tolerance, growth in polluted soil, rapid growth, and no pesticide need [7].
Besides using cheap feedstock and processing technology, an efficiently designed biodiesel supply chain (BSC) is vital while making it commercially feasible. An efficiently designed supply chain provides optimal strategic and tactical-level decisions. This persuades policymakers to design supply chain optimization models targeting low production costs [8]. However, in the past, the detrimental effects of commercialization on society have compelled all sectors to include social sustainability in their planning processes. Therefore, the social aspect of supply chain operations must be ingrained at all levels. The primary difficulty here is to achieve a trade-off among economic, environmental, and social dimensions since all are inherently contradictory. Moreover, a high degree of uncertainty is also involved due to the biodiesel-based supply chain’s dynamic and complex business nature [8]. Therefore, it is essential to design an integrated decision-making system that assists policymakers in efficiently balancing economic and social goals. In this regard, there is currently no research that offers a decision-support tool that enables decision-makers to achieve a trade-off between economic, environmental, and social dimensions in a multiple feedstock-based biodiesel production-distribution system in an uncertain environment. To fill the gap, this study presents a second-generation biomass-based socially responsible supply chain (SGB-SRSC) model for developing a sustainable biodiesel production distribution network in an uncertain environment using a triple bottom line (TBL) framework.
In light of the above discussion, this research will provide adequate answers to the following key questions:
- What is the most effective approach to designing an efficient BSC network that can secure model decisions against an uncertain environment and provide robust results?
- How can the social dimension of sustainability be quantified in a biodiesel supply chain?
- How can a trade-off among the economic, environmental, and social dimensions of sustainability be achieved based on managers’ priorities?
This paper consists of six sections. The remaining part of this research work is categorized as follows: Section 2 provides an extensive review of the second generation-based feedstock supply chain study. Section 3 proposes a mathematical model. In Section 4, the solution methodology is presented. In Section 5, the suggested model and solution technique are validated through the computational analysis of a case study. Finally, in Section 6, conclusions, research findings, and future research directions are presented.
2. Literature Review
Technological advancement leads to a rapid rise in energy demand, resulting in the depletion of fossil fuels and enormous environmental pollution [9]. Therefore, sustainable and secure energy is the need of the hour for the socio-economic progress of the country. The following section of the article discusses recent research on biodiesel production using various types of biomass.
The majority of the literature currently on biodiesel production is either focused on the economic aspect or maximizes the chemical processing effectiveness of various feedstock, including animal fat, cocking oils, and agricultural waste, using various biodiesel production techniques. In this context, Alptekin et al. [10] examined the optimization of the pre-treatment process with various acid catalysts to minimize the free fatty acid content of chicken fat. Cunha et al. [11] suggested that animal fats are excellent low-cost feedstocks for biodiesel synthesis, which helps the environmental problem of waste and lowers the cost of biodiesel production. Srinivasan et al. [12] focused on producing biodiesel from waste animal fats using methanol-based transesterification with nanoparticles acting as a heterogeneous catalyst. Biomass residues originating from energy crops, specially grown seeds, and forest timber are also substantial for deriving energy [13]. In this domain, Abraham et al. [14] suggested that agricultural residue conversion is critical for sustainable development and that rice straw offers a viable feed source for the generation of bioethanol. Ahmad Dar et al. [15] primarily evaluated the technology for sweet sorghum bioethanol production, focusing on its potential benefits as a feedstock for ethanol production. Researchers have also encouraged using waste cocking oil as a sustainable energy resource to produce biodiesel. In this aspect, Rajak et al. [16] aimed to reduce emissions parameters such as NOX, smoke, particulate matter (PM), and summary of emissions (SE) from five distinct categories, including edible and non-edible vegetable oils, waste animal fats, waste oil, and alcohol biodiesel. Moretti et al. [17] measured the environmental effect of polypropylene on used cooking oil using a cradle-to-factory gate life-cycle assessment (LCA). Mohammadshirazi et al. [18] conducted energy and economic assessments of biodiesel synthesis from waste cooking oil (WCO) using the traditional transesterification process.
Several investigations have employed mathematical modeling-based approaches. MILP, one of the mathematical modeling tools, has been frequently utilized to construct biofuel supply networks due to its efficient solving capabilities. In this aspect, Akgul et al. [19] suggested a multi-objective, static modeling approach for optimizing hybrid first/second-generation biofuel supply chains. Various aspects were examined using the proposed modeling framework, including potential greenhouse gas (GHG) savings, and the impact of a carbon tax on the economic and environmental performance of a biofuel supply chain. An et al. [20] provided a multi-period deterministic lignocellulosic-based supply chain (SC) model for biofuel production by taking into account strategic and tactical decisions. Bambara et al. [21] compared the supply cost and network configuration of farmed and wild energy crops in this area. The optimum results were identified using a deterministic mixed-integer linear programming model to aid decision-making about biomass supply chains for biofuel production. Although MILP-based modeling approaches delivered global optimal solutions, the decision-making reliability at the strategic and tactical levels is rather low. Furthermore, because the biofuel-based supply chain is dynamic and complicated, obtaining reliable decisions is necessary.
Fuzzy-based techniques have historically been employed to cope with such uncertain environments, allowing decision makers to obtain reliable results (for details please see [22,23]). Therefore, multiple authors have merged the fuzzy approach with MILP to deal with an uncertain environment of biofuels SC. In this perspective, Ghaderi et al. [5] proposed a multi-objective fuzzy possibilistic programming (FPP) model for designing a sustainable switchgrass-based bioethanol supply chain network under epistemic uncertainty of input data while taking competing economic, environmental, and social goals into account. Mirhashemi et al.’s [6] study provides an optimization model for constructing an efficient moringa oleifera-based biomass to biodiesel supply chain to expedite the commercialization of biodiesel. Habib et al. [8] proposed a mathematical model formulation and modified fuzzy robust possibilistic chance-constrained programming solution approach for biodiesel SC using animal fat while incorporating the economy, society, and environment as model objectives.
In addition to the FPP technique, many researchers have enhanced fuzzy approaches by merging them with various solution methodologies to improve decision quality. For example, Babazadeh et al. [9] suggested a bi-objective FPP model to design a biodiesel SC using jatropha and cocking oil as feedstock. A hybrid solution strategy based on flexible lexicographic and augmented-constraint approaches is used to obtain solutions. Habib et al. [24] developed an animal fat-based SC model using MILP. Researchers used the p-robustness measure to deal with disruption uncertainty and fuzzy-based flexible robust programming to deal with the operational risk of the considered SC. Ahmed et al. [25] suggested a second-generation biofuel SC model that minimizes the total cost of a biofuel supply chain by considering demand and supply uncertain. The authors also employed the FPP approach to deal with uncertain parameters of the model. Further, Ahmed et al. [26] extended the previous SC model by considering a sustainability approach that minimizes total carbon emissions and total cost while increasing job opportunities in a second-generation biofuel. The proposed model was solved using a fuzzy lexicographic optimization approach. Babazadeh [27] used jatropha and UCO to produce biodiesel. To design the biodiesel SC, authors suggested a novel formulation of FPP, which is based on the mean and absolute deviation of fuzzy parameters of the mathematical model. Mousavi et al. [28] developed a lignocellulosic-based biofuel SC model and enhanced the effectiveness of SC decisions by merging the FPP techniques with robust possibilistic programming (RPP). A thorough examination of the research in the domain of BSC reveals that the potential of grey theory in conjunction with fuzzy theory has not been fully realized. Although the grey theory has been used in a variety of applications, including production planning [29,30,31], supply chain [32,33,34,35], engineering applications [36,37], and agriculture [38,39,40,41], its potential in the biofuel supply chain remains unexplored. Table 1 summarizes the literature review done in the respective research field.

Table 1.
An overview of research on biofuel supply chains.
Research Gap Analysis
The previously discussed studies for waste to biodiesel production primarily focus on enhancing chemical processing and engine combustion efficiency. While the socio-economic planning aspect, which is critical to the viability of biodiesel production, is completely overlooked. This study provides a socio-economic framework for decision-making during biodiesel production using wastes and wild plants to fill the gaps. Hence, the supply chain under consideration is defined as the process to design, implement and control the socially, environmentally, and economically efficient flow of biodiesel production to fulfill consumer demand. Based on the mentioned gap, the following are the practical and theoretical contributions of this research:
- (a).
- Practical perspective: From a practical viewpoint, this research provides an optimization model for multiple feedstock-based biodiesel production-distribution systems, which aids policymakers in making strategic and tactical-level decisions to achieve a trade-off among social, environmental, and economic aspects. The strategic-level decision-making process includes determining the closest biomass supply sites and appropriate quantity and capacity of production facilities, raw biomass extraction centers, pre-processing plants, biorefineries, and glycerin distribution stations. At the tactical level, decisions include the flow of material between network connections, the amount of biodiesel and glycerin produced, and the optimal number of inventory reservoirs.
- (b).
- Theoretical perspective: To analyze the social impacts of biodiesel SC configurations, this study employs the recently established “guidelines for social life cycle assessment of products” (GSLCAP) theory for social impact analysis, which considers unemployment, job prospects, regional development, and economic uplift in marginalized areas. None of the research has employed this approach to quantify the social effect while designing a socially responsible SC during second-generation biodiesel production.
3. Mathematical Modeling
3.1. Problem Description of SGB-SRSC
To answer the research question, this study proposes a second-generation feedstock-based supply chain network design model that incorporates all stages while considering social, environmental, and economic factors. Five installed tiers comprise this supply chain network: (i) biomass supply terminals, (ii) biomass cultivation locations, (iii) pre-processing plants, (iv) biorefineries, and (v) demand markets.
The proposed biomass sources, including waste animal fat, agricultural crop residue, and used cooking oil, are delivered to feedstock supply terminals and transported to pre-processing plants. Pre-processing plants convert received feedstock sources into crude oil. The crude oil is transported to biorefineries, which produce biodiesel and glycerin as a byproduct of the transesterification reaction. Finally, biodiesel and glycerin produced at the biorefineries are distributed to the biodiesel and glycerin demand markets to meet market demand. The proposed framework for the SGB-SRSC model is provided in Figure 1. The notation used in the SGB-SRSC model are provided in Appendix A.
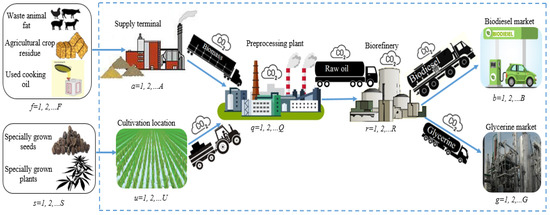
Figure 1.
Proposed framework for second-generation biomass-based SGB-SRSC model.
3.2. Assumptions for the SGB-SRSC Model
- A homogenous fleet of automobiles is available at each terminal of SGB-SRSC model.
- Waste animal fat, agricultural crop residue, and used cooking oil are assumed to be supplied by suppliers at the source terminal, and specially grown seeds and specially grown plants are cultivated at cultivation locations, which are not fertile.
- A two-year planning horizon is assessed. A scenario-based supply chain is formulated to cater to uncertain biodiesel demand.
- As per the market consumption of biodiesel, in each planning sector, the demand for blended B10 (biodiesel 10%, diesel 90%) type is considered.
- As per regional government policy, a carbon emission tax is implemented to all contribute to the biodiesel supply chain.
3.2.1. Objectives functions of the SGB-SRSC Model
- (a).
- The objective function of supply chain cost
The supply chain cost for second-generation feedstock-based biodiesel:
The installation cost for biodiesel supply chain processing facilities:
Second-generation feedstock purchasing cost and specially grown plants cultivation cost:
Handling cost of feedstock:
Inventory holding costs at different facilities of the biodiesel supply chain:
Raw oil, biodiesel, and glycerin production cost at the pre-processing and biorefinery terminals:
Transportation cost:
- (b).
- Objective function of social impact
The social component is critical to the management and implementation of any supply chain. Although quantifying social impact is challenging due to the complexity of the issues and the involvement of multiple stakeholders. Numerous researchers (SAI [46], ISO [47], ETI [48], FLA [49], and Benoît et al. [50]) have proposed a variety of guidelines and strategies for quantifying the social impact of associated activities. Among the methodologies examined, we choose the “guidelines for social life cycle assessment of products” proposed by Benoît et al. [50] for evaluating the social impact in the aforementioned scenario. In comparison to other approaches, GSLCAP has the following advantages: (i) GSLCAP adopts a product-oriented approach instead of an organization oriented; (ii) this strategy adequately addresses social issues while omitting environmental and organizational concerns; (iii) this is a relatively new framework, and it has profited from recent breakthroughs in the field of social impact assessment and recommended by several researchers. The GSLCAP defines five stakeholders: the regional/local community, society, customers, workers (employees), and value chain stakeholders. In the proposed SGB-SRSC model, regional/local community and society are directly associated with the decisions. Therefore, indicators for the two stakeholders mentioned previously are considered. Regional economic development is directly related to the scenario-based biodiesel supply chain model decisions made by society stakeholders. The primary objective is to achieve balanced economic and regional development. Societal stakeholders prefer the establishment of biodiesel supply chain processing facilities in underdeveloped areas in order to achieve a balanced approach to economic prosperity in all relevant fields. The purpose of this study is to promote economic and regional development in all sectors through a mutually beneficial approach. The following is the economic development indicator developed for this purpose.
Economic development indicator:
Regional employment is integrally linked to scenario-based supply chain model decisions made by local community stakeholders. The employment rate in a particular region is determined by the location and capacity of installed biodiesel supply chain processing facilities. As a result, it is critical to address unemployment issues and create job opportunities in marginalized communities. The following is the job opportunity indicator developed for this purpose.
Employment opportunity indicator:
To compute the total social impact associated with the design of the SGB-SRSC model network, the values of EDI and EOI should be normalized. Both indicators are weighted equally. Equations (10)–(14) detail the procedure for normalizing economic development and employment opportunity indicators.
Biodiesel supply chain total social responsibility:
3.2.2. Constraints Formulation
Constraint (15) ensures that the quantity of animal fat, agricultural crop residue, and used cooking oil transported to the pre-processing plant during each planning period should be less than the available amount at feedstock supply terminals.
Constraint (16) shows the amount of specially grown seeds and plants produced in each cultivated area.
Constraint (17) enforces that, during each planning period t, the amount of specially produced seeds and plants sent to the pre-processing facilities should be less than the amount available at candidate cultivation locations.
Constraints (18) and (19) specify the total amount of raw oil produced in a given time at the respective pre-processing centers. When waste animal fat, agricultural crop residue, used cooking oil, cultivated seeds, and specially grown plants are processed into raw oil, the amount of biomass is reduced by a conversion factor.
According to Constraints (20) and (21), the entire amount of raw oil supplied from each pre-processing plant to biorefineries must be smaller than the total amount of raw oil produced.
Constraints (22)–(25) show the total quantity of biodiesel and glycerin produced by biorefineries in a certain period. When biodiesel and glycerin are produced, the yield factor reduces the amount of raw oil.
Constraints (26) and (27) show the total amount of biodiesel and glycerin produced from both types of feedstocks, respectively.
Constraints (28) and (29) show the upper and lower limit for a selected location of specially grown seeds and plants, respectively.
Constraints (30)–(33) depict the inventory levels of preprocessed raw oil for each type of biomass over a specified period.
Equations (34)–(37) are the inventory balance constraints for biodiesel and glycerin produced at biorefineries.
According to Constraints (38) and (39), the amount of biodiesel and glycerin delivered from a biorefinery must be less than the total amount of biodiesel and glycerin produced.
Constraints (40) and (41) ensure that the biodiesel and glycerin market demands are met in a given period for each demand market.
Equations (42) and (43) ensure that for each functioning pre-processing plant and biorefinery, a maximum single capacity level is selected.
Equation (44) represents the capacity constraints for pre-processing plants.
Equation (45) is the processing capacity constraint for biorefineries.
Equations (46)–(49) restrict the upper limit of different established operational processing facilities considering the budget limitations.
Constraints (50) and (51) enforce the requirement that all variables used for decision-making evaluated in the proposed mathematical model must be positive.
All decision variables ≧ 0
4. Solution Methodology
4.1. Grey-Fuzzy Solution Methodology
Why is the grey-fuzzy solution methodology the most suitable for the SGB-SRSC model?
There is a great degree of volatility in biofuel demand, feedstock availability, and biofuel pricing in the business environment of BSC [5]. Values of these parameters cannot be accurately determined due to a lack of historical data. In this context, the provided solution methodology outperforms other techniques in the following ways:
- Grey system theory is best suited for scenarios with “limited sample size and poor information”. Historical data are required for the stochastic approach to correctly estimate the probability distribution, whereas fuzzy theory also requires some data to decide the possibility distribution of an uncertain parameter. Grey theory, on the other hand, seeks realistic patterns through information coverage and only requires two extreme possible points for uncertain parameters [51].
- This study utilizes grey theory to address the problem of incomplete information related to model input parameters in the first section and then incorporates fuzzy theory to determine the trade-off values of the SGB-SRSC model objective through the creation of fuzzy membership functions.
The suggested grey multi-objective model used grey parameters to represent partial or imprecise data. After the grey parameters are whitened, the grey multi-objective model is transformed into a crisp model in the first phase. By solving each objective separately, pay-off values are obtained. Cognitive uncertainty exists in multi-objective optimization problems. Hence, grey model objectives are assigned membership functions according to the solution methodology proposed by the fuzzy mathematical framework. In the second phase, the problem of multi-objective issues is solved using the TH methodology, a modified version of Werner’s method [52,53]. Following are the steps for the proposed solution methodology.
4.1.1. Step I—Conversion of a Grey Model to Its Crisp Equivalent Form
Whitenization weight (β) is used to transform a grey mathematical model into its crisp equivalent following Equation (53). The value β lies within the 0 and 1 ranges.
- (a).
- Whitenization of cost objective parameters:
Whitenization of the installation cost for biodiesel supply chain processing facilities:
Whitenization of second-generation feedstock purchasing cost and specially grown plants cultivation cost:
Whitenization of handling cost of feedstock:
Whitenization of inventory holding costs at different facilities of the biodiesel supply chain:
Whitenization of raw oil, biodiesel, and glycerin production cost at the pre-processing and biorefinery terminal:
Whitenization of transportation cost:
- (b).
- Whitenization of social parameters
Whitenization of economic development indicator
Whitenization of employment opportunity indicator:
- (c).
- Whitenization of uncertain constraints:
4.1.2. Step-II—Obtaining Pay-Off Values
Solving an equivalent model for each objective function under the given constraints yields a pay-off value. There will be a positive beneficial solution (PBS) and a negative beneficial solution (NBS) for each model’s objective [54,55].
4.1.3. Step-III—Developing Fuzzy Membership
The following stage involves developing fuzzy membership functions for each objective of the SGB-SRSC model:
where and represent the satisfaction degree of economics aspect and social aspect, respectively.
4.1.4. Step-IV—Solving Multi-Objective Model Using the TH Method
The subsequent stage of the proposed solution methodology is to convert a multi-objective optimization model to a single objective. The TH method is used to convert the multi-objective model into a single objective. Equations (68)–(71) provide the single objective formulation for the proposed optimization model.
Such that
System constraints (17)–(39) and (42)–(65).
Where θ and are the values for the coefficient of compensation and minimum satisfaction level used, respectively, whereas are the SGB-SRSC model objectives preferences.
5. Implementation and Evaluation
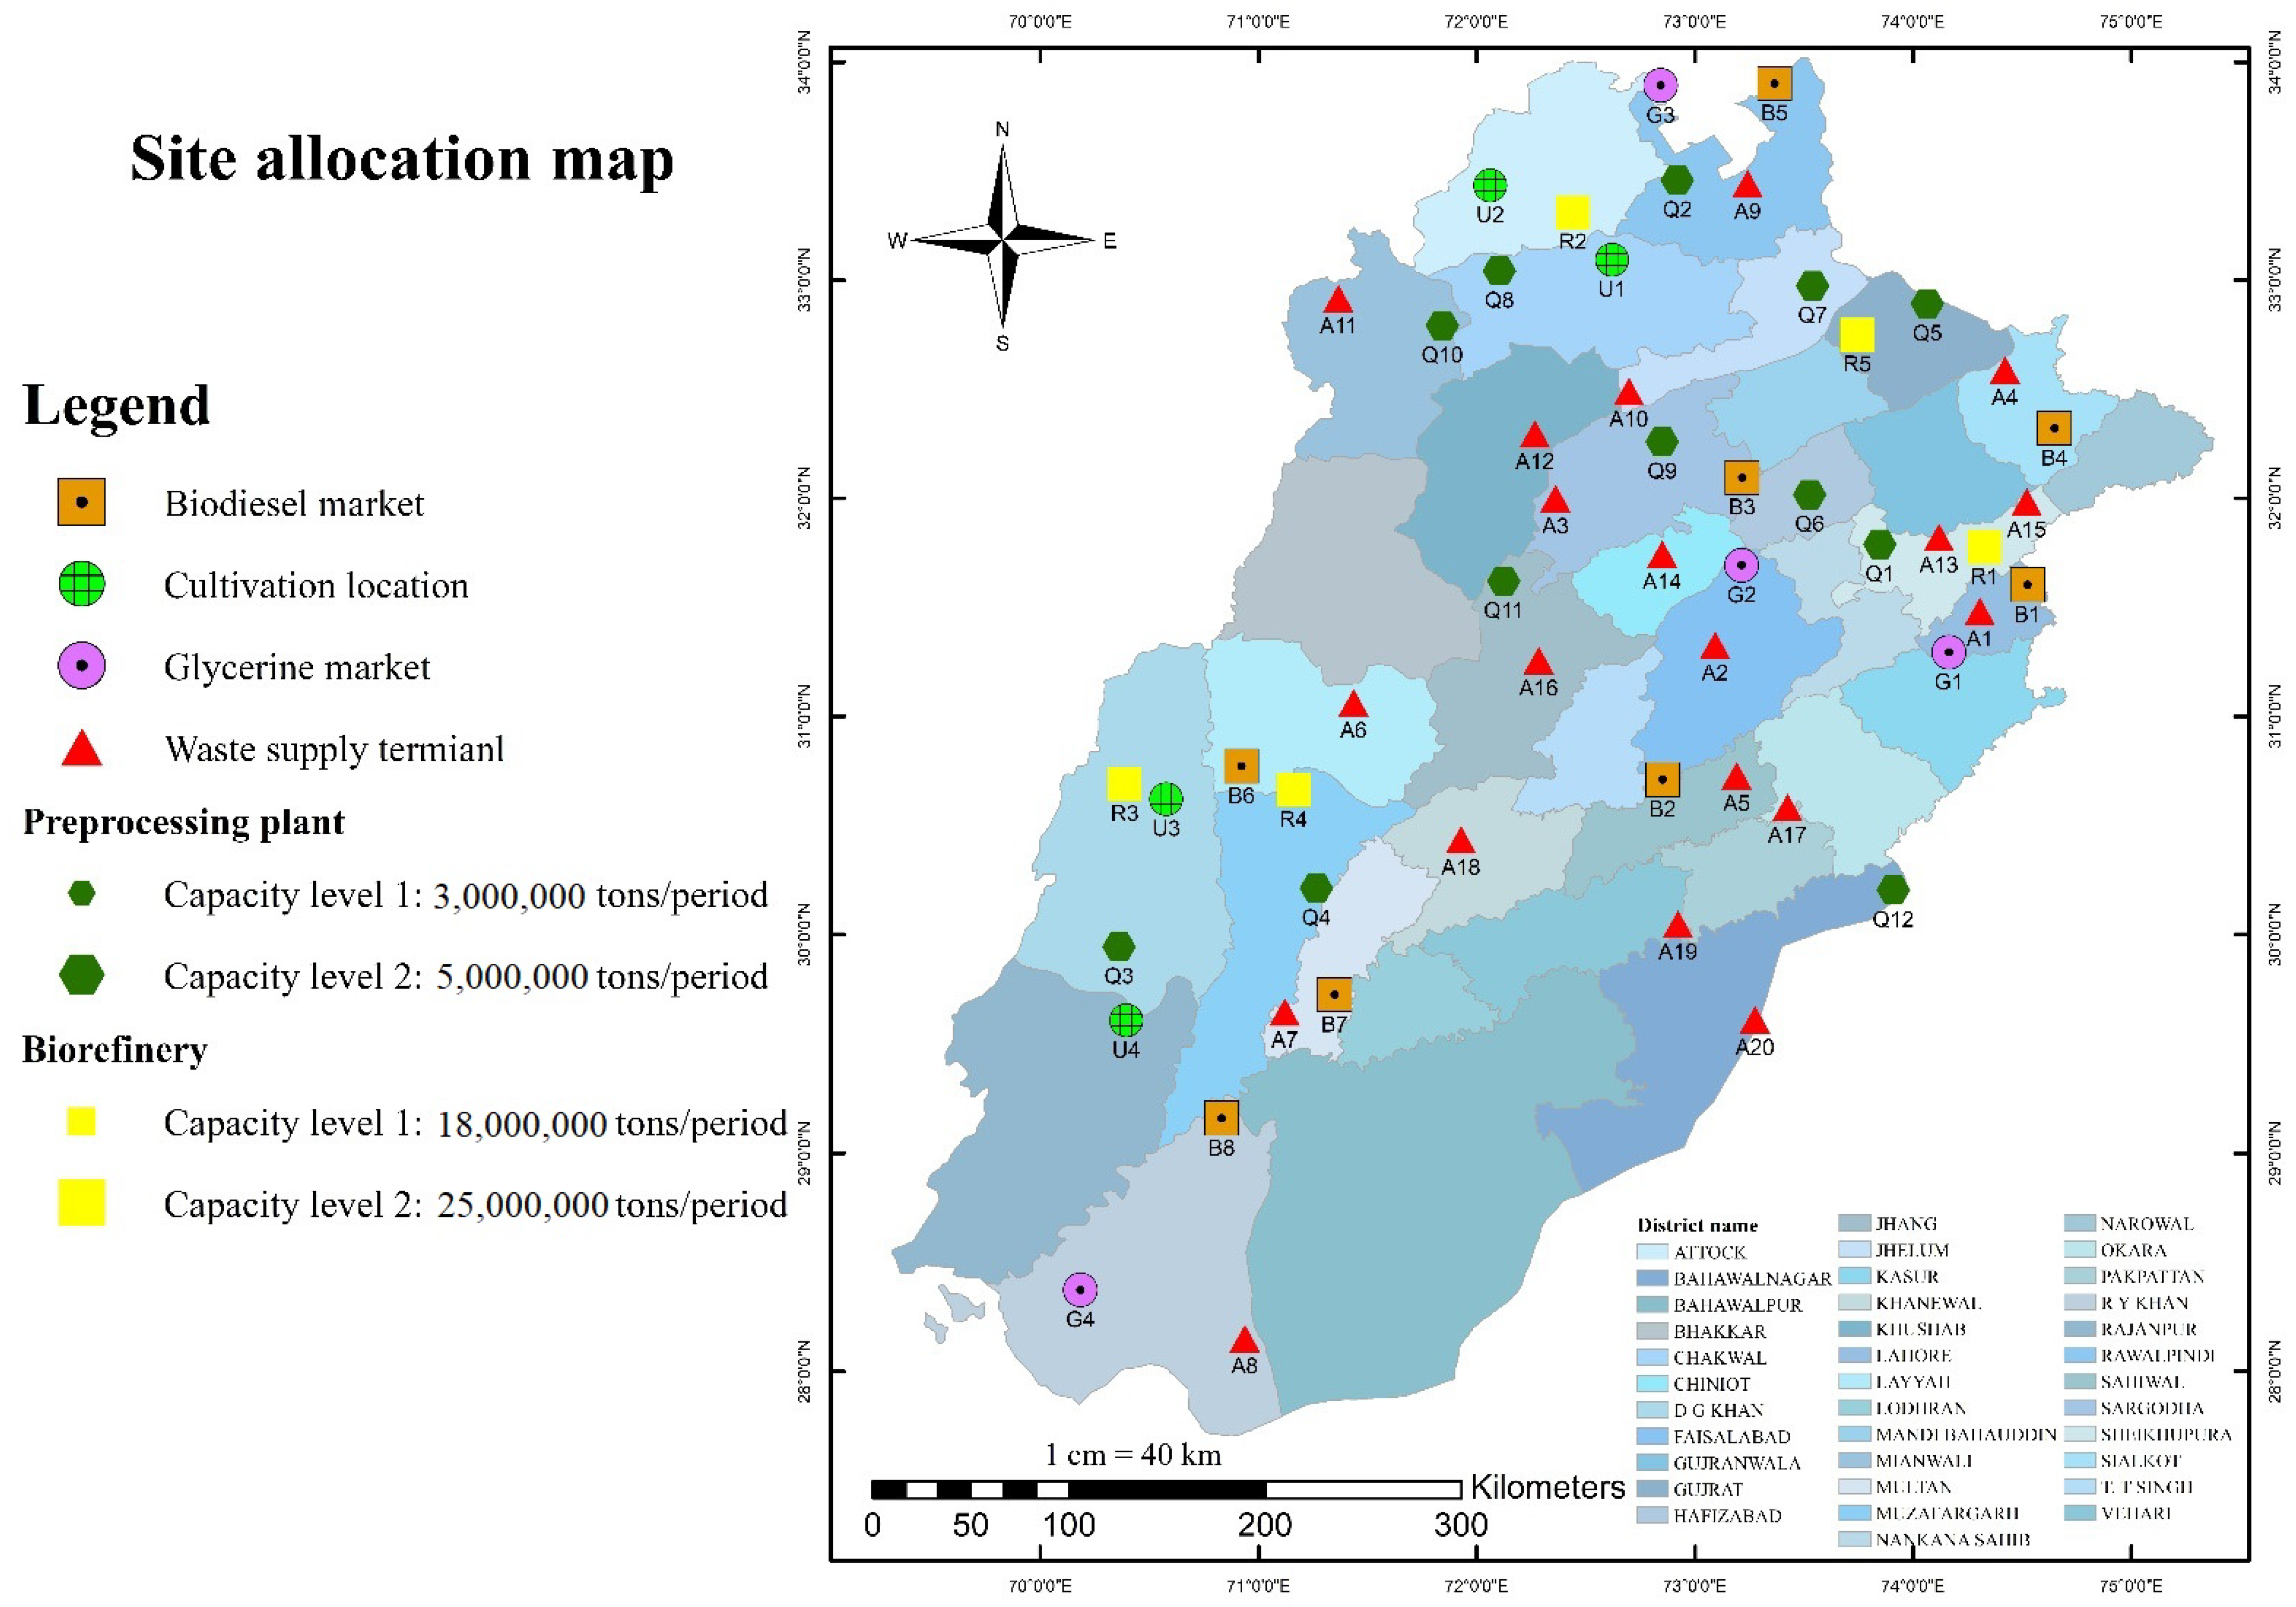
In this section, a scenario-based case is presented to evaluate the performance of the proposed model and solution approach. Presently, Pakistan is dependent on conventional energy sources to fulfill its energy demands. However, a variety of second-generation domestic feedstocks can be used to produce biodiesel, significantly reducing its reliance on conventional sources. In this case, two types of indigenous second-generation energy resources are used. The first category includes a variety of waste, such as animal fat, agricultural crop residues, and used cooking oil. The second type consists of two second-generation specially cultivated plants, moringa oleifera and industrial hemp, which are best suited for arable and marginalized areas and require little maintenance and effort. The Punjab province focuses on the case investigation for which 20 biomass supply terminals, 12 biomass pre-processing plant potential locations, 5 biorefinery potential locations, 8 biodiesel demand markets, and 4 glycerin demand markets are considered. The following categories of capacities are considered in the SC: 3 and 5 million gallons for biomass pre-processing plants, and 18 and 25 million gallons for biorefineries. It is worth noting that, while deciding the prospective facility locations and their associated capacity levels, all industrial, environmental, and regional rules are followed. Data used for computational analysis are provided in the Supplementary Materials. Figure 2 depicts all the prospective locations of biodiesel production facilities in the proposed supply chain model.

Figure 2.
Prospective locations of biodiesel production facilities.
5.1. Results and Discussions
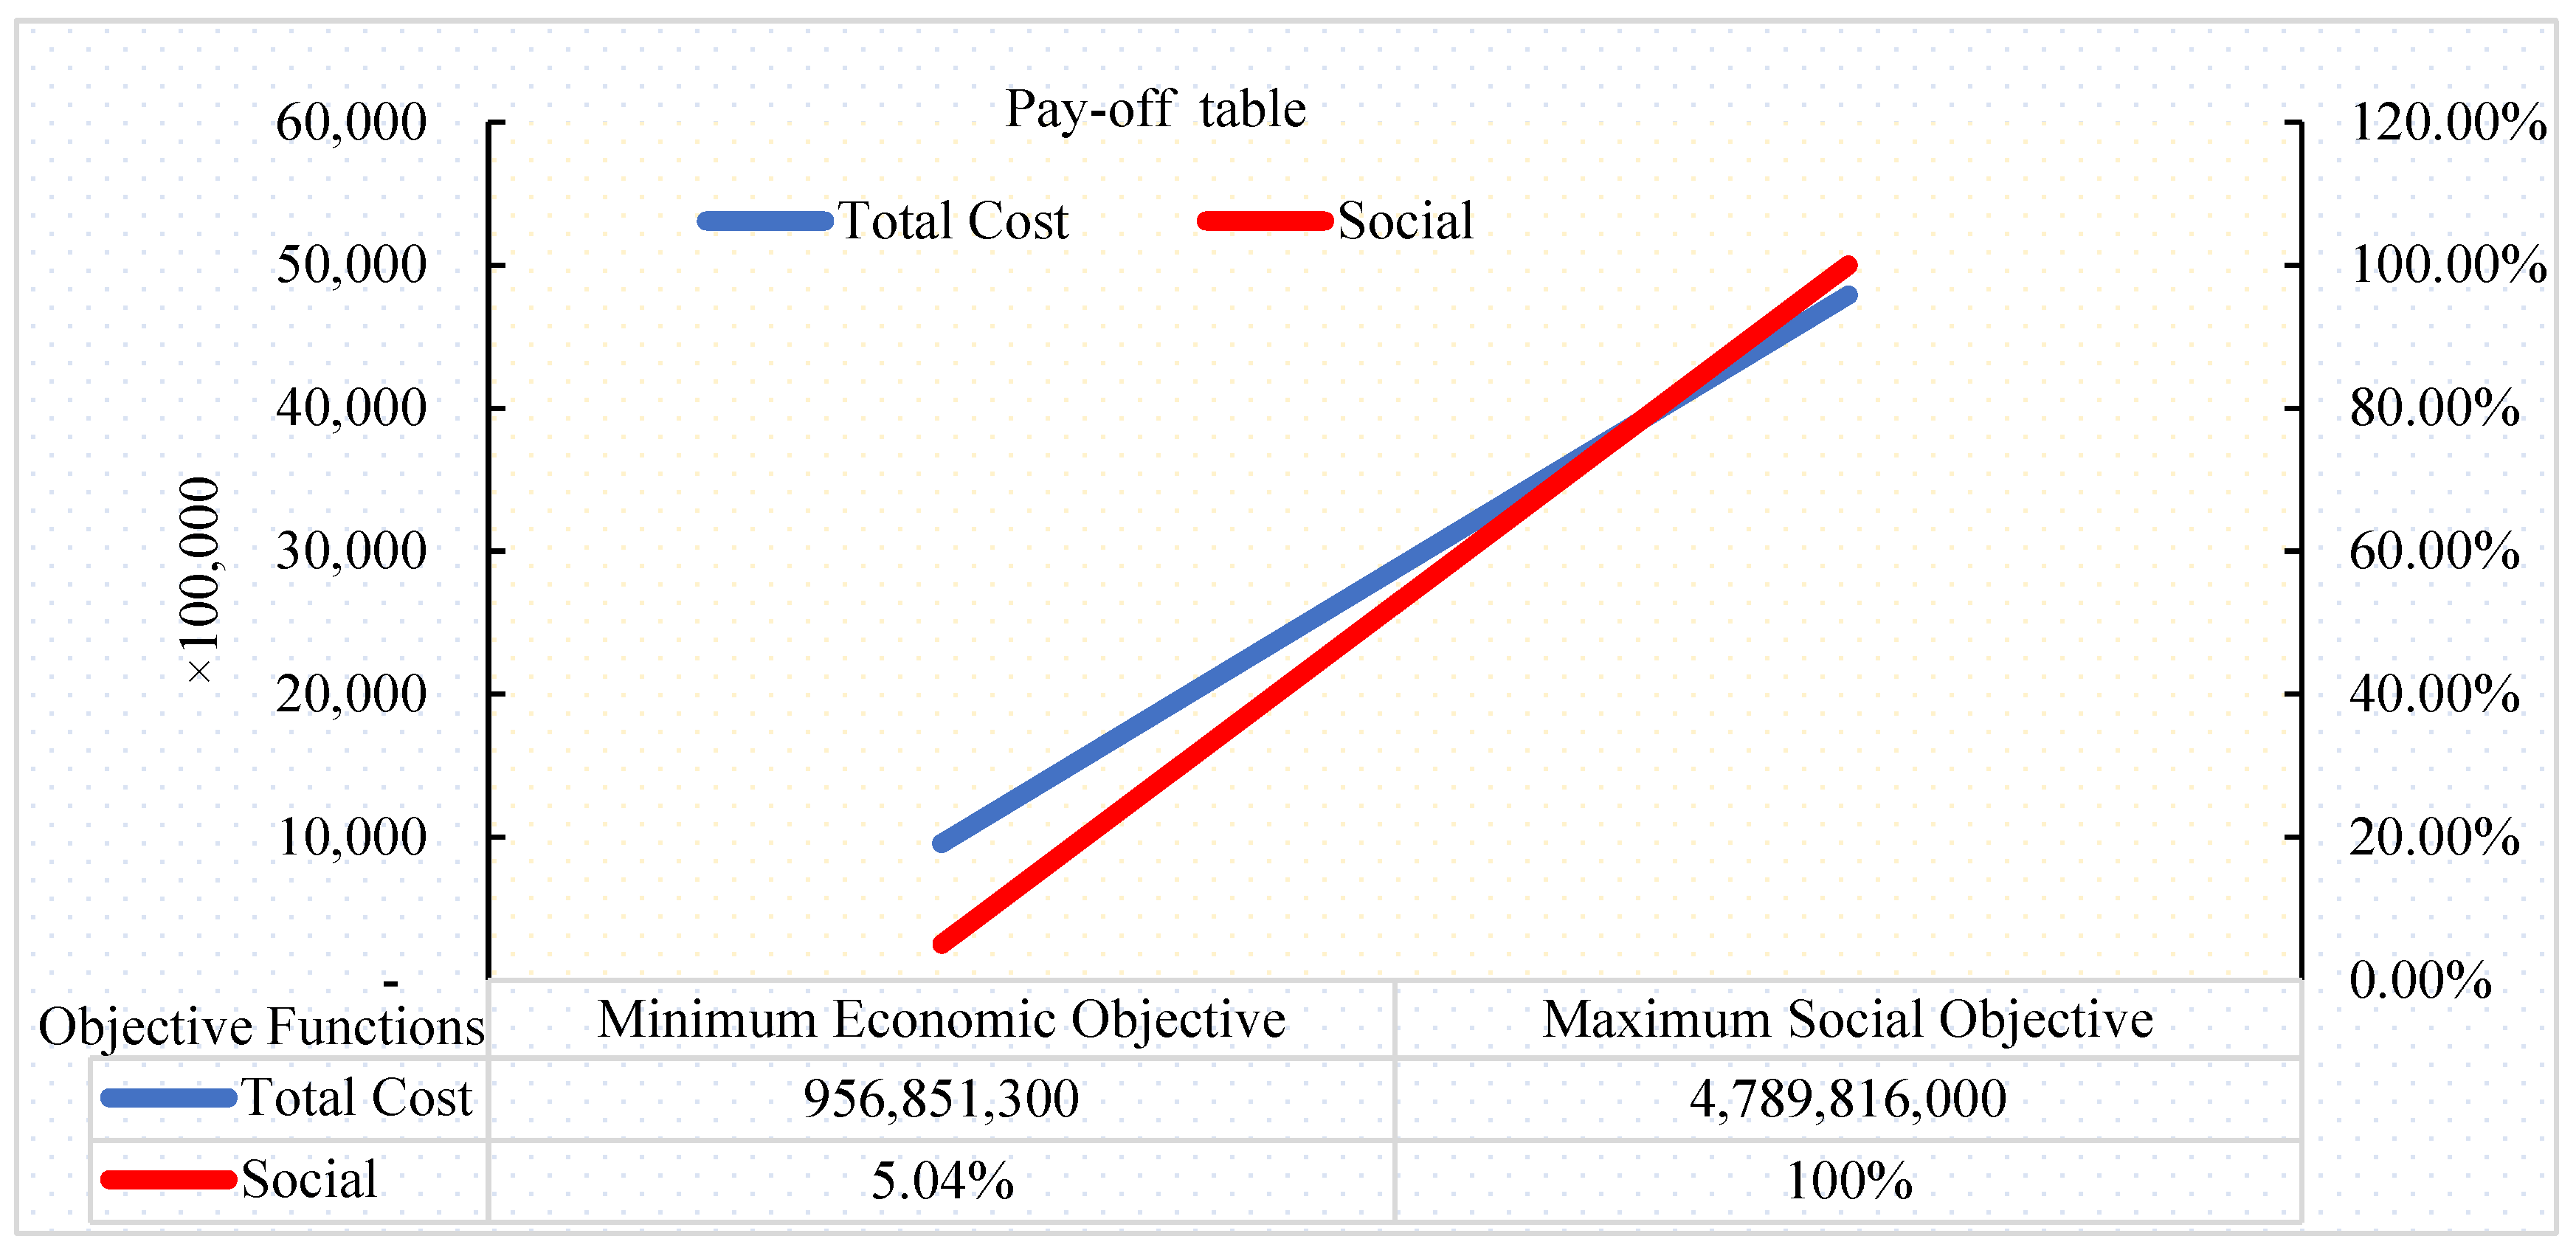
The positive beneficial solutions and negative beneficial solutions are calculated after transforming the grey SGB-SRSC into an equivalent crisp model. This SGB-SRSC model was solved using LINGO 19.0 on a PC with an Intel Core i9-11900 CPU running at 4.90 GHz. There are 786 constraints in total, 3011 total variables, and 58 integer variables in the model. The results provided in Table 2 are calculated at θ = 0, , and . The obtained results depict that both objectives of the proposed model are conflicting in nature. For example, the PBS of an economic objective delivers the lowest feasible value (USD 956,851,300), whereas the NBS solution provides a value (USD 4,789,816,000) that is over five times larger than the PBS. Similarly, the social objective model produces a value of 100 percent social index (PBS) when solved independently, but only a value of 5.04% of the social index (NBS) when solved at the minimum economic value objective.
Table 2.
PBS and NBS for SGB-SRSC model objectives.
The minimum overall system cost value is met in each echelon by keeping the fewest number of facilities with the smallest capacity active. On the other hand, the social element strives to improve economic development indicators in less-developed areas remote from high-biodiesel-demand cities by constructing as many preprocessing plants and biorefineries as possible with peak capacity levels, which increases the overall system cost several times. Figure 3 presents the trade-off among the objectives of the SGB-SRSC model.
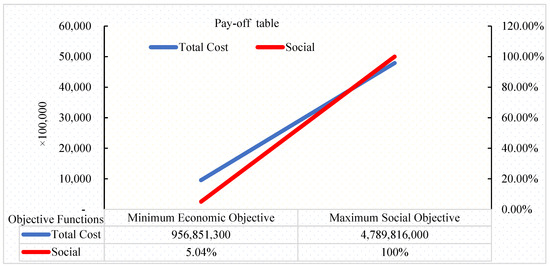
Figure 3.
Trade-off between the SGB-SRSC model objectives.
After that, membership functions for the total supply chain cost and social impact objectives are developed using Equations (66) and (67).
The interactive solution method of the SGB-SRSC model allows managers to adjust interactive parameters in real time and learn more about the system. As a result, by altering the confidence level values () for the uncertain constraints, uncertainty value (β), and compensation coefficient (θ), multiple global optimal solutions depending on the given circumstances may be obtained. Figure 4 depicts the optimized results of the proposed model, at values θ = 0, , and and β = 0.5. For the above-mentioned scenario, the goals achieved for total supply chain cost and social impact objectives are 68.5% (USD 2,164,212,000) and 66.2% (social index 0.68), respectively. According to the decisions depicted in Figure 4, 19 of the 20 possible locations for waste supply terminals were chosen, except for Lahore. All four regions of Chakwal, Attock, DG Khan, and Rajanpur were chosen as cultivating locations for moringa oleifera and industrial hemp, with each region utilizing at least 100,000 hectares. In the second tier of the SGB-SRSC model, 10 of the 12 potential locations were made operational for biomass pre-processing purposes. Further, due to lower per ton pre-processing costs, the model prefers centers with processing capacity levels of 5 million tons over centers with capacity levels of 3 million tons. Additionally, it is observed that biomass pre-processing plants are strategically located near the highest potential feedstock supply in each location to minimize overall system costs and environmental impact due to transportation. Out of five viable locations, three biorefineries were established in Sheikhupura, Muzaffargarh, and DG Khan. Among the selected locations, the Sheikhupura and Muzaffargarh biorefineries were operational with a capacity of 18 million tons/period each, while the DG Khan biorefinery was selected with a capacity of 25 million tons/period. The Sheikhupura biorefinery gets its crude oil primarily from pre-processing plants located in Sheikhupura, Hafizabad, and Chakwal. The feedstock oil for Muzaffargarh biorefinery comes from Bahawalpur, Jhang, Mianwali, and its pre-processing unit. Sargodha and Gujrat furnish crude oil for the DG Khan biorefinery. Finally, in the last tier of the biodiesel supply chain, the markets of Lahore, Sialkot, Sargodha, Rawalpindi, and Faisalabad receive biodiesel generated in Sheikhupura. Muzaffargarh oil refinery exports biodiesel to Layaah, Multan biodiesel markets, and Faisalabad. Rahimyar Khan and Layyah demand zones get biodiesel from the DG Khan biorefinery.
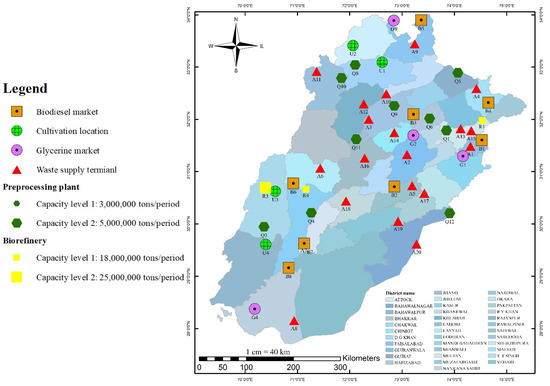
Figure 4.
Map showing operational facilities (optimal decisions) at values θ = 0, = 0.5, and = 0.5.
5.1.1. Influence of Objectives Preference on SGB-SRSC Model Results
Herein, the SGB-SRSC model is solved with various objective preferences to investigate the impact of socio-economic objectives’ priority weights on decision-making. For this purpose, preference weights for SC economics and social goals were varied between 1 and 0, and the results are summarized in Table 3. The examination of the results demonstrates unequivocally that the SGB-SRSC model’s considered goals are in conflict, implying that decision-makers must invest additional resources to achieve higher levels of social goals. It demonstrates that to manage better levels of social satisfaction, executives must pay the cost of lower levels of economic goal satisfaction by constructing numerous biodiesel processing plants in underdeveloped areas. Further, Table 3 shows the corresponding cost of achieving social goals for various combinations of priority weights. From the analysis of the provided results, it is concluded that, when social aspects are given higher importance, the cost of achieving social goals exponentially increases. Additionally, economic and environmental goals are intrinsically tied. This is because transportation costs are proportionate to their environmental impact. Moreover, it is noted that as economic weight is increased, the SC system becomes more centralized.
Table 3.
Influence of objectives preference on SGB-SRSC model results.
If the economic and social goals are combined with preference weights: , , the SGB-SRSC network design model selects the fewest number of biodiesel production facilities at each phase, lowering the total supply chain cost through economies of scale, as shown in Figure 5. The model selects only eight waste supply points (Sargodha, Sahiwal, Layyah, Multan, RY Khan, Jhelum, Joharabad, and Khanewal) and two cultivation locations (Chakwal and Attock). Only two pre-processing plants in the second tier of SC were functional, one with low capacity and one with higher capacity out of 12 available pre-processing plants. Further, only one biorefinery (Sheikhupura) with the lowest possible capacity level is operational in the third tier. The rest of the biorefineries are remained shut, which not only cuts the overall cost for the supply chain, but also helps to alleviate the environmental effects. Likewise, the total system cost is rapidly reduced by giving maximum weightage to the economic factor of the supply chain. This approach will reduce the workforce, which ultimately cuts the cost by reducing the number of wages given to the machinery involved in the human workforce. Detailed SC decisions for the SGB-SRSC model at values θ = 0, , and are provided in Figure 5.

Figure 5.
Detailed supply chain global optimal decisions for the SGB-SRSC model at θ = 0, , and .
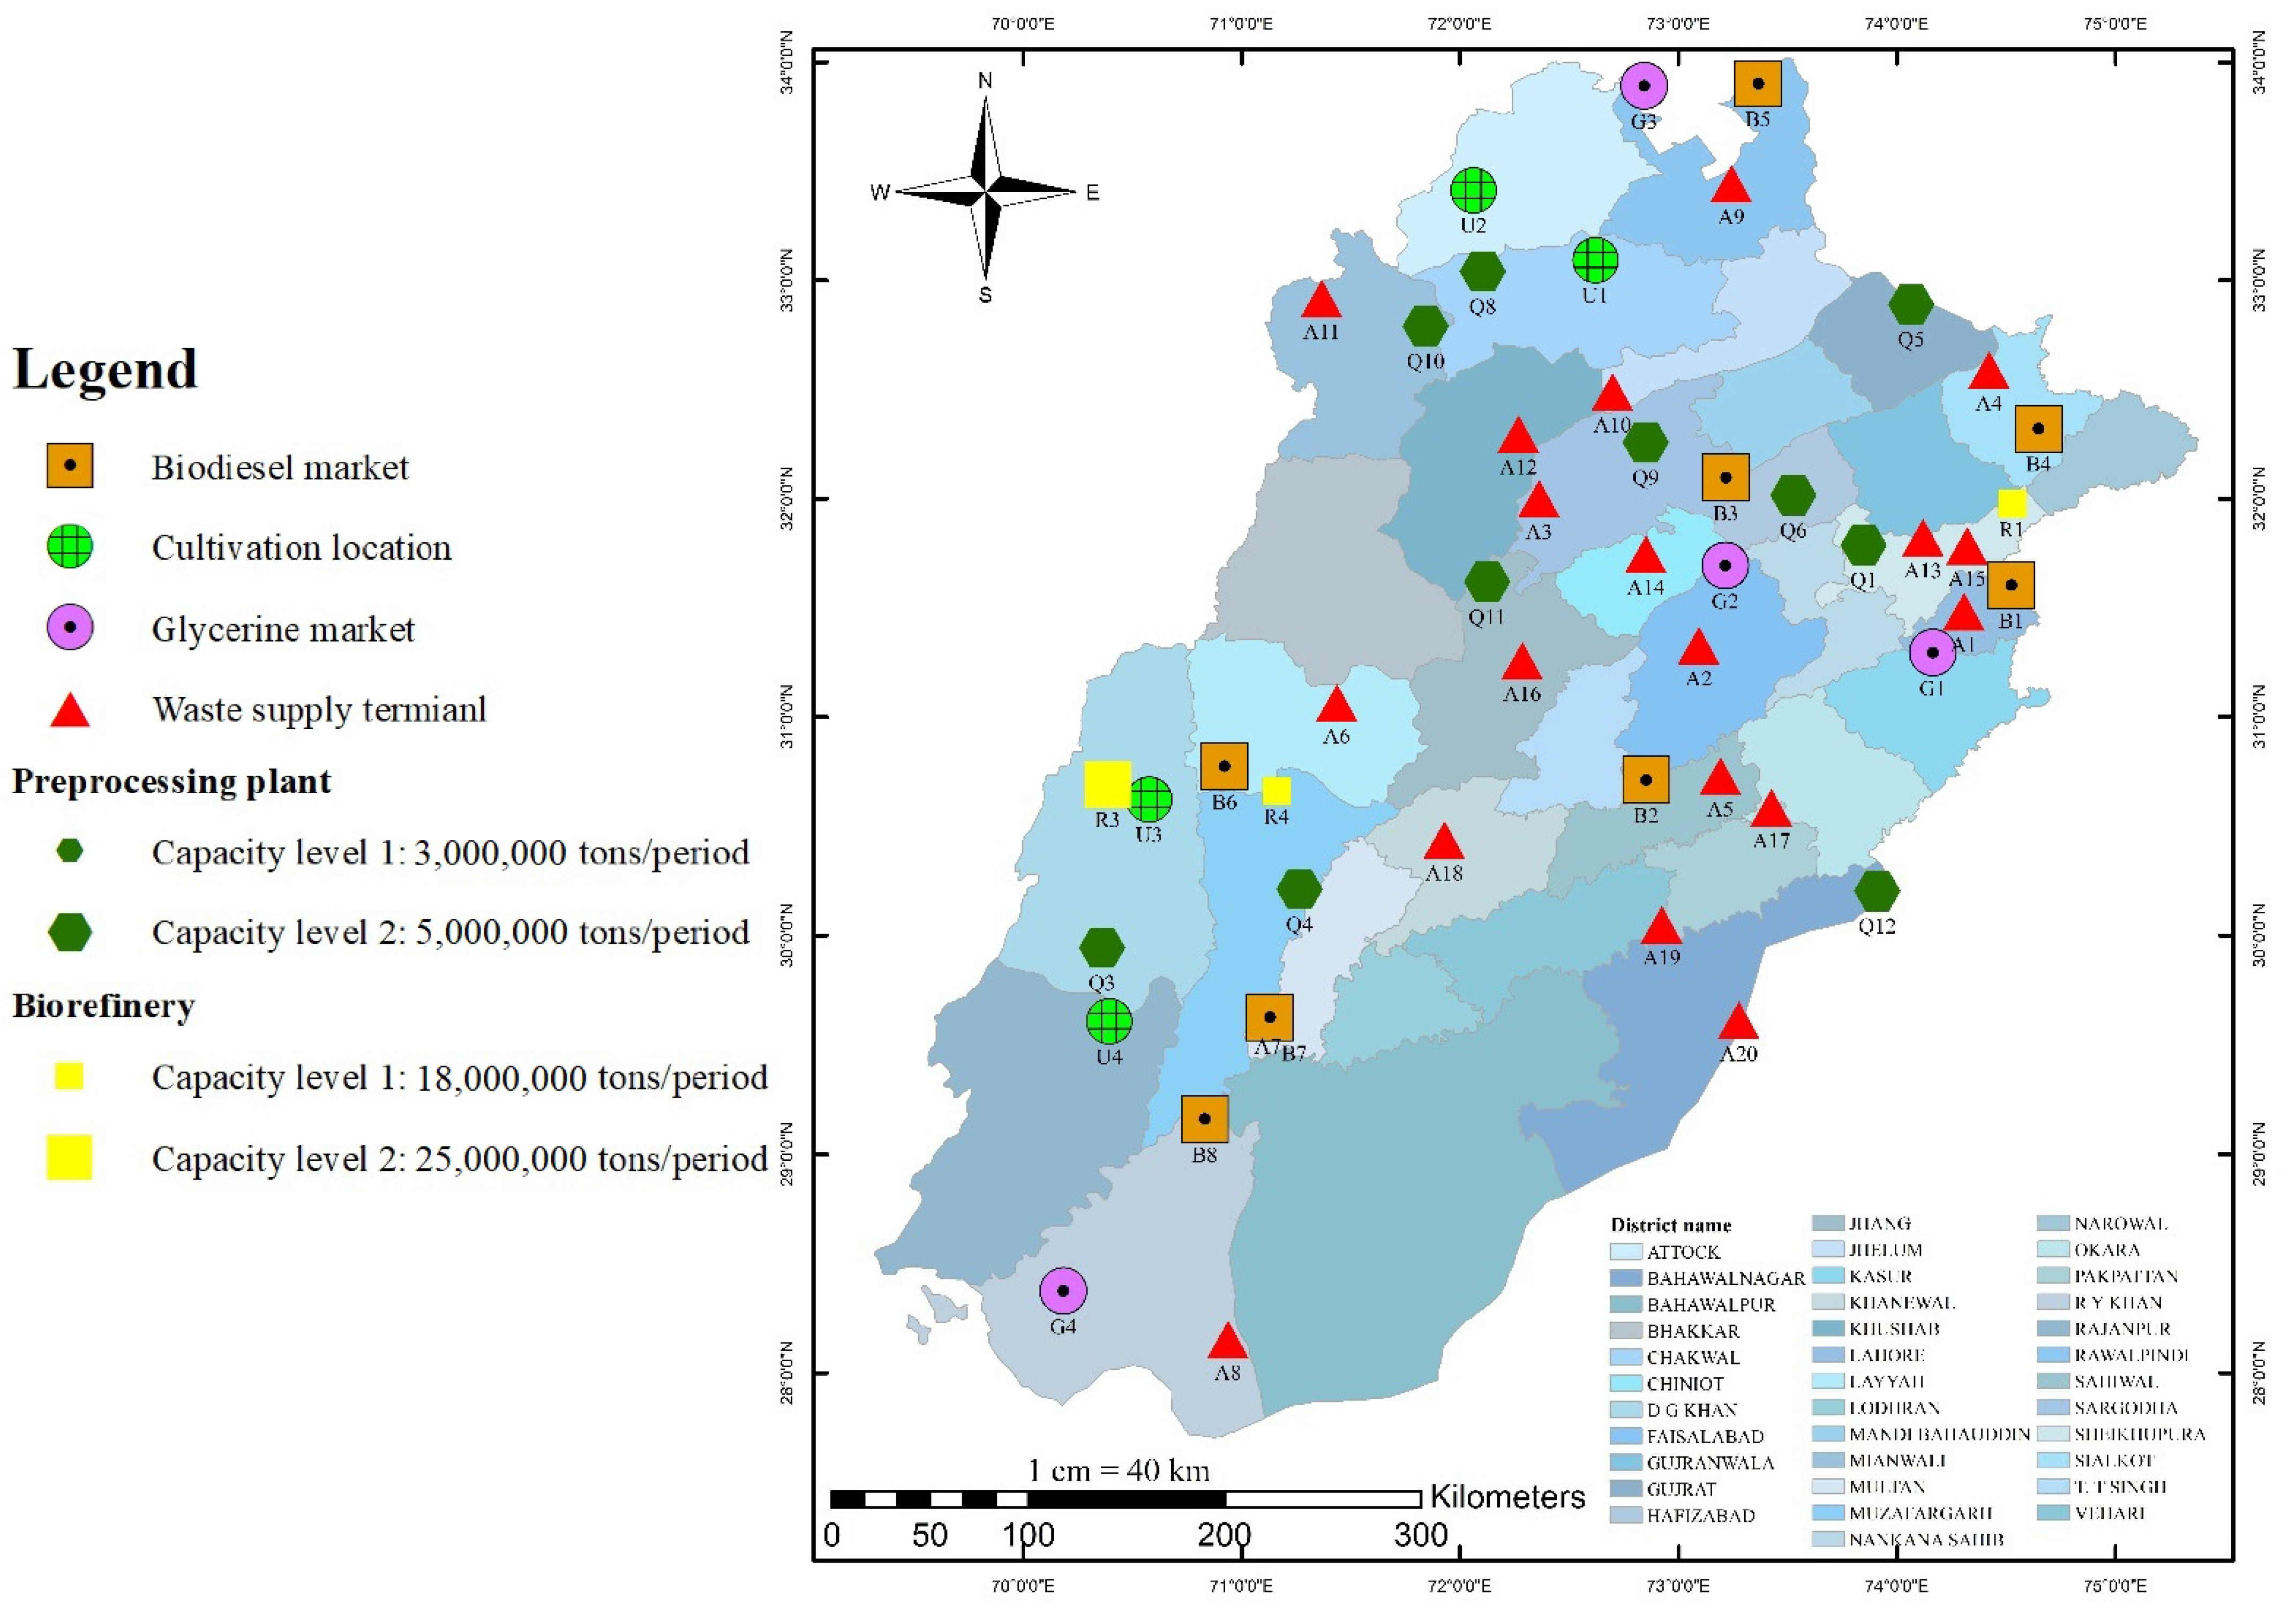
When priority weights θ = 0, , and are considered, the SGB-SRSC model chooses to maximize the social index of the system by selecting the maximum number of facilities in all tiers with the highest employment rate in regions with lower development. Giving priority to the social objective will increase employment opportunities and boost regional development in marginalized areas. Figure 6 illustrates the operational facilities available when social considerations take precedence over economic considerations. All 20 biomass supply terminals and all four cultivation areas are chosen in this scenario. In the second tier of the considered SC, 10 preprocessing plants are operating at full capacity to process raw oil. Five out of five biorefineries with maximum capacity are operational in the next tier, utilizing the maximum amount of workforce and machinery. This scenario will result in a significant increase in employment opportunities and the uplift of marginalized regions. Eventually, it will affect the region’s economy and the natives’ standard of living. Figure 6 depicts the global optimal decisions of the SGB-SRSC model for values θ = 0, , and . The processing facilities in the diagram that are black indicate that they are not operational. Furthermore, the flow of material among SC’s processing facilities is depicted using arrows.
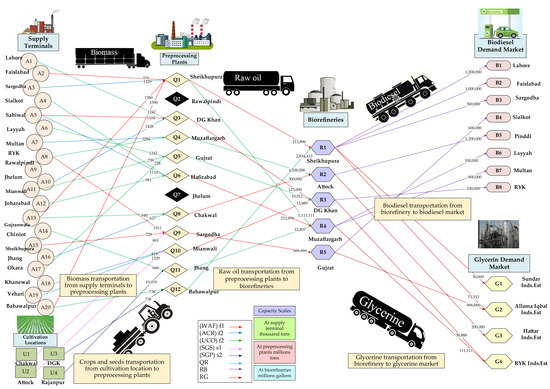
Figure 6.
Detailed supply chain global optimal decisions for the SGB-SRSC model at θ = 0, , and .
5.1.2. The Effect of Capacity Levels of Processing Facilities on the Biodiesel Supply Chain
This section investigates the effect of biodiesel production facility capacity levels on the various configurations of the SGB-SRSC model. Decisions about facility location and capacity (strategic planning) are critical in determining overall system performance. The proposed model allows for a trade-off between total facility count and capacity levels in each supply chain tier. In addition, by determining the number and capacity level in each stage, the SGB-SRSC model also seeks to balance contradictory economic and social goals. To obtain cost-effective and ecologically sustainable SC decisions, a balance must be made between logistics costs and economies of scale: a larger number of facilities (pre-processing tiers and biorefineries) with low-capacity levels will reduce logistics costs, but overall system costs may rise as economies of scale are overlooked. On the other hand, making operational a smaller number of facilities with higher capacity levels will make economies of scale more effective. However, it may incur higher total system costs due to increased distance between facilities.
To examine the impact of levels of capacity on the SGB-SRSC network design, the underlying five situations are considered: (i) integrated scenario, (ii) distributed scenario, (iii) equal preference scenario, (iv) restricted biomass supply, and (v) increased biodiesel demand. Figure 7 summarizes the necessary number of biodiesel preprocessing and production plants, and their levels of capacity for each case. The optimization model’s primary goal in the integrated SC network situation is to exploit the economies of scale. Wherever possible, the model picked the greatest capacities of pre-processing plants and biorefineries for this purpose; nevertheless, lower levels of pre-processing plants and biorefineries were chosen for areas where logistics costs are higher. On the other hand, a distributed SC network attempts to build multiple facilities with lower processing capacity in geographically dispersed regions with the purpose of decreasing system costs by cutting transportation expenses. In the third scenario, where all objectives are equally weighted, the SGB-SRSC model reduces overall SC system costs by locating some of the processing plants and biorefineries in the most economically feasible locations with maximum capacity levels, while others are in low RDL. In this scenario, the optimization model selects the lowest capacity biodiesel plants in dispersed places with low RDL while optimizing the economic component by selecting plants with the highest capacity at the most commercially viable sites. In the situation of low feedstock availability, the model develops the fewest number of pre-processing facilities and biorefineries. The model makes the cultivation locations operational to fill the gap. Nevertheless, the total SC cost rises because produced feedstock (moringa oleifera and industrial hemp) is more expensive than waste (animal fat, used cooking oil, and agriculture crop residue), and cultivated sites are in offset locations.
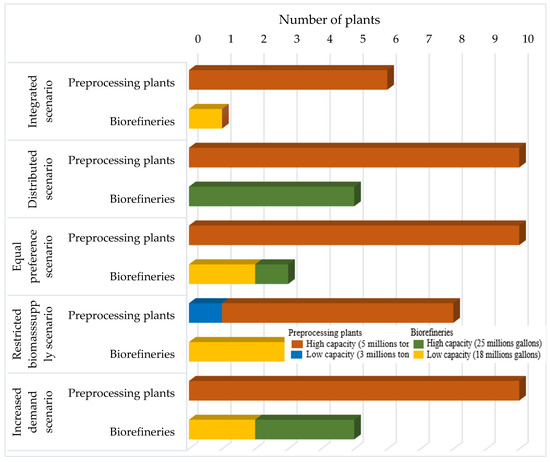
Figure 7.
Impact of capacity levels of facilities on the biodiesel supply chain.
6. Conclusions
This study developed a socio-economic decision-making framework for biodiesel production distribution employing waste cooking oil, agricultural residue, animal fat, industrial hemp, and moringa oleifera as feedstock in uncertain environments. The economic aspect of this decision-making framework seeks to minimize overall SC costs and environmental emission costs, while the social aspect seeks to optimize the social index, which is developed using the GSLCAP methodology and includes job opportunities, regional development, unemployment rate, and economic value. To cope with the uncertainty associated with SGB-SRSC model input parameters, a grey-fuzzy solution methodology was suggested. Socio-economic analysis of the case states that managers have to bear higher total SC system costs for attaining social goals within the proposed framework. Similarly, a higher cost is necessary to mitigate the risk associated with the proposed model’s uncertain input parameters. Because the provided decision-making framework is interactive, the trade-off between overall system cost minimization, social index maximization, and risk mitigation can be made according to real-time circumstances. Furthermore, the price of biodiesel generation and biodiesel production facility installation (biorefinery) accounted for a large portion of the total SC cost. As a result, new cost-effective methods of producing biodiesel are required, which would considerably improve the industry’s economic viability. Multiple extensions to the provided study are possible in the future. No research addresses supply chain contracts in the context of the biofuel supply chain. Incorporating supply chain contracts in the domain of biomass purchase and logistics activities would be a significant contribution to this area. In addition to this, this research has not addressed the design of a regional logistics network for biomass. The proposed SGB-SRSC model’s integration within regional transportation networks would significantly expand the scope of this study. In addition, incorporating uncertainty associated with transportation link disruption risk into the existing framework will also be beneficial for SC managers. This research can be helpful for government regulatory bodies and policymakers involved in biodiesel production and distribution planning projects.
Supplementary Materials
The following supporting information can be downloaded at: https://www.mdpi.com/article/10.3390/su141610169/s1, Table S1. Mutual comparison of grey systems theory, probability theory, and, fuzzy theory; Table S2. Supply terminals, pre-processing plants, and bio-refineries installation costs; Table S3. Supply of second-generation feedstocks at supply terminals for each time horizon; Table S4. Potential biodiesel pre-processing plant sites’ processing capacity; Table S5. Unemployment rate in areas where biodiesel processing facilities might be built; Table S6. Potential biodiesel processing facility locations at the regional development level; Table S7. The number of employment generated by the establishment of biodiesel processing plants; Table S8. Biodiesel processing plants have an economic value; Table S9. The demand for biodiesel during the time; Table S10. The demand for glycerin during the time; Table S11. Yield at production locations for industrial hemp and moringa oleifera; Table S12. Cultivation area for cultivation of industrial hemp and moringa oleifera; Table S13. Feedstock purchasing cost for all types from suppliers; Table S14. Handling cost for all types of feedstock from cultivation location; Table S15. Production cost of raw oil from all types of crops cultivated.
Author Contributions
M.K.: Conceptualization, Writing—original draft, Methodology, Investigation, Review, Revision, Supervision, Funding. M.S.H.: Conceptualization, Writing—original draft, Investigation, Review, Revision, A.S.: Writing—original draft, Software, Resources, Data collection. A.H.: Supervision, Project administration. T.H.: Review and Investigation. H.R.: Methodology and Software. Z.A.: Project administration, Funding, Supervision. R.A.: Software and Investigation. All authors have read and agreed to the published version of the manuscript.
Funding
This research received no external funding.
Institutional Review Board Statement
Not applicable.
Informed Consent Statement
Not applicable.
Data Availability Statement
The study did not report any data.
Conflicts of Interest
The authors declare no conflict of interest.
Appendix A
| Indices | |
| f | Index for animal fat, agricultural crop residue, and used cooking oil type |
| a | Index for feedstock supply terminal of candidate locations |
| s | Index for specially grown seeds and plants type |
| u | Index for specially grown seeds and plants cultivation of candidate locations |
| q | Index for pre-processing plants of candidate locations |
| j | Index of pre-processing plants’ capacity level |
| r | Index for biorefinery of candidate locations |
| i | Index of biorefinery capacity level |
| b | Index of market demand for biodiesel |
| g | Index of market demand for glycerin |
| t | Index for period planning |
| Parameters | |
| Total second-generation feedstock-based biodiesel supply chain cost | |
| The total installation cost of biodiesel supply chain processing facilities | |
| The total cost of second-generation feedstock purchase | |
| Total feedstock source handling cost | |
| Amount of carbon emissions produced in handling feedstock at pre-processing plant q (kg of CO2/ton) for source type f | |
| Amount of carbon emissions produced in handling feedstock at pre-processing plant q (kg of CO2/ton) for source type s | |
| Carbon emission tax (USD/kg of CO2) | |
| Total inventory holding cost | |
| Total production cost of raw oil, biodiesel, and glycerin in the biodiesel supply chain | |
| Amount of carbon emissions produced in the production of raw oil at pre-processing q (kg of CO2/ton) of source type f | |
| Amount of carbon emissions produced in the production of raw oil at pre-processing q (kg of CO2/ton) of source type s | |
| Amount of carbon emissions produced in the production of biodiesel at biorefinery r (kg of CO2/ton) of source type f | |
| Amount of carbon emissions produced in the production of biodiesel at biorefinery r (kg of CO2/ton) of source type s | |
| Total transportation cost of biomass, raw oil, biodiesel, and glycerin among biodiesel supply chain processing facilities | |
| Amount of carbon emissions produced in transporting biomass from supply terminal a to pre-processing q (kg of CO2/ton) of source type f | |
| Amount of carbon emissions produced in transporting biomass from cultivation terminal u to pre-processing q (kg of CO2/ton) of source type s | |
| Amount of carbon emissions produced in transporting raw oil from pre-processing q to biorefinery r (kg of CO2/ton) of source type f | |
| Amount of carbon emissions produced in transporting raw oil from pre-processing q to biorefinery r (kg of CO2/ton) of source type s | |
| Amount of carbon emissions produced in transporting biodiesel from biorefinery r to biodiesel market b (kg of CO2/ton) | |
| Amount of carbon emissions produced in transporting biodiesel from biorefinery r to glycerin market g (kg of CO2/ton) | |
| Opening cost of biomass supply terminals in the candidate locations a | |
| Opening cost of cultivation area for specially grown plants and seeds in the candidate locations u | |
| Opening cost of second-generation feedstock-based pre-processing plant in the region q having capacity j | |
| Opening cost of biorefinery in region r having capacity i for biodiesel production | |
| Purchasing cost of sources from supply terminal a to pre-processing q for feedstock source type f in period t | |
| Cultivation cost of sources from cultivation location u to pre-processing q for feedstock source type s in period t | |
| Handling cost of sources from supply terminal a to pre-processing plant q for feedstock source type f in duration t | |
| Handling cost of sources from cultivation area u to pre-processing plant q for feedstock source type s in duration t | |
| Inventory holding cost at pre-processing plant q of feedstock source type f in period t | |
| Inventory holding cost at pre-processing plant q of feedstock source type s in period t | |
| Inventory holding cost of biodiesel in biorefinery r in period t | |
| Inventory holding cost of glycerin in biorefinery r in period t | |
| Production cost of raw oil at pre-processing plant q for feedstock source type f in period t | |
| Production cost of raw oil at pre-processing plant q for feedstock source type s in period t | |
| Production cost of biodiesel at biorefinery r for feedstock source type f in period t | |
| Production cost of biodiesel at biorefiner r for feedstock source type s in period t | |
| Production cost of glycerin at biorefinery r for feedstock source type f in period t | |
| Production cost of glycerin at biorefinery r for feedstock source type s in period t | |
| Transportation cost of raw oil of feedstock source type f from supply terminals a to pre-processing center q | |
| Transportation cost of raw oil of feedstock source type s from cultivation area u to pre-processing center q | |
| Transportation cost of feedstock source type f from pre-processing center q to biorefinery r | |
| Transportation cost of feedstock source type s from pre-processing center q to biorefinery r | |
| Transportation cost of biodiesel from biorefinery r to biodiesel demand b | |
| Transportation cost of glycerin from biorefinery r to demand center g | |
| Social objective parameters | |
| Biodiesel supply chain total social responsibility | |
| The unemployment percentage rate in the region a | |
| The unemployment percentage rate in the region u | |
| The unemployment percentage rate in region q | |
| The unemployment percentage rate in region r | |
| Job opportunity created by opening supply terminal a | |
| Job opportunity created by opening cultivation area u | |
| Job opportunity created by opening pre-processing plant q having capacity j | |
| Job opportunity created by opening biorefinery r having capacity i | |
| Economic value of establishing feedstock source supply terminal a | |
| Economic value of establishing feedstock cultivation terminal u | |
| Economic value of establishing pre-processing plant q having capacity j | |
| Economic value of establishing biorefinery r having capacity i | |
| Region a development level | |
| Region u development level | |
| Region q development level | |
| Region r development level | |
| Economic development indicator | |
| Indicator for economic development minimum value | |
| Indicator for economic development maximum value | |
| Indicators for an employment opportunity | |
| Minimum value of employment opportunity indicator | |
| Minimum value of employment opportunity indicator | |
| Weightage of indicators for economic development | |
| Weightage of indicator for an employment opportunity | |
| Constraints parameters | |
| Available quantity of animal fat, agricultural crop residue, and used cooking oil supply terminal candidate location a of source type f in period t | |
| Quantity of specially grown plants and seeds yields per hectare at candidate location u in period t (ton/ha) | |
| Conversion factor of waste animal fat, agricultural crop residue, and used cooking oil of candidate locations f | |
| Factor for conversion of specially grown seeds and plants of candidate locations s | |
| Factor for the yield of second-generation feedstock type f | |
| Factor for the yield of second-generation feedstock type s | |
| Processing capacity j at pre-processing plant q | |
| Biorefinery r production capacity with level i | |
| Maximum number of locations for feedstock supply terminals | |
| Maximum number of locations for cultivation area | |
| Maximum number of locations for pre-processing plants | |
| Maximum number of locations for biorefineries plants | |
| Biodiesel market demand at biodiesel market b in period t | |
| Glycerin market demand at glycerin market g in period t | |
| Maximum cultivation area u in period t | |
| Minimum cultivation area u in period t | |
| Decision variables | |
| 1 if biomass supply terminal a is operational: otherwise 0 | |
| 1 if cultivation area u is operational: otherwise 0 | |
| 1 if pre-processing q having capacity j is operational: otherwise 0 | |
| 1 if biorefinery r having capacity i is operational: otherwise 0 | |
| Produced amount of specially grown seeds and plants s at cultivation candidate location u in period t (ton/period) | |
| Amount of cultivation area of specially grown seeds and plants s at candidate location u (ha) | |
| Amount of animal fat, agricultural crop residues, and used cooking oil at candidate location f transported from supply terminal a handled at pre-processing plant q during period t | |
| Amount of specially grown seeds and plants s at candidate locations u transported to pre-processing plant q during period t | |
| Raw oil inventory level at fat pre-processing plant q of feedstock type f in period t | |
| Raw oil inventory level at fat pre-processing plant q of feedstock type s in period t | |
| Biodiesel inventory level produced at biorefinery r in period t | |
| Glycerin inventory level produced at biorefinery r in period t | |
| Quantity of raw oil produced from feedstock type f at pre-processing plant q in period t | |
| Quantity of raw oil produced from feedstock type s at pre-processing plant q in period t | |
| Quantity of biodiesel manufactured at biorefinery r from feedstock type f in period t | |
| Quantity of biodiesel manufactured at biorefinery r from feedstock type s in period t | |
| Quantity of glycerin produced at biorefinery r from feedstock type f in period t | |
| Quantity of glycerin produced at biorefinery r from feedstock type s in period t | |
| Quantity of feedstock source type f from pre-processing plant q transferred to biorefinery r during period t | |
| Quantity of feedstock source type s from pre-processing plant q transferred to biorefinery r during period t | |
| Quantity of produced biodiesel transferred from biorefinery r to biodiesel market b during period t | |
| Quantity of produced glycerin transferred from biorefinery r to glycerin market g during period t | |
| Total quantity of biodiesel produced at biorefinery r in period t | |
| Total quantity of glycerin produced at biorefinery r in period t | |
References
- Khan, H.M.; Ali, C.H.; Iqbal, T.; Yasin, S.; Sulaiman, M.; Mahmood, H.; Raashid, M.; Pasha, M.; Mu, B. Current scenario and potential of biodiesel production from waste cooking oil in Pakistan: An overview. Chin. J. Chem. Eng. 2019, 27, 2238–2250. [Google Scholar] [CrossRef]
- Ambat, I.; Srivastava, V.; Sillanpää, M. Recent advancement in biodiesel production methodologies using various feedstock: A review. Renew. Sustain. Energy Rev. 2018, 90, 356–369. [Google Scholar] [CrossRef]
- Mohammadi, M.; Harjunkoski, I. Performance analysis of waste-to-energy technologies for sustainable energy generation in integrated supply chains. Comput. Chem. Eng. 2020, 140, 106905. [Google Scholar] [CrossRef]
- Aga, W.S.; Fantaye, S.K.; Jabasingh, S.A. Biodiesel production from Ethiopian ‘Besana’-Croton macrostachyus seed: Characterization and optimization. Renew. Energy 2020, 157, 574–584. [Google Scholar] [CrossRef]
- Ghaderi, H.; Moini, A.; Pishvaee, M.S. A multi-objective robust possibilistic programming approach to sustainable switchgrass-based bioethanol supply chain network design. J. Clean. Prod. 2018, 179, 368–406. [Google Scholar] [CrossRef]
- Mirhashemi, M.S.; Mohseni, S.; Hasanzadeh, M.; Pishvaee, M.S. Moringa oleifera biomass-to-biodiesel supply chain design: An opportunity to combat desertification in Iran. J. Clean. Prod. 2018, 203, 313–327. [Google Scholar] [CrossRef]
- Rehman, M.S.U.; Rashid, N.; Saif, A.; Mahmood, T.; Han, J.-I. Potential of bioenergy production from industrial hemp (Cannabis sativa): Pakistan perspective. Renew. Sustain. Energy Rev. 2013, 18, 154–164. [Google Scholar] [CrossRef]
- Habib, M.S.; Tayyab, M.; Zahoor, S.; Sarkar, B. Management of animal fat-based biodiesel supply chain under the paradigm of sustainability. Energy Convers. Manag. 2020, 225, 113345. [Google Scholar] [CrossRef]
- Babazadeh, R.; Razmi, J.; Pishvaee, M.S.; Rabbani, M. A sustainable second-generation biodiesel supply chain network design problem under risk. Omega 2017, 66, 258–277. [Google Scholar] [CrossRef]
- Alptekin, E.; Canakci, M. Optimization of pretreatment reaction for methyl ester production from chicken fat. Fuel 2010, 89, 4035–4039. [Google Scholar] [CrossRef]
- Cunha, A.; Feddern, V.; De Prá, M.C.; Higarashi, M.M.; de Abreu, P.G.; Coldebella, A. Synthesis and characterization of ethylic biodiesel from animal fat wastes. Fuel 2013, 105, 228–234. [Google Scholar] [CrossRef]
- Srinivasan, G.R.; Palani, S.; Jambulingam, R. Biodiesel Production from Waste Animal Fat Using a Novel Catalyst Hca Immobilized Aunps Amine Grafted Sba-15. J. Eng. Sci. Technol. 2018, 13, 2632–2643. [Google Scholar]
- Bai, Y.; Ouyang, Y.; Pang, J.-S. Biofuel supply chain design under competitive agricultural land use and feedstock market equilibrium. Energy Econ. 2012, 34, 1623–1633. [Google Scholar] [CrossRef]
- Abraham, A.; Mathew, A.K.; Sindhu, R.; Pandey, A.; Binod, P. Potential of rice straw for bio-refining: An overview. Bioresour. Technol. 2016, 215, 29–36. [Google Scholar] [CrossRef] [PubMed]
- Ahmad Dar, R.; Ahmad Dar, E.; Kaur, A.; Gupta Phutela, U. Sweet sorghum-a promising alternative feedstock for biofuel production. Renew. Sustain. Energy Rev. 2018, 82, 4070–4090. [Google Scholar] [CrossRef]
- Rajak, U.; Verma, T.N. Effect of emission from ethylic biodiesel of edible and non-edible vegetable oil, animal fats, waste oil and alcohol in CI engine. Energy Convers. Manag. 2018, 166, 704–718. [Google Scholar] [CrossRef]
- Moretti, C.; Junginger, M.; Shen, L. Environmental life cycle assessment of polypropylene made from used cooking oil. Resour. Conserv. Recycl. 2020, 157, 104750. [Google Scholar] [CrossRef]
- Mohammadshirazi, A.; Akram, A.; Rafiee, S.; Bagheri Kalhor, E. Energy and cost analyses of biodiesel production from waste cooking oil. Renew. Sustain. Energy Rev. 2014, 33, 44–49. [Google Scholar] [CrossRef]
- Akgul, O.; Shah, N.; Papageorgiou, L.G. An optimisation framework for a hybrid first/second generation bioethanol supply chain. Comput. Chem. Eng. 2012, 42, 101–114. [Google Scholar] [CrossRef]
- An, H.; Wilhelm, W.E.; Searcy, S.W. A mathematical model to design a lignocellulosic biofuel supply chain system with a case study based on a region in Central Texas. Bioresour. Technol. 2011, 102, 7860–7870. [Google Scholar] [CrossRef]
- Bambara, L.D.F.; Sawadogo, M.; Roy, D.; Blin, J.; Anciaux, D.; Ouiminga, S.K. Wild and cultivated biomass supply chain for biofuel production. A comparative study in West Africa. Energy Sustain. Dev. 2019, 53, 1–14. [Google Scholar] [CrossRef]
- Merigó, J.M.; Gil-Lafuente, A.M.; Yager, R.R. An overview of fuzzy research with bibliometric indicators. Appl. Soft Comput. 2015, 27, 420–433. [Google Scholar] [CrossRef]
- Yu, D.; Xu, Z.; Wang, W. Bibliometric analysis of fuzzy theory research in China: A 30-year perspective. Knowl.-Based Syst. 2018, 141, 188–199. [Google Scholar] [CrossRef]
- Habib, M.S.; Omair, M.; Ramzan, M.B.; Chaudhary, T.N.; Farooq, M.; Sarkar, B. A robust possibilistic flexible programming approach toward a resilient and cost-efficient biodiesel supply chain network. J. Clean. Prod. 2022, 366, 132752. [Google Scholar] [CrossRef]
- Ahmed, W.; Sarkar, B. Impact of carbon emissions in a sustainable supply chain management for a second generation biofuel. J. Clean. Prod. 2018, 186, 807–820. [Google Scholar] [CrossRef]
- Ahmed, W.; Sarkar, B. Management of next-generation energy using a triple bottom line approach under a supply chain framework. Resour. Conserv. Recycl. 2019, 150, 104431. [Google Scholar] [CrossRef]
- Babazadeh, R. Application of Fuzzy Optimization to Bioenergy-Supply-Chain Planning under Epistemic Uncertainty: A New Approach. Ind. Eng. Chem. Res. 2019, 58, 6519–6536. [Google Scholar] [CrossRef]
- Mousavi, P.; Ghaderi, S.F.; Azadeh, A.; Babazadeh, R. Hybrid Multiobjective Robust Possibilistic Programming Approach to a Sustainable Bioethanol Supply Chain Network Design. Ind. Eng. Chem. Res. 2018, 57, 15066–15083. [Google Scholar] [CrossRef]
- Sadeghi, M.; Razavi Hajiagha, S.H.; Hashemi, S.S. A fuzzy grey goal programming approach for aggregate production planning. Int. J. Adv. Manuf. Technol. 2013, 64, 1715–1727. [Google Scholar] [CrossRef]
- Razavi Hajiagha, S.H.; Mahdiraji, H.A.; Hashemi, S.S. A hybrid model of fuzzy goal programming and grey numbers in continuous project time, cost, and quality tradeoff. Int. J. Adv. Manuf. Technol. 2014, 71, 117–126. [Google Scholar] [CrossRef]
- Memon, M.S.; Mari, S.I.; Shaikh, F.; Shaikh, S.A. A Grey-Fuzzy Multiobjective Model for Supplier Selection and Production-Distribution Planning Considering Consumer Safety. Math. Probl. Eng. 2018, 2018, 5259876. [Google Scholar] [CrossRef]
- Rajesh, R. A novel advanced grey incidence analysis for investigating the level of resilience in supply chains. Ann. Oper. Res. 2020, 308, 441–490. [Google Scholar] [CrossRef]
- Rajesh, R. Group decision-making and grey programming approaches to optimal product mix in manufacturing supply chains. Neural Comput. Appl. 2020, 32, 2635–2649. [Google Scholar] [CrossRef]
- Pourofoghi, F.; Salokolaei, D.D.; Abraham, A. Designing Transportation Problem Under Grey Linear Programming Based on Sensitivity Analysis. In Proceedings of the Intelligent and Fuzzy Techniques for Emerging Conditions and Digital Transformation, Istanbul, Turkey, 24–26 August 2021; Springer: Cham, Switzerland, 2022; pp. 666–675. [Google Scholar]
- Memon, M.S.; Lee, Y.H.; Mari, S.I. Group multi-criteria supplier selection using combined grey systems theory and uncertainty theory. Expert Syst. Appl. 2015, 42, 7951–7959. [Google Scholar] [CrossRef]
- Malekpoor, H.; Chalvatzis, K.; Mishra, N.; Mehlawat, M.K.; Zafirakis, D.; Song, M. Integrated grey relational analysis and multi objective grey linear programming for sustainable electricity generation planning. Ann. Oper. Res. 2018, 269, 475–503. [Google Scholar] [CrossRef]
- Luo, Z.; Yang, J.; Chen, L.-P.; Zhang, Y.-Q.; Abdel-Malek, K. A new hybrid fuzzy-goal programming scheme for multi-objective topological optimization of static and dynamic structures under multiple loading conditions. Struct. Multidiscip. Optim. 2006, 31, 26–39. [Google Scholar] [CrossRef]
- Xia, X.; Ruan, J. Analyzing Barriers for Developing a Sustainable Circular Economy in Agriculture in China Using Grey-DEMATEL Approach. Sustainability 2020, 12, 6358. [Google Scholar] [CrossRef]
- Karmakar, S.; Mujumdar, P. Grey fuzzy optimization model for water quality management of a river system. Adv. Water Resour. 2006, 29, 1088–1105. [Google Scholar] [CrossRef]
- Guo, H.-C.; Zhang, Z.-X.; Yu, Y. A grey multi-objective programming approach for sustainable land-use in the Miyun Reservoir Basin, China. J. Environ. Sci. 2004, 16, 120–125. [Google Scholar]
- Julong, D. Introduction to grey system theory. J. Grey Syst. 1989, 1, 1–24. [Google Scholar]
- Gilani, H.; Sahebi, H. A multi-objective robust optimization model to design sustainable sugarcane-to-biofuel supply network: The case of study. Biomass Convers. Biorefin. 2021, 11, 2521–2542. [Google Scholar] [CrossRef]
- Bairamzadeh, S.; Saidi-Mehrabad, M.; Pishvaee, M.S. Modelling different types of uncertainty in biofuel supply network design and planning: A robust optimization approach. Renew. Energy 2018, 116, 500–517. [Google Scholar] [CrossRef]
- Bairamzadeh, S.; Pishvaee, M.S.; Saidi-Mehrabad, M. Multiobjective Robust Possibilistic Programming Approach to Sustainable Bioethanol Supply Chain Design under Multiple Uncertainties. Ind. Eng. Chem. Res. 2016, 55, 237–256. [Google Scholar] [CrossRef]
- Lee, J.-C.; Lee, B.; Ok, Y.S.; Lim, H. Preliminary techno-economic analysis of biodiesel production over solid-biochar. Bioresour. Technol. 2020, 306, 123086. [Google Scholar] [CrossRef]
- SA8000; Social Accountability 8000. SAI Social Accountability International: New York, NY, USA, 2008.
- ISO 26000:2010; Guidance on Social Responsibility. ISO: Geneva, Switzerland, 2010.
- ETI. Base Code of the Ethical Trading Initiative. Available online: https://www.ethicaltrade.org/resources/eti-base-code (accessed on 2 February 2021).
- FLA. FLA Workplace Code of Conduct. Available online: https://www.fairlabor.org/our-work/code-of-conduct (accessed on 25 January 2021).
- Benoît, C.; Norris, G.A.; Valdivia, S.; Ciroth, A.; Moberg, A.; Bos, U.; Prakash, S.; Ugaya, C.; Beck, T. The guidelines for social life cycle assessment of products: Just in time! Int. J. Life Cycle Assess. 2010, 15, 156–163. [Google Scholar] [CrossRef]
- Liu, S.; Forrest, J.Y.L. Grey Systems: Theory and Applications; Springer Science & Business Media: Berlin/Heidelberg, Germany, 2010. [Google Scholar]
- Habib, M.S.; Sarkar, B. A multi-objective approach to sustainable disaster waste management. In Proceedings of the International Conference on Industrial Engineering and Operations Management, Paris, France, 26–27 July 2018; pp. 1072–1083. [Google Scholar]
- Habib, M.S. Robust Optimization for Post-Disaster Debris Management in Humanitarian Supply Chain: A Sustainable Recovery Approach. Ph.D. Thesis, Hanyang University, Seoul, Korea, 2018. [Google Scholar]
- Imran, M.; Salman Habib, M.; Hussain, A.; Ahmed, N.; Al-Ahmari, A.M. Inventory Routing Problem in Supply Chain of Perishable Products under Cost Uncertainty. Mathematics 2020, 8, 382. [Google Scholar] [CrossRef]
- Habib, M.S.; Maqsood, M.H.; Ahmed, N.; Tayyab, M.; Omair, M. A multi-objective robust possibilistic programming approach for sustainable disaster waste management under disruptions and uncertainties. Int. J. Disaster Risk Reduct. 2022, 75, 102967. [Google Scholar] [CrossRef]

Publisher’s Note: MDPI stays neutral with regard to jurisdictional claims in published maps and institutional affiliations. |
© 2022 by the authors. Licensee MDPI, Basel, Switzerland. This article is an open access article distributed under the terms and conditions of the Creative Commons Attribution (CC BY) license (https://creativecommons.org/licenses/by/4.0/).