Article

Future Drought and Flood Vulnerability and Risk Prediction of China’s Agroecosystem under Climate Change

State Key Laboratory of Earth Surface Processes and Resource Ecology, Faculty of Geographical Science, Beijing Normal University, Beijing 100875, China
*
Author to whom correspondence should be addressed.
Sustainability 2022, 14(16), 10069; https://doi.org/10.3390/su141610069
Submission received: 24 June 2022 / Revised: 4 August 2022 / Accepted: 8 August 2022 / Published: 14 August 2022
(This article belongs to the Special Issue Sustainability with Changing Climate and Extremes)

Abstract

:
Droughts and floods cause serious damage to agricultural production and ecosystems, and system-based vulnerability and risk prediction are the main tools used to address droughts and floods. This paper takes the agroecosystem as the research object, uses the vulnerability model based on “sensitivity–exposure–adaptability” and “vulnerability-risk, source-risk receptor” drought and flood risk models, and establishes multi-index prediction systems covering climate change, population, agricultural technology, economy, ecology, and other factors. Using a combination of AHP and the entropy weighting method, we predict the vulnerability and risk of droughts and floods in China’s agroecosystem under the SSP1-2.6, SSP2-4.5, and SSP5-8.5 scenarios from 2020 to 2050. The results show that as the scenario changes from SSP1-2.6 to SSP5-8.5 in turn, drought and flood vulnerability intensify, and the drought or flood vulnerability area expands to southern China. At the same time, future drought and flood risk patterns present the characteristics of high risk in Northeast, North, Central, and Southwest China. Therefore, major grain-producing provinces such as Heilongjiang and Henan need to do a good job of preventing and responding to agroecosystem drought and flood risks by strengthening regional structural and nonstructural measures.

1. Introduction

In the 1960s, international organizations and government agencies introduced vulnerability research into the scope of ecological research. With the continuous growth of the population, the scope of the global fragile ecological environment has increased significantly. The IPCC has officially released six scientific assessment reports on climate change [1,2,3,4,5], the purpose of which is to assess the scientific understanding of climate change, the impact of climate change, and possible countermeasures for the adaptation and mitigation of climate change.
A large number of scholars have successively carried out research on climate change vulnerability and risk. These studies used vegetation and ecological models and other simulation studies [6,7,8], indicators to assess climate change vulnerability and risk [9] or focused on adaptation measures and technological innovations for climate change risks [10,11,12,13]. Budiyono et al. [6] used vulnerability curves and flood risk assessment models; considered local factors related to hazards, exposure and vulnerability; assessing flood risk in Jakarta quantitatively, and they found that Jakarta is estimated to lose approximately US$321 million annually due to river flooding. Simane et al. [9] used the livelihood vulnerability index to study the resilience and vulnerability of five different agroecosystems in Choke Mountain communities in the Blue Nile Highlands of Ethiopia. They found that high-altitude sloping land and low-altitude steep land exhibited relatively low adaptive capacity and high vulnerability, but this study has drawbacks in regard to simplifying the internal characteristics of the community and ignoring the temporal variability of vulnerability.
Senyolo et al. [12] studied innovations in climate-smart agricultural technology at the farm level in South Africa and established a framework for classifying climate change risk, variability, and technological innovation. Drought-tolerant and early-maturing conservation agriculture, rainwater harvesting, and improved seed varieties were found to be the most suitable technologies for climate-smart agriculture in South Africa. Durowoju et al. [14] used monthly rainfall, temperature, soil moisture, vegetation condition index, normalized differential water index, and the land cover index to assess agricultural and hydrological drought vulnerability in the Kaduna River Basin in Nigeria. They found that the agricultural and hydrological drought and high vulnerability areas in this region account for about 18%. Meza et al. [15] used the drought index to calculate the comprehensive hazard index of irrigation and rain-fed systems and assessed the drought vulnerability and risk of irrigation and rain-fed agricultural systems on a global scale. The analysis shows that the drought risk of rainfed and irrigated agricultural systems presents a heterogeneous pattern on a global scale, with higher risks in southeastern Europe and Africa. Swami et al. [16] comprehensively assessed agriculture in Maharashtra, India, from 1966 to 2015 based on indicators such as monsoon and temperature changes, wasteland, scattered land holdings, human capital, physical capital, total assets, and land productivity vulnerability. The results showed that the agricultural system in the region is fragile, and regional-level variability in resource distribution, exposure, and sensitivity parameters was found, underscoring the importance of regional policy development in the region.
China is a large agricultural country, and agricultural production is vulnerable to climatic disasters, causing serious damage. Therefore, the main research object of domestic scholars is the agricultural system [17,18,19,20,21,22]. Zhou [17] analyzed the changing laws and trends of agricultural droughts, floods, and other meteorological disasters, such as climatic resources, diseases, and insect pests in China under global change. He found that with the continuous warming of the global climate and the frequent occurrence of catastrophic events, China’s agricultural meteorological disasters also showed a significant trend of change. Xu et al. [20] showed that the agriculture and food system, as an important area for addressing climate change and comprehensive adaptation measures from the supply and demand side, can effectively reduce food waste and greenhouse gas emissions from agricultural sources and can increase the resilience of agricultural systems.
There are various approaches for assessing climate change vulnerability and risk, each with its own advantages and disadvantages. The biological ecological simulation method is based on theories of natural ecosystems, simulating the energy and material exchange processes between climate, soil, water, and organisms quantitatively; however, the establishment and application of comprehensive ecological models often requires interdisciplinary research by several different professional fields and work teams. The method of indicator evaluation has strong operability, but it is necessary to ensure the scientificity and rationality of the selection of evaluation indicators. At the same time, the index weighting methods of most studies are single and subjective. In addition, the main object of vulnerability and risk assessment in most studies is the ecosystem, agricultural system, economic system, or other relatively single system. Although a few studies have taken the agroecosystem as the research object, and most assessments have included static vulnerability and risk assessments, they have rarely considered different shared socioeconomic pathways (SSPs).
Therefore, this paper adopts multi-index comprehensive prediction methods based on the “sensitivity–exposure–adaptability” vulnerability framework. We established multilevel indicator evaluation systems for the drought and flood vulnerability of agroecosystems. To improve the scientificity and rationality of the evaluation indicator empowerment and evaluation, this study uses both subjective and objective weighting methods; that is, combining the AHP and entropy weight methods and assigning weights to the projection indicators of drought or flood vulnerability of agroecosystems, respectively. To explore the distribution pattern and difference in drought or flood vulnerability of agroecosystems caused by climate change under different shared socioeconomic pathways in the future, we use multiclimate model ensemble data under SSP1-2.6, SSP2-4.5 and SSP5-8.5, predicting the drought or flood sensitivity, exposure, adaptability and vulnerability of agroecosystems under three future shared socioeconomic scenarios from 2020 to 2050. On this basis, we use an agroecosystem drought or flood risk prediction model, considering vulnerability, risk source, and risk receptors, to predict the drought or flood risk of China’s agroecosystem and compare the vulnerability and risk status of agroecosystems under different shared socioeconomic scenarios from 2020 to 2050.

2. Data and Methods

The research area of this paper includes 31 provincial administrative units in China, except for Hong Kong, Macao and Taiwan.

2.1. Climate Data and Population Data

The data of future climate scenarios are selected from the data output by 22 global climate models in the Sixth International Coupling Model Intercomparison Project (CMIP6) (https://esgf-node.llnl.gov/projects/cmip6)(accessed on 5 January 2022). The specific information on the selected climate model can be found in Appendix A, Table A1. The data include three SSP scenarios from 2020 to 2050: the monthly average temperature and precipitation under low-forcing scenario SSP1-2.6, medium-forcing scenario SSP2-4.5, and high-forcing scenario SSP5-8.5. We first interpolate the monthly scale data from the climate model to meteorological stations. Then, we refer to a new statistical downscaling method based on random weather generators in Liu and Zuo [23], correct the monthly scale data of the climate model based on the observation data and feed them into the random weather generator, generating climate prediction data from 699 reference weather stations in China.
The future population data includes multi-dimensional population prediction grid data (0.5° × 0.5°) under the SSP1-2.6, SSP2-4.5, and SSP5-8.5 scenarios from 2020 to 2050 [24]. We use GIS to add population grid data of the same provincial administrative unit to the future provincial population data. Finally, the population forecast data of each provincial administrative unit from 2020 to 2050 are obtained.

2.2. Socioeconomic and Agroecological Data

The agroecological and socioeconomic data used in this study are mainly from the China Statistical Yearbook [25] by the National Bureau of Statistics of China, and the statistical data of China’s forest resources inventory results [26]. The data categories include agricultural disaster-affected area, agricultural fertilizer use, gross production value of agriculture, forestry, animal husbandry and fishery, GDP per capita, total power of agricultural machinery, total reservoir capacity, flood control area, grain sown area, per capita water resources, agricultural ecological water consumption, and forest area.

2.3. Methods

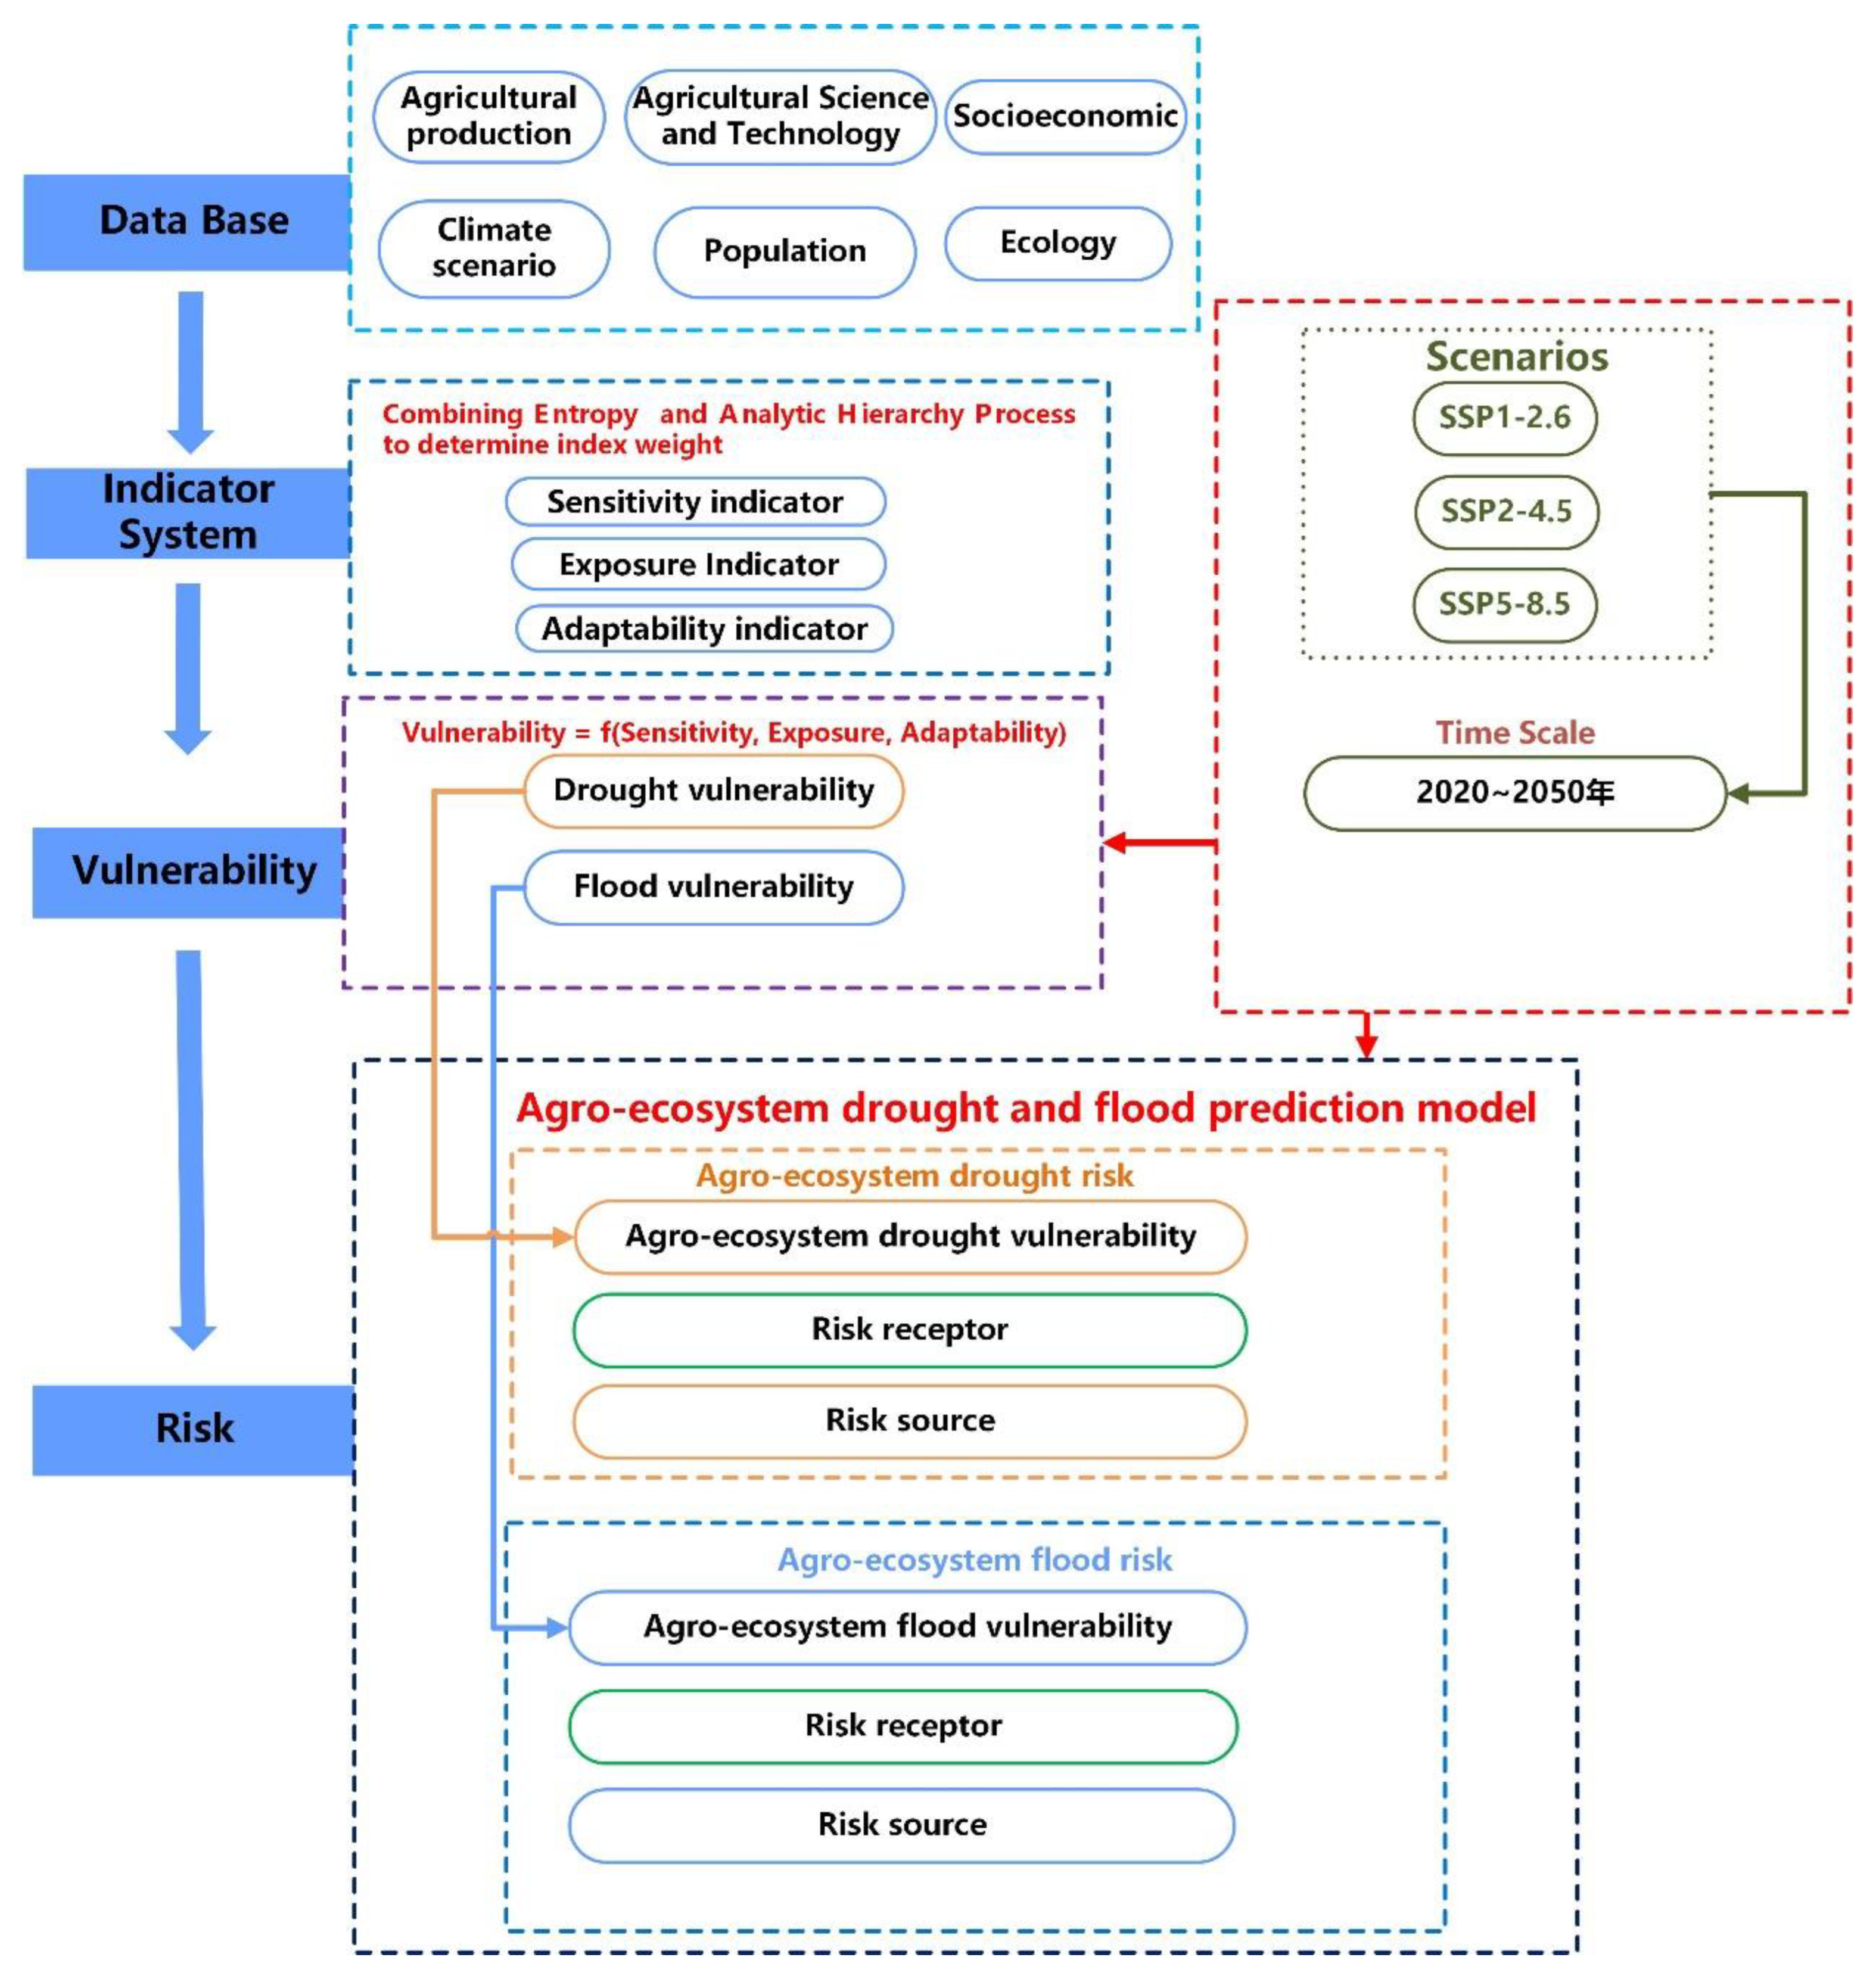
2.3.1. Agroecosystem Vulnerability Prediction Model

To conduct scientific and accurate agroecosystem vulnerability predictions for each provincial administrative unit in China and build drought or flood prediction indicator systems for the vulnerability of agroecosystems, we use the “sensitivity–exposure–adaptability” vulnerability model in the IPCC [3,4,27]. This paper considers vulnerability as the degree to which a system is susceptible or unable to cope with the adverse effects of climate change, typically characterized by high sensitivity to damage, high exposure, and low adaptive capacity, as shown below. Among them, adaptability is defined as the external support of assisting a province to adapt to the hazards. It does not refer to the resilience phase of a system’s adaptation to a hazard after experiencing it. We use indicators that reflect ecosystem service functions, economic and agricultural science and technology development factors in human agricultural activities, and corresponding adaptation measures to define resilience. Since the higher the vulnerability is, the smaller the adaptability is. In the data preprocessing link, this paper reversely normalizes the adaptability index data [28,29].
Vulnerability = f (Sensitivity, Exposure, Adaptability)

2.3.2. Combination of AHP and the Entropy Weight Method to Determine the Weight

AHP is a method of subjectively determining the weight of indicators. It mainly decomposes the evaluation objectives into different levels and indicators, and compares and calculates the indicators at the same level to determine the weights of different evaluation indicators [30,31].
The entropy weight method is an objective analysis method that determines the relative weight of each index in the comprehensive evaluation by the degree of dispersion between the evaluation index values. The main calculation steps are as follows:
First, the corresponding evaluation matrix is constructed.
A = [ Y n 1 , Y n 2 , Y n m ]
Second, the data are normalized.
Y i j = Y i j m i n { Y j } m a x { Y j } m i n { Y j }
Third, the proportion P i j of the i-th province under the j-th indicator is determined.
P i j = x i j k = 1 n x i j , i = 1 , 2 , , n ,   j = 1 , 2 , m
Fourth, the entropy value e j of the jth index is determined.
e j = 1 / l n n × i = 1 n P i j × l n ( P i j )
Fifth, the jth index difference coefficient d j and weight w j are determined.
d j = 1 e j
w j = d j k = 1 m d j
In this study, we use both the analytic hierarchy process and the entropy weight method to weigh the index. The AHP has been relatively and maturely applied to the determination of the weight of a multi-index system. The advantage of the entropy weight method is that it considers the objective numerical characteristics of the data. The combination of the two to determine the weight not only reflects the actual importance of each vulnerability prediction index but can also reflect the objective characteristics of each data point, making the weight of the vulnerability prediction index more scientific and reasonable [32,33].
In determining the selection method of the combination weight, we adopt the revised formula proposed by Wang et al. [34] by analyzing the problems existing in the commonly used subjective and objective combination weighting formulas. That is, the original common formula: z j = v j w j / m is revised to: z j = ( v j + w j ) / m , and the combined weighting calculation formula is derived from this formula, as shown below:
z j = ( v j + w j ) / 2
where n denotes the number of each evaluation index, m denotes the number of each province, Y i j denotes the element in the ith row and jth column of matrix A, v j is the weight determined by the analytic hierarchy process, w j is the weight determined by the entropy weight method, and z j is the weight determined by the combined weighting (Figure 1 and Figure 2).

2.3.3. Agroecosystem Drought and Flood Risk Prediction Model

This study is based on the research by Xu et al. [35] and IPCC [5,27] on climate change and natural disaster risk. The drought and flood risks of agroecosystems in the context of climate change can be expressed as a functional formula of risk source, risk receptor, and vulnerability, and the multiplication of the three is the fundamental relationship. We use R = f(H, V, E) to predict the drought risk or flood risk of China’s agroecosystem under the SSP1-2.6, SSP2-4.5, and SSP5-8.5 scenarios from 2020 to 2050. Among them, the risk source refers to the frequent occurrence of drought or flood risk sources in China, and the intensity is expressed as the probability of occurrence over the next 30 years. The risk receptor, namely, the agroecosystem, is expressed by characterizing nine agroecosystem values, including food production, soil formation and protection, climate and gas regulation, and water conservation. Vulnerability represents drought vulnerability or flood vulnerability of agroecosystems. In addition, the product of agroecosystem value and vulnerability is the possible loss of the region and is then multiplied by the probability of drought or flooding to obtain the risk of agroecosystem drought or flooding. The equations are as follows:
R y = H y × V y × E
R Z = H Z × V Z × E
H y = n N
H z = m M
E = P × A × α
where R y is the drought risk of the agroecosystem in each province. H y is the drought probability of the agroecosystem in each province; that is, the probability of occurrence of moderate drought, severe drought and extreme drought in a certain area from 2020 to 2050 [36]. V y is the agroecosystem drought vulnerability in each province. E is the total value of agroecosystem services in a certain region of China. R z is the flood risk of the agroecosystem in each province. H z is the flood probability of the agroecosystem in each province; that is, the probability that the daily precipitation will reach a certain condition in a certain area from 2020 to 2050. V z   is the agroecosystem flood vulnerability in each province. n denotes the total number of months in which the drought in a certain area reaches the level of moderate drought, severe drought, and extreme drought. N denotes the total number of months in the desired year, which is 372. m denotes the total number of days with daily precipitation greater than or equal to the average daily precipitation in a certain area from 2020 to 2050. M denotes the total number of days in the desired year, which is 11,315. P is the total value of 9 ecological services per unit area of agroecosystem in the average state of China in the early 21st century, which is 6114.3 [37,38,39]. A is the area of the agroecosystem in each region, and this study uses the area of agricultural vegetation coverage; that is, the sown area of grain in each region. α denotes the ratio of the estimated annual economic price of ecological services to the economic price of ecological services in the early 21st century and uses the growth rate β of the consumer price index to calculate, which is α = ( 1 + β ) 30 . The average growth rate of China’s consumer price index is assumed to be 0.03 [40], and α is 2.4.
The flow chart is shown in Figure 3.

3. Results and Discussion

3.1. Vulnerability Estimation

In a previous study [33], we selected sensitivity, exposure, and adaptability evaluation indicators based on the “sensitivity–exposure–adaptability” vulnerability assessment framework. We built an evaluation index system separately for China’s agroecosystem drought or flood sensitivity, exposure, adaptability, and vulnerability from 1991 to 2019 and conducted corresponding evaluations. The results of vulnerability assessment in the past 30 years showed that the drought–flood vulnerability of China’s agroecosystem denotes a weakening trend from the central part to the surrounding areas of China, and the central provinces of Henan and Hubei are at the high drought–flood vulnerability level [33]. To ensure the accuracy of China’s agroecosystem vulnerability estimation and the continuity of research in the next 30 years, we explore the distribution pattern and change in China’s agroecosystem vulnerability under different shared socioeconomic scenarios. Based on previous assessment work, we predict the drought vulnerability and flood vulnerability of China’s agroecosystem from 2020 to 2050.

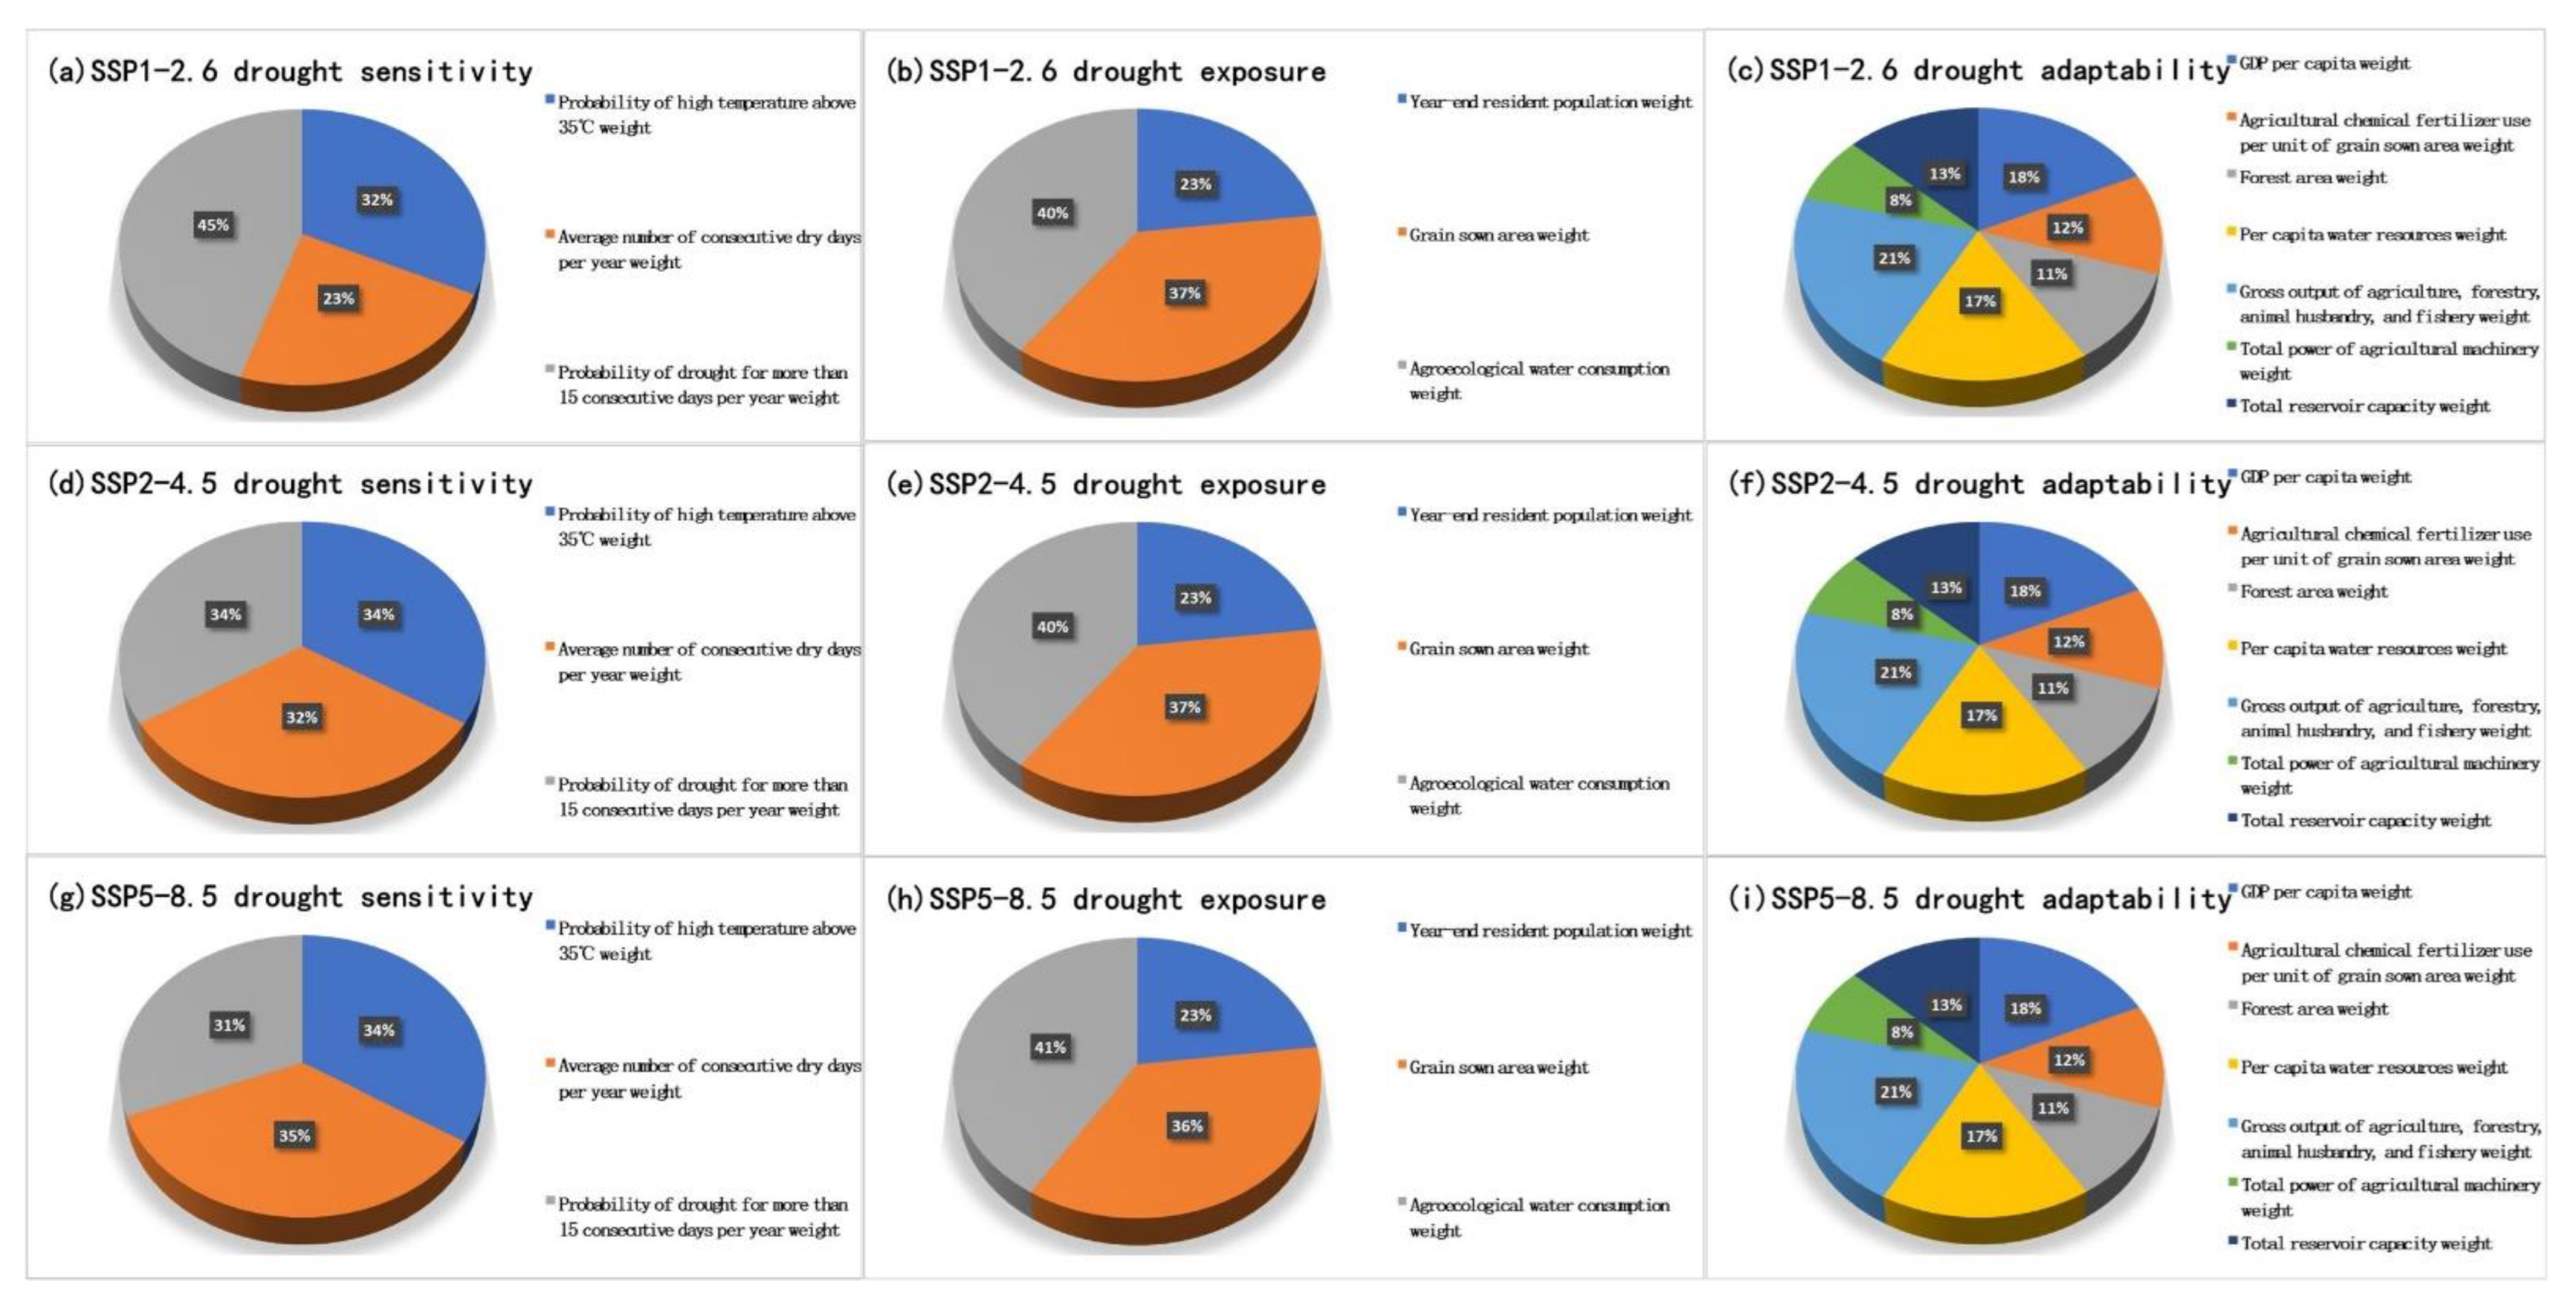
3.1.1. Results of the Construction of the Drought Vulnerability Prediction Index System

In this study, the drought vulnerability prediction index system is constructed based on the vulnerability model (Table 1). Meteorological indicators that combine temperature and rainfall are used to construct drought sensitivity indicators for 2020~2050. The National Meteorological Administration of China is used to define the probability of occurrence of China’s high temperature yellow warning at 35 °C to characterize the state of surface evaporation [41], and the surface water budget is characterized by precipitation to indirectly quantify the water budget of the agroecosystem [42]. Considering that the three major food crops in China, rice, maize, and wheat, are most vulnerable to climate change, the growth length of the critical period of water demand is usually 15–30 days [43,44,45,46]. April to September is considered to be the main growth period of most food crops in food production activities [47,48,49,50]. We use the probability of the occurrence of drought for more than 15 consecutive days and the average annual number of consecutive drought days to scientifically describe the drought status of crops and determine the drought sensitivity of agricultural ecology.
When constructing the drought exposure index in this paper, not only are the population and grain sown area considered, but three different socioeconomic path factors in the future are also included in the future population changes in different provinces. The country’s basic agricultural policies and development planning factors are incorporated into the changes in the sown area of food crops, and agroecological water consumption is also included in the vulnerability analysis of agroecological drought as an assessment indicator of the degree of human participation in arid environmental exposure.
Drought adaptability is the ability to avoid or mitigate losses due to climate change risk by improving the level of science and technology and enhancing the ability to resist disasters when human beings realize the task of addressing adverse and imminent environmental changes [51]. To explore drought vulnerability in response to future extreme climate change based on the current level of drought adaptability, this study assumes that the drought resilience in 2020~2050 is the same as that in 1991–2019. Therefore, we select seven indicators, including the GDP per capita, per unit grain use of agricultural chemical fertilizers, gross production value of agriculture, forestry, animal husbandry and fishery, forest area, per capita water resources, total power of agricultural machinery, and total reservoir capacity.

3.1.2. Drought Vulnerability of China’s Agroecosystem from 2020 to 2050

According to the grading threshold of drought vulnerability from 1991 to 2019 delineated by the standard deviation grading method [33,52], this paper divides the drought vulnerability in the next 30 years into three grades: low, medium, and high. The results show (Figure 4) that in the next 30 years, as the shared socioeconomic scenario increases from SSP1-2.6 to SSP5-8.5, the drought vulnerability of China’s agroecosystem will gradually increase. In the SSP1-2.6 scenario, the only low-drought vulnerable province is Sichuan Province, and fourteen provinces, including Heilongjiang, Liaoning, Beijing, Guizhou, Hunan, and Guangdong, are located in drought-vulnerable areas in the agricultural ecosystem. More than half of the provinces, such as Yunnan, Fujian, and Shaanxi, which are concentrated in Northwest, Central, and East China, are located in areas with high drought vulnerability. Under the SSP2-4.5 scenario, the vulnerability of China’s agroecosystem is divided into two levels: medium and high drought vulnerability. Compared with the SSP1-2.6 scenario, the range of provinces with high drought vulnerability expands to the central and southern regions of China, and the drought vulnerability of the Henan, Hunan, and Guangdong agroecosystems rises to the level of high drought vulnerability. In the SSP5-8.5 scenario, the range of provinces with high drought vulnerability further extends to southern China compared with the SSP2-4.5 scenario, and the agroecosystem drought vulnerability in Guizhou, Yunnan, and Guangxi rises to the high drought vulnerability level. In summary, as the shared socioeconomic scenarios increase from SSP1-2.6 to SSP2-4.5 and SSP5-8.5, the drought vulnerability of China’s agroecosystem increases overall, and the scope of provinces with high drought vulnerability gradually expands to the central and southern regions.

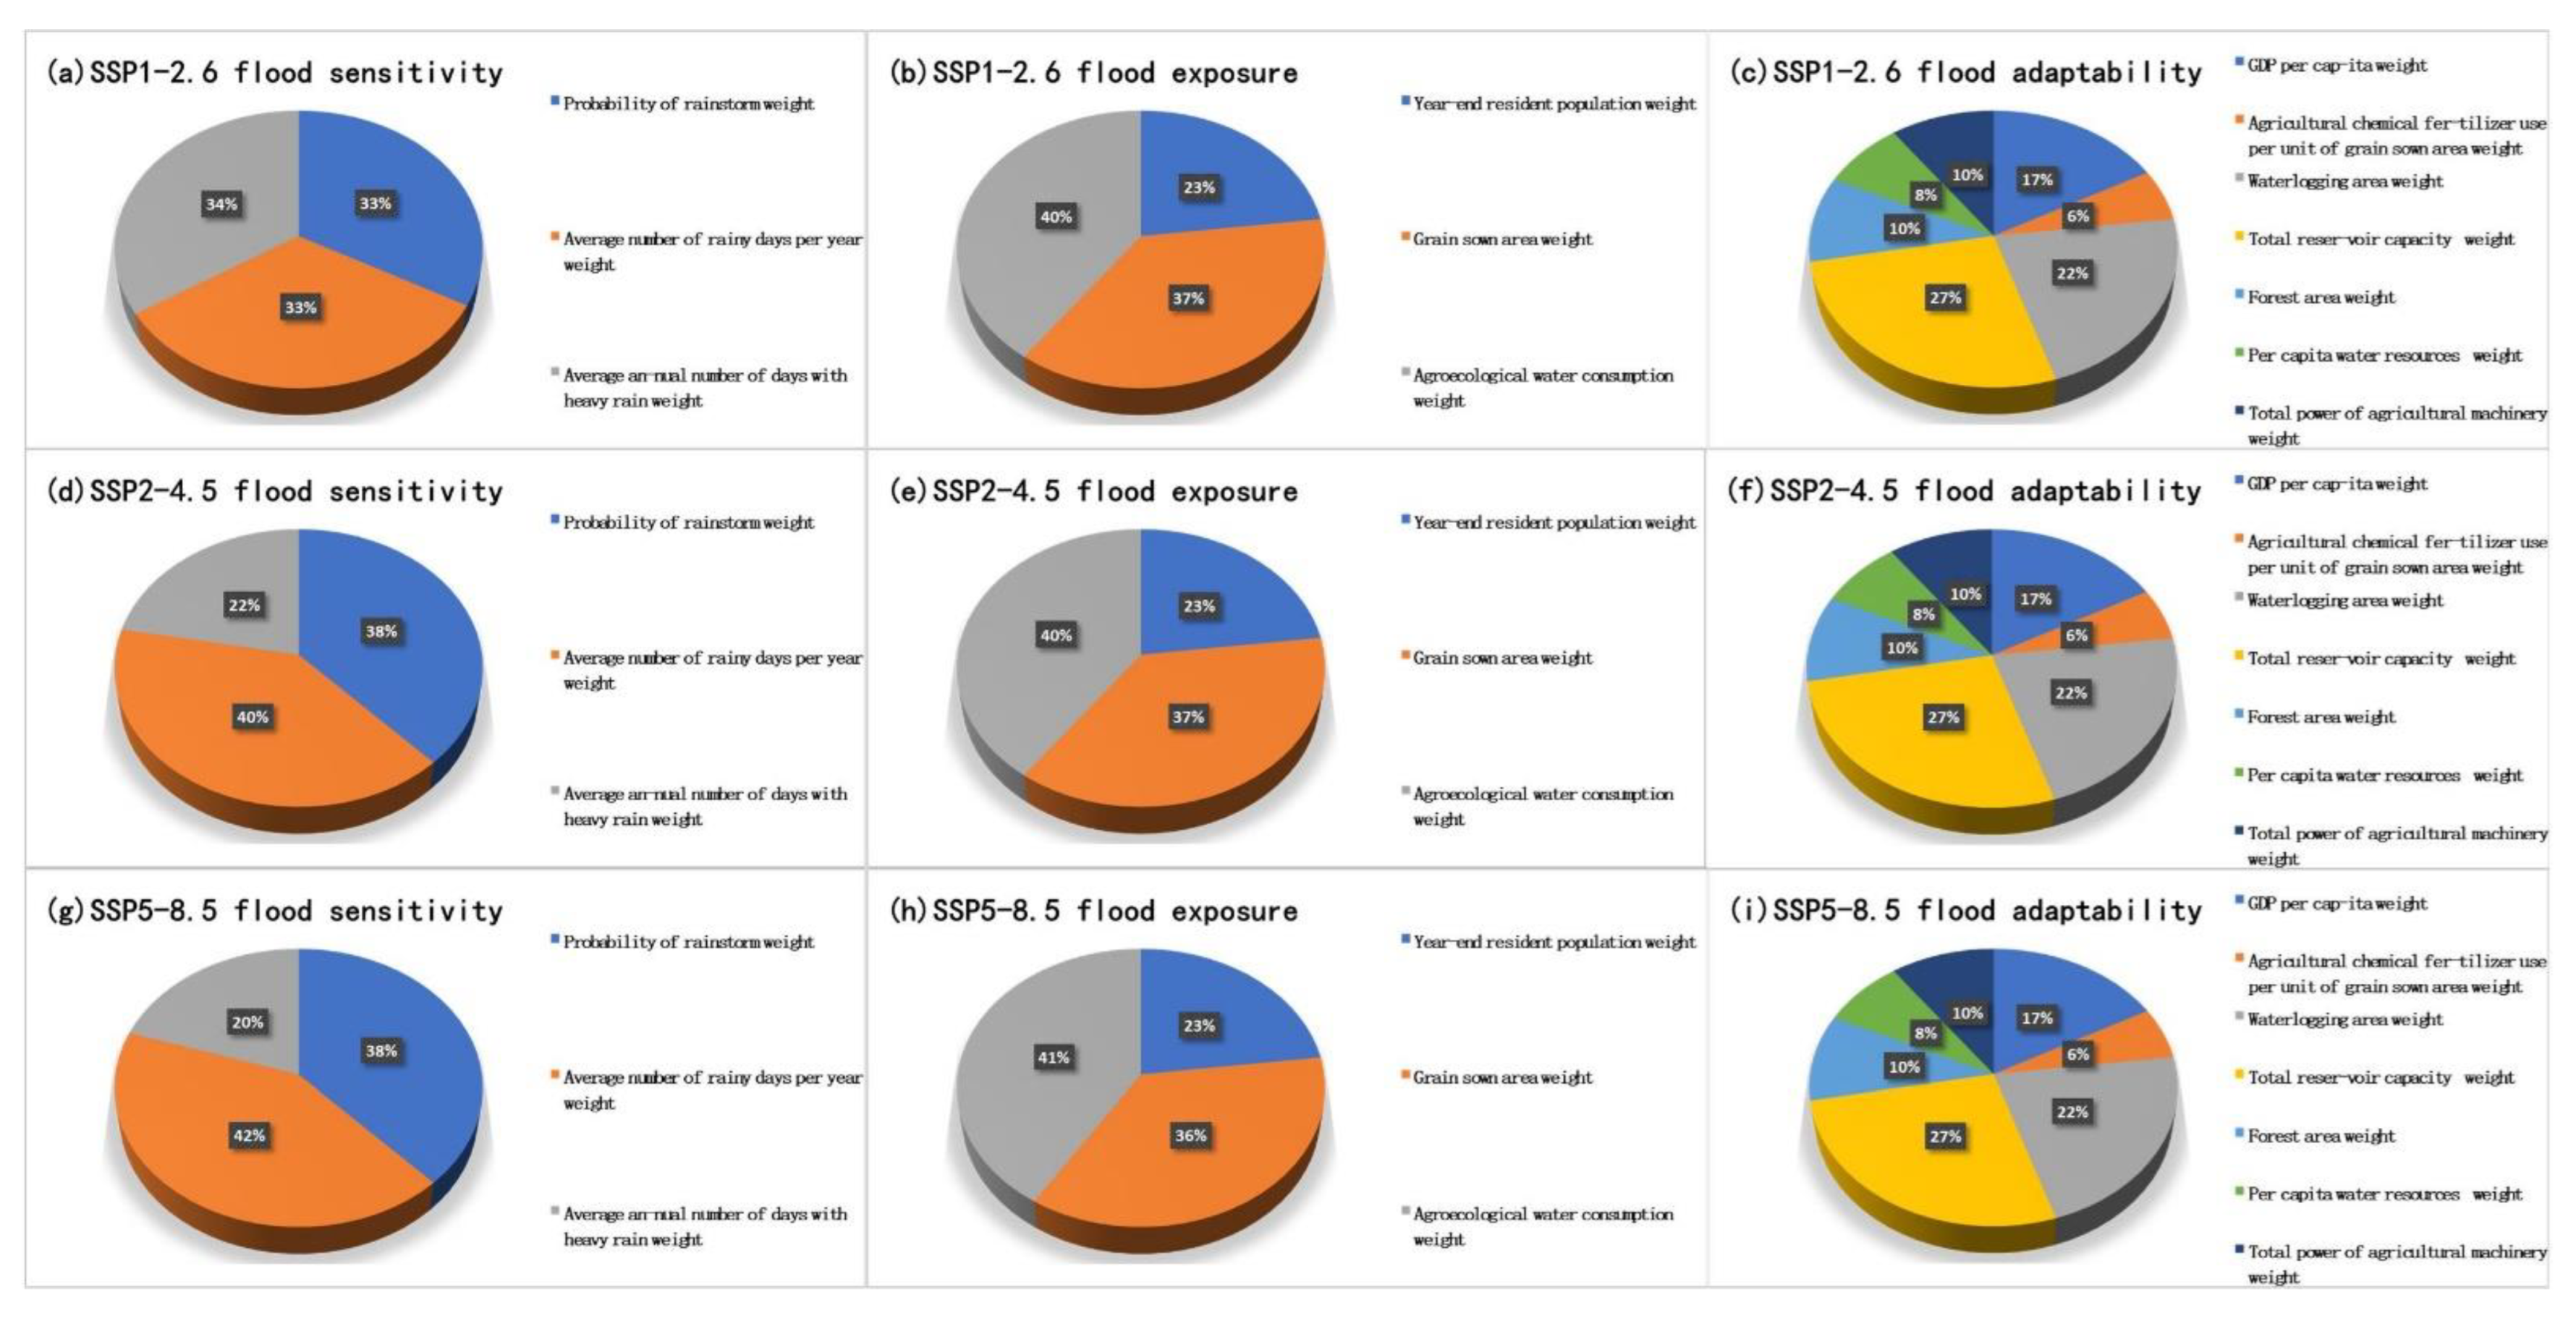
3.1.3. Construction of the Flood Vulnerability Prediction Index System

This study builds a flood vulnerability prediction index system based on the vulnerability model (Table 2). Generally, floods are characterized by a certain order of magnitude, and long-term continuous precipitation leads to submerged or stagnant water in low-lying areas. In this study, the probability of occurrence of heavy rain, the average annual number of heavy rain days, and the average annual number of heavy rain days are used to construct the flood sensitivity index from 2020 to 2050. Flood exposure refers to the order of magnitude of population, production, and living, ecosystem life and environmental service functions, and infrastructure or economic and cultural assets that may be affected by flood disaster losses.
Flood adaptability refers to the active coping and adaptation capabilities brought about by direct and indirect service functions of ecosystems, human-led agricultural science, technology, and economic development factors. To explore flood vulnerability in response to future extreme climate change based on the current flood adaptability level of each province, this study assumes that the flood adaptability from 2020 to 2050 is the same as that from 1991 to 2019. Therefore, this paper uses per capita GDP and unit grain sown area to utilize agricultural chemical fertilizers. This is characterized by seven indicators: scalar volume, flood control area, forest area, per capita water resources, total power of agricultural machinery, and total reservoir capacity.

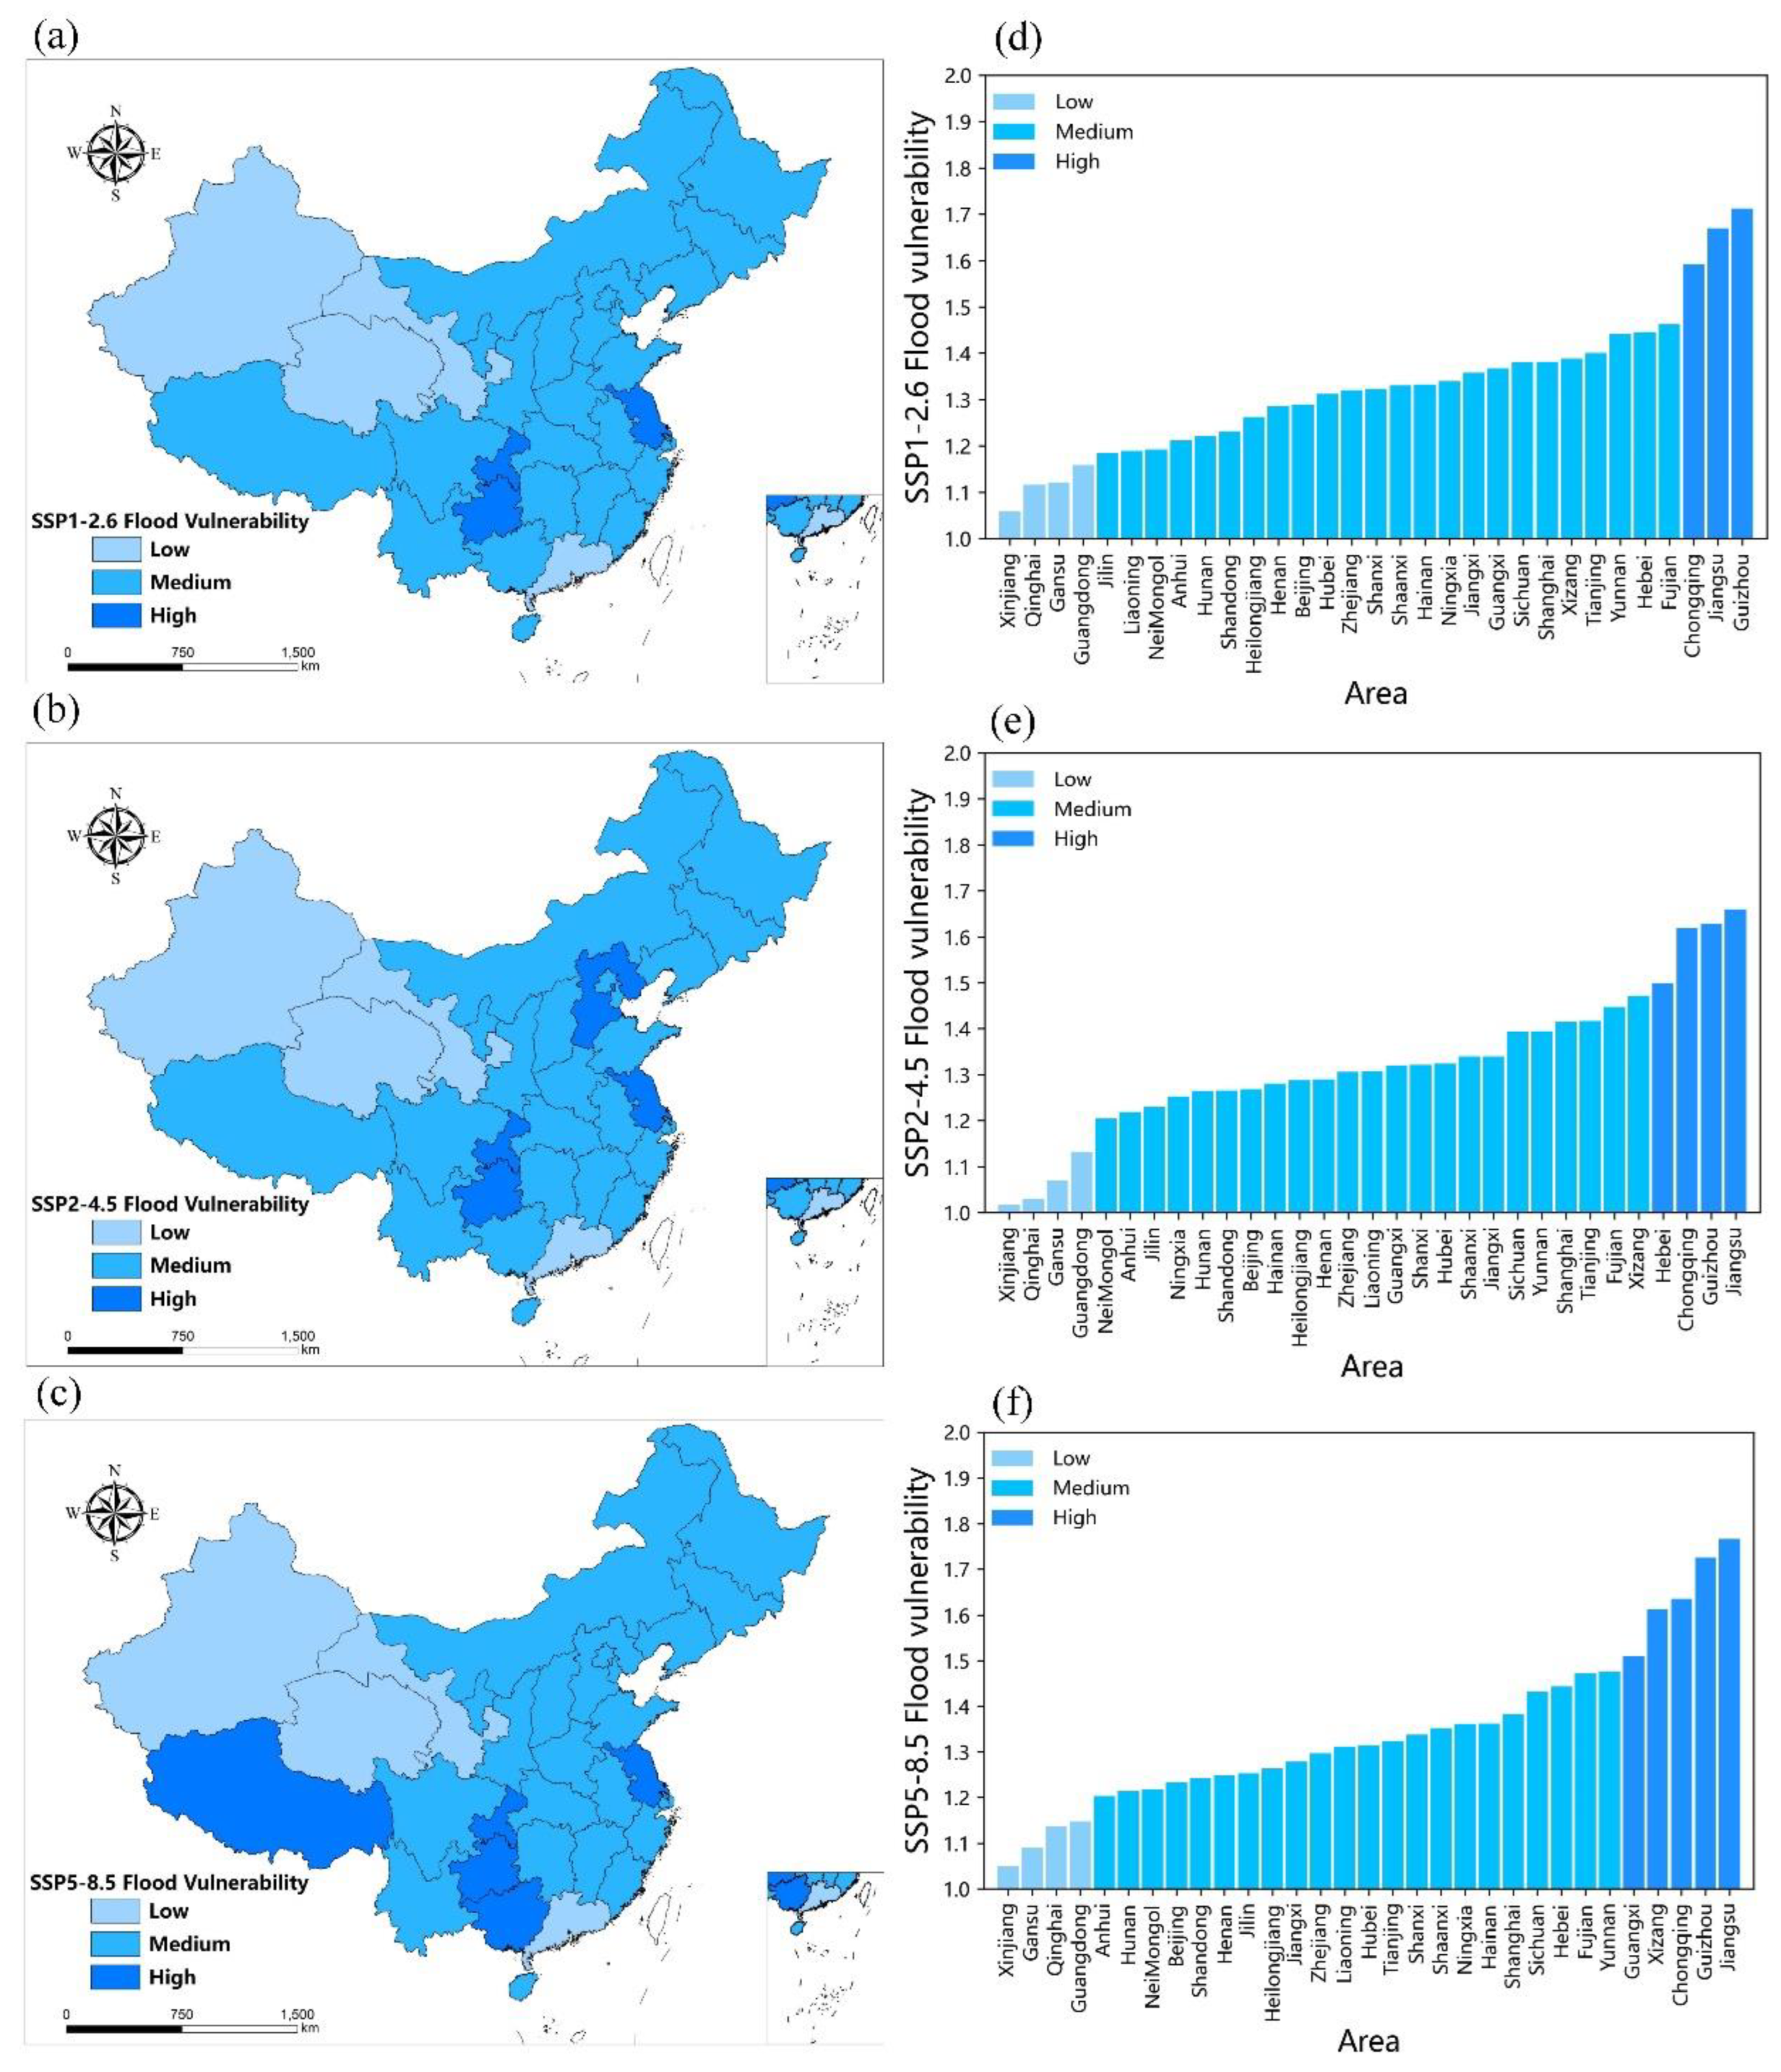
3.1.4. Flood Vulnerability of China’s Agroecosystem from 2020 to 2050

The results of the study on the distribution pattern and changes in vulnerability to floods in China’s agroecosystem under different SSP scenarios from 2020 to 2050 show that (Figure 5) as the shared socioeconomic scenarios increase from SSP1-2.6 to SSP5-8.5 in turn, the degree of China’s agroecosystem flood vulnerability increases slightly, and the number of provinces with high flood vulnerability increases. Under the SSP1-2.6 scenario, areas with high flood vulnerability include Jiangsu, Chongqing, and Guizhou. Under the SSP2-4.5 scenario, Hebei is added to the provinces with high flood vulnerability. Under the SSP5-8.5 scenario, Guangxi and Tibet are added to the provinces with high flood vulnerability. In addition, under the three SSP scenarios, the areas with low flood vulnerability include Xinjiang, Qinghai, Gansu, and Guangdong, which may be due to the small amount of annual precipitation in the northwestern region and the insignificant fluctuation of precipitation. As a relatively developed province in South China, Guangdong has strong flood control and disaster-resistance agricultural infrastructure, as well as flood-resistance and emergency-rescue capabilities. Therefore, the agroecosystem flood vulnerability in Xinjiang, Qinghai, Gansu, and Guangdong Provinces will be lower under the three different climate scenarios in the future. At the same time, with the increase in greenhouse gas emissions, the fluctuation in precipitation in the southwestern region will intensify. In addition, the terrain of the southwestern region is complex, and extreme precipitation and flood disasters are prone to occur. Therefore, the agroecosystems in Tibet, Chongqing, Guizhou, and Guangxi in the southwestern region are more vulnerable to floods.
It is worth noting that under the three SSP scenarios, Jiangsu has a high level of flood vulnerability, which may be because Jiangsu is a coastal area, and climate warming causes high precipitation intensity and frequency. The ability to cope with heavy precipitation and floods is weak; therefore, the vulnerability of agroecosystems to floods is high. In conclusion, as the shared socioeconomic scenarios change from SSP1-2.6 to SSP5-8.5, the overall flood vulnerability of China’s agroecosystem increases slightly, and the range of provinces with high flood vulnerability shows a trend of extending to the southwest.

3.2. Risk Estimation

This paper argues that the drought or flood risk of China’s agroecosystem under climate change can be expressed as a functional equation of the combined action of risk source, risk receptor, and vulnerability. Among them, vulnerability is the consequence of the factors acting on risk. In the previous part of this study, we conducted drought or flood vulnerability projections of China’s agroecosystem over the next 30 years. To further explore the risk distribution and changing characteristics of China’s agroecosystem in the next 30 years, the accuracy of drought risk or flood risk prediction research has been enhanced. We also considered risk sources and risk receptors and assessed drought or flood risk in China’s agroecosystem from 1991 to 2019, and the assessment results are shown in Appendix A Figure A1 and Figure A2. In addition, to ensure the continuity of risk research work, we predicted the drought or flood risk in China’s agroecosystem from 2020 to 2050.

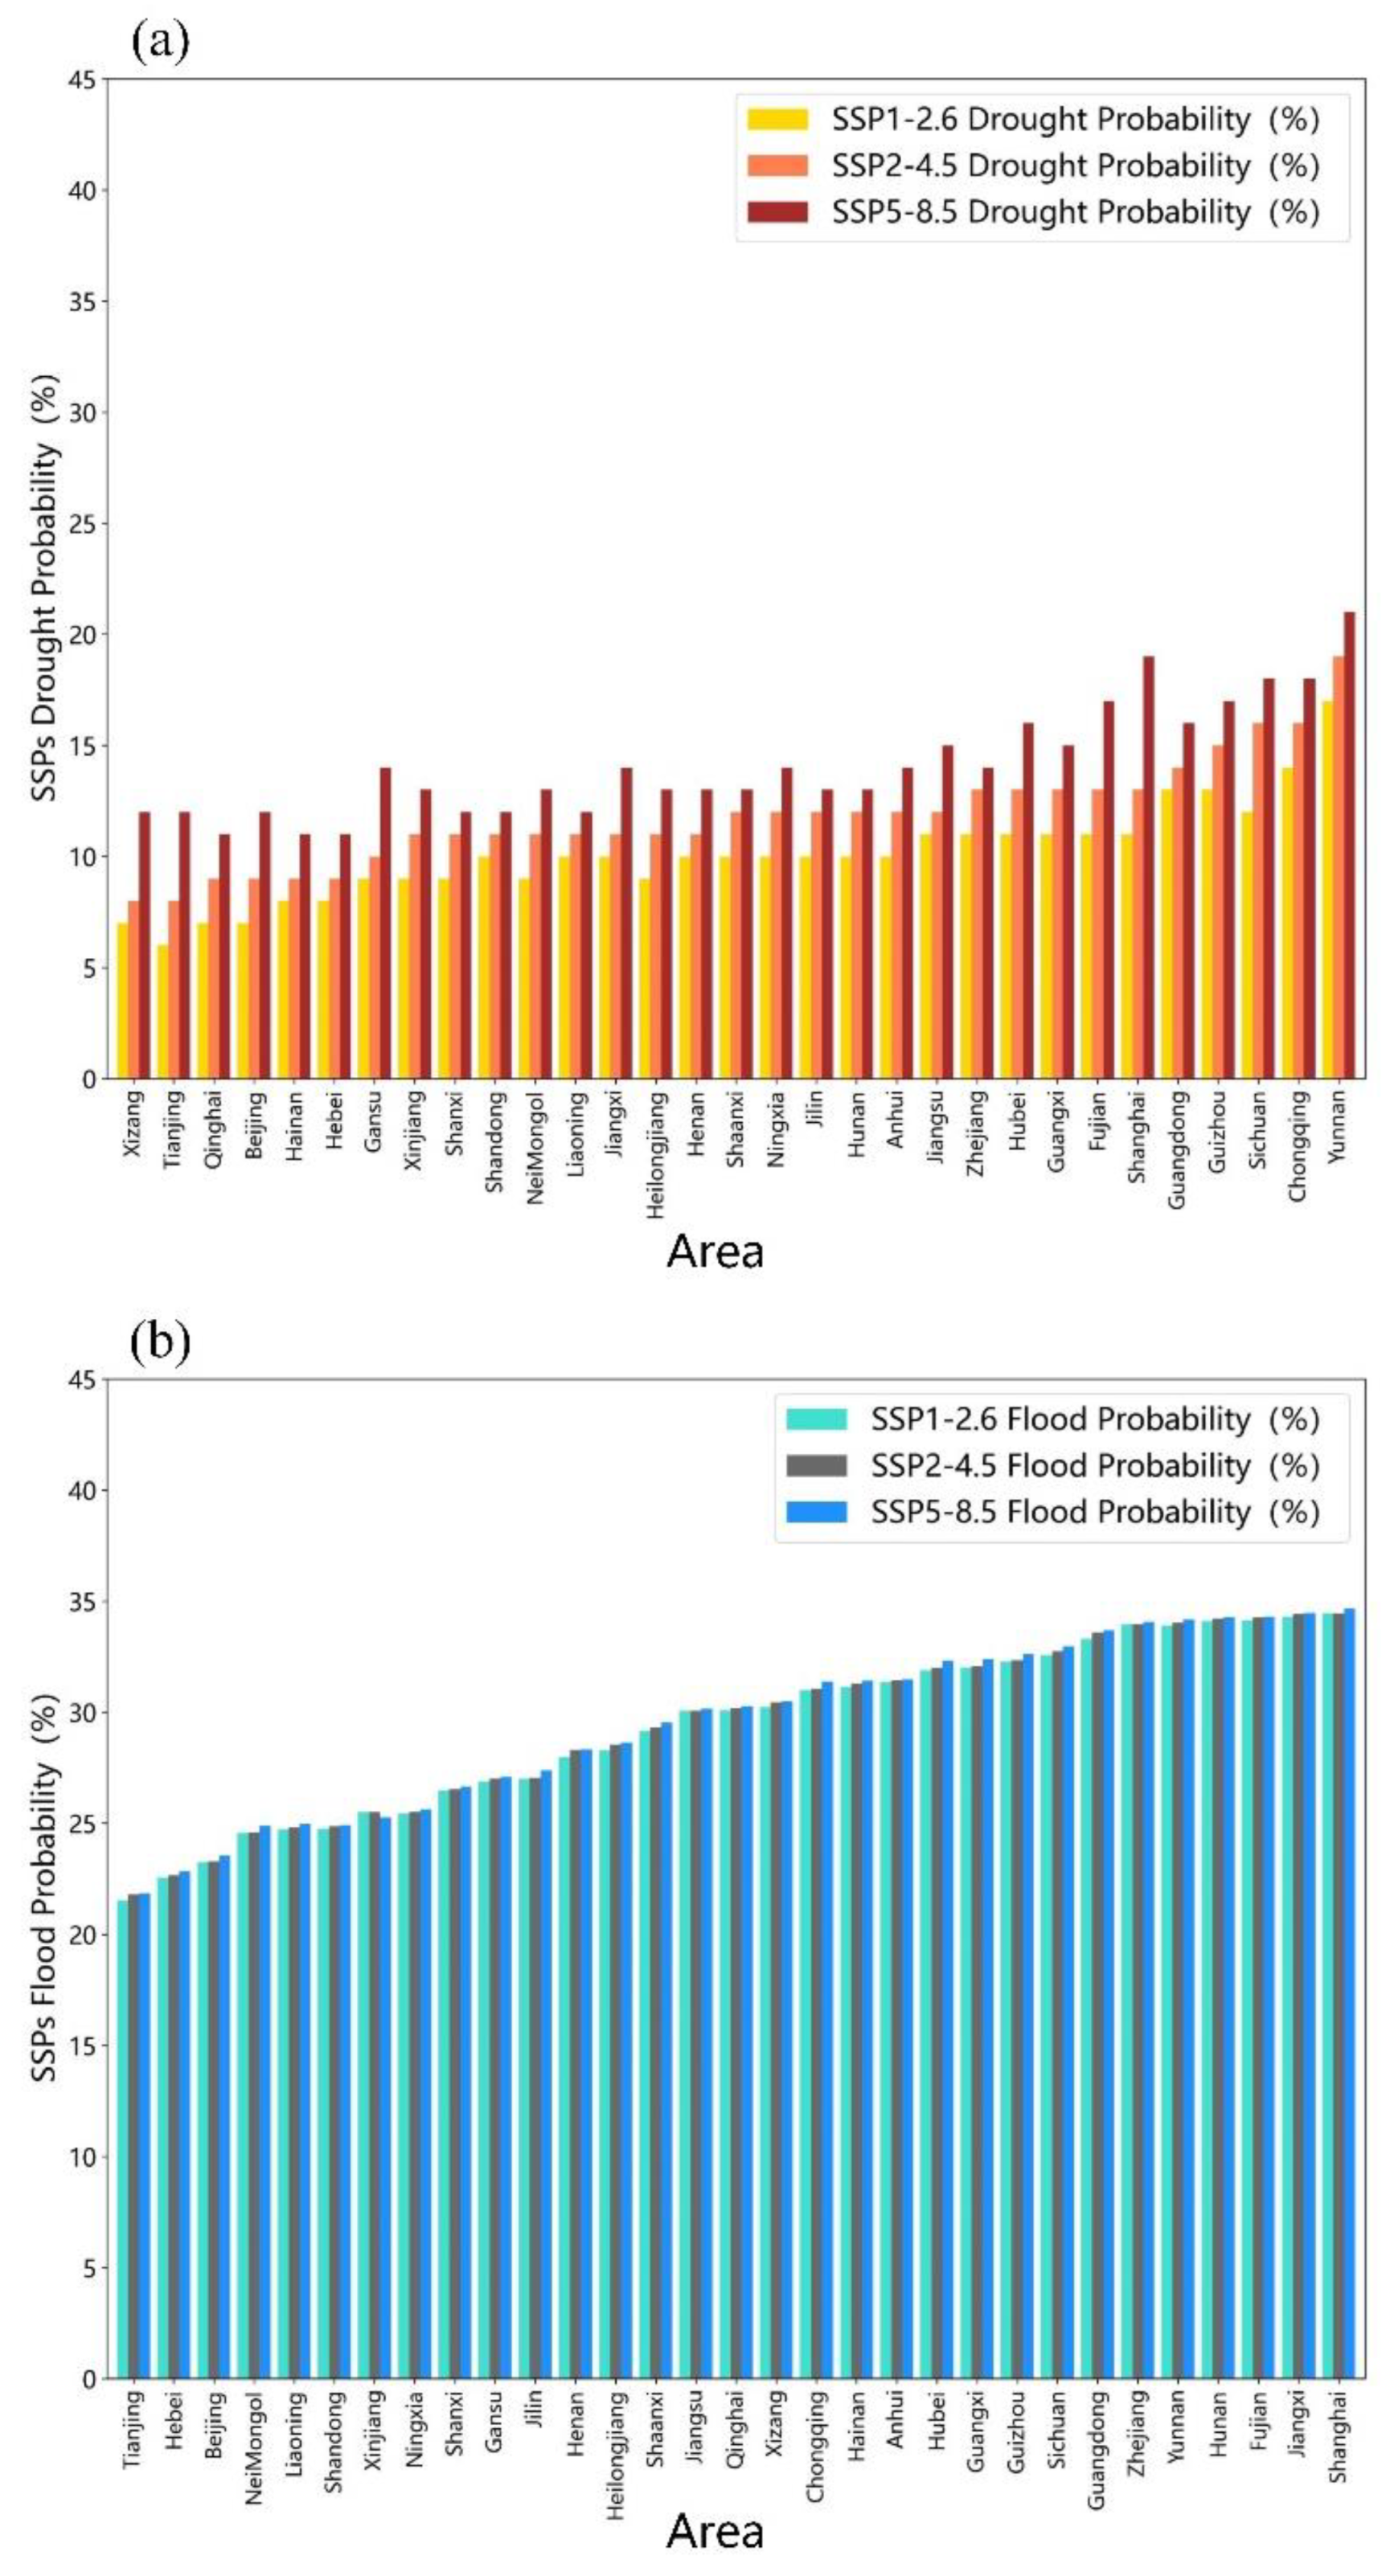
3.2.1. Probability of Drought and Flooding in China’s Agroecosystem from 2020 to 2050

From 2020 to 2050, the probability of drought in China’s agroecosystem under the three SSP scenarios shows that (Figure 6a) as the shared socioeconomic scenario changes from SSP1-2.6 to SSP5-8.5 in turn, the probability of drought in each province continuously increases. Under the SSP1-2.6 scenario, the probability of drought occurrence in each province is 6–17%. Under the SSP2-4.5 scenario, the probability of drought occurrence in each province is 8–19%. Under the SSP5-8.5 scenario, the probability of drought occurrence in each province is 11–21%. Moreover, under the three different scenarios, the probability of the occurrence of drought in southwestern regions such as Sichuan, Chongqing, and Yunnan is slightly higher.
In addition, the probability of floods in the next 30 years shows (Figure 6b) that as the scenarios change from SSP1-2.6 to SSP5-8.5 in turn, the probability of floods in each province increases slightly. In the SSP1-2.6 and SSP2-4.5 scenarios, the probability of flooding in each province is 22–34%. In the SSP5-8.5 scenario, the probability of flooding in each province is 22–35%. At the same time, under the three SSP scenarios over the next 30 years, the probability of flooding in central and southern China, such as Hunan, Fujian, Jiangxi, and Shanghai, is higher than that in northern and northwestern China.

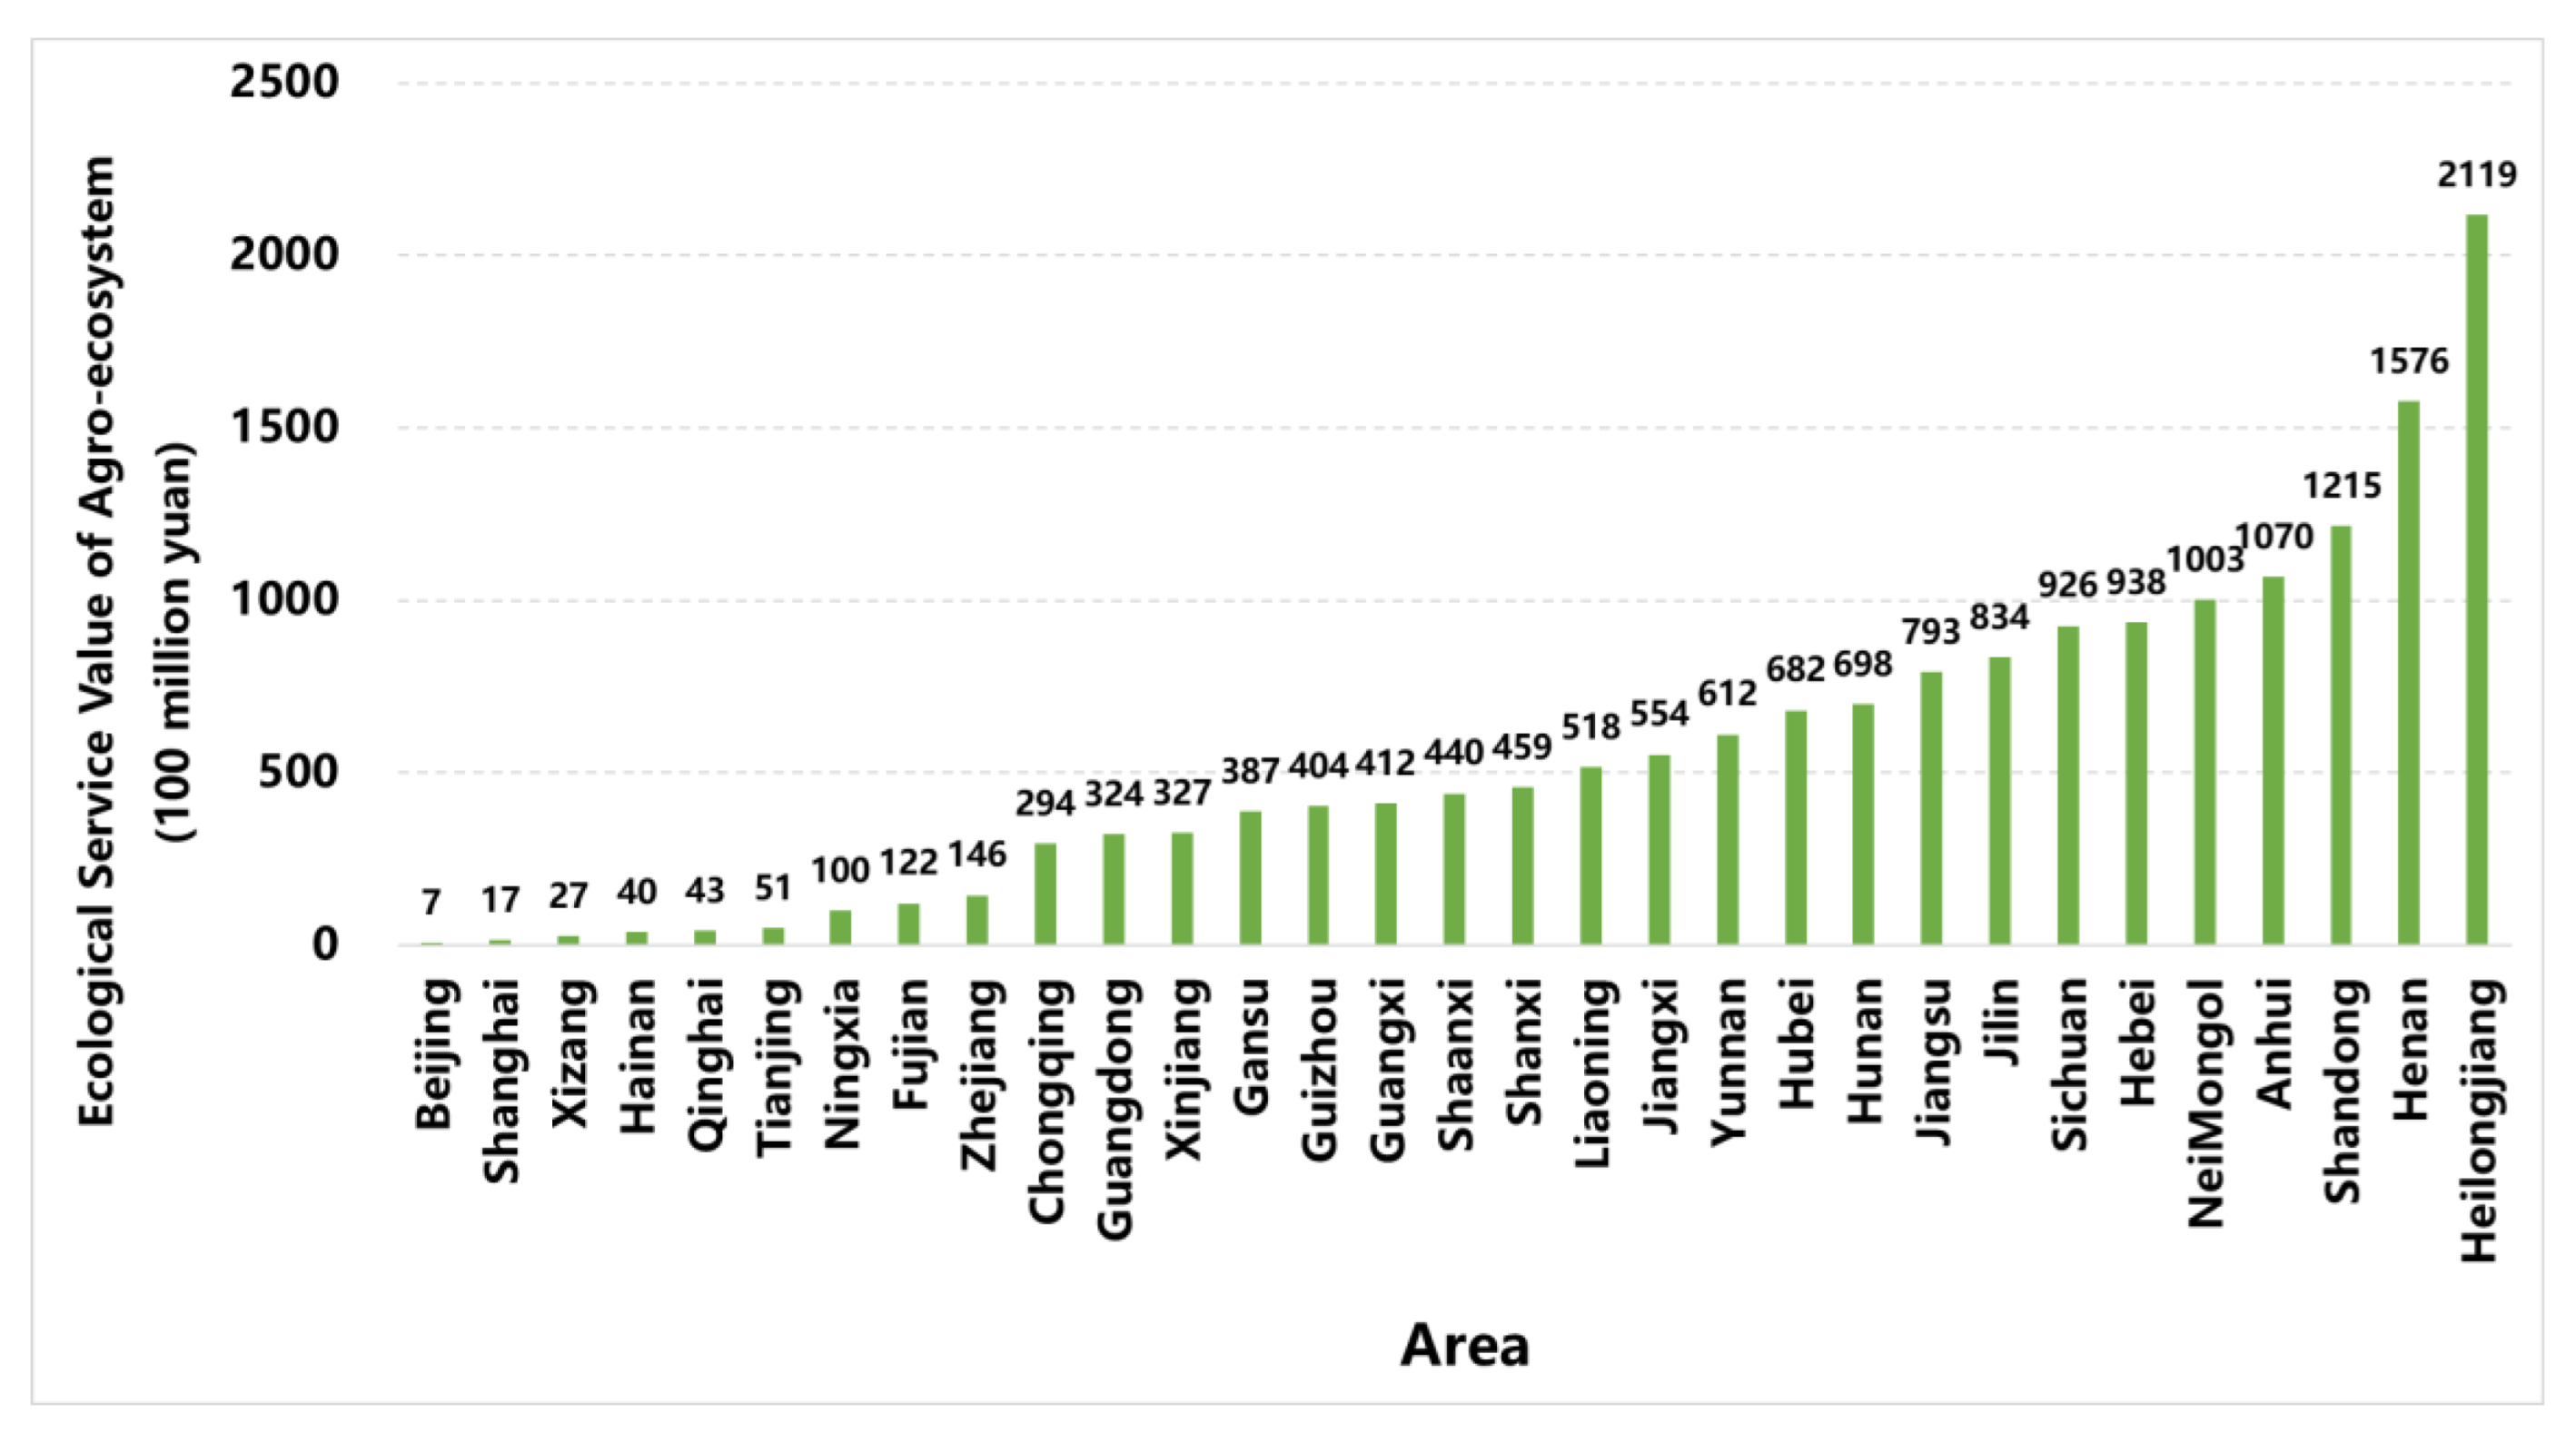
3.2.2. The Service Value of China’s Agroecosystem from 2020 to 2050

From 2020 to 2050, the evaluation results of agroecosystem service value in China’s provinces show that (Figure 7) China’s 31 provincial-level administrative units, except for Hong Kong, Macao, and Taiwan, have obvious differences in the value of agroecosystem services. The value of agricultural ecosystem services in the main provinces, especially Heilongjiang, Henan, and Shandong, is still relatively high. In the next 30 years, the economic value of agricultural ecosystem services will reach approximately 211.9 billion yuan and 157.6 billion yuan. In Beijing, Shanghai, and other regions that will still be dominated by finance, service manufacturing, and high-tech industries in the future, the service value of agroecosystems is relatively low, and the economic value of various services of agroecosystems is less than 2 billion yuan. In other provinces, such as Tibet, Hainan, Qinghai, and Anhui, in the next 30 years, the economic value of agroecosystem services will range from 2 billion to 110 billion yuan. In conclusion, there will be significant differences in the value of agroecosystem services in different provinces in the next 30 years, which is related to the area of agroecosystems in various provinces in China. Heilongjiang, Henan, and Shandong have always been important grain-producing areas in China in the past, mainly planting rice, wheat, and other crops. At the same time, according to Several Opinions of the Central Committee of the Communist Party of China and the State Council on Adhering to the Prioritized Development of Agriculture and Rural Areas and Doing a Good Job in “Three Rurals”, it clearly requires that the red line of 1.8 billion mu of arable land be strictly adhered to and the role of agricultural and rural farmers as ballast stone should be brought into play [54]. In the next 30 years or so, Heilongjiang, Henan, and Hebei may still serve as China’s granaries; therefore, their agroecosystem areas will still account for a relatively high proportion, and the economic value of agroecosystem services will be high.

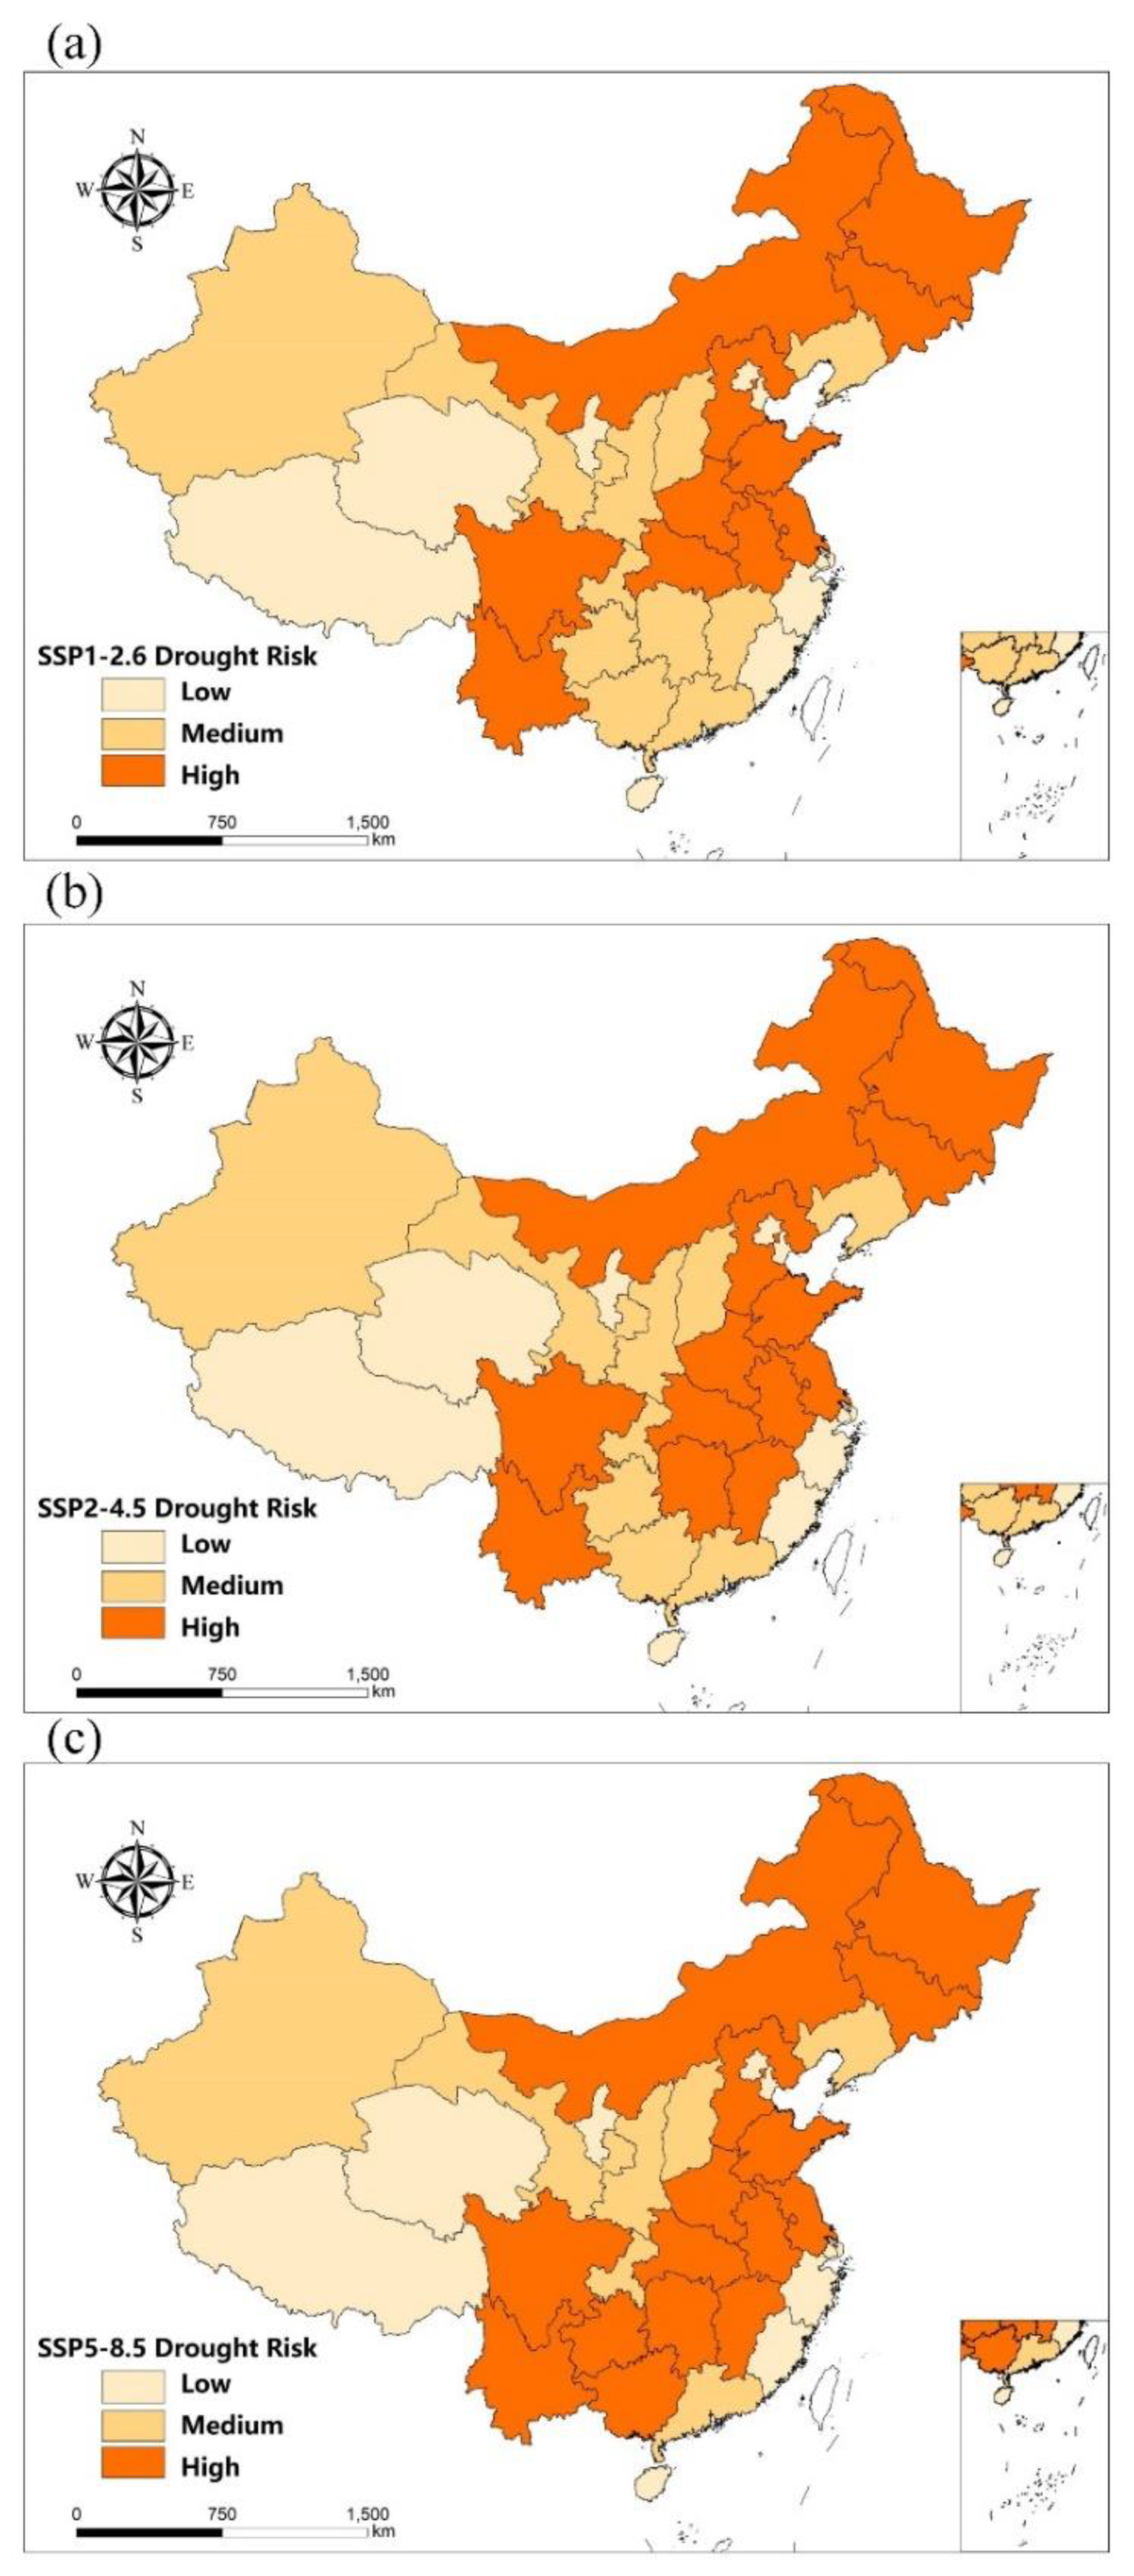
3.2.3. Drought and Flood Risks in China’s Agroecosystem from 2020 to 2050

The drought-risk distribution patterns and changes in China’s agroecosystem under different SSP scenarios from 2020 to 2050 show that (Figure 8), in the next 30 years, the drought-risk patterns of China’s agroecosystem under the three SSP scenarios will denote high drought risk in Northeast, North, Central, and Southwest China. As the scenario increases from SSP1-2.6 to SSP5-8.5, in turn, the drought risk gradually increases, and the number of provinces with high drought risk also increases and shows a trend of extending to the south. In the SSP5-8.5 scenario, the overall drought risk in China is severe. Under the SSP1-2.6 scenario, half of China’s provinces have a high drought-risk level, mainly distributed in the Heilongjiang River, Huaihe River, and the Yangtze River Basins, including Heilongjiang, Anhui, Sichuan, and other places. Under the SSP2-4.5 scenario, the high drought-risk provinces expand further south, adding Hunan and Jiangxi provinces. Under the SSP5-8.5 scenario, the range of provinces with high drought risk expands to the south again, adding Guizhou and Guangxi. However, under the three SSP scenarios, the western provinces of China, such as Tibet and Qinghai, are always low and medium drought-risk provinces. Regarding the spatial distribution characteristics of drought risk in China, the research of Chou et al. [55] showed that drought disasters in China have a trend of drought extending from north to south, especially in the Yangtze River Basin, where drought and extreme precipitation increase. This is consistent with the distribution of the high drought-risk areas of China’s agroecosystem extending to the south as the scenario intensifies in this study.
The distribution pattern and changes in China’s agroecosystem flood risk from 2020 to 2050 (Figure 9) show that the flood risk pattern of China’s agroecosystem presents the characteristics of high flood risk in the northeastern, northern, central, eastern, and southwestern provinces. In the next 30 years, approximately 60% of China’s provinces are at high risk of flooding, including Heilongjiang, Henan, Shandong, Sichuan, and other provinces. This may be related to the fact that Heilongjiang, Henan, Sichuan, and other provinces represent the major grain crop production provinces in China. The grain sown area occurs prior to other provinces in the country, and the service value of the agroecosystem is relatively high. These provinces are located in the Heilongjiang, Huaihe, and Yangtze River Basins. The water systems in the basins are rich, and they are prone to large floods in the whole basin. Therefore, the risk of flooding in the agroecosystem is relatively high. Under these three SSP scenarios, Tibet, Qinghai, Ningxia, Xinjiang, Gansu, Beijing, and Shanghai exhibit moderate-to-low flood risk characteristics. Alpine landforms, such as the Himalayas, Kunlun Mountains, Tianshan Mountains, and Qilian Mountains, block the transport of water vapor; therefore, there is less precipitation. In addition, hilly landforms and mountainous landforms in this area account for a large area, the climate is warm and dry, and the runoff of mountain rivers also shows a downward trend [56]. However, Beijing and Shanghai are regions represented by financial services and high-end industries. The service value of the agroecosystem is low; therefore, the risk of flooding is low.

4. Conclusions and Discussion

This study takes China’s agroecosystem as the research object and adopts a multi-index comprehensive prediction method based on the “sensitivity–exposure–adaptability” vulnerability prediction model. Taking into account factors such as climate change, society, population, agricultural science and technology, economy, ecology, etc., a multilevel indicator evaluation system was established for the drought and flood vulnerability of agroecosystems. Using a combination of subjective empowerment and objective empowerment methods, the drought and flood sensitivity, exposure, adaptability, and vulnerability of agroecosystems under three socioeconomic scenarios, SSP1-2.6, SSP2-4.5, and SSP5-8.5, in the next 30 years were estimated. On this basis, the drought and flood risk prediction model of agroecosystems was used to consider vulnerability, risk sources, and risk receptors. The drought and flood risks of the agroecosystem from 2020 to 2050 were predicted, and the vulnerability and risk status of China’s agroecosystem under different shared social and economic scenarios in the future were compared and analyzed. The main findings are as follows:
(1)
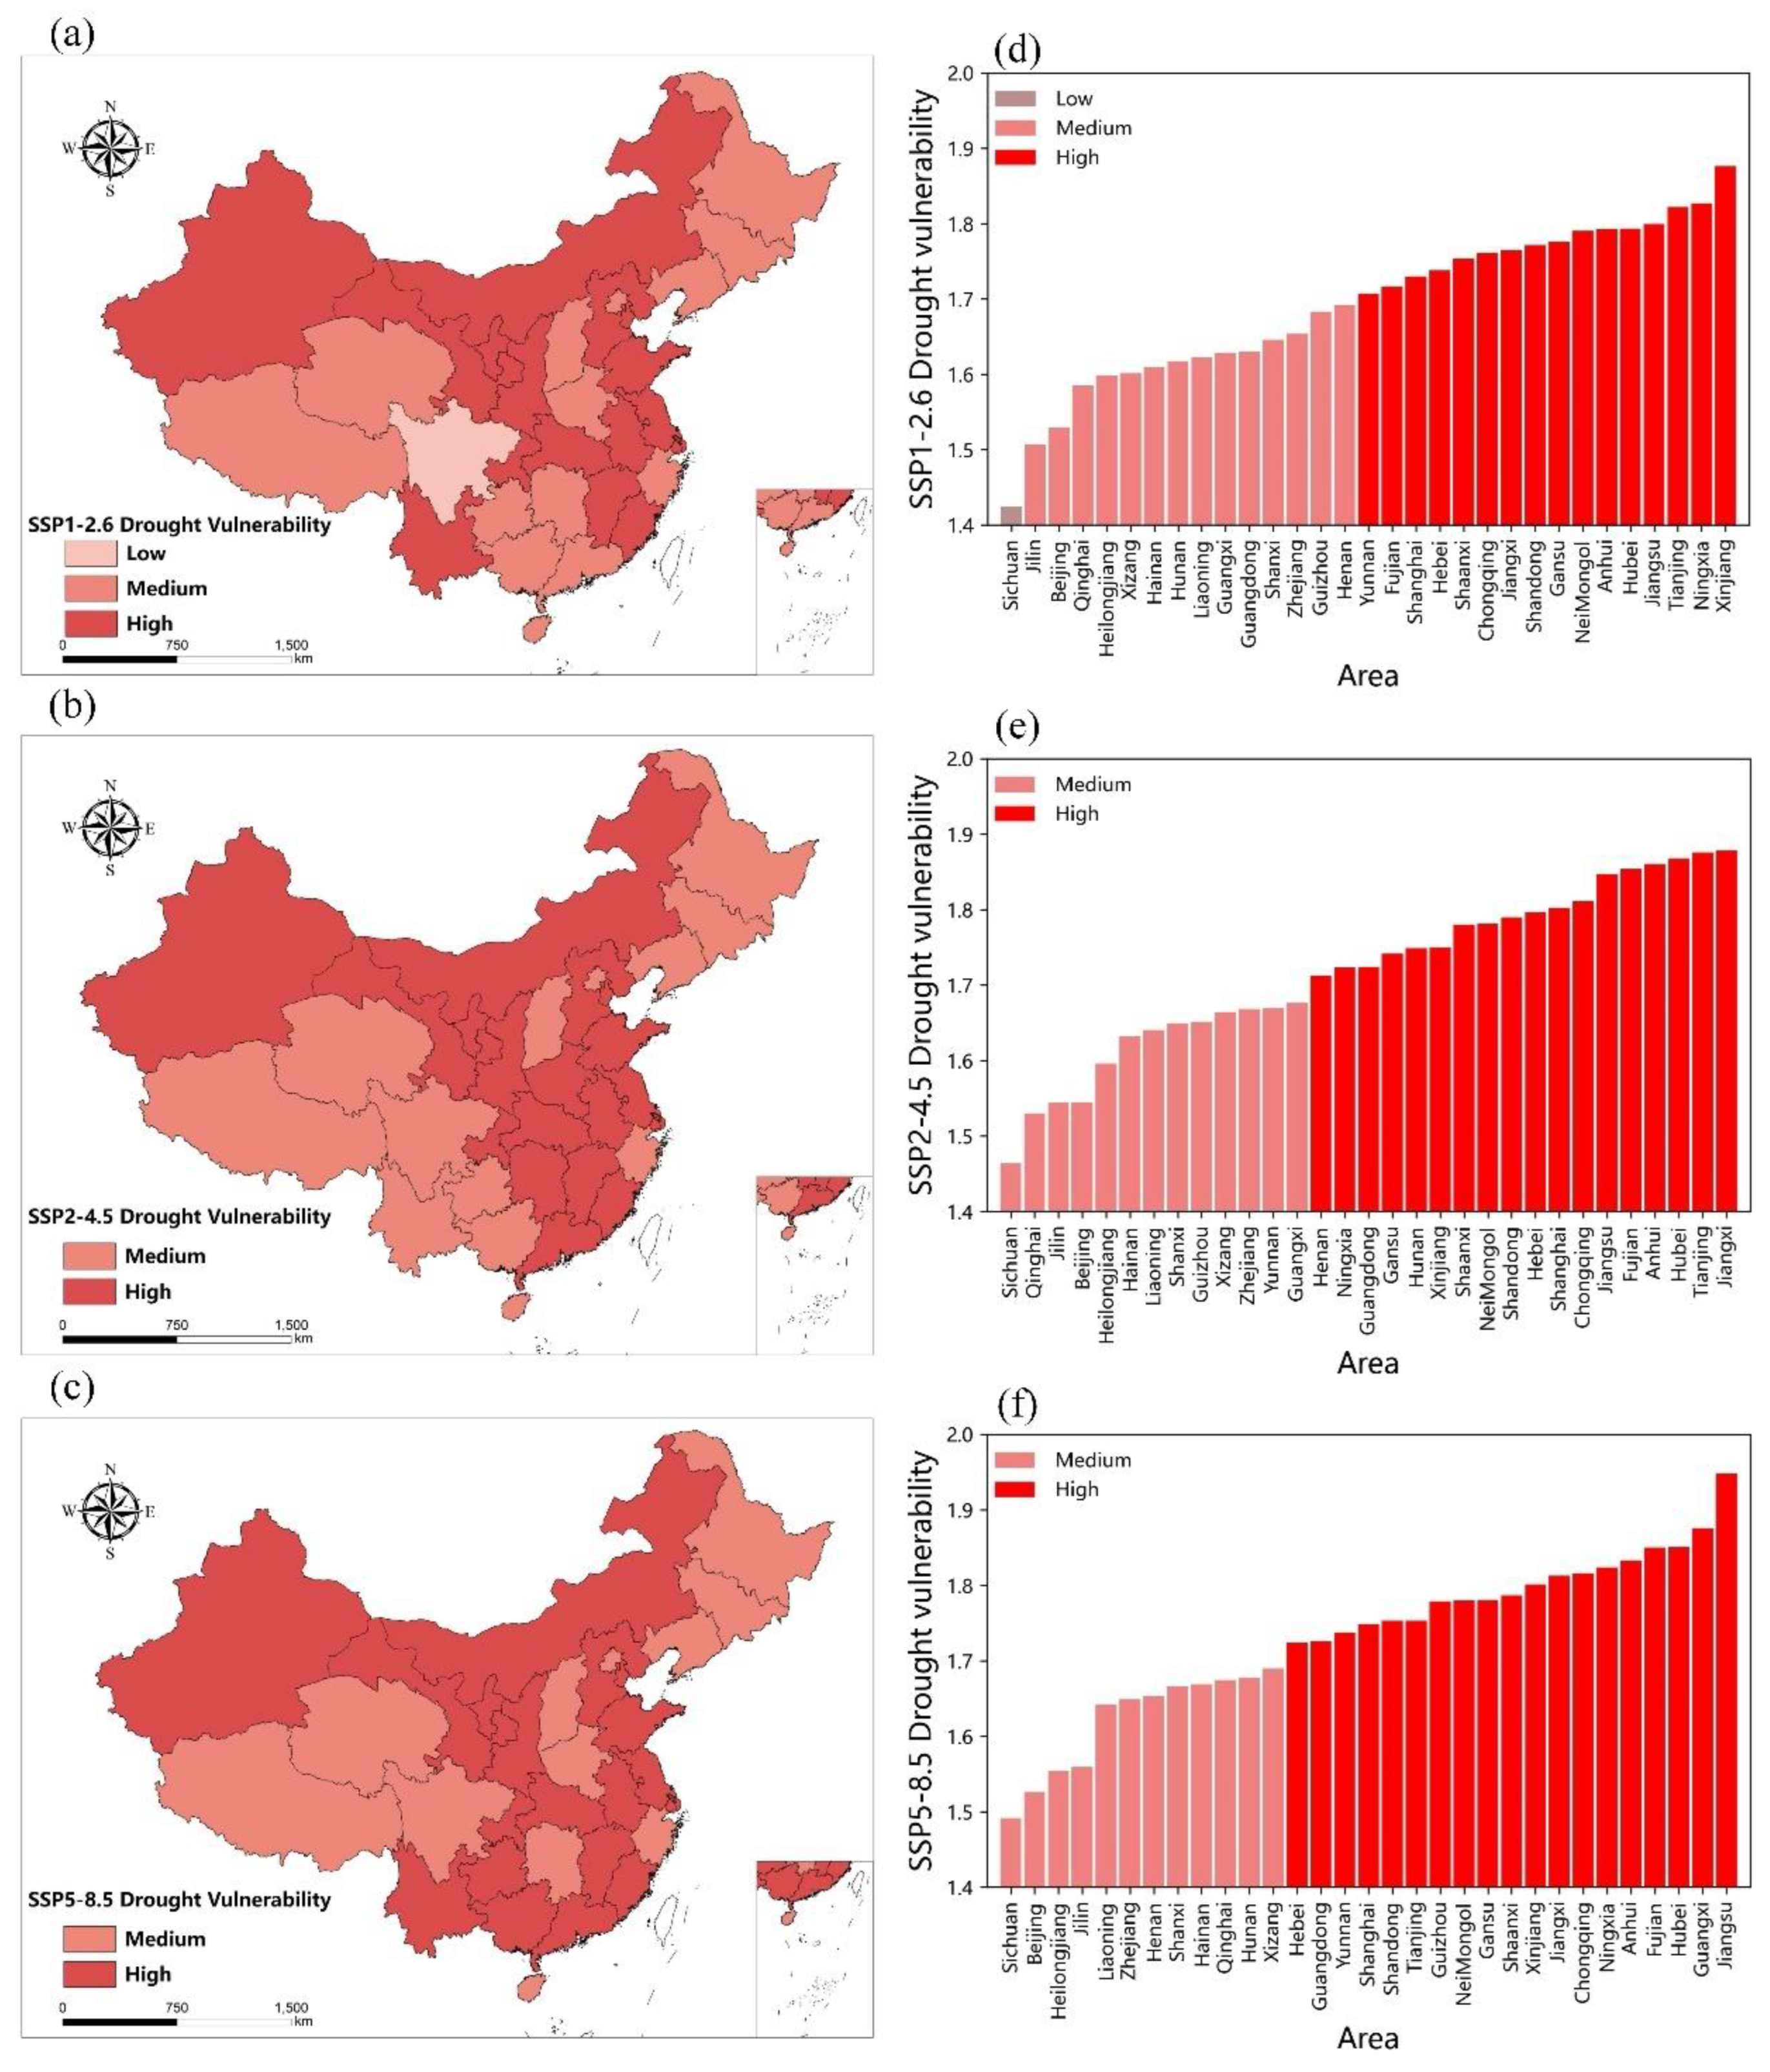
In the next 30 years, as the shared socioeconomic path changes from SSP1-2.6 to SSP5-8.5 in turn, the drought and flood vulnerability of China’s agroecosystem will increase in general, the scope of provinces with high drought vulnerability will gradually expand to the south, and provinces with high flood vulnerability will gradually extend to the southwest.
(2)
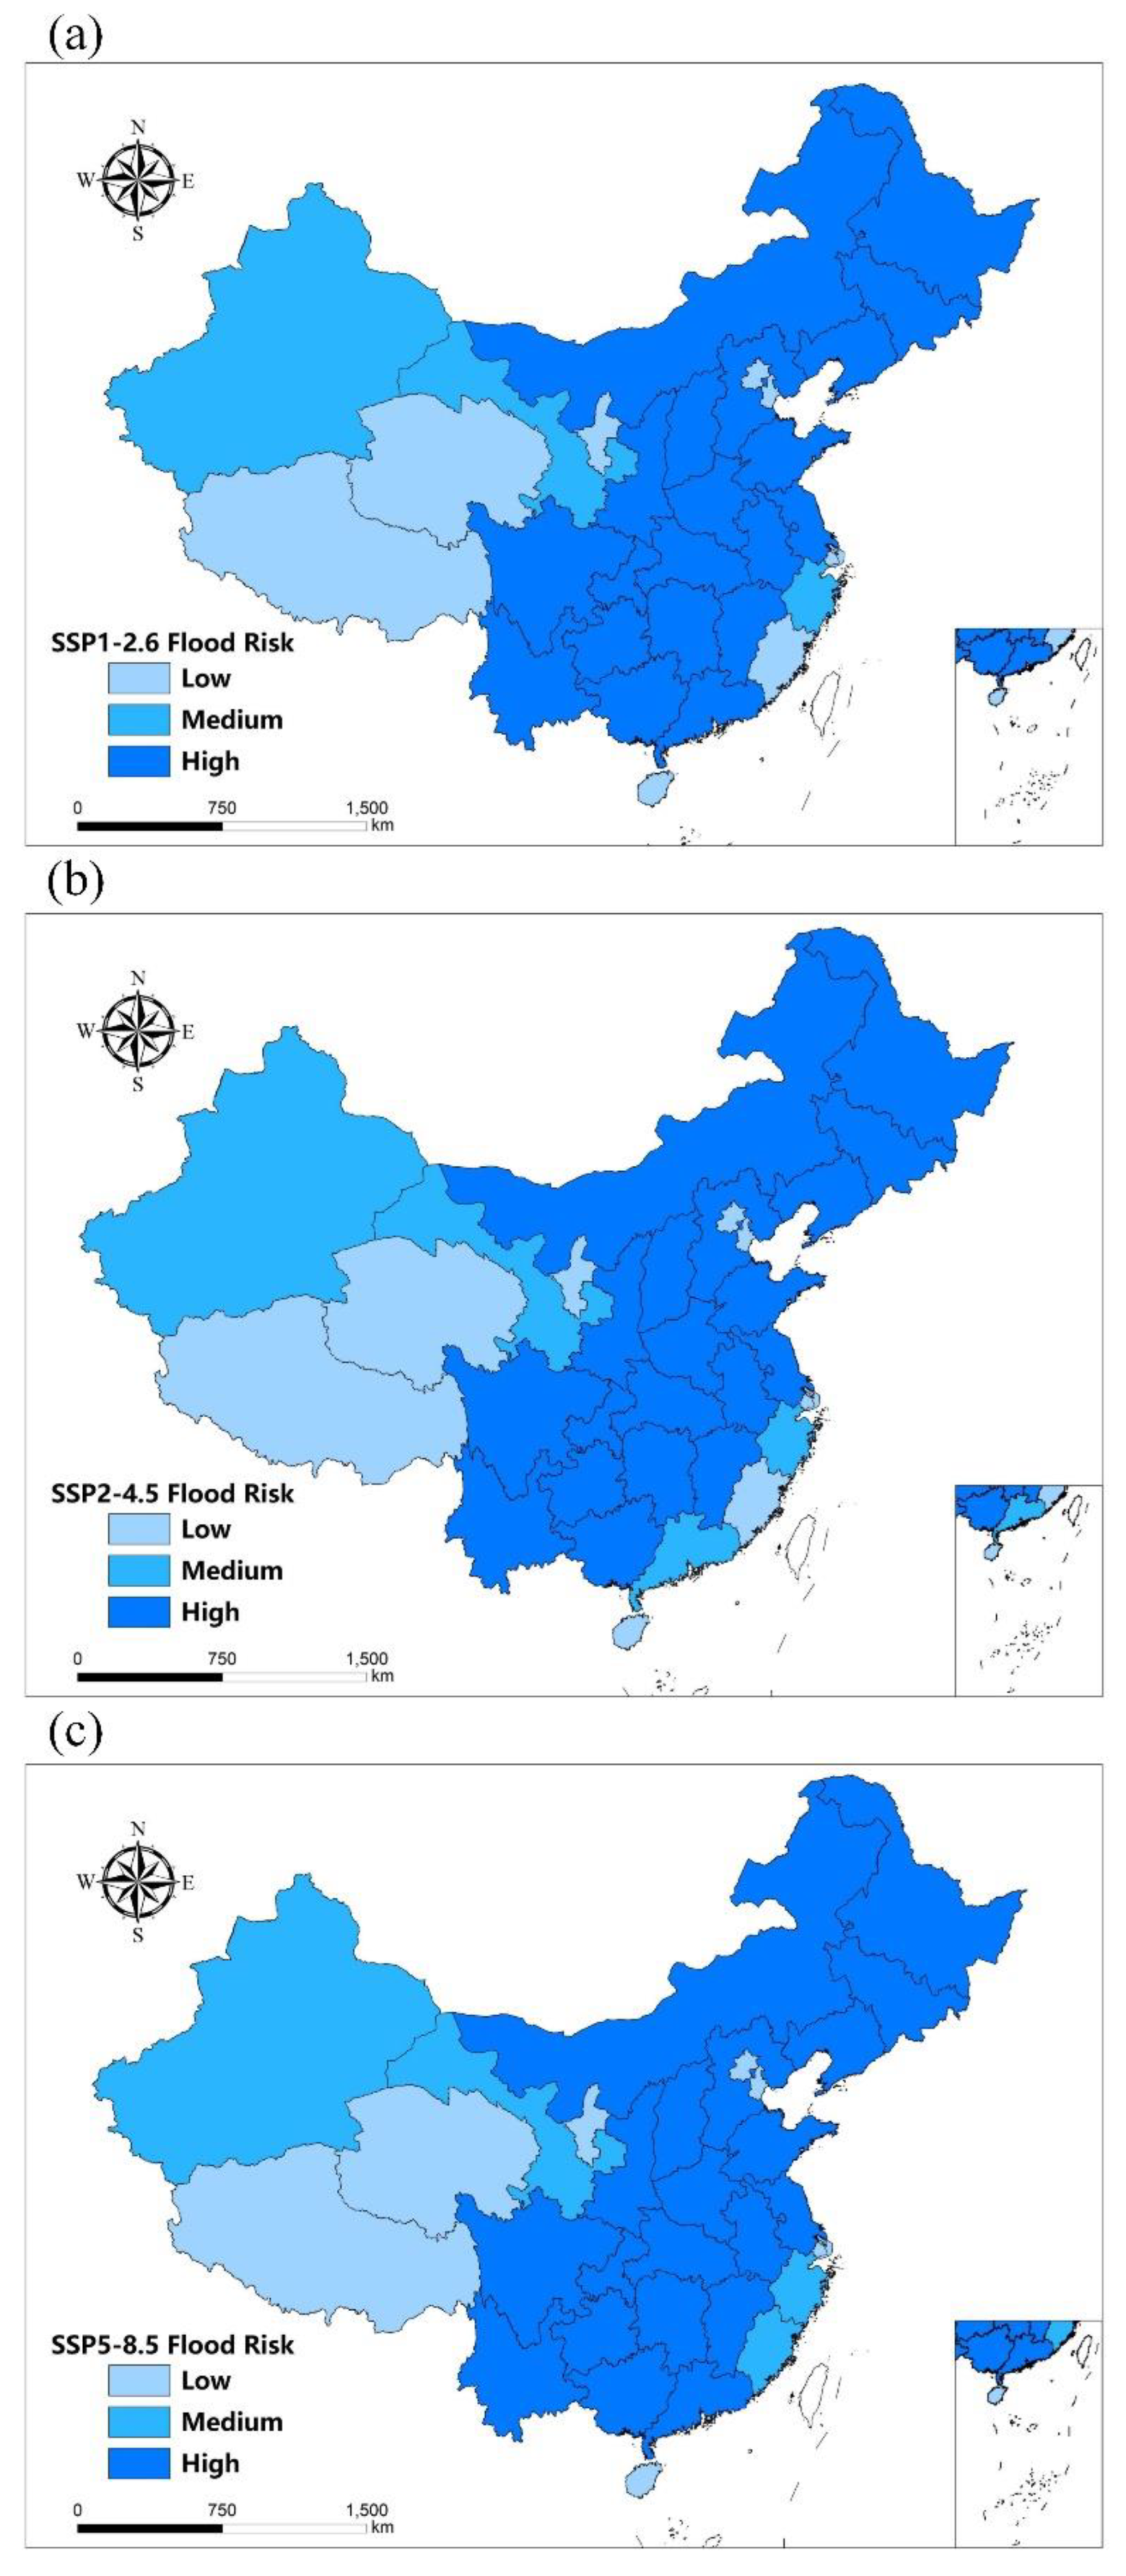
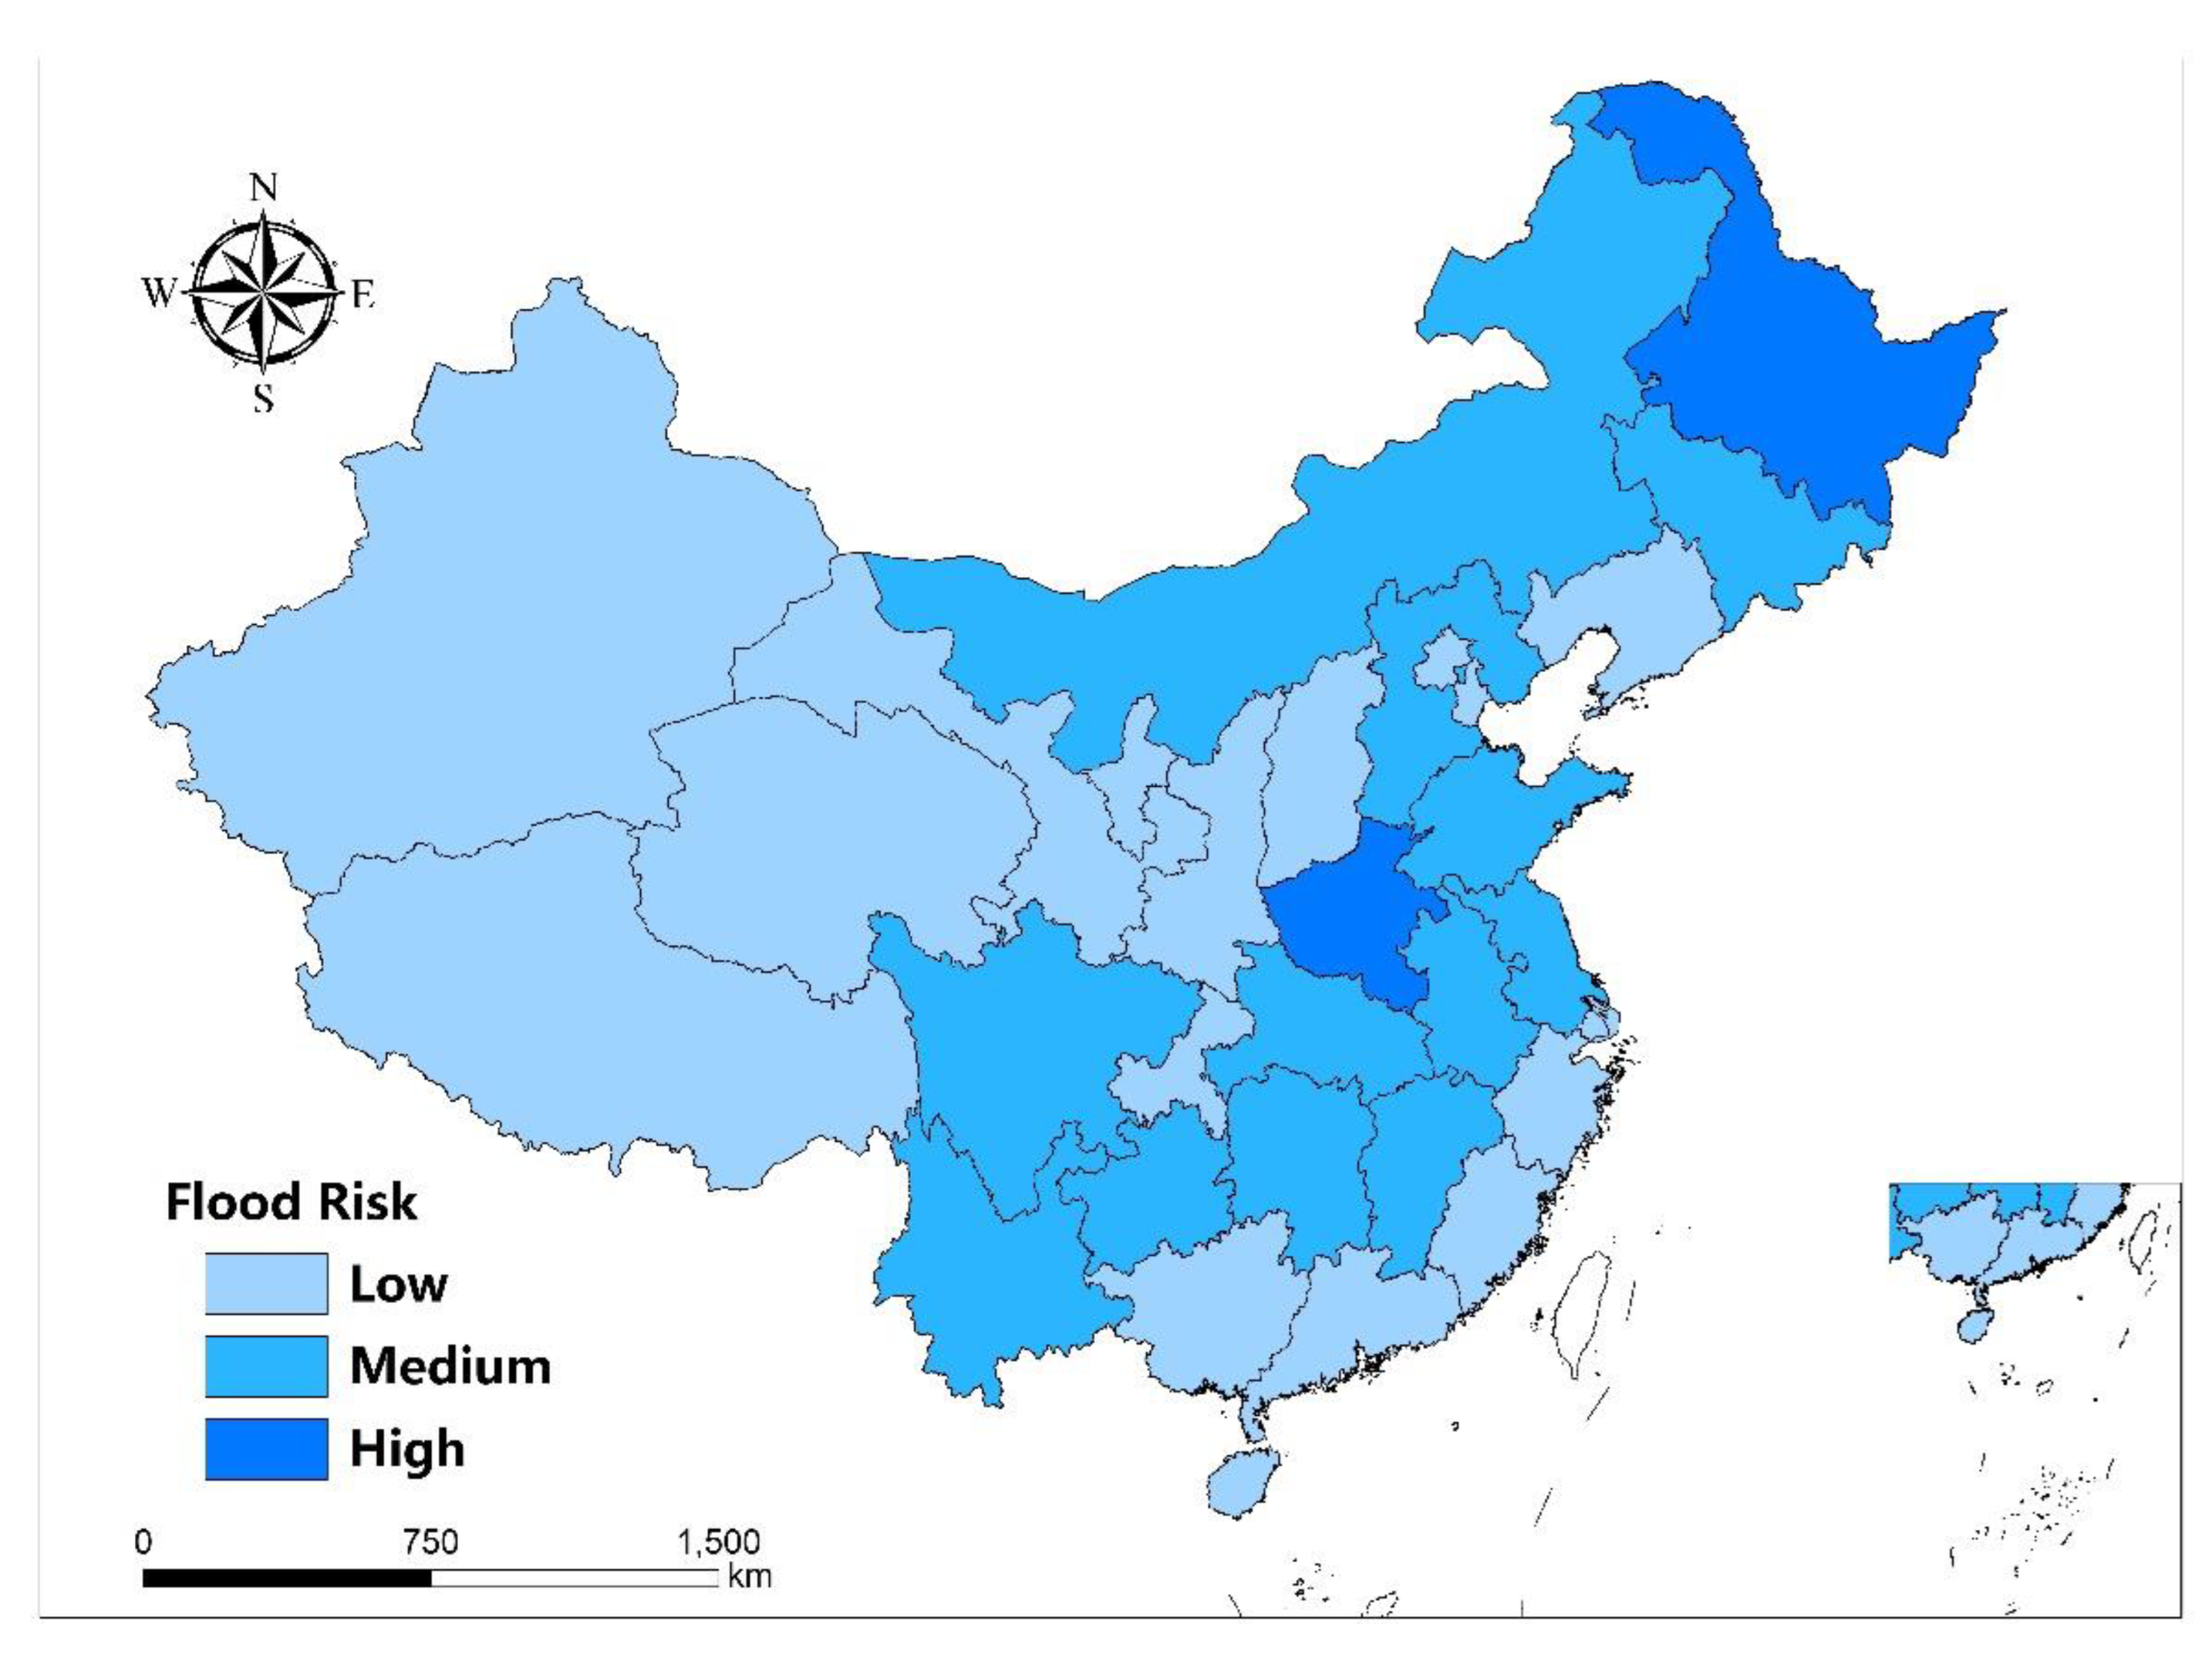
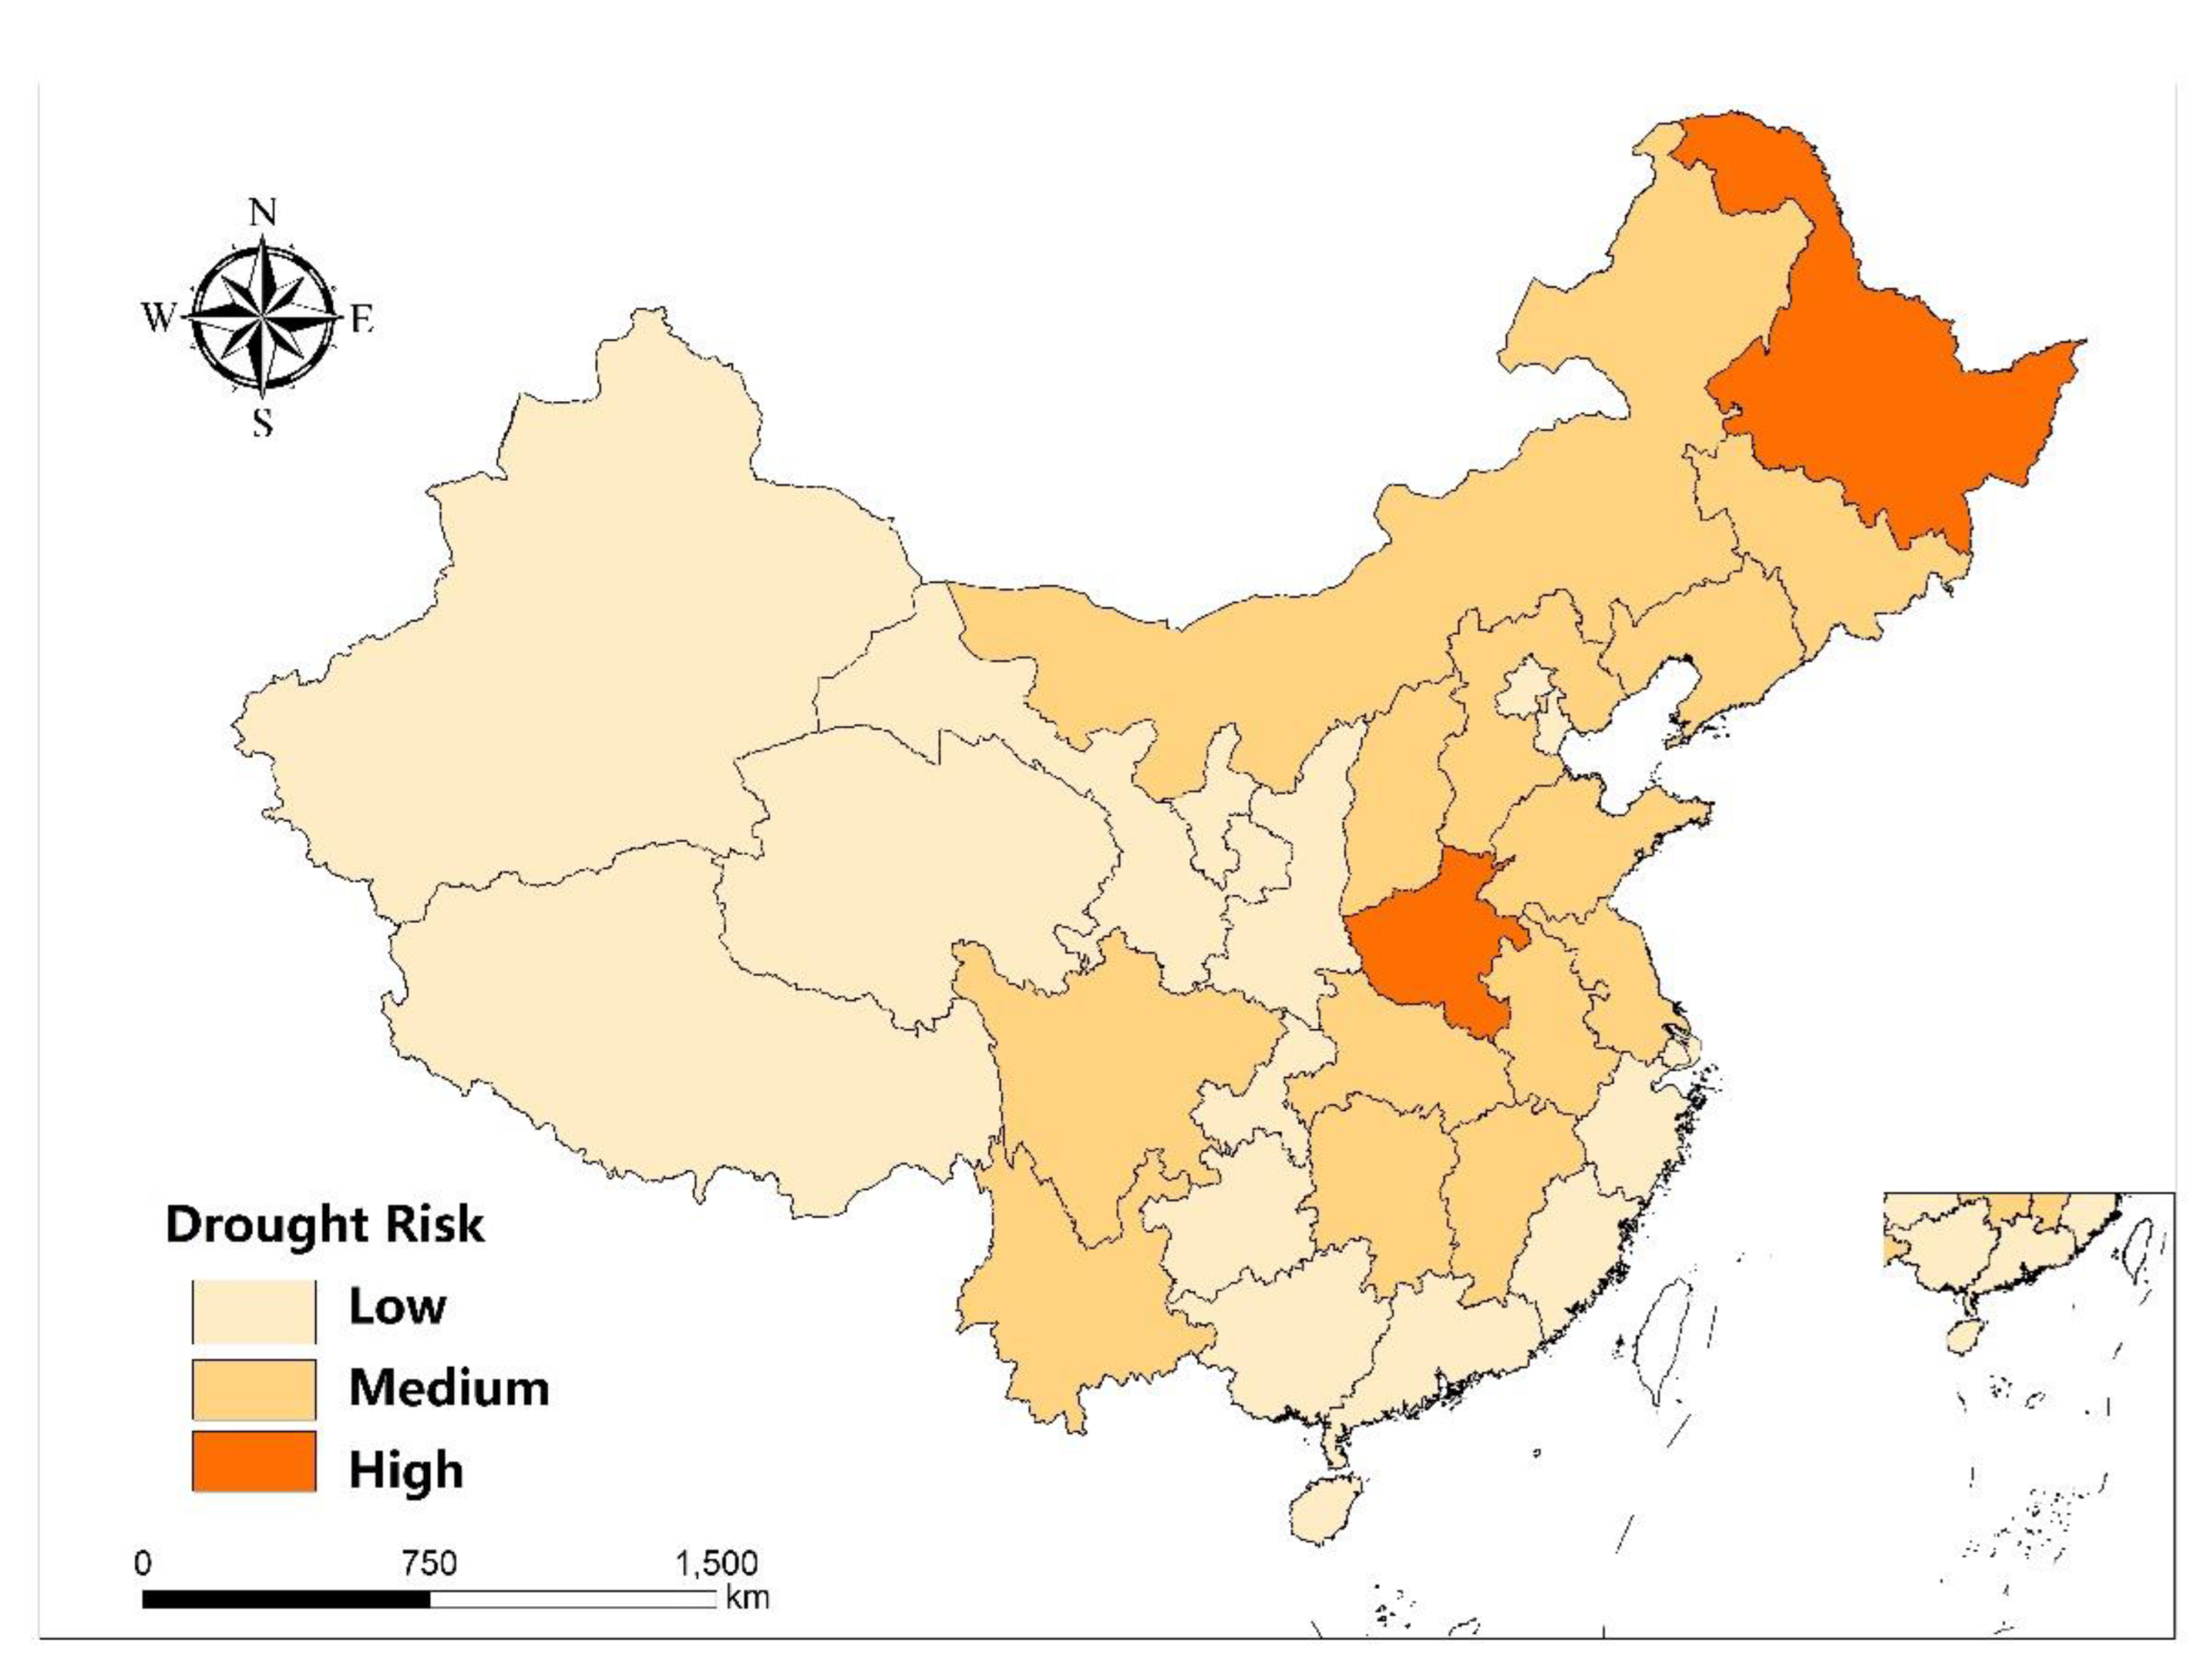
From 2020 to 2050, the regional distribution pattern of drought risk showed the characteristics of high drought risk in agroecosystems in Northeast, North, Central China, and Southwest China. The flood risk pattern showed the characteristics of high flood risk in the agroecosystem in Northeast, North, Central, East, and Southwest China. As the scenarios changed from SSP1-2.6 to SSP5-8.5 in turn, the number of provinces with high drought risk increased and showed a trend of extending to the south. Under the SSP5-8.5 scenario, the drought risk of the agroecosystem is high, and 60% of the provinces in China have a high risk level of flooding.
(3)
It is worth noting that under the SSP5-8.5 scenario, Heilongjiang and Jilin in Northeast China, Henan, Hubei, Anhui, Hunan and Jiangxi in Central China, Inner Mongolia and Hebei in North China, Shandong and Jiangsu in East China, and Sichuan, Yunnan, Guizhou, and Guangxi in Southwest China, the drought and flood risk in the agroecosystem in these provinces will be higher in the next 30 years. Northeast and Central China belong to China’s commodity grain bases. Crops have a long history of planting, and plant growth is easily restricted by drought and floods, resulting in a higher risk of drought and floods in the agroecosystems of Northeast and Central China. These provinces need to strengthen the use of irrigation infrastructure; promote water-saving irrigation technologies, such as sprinkler irrigation and drip irrigation; attach importance to investment; use advanced agricultural machinery and equipment; strengthen soil protection measures; and gradually develop climate-smart agriculture. At the same time, Northeast and Central China should continue to implement policies on drought, flood, and climate change adaptation; make emergency response and preparation for drought and flood risks in terms of equipment, facilities, funds, and technology; and make full use of credit, savings, markets, and other financial instruments to ensure restoration and construction in disaster-affected areas.
(4)
The climate in North China is unstable and water resources are in short supply all year round. The supply of water resources mainly depends on China’s South-to-North Water Diversion Project. The precipitation and reservoir capacity in this region cannot meet the regional agricultural and ecological water consumption, but floods caused by heavy rains often occur. According to the data, in July 2021, a heavy rainstorm occurred in the central and northern parts of Henan, resulting in flood disasters that affected 14.786 million people in 150 counties in Henan Province and caused a direct economic loss of 120.06 billion yuan, of which Zhengzhou City was 40.9 billion CNY, accounting for 34.1% of Henan province [57]. East China belongs to the southeastern coastal area, with a low altitude, adjacent to the Bohai Sea and the Yellow Sea, with vertical and horizontal rivers, insufficient freshwater resources, and a high risk of drought and flooding in the agroecosystem. On the one hand, these areas need to pay attention to the regular maintenance of dams, pipelines, and reservoirs for water supply and storage systems. The southwestern provinces of China have complex topography, spanning the three steps of my country’s landforms, with many mountains and ridges, and their altitudes are mostly 4000–5000 m. It is cold in winter and cool in summer, and the distribution of water and heat is uneven [58], so the risk of drought and flood in the agroecosystem is high. These areas need to advocate that farmers can diversify crops in agricultural planting and production activities, adopt intercropping, crop rotation, and other planting methods, select drought-resistant and flood-resistant crops, and adjust planting dates and planting structures. Farmers should adopt diversified livelihood strategies, actively participate in education and training on water conservation, farming methods, drought and flood awareness, and risk management, and apply them to daily agricultural production and life activities.
(5)
According to the natural geographical and socio-economic background and characteristics of each province in China, we select indicators such as socio-economic development, agriculture, ecological environment, human activities, and agricultural science and technology. We combine statistics and forecast data from different repositories and establish indicator systems for predicting the vulnerability of the agroecosystem to drought and flood disasters. At the same time, this study uses the combination of AHP and the entropy weighting method to reduce the uncertainty of prediction and enhance the repeatability of this study. In addition, in future research work, a multi-indicator evaluation system can be constructed based on the local natural and human context, which can be applied not only to the agricultural system, ecosystem vulnerability, and risk assessment but also to food security, the economic system, and human health risk assessment work. Moreover, compared with the methods used in other studies such as water scarcity and similar indicator reports, the indicator system constructed in this study involves many fields such as society, nature, climate change, human activities, technological level, economic development, and so on. At the same time, based on the vulnerability and risk assessment of China’s agroecosystem in the past 30 years, a comparative analysis of the vulnerability and risk distribution and characteristics of SSP1-2.6, SSP2-4.5, and SSP5-8.5 in the next 30 years is carried out in order to ensure the coherence and credibility of this research.
(6)
In the next step of research, we can consider adding effective actions that farmers and agricultural production cooperatives have taken or may take and conduct adaptive analysis based on relevant driving factors and risk patterns to more accurately formulate and adjust relevant adaptation strategies and reduce ecosystem vulnerability and risk loss. Moreover, in future research, agroecosystem types or large geomorphic units can be used as the basic unit of classification for agroecosystem disaster risk estimation to take into account the influencing factors of different geomorphic units and climatic regions in China.

Supplementary Materials

The following supporting information can be downloaded at: https://www.mdpi.com/article/10.3390/su141610069/s1, Supporting Materials.

Author Contributions

J.C. and J.L. offered the idea and method, all authors participated in the prepared materials, and J.L. wrote the paper with input from all authors. Conceptualization, W.Z., Y.X., Y.H. and Y.L.; Data curation, J.L. and J.C.; Formal analysis, J.L.; Funding acquisition, J.C.; Investigation, J.L.; Methodology, J.L.; Project administration, W.Z.; Writing—original draft, J.L. All authors have read and agreed to the published version of the manuscript.

Funding

This work was supported by Project Supported by State Key Laboratory of Earth Surface Processes and Resource Ecology (Project Number: 2022-GS-01) and the Natural Science Foundation General Program of China (42075167).

Institutional Review Board Statement

Not applicable.

Informed Consent Statement

Not applicable.

Data Availability Statement

All relevant data can be found within the paper and its Supporting Materials. CMIP6 models data are available at link https://esgf-node.llnl.gov/search/cmip6.

Conflicts of Interest

The authors declare no competing interests.

Appendix A

Table A1. Brief introduction of 22 global climate models in CMIP6.
Schema NameThe InstitutionMode Resolution (Longitude × Latitude)
ACCESS-CM2Commonwealth Scientific and Industrial Research Organization of Australia, Australian Research Council Centre of Excellence for Climate System Science1.875° × 1.25°
ACCESS-ESM1-5Commonwealth Scientific and Industrial Research Organization of Australia1.875° × 1.25°
BCC-CSM2-MRChina National Climate Center3.2° × 1.6°
FGOALS-g3Institute of Atmospheric Physics, Chinese Academy of Sciences1.8° × 0.8°
CanESM5Canadian Centre for Climate Modeling and Analysis2.8125° × 2.8125°
CanESM5-CanOECanadian Centre for Climate Modeling and Analysis2.8125° × 2.8125°
CNRM-CMFrench National Centre for Meteorological Research, European Centre for Computational Research and Advanced Training1.4° × 1.4063°
CNRM-CM6-1-HRFrench National Centre for Meteorological Research, European Centre for Computational Research and Advanced Training1.4° × 1.4063°
CNRM-ESMFrench National Centre for Meteorological Research, European Centre for Computational Research and Advanced Training1.4° × 1.4063°
IPSL-CMPierre Simon Laplace Institute, France1.4° × 1.4063°
EC-Earth3European Centre for Medium-Range Weather Forecasts0.7031° × 0.7031°
EC-Earth3-VegEuropean Centre for Medium-Range Weather Forecasts0.7031° × 0.7031°
GFDL-ESM4NOAA Geohydrodynamics Laboratory2.88° × 1.8°
GISS-E2-1-GNASA Gold Institute for Space Studies2.88° × 1.8°
INM-CM4-8Institute of Numerical Mathematics of the Russian Academy of Sciences2° × 1.5°
INM-CM5-0Institute of Numerical Mathematics of the Russian Academy of Sciences2° × 1.5°
MIROC6Japan Marine Earth Science and Technology Agency1.4063° × 1.3953°
MIROC-ES2LJapan Marine Earth Science and Technology Agency2.8125° × 2.8125°
MRI-ESMJapan Meteorological Institute1.125° × 1.125°
MPI-ESM1-2-HRGerman Max Planck Institute for Meteorology, German Meteorological Office0.9375° × 0.9375°
MPI-ESM1-2-LRMax Planck Institute for Meteorology, Alfred Wegener Institute, Germany1.875° × 1. 875°
UKESM1-O-LLUK National Centre for Atmospheric Science, UK Met Office Hadley Centre3.2° × 1.6°
Figure A1. Drought risk in China’s agroecosystem from 1991 to 2019.
Sustainability 14 10069 g0a1
Figure A2. Flood risk of China’s agroecosystem from 1991 to 2019.
Sustainability 14 10069 g0a2

References

  1. Houghton, J.T.; Jenkins, G.; Ephraums, J.J. (Eds.) The IPCC Scientific Assessment; Cambridge University Press: Cambridge, UK, 1990. [Google Scholar]
  2. Watson, R.T.; Zinyowera, M.C.; Moss, R.H. (Eds.) Climate Change 1995. Impacts, Adaptations and Mitigation of Climate Change: Scientific-Technical Analyses; Cambridge University Press: Cambridge, UK, 1995. [Google Scholar]
  3. McCarthy, J.J.; Canziani, O.F.; Leary, N.A.; Dokken, D.J.; White, K.S. (Eds.) Climate Change 2001: Impacts, Adaptation, and Vulnerability: Contribution of Working Group II to the Third Assessment Report of the Intergovernmental Panel on Climate Changes; Cambridge University Press: Cambridge, UK, 2001. [Google Scholar]
  4. Parry, M.L.; Canziani, O.; Palutikof, J.; Van der Linden, P.; Hanson, C. (Eds.) Climate Change 2007—Impacts, Adaptation and Vulnerability: Working Group II Contribution to the Fourth Assessment Report of the IPCC; Cambridge University Press: Cambridge, UK, 2007. [Google Scholar]
  5. Pörtner, D.C.; Roberts, M.; Tignor, E.S.; Poloczanska, K.; Mintenbeck, A.; Alegría, M.; Craig, S.; Langsdorf, S.; Löschke, V.; Möller, A.; et al. (Eds.) Climate Change 2022: Impacts, Adaptation, and Vulnerability.Contribution of Working Group II to the Sixth Assessment Report of the Intergovernmental Panel on Climate Change; Cambridge University Press: Cambridge, UK, 2007. [Google Scholar]
  6. Budiyono, Y.; Aerts, J.; Brinkman, J.J.; Marfai, M.A.; Ward, P. Flood risk assessment for delta mega-cities: A case study of Jakarta. Nat. Hazards 2015, 75, 389–413. [Google Scholar] [CrossRef]
  7. Wang, H.M.; Chen, J.; Xu, C.Y.; Zhang, J.; Chen, H. A framework to quantify the uncertainty contribution of GCMs over multiple sources in hydrological impacts of climate change. Earth’s Future 2020, 8, e2020EF001602. [Google Scholar] [CrossRef]
  8. Tanure, T.; Miyajima, D.N.; Magalhaes, A.S.; Domingues, E.P.; Carvalho, T.S. Impacts of Climate Change on Agricultural Production, Land Use and Economy of the Legal Amazon Region between 2030 and 2049. EconomiA 2020, 21, 73–90. [Google Scholar] [CrossRef]
  9. Simane, B.; Zaitchik, B.F.; Foltz, J.D. Agroecosystem specific climate vulnerability analysis: Application of the livelihood vulnerability index to a tropical highland region. Mitig. Adapt. Strateg. Glob. Chang. 2016, 21, 39–65. [Google Scholar] [CrossRef]
  10. Vignola, R.; Harvey, C.A.; Bautista-Solis, P.; Avelino, J.; Rapidel, B.; Donatti, C.; Martinez, R. Ecosystem-based adaptation for smallholder farmers: Definitions, opportunities and constraints. Agric. Ecosyst. Environ. 2015, 211, 126–132. [Google Scholar] [CrossRef]
  11. Epule, T.E.; Ford, J.D.; Lwasa, S. Projections of maize yield vulnerability to droughts and adaptation options in Uganda. Land Use Policy 2017, 65, 154–163. [Google Scholar] [CrossRef]
  12. Senyolo, M.P.; Long, T.B.; Blok, V.; Omta, O. How the characteristics of innovations impact their adoption: An exploration of climate-smart agricultural innovations in South Africa. J. Clean. Prod. 2018, 172, 3825–3840. [Google Scholar] [CrossRef]
  13. Ashraf, M.; Arshad, A.; Patel, P.M.; Khan, A.; Qamar, H.; Siti-Sundari, R.; Babar, J.R. Quantifying climate-induced drought risk to livelihood and mitigation actions in Balochistan. Nat. Hazards 2021, 109, 2127–2151. [Google Scholar] [CrossRef]
  14. Durowoju, O.S.; Ologunorisa, T.E.; Akinbobola, A. Assessing agricultural and hydrological drought vulnerability in a savanna ecological zone of Sub-Saharan Africa. Nat. Hazards 2022, 111, 2431–2458. [Google Scholar] [CrossRef]
  15. Meza, I.; Siebert, S.; Döll, P.; Kusche, J.; Herbert, C.; Rezaei, E.E.; Nouri, H.; Gerdener, H.; Popat, E.; Frischen, J.; et al. Michael Global-scale drought risk assessment for agricultural systems. Nat. Hazards Earth Syst. Sci. 2020, 20, 695–712. [Google Scholar] [CrossRef]
  16. Swami, D.; Parthasarathy, D. Dynamics of exposure, sensitivity, adaptive capacity and agricultural vulnerability at district scale for Maharashtra, India. Ecol. Indic. 2021, 121, 107206. [Google Scholar] [CrossRef]
  17. Zhou, G.S. Prospects for the impact of climate change on agricultural production in China. Meteorol. Environ. Sci. 2015, 38, 80–94. (In Chinese) [Google Scholar]
  18. Cai, Y.L. Vulnerability and adaptation strategies of Chinese agriculture under global climate change. Acta Geogr. Sin. 1996, 51, 202–212. [Google Scholar]
  19. Liu, Y.; You, M.; Zhu, J.; Wang, F.; Ran, R. Integrated risk assessment for agricultural drought and flood disasters based on entropy information diffusion theory in the middle and lower reaches of the Yangtze River, China. Int. J. Disaster Risk Reduct. 2019, 38, 101194. [Google Scholar] [CrossRef]
  20. Xu, Y.L.; Zhao, Y.C.; Zhai, P.M. IPCC Special Report SRCCL New Cognition and Enlightenment on Climate Change and Food Security. Adv. Clim. Chang. Res. 2020, 16, 37–49. (In Chinese) [Google Scholar]
  21. Wu, S.H.; Zhao, D.S. New Progress in Research on Climate Change Impacts, Risks and Adaptation in China. China Popul. Resour. Environ. 2020, 30, 1–9. (In Chinese) [Google Scholar]
  22. Shi, W.J.; Wang, M.L.; Liu, Y.T. Crop yield and production responses to climate disasters in china. Sci. Total Environ. 2021, 750, 141147–141194. [Google Scholar] [CrossRef] [PubMed]
  23. Liu, D.L.; Zuo, H. Statistical downscaling of daily climate variables for climate change impact assessment over New South Wales, Australia. Clim. Chang. 2012, 115, 629–666. [Google Scholar] [CrossRef]
  24. Huang, J.; Qin, D.; Jiang, T.; Wang, Y.; Feng, Z.; Zhai, J.; Su, B. Effect of fertility policy changes on the population structure and economy of China: From the perspective of the shared socioeconomic pathways. Earth’s Future 2019, 7, 250–265. [Google Scholar] [CrossRef]
  25. National Bureau of Statistics of the People’s Republic of China. China Statistical Yearbook; China Statistics Press: Beijing, China, 2021. (In Chinese)
  26. National Bureau of Statistics of the People’s Republic of China. Inventory Results of China’s Forest Resources. Available online: http://forest.ckcest.cn (accessed on 16 June 2022).
  27. Field, C.B.; Barros, V.R.; Dokken, D.J.; Mach, K.J.; Mastrandea, M.D.; Bilir, T.E.; Chatterjee Ebi, K.L.; Estrada, Y.O.; Genova, R.C. (Eds.) Climate Change 2014: Impacts, Adaptation, and Vulnerability; Cambridge University Press: Cambridge, UK, 2014. [Google Scholar]
  28. Qin, J.; Ding, Y.J.; Zhao, Q.D.; Wang, S.P.; Chang, Y.P. Assessments on surface water resources and their vulnerability and adaptability in China. Adv. Clim. Chang. Res. 2020, 11, 381–391. [Google Scholar] [CrossRef]
  29. Schardong, A.; Simonovic, S.P.; Tong, H. Use of quantitative resilience in managing urban infrastructure response to natural hazards. Int. J. Eng. Sci. 2019, 9, 13–25. [Google Scholar] [CrossRef]
  30. Saaty, T.L. What is the Analytic Hierarchy Process? In Mathematical Models for Decision Support; Springer: Berlin/Heidelberg, Germany, 1988; pp. 109–121. [Google Scholar]
  31. Alamanos, A.; Mylopoulos, N.; Loukas, A.; Gaitanaros, D. An Integrated Multicriteria Analysis Tool for Evaluating Water Re source Management Strategies. Water 2018, 10, 1795. [Google Scholar] [CrossRef]
  32. Wu, J.R.; Chen, X.L.; Lu, J.Z. Assessment of Long and Short-Term Flood Risk Using the Multi-Criteria Analysis Model with the AHP-Entropy Method in Poyang Lake Basin. Int. J. Disaster Risk Reduct. 2022, 75, 102968. [Google Scholar] [CrossRef]
  33. Li, J.N.; Chou, J.M.; Zhao, W.X.; Li, Q.M.; Xu, Y.; Sun, M.Y.; Yang, F. 1991–2019 drought and flood vulnerability assessment of China’s agro-ecosystem. Clim. Environ. Res. 2022, 27, 19–32. (In Chinese) [Google Scholar]
  34. Wang, Q. Research on the Effect of Tourism Poverty Alleviation in Yecheng County, Xinjiang Based on AHP & Entropy Weight Method. Master’s Thesis, Tarim University, Aral Shehri, China, 2020. (In Chinese). [Google Scholar]
  35. Xu, X.G.; Yan, L.; Xu, L.F.; Lu, Y.L.; Ma, L.Y. Ecological Risk Assessment of Natural Disasters in China. J. Peking Univ. Chem. Technol. 2011, 47, 901–908. (In Chinese) [Google Scholar]
  36. GB/T 20481–2017; Grades of Meteorological Drought. Standardization Administration of the People’s Republic of China: Beijing, China, 2017. Available online: https://kns.cnki.net/kcms/detail/detail.aspx?FileName=SCSF00050541&DbName=SCSF (accessed on 16 June 2022).
  37. Costanza, R.; Arge, R.; Groot, R.; Farber, S.; Grasso, M.; Hannon, B.; Belt, M. The value of the world’s ecosystem services and natural capital. Nature 1997, 387, 253–260. [Google Scholar] [CrossRef]
  38. Xie, G.D.; Lu, C.X.; Leng, Y.F.; Zheng, D.; Li, S.C. Evaluation of Ecological Assets on the Qinghai-Tibet Plateau. J. Nat. Resour. 2003, 18, 189–196. (In Chinese) [Google Scholar]
  39. Xu, Y.Q.; Zhou, B.T.; Yu, L.; Shi, Y.; Xu, Y. The spatiotemporal characteristics of future forest ecosystem service value in China under the background of climate change. Chin. J. Ecol. 2018, 38, 1952–1963. (In Chinese) [Google Scholar]
  40. Chen, Y.B.; Liu, L.J.; Chen, X.L. Forecasting China’s Inflation Rate: A Comparative Analysis Based on LSTM Model and BVAR Model. Res. Financ. Issues 2021, 6, 18–29. (In Chinese) [Google Scholar]
  41. China Meteorological Administration. High Temperature Warning Signal and Defense Guide [EB/OL]. Available online: http://www.qxkp.net/qxbk/yjxhjfyzn/202103/t20210312_2948454.html (accessed on 3 August 2022).
  42. Li, B.Z.; Zhou, G.S. Research progress on drought indicators. Chin. J. Ecol. 2014, 34, 1043–1052. (In Chinese) [Google Scholar]
  43. Chen, D.D.; Zi, T.; Zhang, Y.F. Drought risk assessment during wheat growing period in Sichuan Province based on water gain and loss index. J. Nat. Disasters 2017, 26, 155–163. (In Chinese) [Google Scholar]
  44. Yan, J. Analysis of Temporal and Spatial Variation Characteristics of Maize Drought in Liaoning Province Based on Crop Water Deficit Index. Master’s Thesis, Shenyang Agricultural University, Shenyang, China, 2018. (In Chinese). [Google Scholar]
  45. Cao, Y.Q.; Li, L.H.; Lu, J.; Zhang, R.N. Analysis of drought characteristics during maize growth period in Liaoning Province based on SPEI. Chinese. J. Ecol. 2021, 41, 7367–7379. (In Chinese) [Google Scholar]
  46. Pan, G.F.; Wang, B.F.; Chen, B.; Fang, Z.B.; Zhao, S.S.; Tian, Y.H. Effects of sowing date on yield, growth period and utilization of temperature and light of different types of japonica rice in central and northern Hubei. Crop. J. 2021, 4, 105–111. (In Chinese) [Google Scholar]
  47. Wang, H.Y.; Gong, Q. Analysis of the abnormal characteristics of precipitation in the growing season of crops in Northeast China. Meteorol. Sci. Technol. 2005, 33, 345–349. (In Chinese) [Google Scholar]
  48. Zhao, C.Y.; Wang, Y.; Zhang, Y.S.; Yan, X.Y. Changes of climatic conditions during the growing season of crops in Liaoning Province in the past 50 years and their impact on agricultural production. Disaster Sci. 2009, 24, 102–106. (In Chinese) [Google Scholar]
  49. Chou, J.M.; Dong, W.J.; Feng, G.L. A method to quantitatively assess the impact of climate change on economic output. Sci. Bull. 2011, 10, 21–23. (In Chinese) [Google Scholar]
  50. Xiong, W.; Holman, I.P.; You, L.Z.; Yang, J.; Wu, W. Impacts of observed growing-season warming trends since 1980 on crop yields in China. Reg. Environ. Chang. 2014, 14, 7–16. [Google Scholar] [CrossRef]
  51. Xu, G.C.; Kang, M.Y.; He, L.N.; Li, Y.F.; Chen, Y.R. Ecological vulnerability and its research progress. Chin. J. Ecol. 2009, 29, 2578–2588. (In Chinese) [Google Scholar]
  52. Wu, S.H.; Pan, T.; Liu, Y.H.; Deng, H.Y.; Jiao, K.W.; Lu, Q.; Gao, J.B. China’s comprehensive climate change risk zoning. Acta Geogr. Sin. 2017, 72, 3–17. (In Chinese) [Google Scholar]
  53. GB/T 28592-2012; Precipitation Level. Standardization Administration of the People’s Republic of China: Beijing, China, 2012. Available online: http://cmastd.cmatc.cn/bzjd/1357.jhtml (accessed on 16 June 2022).
  54. Xinhua News Agency. Several Opinions of the Central Committee of the Communist Party of China and the State Council on Adhering to Prioritizing the Development of Agriculture and Rural Areas and Doing a Good Job in “Three Rurals”. China Pig Ind. 2019, 14, 17–23. (In Chinese) [Google Scholar]
  55. Chou, J.M.; Xian, T.; Dong, W.J.; Xu, Y. Regional temporal and spatial trends in drought and flood disasters in China and assessment of economic losses in recent years. Sustainability 2018, 11, 55. [Google Scholar] [CrossRef]
  56. Shi, B.; Zhu, X.; Hu, Y.; Yang, Y. Drought characteristics of Henan province in 1961–2013 based on Standardized Precipitation Evapotranspiration Index. J. Geogr. Sci. 2017, 27, 311–325. [Google Scholar] [CrossRef]
  57. The Central People’s Government of the People’s Republic of China. The Investigation Report on the “7.20” Heavy Rainstorm Disaster in Zhengzhou, Henan Announced [EB/OL]. Available online: http://www.gov.cn/xinwen/2022-01/21/content_5669723.htm (accessed on 3 August 2022).
  58. Jing, J.L.; He, C.X.; Wang, Y.F.; Ma, B.X.; Liu, B. Analysis of temporal and spatial evolution characteristics of drought in South west China from 1902 to 2018. Soil Water Conserv. Res. 2022, 29, 220–227. (In Chinese) [Google Scholar]
Figure 1. Estimated indicator weights of drought vulnerability in China’s agroecosystem from 2020 to 2050: (a) SSP1-2.6 drought sensitivity; (b) SSP1-2.6 drought exposure; (c) SSP1-2.6 drought adaptability; (d) SSP2-4.5 drought sensitivity; (e) SSP2-4.5 drought exposure; (f) SSP2-4.5 drought adaptability; (g) SSP5-8.5 drought sensitivity; (h) SSP5-8.5 drought exposure; (i) SSP5-8.5 drought adaptability.
Sustainability 14 10069 g001
Figure 2. Estimated indicator weights of flood vulnerability in China’s agroecosystem from 2020 to 2050: (a) SSP1-2.6 flood sensitivity; (b) SSP1-2.6 flood exposure; (c) SSP1-2.6 flood adaptability; (d) SSP2-4.5 flood sensitivity; (e) SSP2-4.5 flood exposure; (f) SSP2-4.5 flood adaptability; (g) SSP5-8.5 flood sensitivity; (h) SSP5-8.5 flood exposure; (i) SSP5-8.5 flood adaptability.
Sustainability 14 10069 g002
Figure 3. Flowchart of the future drought and flood vulnerability and risk prediction. (年: year).
Sustainability 14 10069 g003
Figure 4. Drought vulnerability of China’s agroecosystem under the SSP1-2.6, SSP2-4.5, and SSP5-8.5 scenarios from 2020 to 2050. Note: (a) SSP1-2.6 drought vulnerability classification; (b) SSP2-4.5 drought vulnerability classification; (c) SSP5-8.5 drought vulnerability classification; (d) SSP1-2.6 drought vulnerability index; (e) SSP2-4.5 drought vulnerability index; and (f) SSP5-8.5 drought vulnerability index.
Sustainability 14 10069 g004
Figure 5. Flood vulnerability of China’s agroecosystem under the SSP1-2.6, SSP2-4.5, and SSP5-8.5 scenarios from 2020 to 2050. Note: (a) SSP1-2.6 flood vulnerability classification; (b) SSP2-4.5 flood vulnerability classification; (c) SSP5-8.5 flood vulnerability classification; (d) SSP1-2.6 flood vulnerability index; (e) SSP2-4.5 flood vulnerability index; and (f) SSP5-8.5 flood vulnerability index.
Sustainability 14 10069 g005
Figure 6. Probability of drought and flooding in China’s agroecosystem under different SSP scenarios from 2020 to 2050. Note: (a) Probability of drought; and (b) probability of flooding.
Sustainability 14 10069 g006
Figure 7. The value of agroecosystem services in China from 2020 to 2050.
Sustainability 14 10069 g007
Figure 8. Drought risk of China’s agroecosystem under the SSP1-2.6, SSP2-4.5, and SSP5-8.5 scenarios from 2020 to 2050. Notes: (a) SSP1-2.6 drought risk; (b) SSP2-4.5 drought risk; and (c) SSP5-8.5 drought risk.
Sustainability 14 10069 g008
Figure 9. Flood risk of China’s agroecosystem under the SSP1-2.6, SSP2-4.5, and SSP5-8.5 scenarios from 2020 to 2050. Note: (a) SSP1-2.6 flood risk; (b) SSP2-4.5 flood risk; and (c) SSP5-8.5 flood risk.
Sustainability 14 10069 g009
Table 1. Prediction indicator system for agroecosystem drought vulnerability in China’s provinces from 2020 to 2050.
Target LayerCriterion LayerIndicator (Unit)Indicator Description and Calculation Method
Drought vulnerability of China’s agroecosystemSensitivityProbability of high temperature above 35 °C (%)Positive indicator. Calculated by dividing the cumulative number of years with the daily maximum temperature ≥35 °C by the total number of years in the desired year
Average number of consecutive dry days per year (d)Positive indicator. According to the standardized precipitation index (SPI) and Meteorological Drought Scale [36]. The number of consecutive drought days refers to the number of consecutive days when the daily SPI reaches moderate drought, severe drought, and extreme drought. The probability of occurrence of drought for more than 15 consecutive days is calculated by dividing the cumulative number of SPI reaching moderate drought, severe drought, and extreme drought for 15 consecutive days or more in the crop growing season from April to September in the desired year by the number of years.
Probability of drought for more than 15 consecutive days per year (%)
ExposureYear-end resident population (104)Positive indicator. Multidimensional population forecast data under SSP1-2.6, SSP2-4.5, and SSP5-8.5 scenarios from 2020 to 2050 [24].
Grain sown area (103 hm)Positive indicator. According to the red line policy of 1.8 billion mu of arable land in China, it is assumed that the sown area of grain will remain unchanged after 2020.
Agroecological water consumption (109 m3)Positive indicator. Assuming that the per capita agricultural ecological water consumption from 2020 to 2050 is constant, which is the same as the situation in 2004 to 2019, then the agricultural ecological water consumption from 2020 to 2050 = ∑ (2004 to 2019 per capita agricultural ecological water consumption of each province × annual predicted population of each province).
AdaptabilityGDP per capita (Yuan/person)Inverse indicator. The adaptability level is assumed to be the same as the drought adaptability status from 1991 to 2019, and the reverse normalized value of the drought adaptability data from 1991 to 2019 is used as the drought adaptability index.
Agricultural chemical fertilizer use per unit of grain sown area (t/hm)
Forest area (104 hm)
Per capita water resources (m3/person)
Gross output of agriculture, forestry, animal husbandry, and fishery (109 yuan)
Total power of agricultural machinery (104 kW)
Total reservoir capacity (109 m3)
Table 2. Prediction index system of agroecosystem flood vulnerability in China’s provinces from 2020 to 2050.
Target LayerCriterion LayerIndicator (Unit)Indicator Description and Calculation Method
Flood vulnerability of China’s agroecosystemSensitivityProbability of rainstorm (%)Positive indicator. Calculated by dividing the cumulative number of years with daily precipitation ≥50 mm by the total number of years in the desired year *.
Average number of rainy days per year (d)Positive indicator. Calculated by dividing the cumulative number of days with daily precipitation ≥ 50 mm by the number of years in the desired year *.
Average annual number of days with heavy rain (d)Positive indicator. Calculated by dividing the cumulative number of days with daily precipitation at (25 mm and 50 mm) by the number of years in the desired year *.
ExposureYear-end resident population (104)Positive indicator. Multidimensional population forecast data under SSP1-2.6, SSP2-4.5, and SSP5-8.5 scenarios from 2020 to 2050 [24].
Grain sown area (103 hm)Positive indicator. According to the red line policy of 1.8 billion mu of arable land in China, it is assumed that the sown area of grain will remain unchanged after 2020.
Agroecological water consumption (109 m3)Positive indicator. Assuming that the per capita agricultural ecological water consumption from 2020 to 2050 is constant, which is the same as the situation in 2004 to 2019, then the agricultural ecological water consumption from 2020 to 2050 = ∑ (2004 to 2019 per capita agricultural ecological water consumption of each province × annual predicted population of each province).
AdaptabilityGDP per capita (Yuan/person)Inverse indicator. Adaptability is assumed to be the same as the flood adaptability from 1991 to 2019, and the reverse-standardized value of the flood adaptability data from 1991 to 2019 is used as the flood adaptability index
Agricultural chemical fertilizer use per unit of grain sown area (t/hm)
Waterlogging area (103 hm)
Per capita water resources (m3)
Forest area (104 hm)
Total power of agricultural machinery (104 kW)
Total reservoir capacity (109 m3)
Note: The data of per capita water resources are missing; therefore, the data time of per capita water resources is selected from 2004 to 2019 *, indicating that the calculation method is based on the precipitation grade [53].
Publisher’s Note: MDPI stays neutral with regard to jurisdictional claims in published maps and institutional affiliations.

