Abstract
Currently, less than 15% of waste iron tailings are utilized. Iron tailings can be used as fine aggregate in concrete, but this kind of concrete has no coarse aggregate, resulting in low strength. Additionally, iron tailings contain some heavy metals, which will cause environmental pollution if improperly treated. In this study, the mechanical properties, sulfate resistance, and pore structure distribution of basalt fiber-biochar-concrete (PFB) were studied. Where basalt is to enhance the mechanical properties of samples, and biochar is to adsorb heavy metals in iron tailings, to prepare environmentally friendly materials. Unconfined compressive strength (UCS) test, flexural strength (FS), sulfate immersion test, leaching behavior, and mercury intrusion porosimetry (MIP) test were used to study the performance of the samples, and X-ray diffraction (XRD), Fourier transform infrared spectrometer (FTIR), and scanning electron microscope (SEM) was used to characterize the samples, explaining the change mechanism of the macroscopic test. The results show that the compressive strength of PFB increased by 2.5% but the flexural strength increased by 12%. The basalt and biochar improve the pore size distribution of samples, that is, the pore size greater than 10 nm is reduced while the pore size between 2 and 6 nm is increased. Biochar can effectively adsorb heavy metals of Cu, Zn, Pb, and Cd, and their leaching concentration is reduced by 50–70%. Basalt fiber improves the mixing performance of concrete, while biochar with a small particle size fills the micro pores in concrete; this paper provides a new idea of sustainability for the preparation of environmentally friendly materials and the utilization of waste iron tailings.
1. Introduction
Recently, with the sustainable development of infrastructure construction, industrialization, and urbanization, the demand for construction materials is gradually increasing [1,2]. Concrete is one of the raw materials for infrastructure construction, and its consumption and demand are huge [3]. The collection of sand and gravel in concrete is mainly natural river sand [4]. As a non-renewable resource, the demand for natural river sand is in short supply due to massive exploitation. Excessive exploitation of river sand will lead to the destruction of ecological balance [5]. At present, the utilization of waste is encouraged, and about 300 million tons of tailings resources are discarded every year in China [6,7]. A small part of these waste tailings is used for backfilling, and their overall utilization is less than 15% [8]. Hence, iron tailings have become one of the largest industrial solid wastes in China. The particle size distribution of these tailings is wide, and it is a new idea to replace fine aggregate in concrete [9].
Iron tailing sand is a kind of slurry mineral waste [10]. The main chemical components in iron tailing sand are SiO2, Al2O, Fe2O3, CaO, and Mg2O, which are similar to natural aggregate, thus it is feasible to replace part of natural fine aggregate with iron tailings sand. Recent literature [11] showed that 50% iron tailings could make concrete obtain the best sulfate attack resistance. Reducing the water-binder ratio is beneficial to improving the mechanical properties and durability of iron tailings concrete. Additionally, the mechanism of adding iron tailings to concrete to improve the performance of samples is revealed [12]. Because of the pozzolanic activity (which contains a large amount of active calcium oxide) in rice husks, the iron tailings concrete underwent a secondary hydration reaction that produced an amount of calcium silicate gel to increase bond strength and fill the internal pores. Some scholars [13,14] reported the first-principles approaches, which are used to calculate the strength of materials. Applying this method to the strength calculation of iron-tailings concrete can better compare the theoretical strength model with the actual strength of test blocks.
However, iron tailings contain some heavy metals, such as Cu, Zn, and Pb [15]. If these harmful components are not effectively treated, concrete construction will be destroyed, and it will cause secondary pollution to the environment [16]. Biochar is an environmental protection material, which can absorb harmful substances such as heavy metals [17,18]. Usage of biochar may contribute to the treatment of heavy metals in tailings. Some researchers [19] have pointed out that biochar could change the chemical form of heavy metals, especially the Fe-Mn oxide-bound; this can stabilize the heavy metals in the sample.
Compared with ordinary concrete, fiber-reinforced concrete can prolong the service life of concrete materials and reduce the pollution caused by building production [20,21]; this reduces energy consumption, greatly reduces the damage of infrastructure materials to the environment, and it is also conducive to the sustainable development of society [22]. Fiber-reinforced concrete has good ductility, but its strength decreases due to the absence of coarse aggregate. At present, there are many studies on basalt fiber concrete, because it is a natural fiber and has little pollution to the environment; its addition can significantly improve the permeability, carbonization resistance, acid and alkali corrosion resistance, frost resistance, and high-temperature resistance of the concrete structure [23]. Additionally, Refai et al. [24] have pointed out that the main function of fiber-reinforced concrete is to improve the shear strength of concrete, about 43–46%. Karthikeyan et al. [25] pointed out that a 0.25% steel fiber and 0.25% basalt fiber combination could be used to improve the tensile and flexural properties of iron-tailings concrete. The results show that compared with traditional concrete, the fiber composite with 30% iron tailings is the optimum mix.
At present, there is little research on basalt fiber-biochar-iron tailings concrete (PFB). In this study, basalt fiber is used to enhance the mechanical properties of iron tailings concrete, and biochar is used to reduce the leaching concentration of heavy metals in iron tailings. The compressive strength, flexural strength, and sulfate resistance of basalt fiber-biochar-iron tailings concrete were studied, and the changing rule of sample properties was explained by Fourier transform infrared spectrometer (FTIR), X-ray diffraction (XRD), mercury intrusion porosimetry (MIP), and scanning electron microscope (SEM) tests. Finally, the toxicity characteristic leaching procedure (TCLP) test confirmed that PFB samples are environment-friendly materials.
2. Materials and Methods
2.1. Raw Material
2.1.1. Portland Cement and Iron Tailings
The Portland cement (PC) used in this test is P.O. 42.5, purchased from Kangda Company in Wuhan, China. Iron tailings (IT) were collected from Hanyang Waste Plant in Wuhan, China; their main components are shown in Table 1. Among them, the main components in PC are CaO and SiO2, which are 61.31 wt.% and 26.65 wt.%, respectively. While the main component in IT is only SiO2, which is 69.34 wt.%; it has a bulk density of 1370 kg/m3 and a void ratio of 45%, which meets the Chinese standard “GB/T 14684-2001”. The particle size distributions of PC, IT, and biochar are shown in Figure 1. The morphologies of PC and IT are shown in Figure 2a,b.

Table 1.
Chemical composition of PC and IT (wt.%).

Figure 1.
Particle size distribution of cement, iron tailings, and biochar.
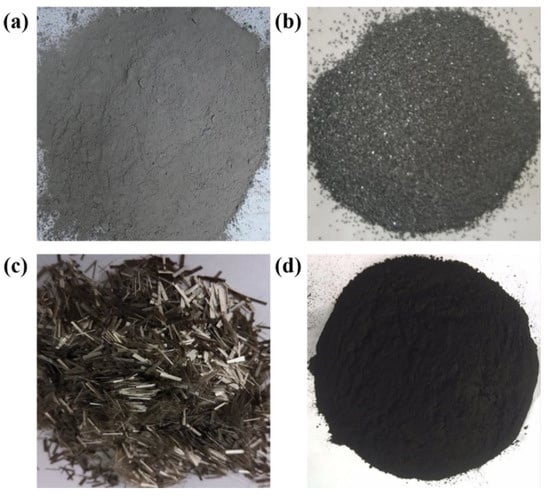
Figure 2.
The morphologies of raw materials. (a) PC, (b) IT, (c) basalt fiber, and (d) biochar.
2.1.2. Basalt Fiber
Basalt fiber is a new high-performance fiber material, which main includes silica, alumina, and other oxides. Basalt continuous fiber has not only high strength but also has many excellent properties such as electrical insulation, corrosion resistance, and high-temperature resistance; it has little environmental pollution and is an environmentally friendly fiber [26,27]. The physical properties of basalt fiber are shown in Table 2, and its morphology is given in Figure 2c.

Table 2.
Physical properties of basalt fiber.
2.1.3. Biochar
The raw material for biochar is corn stalks. The corn stalks collected are waste products. Corn stalks were dried in an oven at 70 °C for 16 h. After that, the corn stalks were then heated in a furnace at 450 °C. A small vent is set on the furnace and was used to vent steam during heating, which could prevent the prevent re-deposition of organics and volatiles onto the biochar surface. The heating rate was set to 15 °C/min to the pyrolysis temperature. The dried biochar powder was ground into 200 mesh with a miller (XQM-2A), and then they were put into a dry light-proof bottle and stored in a cool and dry place for later use. The morphology is shown in Figure 2d.
2.2. Sample Preparation
The mixed proportion of samples is shown in Table 3. Six groups of samples were set up in this work, among which C1 and C2 were two control groups. Basalt fiber and biochar were not added in the C1 group, and only 10 g biochar was added in the C2 group for comparison with sample PFB11. The water-binder (binder includes PC and biochar) ratio of all samples was 0.4. PC, basalt fiber, biochar, and IT were mixed with the proportions shown in Table 3, and they were stirred in a blender (JJ-5) at 120 rpm for 2 min. After that, pour the evenly stirred slurry into a 40 mm × 40 mm × 40 mm and 40 mm × 40 mm× 160 mm mold. After 24 h (because the sample has reached its final setting state), the mold was removed and the sample was placed at 25 ± 2 °C, 95 ± 2% R.H. In the curing tank for later use.

Table 3.
Mix proportion of samples.
2.3. UCS and FS Test
According to “GB/T50081-2002”, unconfined compressive strength (UCS) and flexural strength (FS) tests were carried out on samples cured for 7 days and 28 days. A universal testing machine (CMT6103) was used to test, and the measuring range was 0–300 kN. The loading rate used in the compressive test was 2.4 kN/s. Among them, 40 mm × 40 mm × 40 mm samples were used in the UCS test, and 40 mm × 40 mm × 160 mm samples were used in the FS test. The core of the tested sample was taken out for other characterization tests.
2.4. FTIR Test
Fourier transform infrared spectrometer (FTIR) test is often used to analyze chemical bonds of substances. In this test, the instrument model used was Nicolet iS 50, the test method was powder conventional tablet test, the test mode was transmittance, and the test range was 400–4000 cm−1. After mechanical properties testing, the sample core was ground into a powder with a mortar and then screened for 200 mesh. The ground powder was put into the instrument for testing.
2.5. XRD Test
D8-Advance X-ray diffraction (XRD) instrument is used to analyze the compounds in the samples. The goniometer radius of the instrument was ≥200 mm, the current was 30 mA, the current was 35 kV, the scanning range was 5–50, and the scanning speed was set to 5°/min. After the mechanical test, the core of the samples was soaked in absolute ethanol for 24 h. After that, the samples were taken out and dried in an oven at 50 °C for 24 h. Then, the sample was ground into powder and passed through a 200-mesh sieve; these ground samples were put into the instrument for the XRD test.
2.6. SEM Test
The model of the scanning electron microscope (SEM) instrument is FEG450. After testing the mechanical properties of samples cured for 28 days, the sample core was soaked in anhydrous ethanol to stop hydration, and the samples were taken out after 24 h. The samples were broken to 2–3 mm and then placed in an oven at 50 °C for 24 h. To make the sample conductive, the sample was gilded and then placed in the instrument for testing.
2.7. Sulfate Attack Test
The sulfate attack test mainly investigated the effect of sulfate ions on the mechanical properties of samples. The specimens were molded 24 h after molding, cured for 7 days under standard curing conditions (20 ± 2 °C, 95 ± 2% R.H.), and then they were soaked in 5% Na2SO4 solution. The erosion time was 21 days, and the total curing time was 28 days. The pH value of sodium sulfate erosion solution was within the range of 7–8 in order to avoid the acid attack or alkali attack [28]. Specimens were soaked in Na2SO4 solution, and their mass was tested at 28 days, and the tested mass was compared with that of standard curing specimens at the same age. The calculation of the mass erosion coefficient is shown in Equation (1), and the calculation of the strength erosion coefficient is shown in Equation (2).
where Cm refers to mass erosion coefficient, m1 refers to the mass of the soaked sample, and m0 refers to the mass of the standard sample. Cs refers to the strength erosion coefficient, s1 refers to the strength of the soaked sample, and s0 refers to the strength of the standard sample.
2.8. MIP Test
Poremaster-60 mercury intrusion porosimetry (MIP) was used to analyze the pore structure in this experiment. After the mechanical properties were tested, the core of the sample was soaked in absolute ethanol for 24 h, and then they were taken out and dried in an oven at 50 °C for 24 h. After that, the sample was broken into particle blocks with a diameter of 1.0–1.5 cm. 1.5 g broken sample was put into a glass sample tube for testing. The test gas was nitrogen, the low-pressure test range is 0–40 Psia, the high-pressure test range was 0–60,000 Psia, the measurable pore diameter was 4–5000 nm, and the contact angle was 130°.
2.9. TCLP Test
The toxicity characteristic leaching procedure (TCLP) was used to analyze the concentration of heavy metals in iron tailings. The TCLP test was carried out according to the requirements of the standard of “HJ/T 300-2007”. 5 g of the sample was added to 96.5 mL of deionized water, and the mixture is cooled to 21 °C after magnetic stirring for 5 min. The pH of the extract (glacial acetic acid) was adjusted to 2.64 ± 0.05 by 0.1 mol/L NaOH solution [29]. The sample was ground in a mortar and then passed a sieve larger than 200 mesh, and the ground powder and extract were put into the centrifugal tube at 1:20. The centrifugal tube was placed in a rotary oscillator and oscillated at 32 rpm and 23 ± 2 °C for 20 h. After the shock, a 0.45 um microporous filtration membrane was used to filter the supernatant, and 10 mL filtrate was taken and placed in a refrigerator at 4 °C. After that, an atomic absorption spectrometer was used to analyze the change in heavy metal concentration.
3. Results and Discussion
3.1. Strength Results
Figure 3 shows the compressive strength and flexural strength results of the samples at 7 and 28 days, and the strength differences of these samples are analyzed by the strength activity index (SAI, the compressive strength (or flexural strength) value of the studied sample divided by the compressive strength (or shear strength) value of the control sample). As can be seen from Figure 3a,b, the 7-day compressive strength of samples PFB12 and PFB22 are lower than that of samples C1 and C2, which are decreased by 6.9–8.2%; this is because the high content of biochar reduces the ratio of cement, thus reducing the compressive strength of the sample. At 28 days, the strength of PFB21 and PFB22 is slightly lower than that of C1 and C2, while the compressive strength of PFB11 and PFB12 is higher than that of C1 and C2, but their SAI fluctuation ranges are all between 2.1–2.5%; this shows that basalt fiber has a certain role in the compressive strength of concrete, and the effect on early compressive strength is higher than that on late compressive strength; it is because the early hydration effect is not obvious, basalt fiber reinforcement is dominant, therefore, can significantly enhance the compressive strength. On the contrary, at 28 days, the hydration reaction is basically completed, which is the main factor affecting the late compressive strength of samples. Meanwhile, due to the good tensile effect of basalt fiber, it greatly improves the flexural strength of the sample but has little influence on the 28-day compressive strength. At the early stage (7 days), the compressive strength of the sample is not high, and the sample is not brittle failure. On the contrary, at 28 days, there are many hydration products in the sample [30,31], and these cementing materials have hardened, which leads to brittle failure of the sample; however, basalt fiber has little resistance to brittle failure, resulting in low compressive strength of sample with 0.2 wt.% dosages. Additionally, the addition of biochar had little effect on the compressive strength at 28 days.
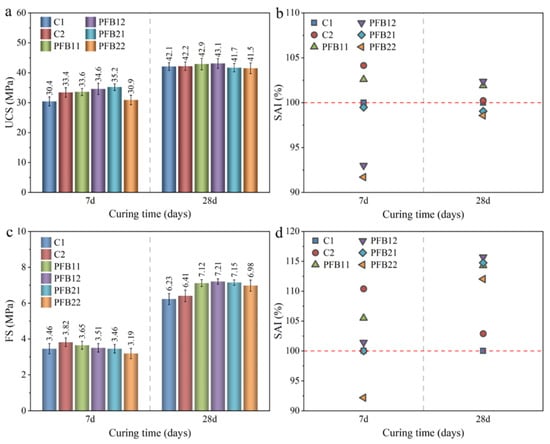
Figure 3.
Results of unconfined compressive strength (UCS) and flexural strength (FS) tests. (a) UCS test results, (b) SAI analysis for UCS results, (c) FS test results, and (d) SAI analysis for FS results.
The results of flexural strength (in Figure 3c,d) are different from those of compressive strength. At 7 days, only the flexural strength of sample PFB22 is 7.3% lower than that of C1, while the flexural strength of other samples is equal to or greater than C1, with an increase by 0–12%; this is mainly because the good tensile property of basalt fiber can effectively improve the bending property of the sample, but has little influence on the compressive property of the sample. The 28-day flexural strength of the PFB-group sample is greater than samples C1 and C2, which indicates that basalt fiber can effectively resist the flexural failure of concrete; it is contrary to the results of compressive strength, which indicates that the high fiber content in concrete is not conducive to improving its compressive strength. The 28-day flexural strength of the sample of 0.1 wt.% basalt fiber is significantly higher than that of 0.2 wt.% basalt fiber. To sum up, basalt fiber can significantly improve the flexural strength of concrete at 28 days, while the compressive strength at 28 days is not significantly improved, as well as 0.1 wt.% fiber content is the best. Biochar reduces the compressive strength at 7 days but has little effect on the compressive strength at 28 days.
3.2. FTIR Analysis
The FTIR test was used to analyze the chemical bonds of the components in the sample, as shown in Figure 4; these peaks refer to different groups: the peak at 468 cm−1 is the bending vibration of Si-O, and the peak at 1012 cm−1 refers to the stretching vibration of the Si-O tetrahedron; this is because C3S (CaO·3SiO2) and C2S (CaO·2SiO2) produced during hydration can affect the Si-O bond, and the peak values of PFB11 and PFB12 are lower than those of other samples, which indicates that the hydration of basalt fiber can be inhibited when its content is 0.1 wt.%; this is consistent with the results of the XRD test.
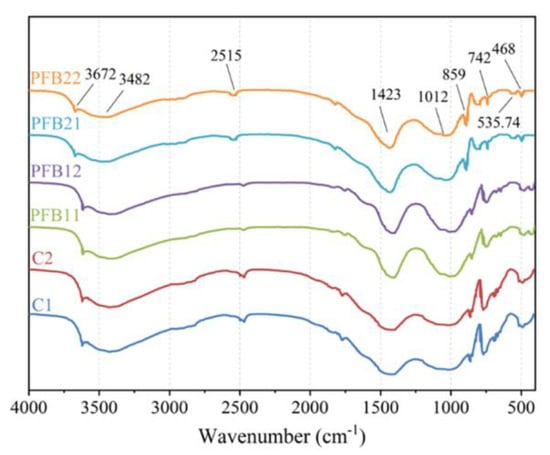
Figure 4.
FTIR analysis of samples.
The peak at 742 cm−1 refers to v4 of CO3, 859 cm−1 denotes CO32− out-of-plane bending vibration, and the peak at 1423 cm−1 refers to C-O symmetric stretching vibration; these two peaks mainly represent the change of the C-O bond in CaCO3, and the formation of CaCO3 is related to the carbonization of calcium oxide. There is little difference in these two peaks of all samples, which indicates that basalt fiber and biochar do not influence the carbonization results of samples. The peaks at 3482 cm−1 and 3672 cm−1 both represent O-H vibrations in H2O; this is due to the depletion of water molecules during hydration reaction, which leads to the breakage of O-H bonds in H2O. Generally speaking, the addition of basalt fiber and biochar cannot lead to the formation of new chemical groups, which shows that basalt and biochar are both environmentally friendly materials.
3.3. XRD Analysis
To investigate the effects of basalt fibers, biochar, and iron tailings on the composition of concrete, the XRD test was used to analyze the hydration products in the samples. As can be seen from Figure 5, five components, including calcium hydroxide, quartz, mineral composition in cement (C3S, C2S (CaO·2SiO2)), and calcium silicate hydrate (C-S-H) crystal were found in the sample. Generally speaking, the peak values of quartz sand in six samples have little change, mainly because SiO2 chemical properties are stable; it is worth noting that the peak values of Ca(OH)2 in samples PFB11 and PFB12 are significantly lower than those in other samples; this shows that the secondary hydration reaction is inhibited when the basalt fiber is 0.1 wt.%, resulting in a lot of Ca(OH)2 not being consumed. Additionally, the peaks of C-S-H in the samples added with both basalt fibers and biochar (PFB11, PFB12, PFB21, and PFB22) are significantly higher than those in the controls C1 and C2; this indicates that the addition of basalt fiber and biochar can improve the strength of the sample from a physical point of view, mainly because basalt can improve the uniformity of samples during the process of sample production. Meanwhile, the particles of biochar are fine, so it is easy to fill the tiny pores in the sample, which is conducive to hydration reaction.

Figure 5.
XRD analysis of samples.
The hydration products which are beneficial to mechanical properties are C3S, C2S, and Ca(OH)2; it can be seen from Figure 5 that the peak values of CS (C3S and C2S) in samples PFB21 and PFB22 are significantly higher than those in other samples. Meanwhile, the peaks of Ca(OH)2 in samples PFB21 and PFB22 are high than that in samples PFB11 and PFB12. The high content of Ca(OH)2 means that the effect of secondary hydration reaction is poor, leading to the reduction of C-S-H generation; this shows that when the content of basalt fiber is 0.1 wt.%, the mixing property of samples can be improved; this also promotes the contact between cement particles and water, improves hydration reaction [32], and generates more C-S-H. Thereby improving the mechanical properties of cement, which is consistent with the results in Figure 3.
3.4. Pore Structure Analysis
The pore structure of 6 samples was analyzed by the MIP test, and the analysis results are shown in Figure 6. As can be seen from Figure 6a, the general trend of C1 and C2 is different from that of the PFB group. At 2–10 nm, the pore sizes of C1 and C2 are very low, while their pore sizes are mainly distributed between 10–20 nm; however, the pore size of the PFB group mainly ranges from 2 to 6 nm, and the pore size larger than 10 nm decreases rapidly; this is mainly because the addition of basalt fiber improves the mixing property of samples and also improves the contact between cement and water molecules, thus improving hydration and making the structure of samples more compact. Additionally, it also indicates that fine biochar can play a role in filling micro-cracks, which contributes to the reduction of the pore structure.
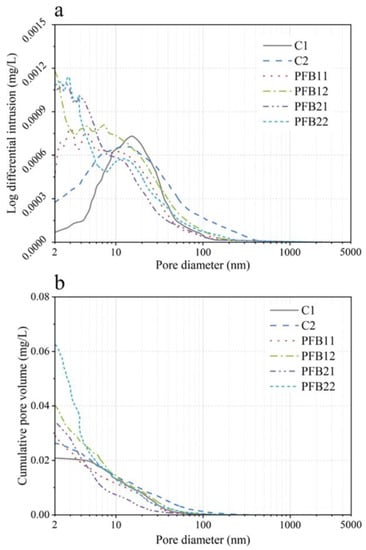
Figure 6.
Pore size distribution of the sample. (a) Log differential intrusion, and (b) cumulative volume.
To further analyze pore distribution, the median pore size is used. The median pore size refers to the pore size corresponding to 50% of the total pore volume in the cumulative pore diameter curve (in Figure 6b). When the cumulative pore volume is similar, the large median pore size results in a large proportion of pores in the pore structure. In terms of the change in median pore size, the median pore size of concrete specimens with 0.1–0.2 wt.% basalt fiber decreased significantly compared with the control group C1; this indicates that the addition of basalt fibers reduces the macropores in the pore structure; it can also be seen from Figure 6b that the distribution of small pore size is: PFB22 > PFB21 > PFB12 > PFB11 > C2 > C1; these results indicate that the addition of basalt fiber and biochar can effectively improve the pore size distribution in the samples, especially the effect of 0.2 wt.% basalt fiber and 5 wt.% biochar is the best.
3.5. SEM Analysis
The microscopic morphology of the standard curing sample and sulfate erosion sample is shown in Figure 7. The C-S-H distribution of C1 and PFB under standard curing (in Figure 7a,c) is significantly wider than that after sulfate erosion (in Figure 7b,d); this proves that sulfate erosion has damage to hydration. Additionally, the content of ettringite in Figure 7a,c is higher than that in Figure 7b,d, furthermore, the content of holes in standard curing samples is also decreasing and they have no large holes, which shows that iron tailings, ettringite, and basalt fibers are combined. Iron tailings have certain activity [33], which promotes the hydration reaction of concrete; meanwhile, biochar has a small particle size and can fill large holes.
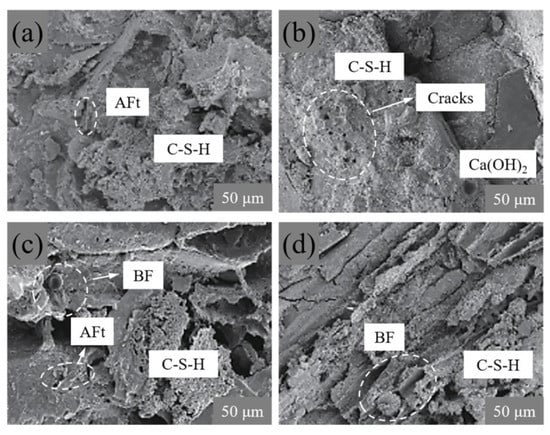
Figure 7.
Microtopography of C1 and PFB. (a) Sample C1 for 28-day standard curing, (b) sample C1 for 28-day soaked in sulphate, (c) sample PFB22 for 28-day standard curing, and (d) sample PFB22 for 28-day soaked in sulphate. Where BF refers to basalt fiber, and C-S-H refers to calcium silicate hydrate.
As can be seen from Figure 7b, many pores are in the sample after sulfate erosion (in Figure 7b), and the basalt fiber surface is slightly eroded (in Figure 7d); these pores cause the whole sample structure to change from dense to loose. The reason is that the hydrate products are eroded by the long-term sulfate immersion, which destroys the integrity of the sample structure and makes the hydrate products loose and unevenly distributed; this directly leads to pores in the internal structure of the sample, thus reducing the mechanical properties of the concrete (in Figure 8).
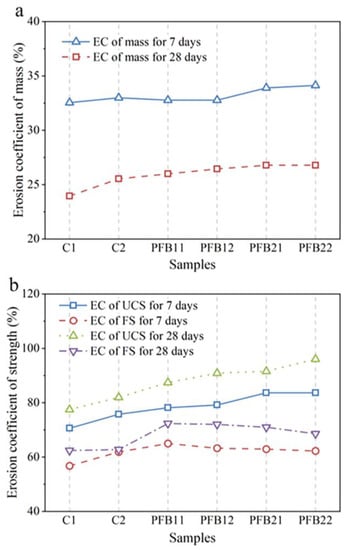
Figure 8.
Erosion coefficient of the sample. (a) Erosion coefficient (EC) of UCS and FS for 7 and 28 days, (b) Erosion coefficient of mass for 7 and 28 days.
To sum up, the distribution of basalt fiber enhances the tightly binding of biochar, iron tailings, and hydration products. Basalt fiber plays a reinforcing mechanism and enhances the integrity of the sample structure; however, there are many gaps and pores on the contact surface between fiber and hydration products. There are two reasons. On the one hand, the disorderly distribution of fiber changes the original pore structure of concrete [34], resulting in a loose structure of the sample. On the other hand, the basalt fibers absorb a large amount of sulfate solution [35], which leads to the hydration products around basalt fiber being easily eroded, resulting in a large number of pores in the interface between the fibers and the cement (Figure 7d).
3.6. Analysis of Resistance to Sulfate Attack
The mechanical properties of PFB and the control group after soaking in sulfate resistance are shown in Figure 9. Compared with the samples without soaking in sulfate, the strength of UCS and FS of the soaked samples decreases. The strength corrosion resistance coefficient (in Figure 8b) is obtained by dividing the strength value of the soaked sample (in Figure 9) by the unsoaked sample (in Figure 3).
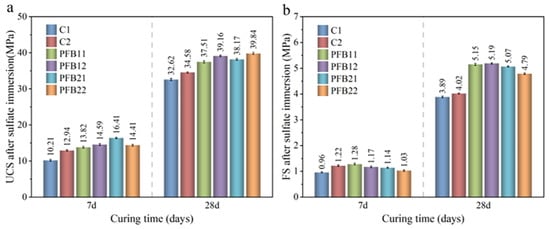
Figure 9.
Mechanical properties of samples soaked in sulfate. (a) UCS after sulfate immersion, and (b) FS after sulfate immersion.
In the control group, the corrosion coefficient of UCS of C1 and C2 concrete at 7 or 28 days is between 0.75–0.8, which is significantly lower than that of unsoaked concrete; however, the corrosion resistance coefficient of UCS of the PFB group is between 0.8–0.97, which is about 5–15% higher than that of the control group; this indicates that the addition of basalt fiber and biochar can effectively resist sulfate attack. When the content of biochar is high, the sulfate resistance coefficient of samples increases, which indicates that biochar plays a key role in sulfate resistance. At 28 days, the corrosion coefficient of UCS of samples PFB21 and PFB22 is maintained at about 0.97, which has no obvious difference from the strength of unsoaked concrete. With the increase of basalt fiber content, the erosion coefficient of UCS of the PFB group shows a smooth state or slightly increases; this indicates that, with the increase of fiber content, the improvement of sulfate attack resistance of the PFB group is small, and the deterioration effect is not obvious; this is similar to the results of Liew et al. [36].
At 28 days, the erosion coefficient of FS in the PFB group is 0.55–0.70, indicating that the flexural strength of the control group is significantly reduced after erosion. The erosion coefficient of samples PFB11 and PFB12 increases significantly, reaching 0.70; this indicates that the basalt fiber delays the reduction rate of FS of concrete and enhances the erosion resistance of concrete. As can be seen from Figure 10a, when the samples are soaked for 28 days, the mass erosion coefficient of the PFB group decreased compared with that of the control group, and the law of mass loss was very similar. The mass sulfate resistance coefficient of the PFB group is about 5% higher than that of the control group; this also indicates that the addition of basalt fiber concrete can improve the compactness of concrete and enhance the resistance to sulfate erosion. The main reason for the decrease of sulfate resistance is the salting out and partial peeling of eroded concrete [37].
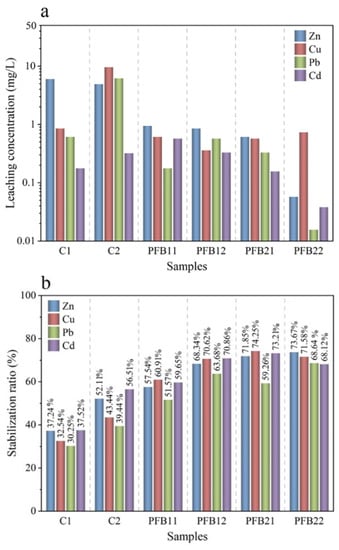
Figure 10.
TCLP test results of samples. (a) Leaching concentration, (b) stabilization ratio.
3.7. Heavy Metals Leaching Behaviour
To study the stability of heavy metals in tailings, the TCLP test was used to analyze the leaching concentration of heavy metals in the samples, and the TCLP test results are shown in Figure 10. As can be seen from Figure 10a, the samples prepared by replacing part of cement with biochar and basalt fiber affect the solidification of heavy metals, and it achieves the effect of reducing the leaching concentration of heavy metals. The leaching concentrations of heavy metals in samples with high biochar content (samples PFB21 and PFB22) are higher than that in samples with low biochar content, thus it can be preliminarily indicated that biochar has a certain contribution to the solidification of the heavy metals. When part of cement is replaced by biochar, it contributes to reducing the leaching amount of the four heavy metals (in Figure 10a). For element Cu, with the increase of biochar content, the leaching concentration of Cu decreased first and then increased. The leaching amount is the smallest in the PFB12 sample, as well as the solidification efficiency of Cu, which is 70.62% (in Figure 10b), which increased by 38.38% compared with sample C1 and 27.18% compared with sample C2; this also proves that the addition of basalt is beneficial to the solidification of heavy metals. The leaching regularity of Pb is consistent with that of Cu. Sample PFB21 has the best solidification effect on Pb, which is 79.26%. For element Zn, the increase of biochar content can reduce the leaching concentration of Zn. The sample with the smallest leaching amount is sample PFB22, whose solidification efficiency for Zn is 73.67%.
For element Cd, with the increase of biochar content, its leaching concentration increases first and then decreases; this may be related to the adsorption of basalt fiber, which can absorb some heavy metals, thus leading to the decrease of Cd leaching concentration
To sum up, the leaching concentrations of the four heavy metals are Zn > Cu > Cd > Pb. The reasons are divided into the following two points. On the one hand, different molar masses of heavy metals can lead to their different stability. During the hydration process, heavy metal ions react with hydroxide ions or carbonate ions to generate precipitates. Hence, heavy metals (Cd and Pb) with high molar mass form unstable precipitates, which are decomposed into free states and then increase the leaching concentration. On the other hand, the physical adsorption of basalt and the physical encapsulation ability of the cement to heavy metals. Some heavy metals are adsorbed in basalt fiber. Additionally, the formed C-S-H has a dense structure, which contributes to the encapsulation of heavy metals.
4. Conclusions
In this work, the mechanical properties, sulfate resistance, pore structure, and toxic leaching of basalt fiber-biochar-concrete composites were studied by a series of experiments. The results are as follows:
- (1)
- Basalt fiber can improve the mixing performance of concrete, the improvement of the 28-day compressive strength of concrete is not high, about 2.5%; however, due to the good tensile effect of basalt fiber, the 28-day flexural strength of the sample is increased by about 12%.
- (2)
- The particle size of biochar is fine, which can effectively fill the tiny pores of the concrete, resulting in a significant decrease in the pore size of 10 nm and an increase in the pore size of 2–6 nm. The microstructure analysis shows that the addition of biochar and basalt fiber improves the pore structure of concrete.
- (3)
- Compared with the control group, the strength erosion resistance coefficient of PFB samples increases by 5–15%, and the mass erosion resistance coefficient increases by 5%; this is related to the absorbability of biochar and basalt fibers.
- (4)
- Biochar has an immobilization effect on heavy metals. Due to biochar adsorption, leaching concentrations of Cu, Zn, Pb, and Cd in iron tailings decrease by 50–70%. Additionally, the hydration products form a dense structure, which is conducive to the physical envelope for heavy metals, thus reducing the leaching concentration of the heavy metals.
- (5)
- PFB is an environmentally friendly material that effectively reduces the toxic leaching concentration of heavy metals in iron tailings, which provides a good idea for the recycling of iron tailings.
Author Contributions
Z.C.: Writing-original draft. N.W.: Resources and methodology. Y.S.: Funding acquisition. J.X.: Investigation and Editing. All authors have read and agreed to the published version of the manuscript.
Funding
This research was funded by the Innovation Program for College Students [grant number 190023] is gratefully acknowledged.
Institutional Review Board Statement
Not applicable.
Informed Consent Statement
Not applicable.
Data Availability Statement
The data is displayed in the paper.
Acknowledgments
The authors would like to thank Danyang Li for checking the grammar of the manuscript.
Conflicts of Interest
The authors declare no conflict of interest.
References
- Xiang, J.; Qiu, J.; Li, Z.; Chen, J.; Song, Y. Eco-Friendly treatment for MSWI bottom ash applied to supplementary cementing: Mechanical properties and heavy metal leaching concentration evaluation. Constr. Build. Mater. 2022, 327, 127012. [Google Scholar] [CrossRef]
- Qiu, J.; Xiang, J.; Zhang, W.; Zhao, Y.; Sun, X.; Gu, X. Effect of microbial-cemented on mechanical properties of iron tailings backfill and its mechanism analysis. Constr. Build. Mater. 2022, 318, 126001. [Google Scholar] [CrossRef]
- Wu, F.; Ren, Y.; Qu, G.; Liu, S.; Chen, B.; Liu, X.; Zhao, C.; Li, J. Utilization path of bulk industrial solid waste: A review on the multi-directional resource utilization path of phosphogypsum. J. Environ. Manag. 2022, 313, 114957. [Google Scholar] [CrossRef] [PubMed]
- Han, Z.; Zhang, Y.; Qiao, H.; Feng, Q.; Xue, C.; Shang, M. Study on axial compressive behavior and damage constitutive model of manufactured sand concrete based on fluidity optimization. Constr. Build. Mater. 2022, 345, 128176. [Google Scholar] [CrossRef]
- Qin, Q.; Meng, Q.; Yang, H.; Wu, W. Study of the anti-abrasion performance and mechanism of coral reef sand concrete. Constr. Build. Mater. 2021, 291, 123263. [Google Scholar] [CrossRef]
- Lu, C.; Zhang, S.; Wang, J.; Zhao, X.; Zhang, L.; Tang, A.; Dong, X.; Fu, L.; Yang, H. Efficient activation of peroxymonosulfate by iron-containing mesoporous silica catalysts derived from iron tailings for degradation of organic pollutants. Chem. Eng. J. 2022, 446, 137044. [Google Scholar] [CrossRef]
- Schatzmayr Welp Sá, T.; Oda, S.; Karla Castelo Branco Louback Machado Balthar, V.; Dias Toledo Filho, R. Use of iron ore tailings and sediments on pavement structure. Constr. Build. Mater. 2022, 342, 128072. [Google Scholar] [CrossRef]
- Deng, J.; Ning, X.-a.; Shen, J.; Ou, W.; Chen, J.; Qiu, G.; Wang, Y.; He, Y. Biomass waste as a clean reductant for iron recovery of iron tailings by magnetization roasting. J. Environ. Manag. 2022, 317, 115435. [Google Scholar] [CrossRef]
- Corradi, M.; Mustafaraj, E.; Speranzini, E. Sustainability considerations in remediation, retrofit, and seismic upgrading of historic masonry structures. Environ. Sci. Pollut. Res. 2021. [Google Scholar] [CrossRef]
- Cheng, Y.H.; Yang, S.H.; Zhang, J.Y.; Sun, X.H. Test research on hydration process of cement-iron tailings powder composite cementitious materials. Powder Technol. 2022, 399, 117215. [Google Scholar]
- Han, F.; Zhang, H.; Liu, J.; Song, S. Influence of iron tailing powder on properties of concrete with fly ash. Powder Technol. 2022, 398, 117132. [Google Scholar] [CrossRef]
- Chen, Z.; Chen, S.; Zhou, Y.; Zhang, C.; Meng, T.; Jiang, S.; Liu, L.; Hu, G. Effect of incorporation of rice husk ash and iron ore tailings on properties of concrete. Constr. Build. Mater. 2022, 338, 127584. [Google Scholar] [CrossRef]
- Uetsuji, Y.; Yagi, T.; Nakamura, Y. Interfacial adhesive strength of a silane coupling agent with metals: A first principles study. Mater. Today Commun. 2020, 25, 101397. [Google Scholar] [CrossRef]
- Mortazavi, B.; Shojaei, F.; Rabczuk, T.; Zhuang, X. High tensile strength and thermal conductivity in BeO monolayer: A first-principles study. FlatChem 2021, 28, 100257. [Google Scholar] [CrossRef]
- Xu, C.; Feng, Y.; Li, H.; Wu, R.; Ju, J.; Liu, S.; Yang, Y.; Wang, B. Adsorption of heavy metal ions by iron tailings: Behavior, mechanism, evaluation and new perspectives. J. Clean. Prod. 2022, 344, 131065. [Google Scholar] [CrossRef]
- Li, S.; Wu, J.; Huo, Y.; Zhao, X.; Xue, L. Profiling multiple heavy metal contamination and bacterial communities surrounding an iron tailing pond in Northwest China. Sci. Total Environ. 2021, 752, 141827. [Google Scholar] [CrossRef]
- Wang, Y.-Y.; You, L.-C.; Lyu, H.-H.; Liu, Y.-X.; He, L.-L.; Hu, Y.-D.; Luo, F.-C.; Yang, S.-M. Role of biochar–mineral composite amendment on the immobilization of heavy metals for Brassica chinensis from naturally contaminated soil. Environ. Technol. Innov. 2022, 28, 102622. [Google Scholar] [CrossRef]
- Gao, X.; Peng, Y.; Zhou, Y.; Adeel, M.; Chen, Q. Effects of magnesium ferrite biochar on the cadmium passivation in acidic soil and bioavailability for packoi (Brassica chinensis L.). J. Environ. Manag. 2019, 251, 109610. [Google Scholar] [CrossRef]
- Feng, L.; He, S.; Zhao, W.; Ding, J.; Liu, J.; Zhao, Q.; Wei, L. Can biochar addition improve the sustainability of intermittent aerated constructed wetlands for treating wastewater containing heavy metals? Chem. Eng. J. 2022, 444, 136636. [Google Scholar] [CrossRef]
- Zhang, C.; Hao, H.; Hao, Y. Experimental study of mechanical properties of double-helix BFRP fiber reinforced concrete at high strain rates. Cem. Concr. Compos. 2022, 132, 104633. [Google Scholar] [CrossRef]
- Lu, J.; Liu, J.; Yang, H.; Gao, J.; Wan, X.; Zhang, J. Influence of curing temperatures on the performances of fiber-reinforced concrete. Constr. Build. Mater. 2022, 339, 127640. [Google Scholar] [CrossRef]
- Mymrin, V.; Pedroso, D.E.; Pedroso, C.L.; Avanci, M.A.; Rolim, P.H.B.; Carvalho, K.Q.; Catai, R.E. Physical-chemical processes of sustainable construction materials structure formation with iron ore processing tailings and aluminum anodizing sludge. Constr. Build. Mater. 2021, 298, 123698. [Google Scholar] [CrossRef]
- Li, Y.; Zhang, J.; He, Y.; Huang, G.; Li, J.; Niu, Z.; Gao, B. A review on durability of basalt fiber reinforced concrete. Compos. Sci. Technol. 2022, 225, 109519. [Google Scholar] [CrossRef]
- El Refai, A.; Alnahhal, W.; Al-Hamrani, A.; Hamed, S. Shear performance of basalt fiber-reinforced concrete beams reinforced with BFRP bars. Compos. Struct. 2022, 288, 115443. [Google Scholar] [CrossRef]
- Karthikeyan, B.; Kathyayini, R.; Aravindh Kumar, V.; Uthra, V.; Senthil Kumaran, S. Effect of dumped iron ore tailing waste as fine aggregate with steel and basalt fibre in improving the performance of concrete. Mater. Today Proc. 2021, 46, 7624–7632. [Google Scholar] [CrossRef]
- Liu, Z.; Worley, R.; Du, F.; Giles, C.D.; Dewoolkar, M.; Huston, D.; Tan, T. A study on avalanches of early age basalt fiber reinforced concrete beams during flexure. J. Clean. Prod. 2021, 279, 123695. [Google Scholar] [CrossRef]
- Ni, H.; Wang, C.; Arslan, M.; Qian, J.; Liang, Z.; Luo, Z.; Cai, R.; Gamal El-Din, M.; Wu, Z. Enhanced wastewater treatment by modified basalt fiber bio-carriers: Effect of etching and surface functionalization. J. Clean. Prod. 2022, 343, 130927. [Google Scholar] [CrossRef]
- Zhang, Y.; Hua, Y.; Zhu, X. Investigation of the durability of eco-friendly concrete material incorporating artificial lightweight fine aggregate and pozzolanic minerals under dual sulfate attack. J. Clean. Prod. 2022, 331, 130022. [Google Scholar] [CrossRef]
- Xiang, J.; Qiu, J.; Yuan, J.; Fu, H.; Yang, Y.; Gu, X. Study on denitrifying biogrout to immobilize heavy metals in bottom ash in an anaerobic environment and its immobilization mechanism. J. Chem. Eng. 2022, 108084. [Google Scholar] [CrossRef]
- Ozturk, O.; Ozyurt, N. Sustainability and cost-effectiveness of steel and polypropylene fiber reinforced concrete pavement mixtures. J. Clean. Prod. 2022, 363, 132582. [Google Scholar] [CrossRef]
- Dey, A.; Vastrad, A.V.; Bado, M.F.; Sokolov, A.; Kaklauskas, G. Long-Term Concrete Shrinkage Influence on the Performance of Reinforced Concrete Structures. Materials 2021, 14, 254. [Google Scholar] [CrossRef] [PubMed]
- Kang, S.H.; Hong, S.G.; Moon, J. Performance Comparison between Densified and Undensified Silica Fume in Ultra-High Performance Fiber-Reinforced Concrete. Materials 2020, 13, 3901. [Google Scholar] [CrossRef] [PubMed]
- Yang, M.; Sun, J.; Dun, C.; Duan, Y.; Meng, Z. Cementitious activity optimization studies of iron tailings powder as a concrete admixture. Constr. Build. Mater. 2020, 265, 120760. [Google Scholar] [CrossRef]
- Li, G.D.; Zhang, L.; Zhao, F.N.; Tang, J.Q. Acoustic Emission Characteristics and Damage Mechanisms Investigation of Basalt Fiber Concrete with Recycled Aggregate. Materials 2020, 13, 4009. [Google Scholar] [CrossRef] [PubMed]
- Kou, C.J.; Wu, X.; Xiao, P.; Liu, Y.; Wu, Z.G. Physical, Rheological, and Morphological Properties of Asphalt Reinforced by Basalt Fiber and Lignin Fiber. Materials 2020, 13, 2520. [Google Scholar] [CrossRef] [PubMed]
- Liew, M.S.; Aswin, M.; Danyaro, K.U.; Mohammed, B.S.; Al-Yacouby, A.M. Investigation of Fibers Reinforced Engineered Cementitious Composites Properties Using Quartz Powder. Materials 2020, 13, 2428. [Google Scholar] [CrossRef]
- Chen, W.F.; Huang, B.; Yuan, Y.X.; Deng, M. Deterioration Process of Concrete Exposed to Internal Sulfate Attack. Materials 2020, 13, 1336. [Google Scholar] [CrossRef]
Publisher’s Note: MDPI stays neutral with regard to jurisdictional claims in published maps and institutional affiliations. |
© 2022 by the authors. Licensee MDPI, Basel, Switzerland. This article is an open access article distributed under the terms and conditions of the Creative Commons Attribution (CC BY) license (https://creativecommons.org/licenses/by/4.0/).