Article

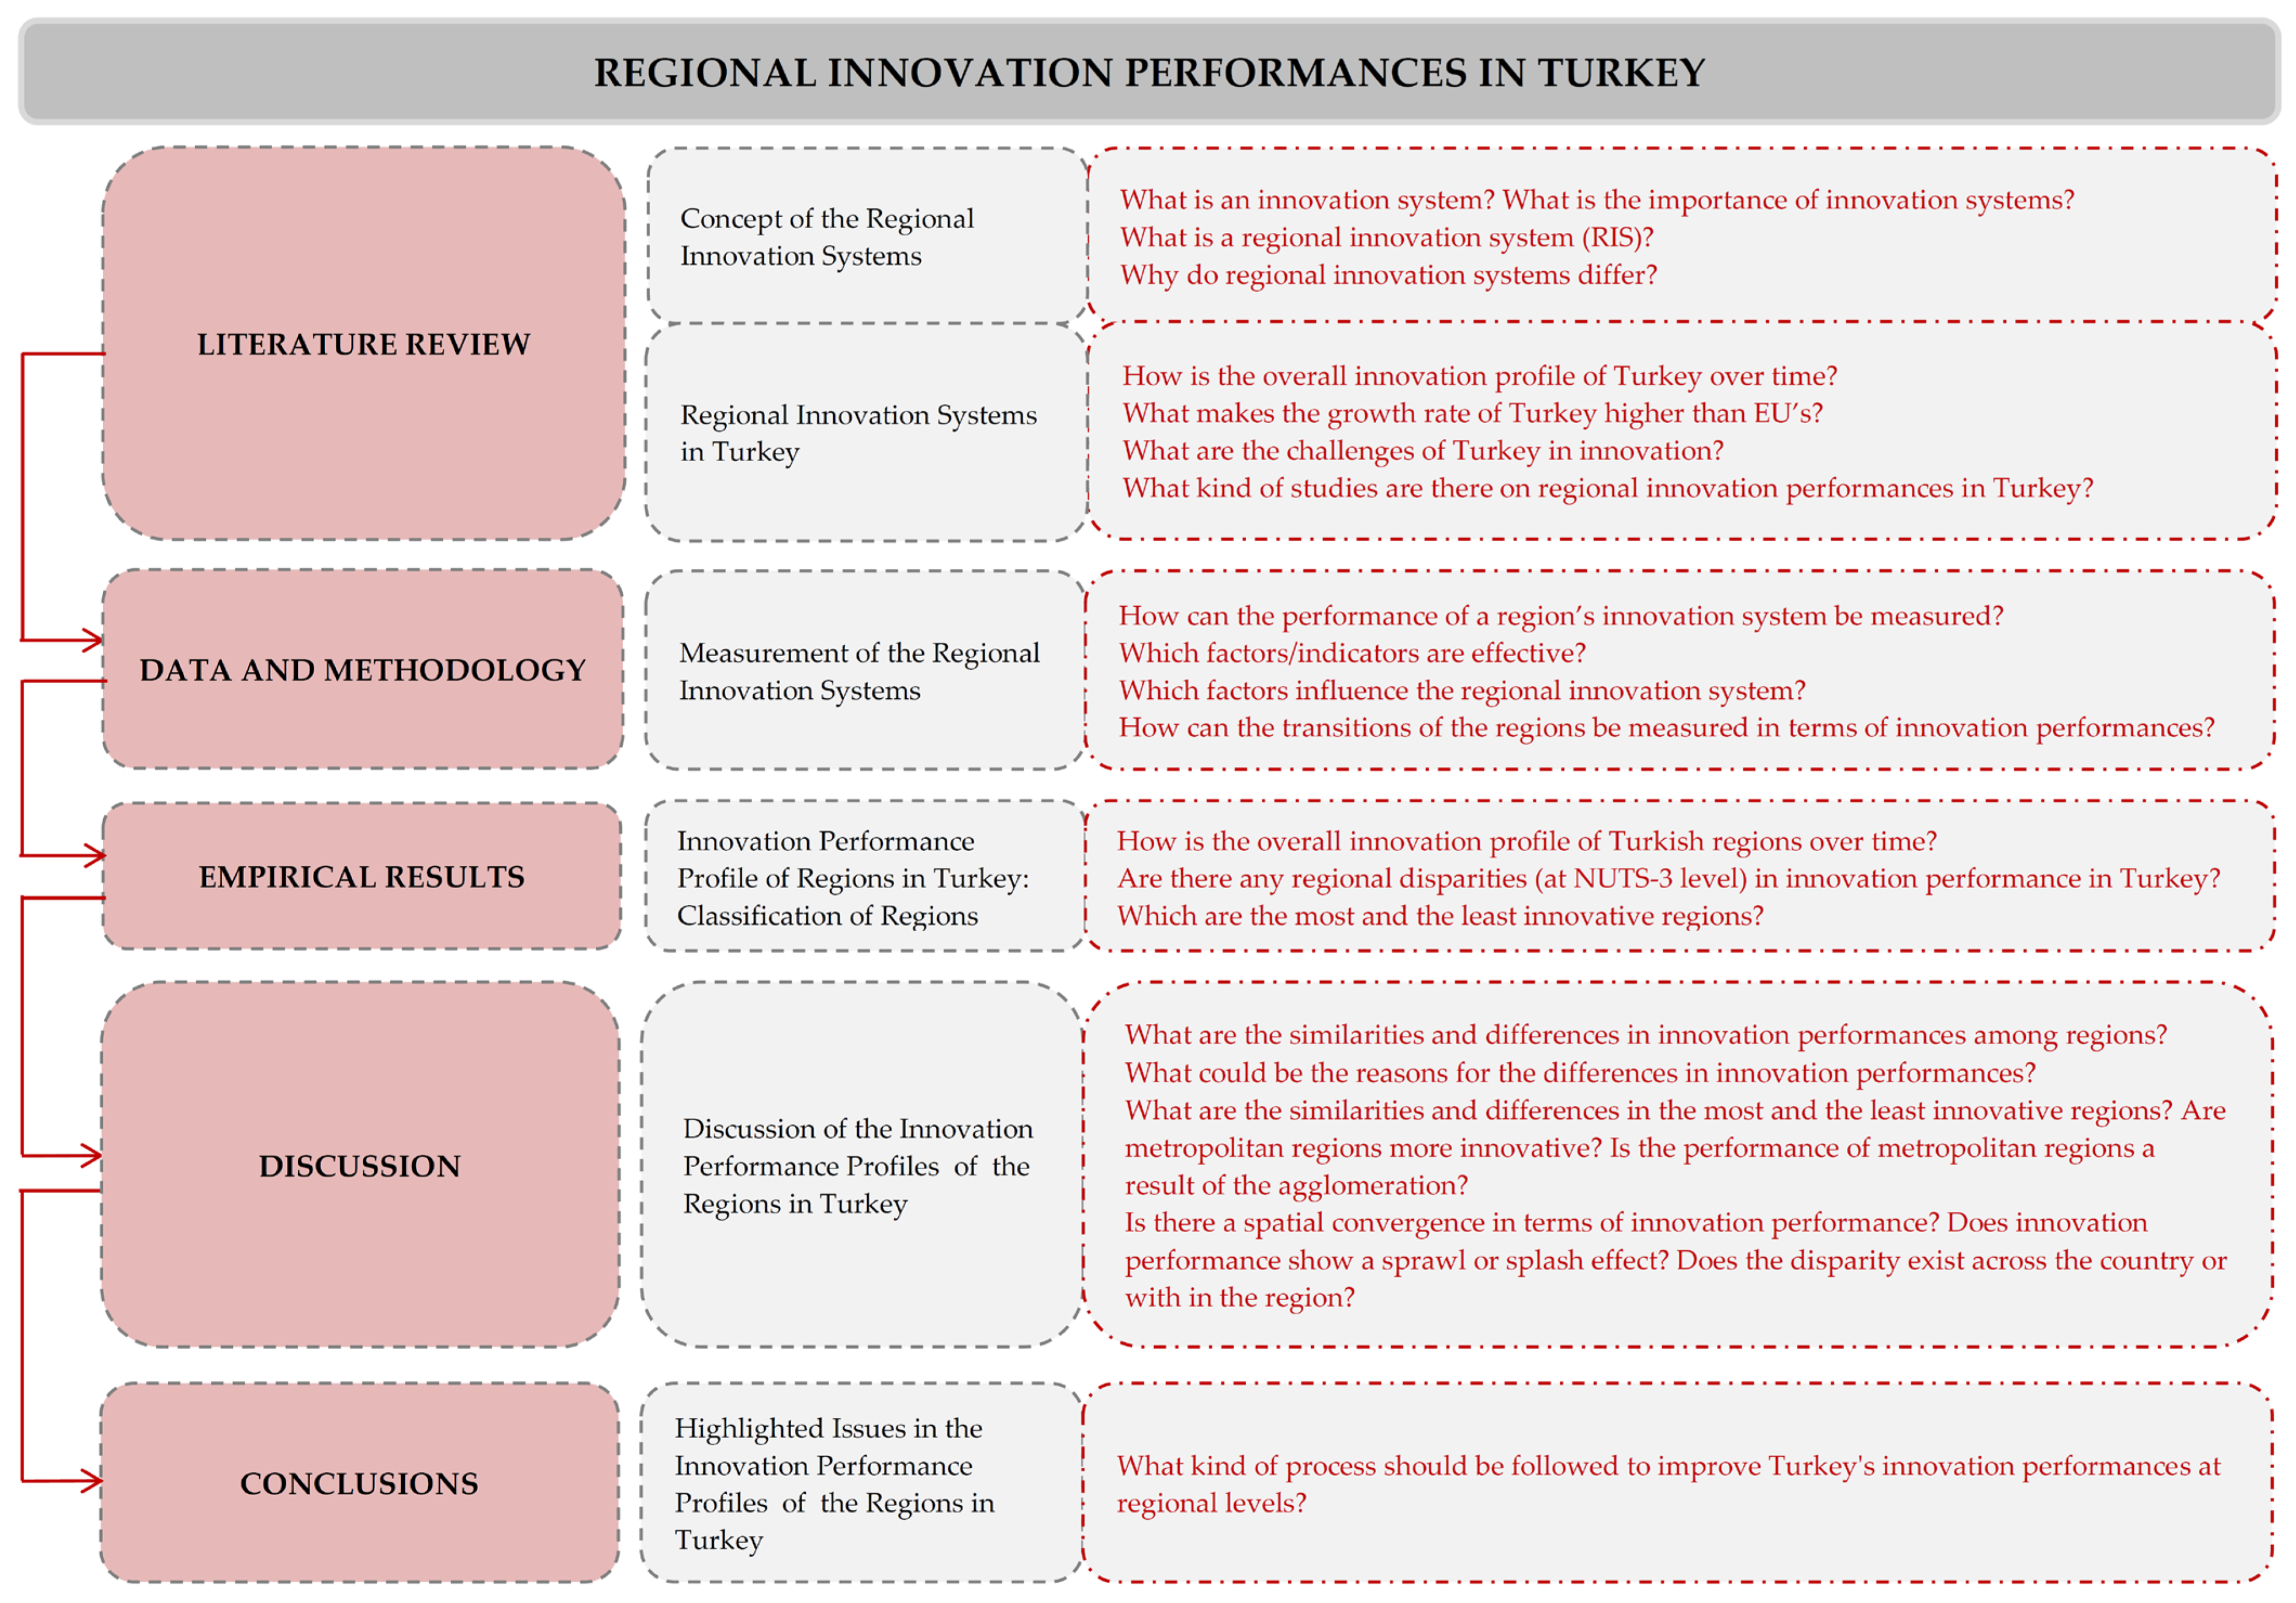
Regional Innovation Performances in Turkey

Department of Urban and Regional Planning, İstanbul Technical University, İstanbul 34367, Turkey
*
Author to whom correspondence should be addressed.
Sustainability 2022, 14(16), 10035; https://doi.org/10.3390/su141610035
Submission received: 18 May 2022 / Revised: 31 July 2022 / Accepted: 1 August 2022 / Published: 14 August 2022

Abstract

:
The purpose of this study is to provide a temporal dynamic analysis of transitions of the regions in Turkey from one state of innovative performance to another by using successive Markov Chains. Regarding the intellectual assets, consisting of the patent, utility model, trademark and design applications, Markov Chains have revealed that there are regional disparities (between i. regions located in the east and west of the country, ii. metropolitan and non-metropolitan regions, iii. high-developed and relatively less-developed regions). Results show that metropolitan regions have higher performances. Innovation leaders which take place in all indicators and time periods in terms of applications are Adana, Ankara, Bursa, Eskişehir, İstanbul, İzmir, Kayseri, Kocaeli, Konya and Manisa regions. It is explicitly distinct that İstanbul leads in the innovation performances for each variable in all time periods. In contrast, regions with the lowest innovation performances are Ağrı, Artvin, Bingöl, Bitlis, Erzincan, Hakkari, Kars, Muş, Siirt, Tunceli, Bayburt, Bartın, Ardahan, Iğdır and Kilis. In addition to having the lowest innovation performances, these regions are identified by state policies as ‘priority regions in development’ or ‘state of emergency regions’.

1. Introduction

Technological developments brought about by globalization give rise to a rapidly changing, developing and transforming competitive environment. In today’s conditions, also known as the knowledge society, every structure from micro to macro scale (firm, region, nation, etc.) displays different behaviors in this competitive environment in such a way that some try to create pioneering changes, while others try to recognize, follow and adapt to these changes [1] (p. 237). Therefore, countries and regions create policies, strategies and plans in order to establish and manage an effective innovation system [2]. Globalization increases the need for and importance of innovation systems as well as affecting the design and implementation of innovation policies [3].
While globalization enables the easiness of free movement of capital and labor, it also brings the regions as smaller important territorial units to the fore by increasing the process of knowledge production, use and accumulation thanks to their localized features [4]. “A Regional Innovation System (RIS) approach helps to explain the regional dimension of production and the regional disparities of innovation capacity and economic power [5], and highlights the diversity of regions in the countries, the differing dynamics of innovation and the interactions between organizations in a particular system [6]. The analysis of a RIS allows the creation and dissemination of economically relevant information in a certain region, and also the identification of key actors and resources (such as existing infrastructures, sources of information and resources of expertise, financing, etc.) [1] (p. 238)”. The concept of RIS makes it necessary to clarify the type and policy levels (local/regional/national/transnational) of supports, investments, incentives and inter-regional cooperation opportunities [7].
In this knowledge-driven competitive environment, measurements of the capacity, efficiency and performance of innovation systems at different spatial levels gain importance. It is obvious that a wide variety of methods are used in the literature regarding the measurement of regional innovation performance. The European Innovation Scoreboard Index is one of the widely accepted tools in the measurements of innovation systems. The European Union (EU) measures the national innovation performance of Turkey based on the European Innovation Scoreboard but does not evaluate the regions of Turkey in this regard.
Hence, fulfilling the gap in this respect, this study seeks answers to the following research questions: How is the overall innovation profile of Turkish regions over time? Are there any regional disparities (at NUTS-3 level) in innovation performances in Turkey? Which are the most and least innovative regions? The purpose of this study is to determine in which aspects the regions of Turkey differ from each other and the intra-regional level over time with reference to their innovation performances. Therefore, a dynamic analysis is realized to figure out the transitions of 81 regions in Turkey at NUTS-3 level from one state to another in terms of innovation performances over time covering the years between 2000 and 2017. In order to assess the regional innovation performances within the scope of the study, a dynamic analysis of inter-regional differences and the transitions of innovation performance of regions from one state to another in terms of innovation performances are carried out by using the successive Markov Chains method based on the performance groups of the EU as innovation leaders, strong innovators, moderate innovators and modest innovators.
The research design of the study is structured with important supportive questions (Figure 1). The following section consists of a broad literature review based on the concept and importance of the innovation systems, the concept of RIS and RIS in Turkey. The next section deals with the data and methodology of the study and defines four different innovation performance groups according to three different time periods with the Markov Chains method based on the data covering the intellectual assets as patent, utility model, trademark and design applications. Then, the empirical results of Markov Chains enabling detailed analyses of the transitions of the regions in Turkey from one state to the other in terms of their innovation performances are provided in the text as a separate section. The discussion section (i) focuses mainly on the similarities and differences in innovation performances among regions, (ii) includes interpretations of the reasons while considering the transitions of regions in different time periods and (iii) also reveals the positions of the regions in the system by examining the state policies and researches on the national scale. In the last chapter, the highlighted issues on the innovation performances of the regions in Turkey are briefly assessed, and then, the policies and processes for Turkey are briefly provided in order to obtain substantial progress in innovation for the regions, establish and manage an effective innovation system and improve the innovation performances at the regional levels.
This study will make a significant contribution to the literature in terms of (i) focusing on the regions of Turkey, which is a large, diverse and emerging country, as an example to other similar countries, (ii) covering the NUTS-3 level highlighting local knowledge and dynamics, and (iii) examining the transitions of regions of Turkey with the Markov Chains and Shorrocks indices including different time periods, as well as (iv) evaluating the regional performances of intellectual assets, which is one of Turkey’s challenges on innovation.

2. Literature Review

Innovation system is an interactive and integrated process composed of the network and relationships of various creators/actors (institutions in the public and private sectors such as firms, universities, government agencies, technical agencies and research and development (R&D) public infrastructure, etc.). Since the innovation system is a tool for economic development, countries and regions form policies, strategies and plans for the establishment and management of an effective innovation system [2].
“As a reflection of knowledge/science/technology/skills-intensive global structure [8] (p. 15), in this global competitive structure, the challenges on innovation make innovation systems and policies vary both in national and regional scales. In this context, there are different responses and reactions of different countries and regions in this competitive environment [1] (p. 237)”. For instance, while “high-income countries become more specialized in resources and services including sophisticated inputs as qualified labor, research and knowledge [9] (p. 118)”, low-income countries face many challenges in innovation such as poor business and governance conditions, low educational levels and mediocre infrastructure [10], in addition to market constraints, firms having a lack of scientific skills and access to credits [11] (p. v) and having scarce knowledge of policy instruments [11] (p. vi), limited collaboration of universities and firms on innovation creation and knowledge transfer [11] (p. 47), inability to protect intellectual property rights [11] (p. 49), etc. Although low-income countries face some difficulties [11], it is essential for these countries to have their own “ability to develop its own innovation system” in catching up with the developed countries [12] (pp. 2, 13) by having “invested massively in the formation of skills and R&D infrastructure [13] (pp. 12–13)”. In addition, these low-income countries should have both the ability to make “(or attract) sufficient investments”, and also “its capacity to absorb existing and generate new technologies (e.g., innovate) [12] (p. 2)”. To catch up developed countries, “every country has to find its own way based on an understanding of (a) the contemporary global technological, institutional and economic dynamics, (b) the behavior of the relevant agents and (c) the specific context in which the catch-up takes place and the broader factors that influence it [13] (pp. 13–14), [14]. Hu et al. [15] describe the countries in different income stages with respect to innovative development as follows: “a country or region in the low-income stage is basically driven by primary elements such as land, resources, energy, and a labor force, whereas a country or region in the lower middle-income stage is largely driven by capital elements such as the domestic savings rate, investment rate and scale. In contrast, a country or region in the upper middle-income stage is driven by technological elements, usually associated with the introduction of large-scale technology, and one in the high-income stage must be driven by a reliance on innovation [15]”. “An indigenous knowledge included IS can facilitate participatory development processes, foster socioeconomic resilience of local communities and enhance the comparative advantage of a developing country [16] (p. 89)”. While analyses on innovation systems generally done focusing on the developing countries [17,18,19,20,21,22,23,24,25,26], relatively less attention has given to the countries with poor-IS. “Furthermore, substantial differences exist among developing countries in terms of socioeconomic contexts and capacities to reach advanced knowledge-based societies and economies [16] (p. 90), [27,28,29,30]”. While low productivity and low-income countries could adopt the pioneering changes to catch up the innovation leaders by the international diffusion of knowledge and technology, high-income countries may benefit more from technological progress [31].
The response of countries to innovation is not only related to income level differences (high and low income), but also to the size of the country. While small countries, in particular, are affected and become more dependent on the global knowledge flows [9] (p. 103), large countries gain more from comparative advantage than from the division of labor and export a smaller share of final goods and a larger share of intermediate goods when compared to small countries [32]. Nelson [33] explains the differentiation of innovation systems of countries by making a wide comparison of various countries such as six large high-income countries (France, Italy, Japan, the United States, Britain and west Germany), four smaller high-income countries (Australia, Canada, Denmark and Sweden) and five lower income countries (Argentina, Brazil, Israel, Korea and Taiwan). These differences are about the firms, university systems, development paths, organization of industry and structure of research and development (R&D) depending on the histories, cultures and entry times into the industrialization processes of the countries. Freeman [34] (p. 14) states that there are differences in national innovation systems of countries such as between Japan, the United States and the European Community (EC) and between European countries themselves [33]; Ireland and other small countries [35]; and Denmark and Sweden [36]. According to Freeman’s statement [34] (p. 14), Denmark and Sweden, neighboring countries which superficially appear very similar in many ways, have big differences. Kaiser and Prange [37] state that countries differ in terms of such features as “the internal organization of firms, the interfirm relationships, the role of the public sector, the institutional set-up of the financial sector, as well as the intensity and the organization of R&D” [37] (p. 397) as a reflection of the differentiation of national economies “regarding the structure of the production system and regarding the general institutional set-up” [37] (p. 397), [38] (p. 13). The above-mentioned features differentiate the innovation systems of the regions as well as the nations.
The successes of developed countries are not only based on their size and income levels, but also the integration of strong sustainable economic development and high level of innovation performances. Ensuring sustainable economic development is only possible in case of an effective and resilient innovation structure of countries. The concept of sustainable development emerged with the Our Common Future [39], also known as the Brundtland Report, in 1987 by the World Commission on Environment and Development (WCED), a sub-organization of the United Nations (UN). This concept has been studied extensively both in theory and in practice, and currently stands out with the emphasis of the United Nations 2030 Agenda for Sustainable Development Goals (SDGs) [40]. Innovation systems including different dimensions have taken their places in these goals, especially the Goal 9-Industry, Innovation and Infrastructure aiming to “build resilient infrastructure, promote inclusive and sustainable industrialization and foster innovation”. There are many statements in the literature regarding the relationship between innovation and sustainable development. While it is stated by some that innovation is the determinant of economic and sustainable growth of living standards [41,42], others identify that investment in innovation facilitates sustainable development [43]. It is also stated that innovation is a fundamental method to return sustainable growth for overcoming economic crisis [44]. Gerstlberger [45] assumes that there is a correlation between the innovation and sustainable development and Ionescu et al. [46] state that sustainable development requires sustainability of innovation and entrepreneurship.
On the other hand, it is necessary to bring the issue of sustainable development to the fore in the innovation processes [47]. According to Makhosheva et al. [48], the development of society can be ensured with the sustainable development based on the effective use of innovations and human capital. Similarly, Scheel and Vazquez [49] designate the innovation systems are the driving forces of modern sustainable economic development. All these statements clearly show that innovation systems and sustainable development are intertwined concepts. Moreover, integrating strong sustainable development and high-performed innovation systems is important for regions as the smaller territorial scales with their localized features as well as countries.
As an important indicator of the innovation systems, intellectual assets with different forms of intellectual property rights (IPR) are also related to sustainable development. Gao and Zhai [50] state the existence of the close relationship between IPR, renewable energy technology and sustainable development through the case of China, adding that sustainable development has promoted the discussion of IPR.

2.1. Concept of Regional Innovation Systems

‘Regional Innovation Systems’ is defined as actors (big or small, local or multi-national firms, universities, public research facilities and technology centers, etc.) and the connections and relationships between these institutions [4,6,51,52]. According to OECD [6], regions have increasing roles in regional innovation policies by (i) forming and shaping virtuous innovation trajectories and mobilizing untapped potential for national growth [53] (ii) setting up the necessary administrative mechanisms to support clusters and innovative enterprises, (iii) defining the flow of real economic activities and (iv) making use of the synergy and connections among economic actors [54,55].
As can be seen from the definitions on regional innovation systems [4,56,57,58,59,60,61], the main feature of regional innovation systems is to be a dynamic and interactive structure where regional knowledge is highlighted for the production, use, dissemination and commercialization of knowledge, which includes the relationships and networks of organizational and institutional infrastructure and regulations.

2.2. Regional Innovation Systems in Turkey

According to the EU’s innovation indices, Turkey was placed in the ‘modest innovators’ group until 2016 and then moved from modest to moderate innovators by improving its innovation performances [62]. Unfortunately, the country could not recently sustain its position and fell back to the group of emerging countries [63]. Even though Turkey’s innovation index is far below the EU average, its innovation growth rate is much above it [62]. According to its growth rate in innovation performance, Turkey is one of the countries that resisted the 2008 global economic crisis and had a rising trend mainly in indicators as ‘population completed tertiary education’, ‘youth with upper secondary level education’ and ‘R&D expenditure in the business sector’ [64]. In recent years, Turkey has made strong efforts to strengthen the innovation systems. According to ‘European Innovation Scoreboard 2018’ [65], the strongest innovation dimensions of Turkey are ‘Firm investments’ and ‘Innovators’. ‘Firm investments’ dimension is one of the best trends of Turkey. In terms of this dimension, Turkey got ahead of the EU with its remarkable increase in 2014 (from 0.099 to 0.568) and was located behind the leading countries such as Israel, Switzerland, Sweden, Germany, Austria, Belgium and Finland in 2017. One of the reasons for Turkey’s high performance in this dimension is being “a positive outlier in 2012 and 2014 [65]” in terms of ‘Non-R&D innovation expenditures’ indicator. In contrast, ‘Intellectual assets’ and ‘Employment impacts’ are the weakest innovation dimensions of Turkey. Although Turkey showed little increases in some years for these dimensions, these increases could not prevent Turkey from being one of the lowest ranking countries. Therefore, Turkey must deeply focus on and spent much more efforts on these dimensions. The reasons that Turkey being a large and diverse country and also an emerging country with a higher growth rate in terms of innovation performances and having some challenges on innovation increase the need for and importance of innovation-related research.
There are some studies to measure the performance of regional innovation in Turkey, which are made generally on the basis of a single time and mainly on the upper scales as (i) NUTS-1 [66], (ii) NUTS-2 [67,68,69], (iii) NUTS-3 levels [70,71] or (iv) on a certain region [72,73,74,75].
(i) Duman [66] compared innovation performances and capacities of 12 regions at NUTS-1 level of Turkey by creating regional innovation indices based on the normalization methods covering different years and also assessed the regions according to the average of NUTS-1 level regions.
(ii) Gömleksiz [67] aimed at presenting the innovative capabilities within the regional innovation systems and created regional innovation indices of 26 NUTS-2 regions by using the normalization methods including a set of indicators with different years as innovation input and output variables. In addition, Mercan and Gömleksiz [68] focused on the Konya Plain Project (KOP) Region covering Konya, Karaman, Aksaray, Niğde regions and compared the regional innovation capabilities of KOP Region and other 5 NUTS-2 regions as TR10 (İstanbul), TR31 (İzmir), T41 (Bursa, Eskişehir, Bilecik), TR42 (Kocaeli, Sakarya, Düzce, Bolu, Yalova) and TR51 (Ankara) regions by using the same methodology. In addition to these studies, Kutgi and Işık Maden [69] measured the regional innovation performance at NUTS-2 level with normalization methods.
(iii) Varış [70] aimed at revealing the determinants of the innovation outputs at NUTS-3 level by examining in three main axes as human agency, institutions and spaces with the statistical and spatial analyses. Lenger [71] focused on the regional innovation systems in Turkey through state universities and legal and institutional set-up at NUTS-3 level by using the Generalized Method of Moments (GMM) model for the time period 1998–2005.
(iv) Karaçor and Duman [72] investigated innovation performance capacity of the TR1 (İstanbul) region by using the normalization methods and made a comparison of the region and the average of Turkey. In addition to the TR1 region, they conducted another study [73] aiming at examining the regional innovation capacity on TR4 (Eastern Marmara) region with the same methodological approach. Akşık [74] measured the regional innovation of İzmir and its surroundings by using the Decision-Making Trial and Evaluation Laboratory model. Şahin and Altuğ [75] focused mainly on the regional specializations of innovative sectors in Turkey. They first determined the innovative regions based on the patent applications per ten thousand people at NUTS-3 level for the years 2007 and 2016, then compared three largest metropolitan regions as İstanbul, Ankara and İzmir, which specialized in the manufacturing industries, in terms of innovative specialization by analyzing the data of manufacturing industry sub-sectors patent applications.
Although there are afore-mentioned studies on regional innovation measurement for Turkey, there has not been any study (except [76]) determined focusing on the transitions through different time periods in terms of the regional innovation performance at NUTS-3 level of Turkey. Hence, fulfilling the gap in this respect, this study seeks answers to the following research questions: How is the overall innovation profile of Turkish regions over time? Are there any regional disparities (at NUTS-3 level) in innovation performances in Turkey? Which are the most and least innovative regions?

3. Data and Methodology

Regional Innovation Systems is an effective tool for examining the regional economy and innovative performance and policymaking. However, there is no one single ideal method to evaluate innovation and innovation processes in a certain region since innovation is a complex and dynamic phenomenon defined with reference to various activities and characteristics. Most studies use quite a number of indicators consisting of various aspects of innovation, and parametric and nonparametric methods. Regional Innovation Systems can be evaluated through such nonparametric methods as Data Envelopment Analysis-DEA [77,78,79,80,81,82] and Free Disposal Hull-FDH [83] (they also used DEA in their studies) and through parametric methods such as Stochastic Frontier Analysis (SFA) [84], [85] (also they used DEA in their studies) and Thick Frontier Analysis-TFA. In addition, some other statistical methods, mainly factor [86,87], discriminant [88], cluster [89] and regression [78,90], and also normalization methods [66,67,68,69,72,73] and Markov Chains [91,92,93] are used to evaluate regional innovation performances and to classify regions with similar characteristics.
In addition to these methods, the Regional Innovation Scoreboard index of the EU, which provides comparative evaluation, is also seen as an important tool in measurement. The EU deals innovation with four main types as framework conditions, investments, innovation activities and impacts which consist of ten innovation dimensions. In this measurement framework, three innovation dimensions as innovators, linkages and intellectual assets have been defined within the scope of innovation activities. The EU examines intellectual assets with indicators as patent, trademark and design applications [94].
In addition to the varieties of the methods used in the evaluation of regional innovation system, factors and variables that affect regional innovation systems also differ based upon the scope of studies conducted. It is possible to reproduce these variables according to the scope of a given study. Since the RIS is a very comprehensive concept, studies in the literature focus on different variables. This study focuses on the intellectual assets with different forms of IPR which are accepted as the directly effective issues in the measurements of regional innovation performances and interprets the transitions in regional innovation performances through the changes in these variables. In addition to the patent, trademark and design indicators, ‘the utility model’ indicator is also included in this study because Turkish Patent and Trademark Office (TÜRKPATENT) attaches importance to utility model within the scope of intellectual property rights.
The present study used Markov Chains to evaluate the innovation performances of regions. Markov Chains, which were derived from the studies of the Russian mathematician Andrey Markov carried out in 1907, are known for that they contain different strings of events in time, and that the transitions contain a random process since they comprise the probabilities from one state to another [95]. Markov Chains are used to examine the differences in the states of variables according to the changes in the different time periods and to predict the future states of variables [96,97]. Adamu and Danbaba [97] claim that Markov Chains are an ideal method to model the varying data and transitions through time and that it is possible to classify individuals and issues according to different categories and states in dealing with many problems the world faces today.
As in many disciplines, Markov Chains are also used in various fields of urban and regional planning including land use changes, urban growth and urban sprawl [98,99,100,101,102], demographic issues such as migration and child mortality [103,104], and innovation studies [91,92,93]. Markov Chains are also used in such sub-headings of innovation as innovation network trajectories [91], knowledge diffusion [92] and R&D and productivity in firms [93]. Using Markov Chains, Purchase et al. [91] studied how variations in network resource bundles affected the achievements of innovation networks and how they changed trajectories over time. Todo et al. [92] studied the effects of the structure of supply chain networks on productivity and innovation capability through knowledge diffusion. Uğur et al. [93] described R&D and productivity in OECD firms and industries using Markov Chains.
This study used Markov Chains to investigate the changes of states in innovation performances of the regions in different time periods. It is important to review Turkey’s historical development of innovation in order to determine the different time periods. With the rise in the number of regulations and institutions as from 2000, it can be said that Turkey has legally and administratively entered into a reconstruction process in the field of innovation. Given Turkey’s historical innovation process, 2000–2005 (t − 1), 2006–2010 (t) and 2011–2017 (t + 1) time periods are identified as important milestones. Reconstructions in the regions gained importance especially with the Law (no. 5449) on the Establishment, Coordination and Duties of Development Agencies enacted on 25 January 2006 [105]. Primarily within the scope of Innovating Regions in Europe (IRE) Network, Mersin and Eskişehir regional innovation projects, the first two innovative experiences, were initiated and followed by many others later. 2011 was a turning point in that it was the time when the Ministry of Science, Industry and Technology was established, whose duties are “to determine, develop and implement scientific, technological and innovative policies in cooperation with other related institutions in line with economic, military and social goals, to support research, development and innovation projects in industries, to take and implement incentive measures and to make arrangements and inspection in related subjects and fields” [106]. In the framework of the defined time periods, the study conducted a dynamic analysis of inter-state transitions with reference to selected variables for 81 regions at NUTS-3 level in Turkey. To define these variables, the study closely reviewed primarily the literature on regional innovation system and tried to determine the factors affecting regional innovation systems.
As distinctly figured out from the historical development process of the European Innovation Scoreboard Index [107], intellectual assets are the main variables constantly used in the EU innovation performance measurement. Although there are some changes in the conceptual and unitary definitions of these variables over time, it is obvious that intellectual assets are very important in the innovation performance.
As a study analyzing the transitions regarding intellectual assets, Özen et al. [76] focused on the patent, utility model, trademark and design registrations with the methodology based on the mean values covering the 2000–2005 (t − 1), 2006–2010 (t) and 2011–2016 (t + 1) time periods. This study differs from that of Özen et al. [76] on issues by (i) using intellectual assets with different forms of intellectual property rights (IPR) as the number of patent, utility model, trademark and design applications obtained from Turkish Patent and Trademark Office (ii) methodology with different forms of values, (iii) years covered.
In this study, the following assumptions were considered as the basic frameworks in the formation of Markov Chains (Table 1):
  • First the mean values of each region were obtained in terms of counts of the Patent, Utility Model, Trademark and Design applications between the 2000–2005 (t − 1), 2006–2010 (t) and 2011–2017 (t + 1) time periods. Next, the new values, obtained by the distance of the mean values of each region from the median values of all regions, were the basis of the analysis.
In Markov analysis, the average values of each region within the specified time periods were taken as basis in both methods to eliminate the effects of earthquake, crisis, etc. in certain years. In this methodology, new values were created according to the distance of the average values of each region to the median value of the 81 regions at NUTS-3 level (that is, a new value was obtained for each region by subtracting the median value from the average of the region for each time period).
  • The study used the quartiles to form the performance groups statistically.
Then, the quartiles were processed based on the new values obtained. Thus, regions that have higher values than the median stepped up their innovation performance status, whereas those that have lower ones went down.
  • States are assumed to remain fixed in three different time periods and therefore no change is attempted in describing the performance groups. As mentioned in the introduction chapter, four different performance groups, which were also accepted by the EU, were identified in the evaluation of regional innovation performances. As a result of classification based on the quartiles, the upper group is defined as innovation leaders, the upper-middle group as strong innovators, the lower-middle group as moderate innovators, and finally, the lower group as modest innovators.
In this method, it is assumed that all regions are in the same place in the 2000–2005 time period, and there are no regions in the lower group as modest innovators in the 2000–2005 time period.
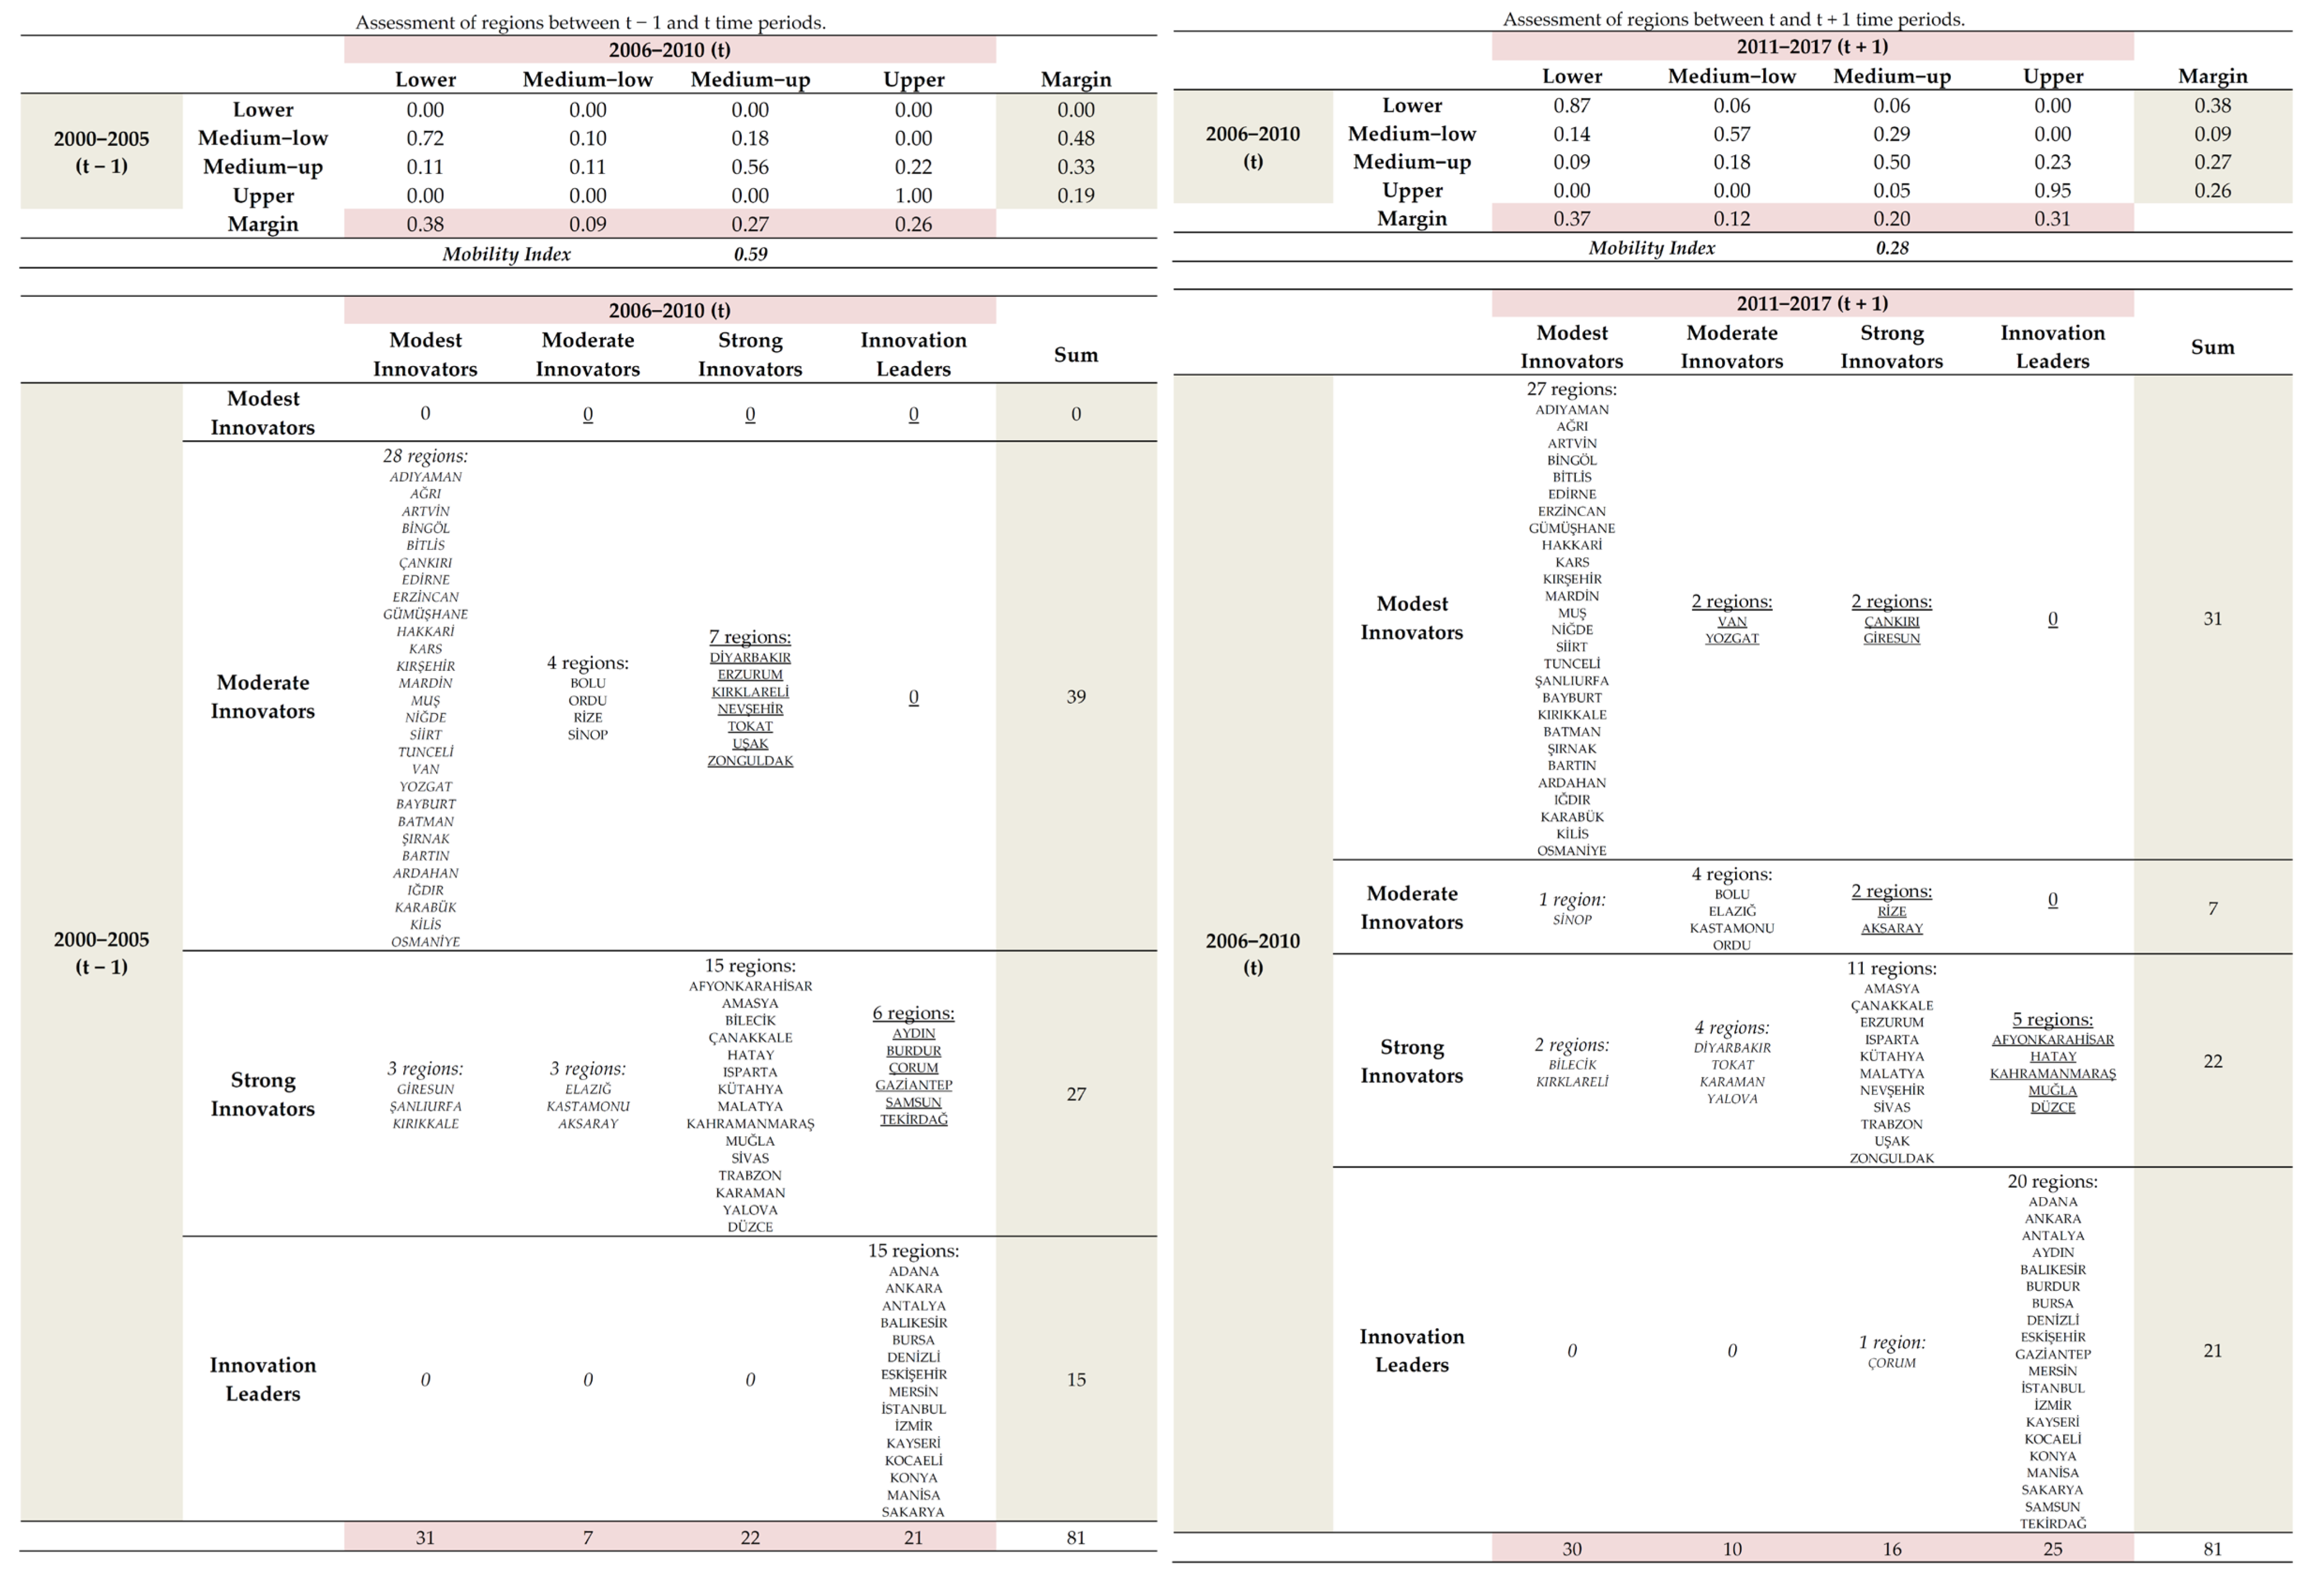
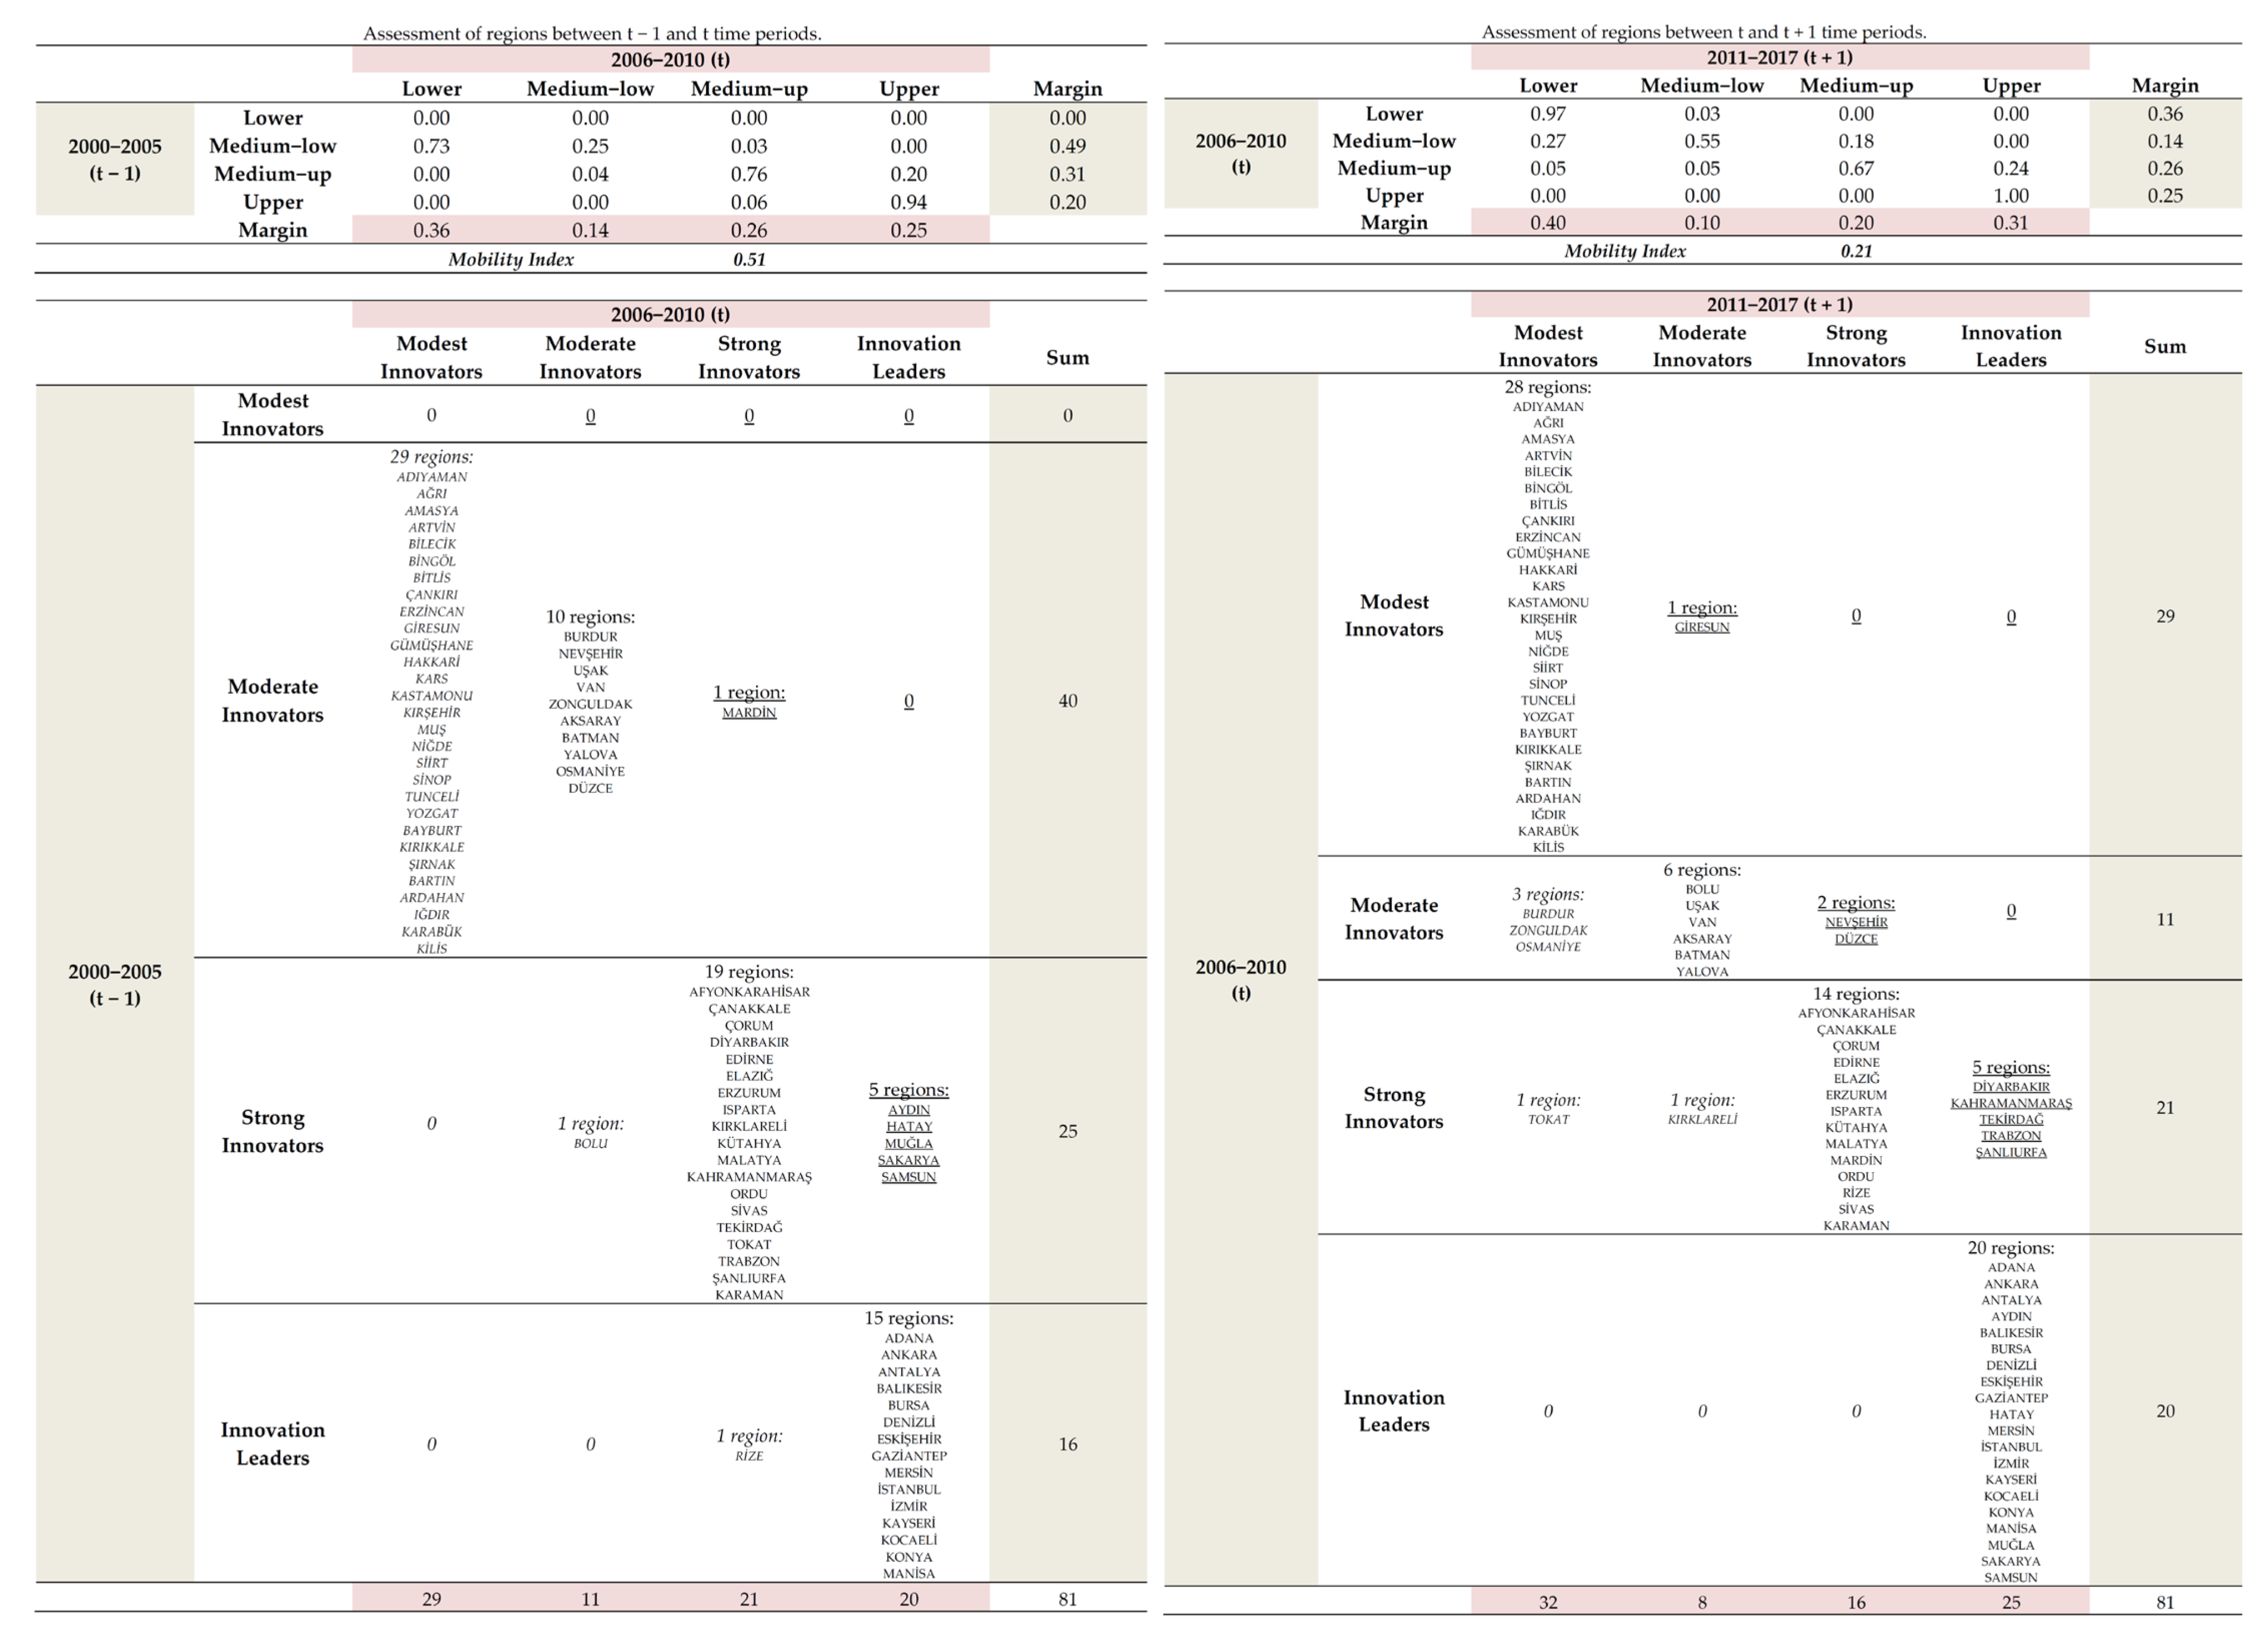
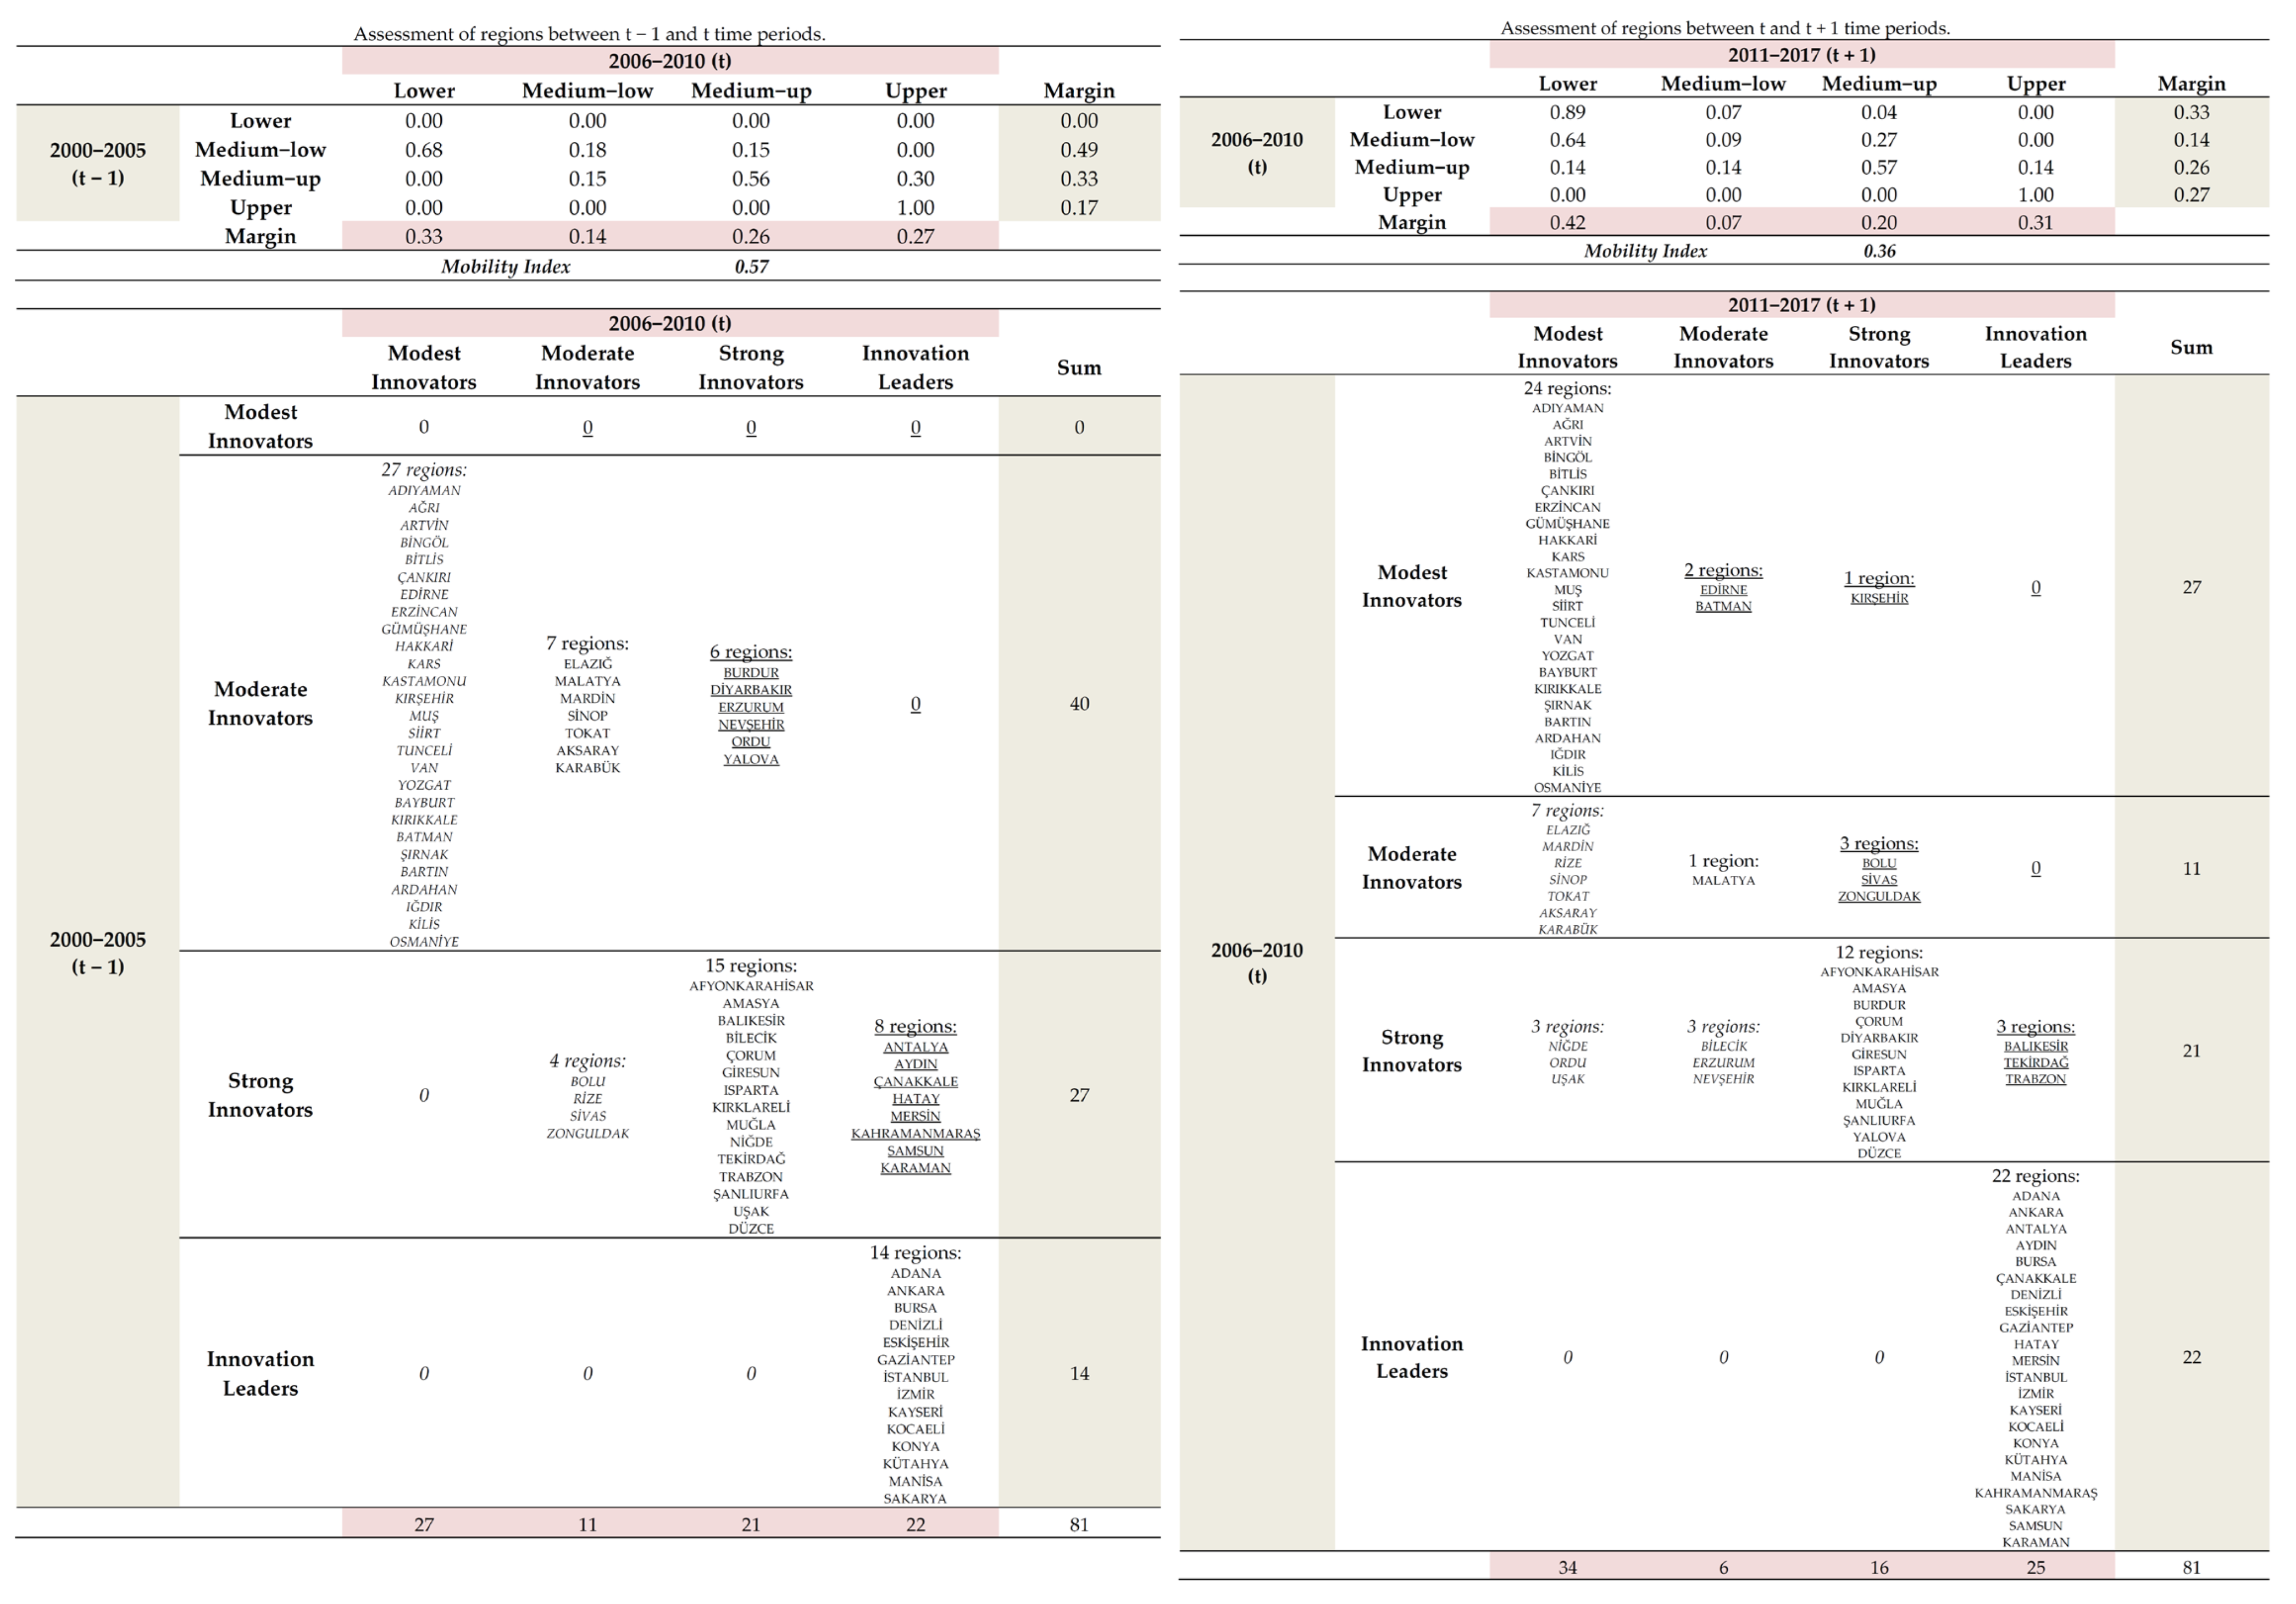
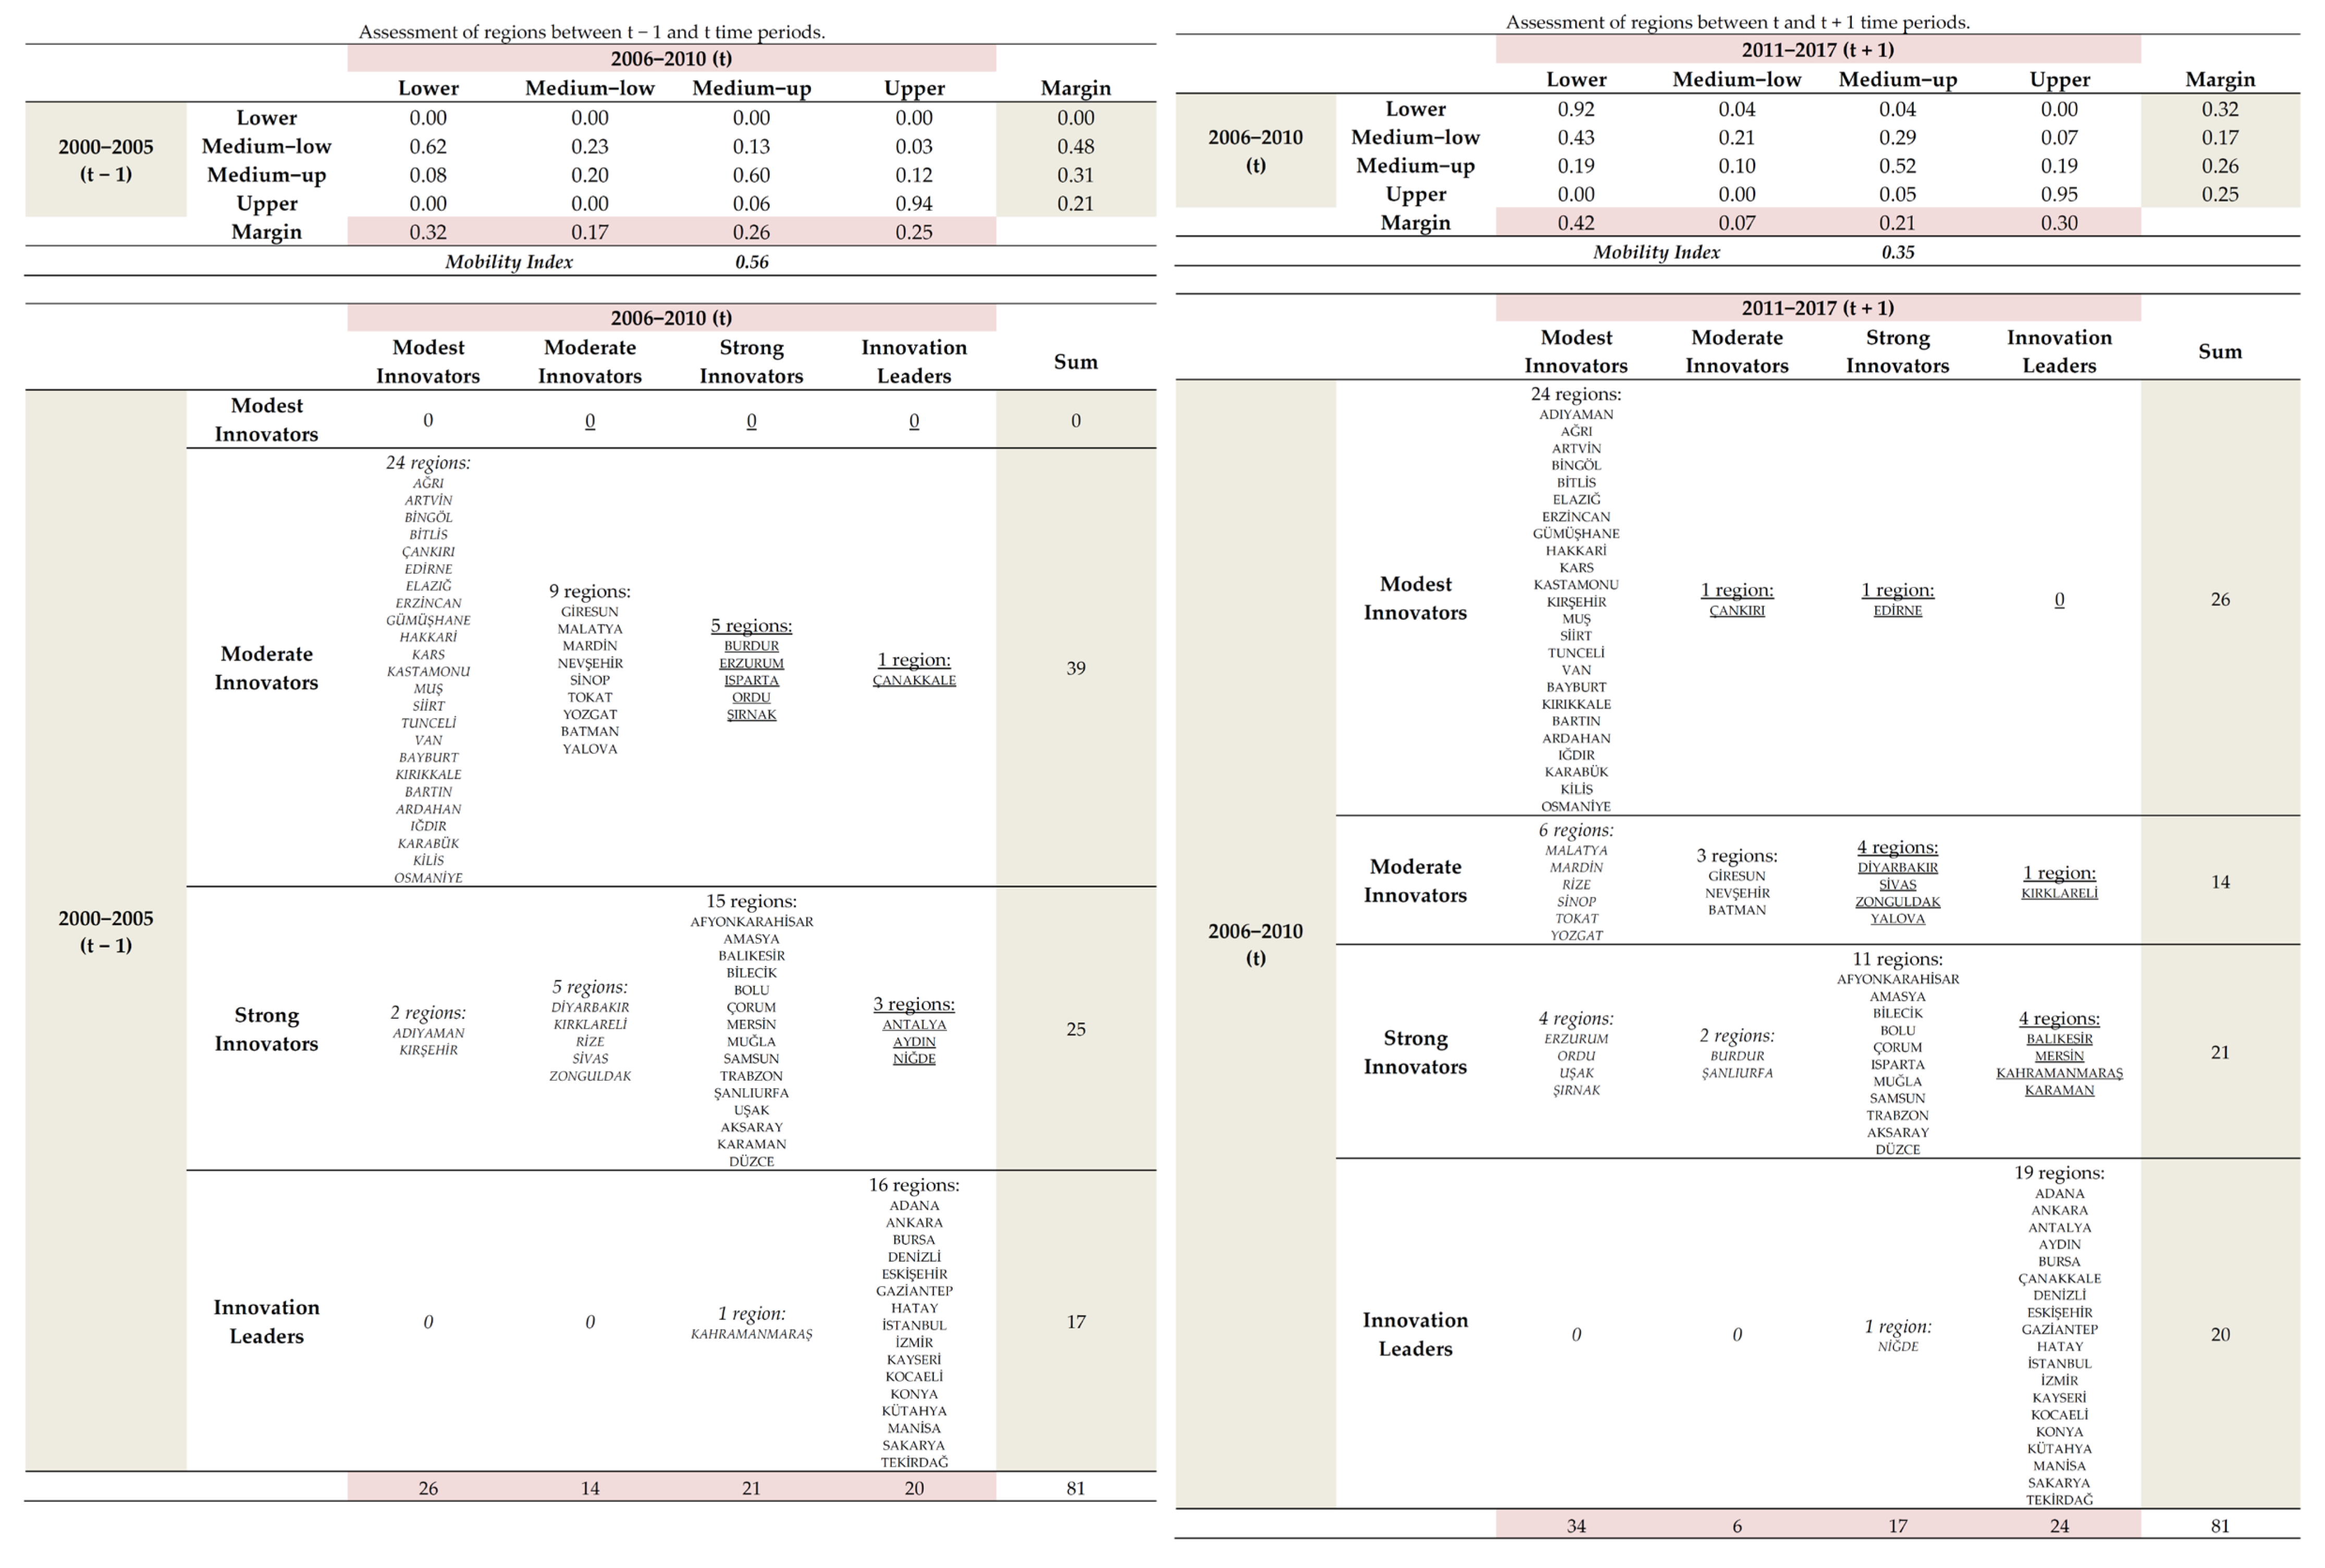
  • In response to the research questions of the study, the transitions of the regions (at NUTS-3 level) in Turkey from one state to the other were determined according to the time periods in terms of their innovation performances which previously defined as four states/classes as a result of the four quartiles. The Shorrocks Trace Index [108], which has been widely used in many fields considering socioeconomic dimensions, is preferred as mobility index for the transitions between states to indicate whether the regions were mobile or not. This mobility index is based on the trace of the transition matrices of Markov Chains. If the mobility index value is 0, it corresponds to immobility, whereas 1 corresponds to perfect mobility. Thus, a higher value of the index refers to a higher level of mobility. The formula of the standardized Shorrocks index ( μ 1 n o r ) is given in Equation (1) as follows:
μ 1 n o r = 1 t r ( P ) n
where n is the number of states/classes, P is the transition probability matrix and t r ( P ) is the trace of P which refers to the sum of its diagonal elements.

4. Empirical Results

This chapter deals with the empirical results of the transitions of regions in terms of innovation performances after the use of successive Markov Chains based on the patent, utility models, trademark and design applications.

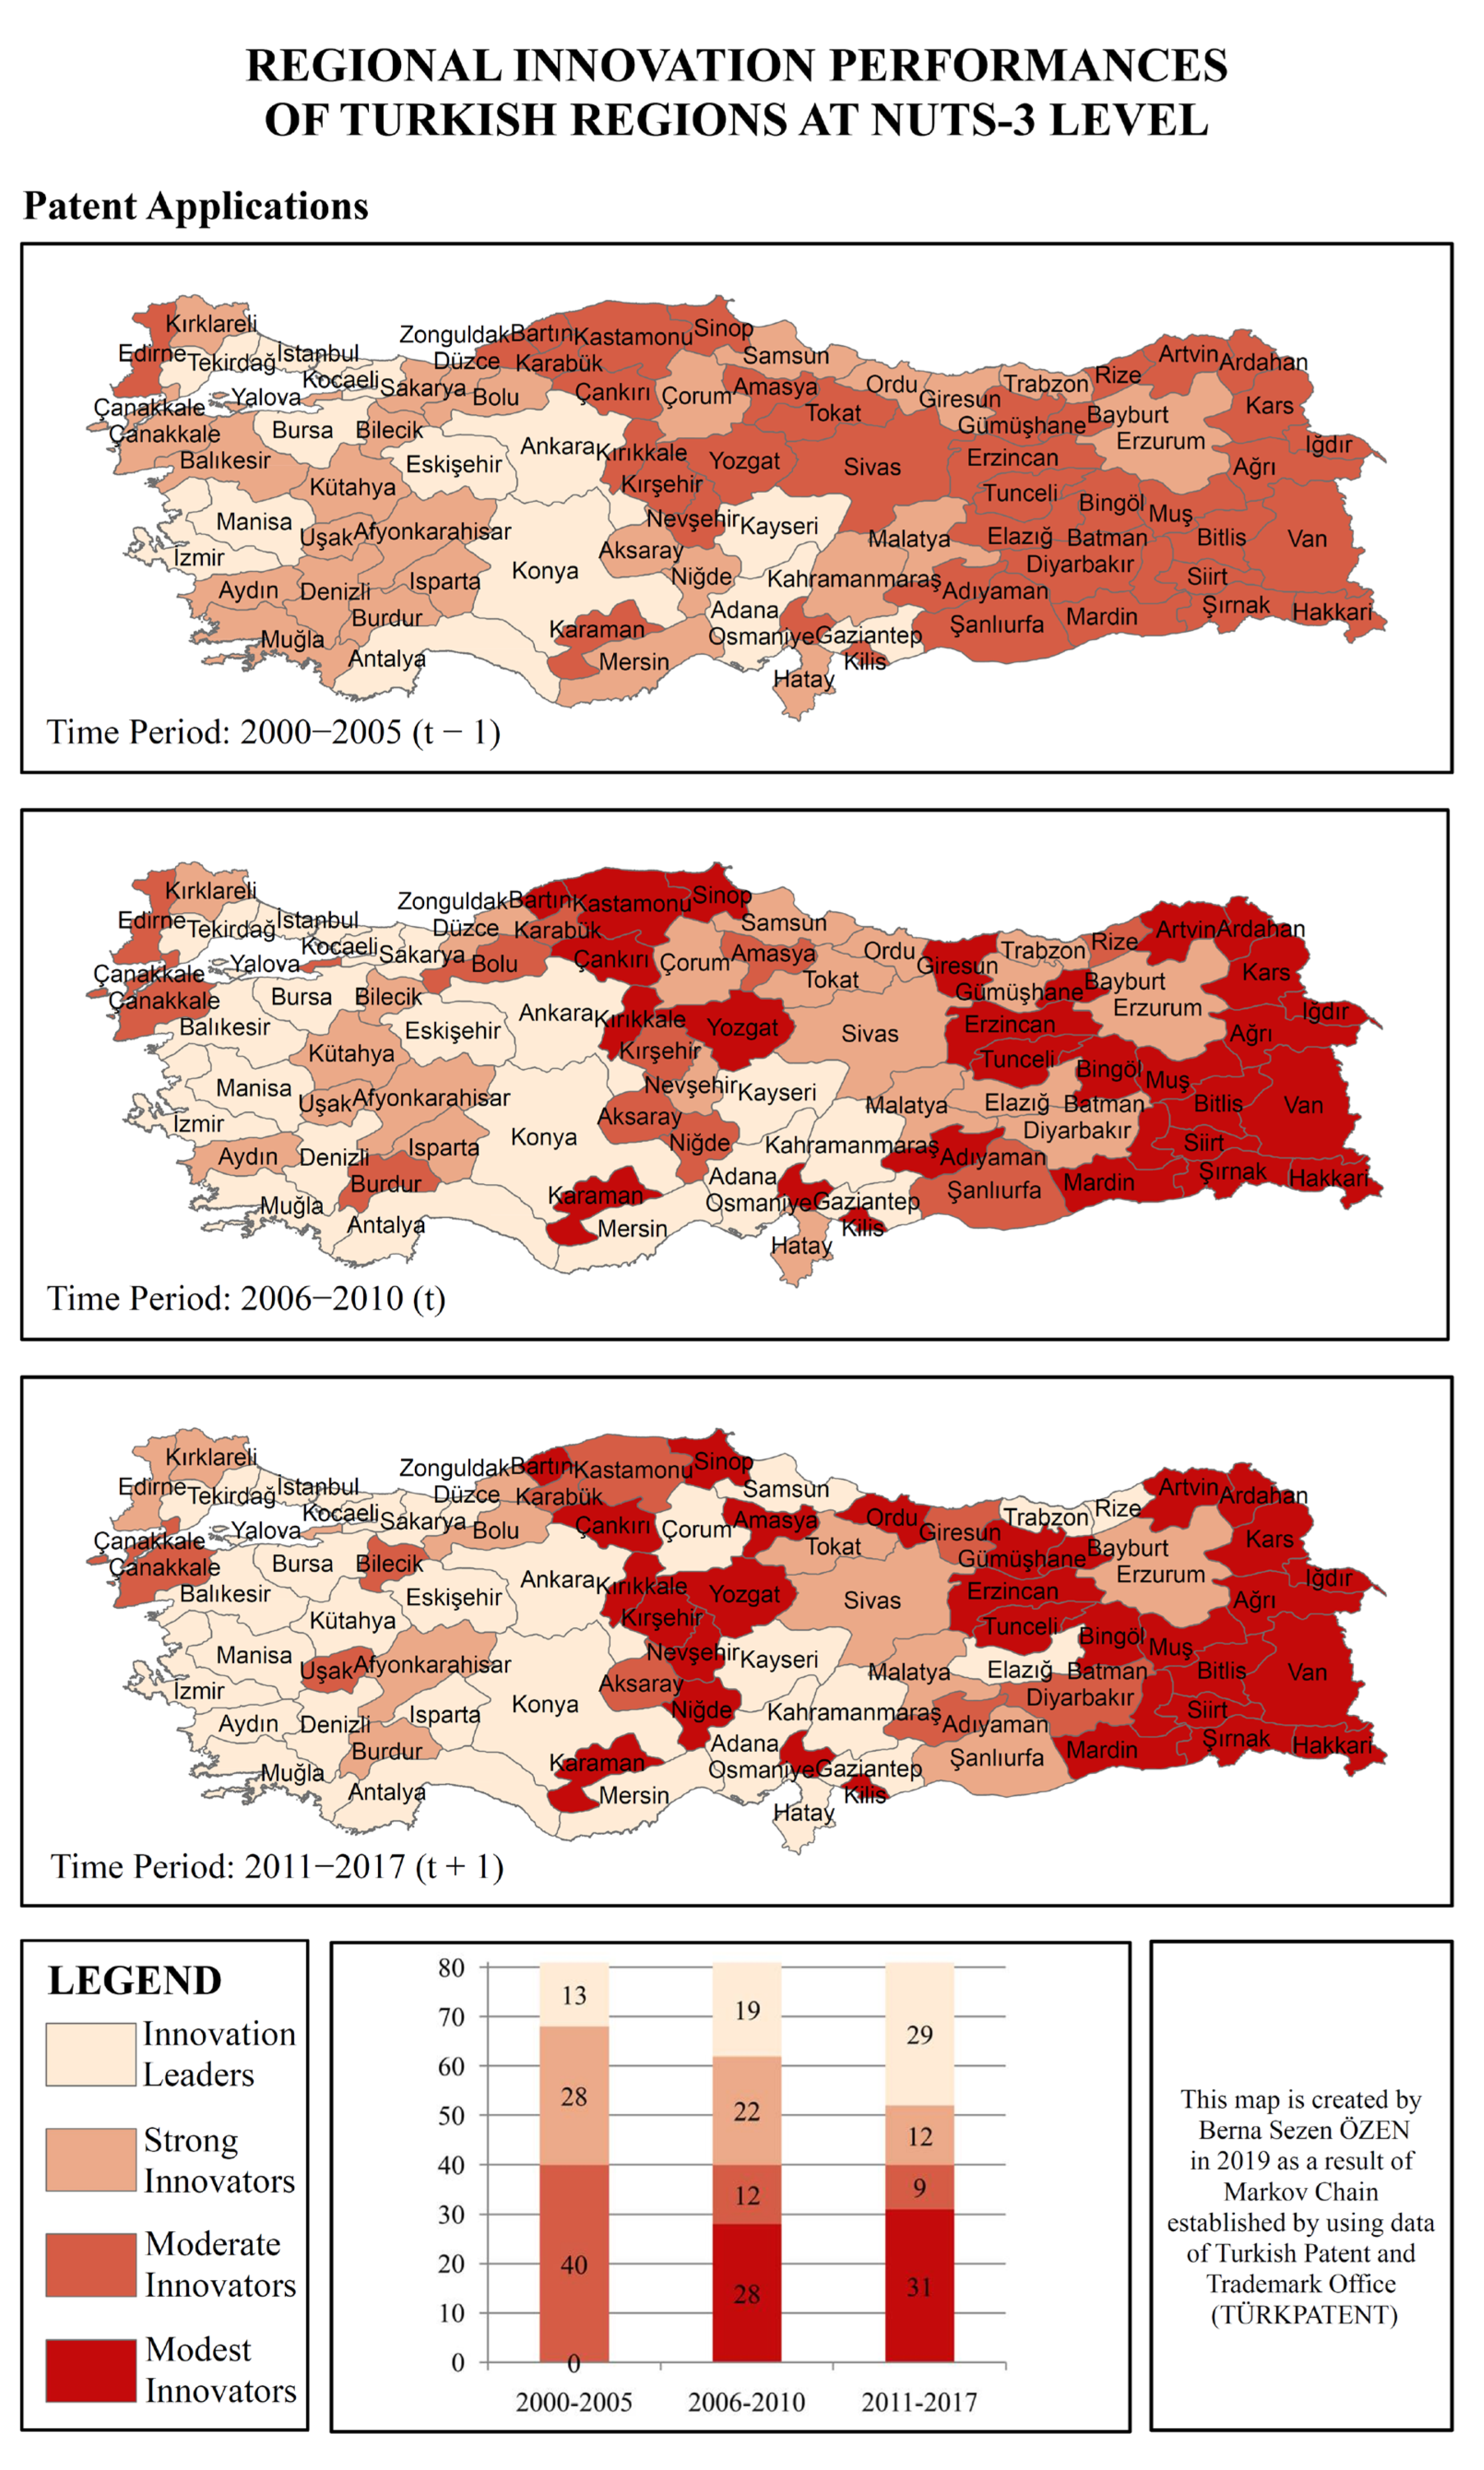
4.1. Patent Applications

When the 2000–2005 (t − 1) and 2006–2010 (t) time periods are analyzed, it is observed that only 34 regions held their innovation performances and preserved their places. There were 13 regions in innovation leaders in both time periods, namely as İstanbul, Ankara, İzmir, Bursa, Manisa, Kocaeli, Konya, Tekirdağ, Kayseri, Adana, Antalya, Eskişehir and Gaziantep regions. The common characteristic of these regions is that they are metropolitan regions (the regions referred to as metropolitan provinces in Turkey are defined in the “Metropolitan Municipality Law no. 5216” which adopted on 10 July 2004 [109] such that each has a population more than 750,000 inhabitants with surrounding suburbs and other neighboring communities). Erzurum, Afyonkarahisar, Kütahya, Samsun, Hatay, Malatya, Çorum, Kırklareli, Trabzon, Aydın, Bilecik, Isparta, Ordu, Uşak and Düzce regions were the 15 strong innovators in both time periods. The remaining 6 regions that managed to maintain their innovation performances were Kırşehir, Edirne, Rize, Karabük, Amasya and Şanlıurfa regions which located in moderate innovators in two time periods. For patent applications, 13 regions succeeded in increasing their innovation performances. These consisted of seven regions as Diyarbakır, Elazığ, Gümüşhane, Sivas, Nevşehir, Tokat and Zonguldak which moved from moderate innovators to strong innovators and six regions as Sakarya, Denizli, Mersin, Balıkesir, Kahramanmaraş and Muğla that passed the innovation leaders from the strong innovators. In contrast to these regions, 34 regions could not maintain their innovation performances and their status declined. Çanakkale, Niğde, Bolu, Burdur, Yalova and Aksaray declined from strong innovators to moderate innovators, and Adıyaman, Sinop, Osmaniye, Kastamonu, Yozgat, Van, Karaman, Kırıkkale, Batman, Mardin, Çankırı, Bitlis, Hakkari, Muş, Siirt, Bartın, Iğdır, Kilis, Ağrı, Bingöl, Tunceli, Şırnak, Artvin, Erzincan, Kars, Bayburt and Ardahan moved from the moderate innovators to the modest innovators. However, apart from these regions, the most striking one was Giresun, which had moved from the strong innovators to the modest innovators having a two-stage downward mobility (Figure A1).
Comparing the 2006–2010 (t) and 2011–2017 (t + 1) time periods, 54 regions were able to maintain their innovation performances. As a reflection of this, it was observed that the mobility index decreased from 0.58 to 0.38. Distribution of these 54 regions are as follows; 19 of them (İstanbul, Ankara, Bursa, İzmir, Manisa, Kocaeli, Konya, Gaziantep, Sakarya, Tekirdağ, Eskişehir, Kayseri, Antalya, Adana, Denizli, Mersin, Balıkesir, Muğla and Kahramanmaraş) are innovation leaders, 7 of them (Malatya, Sivas, Erzurum, Afyonkarahisar, Kırklareli, Zonguldak and Tokat) are strong innovators, 3 of them (Çanakkale, Aksaray and Karabük) are moderate innovators, and finally, 25 of them (Osmaniye, Karaman, Kırıkkale, Van, Yozgat, Batman, Çankırı, Erzincan, Mardin, Bitlis, Siirt, Kilis, Sinop, Bingöl, Hakkari, Artvin, Kars, Şırnak, Bartın, Tunceli, Bayburt, Ağrı, Muş, Ardahan and Iğdır) are modest innovators. All of the innovation leaders in both time periods are metropolitan regions. There are 18 regions that have succeeded to increase their innovation performances. The region that attracted the most attention was Rize, who achieved a two-stage upward mobility from moderate innovators to innovation leaders. The other 17 regions were able to experience a one-stage upward mobility. These regions were Kastamonu, Adıyaman and Giresun, which moved from modest innovators to moderate innovators; Şanlıurfa, Edirne, Yalova, Bolu and Burdur from moderate innovators to strong innovators; and finally, Samsun, Aydın, Trabzon, Çorum, Hatay, Kütahya, Isparta, Elazığ and Düzce regions which moved from strong innovators to innovation leaders. Unlike these regions, innovation performances of nine regions decreased. Especially Gümüşhane, Ordu and Nevşehir regions were the most striking ones because of the two-stage decline from the strong innovators to the modest innovators. In addition, Diyarbakır, Uşak and Bilecik regions have declined from strong innovators to moderate innovators, and Niğde, Amasya and Kırşehir regions from moderate innovators to modest innovators (Figure A1). Depending on the patent applications, transitions regarding innovation performances of all regions in all time periods are illustrated in Figure A2.
In Turkey, patent applications increased after the year 2013. The reason that provided the acceleration of the number of patent applications after 2013 may be attributed to the implementation of the new patent support program as on 1 January 2014. According to the Turkish Patent Institute (TPE) (recently known as Turkish Patent and Trademark Office-TÜRKPATENT) 2014 Annual Report: “The TÜBİTAK 1008 Patent Application Incentive and Support Program, which was implemented in cooperation with TPE and TÜBİTAK on 21 September 2006, was terminated on 15 November 2013 and the new TÜBİTAK 1602 Patent Support Program was implemented as of 1 January 2014. 2.398 requests benefited from TÜBİTAK’s 1602 incentive”.

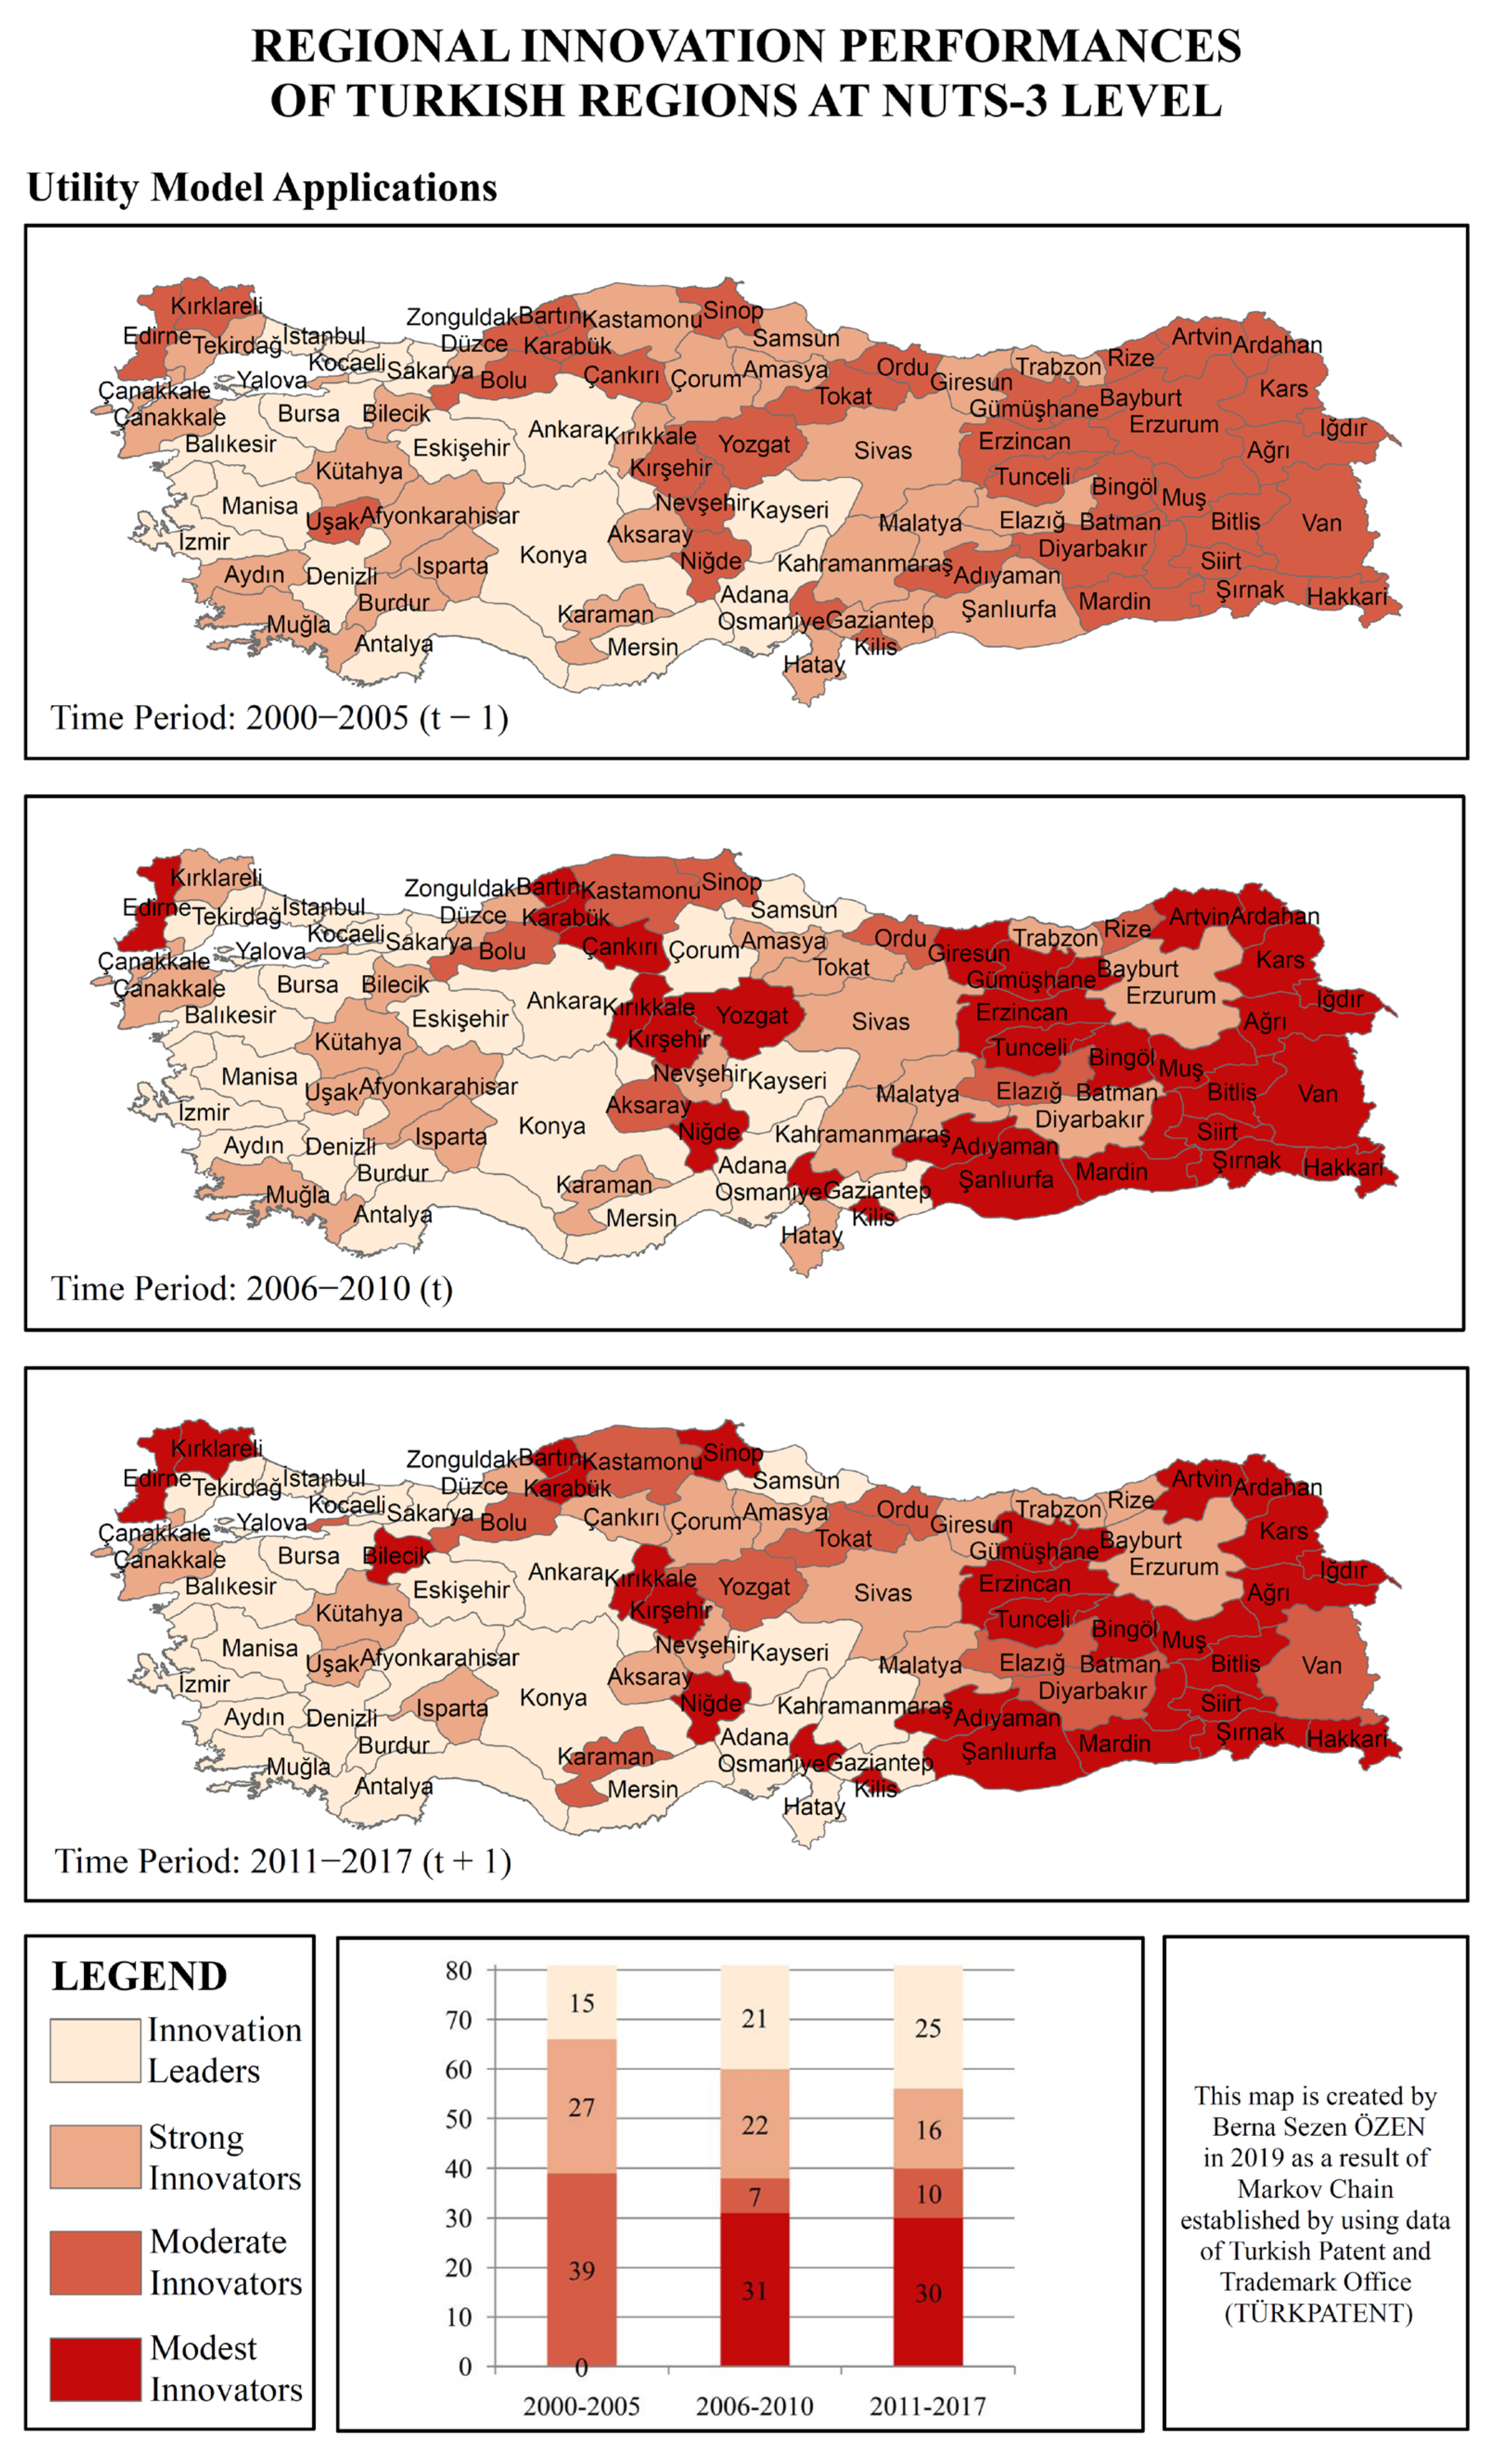
4.2. Utility Models Applications

When the 2000–2005 (t − 1) and 2006–2010 (t) time periods are compared for the variable of utility model applications, 15 regions were consequently identified as innovation leaders in both time periods comprising İstanbul, Ankara, İzmir, Bursa, Konya, Kayseri, Kocaeli, Antalya, Sakarya, Manisa, Adana, Denizli, Eskişehir, Mersin and Balıkesir regions, all of which are metropolitan regions. There were 15 strong innovators in both time periods as Muğla, Düzce, Isparta, Kütahya, Hatay, Kahramanmaraş, Afyonkarahisar, Çanakkale, Sivas, Bilecik, Malatya, Amasya, Yalova, Trabzon and Karaman. Moderate innovators in both time periods were Ordu, Bolu, Sinop and Rize regions. In this case, there were a total of 34 regions that maintained their current places in the 2000–2005 (t − 1) and 2006–2010 (t) time periods. There are a total of 13 regions that have increased their innovation performances. Six strong innovators in 2000–2005 (t − 1), namely as Gaziantep, Aydın, Tekirdağ, Samsun, Çorum and Burdur were promoted to the innovation leaders in 2006–2010 (t) time period. The remaining seven regions were Nevşehir, Tokat, Erzurum, Uşak, Diyarbakır, Kırklareli and Zonguldak regions that had risen from the moderate innovators to the strong innovators. Unlike these upgraded regions, there are a total of 34 regions, whose innovation performances in the 2000–2005 (t − 1) time period declined in the 2006–2010 (t) time period. Giresun, Şanlıurfa and Kırıkkale regions are the most striking regions among those with declining performance. These regions, which were in the strong innovators group in the first period, declined with a two-stage downward mobility to the modest innovators group in the 2006–2010 (t) time period. The remaining 31 regions consisted of 3 regions (Kastamonu, Elazığ and Aksaray) which declined from the strong innovators to the moderate innovators and 28 regions (Edirne, Yozgat, Kırşehir, Mardin, Osmaniye, Adıyaman, Karabük, Çankırı, Kars, Niğde, Van, Batman, Erzincan, Bartın, Iğdır, Artvin, Gümüşhane, Muş, Kilis, Tunceli, Bayburt, Ardahan, Ağrı, Bingöl, Bitlis, Hakkari, Siirt and Şırnak) from the moderate innovators to the modest innovators (Figure A3).
Upon comparing the 2006–2010 (t) and 2011–2017 (t + 1) time periods for the variable of utility model applications, it is figured out that the mobility index decreased from 0.59 to 0.28. The presence of 62 regions that maintained their places in performance groups is an indication of this situation. The distribution of these regions is 27 (Şanlıurfa, Osmaniye, Edirne, Niğde, Kırıkkale, Adıyaman, Bartın, Karabük, Erzincan, Gümüşhane, Mardin, Şırnak, Batman, Bingöl, Kars, Kırşehir, Hakkari, Muş, Ardahan, Iğdır, Kilis, Bitlis, Ağrı, Artvin, Tunceli, Bayburt and Siirt) in the modest innovators; 4 (Kastamonu, Ordu, Elazığ and Bolu) in the moderate innovators; 11 (Trabzon, Isparta, Kütahya, Malatya, Nevşehir, Zonguldak, Amasya, Erzurum, Sivas, Uşak and Çanakkale) in strong innovators; and 20 regions (İstanbul, Ankara, Bursa, İzmir, Konya, Kayseri, Kocaeli, Antalya, Sakarya, Manisa, Denizli, Gaziantep, Adana, Eskişehir, Aydın, Mersin, Tekirdağ, Samsun, Balıkesir and Burdur) in innovation leaders. In the 2011–2017 (t + 1) time period, 11 regions increased their previous innovation performances. The most striking of these regions are the Çankırı and Giresun regions which achieved a two-stage upward mobility from the modest innovators to the strong innovators. The remaining nine regions achieved a one-stage upward mobility. These regions were Yozgat and Van which increased their innovation performances from the modest innovators to the moderate innovators; Rize and Aksaray from moderate innovators to strong innovators; and finally, Afyonkarahisar, Hatay, Kahramanmaraş, Muğla and Düzce regions from strong innovators to the innovation leaders. There are eight regions where innovation performances are declining. The most striking of these regions are Kırklareli and Bilecik, which were in the strong innovators in the 2006–2010 (t) time period but declined to the modest innovators in the 2011–2017 (t + 1) time period. Innovation performances of the remaining six regions declined by one stage. Sinop declined from moderate innovators to the modest innovators. Karaman, Yalova, Diyarbakır and Tokat moved from the strong innovators to the moderate innovators. Finally, Çorum region declined from innovation leaders to strong innovators (Figure A3). Depending on the utility model applications, transitions regarding innovation performances of all regions in all time periods are illustrated in Figure A4.

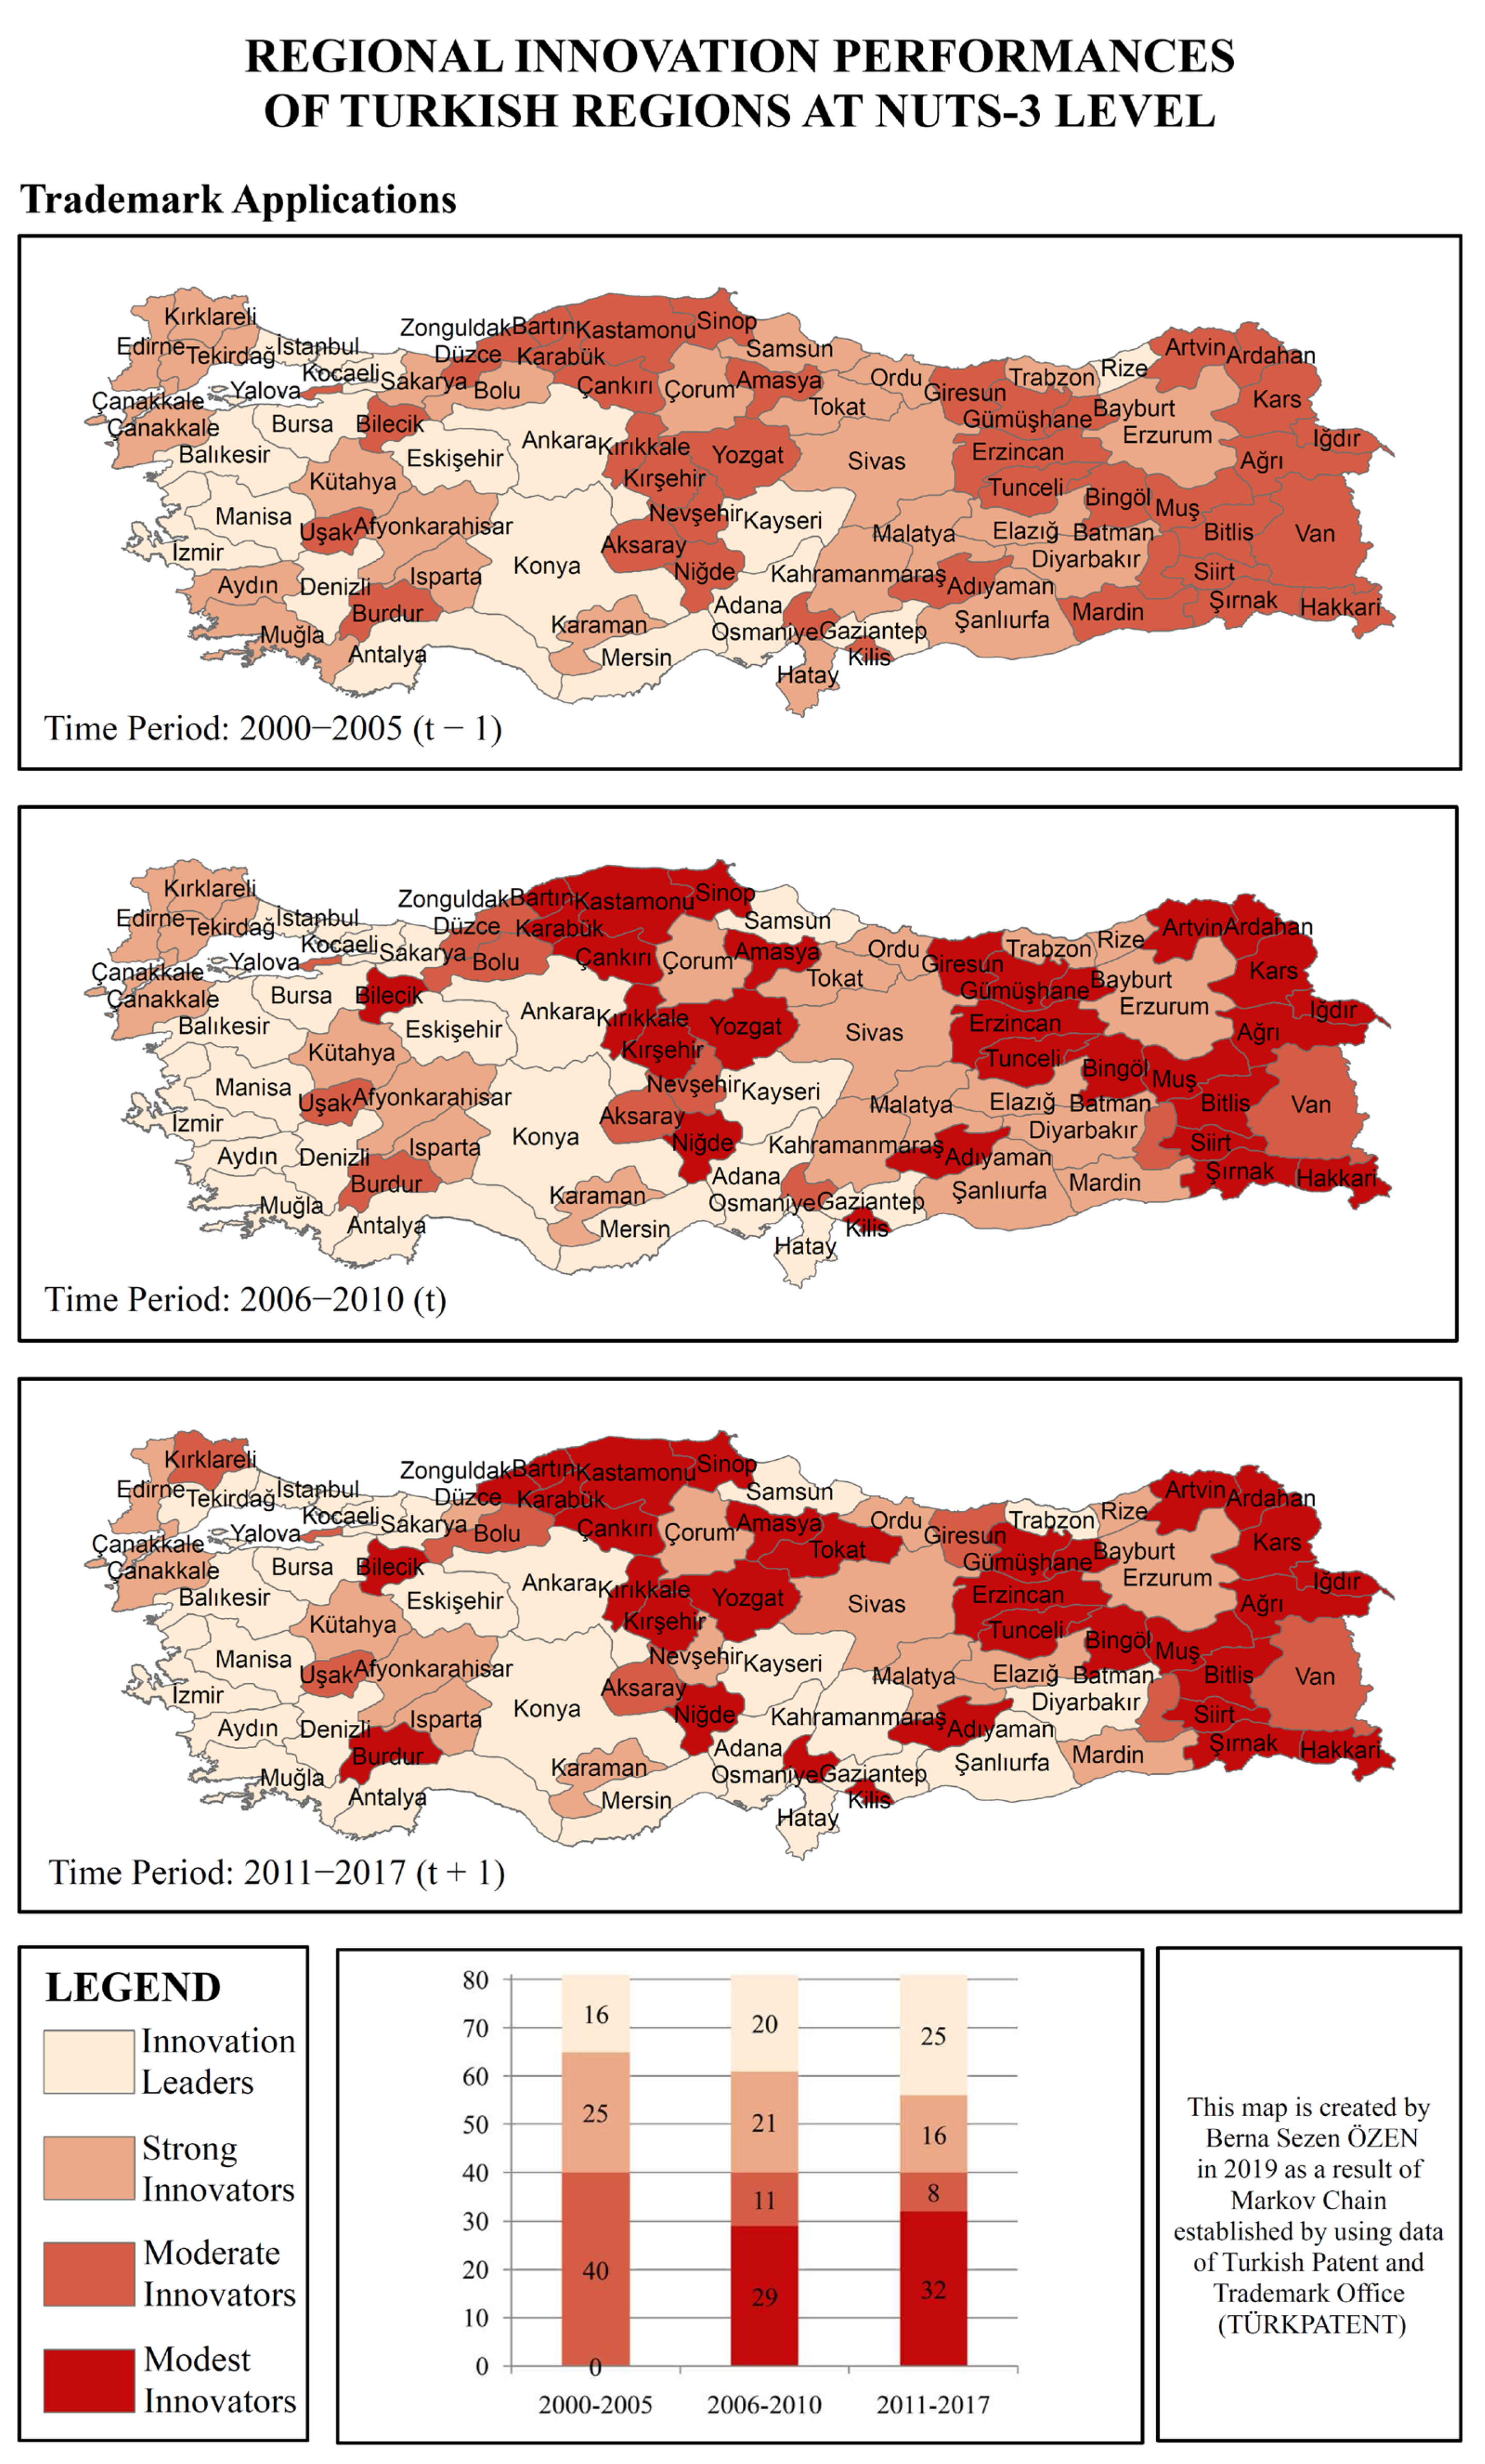
4.3. Trademark Applications

When the 2000–2005 (t − 1) and 2006–2010 (t) time periods are examined for the variable of trademark applications, there are 44 regions that maintained their innovation performances. Fifteen of these regions were in the innovation leaders in both time periods as İstanbul, Ankara, İzmir, Bursa, Antalya, Gaziantep, Konya, Kocaeli, Adana, Kayseri, Mersin, Denizli, Eskişehir, Manisa and Balıkesir regions. As in other variables, the common feature of these regions is that they are all metropolitan regions. Nineteen regions (namely Tekirdağ, Trabzon, Malatya, Afyonkarahisar, Kahramanmaraş, Şanlıurfa, Kütahya, Elazığ, Diyarbakır, Karaman, Isparta, Çanakkale, Tokat, Erzurum, Çorum, Ordu, Kırklareli, Sivas and Edirne) kept their innovation performances and located in the strong innovators in both time periods. Finally, the remaining 10 regions in the moderate innovators that maintained their innovation performances in both time periods were Düzce, Yalova, Van, Uşak, Batman, Zonguldak, Nevşehir, Osmaniye, Aksaray and Burdur regions. In this variable, only 6 regions managed to increase their innovation performances, while 31 regions could not be able to maintain their innovation performances and had to decline by one stage. Regions that increased their innovation performances were Mardin region from the moderate innovators to the strong innovators and Muğla, Sakarya, Samsun, Aydın and Hatay regions from the strong innovators to the innovation leaders. Unlike these upgraded regions, Rize region declined from innovation leaders to strong innovators, Bolu from strong innovators to moderate innovators and Adıyaman, Amasya, Giresun, Kastamonu, Erzincan, Niğde, Karabük, Yozgat, Bartın, Kırıkkale, Bilecik, Çankırı, Kırşehir, Kars, Sinop, Kilis, Şırnak, Muş, Ağrı, Gümüşhane, Hakkari, Artvin, Siirt, Bingöl, Iğdır, Bitlis, Ardahan, Bayburt and Tunceli regions from moderate innovators to modest innovators by being unable to maintain their innovation performances (Figure A5).
When the time periods of 2006–2010 (t) and 2011–2017 (t + 1) are examined, it is seen that 68 regions preserved their places and as a reflection of this, the mobility index in the first matrix declined from 0.51 to 0.21. This variable is the variable in which mobility most decreased and reached the lowest value. The majority of these 68 regions maintained their innovation performances comprising the modest innovators with 28 regions as Adıyaman, Karabük, Kastamonu, Niğde, Amasya, Erzincan, Bilecik, Kırıkkale, Kırşehir, Bartın, Yozgat, Sinop, Kilis, Şırnak, Iğdır, Ağrı, Çankırı, Artvin, Siirt, Kars, Bingöl, Bitlis, Muş, Hakkari, Gümüşhane, Tunceli, Ardahan and Bayburt regions. In addition, Bolu, Batman, Van, Aksaray, Yalova and Uşak regions were in the moderate innovators in both periods. The 14 regions located in the strong innovators in both time periods were Çanakkale, Afyonkarahisar, Malatya, Elazığ, Mardin, Kütahya, Karaman, Rize, Isparta, Edirne, Çorum, Sivas, Erzurum and Ordu regions. The last remaining 20 regions that maintained their innovation performances were in the innovation leaders. These regions were İstanbul, Ankara, İzmir, Bursa, Gaziantep, Antalya, Konya, Kocaeli, Adana, Kayseri, Denizli, Mersin, Muğla, Hatay, Eskişehir, Balıkesir, Sakarya, Manisa, Samsun and Aydın regions, all of which are metropolitan regions. While 8 regions were able to increase their innovation performances by one stage, the performances of other 5 regions have decreased for this variable. These upgraded regions were Giresun region which has risen from the modest innovators to the moderate innovators; Düzce and Nevşehir from the moderate innovators to the strong innovators; and finally, Tekirdağ, Trabzon, Kahramanmaraş, Şanlıurfa and Diyarbakır regions from strong innovators to innovation leaders. Tokat is the most noticeable region of the 5 regions with declining performances. It was undergone two-stage downward mobility from the strong innovators in the 2006–2010 (t) time period to the modest innovators in the 2011–2017 (t + 1) time period. Other regions have declined by one stage. These regions were Zonguldak, Osmaniye and Burdur regions which moved from moderate innovators to modest innovators; and Kırklareli region from strong innovators to moderate innovators (Figure A5). Depending on the trademark applications, transitions regarding innovation performances of all regions in all time periods are shown in Figure A6.

4.4. Design Applications (Number of Files)

According to this variable when the 2000–2005 (t − 1) and 2006–2010 (t) time periods are compared, it is seen that 36 regions maintained their innovation performances. Fourteen of these regions were İstanbul, Ankara, Bursa, İzmir, Kayseri, Gaziantep, Konya, Kocaeli, Denizli, Manisa, Adana, Kütahya, Sakarya and Eskişehir regions which were in innovation leaders in both time periods. All of these regions except Kütahya are metropolitan regions. Trabzon, Balıkesir, Tekirdağ, Afyonkarahisar, Uşak, Şanlıurfa, Muğla, Isparta, Niğde, Bilecik, Çorum, Amasya, Giresun, Düzce and Kırklareli regions were located in the strong innovators. In addition, the remaining seven regions consisted of Tokat, Sinop, Malatya, Elazığ, Mardin, Aksaray and Karabük regions which located in moderate innovators for both time periods. There are 14 regions that have managed to increase their innovation performances. These regions were Ordu, Diyarbakır, Yalova, Burdur, Erzurum and Nevşehir regions that moved from moderate innovators to strong innovators; and Antalya, Hatay, Çanakkale, Mersin, Aydın, Samsun, Kahramanmaraş and Karaman regions that have passed to the innovation leaders from the strong innovators. Unlike these regions, Bolu, Zonguldak, Sivas and Rize regions declined from strong innovators to the moderate innovators and Batman, Çankırı, Kastamonu, Ağrı, Kırşehir, Kilis, Osmaniye, Edirne, Yozgat, Kırıkkale, Artvin, Bingöl, Bayburt, Ardahan, Adıyaman, Erzincan, Muş, Bartın, Bitlis, Gümüşhane, Hakkari, Kars, Siirt, Tunceli, Van, Şırnak and Iğdır regions declined from moderate innovators to the modest innovators. Thus 31 regions could not be able to maintain their innovation performances (Figure A7).
When comparing the 2006–2010 (t) and 2011–2017 (t + 1) time periods, 59 regions maintained their innovation performances. As a reflection of this, mobility has decreased with declining mobility indices from 0.57 to 0.36. The majority of these 59 regions consisted of 22 regions in innovation leaders and 24 regions in modest innovators. Regions in innovation leaders in both time periods were Adana, Ankara, Antalya, Aydın, Bursa, Çanakkale, Denizli, Eskişehir, Gaziantep, Hatay, Mersin, İstanbul, İzmir, Kayseri, Kocaeli, Konya, Kütahya, Manisa, Kahramanmaraş, Sakarya, Samsun and Karaman regions all of which were metropolitan regions except Kütahya, Çanakkale and Karaman. The regions that were in strong innovators in both time periods were Afyonkarahisar, Amasya, Burdur, Çorum, Diyarbakır, Giresun, Isparta, Kırklareli, Muğla, Şanlıurfa, Yalova and Düzce regions. Malatya region was located in the moderate innovators group. Finally, remaining 24 regions that maintained their innovation performances were located in modest innovators as Adıyaman, Ağrı, Artvin, Bingöl, Bitlis, Çankırı, Erzincan, Gümüşhane, Hakkari, Kars, Kastamonu, Muş, Siirt, Tunceli, Van, Yozgat, Bayburt, Kırıkkale, Şırnak, Bartın, Ardahan, Iğdır, Kilis and Osmaniye regions. A total of 9 regions managed to increase their innovation performances. The most noticeable of these regions is Kırşehir, which was in the modest innovators in the 2006–2010 (t) time period and moved to the strong innovators in the next time period by achieving a two-stage upward mobility. The other 8 regions increased their innovation performances by one stage. Edirne and Batman regions moved from modest to moderate innovators; Bolu, Sivas and Zonguldak regions from moderate to strong innovators; and finally, Balıkesir, Tekirdağ and Trabzon regions from strong innovators to innovation leaders. Unlike these regions, the most noticeable of the 13 regions with declining performances were Niğde, Ordu and Uşak regions which were unable to maintain their innovation performances and had a two-stage downward mobility. Thus, their positions in the strong innovators changed to the modest innovators in the 2011–2017 (t + 1) time period. The other 10 regions declined by one stage. Bilecik, Erzurum and Nevşehir regions fell from strong innovators to moderate innovators, and Elazığ, Mardin, Rize, Sinop, Tokat, Aksaray and Karabük regions from moderate innovators to modest innovators (Figure A7). Depending on the design applications (file), transitions regarding innovation performances of all regions in all time periods are shown in Figure A8.

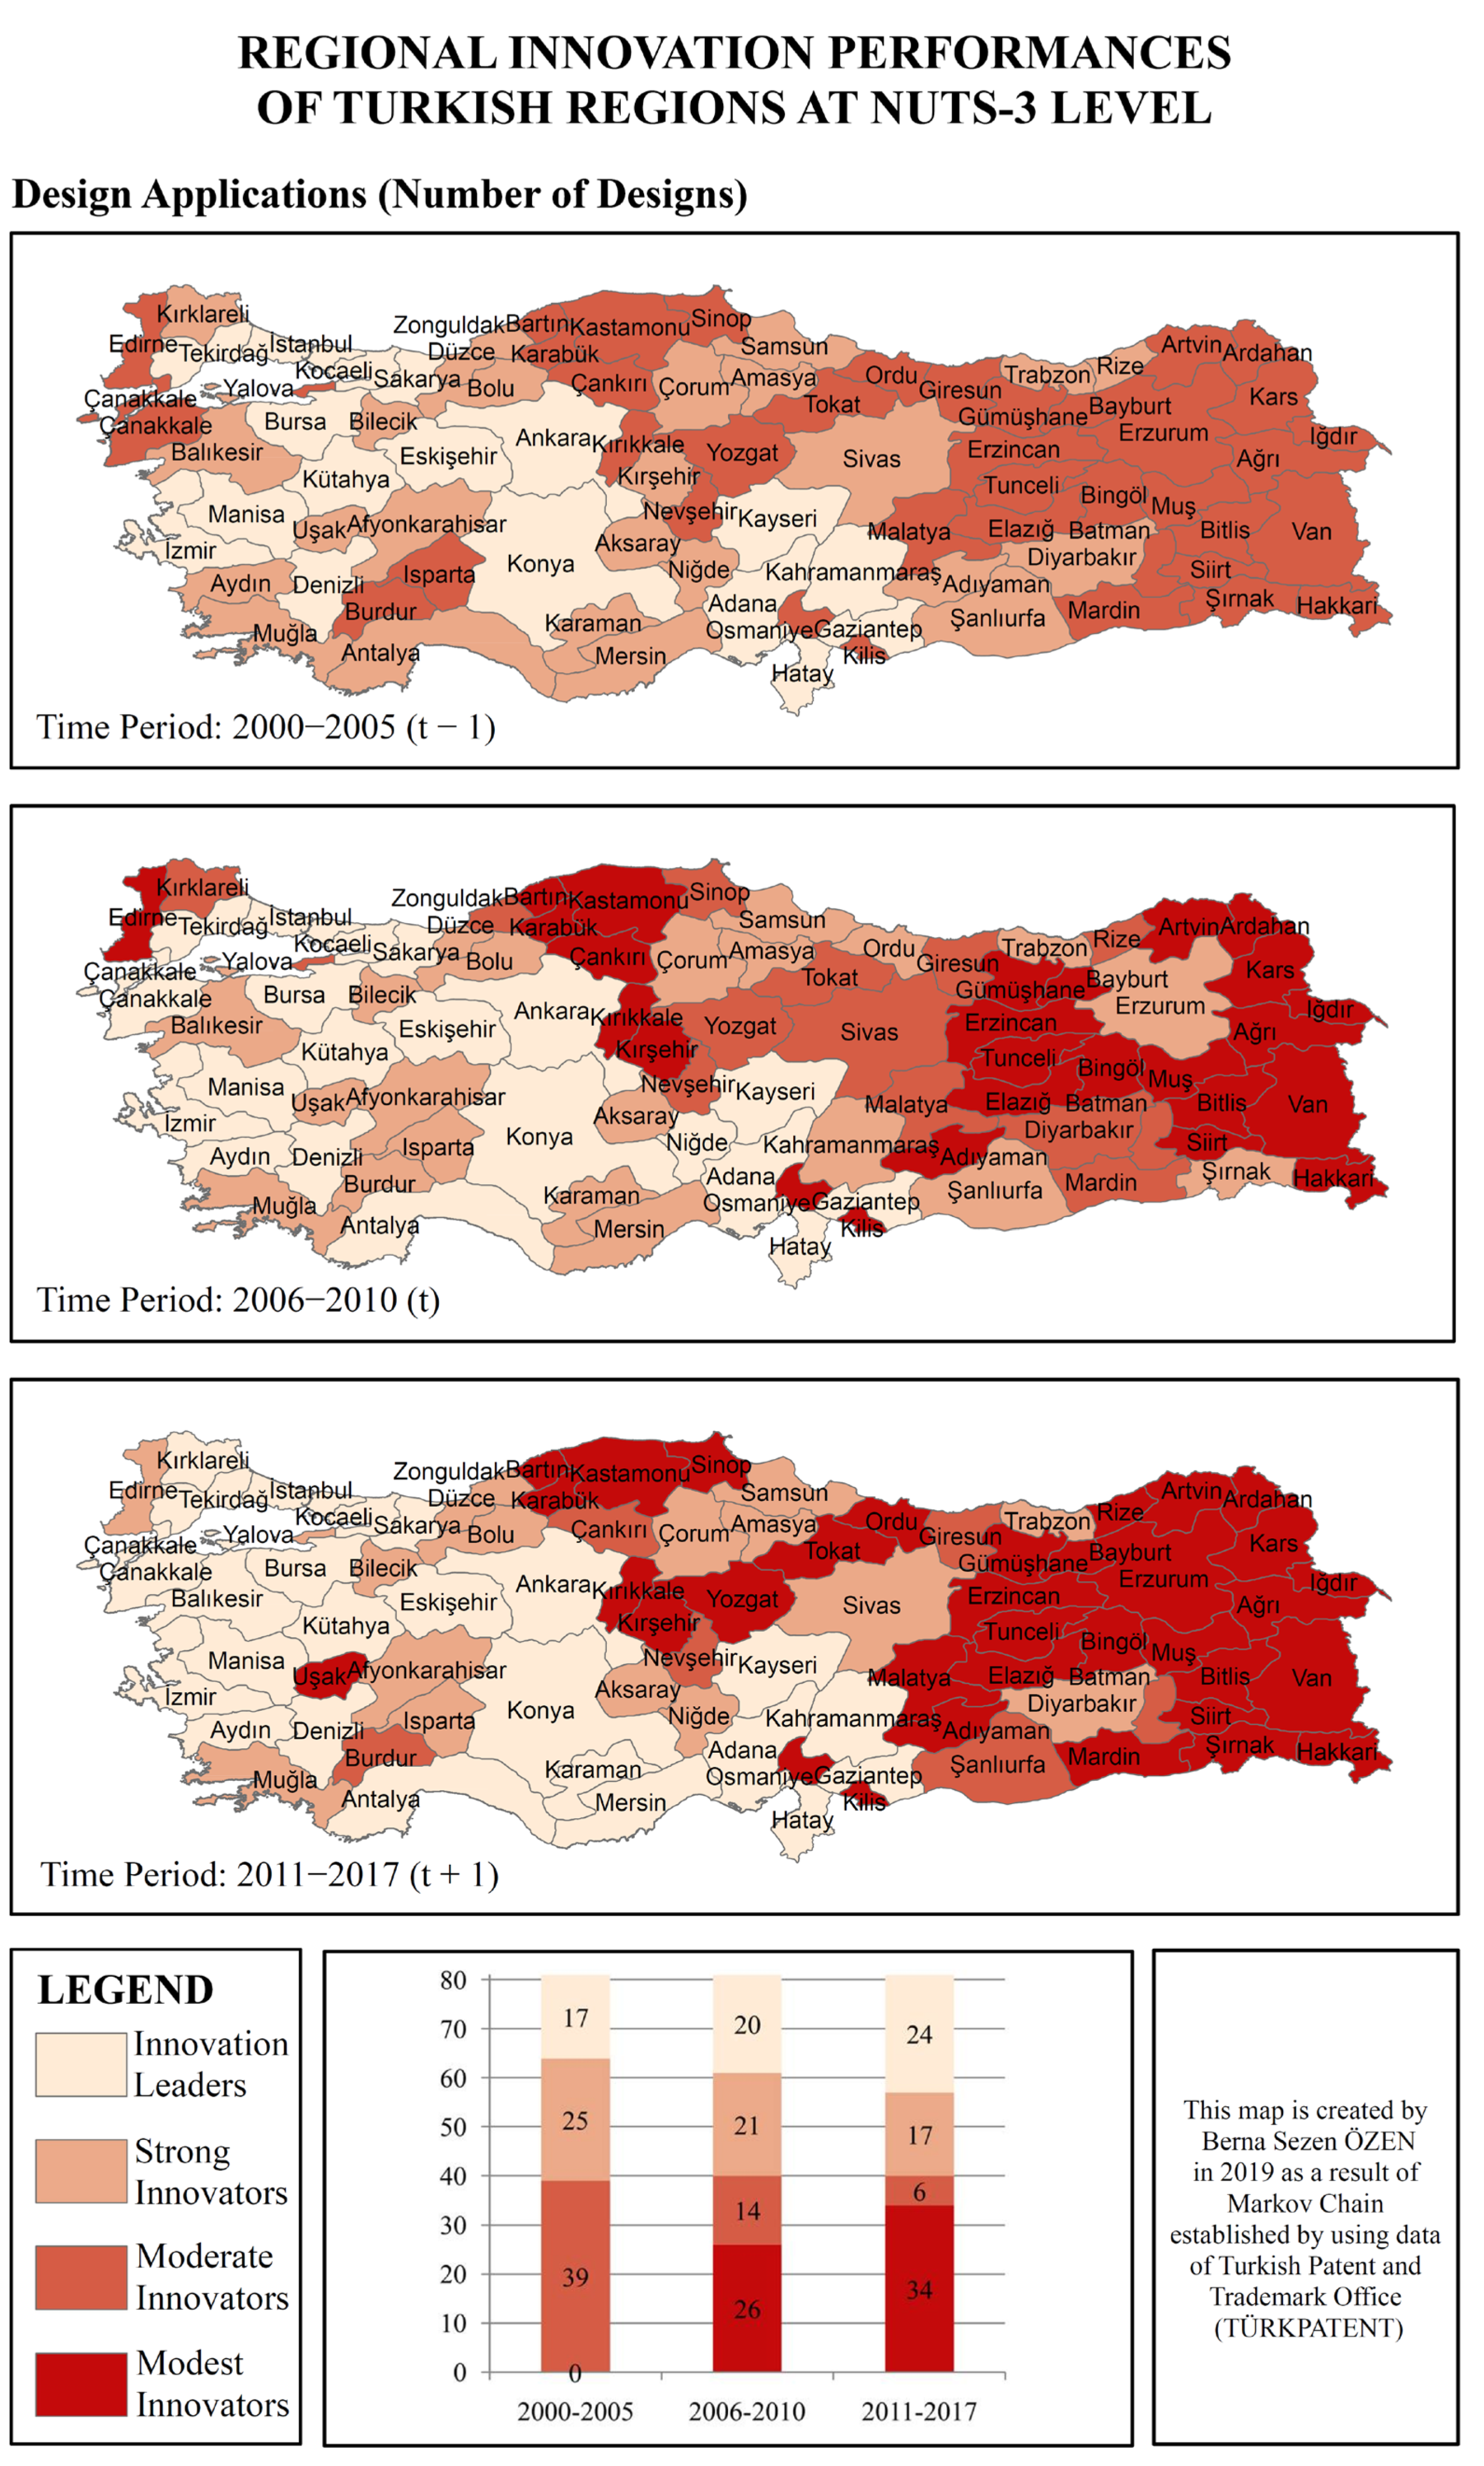
4.5. Design Applications (Number of Designs)

When the 2000–2005 and 2006–2010 time periods are compared, it is seen that 40 regions maintained their innovation performances. Sixteen of these regions were in innovation leaders, fifteen in strong innovators, and nine in moderate innovators. Regions in innovation leaders were Adana, Ankara, Bursa, Denizli, Eskişehir, Gaziantep, Hatay, İstanbul, İzmir, Kayseri, Kocaeli, Konya, Kütahya, Manisa, Sakarya and Tekirdağ regions. All of these regions except Kütahya are metropolitan regions. Regions in strong innovators were Afyonkarahisar, Amasya, Balıkesir, Bilecik, Bolu, Çorum, Mersin, Muğla, Samsun, Trabzon, Şanlıurfa, Uşak, Aksaray, Karaman and Düzce regions. Finally, Giresun, Malatya, Mardin, Nevşehir, Sinop, Tokat, Yozgat, Batman and Yalova regions were located in moderate innovators. While 9 regions managed to increase their innovation performances, 32 regions could not maintain their innovation performances and their status declined. The most striking of these nine upgraded regions was Çanakkale region, which has risen from moderate innovators to innovation leaders by achieving a two-stage upward mobility. The other eight regions made a one-stage improvement. Five of these regions were Burdur, Erzurum, Isparta, Ordu and Şırnak regions that rose from moderate innovators to strong innovators, and three of these regions were Antalya, Aydın and Niğde regions that rose from strong innovators to innovation leaders. Contrary to these upgraded regions, among the 32 regions whose innovation performances have declined, the most striking ones were Adıyaman and Kırşehir regions, which fell from strong innovators to modest innovators by having a two-stage downward mobility. Regions that declined by one stage were Kahramanmaraş region that moved from innovation leaders to strong innovators; Diyarbakır, Kırklareli, Rize, Sivas and Zonguldak regions that moved from strong innovators to moderate innovators, and finally, Ağrı, Artvin, Bingöl, Bitlis, Çankırı, Edirne, Elazığ, Erzincan, Gümüşhane, Hakkari, Kars, Kastamonu, Muş, Siirt, Tunceli, Van, Bayburt, Kırıkkale, Bartın, Ardahan, Iğdır, Karabük, Kilis and Osmaniye regions which moved from moderate innovators to modest innovators (Figure A9).
Mobility index value decreased from 0.56 to 0.35. Upon comparing the 2006–2010 (t) and 2011–2017 (t + 1) time periods, the reason of the decline is that 57 regions maintained their innovation performances. Eleven regions managed to increase their innovation performances, while thirteen regions could not maintain their innovation performances and their ranks fell. Regions that maintained their innovation performances were Adana, Ankara, Antalya, Aydın, Bursa, Çanakkale, Denizli, Eskişehir, Gaziantep, Hatay, İstanbul, İzmir, Kayseri, Kocaeli, Konya, Kütahya, Manisa, Sakarya and Tekirdağ regions (all of that are metropolitan regions except Çanakkale and Kütahya regions) in innovation leaders; Afyonkarahisar, Amasya, Bilecik, Bolu, Çorum, Isparta, Muğla, Samsun, Trabzon, Aksaray and Düzce regions located in strong innovators; Giresun, Nevşehir and Batman regions in the moderate innovators; and finally, Adıyaman, Ağrı, Artvin, Bingöl, Bitlis, Elazığ, Erzincan, Gümüşhane, Hakkari, Kars, Kastamonu, Kırşehir, Muş, Siirt, Tunceli, Van, Bayburt, Kırıkkale, Bartın, Ardahan, Iğdır, Karabük, Kilis and Osmaniye regions in modest innovators. Among the 11 regions that increased their innovation performances, the most notable ones were Edirne region that rose from modest innovators to strong innovators and Kırklareli region from moderate innovators to innovation leaders with experiencing a two-stage upward mobility. In addition to these regions, Çankırı region that moved from modest innovators to moderate innovators; Diyarbakır, Sivas, Zonguldak and Yalova regions that moved from moderate innovators to strong innovators; and Balıkesir, Mersin, Kahramanmaraş and Karaman regions which moved from strong innovators to innovation leaders were the regions that have succeeded to increase their innovation performances by one stage. Among the 13 regions with declining innovation performances, the most striking ones were Erzurum, Ordu, Uşak and Şırnak regions, which declined from strong innovators to modest innovators with a two-stage downward mobility. In addition to these regions, Niğde region that moved from innovation leaders to strong innovators; Burdur and Şanlıurfa regions from strong innovators to moderate innovators; and Malatya, Mardin, Rize, Sinop, Tokat and Yozgat regions that moved from moderate innovators to modest innovators were other regions whose innovation performances have declined (Figure A9). Depending on the design applications (design), transitions regarding innovation performances of all regions in all time periods are illustrated in Figure A10.

5. Discussion

Markov Chains, which are used to investigate the transitions of the regions from one state to the other in terms of their innovation performances in different time periods in this study, have revealed that there are regional disparities (at NUTS-3 level) (i. between regions located in the east and west of the country, ii. between metropolitan regions and non-metropolitan regions, iii. between high-developed regions and relatively less-developed regions in terms of socio-economic development) in terms of innovation performances in Turkey.
Innovation leaders which take place in all indicators and time periods in terms of applications are Adana, Ankara, Bursa, Eskişehir, İstanbul, İzmir, Kayseri, Kocaeli, Konya and Manisa regions (sorted by the regional plate codes). There is a certain fact for each variable in all time periods that İstanbul takes the lead in the innovation performance.
In contrast, there is not any common modest innovator region for all indicators and time periods since the modest innovator region does not occur in the t − 1 time period. The regions with the lowest innovation performances for all indicators, which located in moderate innovators in t − 1 time period and in modest innovator regions for t and t + 1 time periods, are Ağrı, Artvin, Bingöl, Bitlis, Erzincan, Hakkari, Kars, Muş, Siirt, Tunceli, Bayburt, Bartın, Ardahan, Iğdır and Kilis regions.
There is a spatial segregation/spatial polarization between the west and east of the country (Figure A2, Figure A4, Figure A6, Figure A8 and Figure A10).
Results of the analysis show that metropolitan regions have higher performances in innovation. Although the innovation leaders are generally the same metropolitan regions, there may be some changes in their positions in the system due to different variables.
Innovation performances showed increases both only in metropolitan regions and also in the regions next to them. The fact that the increases in innovation performances are not limited to the metropolitan regions but also in the regions adjacent to them indicates the existence of spatial convergence in terms of innovation.
One of the reasons why many regions have increased their innovation performances in the last two time periods in Markov Chains may be the fact that these regions have at least a university or have increased the number of existing universities with the policy of “at least one university with each region at NUTS-3 level”. With the law no 5467 on 1 March 2006 [110], some amendments were made to The Law on Organization of Higher Education Institutions, Higher Education Law, Public Financial Management and Control Law, Wireless Law 78 and 190 numbered Decree Laws. With this law, “at least one university with each region at NUTS-3 level” policy adopted by the government came into effect and immediately after that many state and mostly foundation universities have been rapidly established since 2006. Thus 41 regions, which did not have a university before 2006, have gained universities in the following years. In total, 15 of these 41 regions gained their first universities in 2006 (Adıyaman, Amasya, Burdur, Çorum, Erzincan, Giresun, Kastamonu, Kırşehir, Ordu, Rize, Tekirdağ, Uşak, Yozgat, Aksaray and Düzce), 17 in 2007 (Ağrı, Artvin, Bilecik, Bingöl, Bitlis, Çankırı, Kırklareli, Mardin, Muş, Nevşehir, Siirt, Sinop, Karaman, Batman, Karabük, Kilis and Osmaniye), and finally, 9 in 2008 (Gümüşhane, Hakkari, Tunceli, Bayburt, Şırnak, Bartın, Ardahan, Iğdır and Yalova). Another reason why the regions have recently increased their innovation performances in the last time period in Markov Chains may be that some regions have gained metropolitan region status with the Law No: 6360 [111]. The regions as Aydın, Balıkesir, Denizli, Hatay, Malatya, Manisa, Kahramanmaraş, Mardin, Muğla, Tekirdağ, Trabzon, Şanlıurfa and Van regions became metropolitan regions in 2012 with the amendments to the Metropolitan Municipality Law no. 5216 on 12 November 2012. This assumption can be supported by the rise of related regions from different groups to an upper group in the last time period in different variables as follows:
-
Patent applications (Şanlıurfa from moderate innovators to strong innovators; Aydın, Hatay, Trabzon from strong innovators to innovation leaders).
-
Utility model applications (Van from modest to moderate innovators; Hatay, Kahramanmaraş, Muğla from strong innovators to innovation leaders).
-
Trademark applications (Kahramanmaraş, Tekirdağ, Trabzon, Şanlıurfa from strong innovators to innovation leaders).
-
Design applications (file) (Balıkesir, Tekirdağ, Trabzon from strong innovators to innovation leaders). This assumption cannot be supported for design applications (file) by Mardin which declined from moderate to modest innovators.
-
Design applications (design) (Balıkesir, Kahramanmaraş from strong innovators to innovation leaders). This assumption cannot be supported for design applications (design) specific to some regions because the innovation performances of some regions that have metropolitan region status have recently decreased such as Malatya and Mardin declined from moderate to modest innovators and Şanlıurfa from strong to moderate innovators.
The increase in innovation performances may sometimes be related to effective collaboration and coordination of local administration, non-governmental organizations (NGOs) and public-private actors of the region. With such a collaborative governance approach, the region can accelerate its innovative performance compared to other regions.
The common features of these high innovation performance regions and low innovation performance regions within themselves are examined as follows:
Regions that are innovation leaders for all time periods of all variables, Adana, Ankara, Bursa, Eskişehir, İstanbul, İzmir, Kayseri, Kocaeli, Konya and Manisa regions, are all metropolitan regions.
Results of the analysis show that metropolitan regions have higher innovation performances. These metropolitan regions are at an advanced level of socio-economic development and center of attraction compared to other regions. In addition to creating innovation activities, these regions have the social and economic strengths to attract investments and specialized high-skilled innovation staff to their regions.
Considering the historical development process, the roles of the regions in the country within the scope of the settlement system and socio-economic development levels were also examined.
In this context, according to State Planning Office (SPO) [112] ‘Regional Distribution Relating to State Aid and Other Supports’ shows that the regions in the first stage and defined as developed regions are İstanbul and Kocaeli provinces, and the areas within the boundaries of metropolitan municipality of Adana, Ankara, Antalya, Bursa and İzmir. There are two different issues in this list: (i) Although Antalya region, which defined as one of the developed regions in 2000, was innovation leader for most variables in the Markov Chains, it does not have this feature for all variables in all time periods in terms of innovation performances. (ii) Another issue is the Eskişehir, Kayseri, Konya and Manisa regions. Even though these regions are defined as normally developing regions in 2000, they are remarkable regions that are the innovation leaders for all variables in Markov Chains in terms of innovation performances.
In the “Research of Socio-Economic Development Ranking of Provinces and Regions (SEGE-2011)” study of the Ministry of Development [113], İstanbul, Ankara, İzmir, Kocaeli, Antalya, Bursa, Eskişehir and Muğla were the regions within the scope of the ‘First Stage Developed Regions’. As it can be seen, while İstanbul, Ankara, İzmir, Kocaeli, Bursa and Eskişehir are innovation leaders in terms of innovation performances, Antalya and Muğla have not been innovation leaders for all time periods of all variables. Remaining innovation leaders for all time periods of all variables as Adana, Kayseri and Konya regions were defined as the ‘Second Stage Developed Regions’ and Manisa region was defined as the “Third Stage Developed Region’ according to that study.
Again, the “Research of Socio-Economic Development Ranking of Provinces and Regions (SEGE-2017)” was carried out by the Ministry of Industry and Technology in 2019 [114]. First Stage Developed Regions consisted of İstanbul, Ankara, İzmir, Kocaeli, Antalya, Bursa, Eskişehir, Muğla ve Tekirdağ regions. As can be figured out, while İstanbul, Ankara, İzmir, Kocaeli Bursa and Eskişehir are innovation leaders in terms of innovation performances. Antalya, Muğla and Tekirdağ regions have not been innovation leaders for all time periods of all variables. Konya, Kayseri and Manisa regions, which were the innovation leaders for all time periods of all variables, were located in the ‘Second Stage Developed Regions’. Although Adana was an innovation leader for all time periods of all variables, this region was identified as the ‘Third Stage Developed Region’ according to the study.
Regions with the lowest innovation performances in all time periods for all variables (as patent, utility model, trademark and design applications), which are Ağrı, Artvin, Bingöl, Bitlis, Erzincan, Hakkari, Kars, Muş, Siirt, Tunceli, Bayburt, Bartın, Ardahan, Iğdır and Kilis regions, have lower socio-economic development levels compared to other regions. According to the SPO [112], Ağrı, Ardahan, Artvin, Bartın, Bayburt, Bingöl, Bitlis, Erzincan, Iğdır, Kars and Kilis regions were the priority regions for development and Hakkari, Siirt, Tunceli and Muş were not only identified as priority regions for development, but also as regions within the scope of state of emergency regions. Similar to this, in the “Research Socio-Economic Development Ranking of Provinces and Regions (SEGE-2011)” study of the Ministry of Development [113], (i) Artvin, Bartın and Erzincan regions were in the Fourth Stage Developed Regions, (ii) Tunceli, Kilis and Bayburt regions were in the Fifth Stage Developed Regions, and finally, Ağrı, Bingöl, Bitlis, Hakkari, Kars, Muş, Siirt, Ardahan and Iğdır regions were in the last group as the Sixth Stage Developed Regions. The study [113] stated that all of the provinces in the 6th group are located in the East and Southeast Anatolia Regions.
According to the “Research of Socio-Economic Development Ranking of Provinces and Regions (SEGE-2017)” [114], ranking was the same as in the previous study as (i) Artvin, Bartın and Erzincan regions were in the ‘Fourth Stage Developed Regions’, (ii) Tunceli, Kilis and Bayburt regions were in the ‘Fifth Stage Developed Regions’, and finally, Ağrı, Bingöl, Bitlis, Hakkari, Kars, Muş, Siirt, Ardahan and Iğdır regions were in the last group as the ‘Sixth Stage Developed Regions’.
This situation shows that innovation performance and socio-economic development may be parallel with some exceptions.
In short, the similar features of these regions are not only having low innovation performances but also being identified as ‘priority regions in development (PRDs)’ or ‘state of emergency regions’ in various national studies in different years.
Although some political decisions had already been taken for the development of these regions, identified as ‘priority regions in development’ or ‘state of emergency regions’, it is figured out from the performance measurements that the efforts to realize this have not been fully rewarded, especially in terms of innovation.
The reason for this can be shown that the investments and incentives made to the regions have not been realized properly for the purpose and on-site use [115] (p. 89), [116] (p. 110). Within the scope of the five-year development plans that started with the planned period in the 1960s, the ‘PRDs’ and incentive applications were carried out in order to resolve the disparities between the regions [117], [118] (p. 282). In this context, development plans include objectives, principles and policies for the development of priority regions in economic, social and cultural aspects and thus reducing the disparities between these regions and other regions over time in terms of development [119] (p. 2). However, academic studies, that analyze policies for the PRDs with various indicators, revealed that there is a problem in the policies implemented [119] (p. 14) and that despite these policies, the desired success cannot be achieved [115] (p. 89), [116] (p. 102) and the desired and expected development rate could not be provided [120] (p. 1). Reasons for the ineffectiveness of policies for the PRDs can be summarized as follows from previous academic studies: indirect and direct resources transferred to regions within the context of the PRDs cannot remain in these provinces [115] (p. 89), [116] (p. 110). It was seen that these resources could not be prevented from going out of the regions within the scope of the PRDs [115] (p. 88) and especially in the planned period, although the public tried to steer the resource allocation directly and indirectly, the factors that shaped the development process were concentrated in the west [116] (p. 102). In addition to the realization of appropriate supports, investments and incentives, the sustainable, effective and correct uses of local resources gain particular importance within the framework of sustainable regional development, since regional innovation systems are based on the localized characteristics of the region.
Moreover, when the establishment years and number of Organized Industrial Zones (OIZs) in overall Turkey are examined, these regions with low innovation performances have few and relatively late established OIZs. This fact may be one of the reasons for them not to be innovative. However, there are some exceptions to this assumption as follows: (i) although there are some regions with OIZs established late and few in number, these regions are not the ones with the lowest innovation performances, (ii) this may not be the case for the most innovative regions, too: although the establishment of the OIZs are old and their number is high, some regions could not be among the most innovative regions even though they were relatively innovative, (iii) although some regions are among the most innovative ones, they do not meet the OIZs criteria. Therefore, the existence and activeness of the OIZs cannot be evaluated as a definitive reason.

6. Conclusions

In order to assess the innovation performances of the regions, this study focused on the intellectual assets with different forms of intellectual property rights which are accepted as the directly effective issues in the measurements of regional innovation performances and analyzed the transitions of the regions (at NUTS-3 level) in Turkey from one state to the other in terms of their innovation performances which previously defined as four different performance levels as innovation leaders, strong innovators, moderate innovators and modest innovators as a result of the four quartiles according to the 2000–2005 (t − 1), 2006–2010 (t) and 2011–2017 (t + 1) time periods.
Regarding the intellectual assets, consisting of the patent, utility model, trademark and design applications, Markov Chains have revealed that there are regional disparities (i. between regions located in the east and west of the country, ii. between metropolitan and non-metropolitan regions, iii. between high-developed and relatively less-developed regions). Results of the study show that metropolitan regions have higher performances. While Adana, Ankara, Bursa, Eskişehir, İstanbul, İzmir, Kayseri, Kocaeli, Konya and Manisa regions are the innovation leaders, Ağrı, Artvin, Bingöl, Bitlis, Erzincan, Hakkari, Kars, Muş, Siirt, Tunceli, Bayburt, Bartın, Ardahan, Iğdır and Kilis are the regions with the lowest innovation performances. In addition to having the lowest innovation performances, these regions are identified by state policies as ‘priority regions in development’ or ‘state of emergency regions’. It is explicitly distinct that İstanbul leads in the innovation performances for each variable in all time periods.
The reasons why many regions have increased their innovation performances in the last two time periods in Markov Chains may be (i) having a university or increase the number of existing universities with the policy of “at least one university with each region at NUTS-3 level”, (ii) gaining a metropolitan region status with the Law No: 6360 [111], (iii) having a governance approach with the effective collaboration and coordination of local administration, NGOs and public-private actors of the region, (iv) having an advanced level of socio-economic development and being center of attraction, and (v) the investments and incentives made to the regions.
In this context, interactions of “all important economic, social, political, organizational, institutional, and other factors etc. [121] (p. 14)”, which are important components of regional innovation systems, gain importance. Therefore, correct and effective political, legal, institutional and financial measures and solutions should be taken in all regions (not only for priority regions, but especially in all regions with the lowest innovation performances). Hence, the interaction and coordination of local actors (firms, universities, public research facilities and technology development zones/centers, etc.) in the regions is a vital importance for this innovation process to be effective.
In addition, there should be no uniform vision, mission, policy and practices in the regions with the lowest innovation performances. It is necessary to implement, monitor and audit unique and place-based innovation policy designs in the region (where local knowledge and dynamics stand out). Furthermore, awareness of innovation culture among local actors needs to be increased. In addition, the investment decisions must be made for the purpose and on-site.
On the other hand, these requirements also apply to the ‘innovation leaders’ regions with high innovation performances. In addition, these ‘innovation leaders’ regions especially need to keep their progressive efforts at the forefront of their priority goals rather than maintaining their status. Because maintaining the status marks the beginning of decline. Only in this way, can they sustain their successes in innovation. Thanks to these resilient structures, they can survive possible effects of unexpected situations arising from both internal and external (national or global) dynamics of the region. A way of ensuring sustainable regional development is to provide a sustainable regional innovation system with the local dynamics and interactions based on (i) the sectoral specializations of production, creativity, entrepreneurship and human capital; (ii) patterns of knowledge/science/technology/skills; and (iii) strong governance mechanisms with collaboration of various actors.
In addition to its strengths, it is obvious that Turkey has some challenges to innovation, as well as strong efforts to overcome them. Turkey will make a substantial progress both in innovation and sustainable development by taking the above-mentioned policies into account not only at the national level, but also at the regional levels.

Author Contributions

Conceptualization, B.S.Ö.; Methodology, B.S.Ö.; Writing—original draft preparation, B.S.Ö.; Writing—review and editing, B.S.Ö. and T.B.; Visualization, B.S.Ö.; Supervision, T.B. All authors have read and agreed to the published version of the manuscript.

Funding

This research received no external funding.

Institutional Review Board Statement

Not applicable.

Informed Consent Statement

Not applicable.

Data Availability Statement

Not applicable.

Conflicts of Interest

The authors declare no conflict of interest.

Appendix A

Figure A1. Assessment of regions: Patent Applications. Legend: Upgraded regions increasing their innovation performances (are shown underlined). Stable regions remained their status (shown as normal text). Retrograded regions decreasing their innovation performances (shown in italics).
Sustainability 14 10035 g0a1
Figure A2. Regional maps of ‘patent applications’.
Sustainability 14 10035 g0a2
Figure A3. Assessment of regions: Utility Model Applications. Legend: Upgraded regions increasing their innovation performances (are shown underlined). Stable regions remained their status (shown as normal text). Retrograded regions decreasing their innovation performances (shown in italics).
Sustainability 14 10035 g0a3
Figure A4. Regional maps of ‘utility model applications’.
Sustainability 14 10035 g0a4
Figure A5. Assessment of regions: Trademark Applications. Legend: Upgraded regions increasing their innovation performances (shown as underlined). Stable regions remained their status (shown as normal text). Retrograded regions decreasing their innovation performances (shown in italics).
Sustainability 14 10035 g0a5
Figure A6. Regional maps of ‘trademark applications’.
Sustainability 14 10035 g0a6
Figure A7. Assessment of regions: Design Applications (Number of Files). Legend: Upgraded regions increasing their innovation performances (shown as underlined). Stable regions remained their status (shown as normal text). Retrograded regions decreasing their innovation performances (shown in italics).
Sustainability 14 10035 g0a7
Figure A8. Regional maps of ‘design applications (number of files)’.
Sustainability 14 10035 g0a8
Figure A9. Assessment of regions: Design Applications (Number of Designs). Legend: Upgraded regions increasing their innovation performances (are shown underlined). Stable regions remained their status (shown as normal text). Retrograded regions decreasing their innovation performances (shown in italics).
Sustainability 14 10035 g0a9
Figure A10. Regional maps of ‘design applications (number of designs)’.
Sustainability 14 10035 g0a10

References

  1. Özen, B.S.; Baycan, T. A Comparison of Innovation Strategies of Regional Development Agencies in Turkey. Econ. Soc. Chang. Facts Trends Forecast. 2022, 15, 236–258. [Google Scholar] [CrossRef]
  2. Özen, B.S.; Baycan, T. An Assessment of Turkish Regional Innovation System over Regional Innovation Strategies Developed by Regional Development Agencies. In Proceedings of the 55th Congress of European Regional Science Association (ERSA) World Renaissance: Changing Roles for People and Places, Lisbon, Portugal, 25–29 August 2015. [Google Scholar]
  3. Edquist, C. Identification of Policy Problems in Systems of Innovation through Diagnostic Analysis. In Proceedings of the Prime-Latin America Conference, Mexico City, Mexico, 24–26 September 2008; Available online: https://smartech.gatech.edu/bitstream/handle/1853/36896/Charles_%20Edquist_Identification%20_of_%20Policy_Problems.pdf?sequence=1 (accessed on 5 January 2014).
  4. European Commission; Directorate-General for Enterprise and Industry. Regional Innovation Scoreboard 2014; European Commission: Brussels, Belgium, 2014; Available online: https://data.europa.eu/doi/10.2769/88893 (accessed on 7 February 2015).
  5. Schrempf, B.; Kaplan, D.; Schroeder, D. National, Regional, and Sectoral Systems of Innovation-An Overview. Report for FP7 Project “Progress”. 2013. Available online: progressproject.eu (accessed on 20 June 2016).
  6. OECD. Regions and Innovation Policy; OECD Reviews of Regional Innovation; OECD Publishing: Paris, France, 2011; p. 315. ISBN 9789264097384. [Google Scholar] [CrossRef]
  7. IRE Working Group. Effective Regional Innovation Systems; ERIS Working Group Final Report; Innovating Regions in Europe (IRE) Secretariat: Brussels, Belgium, 2008. [Google Scholar]
  8. OECD. Managing National Innovation Systems; OECD Publishing: Paris, France, 1999; p. 112. ISBN 9264189416. [Google Scholar] [CrossRef]
  9. Aiginger, K.; Okko, P.; Ylä-Anttila, P. Globalization and Business—Innovation in a Borderless World Economy. In Evaluation of the Finnish National Innovation System—Full Report; Veugelers, R., Ed.; Taloustieto Oy, (on behalf of the Ministry of Education and the Ministry of Employment and the Economy), Helsinki University Print: Helsinki, Finland, 2009; Chapter 4; pp. 103–146. [Google Scholar]
  10. Aubert, J.-E. Promoting Innovation in Developing Countries: A Conceptual Framework; World Bank Policy Research Working Paper No. 3554; World Bank: Washington, DC, USA, 2005. [Google Scholar]
  11. Fu, X.; Zanello, G.; Essegbey, G.O.; Hou, J.; Mohnen, P. Innovation in Low Income Countries: A Survey Report; The DFID-ESRC Growth Research Programme (DEGRP); OMDC: Oxford, UK, 2014. [Google Scholar]
  12. Fagerberg, J.; Verspagen, B. Innovation, growth and economic development: Have the conditions for catch-up changed? Int. J. Technol. Learn. Innov. Dev. 2007, 1, 13–33. [Google Scholar] [CrossRef]
  13. Fagerberg, J.; Godinho, M.M. Innovation and catching-up. In The Oxford Handbook of Innovation, 4th ed.; Fagerberg, J., Mowery, D.C., Nelson, R., Eds.; Oxford University Press: Oxford, UK, 2004; Chapter 20. [Google Scholar] [CrossRef]
  14. Freeman, C.; Louça, F. As Time Goes by: The Information Revolution and the Industrial Revolutions in Historical Perspective; Oxford University Press, Inc.: Oxford, UK, 2001; 407p, ISBN 019-9241074. [Google Scholar]
  15. Hu, A.; Yan, Y.; Tang, X. Innovative development. In Xi Jinping’s New Development Philosophy; Hu, A., Yan, Y., Tang, X., Eds.; Springer: Singapore, 2018; pp. 15–35. [Google Scholar] [CrossRef]
  16. Jauhiainen, J.S.; Hooli, L. Indigenous Knowledge and Developing Countries’ Innovation Systems: The Case of Namibia. IJIS 2017, 1, 89–106. [Google Scholar] [CrossRef]
  17. Gu, S. Implications of National Innovation Systems for Developing Countries-Managing Change and Complexity in Economic Development; UNU/INTECH Discussion Papers; Intech: Maastricht, The Netherlands, 1999; ISSN 1564-8370. [Google Scholar]
  18. Segura-Bonilla, O.; Johnson, B. Innovation Systems and Developing Countries: Experiences from the SUDESCA Project; Danish Research Unit for Industrial Dynamics: Aalborg Denmark, 2001. [Google Scholar]
  19. Arocena, R.; Sutz, J. Innovation Systems and Developing Countries; DRUID (Danish Research Unit for Industrial Dynamics) Working Paper; DRUID: Aalborg Denmark, 2002; Volume 2. [Google Scholar]
  20. Metcalfe, S.; Ramlogan, R. Innovation systems and the competitive process in developing economies. Q. Rev. Econ. Financ. 2008, 48, 433–446. [Google Scholar] [CrossRef]
  21. Kayal, A.A. National innovation systems a proposed framework for developing countries. Int. J. Entrep. Innov. Manag. 2008, 8, 74–86. [Google Scholar] [CrossRef]
  22. Altenburg, T. Building inclusive innovation systems in developing countries: Challenges for IS research. In Handbook of Innovation Systems and Developing Countries; Lundvall, B.Å., Joseph, K.J., Chaminade, C., Vang, J., Eds.; Edward Elgar Publishing: Cheltenham, UK; Northampton, MA, USA, 2009; Chapter 2; pp. 33–56. [Google Scholar] [CrossRef]
  23. Lundvall, B.Å.; Joseph, K.J.; Chaminade, C.; Vang, J. Handbook of Innovation Systems and Developing Countries: Building Domestic Capabilities in a Global Setting; Edward Elgar Publishing: Cheltenham, UK; Northampton, MA, USA, 2011. [Google Scholar]
  24. Watkins, A.; Papaioannou, T.; Mugwagwa, J.; Kale, D. National innovation systems and the intermediary role of industry associations in building institutional capacities for innovation in developing countries: A critical review of the literature. Res. Policy 2015, 44, 1407–1418. [Google Scholar] [CrossRef]
  25. Egbetokun, A.; Oluwadare, A.J.; Ajao, B.F.; Jegede, O.O. Innovation systems research: An agenda for developing countries. J. Open Innov. Technol. Mark. Complex. 2017, 3, 25. [Google Scholar] [CrossRef]
  26. Fu, X.; Shi, L. Direction of Innovation in Developing Countries and Its Driving Forces; Economic Research Working Paper No. 69; World Intellectual Property Organization (WIPO): Geneva, Switzerland, 2022. [Google Scholar]
  27. Intanakumnerd, P.; Chairatana, P.; Tangchitpiboon, T. National innovation system in less successful developing countries: The case of Thailand. Res. Policy 2002, 31, 1445–1457. [Google Scholar] [CrossRef]
  28. Arocena, R.; Sutz, J. Knowledge, innovation and learning: Systems and policies in the North and in the South. In Systems of Innovation and Development: Evidence from Brazil; Cassiolato, J.E., Lastres, H., Maciel, M., Eds.; Edward Elgar: New York, NY, USA, 2003; Chapter 11; pp. 291–310. [Google Scholar] [CrossRef]
  29. Bartels, F.; Koria, R. Mapping, measuring and managing African national systems of innovation for policy and development: The case of the Ghana national system of innovation. Afr. J. Sci. Technol. Innov. Dev. 2014, 6, 383–400. [Google Scholar] [CrossRef]
  30. Yun, J.; Won, D.; Hwang, B.; Kang, J.; Kim, D. Analysing and simulating the effects of open innovation policies: Application of the results to Cambodia. Sci. Public Policy 2015, 42, 743–760. [Google Scholar] [CrossRef]
  31. Taşkın, F.; Zaim, O. Catching-up and innovation in high- and low-income countries. Econ. Lett. 1997, 54, 93–100. [Google Scholar] [CrossRef]
  32. Soo, K.T. Country Size and Trade in Intermediate and Final Goods. World Econ. 2018, 41, 634–652. [Google Scholar] [CrossRef]
  33. Nelson, R.R. National Innovation Systems: A Comparative Analysis; Oxford University Press: Oxford, UK; New York, NY, USA, 1993. [Google Scholar]
  34. Freeman, C. The ‘National System of Innovation’ in historical perspective. Camb. J. Econ. 1995, 19, 5–24. [Google Scholar]
  35. Mjøset, L. The Irish Economy in a Comparative Institutional Perspective; NESC Reports No. 93; The National Economic and Social Council: Dublin, Ireland, 1992. [Google Scholar]
  36. Edquist, C.; Lundvall, B.A. Comparing the Danish and Swedish systems of innovation. In National Innovation Systems: A Comparative Analysis; Nelson, R.R., Ed.; Oxford University Press: Oxford, UK; New York, NY, USA, 1993; pp. 265–298. [Google Scholar]
  37. Kaiser, R.; Prange, H. The reconfiguration of National Innovation Systems—The example of German biotechnology. Res. Policy 2004, 33, 395–408. [Google Scholar] [CrossRef]
  38. Lundvall, B.-Å. Introduction. In National Systems of Innovation. Towards a Theory of Innovation and Interactive Learning; Lundvall, B.-Å., Ed.; Pinter: London, UK, 1992; pp. 1–19. [Google Scholar]
  39. World Commission on Environment and Development (WCED). Our Common Future; Oxford University Press: Oxford, UK; New York, NY, USA, 1987. [Google Scholar]
  40. United Nations. Available online: https://sdgs.un.org/goals (accessed on 9 July 2022).
  41. Despotovic, D.Z.; Cvetanović, S.; Nedic, V. Analysis of innovativeness, as a determinant of competitiveness of the selected European countries. Industrija 2016, 44, 89–111. [Google Scholar] [CrossRef]
  42. Szopik-Depczyńska, K.; Kędzierska-Szczepaniak, A.; Szczepaniak, K.; Cheba, K.; Gajda, W.; Ioppolo, G. Innovation in sustainable development: An investigation of the EU context using 2030 agenda indicators. Land Use Policy 2018, 79, 251–262. [Google Scholar] [CrossRef]
  43. United Nations Development Programme. Available online: https://www.undp.org/sustainable-development-goals (accessed on 9 July 2022).
  44. Foray, D.; Phelps, E. The Challenge of Innovation in Turbulent Times: A Report Submitted to the Global Agenda Council; Working Paper No. 56; Columbia University, Center on Capitalism and Society: New York, NY, USA, 2010. [Google Scholar]
  45. Gerstlberger, W. Regional innovation systems and sustainability—Selected examples of international discussion. Technovation 2004, 24, 749–758. [Google Scholar] [CrossRef]
  46. Ionescu, G.H.; Firoiu, D.; Pîrvu, R.; Enescu, M.; Rădoi, M.I.; Cojocaru, T.M. The potential for innovation and entrepreneurship in EU countries in the context of sustainable development. Sustainability 2020, 12, 7250. [Google Scholar] [CrossRef]
  47. Johnson, B. Systems of innovation, the urban order and sustainable development. Waste Manag. Res. 2007, 25, 208–213. [Google Scholar] [CrossRef]
  48. Makhosheva, S.A.; Rud, N.Y.; Kandrokova, M.M.; Israilov, M.V.; Shinahova, F.B. The paradigm of sustainable development and innovation in the region. Rev. Espac. 2018, 39, 28. [Google Scholar]
  49. Scheel, C.; Vazquez, M. The role of innovation and technology in industrial ecology systems for the sustainable development of emerging regions. J. Sustain. Dev. 2011, 4, 197. [Google Scholar] [CrossRef]
  50. Gao, X.; Zhai, K. Performance evaluation on intellectual property rights policy system of the renewable energy in China. Sustainability 2018, 10, 2097. [Google Scholar] [CrossRef]
  51. Edquist, C. Systems of innovation—Perspectives and challenges. In The Oxford Handbook of Innovation; Fagerberg, J., Mowery, D.C., Nelson, R.R., Eds.; Oxford University Press: Oxford, UK; New York, NY, USA, 2005; Chapter 7; pp. 181–208. [Google Scholar]
  52. Asheim, B.; Bugge, M.; Coenen, L.; Herstad, S. What Does Evolutionary Economic Geography Bring to the Table? Reconceptualising Regional Innovation Systems; CIRCLE Working Paper No. 2013/05; Centre for Innovation Research, Lund University: Lund, Sweden, 2013. [Google Scholar]
  53. OECD. Available online: http://www.oecd.org/regional/regionalinnovation.htm (accessed on 15 January 2017).
  54. Cooke, P.; Boekholt, P.; Tödtling, F. The Governance of Innovation in Europe; Pinter: London, UK, 2000. [Google Scholar]
  55. Cook, P.; Memedovic, O. Strategies for Regional Innovation Systems: Learning Transfer and Applications; Policy Papers; UNIDO: Vienna, Austria, 2003. [Google Scholar]
  56. Cooke, P.; Gomez Uranga, M.; Etxebarria, G. Regional Innovation Systems: Institutional and Organisational Dimensions. Res. Policy 1997, 26, 475–491. [Google Scholar] [CrossRef]
  57. Cooke, P.; Heidenreich, M.; Braczyk, H.J. Regional Innovation Systems, 2nd ed.; Routledge: London, UK, 2004. [Google Scholar]
  58. Doloreux, D. ‘Regional Innovation Systems in Canada: A Comparative Study’. Reg. Stud. 2004, 38, 479–492. [Google Scholar] [CrossRef]
  59. Asheim, B.; Gertler, M.S. The geography of innovation. Regional innovation systems. In The Oxford Handbook of Innovation; Fagerberg, J., Mowery, D.C., Nelson, R.R., Eds.; Oxford University Press: Oxford, UK; New York, NY, USA, 2005; Chapter 11; pp. 291–317. [Google Scholar]
  60. Asheim, B.; Coenen, L. Contextualising Regional Innovation Systems in a Globalising Learning Economy: On Knowledge Bases and Institutional Frameworks. J. Technol. Transf. 2006, 31, 163–173. [Google Scholar] [CrossRef]
  61. Asheim, B. Guest editorial: Introduction to the creative class in European city regions. Econ. Geogr. 2009, 85, 355–362. [Google Scholar] [CrossRef]
  62. European Commission; Directorate-General for Internal Market, Industry, Entrepreneurship and SMEs. European Innovation Scoreboard 2016; European Commission: Brussels, Belgium, 2017; Available online: https://data.europa.eu/doi/10.2873/84537 (accessed on 10 July 2017).
  63. European Commission; Directorate-General for Internal Market, Industry, Entrepreneurship and SMEs. European Innovation Scoreboard 2021; European Commission: Brussels, Belgium, 2021; Available online: https://data.europa.eu/doi/10.2873/725879 (accessed on 12 June 2022).
  64. Baycan, T.; Özen, B.S. The effects of the global economic crisis on the innovation performance of EU countries. In Resilience, Crisis and Innovation Dynamics; Baycan, T., Pinto, H., Eds.; Edward Elgar Publishing: Cheltenham, UK; Northampton, MA, USA, 2018; Chapter 2; pp. 17–46. [Google Scholar]
  65. European Commission; Directorate-General for Internal Market, Industry, Entrepreneurship and SMEs. European Innovation Scoreboard 2018; European Commission: Brussels, Belgium, 2018; Available online: https://data.europa.eu/doi/10.2873/66501 (accessed on 25 February 2019).
  66. Duman, E. Bölgesel Inovasyon ve Iktisadi Büyüme: Düzey 1 Kapsamındaki Bölgelerin Normalizasyon Yöntemiyle Analizi (Regional Innovation and Economic Growth: Level 1 Regions with the Normalization Analysis). Ph.D. Thesis, Selçuk University, Konya, Turkey, 2017. (In Turkish). [Google Scholar]
  67. Gömleksiz, M. Bölgesel Inovasyon Sistemleri ve Türkiye: İstatistiki Bölge Birimleri Sınıflandırması Düzey 2 Bölgeleri Inovasyon Indeksi (Regional Innovation Systems and Turkey: Nuts 2 Level Regional Innovation Index). Master’s Thesis, Selçuk University, Konya, Turkey, 2012. (In Turkish). [Google Scholar]
  68. Mercan, B.; Gömleksiz, M. Bölgesel kalkinmada inovasyon sistemleri yaklaşimi: KOP bölgesi üzerine bir inceleme. In Proceedings of the I. KOP Bölgesel Kalkınma Sempozyumu, Konya, Türkiye, 14–16 November 2013. (In Turkish). [Google Scholar]
  69. Kutgi, D.; Işık Maden, S. Türkiye’de Düzey 2 Bölgelerinin Yenilikçilik Performansının Ölçümü Üzerine Ampirik Bir Analiz. Girişimcilik İnovasyon Yönetimi Derg. 2020, 9, 25–48. (In Turkish) [Google Scholar]
  70. Varış, S.C. Determinants of Regional Innovation in Turkish NUTS 3 Regions from the Spatial Dependence Perspective. Ph.D. Thesis, Middle East Technical University, Ankara, Turkey, 2021. [Google Scholar]
  71. Lenger, A. Regional Innovation Systems and the Role of State: Institutional Design and State Universities in Turkey. Eur. Plan. Stud. 2008, 16, 1101–1120. [Google Scholar] [CrossRef]
  72. Karaçor, Z.; Duman, E. Analysis of the regional innovation performance by using normalization method: TR1 (İstanbul) example. PressAcademia Procedia 2017, 4, 409–417. [Google Scholar] [CrossRef]
  73. Duman, E.; Karaçor, Z. Examination of the regional innovation capacity by using normalization method: Eastern marmara of the regional (TR4) example. In Economics, Management, & Econometrics; Çilingirtürk, A.M., Albrychiewicz-Słocińska, A., Bali, B.B., Eds.; IJOPEC Publication Limited: London, UK, 2017; Chapter 9; pp. 169–183. ISBN 978-1-9997035-8-5. [Google Scholar]
  74. Akşık, E.S. Toplam Kalite Yönetimi Açısından Bölgesel Inovasyon Faktörlerinin Incelenmesi ve Etkileşimlerinin Dematel Yöntemi ile Analizi: İzmir ve Yakın Çevresi Için bir Araştırma (Examination of Regional Innovation Factors in Terms of Total Quality Management and Their Interaction Analysis with Dematel Method: A Research for İzmir and Its Surrounding Area). Master’s Thesis, Dokuz Eylül University, İzmir, Turkey, 2019. (In Turkish). [Google Scholar]
  75. Şahin, M.T.; Altuğ, F. Türkiye’de Yenilik Faaliyetlerinde Yenilikçi Uzmanlaşma Eğilimleri: İstanbul, Ankara ve İzmir Bölgeleri İmalat Sanayi Patent Göstergeleri. Coğrafi Bilimler Derg. 2017, 15, 157–166. (In Turkish) [Google Scholar]
  76. Özen, B.S.; Baycan, T.; Filiztekin, A. Türkiye’de bölgesel inovasyon performanslarinin 2000 yilindan günümüze değişimi. In Bölgesel Kalkınma ve Bölge Bilimi Üzerine Yazılar; Karagül, M., Kaya, L.G., Sungur, O., Eds.; Nobel Akademik Yayıncılık: İstanbul, Turkey, 2018; pp. 71–92. ISBN 978-605-320-880-8. (In Turkish) [Google Scholar]
  77. Kutvonen, A. Ranking Regional Innovation Policies: DEA-Based Benchmarking in a European Setting; Department of Industrial Management, Faculty of Technology Management, Lappeenranta University of Technology: Lappeenranta, Finland, 2007. [Google Scholar]
  78. Fu, X. Foreign Direct Investment, Absorptive Capacity and Regional Innovation Capabilities: Evidence from China. Oxf. Dev. Stud. 2008, 36, 89–110. [Google Scholar] [CrossRef]
  79. Bosco, M.G.; Brugnoli, A. Regional efficiency, innovation and productivity. In Proceedings of the RSA Conference, Pecs., San Francisco, CA, USA, 1–5 March 2010. [Google Scholar]
  80. Roman, M. Regional Efficiency of Knowledge Economy in the New EU Countries: The Romanian and Bulgarian case. Rom. J. Reg. Sci. J. Rom. Reg. Sci. Assoc. 2010, 4, 33–53. Available online: http://www.rrsa.ro/rjrs/V413.ROMANMO.PDF (accessed on 10 July 2017).
  81. Foddi, M.; Usai, S. Technological Catching Up among European Regions. Lessons from Data Envelopment Analysis. WP4/02 Search Working Paper. 2013. Available online: http://www.ub.edu/searchproject/wp-content/uploads/2013/01/WP-4.2.pdf (accessed on 10 July 2017).
  82. Dzemydaitė, G.; Dzemyda, I.; Galinienė, B. The Efficiency of Regional Innovation Systems in New Member States of the European Union: A Nonparametric DEA Approach. Econ. Bus. 2016, 28, 83–89. [Google Scholar] [CrossRef]
  83. Dzemydaitė, G.; Galinienė, B. Evaluation of Regional Efficiency Disparities by Efficient Frontier Analysis. Ekonomika 2013, 92, 21–36. [Google Scholar] [CrossRef]
  84. Li, X. China’s Regional Innovation Capacity in Transition: An Empirical Approach. Res. Policy 2009, 38, 338–357. [Google Scholar] [CrossRef]
  85. Cincera, M.; Czarnitzki, D.; Thorwarth, S. Efficiency of Public Spending in Support of R&D Activities; European Economy. Economic Papers 376; European Commission, Directorate-General for Economic and Financial Affairs: Brussels, Belgium, 2009; pp. 1–111. [Google Scholar] [CrossRef]
  86. Zabala Iturriagagoitia, J.M. Benchmarking Regional Innovation Systems: The Relevance of Efficiency to Their Performance. Ph.D. Thesis, Universitat Politècnica de València, Valencia, Spain, 2008. [Google Scholar]
  87. Zilang, H.; Yaming, Z.; Zhuo, L. The Comparative Study on Bohai Rim Regional Technology Innovation Ability. International Conference on Medical Physics and Biomedical Engineering. Phys. Procedia 2012, 33, 294–300. [Google Scholar] [CrossRef]
  88. Mukundan, R. Product and Process Innovation: Antecedents and Performance Outcomes in Small IT Firms in India. Ph.D. Thesis, Cochin University of Science and Technology, Kochi, Japan, 2015. Available online: http://dyuthi.cusat.ac.in/purl/5060 (accessed on 12 June 2022).
  89. Hájková, V.; Hájek, P. Typology of Regional Innovation Systems in Europe—A Neural Network Approach. Int. J. Math. Models Methods Appl. Sci. 2011, 5, 463–471. [Google Scholar]
  90. Yang, C.; Zhao, Z.; Zhang, Z. Empirical study of regional innovation capability and economic convergence in China. In China’s New Sources of Economic Growth: Volume 2. Human Capital, Innovation and Technological Change; Song, L., Garnaut, R., Fang, C., Johnston, L., Eds.; ANU Press, The Australian National University: Canberra, Australia, 2017; Chapter 10; pp. 229–243. [Google Scholar] [CrossRef]
  91. Purchase, S.; Olaru, D.; Denize, S. Innovation Network Trajectories and Changes in Resource Bundles. Ind. Mark. Manag. 2014, 43, 448–459. [Google Scholar] [CrossRef]
  92. Todo, Y.; Matous, P.; Inoue, H. The Strength of Long Ties and the Weakness of Strong Ties: Knowledge Diffusion through Supply Chain Networks. Res. Policy 2016, 45, 1890–1906. [Google Scholar] [CrossRef]
  93. Uğur, M.; Trushin, E.; Solomon, E.; Guidi, F. R&D and Productivity in OECD Firms and Industries: A Hierarchical Meta-Regression Analysis. Res. Policy 2016, 45, 2069–2086. [Google Scholar]
  94. European Commission; Directorate-General for Internal Market, Industry, Entrepreneurship and SMEs. Regional Innovation Scoreboard 2017; European Commission: Brussels, Belgium, 2017; Available online: https://data.europa.eu/doi/10.2873/469382 (accessed on 3 October 2018).
  95. The University of Tennessee. Available online: http://web.eecs.utk.edu/~cphillip/cs594_spring2016/Markov%20Chains.pdf (accessed on 20 December 2016).
  96. Levin, R.I.; Kirkpatrick, C.A. Quantitative Approaches to Management, 3rd ed.; McGraw-Hill: New York, NY, USA, 1975; pp. 436–459. [Google Scholar]
  97. Adamu, G.S.; Danbaba, A. Markov Chain Model for the Dynamics of Cooking Fuel Usage: Transition Matrix Estimation and Forecasting. Int. J. Phys. Sci. 2014, 9, 255–260. [Google Scholar] [CrossRef]
  98. Bell, E.J. Markov Analysis of Land Use Change—An Application of Stochastic Processes to Remotely Sensed Data. Socio-Econ. Plan. Sci. 1974, 8, 311–316. [Google Scholar] [CrossRef]
  99. Bell, E.J.; Hinojosa, R.C. Markov Analysis of Land Use Change: Continuous Time and Stationary Processes. Socio-Econ. Plan. Sci. 1977, 11, 13–17. [Google Scholar] [CrossRef]
  100. Muller, M.R.; Middleton, J. A Markov Model of Land-Use Change Dynamics in the Niagara Region, Ontario, Canada. Landsc. Ecol. 1994, 9, 151–157. [Google Scholar]
  101. Ayila, A.E.; Oluseyi, F.O.; Anas, B.Y. Statistical Analysis of Urban Growth in Kano Metropolis, Nigeria. Int. J. Environ. Monit. Anal. 2014, 2, 50–56. [Google Scholar] [CrossRef]
  102. Owoeye, J.O.; Popoola, O. Predicting Urban Sprawl and Land Use Changes in Akure Region Using Markov Chains Modeling. J. Geogr. Reg. Plan. 2017, 10, 197–207. [Google Scholar] [CrossRef]
  103. Joseph, G. A Markov Analysis of Age/Sex Differences in Interregional Migration in Britain. Reg. Stud. 1974, 9, 69–78. [Google Scholar] [CrossRef]
  104. Gambrah, P.P.; Adzadu, Y. Using Markov Chain to Predict the Probability of Rural and Urban Child Mortality Rates Reduction in Ghana. Int. J. Sci. Technol. Res. 2013, 2, 73–78. [Google Scholar]
  105. The Official Gazette of Turkey. ‘Law on the Establishment, Coordination and Duties of Development Agencies’ 2006. Law No: 5449, Date of Approval: 25 January 2006. Date of Publication on the National Gazette: 8 February 2006 No: 26074, Publication Code: 5, Volume: 45. 2006. Available online: http://www.mevzuat.gov.tr/MevzuatMetin/1.5.5449.pdf (accessed on 20 May 2015). (In Turkish)
  106. The Official Gazette of Turkey. ‘Decree on the Organization and Duties of the Ministry of Science, Industry and Technology’, 2011. Date of Decree Law: 3 June 2011 No: 635, Date of Authorization Law: 6 April 2011 No: 6223, Date of Publication on the National Gazette: 8 June 2011 No: 27958, Publication Code: 5, Volume: 50. 2011. Available online: http://www.mevzuat.gov.tr/MevzuatMetin/4.5.635.pdf (accessed on 20 May 2015). (In Turkish)
  107. European Commission. Available online: https://ec.europa.eu/info/research-and-innovation/statistics/performance-indicators/european-innovation-scoreboard_en (accessed on 14 March 2022).
  108. Shorrocks, A.F. The Measurement of Mobility. Econometrica 1978, 46, 1013–1024. [Google Scholar] [CrossRef]
  109. The Official Gazette of Turkey. ‘Metropolitan Municipality Law’ 2004., Law No: 5216, Date of Approval: 10 July 2004., Date of Publication on the National Gazette: 23 July 2004 No: 25531, Publication Code: 5, Volume: 43. 2004. Available online: http://www.mevzuat.gov.tr/MevzuatMetin/1.5.5216.pdf (accessed on 12 August 2017). (In Turkish)
  110. The Official Gazette of Turkey. ‘The Law on Amendments on Law on Organization of Higher Education Institutions, Higher Education Law, Public Financial Management And Control Law, Wireless Law 78 and 190 numbered Decree Laws’ 2006. Law no: 5467, Date of Approval: 1 March 2006., Date of Publication on the National Gazette: 17 March 2006. No: 26111. 2006. Available online: https://www.resmigazete.gov.tr/eskiler/2006/03/20060317-1.htm (accessed on 12 August 2017). (In Turkish)
  111. The Official Gazette of Turkey. ‘The Law on the Establishment of Metropolitan Municipalities and Twenty-Six Districts in Thirteen Provinces and Amendments on Some Laws and Decree Laws’ 2012., Law No: 6360, Date of Approval: 12 November 2012, Date of Publication on the National Gazette: 6 December 2012 No: 28489. 2012. Available online: https://www.resmigazete.gov.tr/eskiler/2012/12/20121206-1.htm (accessed on 12 August 2017). (In Turkish)
  112. State Planning Office (SPO). ‘8. Beş Yıllık Kalkınma Planı, Bölgesel Gelişme Özel İhtisas Komisyonu Raporu’, (DPT: 2502—ÖİK: 523); State Planning Office (SPO): Ankara, Turkey, 2000. (In Turkish) [Google Scholar]
  113. Ministry of Development. ‘İllerin Ve Bölgelerin, Sosyo-Ekonomik Gelişmişlik Sıralaması Araştırması (SEGE-2011)’; Bölgesel Gelişme ve Yapısal Uyum Genel Müdürlüğü: Ankara, Turkey, 2013. (In Turkish) [Google Scholar]
  114. Ministry of Industry and Technology. ‘İllerin ve Bölgelerin Sosyo-Ekonomik Gelişmişlik Sıralaması Araştırması SEGE-2017′, Kalkınma Ajansları Genel Müdürlüğü Yayını Sayı: 3, Araştırma Raporu Sayı: 3; Ministry of Industry and Technology: Ankara, Turkey, 2019; ISBN 978-605-7679-02-4. (In Turkish)
  115. Sarı, R.; Güven, A. Kalkınmada öncelikli yöreler uygulamasının iller arası gelir dağılımı üzerindeki etkisi. ODTÜ Gelişme Derg. 2007, 34, 77–96. (In Turkish) [Google Scholar]
  116. Çakır Sümer, G.; Özcan, A. Türkiye’de Kalkınmada Öncelikli Yöreler Politikası ve Kentleşme Üzerine Etkileri. In Proceedings of the Uluslararası Bölgesel Kalkınma Konferansı, Malatya, Turkey, 22–23 September 2011; pp. 101–110. (In Turkish). [Google Scholar]
  117. Oskay, C.S.; Kubar, Y. Avrupa Birliği’ne Uyum Sürecinde Türkiye’de Bölgesel Kalkınmanın Finansmanında Kalkınma Ajansları. Selçuk Üniversitesi Karaman İİbf Derg. 2007, 14, 204–214. (In Turkish) [Google Scholar]
  118. Keskin, H.; Sungur, O. Bölgesel Politika Ekseninde Yaşanan Dönüşüm: Türkiye’de Kalkınma Planlarında Bölgesel Politikaların Değişimi. SDÜ Fen Edeb. Fakültesi Sos. Bilimler Derg. 2010, 21, 271–293. (In Turkish) [Google Scholar]
  119. Düzakın, E.; (Kıran) Bulğurcu, B. Kalkınmada Öncelikli İllerin Ekonomik Etkinliklerinin Değerlendirilmesi. Çukurova Üniversitesi İİbf Derg. 2010, 14, 1–18. (In Turkish) [Google Scholar]
  120. Arslan, K. Bölgesel Kalkınma Farklılıklarının Giderilmesinde Etkin Bir Araç: Bölgesel Planlama Ve Bölgesel Kalkınma Ajansları. İstanbul Ticaret Üniversitesi Sos. Bilimler Derg. 2005, 1, 275–294. (In Turkish) [Google Scholar]
  121. Edquist, C. Systems of innovation approaches—Their emergence and characteristics. In Systems of Innovation: Technologies, Organizations and Institution; Edquist, C., Ed.; Pinter: London, UK, 1997; pp. 1–35. [Google Scholar]
Figure 1. Research design of the study.
Sustainability 14 10035 g001
Table 1. Methodology and Data.
MethodologyDataSourceValuesTime PeriodsInnovation
Performance Groups
Markov Chains- Patent Applications
- Utility Model
Applications
- Trademark
Applications
- Design
Applications
(both file and
designs)
Turkish
Patent and
Trademark
Office
Distance from the mean values to the
median
2000–2005 (t − 1),
2006–2010 (t)
and
2011–2017 (t + 1)
- The upper group as
innovation leaders,
- The upper-middle group
as strong innovators,
- The lower-middle group
as moderate innovators
and
- The lower group as
modest innovators.
Publisher’s Note: MDPI stays neutral with regard to jurisdictional claims in published maps and institutional affiliations.

