Article

An AI-Based Automatic Risks Detection Solution for Plant Owner’s Technical Requirements in Equipment Purchase Order

1
Graduate Institute of Ferrous and Energy Materials Technology, Pohang University of Science and Technology (POSTECH), Pohang 37673, Korea
2
Plate Rolling Maintenance Section, Plate Rolling Department, Pohang Iron and Steel Company (POSCO), Pohang 37754, Korea
3
Department of Industrial and Management Engineering, Pohang University of Science and Technology (POSTECH), Pohang 37673, Korea
*
Author to whom correspondence should be addressed.
Sustainability 2022, 14(16), 10010; https://doi.org/10.3390/su141610010
Submission received: 24 June 2022 / Revised: 9 August 2022 / Accepted: 10 August 2022 / Published: 12 August 2022
(This article belongs to the Special Issue Digital Transformation Applications in Construction and Engineering)

Abstract

:
Maintenance activities to replace, repair, and revamp equipment in the industrial plant sector are gradually needed for sustainability during the plant’s life cycle. In order to carry out these revamping activities, the plant owners exchange many purchase orders (POs) with equipment suppliers, including technical and specification documents and commercial procurement content. As POs are written in various formats with large volumes and complexities, it is often time-consuming for the owner’s engineer to review them and it may lead to errors and omissions. This study proposed the purchase order recognition and analysis system (PORAS), which automatically detects and compares risk clauses between plant owners’ and suppliers’ POs by utilizing artificial intelligence (AI). The PORAS is a comprehensive framework consisting of two independent modules and four model components that accurately reflect on the added value of the PORAS. The table recognition and comparison (TRC) module is utilized for risk clauses in POs written in tables with its two components, the table comparison (TRC-C) and table recognition (TRC-R) models. The critical terms in general conditions (CTGC) module analyzes the patterns of risk clauses in general texts, then extracts them with a rule-based algorithm and compares them through entity matching. In the TRC-C model using machine learning (Ditto model), a few errors occurred due to insufficient training data, resulting in an accuracy of 87.8%, whereas in the TRC-R model, a rule-based algorithm, errors occurred in only some exceptional cases; thus, its F1 score was evaluated to be 96.9%. The CTGC module’s F2 score for automatic extraction performance was evaluated as 79.1% due to some data’s bias. Overall, the validation study shows that while a human review of the risk clauses in a PO manually took hours, it took only an average of 10 min with the PORAS. Therefore, this time saving can significantly reduce the owner engineer’s PO workload. In essence, this study contributes to achieving sustainable engineering processes through the intelligence and automation of document and risk management in the plant industry.

1. Introduction

In recent decades, the development of the plant industry has been accelerating due to technological developments and globalization [1]. Industrial plant refers to the basic raw materials, such as petroleum, steel, nonferrous metals, and chemical engineering [2], that are manufactured in a facility. Since the plant industry uses large-scale equipment for production, massive procurement and complicated supply chains occur during the plant’s life cycle [1,3]. In addition, the continued development of engineering technology and the expansion of production scale will result in equipment becoming more complex. Therefore, a rise in interactions and coupling between equipment will be required. The likelihood of equipment failure will increase, thus replacements and revamping for equipment maintenance will constantly occur while operating the plant [3]. In the plant industry, plant maintenance is one of the major operational activities and is a rapidly increasing cost area for plant owners (hereafter owner) [4,5]. In fact, according to P Company, between 2016 and 2020, an average of 429 investments in equipment maintenance worth 82 million dollars were made annually [6,7]. On average, engineers performing this task are responsible for twenty investment projects per person per year. Furthermore, when performing one investment, an average of ten purchase orders (POs) are reviewed, and it may take up to sixteen hours for each PO to be evaluated [8]. As a result, when the industrial plant makes a massive investment in equipment maintenance, it requires many man-hours to review POs in the supplier selection process before proceeding with the investment.
The procurement process for replacement or revamping of equipment may vary in detail from industry type or its owner. However, it is usually the same as Figure 1a illustrates below.
Once the equipment investment project begins, the investment assessment based on the basic design begins. After the project is recognized and approved for investment value, a full-scale purchase and procurement process proceeds. The process starts with the owner distributing the PO to potential suppliers. The PO is the most critical technical document in the investment project and consists of the technical and legal parts for equipment (see Figure 1b). The technical part includes equipment specifications, types, and quantities [9]. Additionally, technical requirements are written by the owner, while a technical proposal is drafted by the suppliers. The legal part of the PO usually consists of general conditions. General conditions are contracts commonly used as standards for companies and/or projects. Furthermore, it generally defines the contracting parties’ legal relationships, responsibilities, and contract management methods [10]. The supplier, who willing to participate in the bid based on the PO distributed by the owner, responds by creating a technical proposal regarding the equipment available with specifications. Then, the owner compares his or her PO with the supplier’s technical proposal to confirm that the owner’s technical requirements are well-reflected. If further changes are required, the owner may adjust the contents with the supplier as necessary. Throughout this process, the owner also corrects or embodies his or her PO to determine the final PO. The owner selects a supplier based on the PO submitted in the bidding process and proceeds with the contract. During the procedure, they review and agree on the general conditions of each party. After the contract, the supplier submits the final technical proposal for fabrication or installation of the equipment to the owner. Then, the owner compares and reviews this with his or her final PO. Additionally, information may be modified as necessary throughout this procedure. Lastly, based on the final technical proposal confirmed by the owner, the process of fabrication, installation, and construction of the equipment proceeds.
The review task, shown in Figure 1a, is to compare the owner’s technical requirements and the supplier’s technical proposal for the technical specification of the equipment. In addition, the engineer in charge manually compares all of the items. The PO usually has dozens of sheets, often times over 100, and is written in relatively different formats. Therefore, the engineer in charge must directly search for and compare the same items. Moreover, the PO deals with not only the technical part of the equipment but also the legal part, which is challenging to analyze. Thus, it is time-consuming for engineers to review because it processes a considerable number of documents submitted by many suppliers while bidding for one piece of equipment. In addition, the interpretation may change depending on the background knowledge and experience, and since it is manually reviewed by a person, omissions or errors may occur. As a result, inadequate reviews of POs can lead to future disputes and claims. To resolve this issue, owners need a system that automatically detects and compares significant review items, for example, items with high contractual risk and equipment that require particular specifications. In addition, research on document analysis using artificial intelligence (AI) is relatively insufficient in industrial plants compared to other fields, such as social sciences and medical sciences, and in particular, cases of AI application that document analysis in steelworks, as is the subject of this study. Therefore, many opportunities exist to apply AI technology in industrial plants where vast technical documents are still manually analyzed.
The techniques by which computers analyze documents are no longer new, but many of these techniques target non-technical documents [11]. Therefore, the purpose of this study was to analyze a PO, a technical document, using AI. In addition, this study aimed to propose a more complete table recognition method by recognizing both the table structure and internal text, unlike other preceding research that focused on table structure or area recognition. Furthermore, this study focused on proposing a novel model that can compare tables for the same clause written in different formats. This study also proposed support for the quick decision making of the owner by providing the result of extracting and comparing risk clauses from two different POs. To achieve these objectives, this research has developed the purchase order recognition and analysis system (PORAS) for analyzing tables and general conditions in the POs. Overall, the objective is to reduce the time it takes to review technical documentation during the purchase and procurement process as well as eliminate the risk of review errors and omissions.
This paper consists of five main sections. First, Section 1 describes the background and purpose of the study. Second, Section 2 presents literature reviews on table recognition, information extraction, and entity matching. Then, Section 3 shows detailed descriptions of the modules of the PORAS, which includes the overview of this study and the collected data. Fourth, Section 4 is about the performance validation of the detailed models constituting of the developed modules. Lastly, Section 5 describes the conclusion, contribution of this work, discusses the limitations of the study, and future research directions.

2. Literature Review

The contents of this research were classified into three categories, and the previous research was investigated and reviewed. The first is the technology of table recognition and the second is the research of information extraction technology by text analysis. The third is research on entity matching to compare the contents of tables and general conditions. In this way, the authors examined the characteristics and approaches of similar studies, analyzed the limits, and benchmarked this study.

2.1. Table Recognition

Prior to developing table recognition techniques, the authors reviewed existing similar studies. Kieninger and Dengel [12] developed T-Recs, a system that recognizes the position of a table using optical character recognition (OCR) technology, and T-Recs ++, which is an improvement over the previous system. They used the system to recognize the text in the document, extract the boundaries of the text, and combine them to recognize the table. However, since this study does not consider the lines of the table, it has the limitation that it can only be recognized in certain cases. In addition, the performance of table recognition was evaluated by recognizing the areas for tables, columns, and rows. Shahab et al. [13] provided a comparative evaluation framework for algorithms that leverage their previously developed OCR techniques to determine table boundaries and identify table rows and columns. Therefore, each recognition accuracy was provided for the tables, rows, columns, cells, row span, and column span. The authors referred to this paper to construct a method to evaluate the table recognition model. Kasar et al. [14] developed a technique to identify horizontal and vertical lines in an image and detect a table based on the attributes of the lines found through a trained support vector machine classifier. However, unlike other studies, this study relies solely on the presence of lines without text analysis. Thus, there are unrecognizable limits for table layouts without boundaries. Additionally, there was a limitation in evaluating the performance when only detecting the table area. Rashid et al. [15] used a pre-trained artificial neural network model (autoMLP) to classify the content of a document into table elements and general text elements. It then scanned the identified table horizontally, found rows and boundaries, and determined the table. However, this study only shows the original table and non-table elements in different colored bounding boxes. As a result, it requires additional effort for the user to extract their content. Although their system distinguished areas of cells, rows, and tables, it only provided validation for distinguishing table elements, such as text elements outside the table. Qasim et al. [16] considered the introduction of graph networks, unlike other studies that presented standard neural networks for table recognition. Adams et al. [17] presented benchmarking methods and training datasets for recognizing complex tables in a particular discipline (biomedical). They emphasized that to recognize complex tables used in a particular discipline, collecting individual data for each of them is necessary.
Before developing the table recognition function, three pieces of commercial software were tested using two documents from the test dataset found in this study. This study was conducted to understand the latest technology through these tests, and to resolve any errors that occur in commercial software. The first is Form Recognizer installed in Microsoft Azure [18]. As a result of the table recognition test of Form Recognizer, it was confirmed that the application programming interface (API) was successfully constructed and showed an overall excellent performance. However, recognition errors for merged cells often occurred, along with inconsistent and irregular results in distinguishing cell areas. In addition, although the recognition results are displayed graphically, it is difficult for general users to utilize them immediately as extraction and saving are only allowed with JavaScript Object Notation (JSON) files. Finally, the authors used Adobe Acrobat Reader Pro to test the conversion of documents into excel files [19]. At first glance, it may seem like the document format has been successfully transferred. However, a closer look reveals errors in the immoderate separation of cells. These errors also occurred in general cells, but appeared more often in merged cells. However, through Acrobat Document Cloud, which was released by improving Acrobat Reader Pro, most of the recognition errors of immoderate separating general cells were improved, and thus only some recognition errors of merged cells occurred [20]. The testing of three pieces of commercial software determined that there are frequent errors in recognizing merged cells. Through the above-mentioned previous research and the investigation of programming tools that implemented it, the current technical level was grasped, and the part requiring further research was assimilated.

2.2. Information Extraction

In this study, the authors studied how to detect risk clauses in documents and selected information extraction (IE) as the most appropriate method. IE is the task of separating a document into the corpus and text fragments, disregarding irrelevant information. In addition, it determines and connects only the target information [21]. Piskorski and Yangarber [22] defined IE as deriving predefined structured information from unstructured text. In addition, they investigated and introduced the past development of IE to future issues. Mykowiecka et al. [23] developed rule-based IE systems for automatically extracting specific medical information from patients’ clinic data in Polish. In this study, they adopted a rule-based IE method rather than machine learning because of the complex templates of clinical data and the lack of training data. Furthermore, they introduced a rule-based IE system when there was insufficient data in that specific field of expertise. Zhang et al. [24] developed a semantic natural language processing (NLP) and IE-based method for finding important information from other construction regulatory documents. Furthermore, it automatically performs regulatory compliance checks as well. Lee et al. [25] developed a model to perform IE that focuses on keywords for risk clauses on construction contracts via rule-based NLP. Although the data were biased due to extracting only some data corresponding to risk clauses from the entire contract, the F1 score without considering the biased data was measured at 81.8 percent. The studies of Zhang et al. [24] and Lee et al. [25] were similar as both consist of the process of creating an extraction rule based on the pattern of sentences associated with risk. This paper benchmarked the methodology for creating the extraction rules covered in Zhang et al. [24] and Lee et al. [25]. Feng and Chen [26] emphasized the need to work with domain experts to introduce automated information extraction into the engineering industry and other disciplines. Given that securing data sources for the engineering industry is challenging, this paper proposed a framework for training deep neural networks using small data. Itto et al. [27] summarized text analysis methods in various industries with examples. They focused on text mining and NLP in particular and discussed the limitations of each case. Omran and Treude [28] analyzed 1350 software engineering conference papers from 2012 to 2017 and selected the four most widely used NLP libraries in academia. Additionally, they provided a description and rating of the selected NLP libraries (Google Syntaxnet, Stanford Corenlp Suite, NLTK, and spaCy). For this study, the authors selected spaCy, which showed the best overall performance among the NLP libraries selected. Lastly, Altinok [29] summarized the features and usage examples of spaCy.

2.3. Entity Matching

This study researched a method to find and compare data that correspond to the PO’s content regarding the owner and supplier. Therefore, entity matching, a process of identifying and interconnecting data that correlate to the same entity in different data sources [30], was selected as the most suitable method for this study. The entity matching process has been studied under various names (record linkage, entity resolution, data deduplication, reference reconciliation, and others) [31,32] and is referred to in this study as entity matching. Newcombe et al. [33] proceeded with the study of hereditary diseases by first studying the entity matching problem, which automatically connects data corresponding to the same entity to a computer. Köpcke and Rahm [30] compared and analyzed eleven entity matching frameworks on various criteria and offered ways to effectively solve the problem through a combination of blocking and multiple matcher algorithms. Barlaug and Gulla [34] weighed various studies using neural networks for entity matching. In addition to the generally applicable entity matching process, the authors also presented a reference model for a deep-learning-based entity matching process. This research explored how to introduce neural networks into entity matching and benchmarked them to design a research process. Xu et al. [35] studied the concept of matching various data in a document with the corresponding specific entity using named entity recognition (NER), which recognizes specific mentions and neural networks. Additionally, they built a data dictionary for specific disciplines (biomedical) and used string matching methods to perform dictionary matching based on it. It also describes the word embedding process for training a neural network model in a particular field of vocabulary. The performance of their new method, named DABLC, for two corpora widely used in the biomedical field had an F1 score of 88.6 percent and 88.3 percent, respectively.
As a result of reviewing the prior research above, there were many cases where the focus was only on recognizing tables and each area. In addition, it was confirmed that no study comprehensively identified or thoroughly evaluated the table structure, the internal text’s content, and location. This study was conducted by testing the features of three pieces of commercial software, including recognizing the table structure, the content, and the location of the inner text, which were not sufficiently dealt with in previous studies. Furthermore, this research team researched the process of recognizing the table structure more accurately by devising a rule to increase the recognition rate of merged cells that cause frequent errors in commercial software.

3. Methodology and Model Development

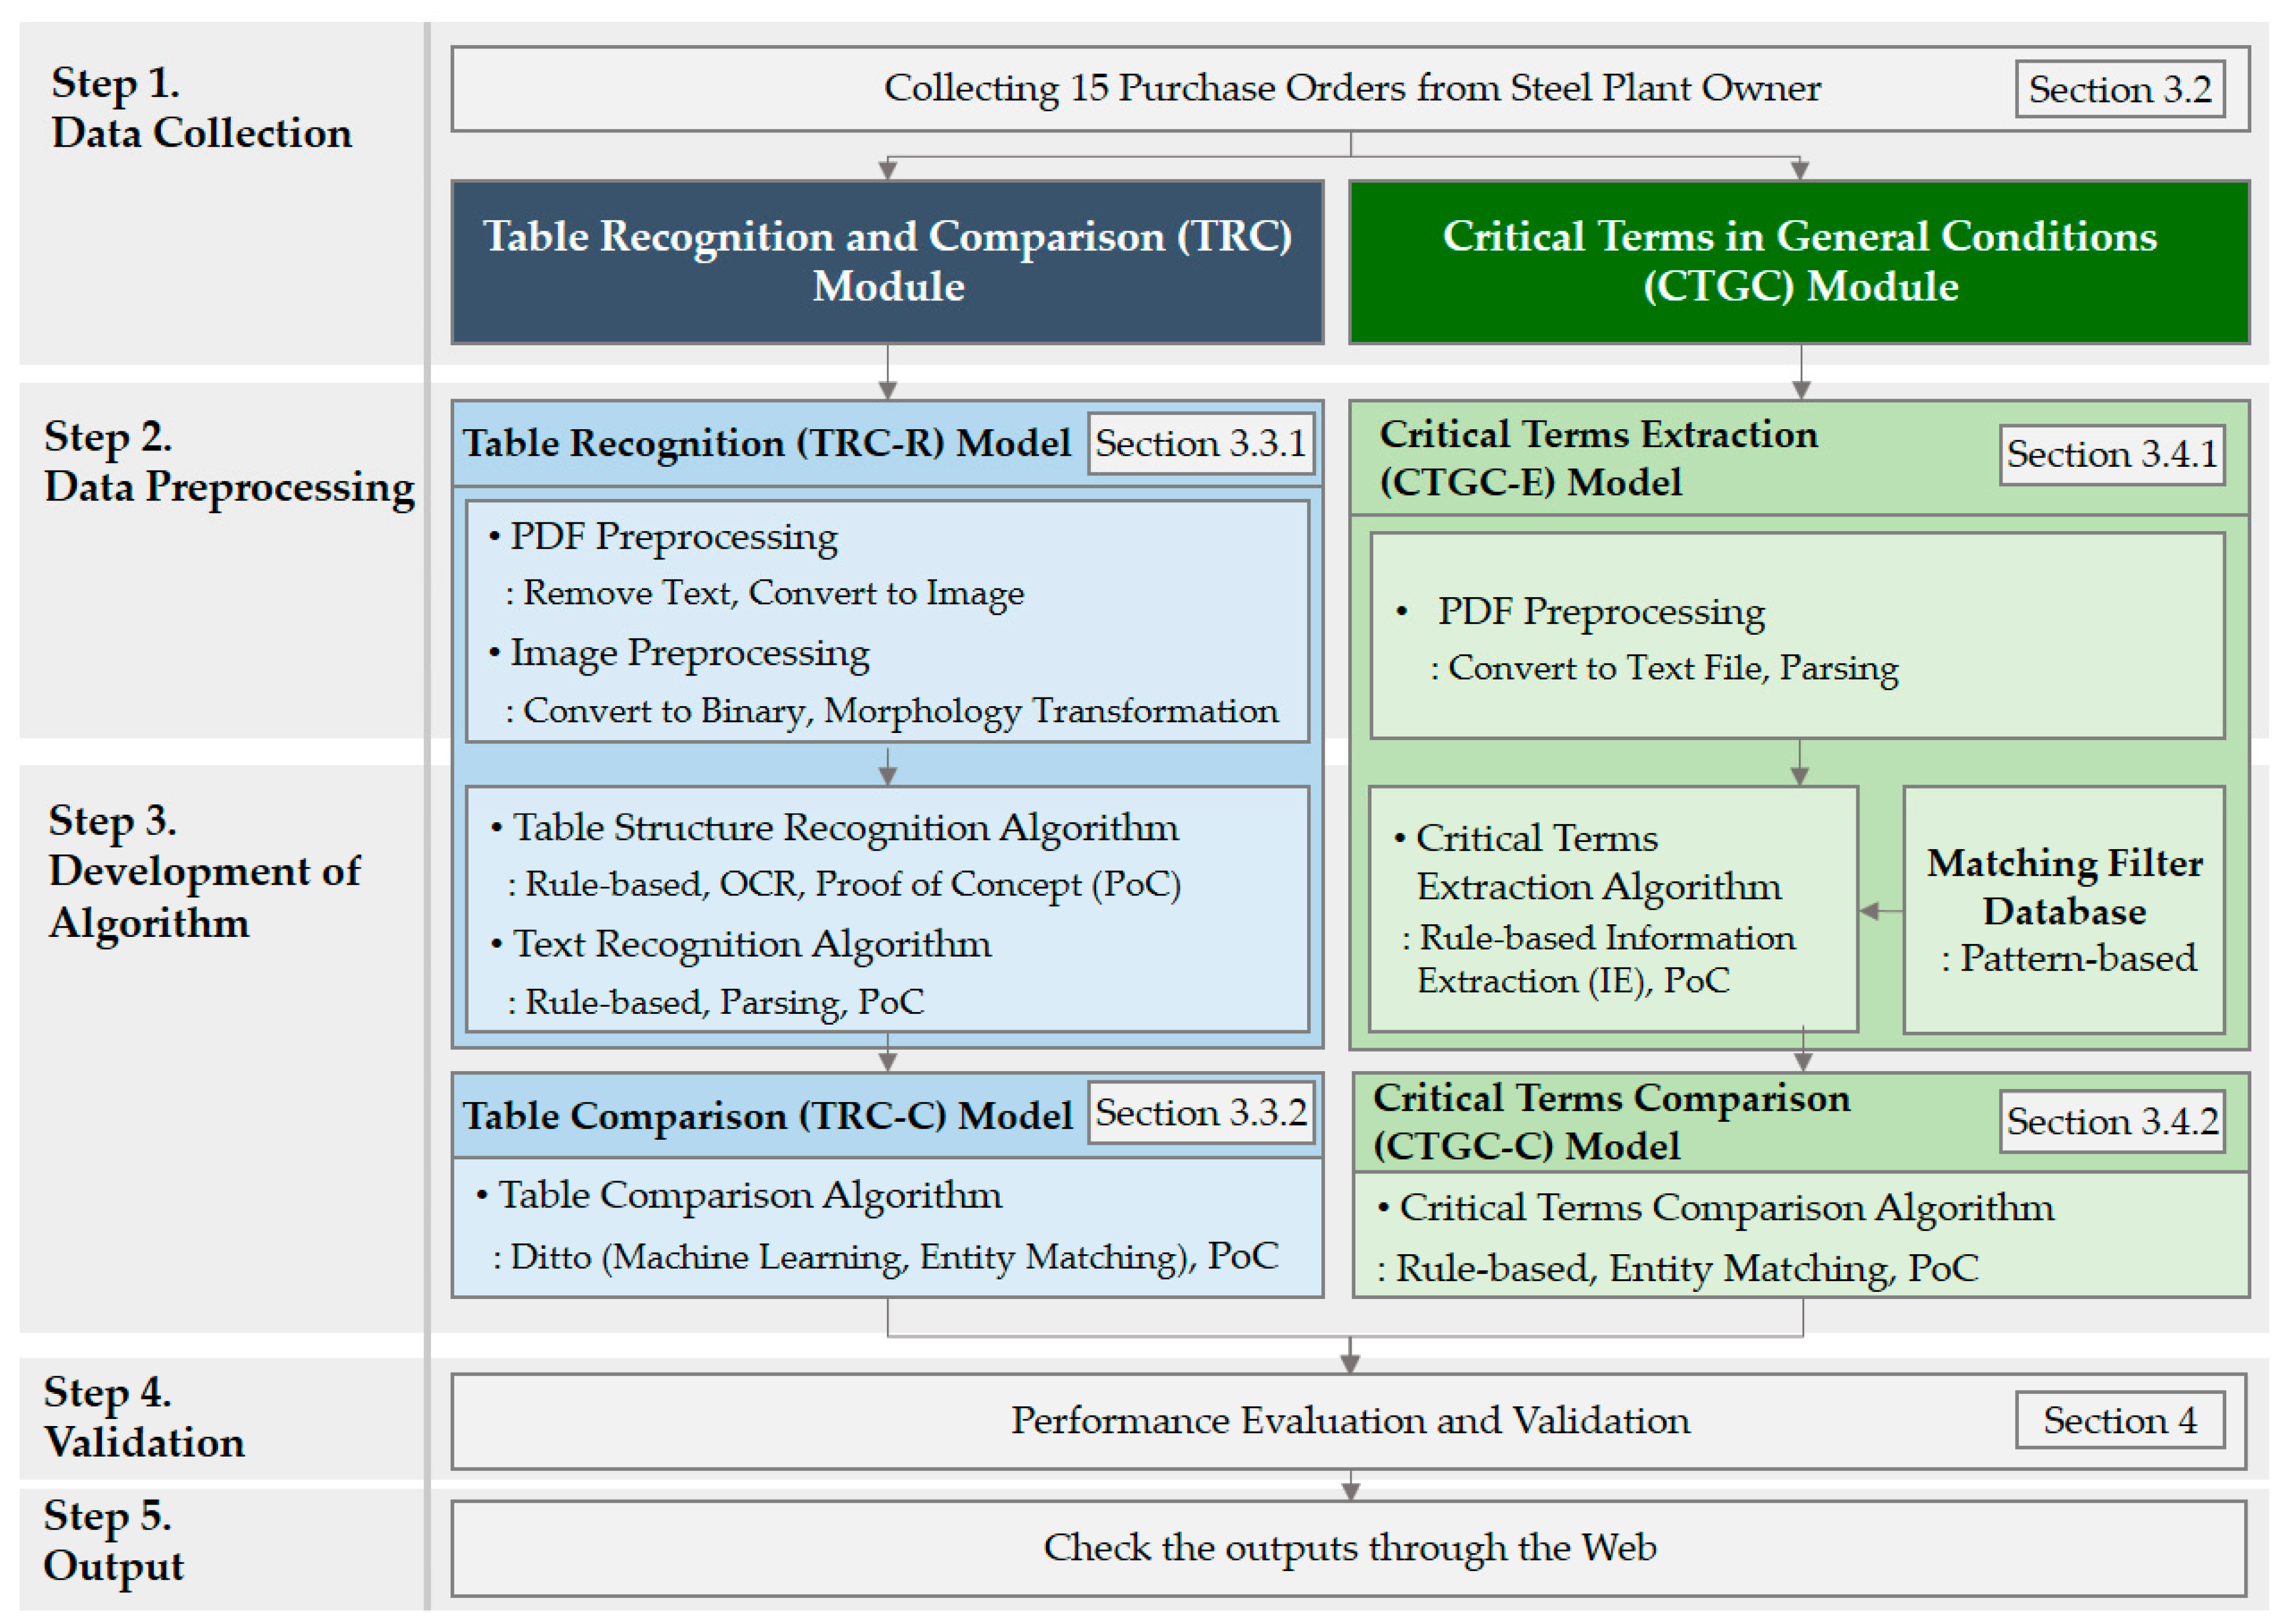
3.1. The Research Overview

In this research, the authors developed the PORAS, which detects and compares the core items of POs, a technical document, using AI. After discussing the POs with engineers that have 10 and 15 years of experience with equipment investment projects in steel plants, the key issues that showed significant problems were reviewed. As a result, the following were selected as proof of concept (PoC): the scope of supply, detail specification, performance guarantee, and schedule clauses. A detailed description of each clause can be found in Section 3.3 and Section 3.4. Since these critical issues are written in text and tables, this research has advanced into two modules.
The first is the table recognition and comparison (TRC) module for detecting and comparing important points written in a table. The TRC module used OCR and parsing techniques to recognize the table as well as Ditto, an artificial neural network model. Furthermore, entity matching techniques were utilized to determine the same item in two different tables and were compared based on their contents. The second is the critical terms in general conditions (CTGC) module, which is used for finding and comparing risk clauses under general conditions written in general text. The CTGC module applies a pattern-based and rule-based algorithm to detect and extract the critical terms of risk clauses in the PO [36]. It also uses an entity matching technique to compare the same items found in two different POs. Since the TRC module targets tables and the CTGC module focuses on plain text, these two modules operate independently as separate modules. Developed based on the Python programming language, the PORAS has been made user-friendly by creating a web implemented with a graphical user interface (GUI). The functions of the two modules that make up the PORAS were subdivided, appropriate tests were planned, and performance was quantitatively evaluated.
This study was carried out in five steps and was separated into two tracks, the TRC module and the CTGC module as shown in Figure 2. The TRC module found the table with the same clause in the owner’s and supplier’s POs, respectively, and compared the items in the table. The CTGC module targeted only text by extracting it from the PO and comparing the critical terms of the risk clause specified by the user.
  • Step 1. Data collection: collecting POs from owners to carry out research;
  • Step 2. Data preprocessing: performing preprocessing to improve the analysis accuracy of the collected data;
  • Step 3. Development of algorithm: developing the TRC module and the CTGC module;
  • Step 4. Validation: executing validation by evaluating the performance of the two developed modules;
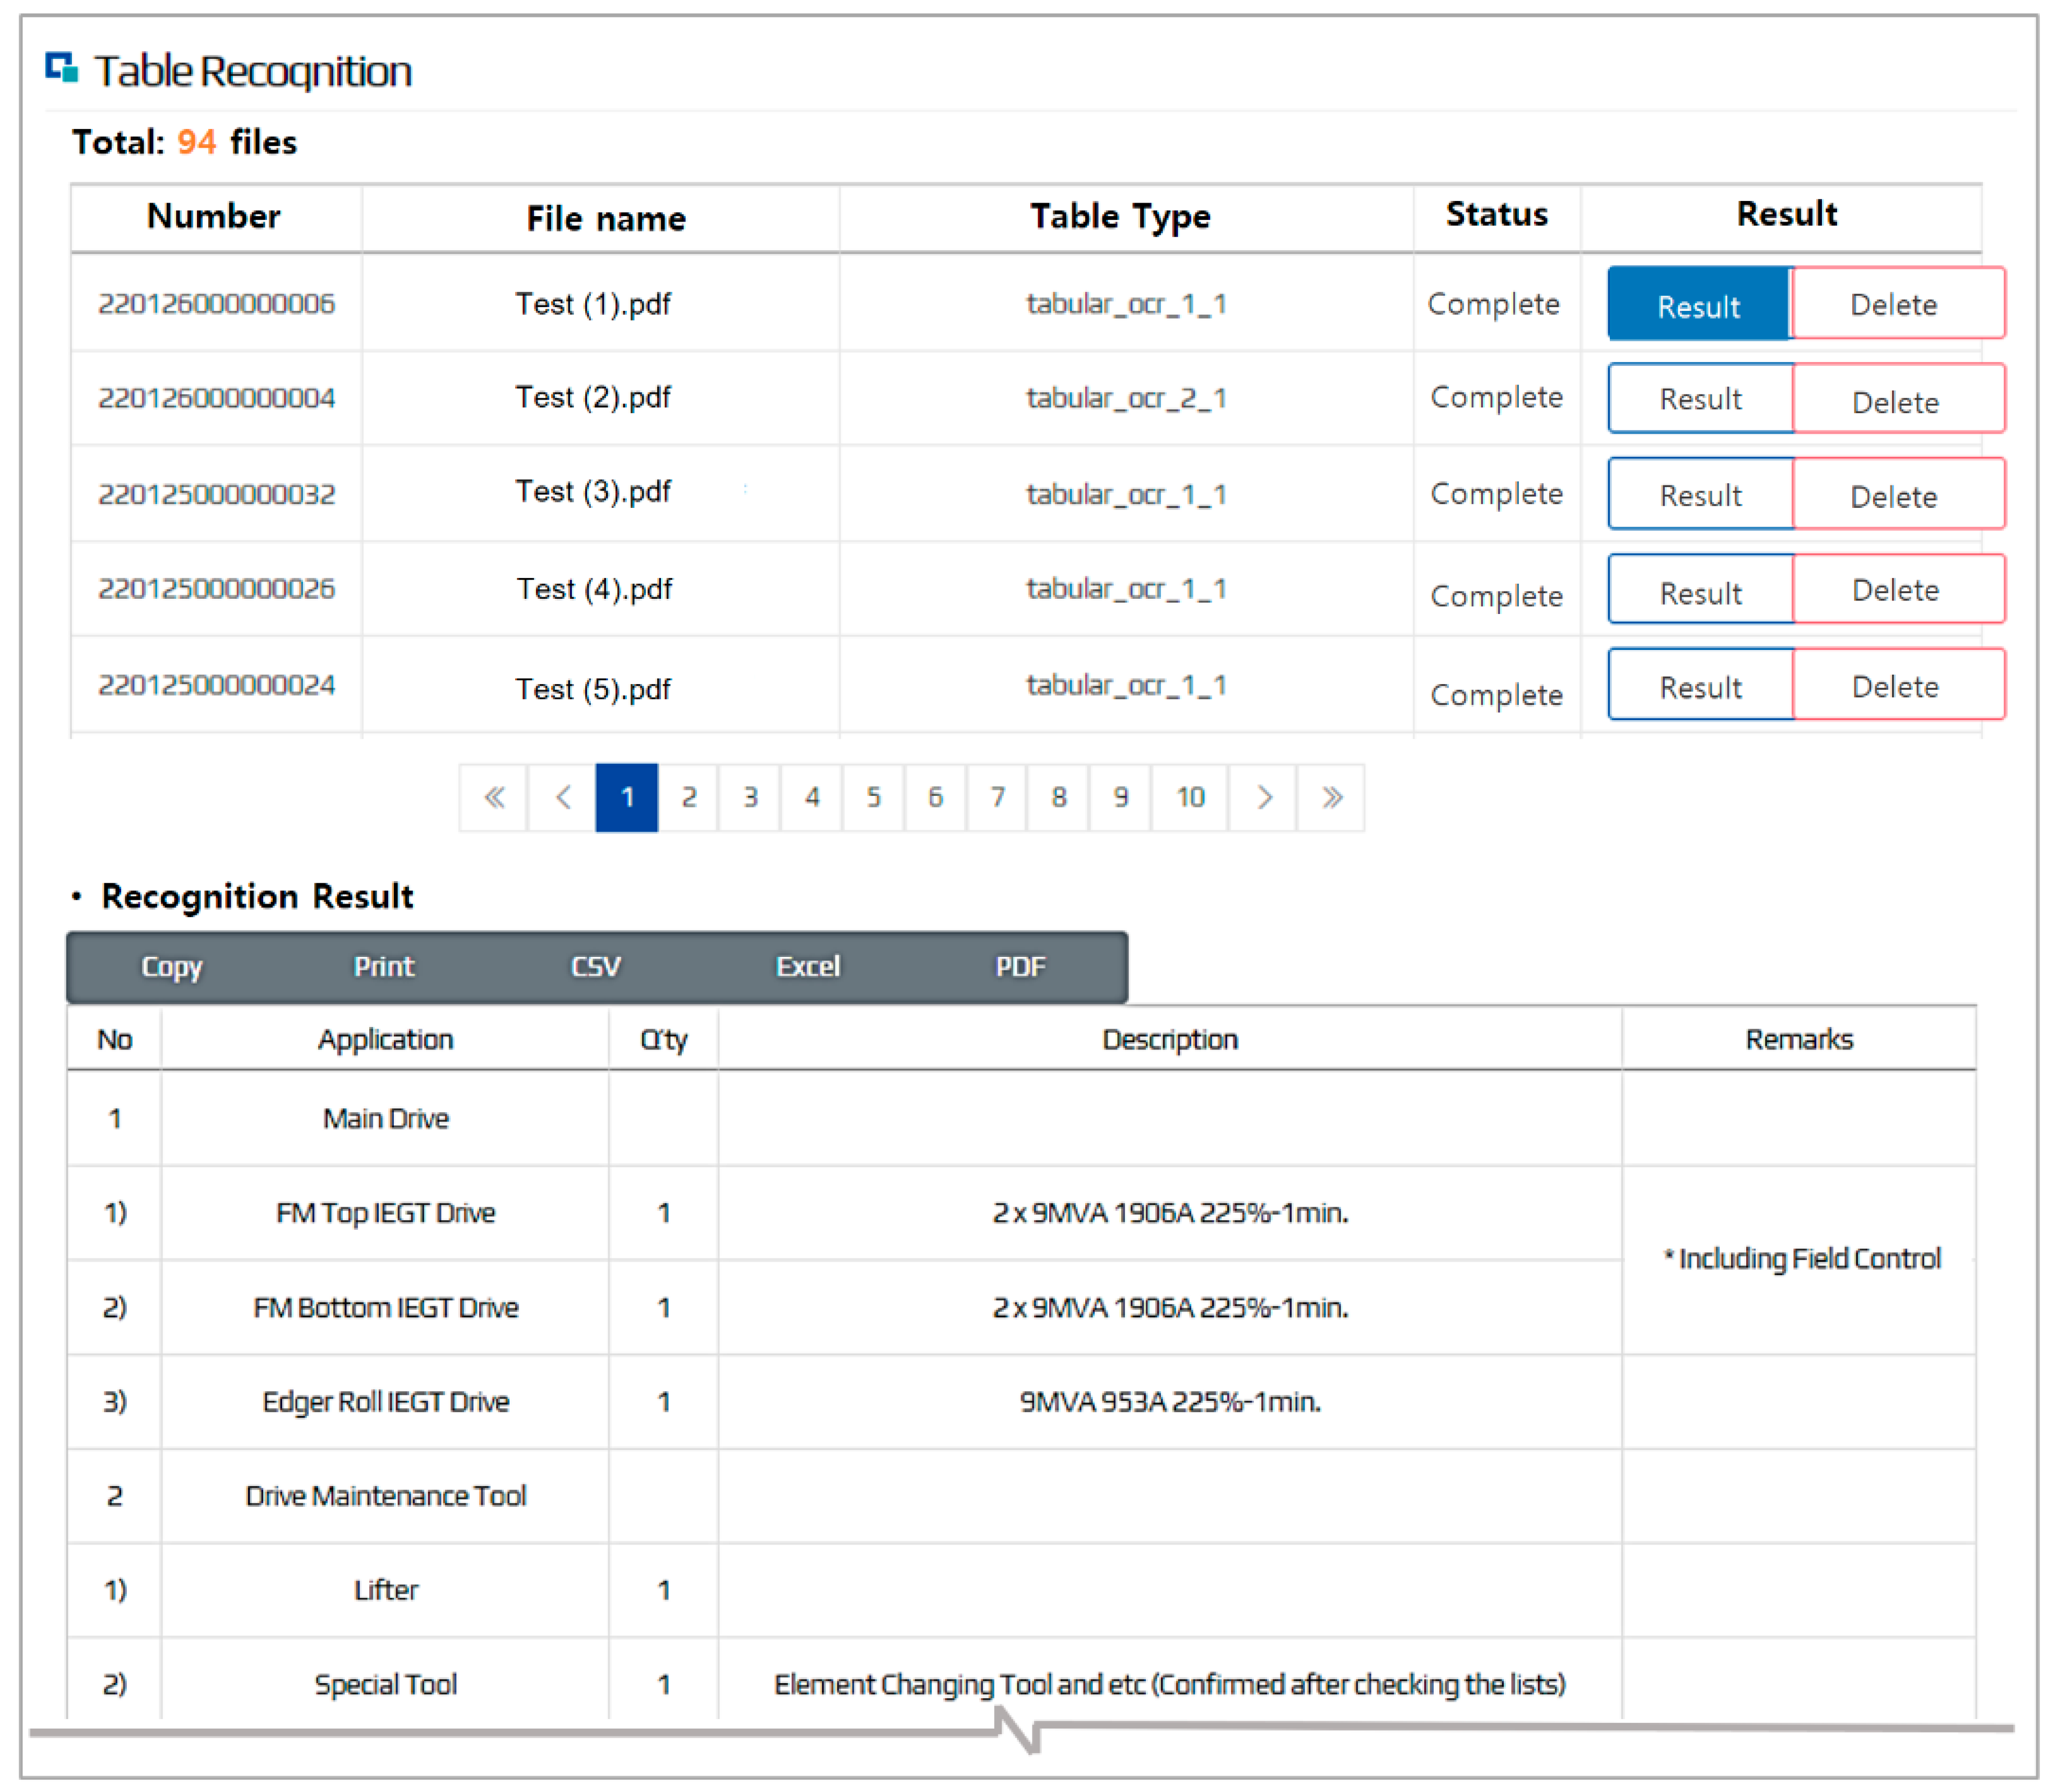
  • Step 5. Output: confirming visualized analysis results via the web.
The programming language used to develop the PORAS was Python. The web server was configured using the Spring Framework, and Angular 11 was used to implement the web screen. Furthermore, the database for this system used MySQL. The methodologies and their corresponding main Python libraries are described in Section 3.3 and Section 3.4. The development environment for the PORAS is the same as in Table 1.

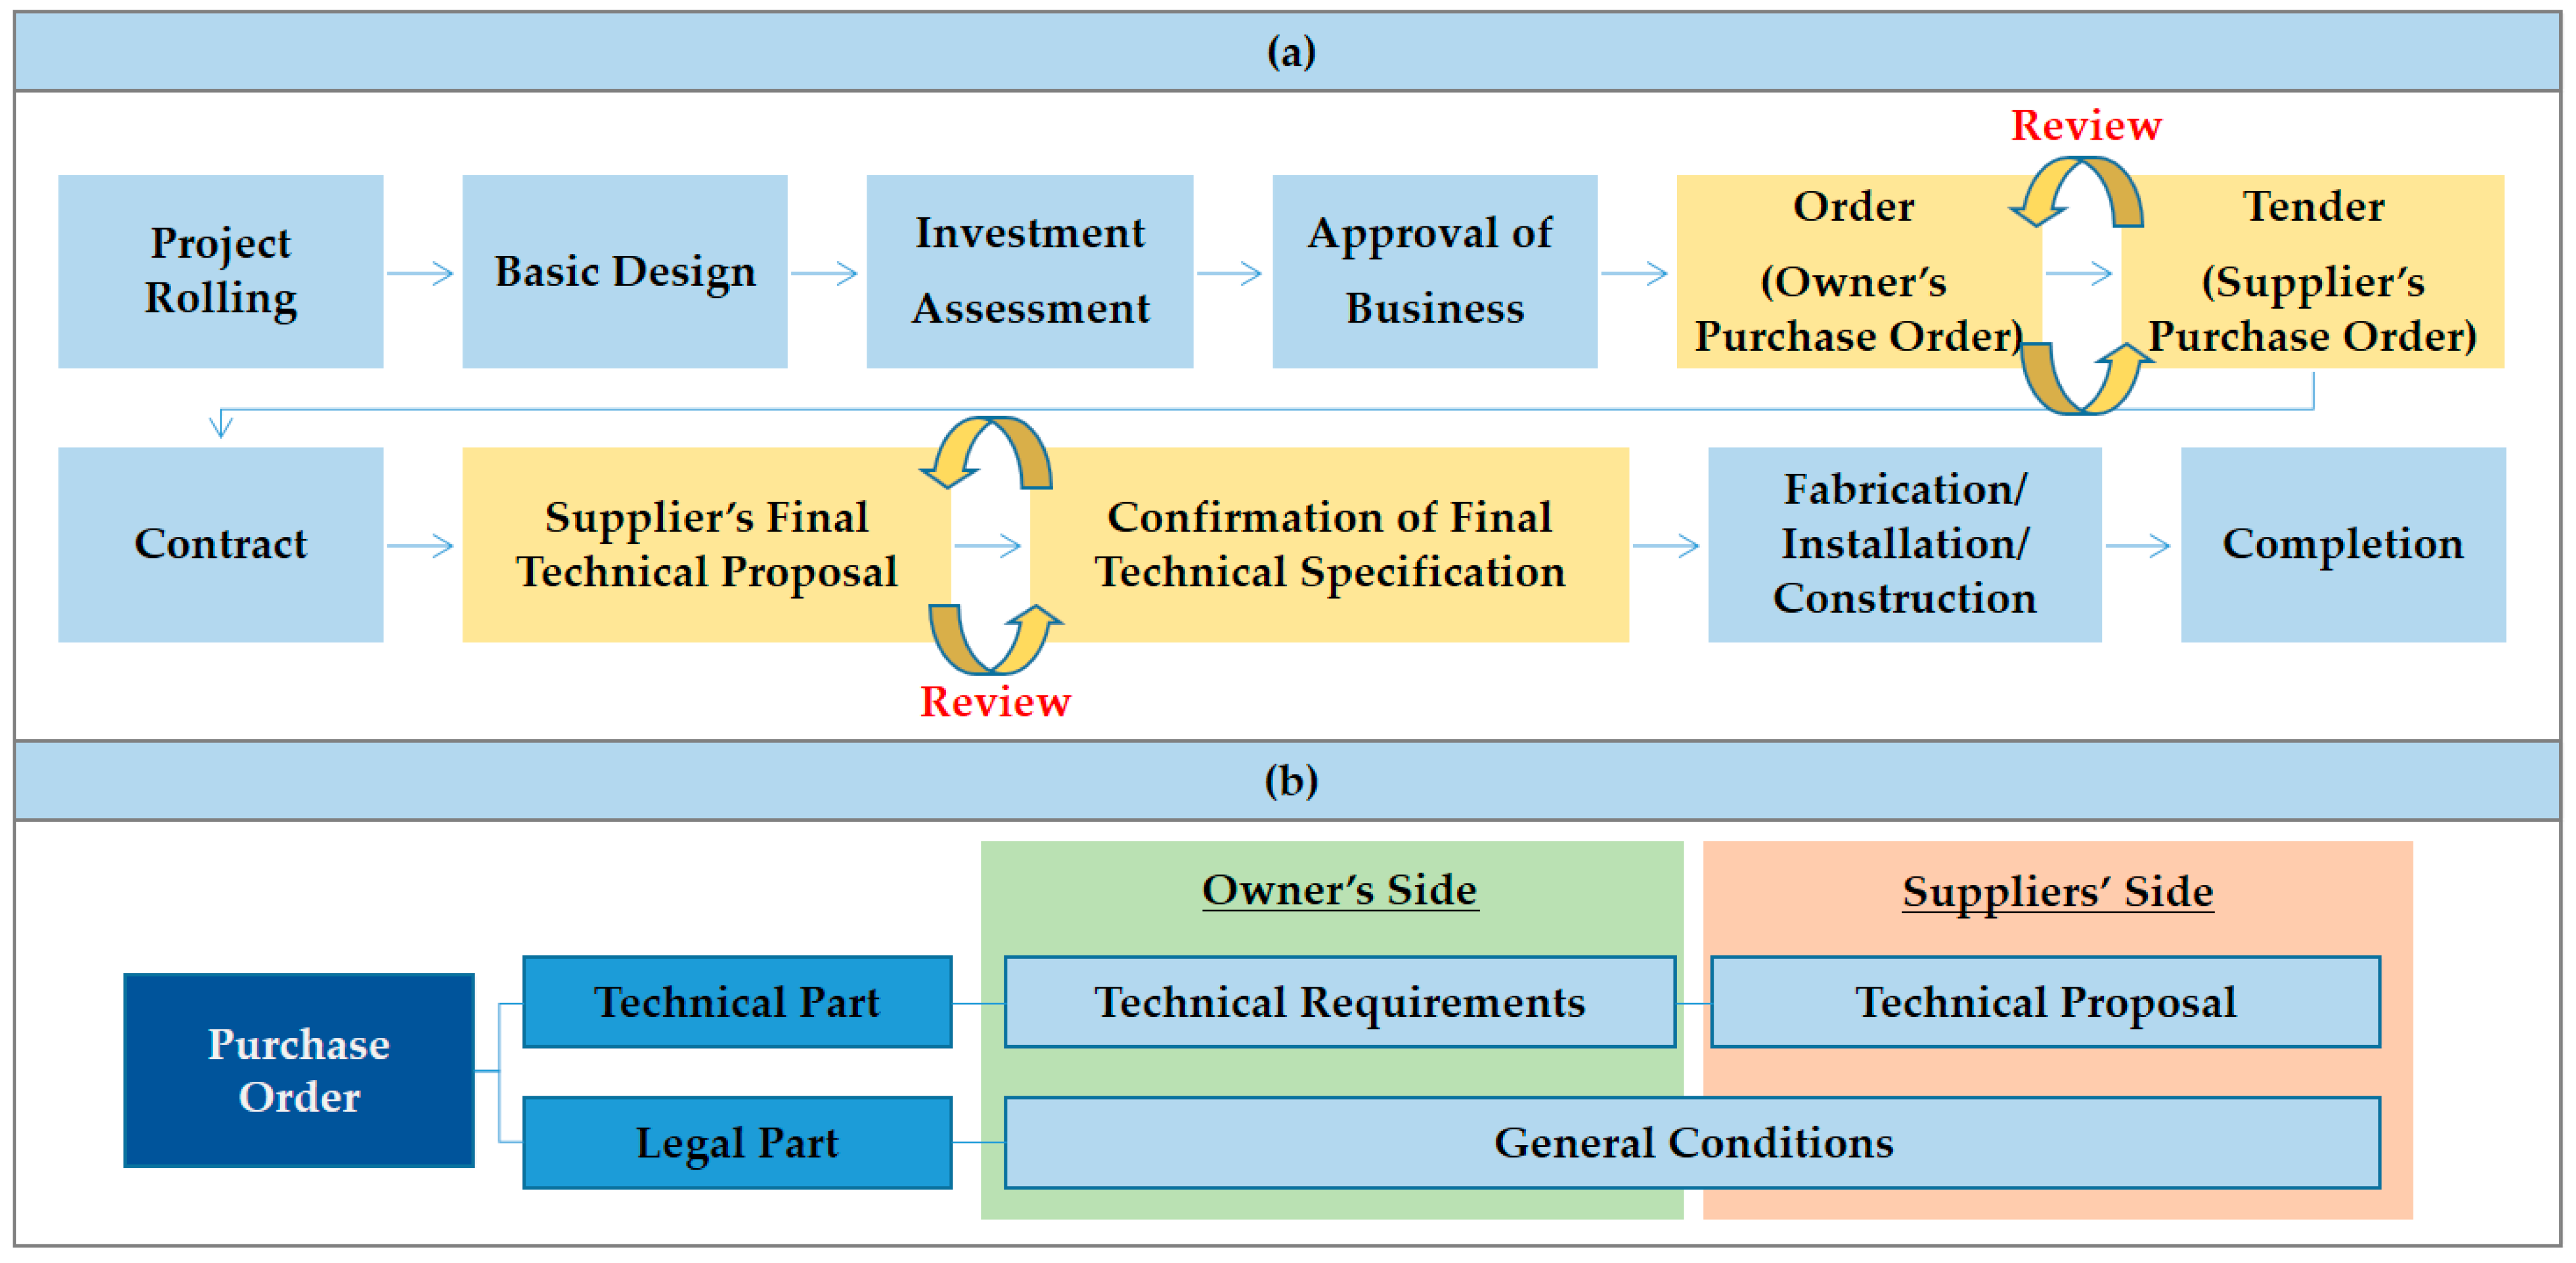
3.2. Data Collection

In order to proceed with this research, the authors collected fifteen POs for six investment projects for equipment conducted from 2016 to 2020 from P Company, the steel plant owner. Therefore, this research mainly focused on the equipment supplied to steel plants. The seven collected POs were written by the owner for technical requirements and general conditions for ordering equipment. The remaining eleven POs are about technical proposals and general conditions written by suppliers willing to participate in bidding. Among them, T1, T2, and T3, shown in Table 2, were used as input data to validate the performance of the PORAS, while the rest were used as data for developing the PORAS. As depicted below, Table 2 lists the collected POs, and the content with security problems was treated anonymously.

3.3. Table Recognition and Comparison (TRC) Module

The TRC module can recognize and compare table structure and internal text from the owner’s and the supplier’s PO for the same clause. The PoC targets for the TRC-R model are the table in the scope of supply clause and the detail specification clause. Meanwhile, the PoC target for the TRC-C model is the table of the scope of supply clause. Because this is a representative table that expresses the same content differently in a document, it is suitable for testing the comparison function. First, the scope of supply clause clarifies the liability of the owner and supplier item by item. As a result, this shows not only physical parts like equipment but also services like construction and installation. Second, the detail specification clause establishes the equipment specifications. Since there are many items, both clauses are commonly written in a table. These two clauses were chosen as PoC because they require particular review as they may be linked to contractual risks, such as claims.

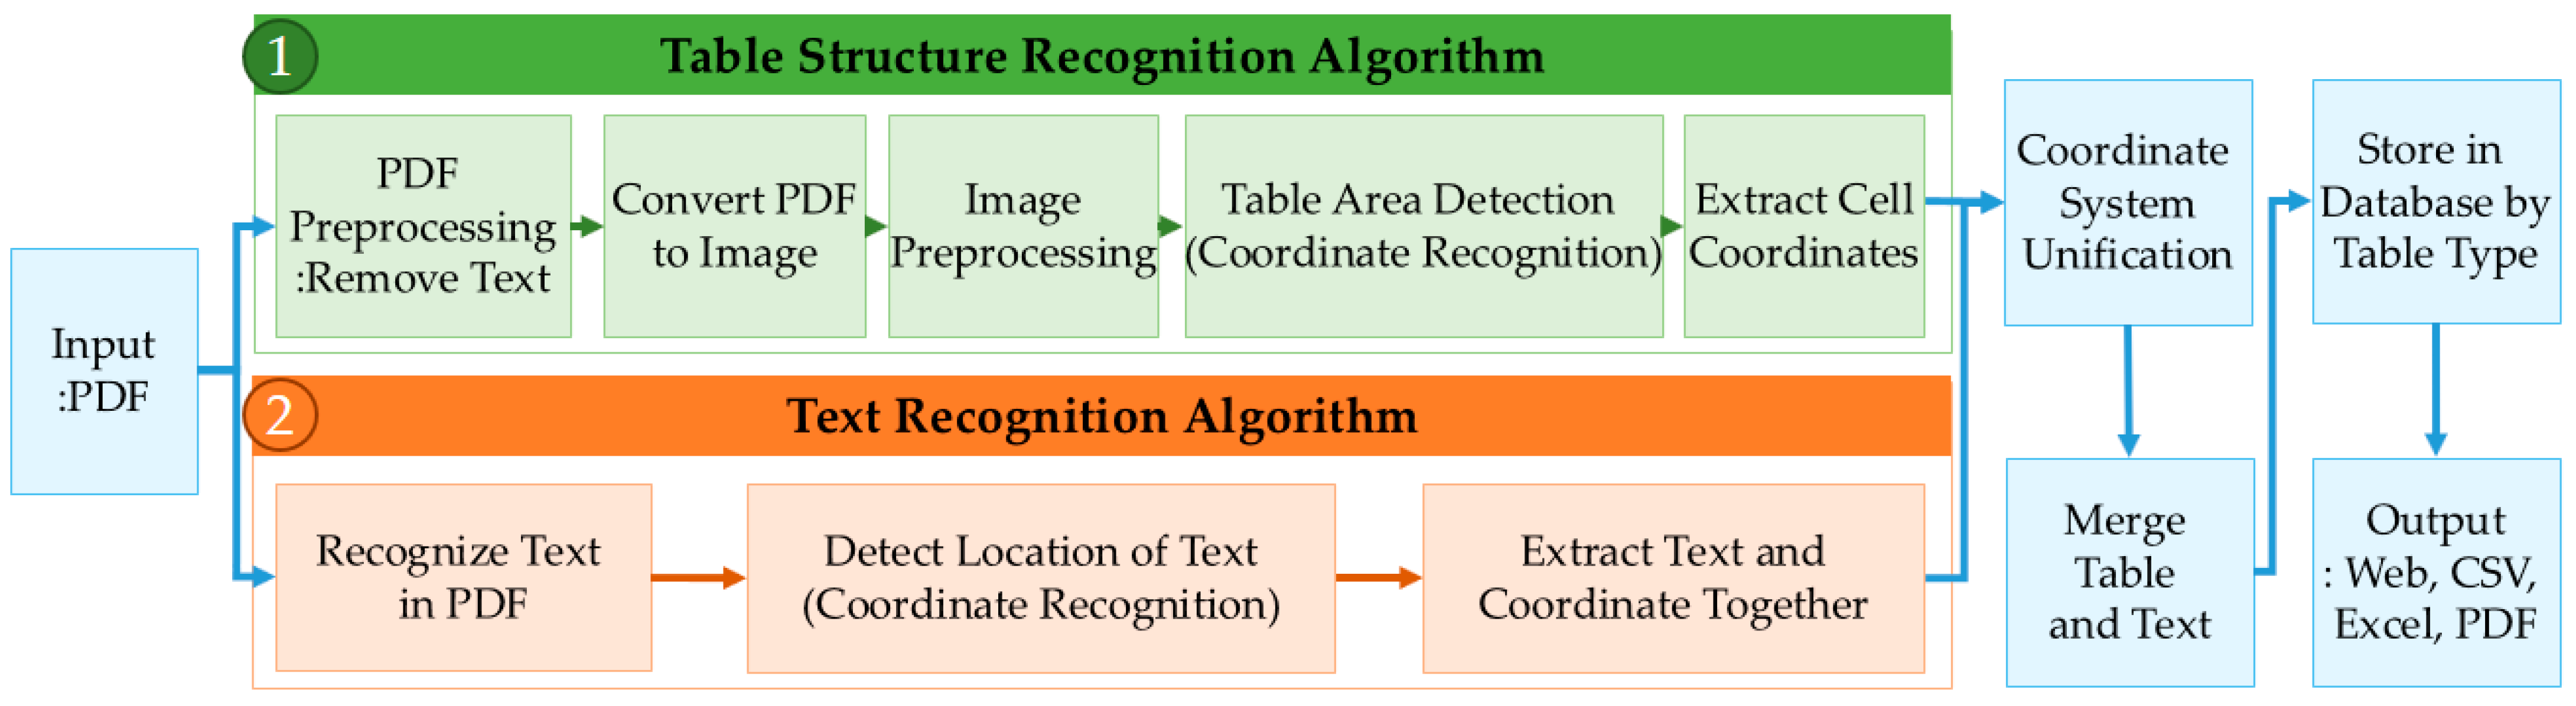
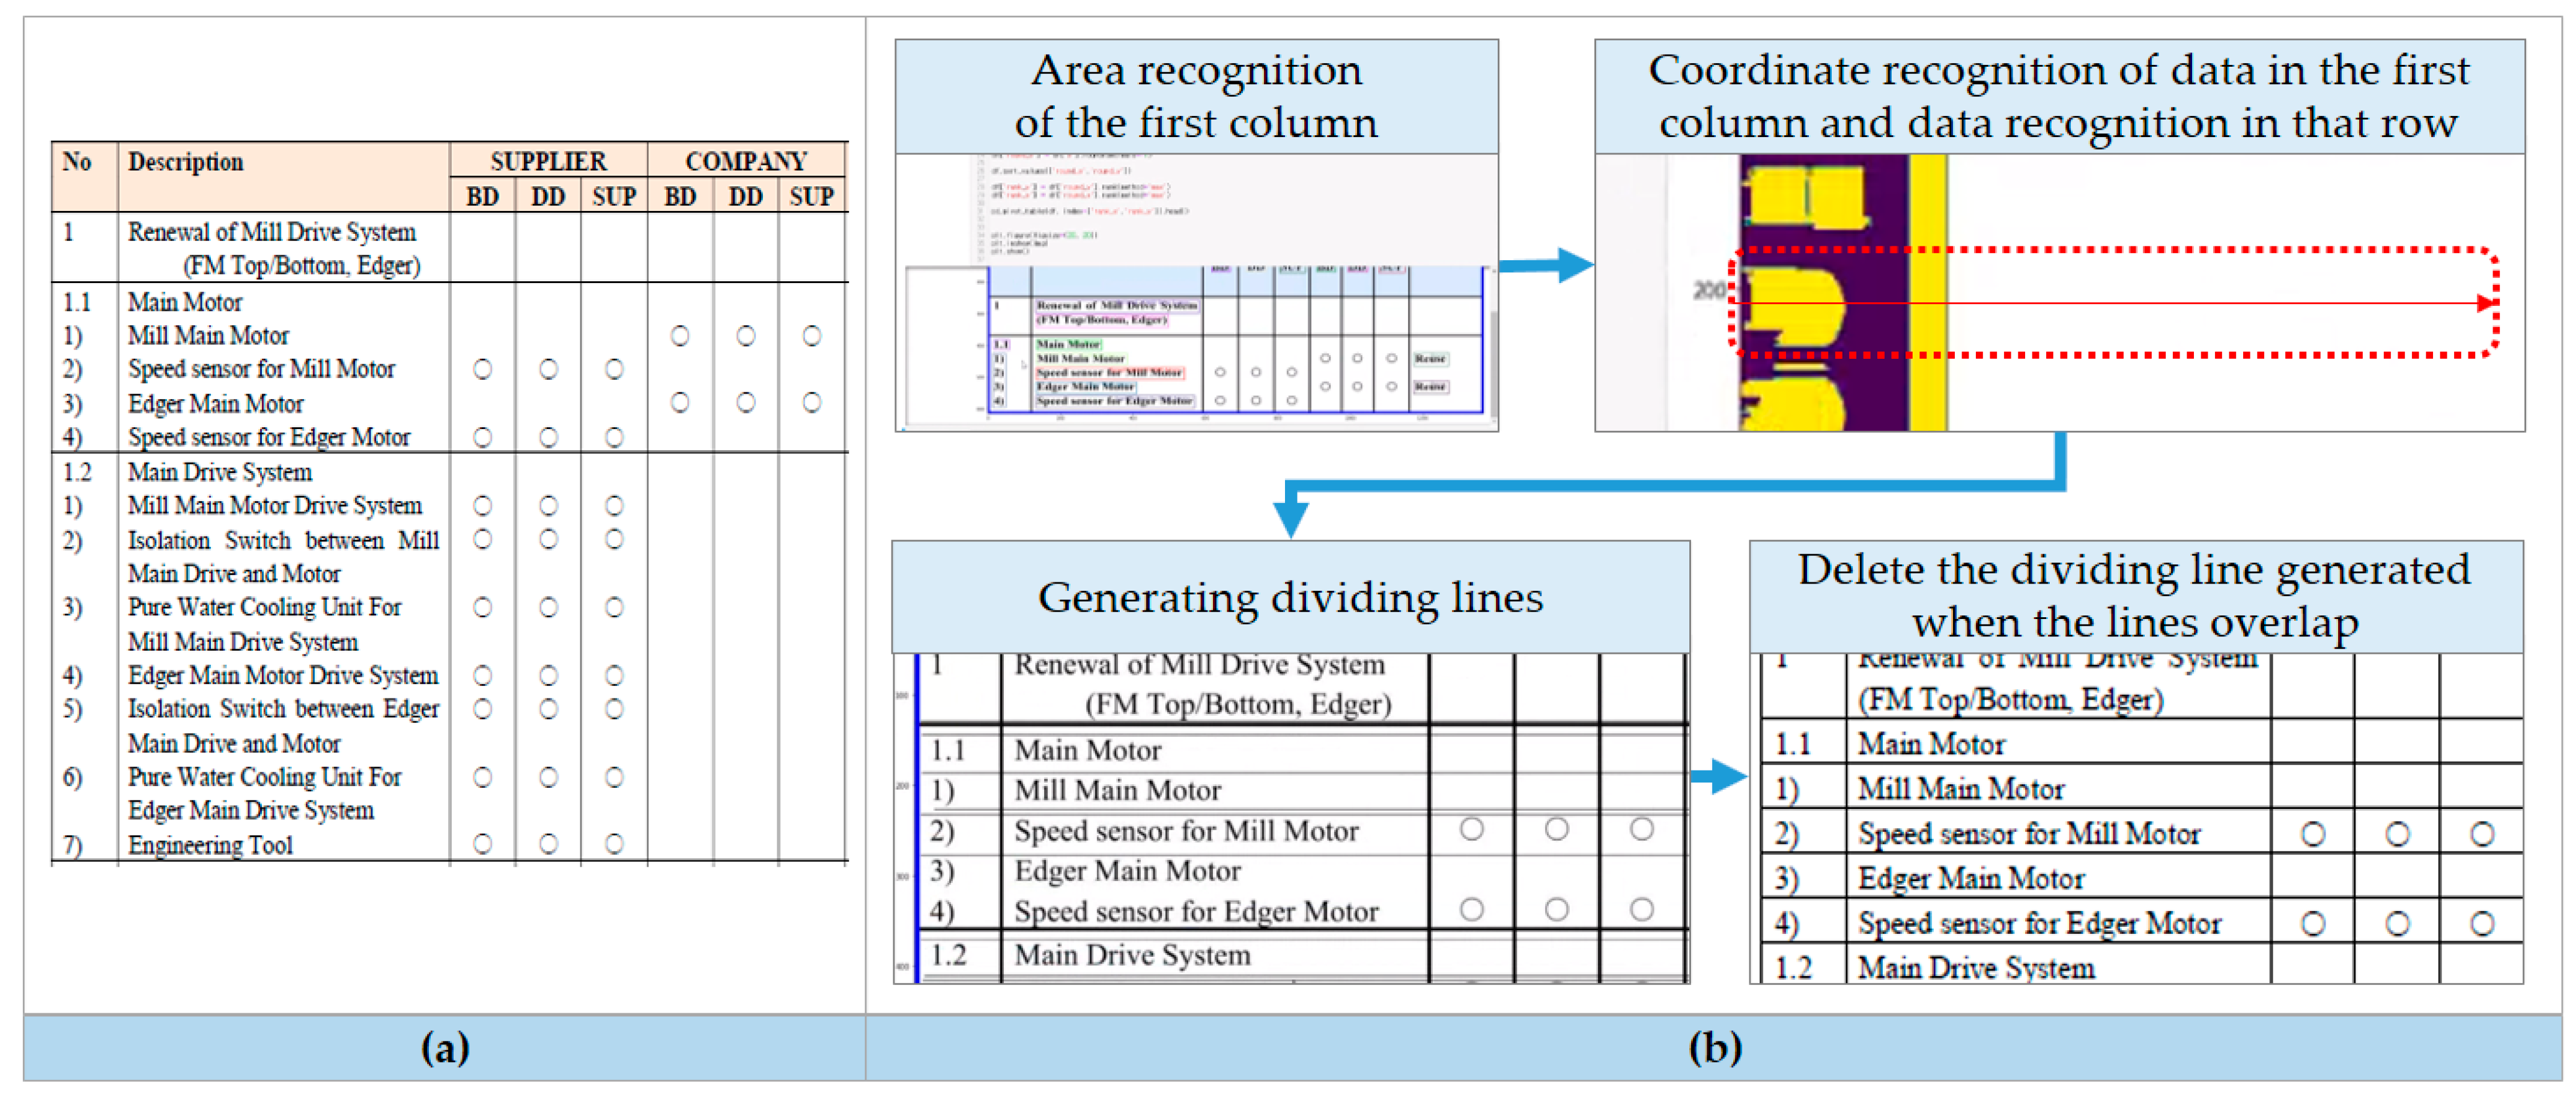
3.3.1. Table Recognition (TRC-R) Model

This section discusses a type of model that recognizes tables in portable document format (PDF). Figure 3 presents the entire process of the TRC-R model.
Prior to beginning the process, the user is required to upload the PDF document into the TRC-R model. In order to recognize the table in the uploaded document, the table’s structure was recognized first, then the text in the table was identified. The table structure recognition algorithm consists of five steps. First, preprocessing was performed to remove all text from a PDF document using GhostScript, a well-known interpreter for PDF. Next, a PDF document with text removed was converted to an image format. The main library used was OpenCV, which applied OCR technology to recognize the table’s structure. Then, image preprocessing was performed to increase the OCR recognition rate. Furthermore, it converted the original image in red, green, and blue (RGB) format into a binary image, which allowed the machine to judge the boundaries of the table in the photo. In addition, the noise of the image generated in the binary conversion process was removed through blur processing, and for errors such as holes and broken lines, morphology conversion was performed to clarify the area through simplification work. In the preprocessed image, the table area was detected by using the rules for line and vertex. As a result, it was able to recognize the coordinates in the image and the vertex where the lines in the table intersect. Lastly, it extracted the coordinates for each cell as well.
As shown in Figure 4a, when the internal dividing line is omitted from the input table, a separate dividing line is drawn to detect the table area. First, the data coordinates in the table’s first column were identified by the data of the row corresponding to the first recognized column. Then, a dividing line based on the recognized data was drawn. When the existing and dividing lines overlap, it was forcibly deleted to separate the table cells. Figure 4b presents the process of creating dividing lines.
After completing that process, Text recognition algorithm is then performed in three major steps. The main library used by this algorithm was PDFminer. After recognizing the text in the PDF file, it detected and identified the coordinates of the text. Then, it extracted the required text along with the coordinates. Additionally, all text and numbers in the recognized table are treated as unstructured text data.
The coordinates of the cells extracted by Table structure recognition algorithm were a pixel coordinate system with the origin at the upper left, the x coordinate increasing to the right, and the y coordinate increasing downward [37]. The coordinates of the text extracted by Text recognition algorithm were a PDF coordinate system with the lower left as the origin, the x coordinates increasing to the right, and the y coordinates increasing upwards [38]. Since these two coordinate systems read in different directions and have different units, they were unified into the PDF coordinate system through separate calculations. Based on the unified coordinate system, text and table structure were merged as well as saved in a database. The result of the TRC-R model applied through the web is the same as in Figure 5. The results can be extracted in formats such as comma-separated values (CSV), Excel files, and PDFs.

3.3.2. Table Comparison (TRC-C) Model

This section discusses the TRC-C model, which compares the table contents among the POs converted to the database via the TRC-R model. In addition, the tables of the scope of supply clauses were selected as PoC for the study. The entire TRC-C model process consists of two stages: matching and comparison. The first stage involves inputting the table’s data into the TRC-C model to compare. This input data can be table data recognized and stored in the database using the TRC-R model as described in Section 3.3.1. However, during the stage of developing the TRC-C model, the authors used an Excel file in which the contents of the table were directly and manually transferred by a person. The reason for using the manually worked file was that the comparison accuracy could not be measured if the TRC-R model output file was used as the TRC-C model input due to the TRC-R model’s recognition accuracy not being ensured. Figure 6 presents the process of the TRC-C model.
The owner and supplier may use different words for the same item on their POs. For example, owners use their own type of diction throughout decades of equipment operation. In addition, suppliers also use their own words through equipment development and contracts with other companies. As a result, although the items are the same, there is a difference in expression. These cases can be divided into three types.
  • Case 1: this is about whether to use abbreviations;
  • Case 2: this is the case when the order of words is changed;
  • Case 3: this is the case when some words are omitted.
Cases 1, 2, and 3 are for the same item, but the expressions are different, so a problem may occur when they are classified into different items. Thus, it was necessary to define synonyms for the same item in advance. To define them, the authors built a synonym database for the same item through collaboration with the owner’s 10th and 15th-year senior engineers. Table 3 displays examples of synonyms used by owners and suppliers.
The second stage is comparison. Before the comparison, the owner’s and supplier’s table data had to classify the same item through entity matching. The table data of the TRC-C model implied that the text data in the tables require comparison. Therefore, this study applied Ditto, an artificial neural network model, to perform entity matching. Ditto is an advanced model of pre-trained models, such as BERT and DistilBERT [39]. For improved performance, the training time was reduced by 5% compared to the initial Ditto model through the ability to enter relevant information, emphasize important details, summarize long strings, and only show essential information [40]. Ditto consists of a structure in which one linear layer is added to the pretrained language model to classify whether the two input contents are equal or not equal. The identity of the contents for the two entered entities is the training target, and OntoNotes 5 / GloVe Common Crawl was used as the training data [41]. The TRC-C model, to which Ditto was applied, was performed in four stages (see Figure 7a).
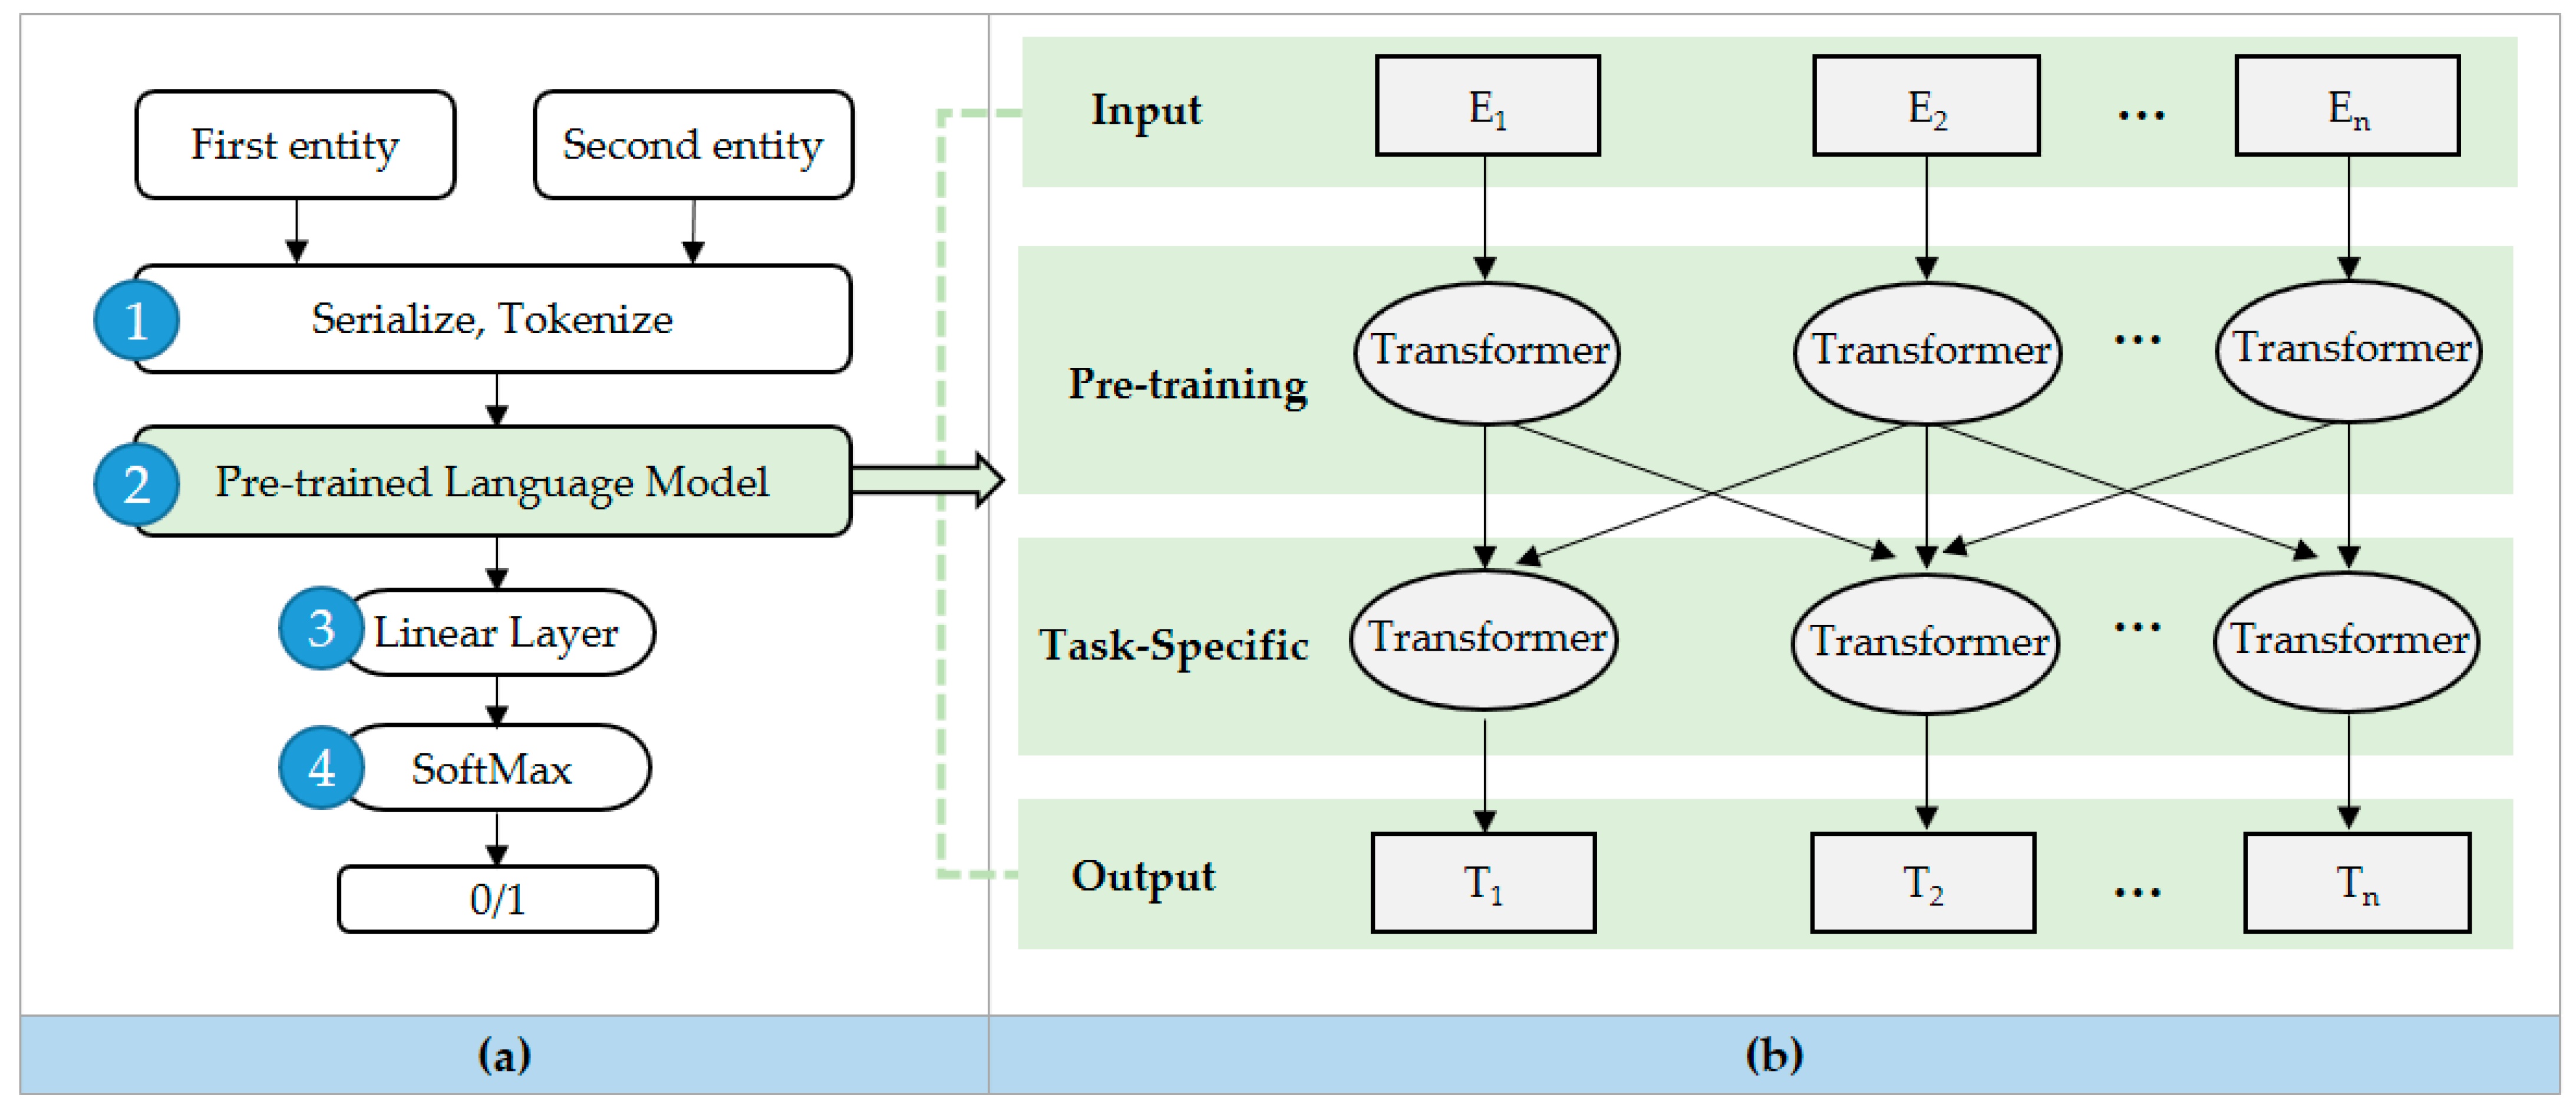
  • Performed classification to order through serializing the text of the input table data and tokenized the text data so that Ditto could process it word by word;
  • Randomly masked some tokens from the input data using a pretrained language model with an entity matching classifier added to the language model trained for regular text (see Figure 7b). The pretrained language model is performed on the same basis as the BERT model, which puts masked tokens in a transformer structure and predicts masked tokens by looking only at the context of the surrounding words [42];
  • Added linear layer and SoftMax layer for binary classification;
  • Finally, the two entities that were input through the training of Ditto were classified binary as true or false.
It was determined that a large amount of training data was needed to distinguish the same entity. However, due to the lack of datasets that exactly match the PoC equipment, this study leveraged the dataset of equipment most similar to the drive equipment that controls the motor’s output. Additionally, this study used the Wdc_computers_title_xlarge dataset, which is similar to the drive among WDC Product data. It also included 26 million cases of data collected from e-commerce websites. Of the total 68,461 sample data of 745 entities, 9690 was positive and 58,771 were negative samples set to configure the dataset [39]. Table 4 summarizes the training dataset for the TRC-R model, and the training data to test data ratio was chosen as 8-to-2.
The hyperparameter was set to improve the performance of Ditto. A hyperparameter is a value set directly by the user when modeling machine learning and is also a value predefined for the model’s favorable performance. A typical example would be the learning rate [43]. Epochs are defined as the number of times the model has been repeatedly trained once for the entire dataset through feed forwarding and backpropagation. In addition, the epochs of Ditto in this study amounted to 20. Batch size is the size of the data sample given for each batch. If there are problems learning the entire dataset in terms of system or time, then the dataset is trained by dividing it into a specific size. As a result, the size of the divided dataset becomes the batch size. Furthermore, the batch size of this study was 64. Optimizer is for optimizing parameters during learning. This study’s optimizer was Adam and was based on the first-order gradient. It is easy to implement and computationally efficient, and has few memory requirements [44]. The learning rate is a rate for converging to an appropriate value. If the value is low, it takes a long time to converge, and if it is high, it fluctuates near the minimum value or even deviates from preventing convergence. Therefore, in this study, 3 × 10⁻⁵ was applied as the learning rate. In addition, DistilBERT was applied as the language model because it could find the most natural word sequences. In addition, it reduced the size by up to 40 percent of the BERT and kept language comprehension ability at 97 percent as well as being 60 percent faster than the BERT [45]. Table 5 shows the hyperparameters applied to the TRC-C model.
The TRC-C model performs entity matching based on a trained Ditto and synonym database. In addition, it categorizes table data from owners and suppliers. Therefore, the authors compared the classified data for the same item. Furthermore, the TRC-C model is implemented in Python and tested on the web.

3.4. Critical Terms in General Conditions (CTGC) Module

The CTGC module detects specific risk clauses among the general conditions in the owner’s and supplier’s POs and compares the core content. The PoC target of this module is the performance guarantee clause and the schedule clause. The supplier must pass performance tests when delivering equipment to the owner. After passing this specific test, the supplier can receive a preliminary acceptance certificate (PAC) from the owner and complete their service [46,47]. The performance guarantee clause specifies the minimum performance that must be guaranteed to the equipment in order to pass the performance test. If this test is failed, the supplier must supplement the equipment until the minimum performance requirements are met. If some complementary attempts do not meet these minimum performance requirements, the supplier must indemnify the owner for liquidated damages of performance (PLD). The schedule clause specifies the deadline when the supplier should deliver the equipment to the owner. If the contract’s scope of supply includes installation and construction services in the supplier, then the deadline for this is also specified. In some cases, deadlines for each critical milestone may be specified as well. If the supplier does not meet this deadline, they must indemnify the owner for delayed liquidated damages (DLD). In addition, PAC issuance may be delayed in the process of complementing the performance of the equipment to pass the performance test. This often fails to meet the final delivery date specified in the contract and can lead to DLD. Thus, the clauses chosen as PoC can result in contractual risk and require special attention when reviewed.
The entire process of the CTGC module is the same as in Figure 8. Additionally, it consists of the CTGC-E model and the CTGC-C model for extracting and comparing important periods. Further details continue in Section 3.4.1 and 3.4.2, respectively.

3.4.1. Critical Terms Extraction (CTGC-E) Model

The CTGC-E model extracts critical terms to detect risk clauses in POs. Before extracting critical terms, the document must be preprocessed in a machine-processable format. All POs collected from the owner are PDFs. PDFs are widely used because they can be shared on almost any operating system, and the fonts, images, and document formats of the original documents are preserved. In addition, it is difficult to modify the document and it has high security compared to other formats. Therefore, it is frequently used when distributing materials at public institutions and research institutes. The POs dealt with in this research also have the character of a contract and are often in PDF. However, the information in a PDF document is composed of an untagged internal structure, making it unsuitable for machines to read. In addition, information on the internal structure of a PDF is not well-known, which causes difficulties in extracting information from the PDF for detailed analysis [48]. This study used PDFminer, a Python library that detects information about the layout and structure of PDFs. Parsing was performed to extract the targeted data from the document and divided it into units that could be analyzed. First, the data classified as the text was extracted from the PDF through layout detection and converted into a text file. By converting to a text file, a series of character strings that were previously combinations were translated into machine language, thus, making it easy for machines to handle. In this process, PDFminer extracted different information, such as page, position coordinates, size, and font, in a tree structure for each text data [49]. The page and location information of extracted text data is used later when highlighting the target clause in the original PDF document.
All POs were reviewed and collected to allow the machine to extract the critical terms of the PoC clauses from the preprocessed input data. Then, work was proceeded to find and generalize common patterns. The performance guarantee clause generally requires a certain level of availability during the test duration in which the performance test is conducted. Availability is calculated as the ratio of uptime to planned production time and is one of the indicators that measures the efficiency of the equipment [50]. The schedule clause generally provides a specific date or period for delivery, installation, or construction. It was found that there was a difference in the unit and expression method for each owner and supplier. For example, some POs used a pattern such as ‘2021.09.10′, while other POs expressed the date in various ways, such as ‘September 10th, 2021′ or ‘21.09.10′. Another example is the performance guarantee clause as it may use hour or day units, and in the case of the schedule clause, the method of expressing the date was different as well. Based on the collected data, the authors created a database for all possible cases for units and the expression methods. In addition, the date expression method provided by the widely used Excel program has been added to improve utilization. This study designed a matching rule to detect PoC clauses by utilizing the matching filter database constructed for the typical pattern and expression of each PoC found through the review of POs. Unlike general IE, which simply extracts keywords, this matching rule identifies and extracts text that indicate a pattern. The CTGC module applied spaCy, an open source library that specializes in NLP [51]. Furthermore, this model extracts only data that conform to the matching rule belonging to the rule-based IE for text. Among the various functions provided by spaCy, the authors used Matcher, a class that matches tokens based on pattern rules. Since both PoCs contain numeric data, only the sentences containing numeric data were selected from the preprocessed data. After that, specific sentences that match the matching rule were extracted by utilizing the matching filter database constructed earlier.

3.4.2. Critical Terms Comparison (CTGC-C) Model

In order to compare the extracted sentences, normalization, which is a work to unify the expression method of critical terms, preceded the comparison. In addition, normalization contains functions that the unit data identified from the extracted data and then unified the information into the smallest unit. Additionally, after grasping the date expression type of the extracted data, an algorithm that identifies each year, month, and day converted the expression into one representative format, “yyyy-mm-dd”. An example of unit unification of normalization is when the test duration is displayed as “3 days”. After identifying the unit “days”, it is calculated according to the minimum unit “hours” and converted to “72 h”. An example of unifying the date expression type of normalization is when year, month, and day are identified as 22, 02, and 14, respectively, in the date data expressed in “22.02.14”. Then, the expression type is converted to the representative format, “2022-02-14”.
For critical terms that have been normalized, the authors used a rule named critical terms comparator to distinguish between entities of the same item and compare their values. For example, the date value extracted and normalized from the owner’s and supplier’s PO was recognized as a common entity called date, then the values were compared. Since the CTGC-C model performs relatively small entity matching in comparison to the TRC-C model, a rule-based algorithm is used rather than the Ditto model (machine learning). Furthermore, using the Ditto model for relatively simple entity matching is disadvantageous in regards to model size, processing speed, and usability.
Users can upload the PO that they want to be analyzed to a web and check the results with just a few clicks. Figure 9 is a screenshot of the web showing the results of the analysis of the performance guarantee clause by the CTGC module. In addition, the analysis results of the schedule clause were also made to appear in a similar form. Some parts of the POs used as samples shown in Figure 9 were hidden for security reasons. The results were output in tabular format so that the results could be checked briefly. Furthermore, sentences that initially match the target data are highlighted and displayed, preventing the user from finding the target data in the document separately.

4. Performance Evaluation and Validation

In this section, the authors conducted tests to quantitatively evaluate the performance level of each module to confirm the practical applicability of the PORAS. Then, validations were performed based on the test results. The PORAS is a comprehensive framework consisting of four models with different purposes for analyzing the risk of POs. Therefore, the PORAS was designed so that the user can select and use the model according to their purpose. However, this study has a limitation in not being able to measure the performance of the entire PORAS as a single value because the performance was evaluated by designing different validation methodologies suitable for each model. The validation method was considered by classifying it into those corresponding to the rule-based AI algorithm and those corresponding to machine learning. The performance evaluation indexes commonly used to validate rule-based AI algorithms are the accuracy, precision, recall, and F1 score. In order to measure them, the confusion matrix was modified and utilized according to this study [52,53,54]. For transformation and utilization of the confusion matrix, it is necessary to define four counts suitable for each validation. The four counts consist of true positive (TP), true negative (TN), false positive (FP), and false negative (FN). TP and TN are ground truths because TP occurs when the model classifies an accurate value as true and TN occurs when the model classifies a false value as false. On the other hand, FP and FN are errors because they classify false as true and true as false. Accuracy is a commonly used performance evaluation index for validating machine learning algorithms [55,56]. The accuracy calculation formula was adjusted and utilized according to this study as well.

4.1. Performance Evaluation and Validation for the TRC-R Model

4.1.1. Setup for Performance Evaluation

This section details the evaluation of the performance of the TRC-R model, which detects a table in a document with mixed tables and general text. Additionally, the TRC-R model also accurately recognizes the structure of the table and the text inside the table. The test data are a table of the scope of supply and detail specification clauses selected from T1, T2, and T3 to PoC, shown in Table 2. The page containing the target table was manually extracted by a person and used as input data for the test. The performance evaluation was conducted through the developed web and the output of the TRC-R model was directly compared to the original by a person.
Since the TRC-R model is a rule-based AI algorithm, the accuracy, precision, recall, and F1 score were derived using the confusion matrix to evaluate the performance. It is important that the TRC-R model accurately recognizes both the structure of the table and the internal text. Even if the table’s structure is recognized correctly, the internal text may be misrecognized, and vice versa. However, as reviewed in Section 2.1, most of the precedent research did not consider recognizing the contents of the data inside the tables. It did not present an evaluation method that comprehensively considered the table’s structure and internal data. Therefore, in this paper, based on the performance evaluation results, the performance of the table structure’s recognition and internal data recognition were evaluated separately. The overall recognition performance was evaluated by averaging the table structure’s recognition and internal data recognition. After detecting the table in the entire document, it extracted the coordinates of the vertices of each cell and then recognized the entire table. Therefore, the performance of table structure recognition was validated by whether the cell’s vertices were extracted. The four counts and explanation for this are as follows:
  • TP: cases where the vertices of existing cells are extracted;
  • TN: cases extracted as none for cases without vertices (it can occur in merged cells);
  • FP: cases in which vertices of cells that did not exist were extracted (it can occur in merged cells);
  • FN: cases where there was a vertex of a cell, but it was not extracted.
The four counts and descriptions for validation of internal data recognition performance are as follows:
  • TP: cases in which the data inside the cell were correctly extracted;
  • TN: cases extracted as none for cases where there were no data inside the cell;
  • FP: cases where there were no data inside the cell, but other data were extracted;
  • FN: cases where there were data inside the cell, but other data were extracted.
Validation was performed based on the defined four counts. For the explanation and formula of accuracy, precision, recall, and F1 score, refer to the study of Sokolova and Lapalme [57]. Accuracy is calculated as the ratio of ground truths (TP, TN) among the total results, as shown in Equation (1). It is the most intuitive way to assess the effectiveness of a model. However, it may not be a good performance measure if there is a bias in the domain data.
Accuracy = TP + TN TP + TN + FP + FN ,
Precision is calculated as shown in Equation (2) and is the ratio of the truths among predicted positives.
Precision = TP TP + FP   ,
Recall, also known as sensitivity, is calculated as illustrated in Equation (3). It is the ratio of the predicted positives among the truths.
Recall = TP TP + FN   ,
The F1 score is the harmonic mean of precision and recall. It is calculated as displayed in Equation (4).
F 1   score = 2   ×   Precision   ×   Recall Precision + Recall  

4.1.2. Validation and Discussion

In order to validate the performance of table structure recognition, the output of the TRC-R model was compared to the original, and the cases corresponding to the four counts defined above were included. Validation was performed based on four counts. As a result of validating the performance of table structure recognition, the accuracy was measured to be 96.5 percent. The fatal error in recognizing the structure of a table is to output the merged cells separately without recognizing them. Merged cells are typically used to write duplicate content for multiple items. Misunderstandings can occur if the contents are not outputting in a merged form and the contents are outputted to only one cell among the many divided cells. Therefore, FP was a fatal error, and the precision considering FP was 99.2%. Compared to the commercial software described in Section 2.1, the TRC-R model resolved most of the errors that occurred in the cell merging of commercial software. Moreover, in the case of the TRC-R model, there were 345 merged cells of TN and FP, of which only 21 errors were found. The TRC-R model was solved by making rules for errors that occurred in commercial software, but it still had 21 errors that were not defined through the rules. This is a limitation of the rule-based algorithm, and to solve this problem, the algorithm must be reinforced by analyzing various cases. In addition, recall, the trade-off relationship with precision, also showed a high value of 96.8 percent. The F1 score was also well-measured at 98.0 percent because the precision and recall were not biased. In summary, all evaluation indices were measured uniformly higher than 95 percent.
Next, to validate the performance of internal data recognition, the TRC-R model’s output was compared to the original, and the cases corresponding to the four counts defined above were included. Furthermore, evaluation indexes were derived based on them. As a result of validating the performance of internal data recognition, the accuracy was measured to be 96.0 percent. When recognizing the text in the table, it is essential to recognize it accurately as a whole to reduce both FP and FN errors. In addition, it is crucial that both the precision considering FP and the recall value considering FN are high. The precision was 97.7 percent, and the recall was 93.8 percent, resulting in high values. The F1 score considering these two values simultaneously also showed a high value of 95.7 percent.
The overall performance of the TRC-R model was evaluated by averaging the recognition performance for the table structure and the data inside the table. The accuracy was measured to be 96.3 percent, and the F1 score was measured to be 96.9 percent. If an error occurs, it is analyzed as a case not specified in the rules in the TRC-R model. Additionally, the performance is expected to be further improved when rules are added or supplemented. Table 6 summarizes the TRC-R model’s performance evaluation and validation.

4.2. Performance Evaluation and Validation for the TRC-C Model

4.2.1. Setup for Performance Evaluation

In order to evaluate the performance of the TRC-C model, the authors checked the accuracy by matching and comparing the same items written through their own expression method in the owner’s and suppliers’ tables. The test data were tables of the scope of supply clause in the POs of the owner and suppliers. Figure 10a was written by the owner, and the term ‘company’ means the owner. Figure 10b was written by the supplier, and the term ‘constructor’ implies that the particular scope is to be done through a separate contract with the constructor. In general, the word ‘description’ concerns the name of the equipment, and ‘remarks’ refers to matters that need to be attended. ‘BD’ stands for basic design, ‘DD’ is used to signify detailed design, and ‘SUP’ refers to supply, meaning equipment design and responsibility for each supply stage. An item marked ‘O’ means that the owner, constructor, or supplier is responsible for supplying it. Figure 10 is an example of the scope of supply clause for a drive of the owner’s and suppliers’ POs.
The results of the TRC-C model are shown in four cases, as is depicted in Table 7. ‘Comparison Result (Item R&R)’ indicates whether the supply categories of the scope of supply are equal, while ‘Comparison Result (Description)’ indicates whether the contents of the supplies match.
  • Case 1: The data of the owner and the supplier match. ‘Comparison Results (Item R&R, Description)’ are all written the same and it can be seen that the categories and contents of the supply of the main motor are the same;
  • Case 2: The owner’s and the supplier’s data were not identical expressions but matched in synonyms. This result occurred when they were classified and matched by the same entity through the synonyms database described in Section 3.3.2. ‘Comparison Results (Item R&R, Description)’ are all written as the same and it can be seen that the categories and contents of the supply of the main motor are the same;
  • Case 3: It was on the owner’s table but not on the supplier’s table. Looking at Table 7, the same item was not found in the supplier’s table for the ‘Switchgear & Panel’ item as in the owner’s table and an error occurred that printed ‘Hardware’. Therefore, ‘Text Mismatch’ was displayed in ‘Comparison Result (Description)’ so that the engineer in charge could reconfirm it;
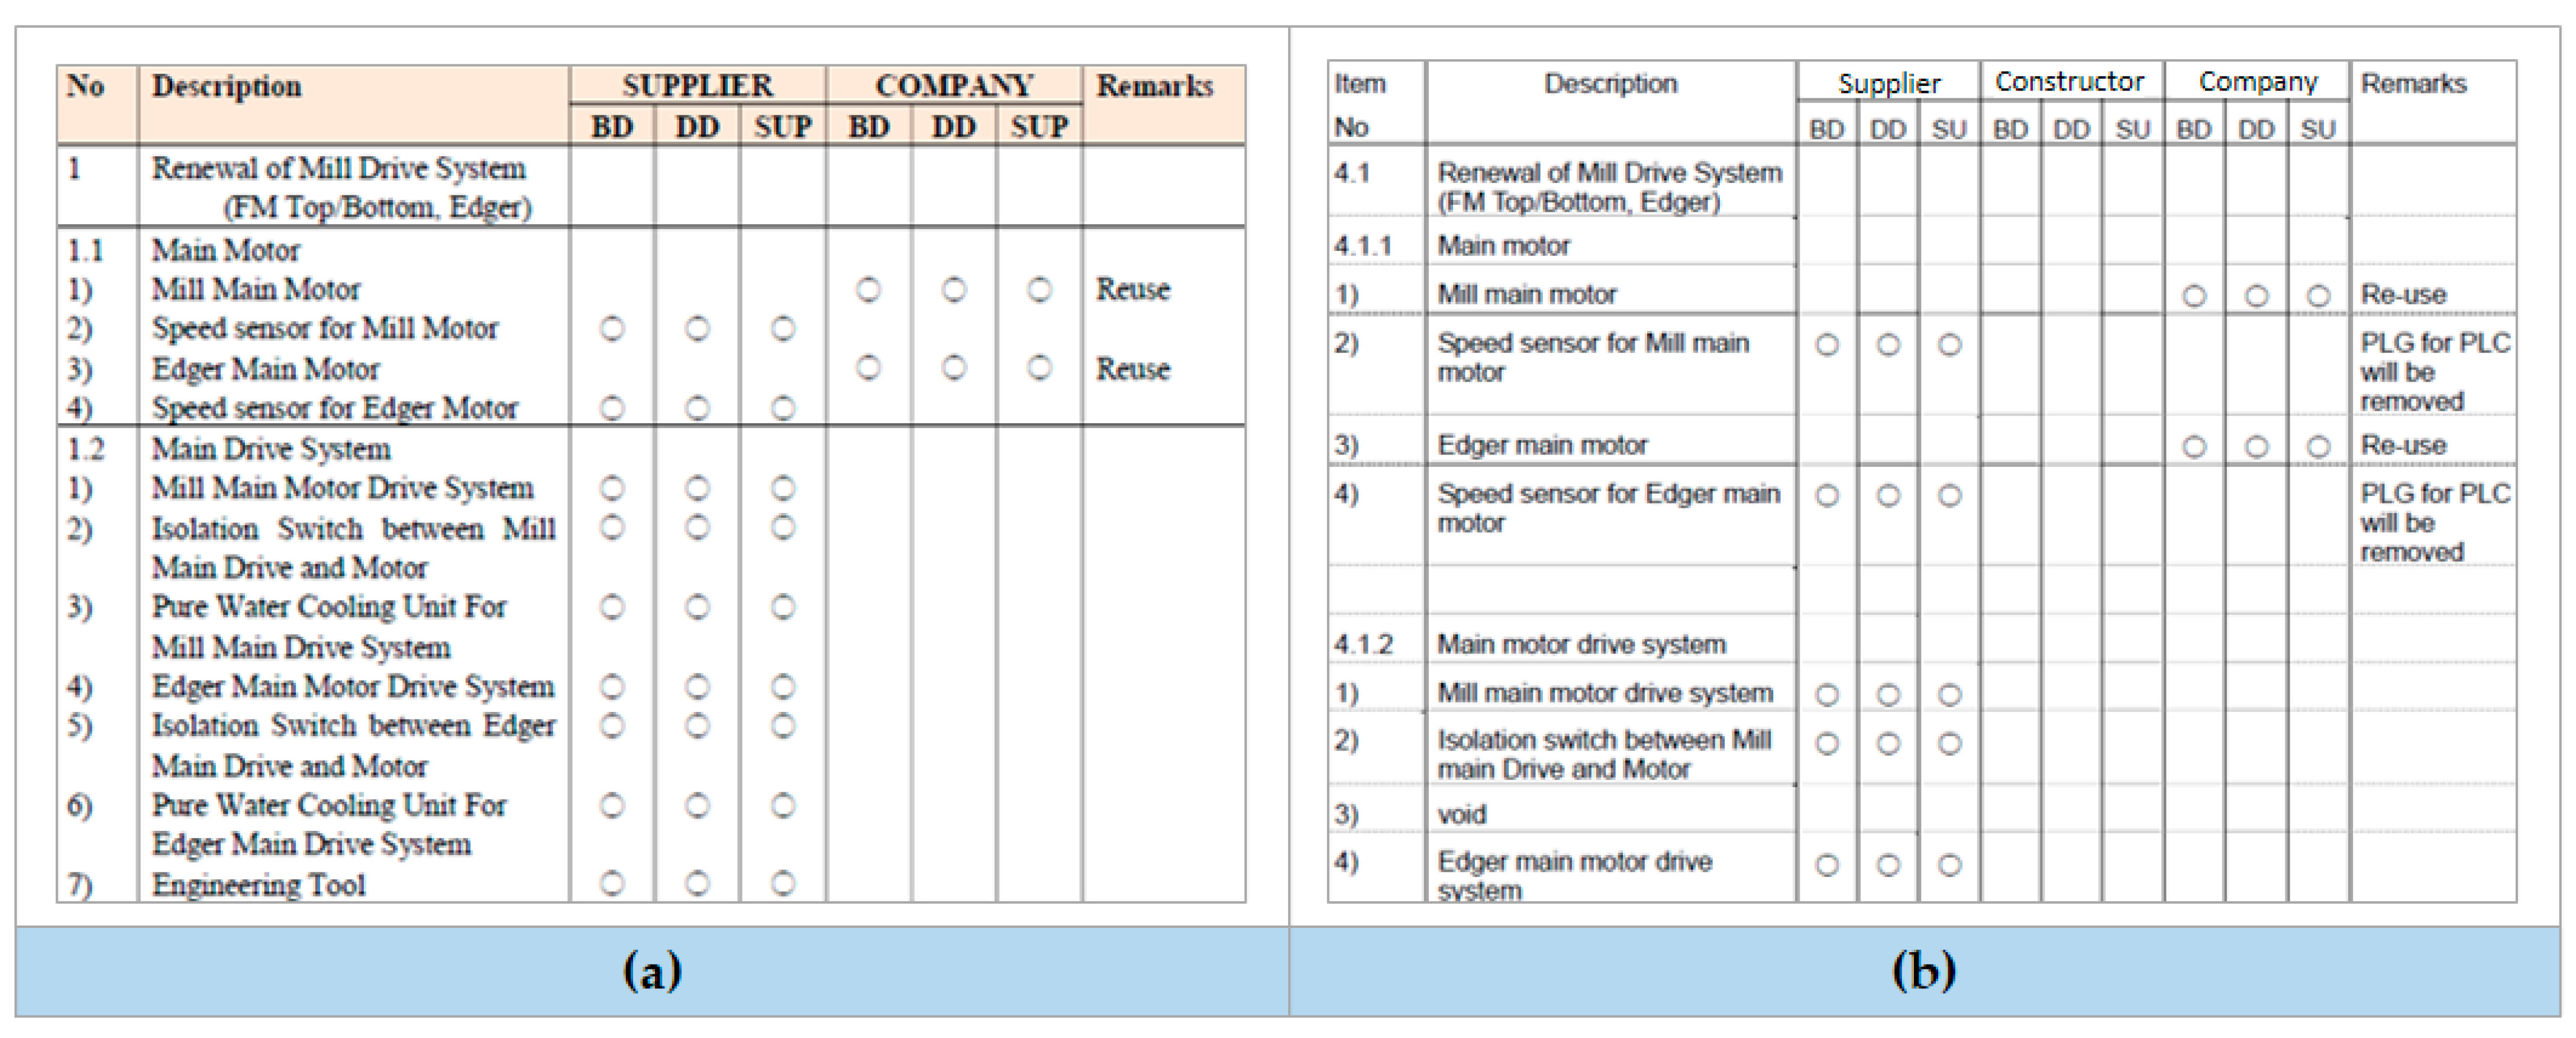
  • Case 4: The supplier and owner created it differently for ‘Comparison Item R&R’ by adding another column, ‘Constructor’. The supplier does not supply the relevant item but supplies it through a separate constructor. Therefore, the owner’s confirmation is needed.
In order to validate the TRC-C model, the accuracy was measured. Accuracy is the ratio of the correct answer among the total results [56]. The results of the TRC-C model were reviewed by 10th- and 15th-year engineers. The case where the result judged by the expert and the analysis result of the TRC-C model are the same was defined as a correct answer, and the accuracy was calculated as shown in Equation (5).
Accuracy = Number   of   the   correct   answer Total   number   of   the   results   of   TRC C    

4.2.2. Validation and Discussion

The tables of the scope of supply selected as PoC to evaluate the performance of the TRC-C model have a total of 41 items. As a result of the engineers checking the results of the TRC-C model for validation, only 36 items out of a total of 41 items were correctly compared. Therefore, the accuracy was 87.8 percent (see Table 8).
The accuracy of the TRC-C model was relatively low due to the training result of preferentially matching entities judged to have high similarities. Therefore, it was analyzed that expressions with few similarities are not classified as the same entity. Table 9 shows the mismatching items of the TRC-C model. For example, the item with ‘Process Computer Modification’ written in the owner’s table matched the item with ‘Modification of PLC System’ in the supplier’s table. This is because the TRC-C model determined that the phrase ‘modification’ was the same and therefore, the process computer and the PLC system were similar. In the other case, the item with ‘PLC Modification’ in the owner’s table matched the item with ‘Modification of Supervisory System’ in the supplier’s table. It is analyzed that the owner’s table and the supplier’s table were matched one-to-one, the ‘Modification of PLC system’ was preferentially matched, and as a result, the ‘Modification of Supervisory System’ item appeared.
With the TRC-C model, it is possible to shorten the PO review time in preparation for the examination only with the naked eye. In addition, the risk of proceeding to a contract with omissions or errors occurring can be reduced. In Case 3 of Table 7, if the answer is incorrect, text mismatching is displayed; thus, the engineer in charge needs to reconsider only the relevant item. However, the mismatching occurred in 5 of the 41 items. Therefore, there is a limitation in that additional human validation of the TRC-C model’s results cannot be omitted. Overall, research on improving the accuracy of the TRC-C model is required by enhancing the model and adding training data in the future.

4.3. Performance Evaluation and Validation for the CTGC-E Model

4.3.1. Setup for Performance Evaluation

The performance evaluation of the CTGC-E model concerns how accurately the CTGC-E model extracts the target clause from the entire document. The CTGC-C model, which compares general conditions, is a simple and direct comparison of the extracted numerical data. Therefore, the accuracy was close to 100 percent, which is incorrect, and as a result, the authors did not provide a separate explanation. Test data are T1, T2, and T3 shown in Table 2, and PoC clauses are the performance guarantee and schedule clauses. The test was performed on the developed web and it counted the number of words corresponding to the four counts defined earlier in the output of the CTGC-E model and the original file. Among all the words in the PO, the targets for the performance guarantee clause were pattern value (e.g., availability, test duration), target numeric value, and unit (e.g., percent, hour, day). The target to be extracted for the schedule clause was the numeric value corresponding to the date pattern. In other words, the CTGC-E model detects and extracts target data for the performance guarantee clauses and schedule clauses selected as PoC from all POs. The outputs of the CTGC-E model showed a list of target values and comparison results for the PoC clauses extracted from the entire document, as shown in Figure 9.
The four counts for evaluating the performance of the CTGC-E model are as follows.
  • TP: cases where the targeted value of the PoC clause in the PO was correctly extracted;
  • TN: cases that did not extract anything that was not the targeted value of the PoC clause in the PO;
  • FP: cases where a value different from the target value of the PoC clause in the PO was extracted incorrectly;
  • FN: cases that did not extract the targeted value of the PoC clause within the PO.
The quantitative evaluation of the CTGC-E model’s performance was based on the four counts. Accuracy, precision, and recall were applied as defined in Section 4.1.2 and followed Equations (1), (2) and (3), respectively. However, in the case of validation for the CTGC-E model, the data to be extracted was unbalanced. Thus, the Fβ score, a generalization of the F1 score, was applied. The Fβ score was calculated using Equation (6) [58,59].
F β   score = ( 1 + β 2 )   ×   Precision   ×   Recall β 2 * Precision + Recall  

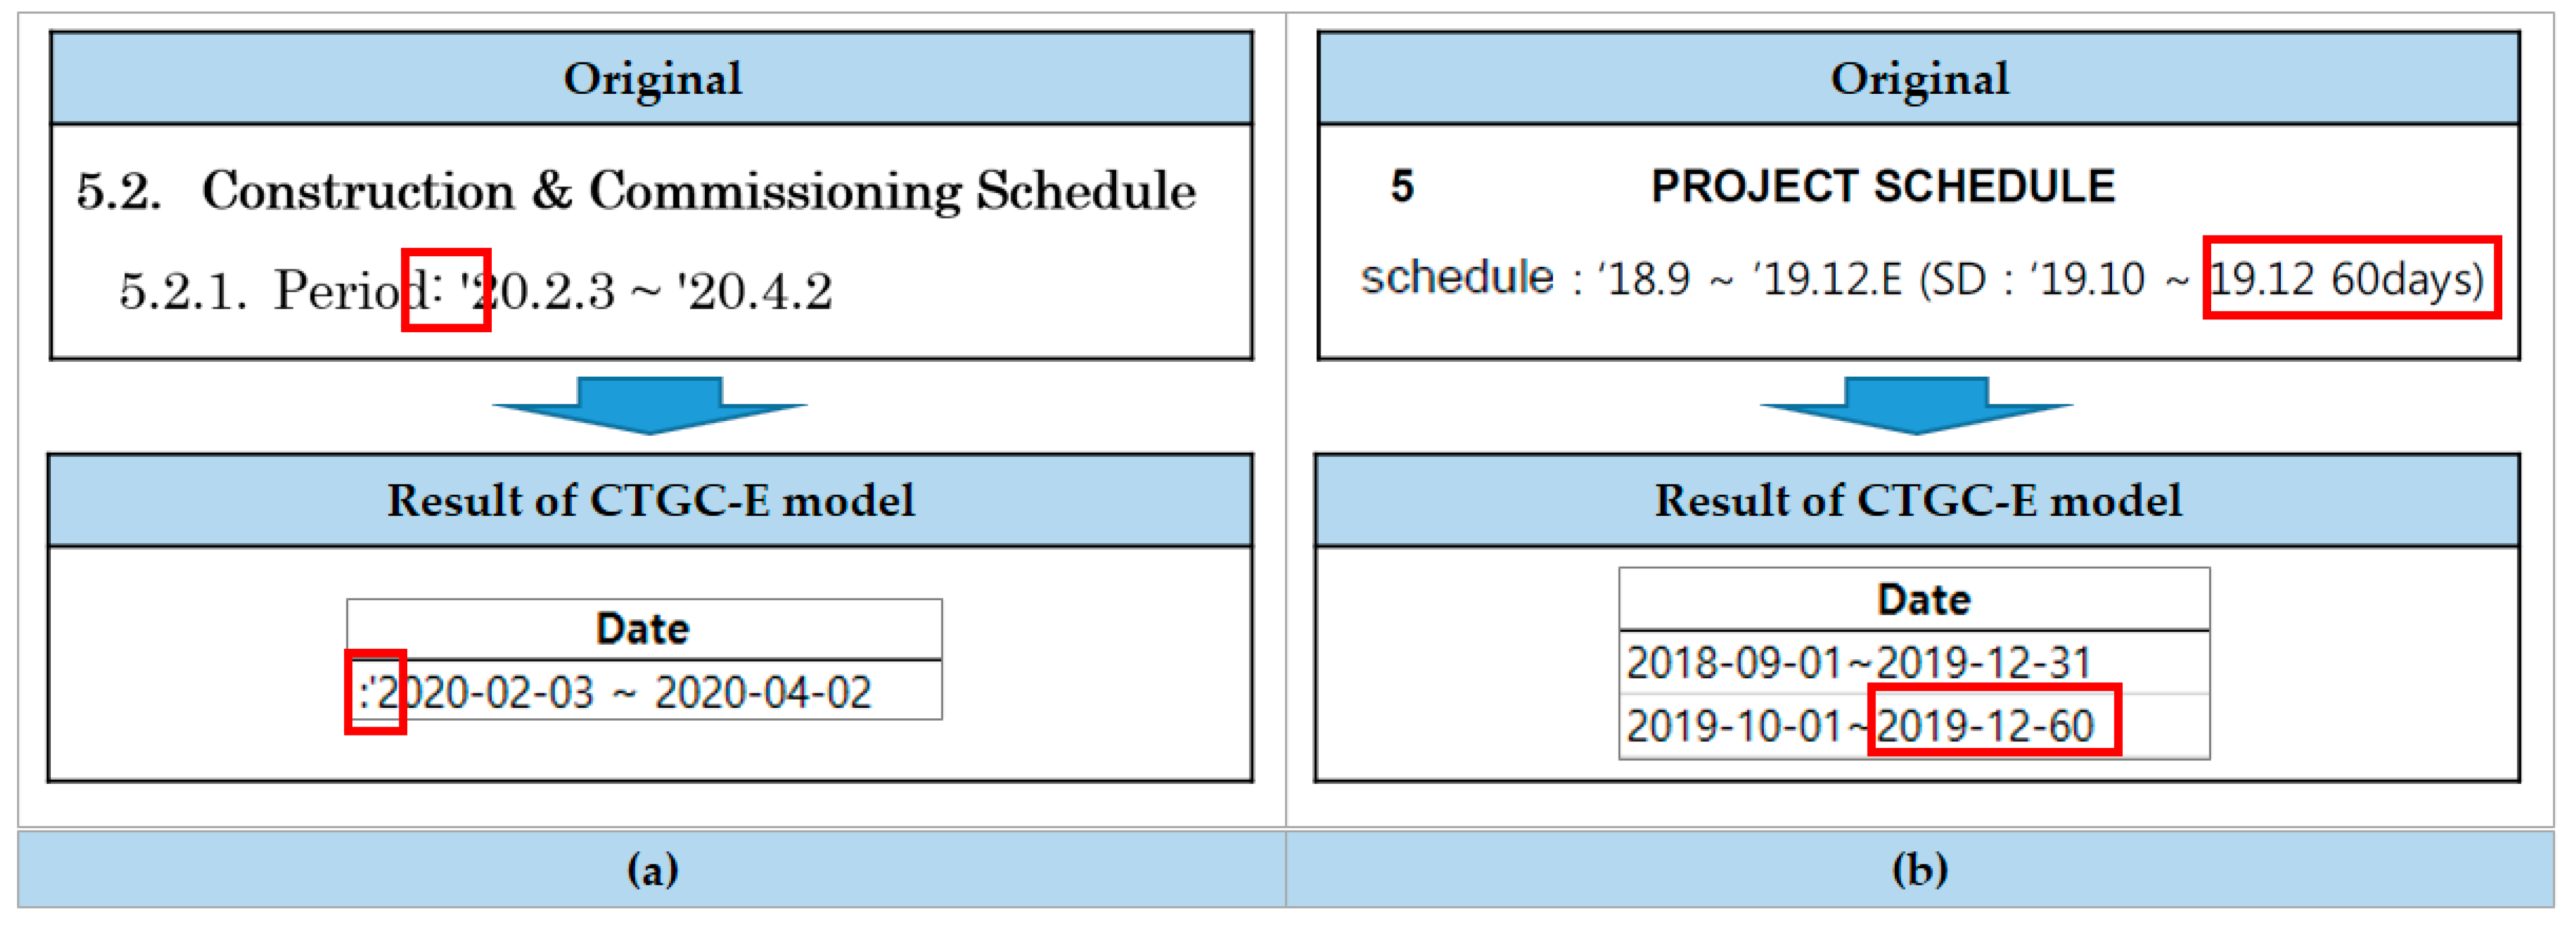
4.3.2. Validation and Discussion

As a result, the accuracy of the CTGC-E model was 99.9 percent. Accuracy is an evaluation index that considers the case of the ground truths (TP, TN) and can evaluate the model performance most intuitively. However, as mentioned earlier, accuracy may not be suitable for cases like the performance evaluation for the CTGC-E model, where the data domain is biased. This was the reason why precision and recall were 68.3 percent and 82.4 percent, respectively, which was significantly different from accuracy. The data domain is heavily biased because the CTGC-E model extracted only a small part of all of the words in the entered PO. The next thing to consider was what the fatal error was. For the CTGC-E model, all of the values needed to extract were related to core risk, so an unextracted FN was the fatal error. Therefore, it was important to check the recall value considering the FN case, and the recall value was evaluated as 82.35 percent. The next major error was the case of FP, which incorrectly extracts a value other than the target value. The errors of FN occurred only for the schedule clause and not for the performance guarantee clause. The FN errors occurred when data that should not be extracted around the target value were extracted because the data were not completely purified during the preprocessing process. Figure 11 shows an example of typical errors of the CTGC-E model. Figure 11a shows the case of extracting colon (:) or apostrophe (’). Meanwhile, Figure 11b illustrates the error in recognizing a number that is not a date as a date. The precision value considering these FP errors was 68.3 percent. Because FP errors can affect the comparison results, it is necessary to improve the model to increase the refinement accuracy in the data preprocessing process.
Finally, it was important to check the recall value considering the case of FN. The recall value was 82.35 percent, which could be considered to be a good performance. Furthermore, if the data are biased and require emphasis on certain values as described above, the Fβ score should be used. If the recall needs to be emphasized, like the CTGC-E model, use β > 1 and the F2 score. Therefore, the F2 score was calculated instead of the F1 score, and the value was confirmed to be 79.1 percent. If the matching filter database is complemented by collecting more POs, it is expected to improve the performance of matching rules directly related to the performance of the CTGC-E model. Table 10 summarizes the performance validation of the CTGC-E model.

5. Conclusions and Future Works

5.1. Conclusions and Contributions

This study developed the PORAS to extract and compare risk clauses between POs during the investment of plant equipment. Based on discussions with experts, the authors selected the following four provisions for PoC to be considered with the utmost care in POs: scope of supply, detail specification, performance guarantee, and schedule. This study was developed separately in the TRC module, which recognizes and compares tables, and the CTGC module, which extracts and compares core risk clauses expressed in general text throughout the document. Furthermore, this paper includes a discussion of the TRC module divided into two models: the TRC-R model and the TRC-C model. First, the TRC-R model recognized the table structure and internal text separately, then proceeded with the integration process. Therefore, the TRC-R model has novelty in that it recognizes the table structure and the internal text synthetically, unlike the similar studies reviewed in Section 2.1. The validation of the TRC-R model was divided into recognition of the table structure and recognition of the text from the table. As a result of validating the performance of the table structure recognition, it was confirmed that the F1 score was 98.0 percent. Based on the validation of the performance of table text recognition, it was confirmed that the F1 score was 95.7 percent. The overall TRC-R model’s performance, on average, was rated 96.9 percent for the F1 score. Second, the purpose of the TRC-C model was to find and compare the same items through entity matching with two tables that express the same content differently. As a result of evaluating the performance of the TRC-C model, it was confirmed that the accuracy was 87.8 percent. The process of analyzing tables is fully provided by proposing a method for recognizing and comparing tables.
The CTGC module is used to find critical terms related to risk clauses throughout a document. It is also utilized to extract and compare core content. Based on the POs collected in this study, the authors grasped the typical pattern of the targeted clauses, created matching rules, and extracted the PoC clauses. The extracted data were normalized through the same unit and expression, then the core values were compared through entity matching and stored in the database. According to the performance evaluation of the CTGC-E model, considering the data-biased situation, the F2 score was 79.1 percent. As a result, performance improvement is required by collecting additional POs to supplement the matching rules. All the modules in the PORAS have been developed for use on the web, and each model’s analysis results are visualized for the user’s convenience. The authors also developed and made it possible to extract the results in various formats. The CTGC-E model is significant as it proposes a new method for risk management by providing the results of analyzing risk clauses using AI in steelworks’ purchasing and procurement process.
The application of an AI-based automatic risk detection solution through the PORAS is expected to be helpful in shortening the examination time for engineers. In addition, it can assist in reducing the workload since it automatically extracts the clauses that need to be intensively examined when investing in plant equipment and presents the comparison results. It takes approximately ten minutes to acquire the results from both modules. Although the PORAS does not currently provide analysis results for all clauses in a document, it supports users’ decision making by quickly and efficiently delivering results for the four most critical clauses and PoC, in comparison to human review. Furthermore, it can eliminate not all but most contractual risks, such as change orders and claims, and improve work accuracy by preventing omissions and errors that can occur when people review. Thus, it is beneficial to both plant owners and suppliers because the PORAS can increase the consistency and accuracy of detecting existing and potential risks in POs. Moreover, it can save time and workforce. In addition, it is possible to implement a sustainable and future-oriented procurement process in steel plant operation by providing groundbreaking solutions through automation of the existing manual review method. The table recognition technology developed through this study is expected to be utilized in research to digitize data, such as hard copies and PDFs, which are commonly used in engineering. It can also be leveraged to achieve the full digitization of technical documents, including tables and text. As a result, it can enable a paperless office to implement sustainable engineering processes. Although the PORAS was developed based on PO for steel plants, customization of some algorithms allows them to be adapted to other types of equipment as well. Therefore, it can be utilized in other industrial plants, such as petroleum, non-ferrous metals, chemical engineering, and other manufacturing industries.

5.2. Limitations and Future Works

Discussions on the limitations of this research and further research were created for each module as follows. In addition, the following limitations to the TRC module are discussed as well. First, the current TRC module needs to separately input only the pages that the table user wants to recognize. Additionally, since it can only recognize the table at the top of the page, if the user has multiple tables on a page, he or she needs to enter them separately. In the future, the authors plan to expand the function so that it can be used to recognize many pages and tables. Second, entity matching has limited use as it is only limited to comparing the same item in two different tables. For now, in entity matching, the data of the contents part of the table are matched with the header and stub and, as a result, the same item is found and compared in the matched data. By applying this function that gives all data in the contents area header and stub information, the authors expect that it can be expanded to the function of searching data in the table in the future. Third, the user must input the data into the module and classify when and whether it is necessary to draw a virtual line when recognizing the table. In the future, adding a function that automatically detects the presence or absence of the need for virtual lines will help improve users’ convenience. Fourth, there was a lack of training data for the TRC-C model that used machine learning. There was no training dataset for the terminology of the steel domain or the industrial machinery domain. Therefore, in this study, in addition to the training dataset for the computer domain, the authors manually made and utilized a dictionary of terminology for drives of steel plants. Lastly, the TRC-R model recognizes data that have errors in commercial software. As a result, this is a limitation of the rule-based approach because an error occurs when an exception is made to the rule. Therefore, the rule-based algorithm needs to be reinforced by collecting more data.
The dictionary needs to be further enhanced in order to be applied to other equipment used in steel plants. If the training dataset is fully equipped, higher performance can be expected. Finally, while the TRC-R model can dramatically reduce review time, it cannot omit human review. The current TRC-C model is trained to match only the objects with the highest one-to-one similarity. Therefore, if there are many similar items, matching through the current TRC-C model can cause an error, such as the next-order entity not being matched. Future research to resolve this error includes model improvement and the addition of training data.
The CTGC module has the following limitations. First, to apply this module to new equipment and clauses, new matching filter rules need to be created. In addition, an abundance of data is also required because it is necessary to figure out common patterns in the targeted clauses in this process. However, as mentioned above, such data used for investment have a limit that is difficult to collect for security reasons. Second, finding a common pattern for these clauses is challenging, but even if found, it is hard to make it a rule. The help of domain experts in each field is required because implicit, tacit knowledge may be needed to find common patterns in the targeted clause. In addition, extending to every piece of equipment and clause is difficult, as humans cannot develop all the rules. Therefore, future studies will be broadened for clauses about PLD or DLD associated with existing studies rather than equipment oriented under general conditions. Finally, in the case of the schedule clause, it can sometimes be written on the Gantt chart. The current CTGC module cannot extract schedule information without detecting a date pattern. As a result, it is expected that it will be possible to read the Gantt chart if the TRC-R model is upgraded and linked to the CTGC module in the future.
Through conducting this study, the authors learned that business practices need to be improved. For effective digitization and better performance of intelligent and automated comparative analysis systems, it is necessary to generate documents in specific standardized formats. This is because humans cannot create rules for the layout of every table and cannot define all synonyms. In essence, a more efficient and accurate system should be built when the owner and supplier create the documentation in an agreed-upon format.

Author Contributions

Conceptualization, C.-Y.K., S.-W.C. and E.-B.L.; methodology, C.-Y.K. and S.-W.C.; software, C.-Y.K. and S.-W.C.; validation, C.-Y.K., J.-G.J., S.-W.C. and E.-B.L.; formal analysis, C.-Y.K.; investigation, C.-Y.K. and J.-G.J.; resources, J.-G.J. and E.-B.L.; data curation, J.-G.J.; writing—original draft preparation, C.-Y.K. and J.-G.J.; writing—review and editing, C.-Y.K., S.-W.C. and E.-B.L.; visualization, C.-Y.K. and J.-G.J.; supervision, E.-B.L.; project administration, E.-B.L.; funding acquisition, J.-G.J. and E.-B.L. All authors have read and agreed to the published version of the manuscript.

Funding

This research was sponsored by Pohang Iron & Steel Co., Ltd. (POSCO) with a grant number: POSCO-POSTECH Research ID = 20214205.

Institutional Review Board Statement

Not applicable.

Informed Consent Statement

Not applicable.

Data Availability Statement

Not applicable.

Acknowledgments

Special thanks to Chang-Mo Kim for the academic feedback on this paper and Jong-Hwi Hwang and Sung-Bin Baek for their support of the Python coding.

Conflicts of Interest

The authors declare no conflict of interest.

Abbreviations

The following abbreviations are used in this paper:
AIArtificial intelligence
APIApplication programming interface
CSVComma separated value
CTGCCritical terms in general conditions
CTGC-CCritical terms comparison
CTGC-ECritical terms extraction
DLDDelay liquidated damages
GUIGraphical user interface
IEInformation extraction
JSONJavaScript Object Notation
NERNamed entity recognition
OCROptical character recognition
PACPreliminary acceptance certificate
PDFPortable document format
PLDPerformance liquidated damages
POPurchase order
PoCProof of concept
PORASPurchase order recognition and analysis system
RGBRed, green, blue
TRCTable recognition and comparison
TRC-RTable recognition
TRC-CTable comparison

References

  1. Brennan, D. Process Industry Economics: Principles, Concepts and Applications, 2nd ed.; Brennan, D., Ed.; Elsevier Science: Amsterdam, The Netherlands, 2020; pp. 1–15, 95–125. [Google Scholar]
  2. Qian, F.; Zhong, W.; Du, W. Fundamental Theories and Key Technologies for Smart and Optimal Manufacturing in the Process Industry. Engineering 2017, 3, 154–160. [Google Scholar] [CrossRef]
  3. Chen, M.; Zhou, R.; Zhang, R.; Zhu, X. Application of Artificial Neural Network to Failure Diagnosis on Process Industry Equipments. In Proceedings of the 6th International Conference on Natural Computation (ICNC 2010), Yantai, China, 10–12 August 2010; pp. 1190–1193. [Google Scholar]
  4. Braaksma, A.J.J.; Klingenberg, W.; Veldman, J. Failure Mode and Effect Analysis in Asset Maintenance: A Multiple Case Study in the Process Industry. Int. J. Prod. Res. 2013, 51, 1055–1071. [Google Scholar] [CrossRef]
  5. Kumar, N.; Besuner, P.; Lefton, S.; Agan, D.; Hilleman, D. Office of Scientific and Technical Information. In Power Plant Cycling Costs; NREL/SR-5500-55433; NREL: Sunnyvale, CA, USA, 2012. [Google Scholar]
  6. POSCO. Execution Management Plan. Pohang, Korea. 2022. Available online: https://www.posmate.com/download.do?fid=25&pid=47 (accessed on 11 May 2022).
  7. POSCO. Maintenance Investment Expense Execution Outlook of Capital Investment Group of Pohang Office. Pohang, South Korea. 2021. Available online: https://www.posmate.com/download.do?fid=25&pid=47 (accessed on 11 May 2022).
  8. POSCO. Guide for the Maintainability Investment Execution. Pohang, South Korea. 2020. Available online: http://www.steel-n.com (accessed on 19 May 2022).
  9. Burt, D.N.; Dobler, D.W. Purchasing and Supply Management: Text and Cases; McGraw-Hill: New York, NY, USA, 1996; pp. 45–78. [Google Scholar]
  10. Zuberi, S.H. Contract/Procurement Management. PM Netw. 1987, 1, 41–44. Available online: https://www.pmi.org/learning/library/contract-procurement-management-9101 (accessed on 13 June 2022).
  11. Kononova, O.; He, T.; Huo, H.; Trewartha, A.; Olivetti, E.A.; Ceder, G. Opportunities and Challenges of Text Mining in Materials Research. Iscience 2021, 24, 102155. [Google Scholar] [CrossRef]
  12. Kieninger, T.; Dengel, A. Applying the T-Recs Table Recognition System to the Business Letter Domain. In Proceedings of the 6th International Conference on Document Analysis and Recognition (ICDAR 2001), Seattle, WA, USA, 13 September 2001; pp. 518–522. [Google Scholar]
  13. Shahab, A.; Shafait, F.; Kieninger, T.; Dengel, A. An Open Approach Towards the Benchmarking of Table Structure Recognition Systems. In Proceedings of the 9th IAPR International Workshop on Document Analysis Systems (DAS ’10), Boston, MA, USA, 9–11 June 2010; pp. 113–120. [Google Scholar]
  14. Kasar, T.; Barlas, P.; Adam, S.; Chatelain, C.; Paquet, T. Learning to Detect Tables in Scanned Document Images Using Line Information. In Proceedings of the 12th International Conference on Document Analysis and Recognition (ICDAR 2013), Washington, DC, USA, 25–28 August 2013; pp. 1185–1189. [Google Scholar]
  15. Rashid, S.F.; Akmal, A.R.N.S.; Adnan, M.; Aslam, A.A.; Dengel, A.R. Table Recognition in Heterogeneous Documents Using Machine Learning. In Proceedings of the 14th IAPR International Conference on Document Analysis and Recognition (ICDAR), Kyoto, Japan, 9–15 November 2017; pp. 777–782. [Google Scholar]
  16. Qasim, S.R.; Mahmood, H.; Shafait, F. Rethinking Table Recognition Using Graph Neural Networks. In Proceedings of the 2019 International Conference on Document Analysis and Recognition (ICDAR), Sydney, Australia, 20–25 September 2019; pp. 142–147. [Google Scholar]
  17. Adams, T.; Namysl, M.; Kodamullil, A.T.; Behnke, S.; Jacobs, M. Benchmarking Table Recognition Performance on Biomedical Literature on Neurological Disorders. Bioinformatics 2021, 38, 1624–1630. [Google Scholar] [CrossRef]
  18. Microsoft, Azure Form Recognizer. Available online: https://azure.microsoft.com/en-us/services/form-recognizer/#overview (accessed on 5 April 2022).
  19. Adobe, Acrobat pro. Available online: https://www.adobe.com/vn_en/acrobat/pdf-reader.html (accessed on 5 April 2022).
  20. Adobe, Adobe Document Cloud. Available online: https://www.adobe.com/documentcloud.html (accessed on 5 April 2022).
  21. Cowie, J.; Lehnert, W. Information extraction. Commun. ACM 1996, 39, 80–91. [Google Scholar] [CrossRef]
  22. Piskorski, J.; Yangarber, R. Information Extraction: Past, Present and Future. In Multi-Source, Multilingual Information Extraction and Summarization; Springer: Berlin/Heidelberg, Germany, 2013; pp. 23–49. [Google Scholar]
  23. Mykowiecka, A.; Marciniak, M.; Kupść, A. Rule-based Information Extraction from Patients’ Clinical Data. J. Biomed. Infor. 2009, 42, 923–936. [Google Scholar] [CrossRef]
  24. Zhang, J.; El-Gohary, N.M. Semantic NLP-Based Information Extraction from Construction Regulatory Documents for Automated Compliance Checking. J. Comput. Civ. Eng. 2016, 30, 04015014. [Google Scholar] [CrossRef]
  25. Lee, J.; Yi, J.-S.; Son, J. Development of Automatic-Extraction Model of Poisonous Clauses in International Construction Contracts Using Rule-Based NLP. J. Comput. Civ. Eng. 2019, 33, 04019003. [Google Scholar] [CrossRef]
  26. Feng, D.; Chen, H. A Small Samples Training Framework for Deep Learning-based Automatic Information Extraction: Case Study of Construction Accident News Reports Analysis. Adv. Eng. Inform. 2021, 47, 101256. [Google Scholar] [CrossRef]
  27. Ittoo, A.; Nguyen, L.M.; van den Bosch, A. Text Analytics in Industry: Challenges, Desiderata and Trends. Comput. Ind. 2016, 78, 96–107. [Google Scholar] [CrossRef]
  28. Omran, F.N.A.A.; Treude, C. Choosing an NLP Library for Analyzing Software Documentation: A Systematic Literature Review and a Series of Experiments. In Proceedings of the 2017 IEEE/ACM 14th International Conference on Mining Software Repositories (MSR), Buenos Aires, Argentina, 20–21 May 2017; pp. 187–197. [Google Scholar]
  29. Altinok, D. Mastering spaCy: An End-to-end Practical Guide to Implementing NLP Applications Using the Python Ecosystem; Packt Publishing: Birmingham, UK, 2021; pp. 108–137, 168–196. [Google Scholar]
  30. Köpcke, H.; Rahm, E. Frameworks for Entity Matching: A Comparison. Data Knowl. Eng. 2010, 69, 197–210. [Google Scholar] [CrossRef]
  31. Getoor, L.; Machanavajjhala, A. Entity Resolution: Theory, Practice & Open Challenges. Proc. VLDB Endow. 2012, 5, 2018–2019. [Google Scholar] [CrossRef]
  32. Köpcke, H.; Thor, A.; Rahm, E. Evaluation of Entity Resolution Approaches on Real-world Match Problems. Proc. VLDB Endow. 2010, 3, 484–493. [Google Scholar] [CrossRef]
  33. Newcombe, H.B.; Kennedy, J.M.; Axford, S.J.; James, A.P. Automatic Linkage of Vital Records. Science 1959, 130, 954–959. [Google Scholar] [CrossRef]
  34. Barlaug, N.; Gulla, J.A. Neural Networks for Entity Matching: A Survey. ACM Trans. Knowl. Discov. Data 2021, 15, 52. [Google Scholar] [CrossRef]
  35. Xu, K.; Yang, Z.; Kang, P.; Wang, Q.; Liu, W. Document-level Attention-based BiLSTM-CRF Incorporating Disease Dictionary for Disease Named Entity Recognition. Comput. Biol. Med. 2019, 108, 122–132. [Google Scholar] [CrossRef]
  36. Batra, D.; Wishart, N.A. Comparing a Rule-based Approach with a Pattern-based Approach at Different Levels of Complexity of Conceptual Data Modelling Tasks. Int. J. Hum. Comput. Stud. 2004, 61, 397–419. [Google Scholar] [CrossRef]
  37. Eck, D.J. Introduction to Computer Graphics. 2021. Available online: https://math.hws.edu/graphicsbook/ (accessed on 5 April 2022).
  38. Adobe, Grids, Guides, and Measurements in PDFs. Available online: https://helpx.adobe.com/acrobat/using/grids-guides-measurements-pdfs.html (accessed on 1 April 2022).
  39. Li, Y.; Li, J.; Suhara, Y.; Doan, A.; Tan, W.-C. Deep Entity Matching with Pre-trained Language Models. Proc. VLDB Endow. 2020, 14, 50–60. [Google Scholar] [CrossRef]
  40. Strubell, E.; Verga, P.; Belanger, D.; McCallum, A. Fast and Accurate Entity Recognition with Iterated Dilated Convolutions. In Proceedings of the 2017 Conference on Empirical Methods in Natural Language Processing, Copenhagen, Denmark, 7–11 September 2017; pp. 2670–2680. [Google Scholar]
  41. Liu, Y.; Ott, M.; Goyal, N.; Du, J.; Joshi, M.; Chen, D.; Levy, O.; Lewis, M.; Zettlemoyer, L.; Stoyanov, V. RoBERTa: A Robustly Optimized BERT Pretraining Approach. arXiv 2019, arXiv:1907.11692v1. [Google Scholar]
  42. Devlin, J.; Chang, M.-W.; Lee, K.; Toutanova, K. BERT: Pre-training of Deep Bidirectional Transformers for Language Understanding. arXiv 2018, arXiv:1810.04805v2. [Google Scholar]
  43. Hazan, E.; Klivans, A.; Yuan, Y. Hyperparameter Optimization: A Spectral Approach. arXiv 2017, arXiv:1706.00764v4. [Google Scholar]
  44. Kingma, D.P.; Ba, J. Adam: A Method for Stochastic Optimization. arXiv 2014, arXiv:1412.6980v9. [Google Scholar]
  45. Sanh, V.; Debut, L.; Chaumond, J.; Wolf, T. DistilBERT, A Distilled Version of BERT: Smaller, Faster, Cheaper and Lighter. arXiv 2019, arXiv:1910.01108v4. [Google Scholar]
  46. Bittner, E.; Gregorc, W. Experiencing Project Management: Projects, Challenges and Lessons Learned; John Wiley & Sons: Hoboken, NJ, USA, 2010; p. 226. [Google Scholar]
  47. De, P.K. Project Termination Practices in Indian Industry: A Statistical Review. Int. J. Proj. Manag. 2001, 19, 119–126. [Google Scholar] [CrossRef]
  48. Mohemad, R.; Hamdan, A.R.; Othman, Z.A.; Noor, M.M. Automatic Document Structure Analysis of Structured PDF Files. Int. J. New Comput. Archit. Appl. 2011, 1, 404–411. [Google Scholar]
  49. Shinyama, Y. Programming with PDFMiner. Available online: https://pdfminer-docs.readthedocs.io/programming.html (accessed on 2 April 2022).
  50. Vijayakumar, S.; Gajendran, S. Improvement of Overall Equipment Effectiveness (OEE) in Injection Moulding Process Industry. IOSR J. Mech. Civ. Eng. 2014, 2, 47–60. [Google Scholar]
  51. Spacy. Industrial-Strength Natural Language Processing. Available online: https://spacy.io/ (accessed on 2 April 2022).
  52. Fan, H.; Li, H. Retrieving Similar Cases for Alternative Dispute Resolution in Construction Accidents Using Text Mining Techniques. Autom. Constr. 2013, 34, 85–91. [Google Scholar] [CrossRef]
  53. Shao, P.; Yang, G.; Niu, X.; Zhang, X.; Zhan, F.; Tang, T. Information Extraction of High-Resolution Remotely Sensed Image Based on Multiresolution Segmentation. Sustainability 2014, 6, 5300–5310. [Google Scholar] [CrossRef]
  54. Zhu, H.-J.; Zhu, Z.-W.; Jiang, T.-H.; Cheng, L.; Shi, W.-L.; Zhou, X.; Zhao, F.; Ma, B. A Type-Based Blocking Technique for Efficient Entity Resolution over Large-Scale Data. J. Sens. 2018, 2018, 2094696. [Google Scholar] [CrossRef]
  55. Siregar, S.P.; Wanto, A. Analysis of Artificial Neural Network Accuracy Using Backpropagation Algorithm in Predicting Process (Forecasting). Int. J. Inf. Syst. Technol. 2017, 1, 34–42. [Google Scholar] [CrossRef]
  56. Chen, Y.-H.; Lu, E.J.-L.; Ou, T.-A. Intelligent SPARQL Query Generation for Natural Language Processing Systems. IEEE Access 2021, 9, 158638–158650. [Google Scholar] [CrossRef]
  57. Sokolova, M.; Lapalme, G. A Systematic Analysis of Performance Measures for Classification Tasks. Inf. Process. Manag. 2009, 45, 427–437. [Google Scholar] [CrossRef]
  58. Prasetiyo, B.; Muslim, M.A.; Baroroh, N. Evaluation Performance Recall and F2 Score of Credit Card Fraud Detection Unbalanced Dataset Using SMOTE Oversampling Technique. J. Phys. Conf. Ser. 2021, 1918, 042002. [Google Scholar] [CrossRef]
  59. Malhotra, P.; Ramakrishnan, A.; Anand, G.; Vig, L.; Agarwal, P.; Shroff, G. LSTM-based Encoder-decoder for Multi-sensor Anomaly Detection. arXiv 2016, arXiv:1607.00148v2. [Google Scholar]
Figure 1. (a) Process of purchase and procurement for equipment in the plant industry; (b) composition of a purchase order.
Sustainability 14 10010 g001
Figure 2. The overall research processes.
Sustainability 14 10010 g002
Figure 3. Process of the table recognition (TRC-R) model.
Sustainability 14 10010 g003
Figure 4. (a) Example of a table with internal lines omitted; (b) process of generating dividing lines.
Sustainability 14 10010 g004
Figure 5. Screenshot of ‘Table Recognition’ tab of the developed web.
Sustainability 14 10010 g005
Figure 6. Process of table comparison (TRC-C) model.
Sustainability 14 10010 g006
Figure 7. The architecture of Ditto. (a) Entity matching process of Ditto (source: Li et al., 2020); (b) detailed structure within a pre-training cell (source: Devlin et al., 2018 [42]).
Sustainability 14 10010 g007
Figure 8. Flowchart of the critical terms in general conditions (CTGC) Module.
Sustainability 14 10010 g008
Figure 9. Screenshot of ‘Performance Guarantee’ tab of the developed web.
Sustainability 14 10010 g009
Figure 10. Example tables for the scope of supply clause. (a) Owner’s PO; (b) supplier’s PO.
Sustainability 14 10010 g010
Figure 11. Example of errors in the CTGC-E model. (a) An error with punctuation marks; (b) an error recognizing a non-date number as a date.
Sustainability 14 10010 g011
Table 1. Development environment of the purchase order recognition and analysis system (PORAS).
Programming LanguagePython 3.8
IDEPyCharm 2020.3.4
MethodologiesTRC ModuleOCR, Parsing,
Machine Learning, Entity Matching
CTGC ModulePattern-based algorithm, Rule-based algorithm, Entity Matching
Main LibrariesTRC ModuleOpenCV, PDFminer, Ghostscript, Ditto
CTGC ModulespaCy (Matcher), PDFminer
DatabaseMySQL
Web Back-end FrameworkSpring Framework
Web Front-end FrameworkAngular 11
Table 2. List of the collected purchase orders from steel plant owner, P Company.
TypeNo.Made byTarget Equipment
Owner’s
Purchase Order
OP1P CompanyFinishing Mill Main Drive System
OP2Ultrasonic Billet Inspection System
OP3Ultrasonic Testing System
OP4Roll Grinder
OP5Main Motor for Hot Rolling Mill
T1Auxiliary Line Vector Drive
Suppliers’
Purchase Order
SP1T CompanyFinishing Mill Main Drive System
SP2N CompanyUltrasonic Billet Inspection System
SP3N CompanyUltrasonic Testing System
SP4H CompanyRoll Grinder
SP5W CompanyRoll Grinder
SP6T CompanyMain Motor for Hot Rolling Mill
SP7A CompanyMain Motor for Hot Rolling Mill
T2H CompanyAuxiliary Line Vector Drive
T3PI CompanyAuxiliary Line Vector Drive
Table 3. Partial example of the database for synonyms.
CaseOwner’s Purchase OrderSupplier’s Purchase Order
1Power DP panelPower distribution panel
2PLC modificationModification of PLC system
3Main drive systemMain motor drive system
Table 4. The training dataset for table comparison (TRC-C) model.
StudyData
NameWdc_computers_title_xlarge
Number of entity745
Positive sample9690
Negative sample58,771
Total sample68,461
DomainComputer
Table 5. Hyperparameter for the table comparison (TRC-C) model.
StudyData
Epochs20
Batch size64
OptimizerAdam
Learning rate3 × 10−5
Language modelDistillBERT
Table 6. Performance evaluation and validation results for the TRC-R model.
Performance Evaluation TargetConfusion MatrixEvaluation Indexes (Percent)
TPTNFPFNAccuracyPrecisionRecallF1 Score
Table Structure Recognition2726324219096.599.296.898.0
Internal Data Recognition10431191256996.097.793.895.7
Averaged performance of the TRC-R model96.398.595.396.9
Table 7. Example of outputs of the TRC-C model.
CaseOwner’s POSupplier’s POComparison Result
(Item R&R)
Comparison Result
(Description)
1Main MotorMain MotorSameSame
2Power distribution panelPower DP panelSameSame
3Switchgear & PanelHardwareSameText Mismatch
4Modification of
Relay Panel
Modification of
relay panel
Invalid Scope
(Constructor on supplier’s PO)
Same
Table 8. Performance evaluation and validation results for the TRC-C model.
TargetPerformance EvaluationEvaluation Indexes (Percent)
Total ResultsCorrect AnswerAccuracy
TRC-C model413687.8
Table 9. The incorrect dataset for the TRC-C model.
Plant Owner’s POSupplier’s POCorrect Answer
Process Computer
Modification
Modification of PLC SystemModification of
Process Computer
PLC ModificationModification of
Supervisory System
Modification of PLC System
Table 10. Performance evaluation and validation results for the CTGC-E model.
Performance Evaluation TargetConfusion MatrixEvaluation Indexes (Percent)
TPTNFPFNAccuracyPrecisionRecallF2 Score
CTGC-E model2837,04513699.968.382.479.1
Publisher’s Note: MDPI stays neutral with regard to jurisdictional claims in published maps and institutional affiliations.

