Abstract
The complexity and age of industrial plants have prompted a rapid increase in equipment maintenance and replacement activities in recent years. Consequently, plant owners are challenged to reduce the process and review time of equipment purchase order (PO) documents. Currently, traditional keyword-based document search technology generates unintentional errors and omissions, which results in inaccurate search results when processing PO documents of equipment suppliers. In this study, a purchase order knowledge retrieval model (POKREM) was designed to apply knowledge graph (KG) technology to PO documents of steel plant equipment. Four data domains were defined and developed in the POKREM: (1) factory hierarchy, (2) document hierarchy, (3) equipment classification hierarchy, and (4) PO data. The information for each domain was created in a graph database through three subprocesses: (a) defined in a hierarchical structure, (b) classified into nodes and relationships, and (c) written in triples. Ten comma-separated value (CSV) files were created and imported into the graph database for data preprocessing to create multiple nodes. Finally, rule-based reasoning technology was applied to enhance the model’s contextual search performance. The POKREM was developed and implemented by converting the Neo4j open-source graph DB into a cloud platform on the web. The accuracy, precision, recall, and F1 score of the POKREM were 99.7%, 91.7%, 100%, and 95.7%, respectively. A validation study showed that the POKREM could retrieve accurate answers to fact-related queries in most cases; some incorrect answers were retrieved for reasoning-related queries. An expert survey of PO practitioners indicated that the PO document review time with the POKREM was reduced by approximately 40% compared with that of the previous manual process. The proposed model can contribute to the work efficiency of engineers by improving document search time and accuracy; moreover, it may be expandable to other plant engineering documents, such as contracts and drawings.
1. Introduction
1.1. Status of IT Technology and Data Usage
Information technology (IT) is defined as the ability of computers, software applications, and communications to deliver data, information, and knowledge to individuals and processes [1]. The worldwide population using the Internet increased from 0.1% in the 1990s to 59.9% in 2020 [2]. In other words, the global population using the Internet had increased from about 2.6 million in 1990 to about 4.7 billion in 2020. In addition, mobile phone subscribers per 100 population increased from less than 0.1 in 1980 to 106.2 in 2020. The number of Facebook users, one of the largest social media platforms, increased from 100 million in 2008 to 2.38 billion in 2019 globally. As of July 2020, the number of large data centers operated by hyperscale cloud service providers was 541, more than double the number of data centers in mid-2015, and an additional 176 data centers were in the planning or construction phase [3]. From 2018 to 2022, corporate spending on cloud infrastructure services per quarter steadily increased to 34% in the first quarter of 2022, reaching 53 billion US dollars (KRW 67.151 T) as of 28 December 2022 [4]. In South Korea, domestic wireless communication traffic usage, that is, the amount of data used, increased from 608,323 TB in January 2020 to 926,977 TB in May 2022 [5]. The above data show the increase in the population of worldwide IT users, such as the Internet and social media platforms. In addition, it can also be seen that the number of cloud data centers, which are IT service infrastructure, has been increasing. Through these data, we can see the increase in global IT use in recent decades and confirm the increase in data usage, including in South Korea.
In the past, some researchers have argued that investments in IT do not affect productivity in the United States because of the decline in the productivity growth rate since the 1970s, but relatively recent studies show a positive correlation between investment in IT and productivity [6]. In recent years, IT investments in high-income developing countries have had a significantly positive impact on productivity despite the fact that in the past, the impact of IT investment on productivity was limited to developed countries [7]. The application of information and communication technology (ICT) can increase the productivity of manufacturing companies. In particular, manufacturers with a high level of production technology use ICT effectively, which has a significant impact on labor productivity [8]. Information retrieval (IR) technology is required when the size of the data collection reaches a level that cannot be managed by cataloging technology. Document retrieval began with using mechanical devices in the early days and evolved into document retrieval using computers [9]. The World Wide Web, which facilitates information retrieval, has evolved into a semantic web that facilitates linguistic searches. This has led to the development of knowledge graphs, a retrieval service with semantic search capability, released by Google in 2012 [10].
As mentioned above, the development of IT technology has influenced the introduction of the latest technology to improve corporate work efficiency. In addition, the increase in data usage has required the application of efficient IR technology.
1.2. Transition of Manufacturing Plant to Revamping Model
For decades, the development speed of the plant industry has accelerated with the advances in technology and the growing activities of multinational companies [11]. The plant industry requires complex equipment, and the complexity of equipment increases with advances in engineering technology, thus increasing the possibility of failure [12]. Plant owners carry out revamping projects to maintain the equipment during plant operation in line with the history of the plant industry, and the possibility of failure of plant equipment increases. Hence, the task of reviewing the purchase order (PO) is performed to repair and replace equipment during the plant operation process.
The PO is the first formal proposal issued by a buyer to the seller [13]. It shows the type, quantity, and agreed price of the products or services. The document, written by the buyer, is a technical requirement, and the draft, written by the seller, is a technical proposal [12]. General conditions refer to contracts that define the legal relationships and responsibilities of the contracting parties. Sellers intending to participate in the tender for the PO issued by the buyer write technical proposals specifying the suppliable conditions and undergo the negotiating process with the buyer regarding the information provided in the written documents. Analyzing the PO is difficult because it covers not only the technical part of the equipment but also the legal part. Therefore, processing the documents submitted by many sellers is a significant task for engineers, and PO review requires considerable time. For example, Company P in the steel plant sector made 429 investments in equipment maintenance with an average annual size of 82 million US dollars (KRW 103.976 B as of 28 December 2022) from 2016 to 2020. The persons in charge of the work related to these investments review many POs [12]. An engineer in charge of the PO is responsible for 20 investment projects per year and reviews 10 POs per investment project on average. Considerable manpower is required to review POs when a large investment is made for the maintenance of plant equipment, as it takes up to 16 h to review one PO. Thus, the importance of retrieval increases because documents related to such a vast task must be found and reviewed efficiently.
In this study, digital transformation, a recent technological trend, was applied to a semantic search for text documents among various documents in the company. To this end, a purchase order’s knowledge retrieval model (POKREM), a knowledge retrieval model of documents, was developed by applying knowledge graph (KG) technology. This study differs from other studies in that it contributed to engineering digital transformation by studying an improved method for PO documents of steel plant equipment and developing a semantic document search model using KG technology.
2. Literature Review
Previous studies on information retrieval (IR), KG, and PO were reviewed to develop POKREM with the goal of improving the documentation work efficiency of the workforce responsible for POs. First, the definitions, various models, and limitations of IR in the literature were studied. Second, the authors examined the results of the various studies using PO in a literature review. Finally, the definitions of KG, reasoning methods, and effects of applying KG in various fields were examined.
2.1. Information Retrieval
Information retrieval is related to the structure, analysis, organization, storage, and retrieval of information [14]. Using logical implications, Cooper [15] explained the meaning of “relevance” in the stored information in relation to the user’s information needs. Wong et al. [16] proposed the concept of a generalized vector space model (GVSM), which is an improvement over the vector space model (VSM) to address the difficulty in determining the relevance between documents and a given imprecise query in the IR process. Wiesman et al. [17] provided an overview of the characteristics of IR systems and discussed four models: Boolean, vector, probabilistic, and connectionist models. Rehma et al. [18] classified set-theoretic, probabilistic, and algebraic models and explained the fields of each model. Merrouni et al. [19] emphasized the importance of context in information retrieval and its effects on the effective operation of retrieval systems. They also introduced various recent real-world cases. Yu [20] proposed an ontology model with document retrieval capability to mitigate the difficulty of obtaining personalized information from search results, a problem faced by classic keyword-based information retrieval models, and demonstrated its feasibility and superiority through experiments. Azad and Deepak [21] examined query expansion (QE) techniques in IR from the 1960s to 2017 focusing on core techniques, data sources, weighting and ranking methods, user participation, and applications to demonstrate their similarities and differences. Bai et al. [22] proposed a neural network model based on an existing framework, IRNet, to solve the problem of database information retrieval using only the query format. Angdresey et al. [23] proposed a method using a vector space model to find verses in the Bible based on the relevance or similarity level with the input keyword. Sansone and Sperlí [24] studied artificial intelligence (AI) technology related to legal information retrieval systems based on natural language processing (NLP), machine learning, and knowledge extraction techniques and discussed the open issues in legal information retrieval systems. Ibrihich et al. [25] conducted a survey on modeling and simulation approaches to describe the information retrieval basics. They reviewed the literature on the discovery of search techniques and compared them in relation to IR from various research perspectives.
2.2. Purchase Order
Moe and Fader [26] proposed a method of using advance purchase order data to forecast sales of a new product and explained that sales of a new album could be predicted based on the pattern of advance purchase orders alone. Wang and Miller [27] described an intelligent aggregation approach for automatically aggregating demand to reduce procurement costs in POs of large enterprises. Li [28] built a process-focused business risk analysis model based on an analysis of the control mode of purchase-order financing and explained that the process risk of implementing a PO is the most important factor impacting business security. Baraka and Al-ashqar [29] built a service-oriented architecture (SOA)-based purchase order management (POM) system to improve the interoperability and management features of existing POM systems. Huang et al. [30] proposed an acceptable order quantity allocation condition for both the buyer and seller to address the problem emphasized in supply chain coordination that in maximizing the profit of the overall supply chain, the profit changes of individual members in the supply chain are often overlooked. Bock and Isik [31] proposed a two-dimensional measure and analysis framework that purchasing decision makers can use to solve the problem of increasing inventory caused by the lack of knowledge about the behavioral aspects of decision-making within the procurement process. Yamanaka [32] proposed a credit risk assessment of the borrower using the borrower’s PO information to enable more frequent monitoring than typical credit risk assessment based on financial statement analysis. Liu et al. [33] developed supervised machine learning models in the form of random forests and the quantile regression forests algorithm that were trained on historical PO transaction data. Hence, higher accuracy was obtained compared with that of the supplier-provided delivery time estimates.
2.3. Knowledge Graph
A KG is a method of representing information that can provide semantically structured information [34]. Berners-Lee et al. [35] described the components of the semantic web, a concept that evolved from the World Wide Web by classifying it into three categories: semantic representation, knowledge representation, and ontology, which became the basis of KGs. In 2012, Singhal [36] introduced KGs and Google’s new concept of information retrieval. He proposed a concept to enable a new search method using the semantics of a search sentence rather than searching a webpage using words. Auer and Mann [37] explained that a KG facilitates the discovery of information by organizing it into entities and describing the relationships between the created entities. Auer et al. [38] contributed a vision of a KG in science, explaining that document-centric research in science has reached its limit and that if research results inside documents are represented semantically using KGs, this can lead to revolutionary results in scientific research through connections between related knowledge. Wang et al. [39] proposed AceKG to solve the problems of existing KGs in academic domains, such as insufficient multirelational information, name ambiguity, and improper data formats for large-scale machine processing. Chen et al. [40] proposed AgriKG using NLP and deep learning techniques as a solution to the problem of integrating massive amounts of information in the agriculture sector based on the advancement of information technology. They implemented an agricultural KG using text information. Noy et al. [41] examined the characteristics of each KG of Microsoft, Google, Facebook, eBay, and IBM, and discussed the current challenges of KG systems. Guo et al. [42] conducted a survey of KG-based recommender systems and classified them into three categories: embedding-based, connection-based, and propagation-based methods. Chen et al. [43] classified KG reasoning methods into three categories: rule-based, distributed representation-based, and neural network-based reasoning. They also reviewed applications of KG reasoning, such as KG completion, question answering, and recommender systems. Huang et al. [44] described KG construction methods for large-scale power grids in China using a combination of AI technology, labeling techniques, and KGs for the efficient management of complex power grids in China. They also demonstrated that the efficiency of maintenance and management can be improved through experimental simulations. Liu et al. [45] developed a model to identify the potential rules of accident risks in railway operations, contributing to the identification of potential characteristics of accidents and the establishment of preventive measures. Kim et al. [46] proposed a document-grounded generative model using a knowledge graph to solve the maximum input length of text, a limitation of document-grounded conversation (DGC) applying a pretrained language model. As a result of reviewing the previous studies, the authors determined that research on IR techniques has been conducted to find the desired information among numerous pieces of information available on the web and is continually growing. However, keyword-based searches, which do not reflect the contextual information sought by the search user, produce search results that differ from the user’s intention. The effects of using PO data in various ways, such as evaluating a company’s credit, forecasting the sales volume of a new product, and predicting the appropriate delivery time, are presented in the literature review on POs. However, the authors have not found any study on improving the productivity of POs in reviewing the work of plant owners. IR has evolved into the concept of KGs, which facilitates semantic search beyond the level of searching for documents based on search words, to overcome the limitations of keyword-based searches of traditional methodologies. Many researchers have constructed KGs from multisource data in various fields with effects, such as accident prevention and management efficiency.
3. A Preliminary Study
3.1. Survey as a Preliminary Study
In this study, the authors conducted two surveys. The first survey aims to accurately grasp the latest status regarding reviewing POs. The second survey is to identify the effectiveness of the PO review work of the model developed through this study. This section describes the first survey, and the second survey is explained in Section 7.4. The first survey consists of six questions. The first question is about the average number of documents referenced by PO staff when reviewing one PO. The second asks about the average time staff take to review PO documents. The third question is about the maximum time spent reviewing reference documents on a task. The fourth question is whether the retrieval system for searching PO documents for company P is a semantic or keyword-based retrieval system. The fifth question is whether an engineer thinks it would be helpful in the business process if Company P had a semantic search system for retrieving PO documents. Finally, the sixth question is about the years of experience of the survey participants. The third question was designed to be answered in an open-ended format. The remaining questions were designed using a five-point Likert scale except for the third question. In the first survey, 18 respondents from Company P participated in the PO review work. Of the 18 employees who participated in the survey, 27.8% (5 persons) had worked for more than 25 years, and 22.2% (4 persons) had worked for more than 12 years and less than 17 years. Employees who worked for more than 7 years and less than 12 years accounted for 44.4% (8 persons). Finally, 5.6% (1 person) of employees worked for a period of 3 to 7 years (Table 1).
Table 1.
The information on respondents in the survey.
In the survey results, 83.3% of the participants answered that they reviewed 5 to 10 relevant documents on average to review 1 PO. Additionally, 44.4% of the participants answered that it takes 1 to 3 hours on average to review 1 document related to a single PO. The survey results showed that up to three days were required to review one document related to the writing of a single PO. All participants answered that the document retrieval systems used in the process of handling their work were keyword-based search systems, such as web searches; 88.9% of the participants indicated that having a document retrieval system capable of retrieving the contents of the documents would be helpful. The survey results showed that currently, people responsible for this task in Company P are spending considerable time and effort reviewing many reference documents in the process of reviewing one PO. The results also showed that there is currently no semantic search function used for work, suggesting that work productivity could be improved if a semantic search function capable of retrieving the contents of documents could be built.
3.2. Problem Statement and Research Objective
Recently in the IT industry, the size and amount of data used have increased, which in turn has increased the importance of information retrieval technology. Retrieval technology has evolved from keyword-based web searches into semantic search technology. Some studies have shown that the application of IT is positively related to the productivity of companies. The plant industry has become larger and more complex, and the task of reviewing POs for the operation of facilities has increased. The survey results show that workers responsible for POs spend considerable time reviewing POs and searching for documents through keyword-based retrieval systems. Moreover, the results suggest that a semantic search system for the content of documents would improve work productivity. The research background and survey results revealed the problems of current PO review work, suggesting that the productivity of PO reviews can be improved by using a semantic search function in the plant sector.
This study aims to develop a knowledge retrieval model with semantic search capability by applying IT to reduce the review time of POs and improve the productivity of workers in the process. The developed model is referred to as the Purchase Order’s Knowledge Retrieval Model (POKREM). The authors developed the POKREM using a graph database to achieve the goals of this study. First, the four domains to be created in the graph database were defined. The four domains consisted of plant hierarchy, document hierarchy, facility classification hierarchy, and PO data. The data were preprocessed using comma-separated value (CSV) files for the ease of creating multiple nodes and relationships for the information on the four defined domains in the graph database. Subsequently, rule-based reasoning was applied to complete the POKREM. The authors used queries and correct answers for the information in the four domains to test the performance of the developed knowledge retrieval model. The test was conducted by inputting a query into the model and comparing the query processing result with the correct answer. Finally, the authors developed the POKREM platform by building a web server.
4. Research Framework and Model Overview
This section describes the research framework and provides an overview of the model. The selection of PO data, the subject of the POKREM research, is then explained, and the development environment of the POKREM is described.
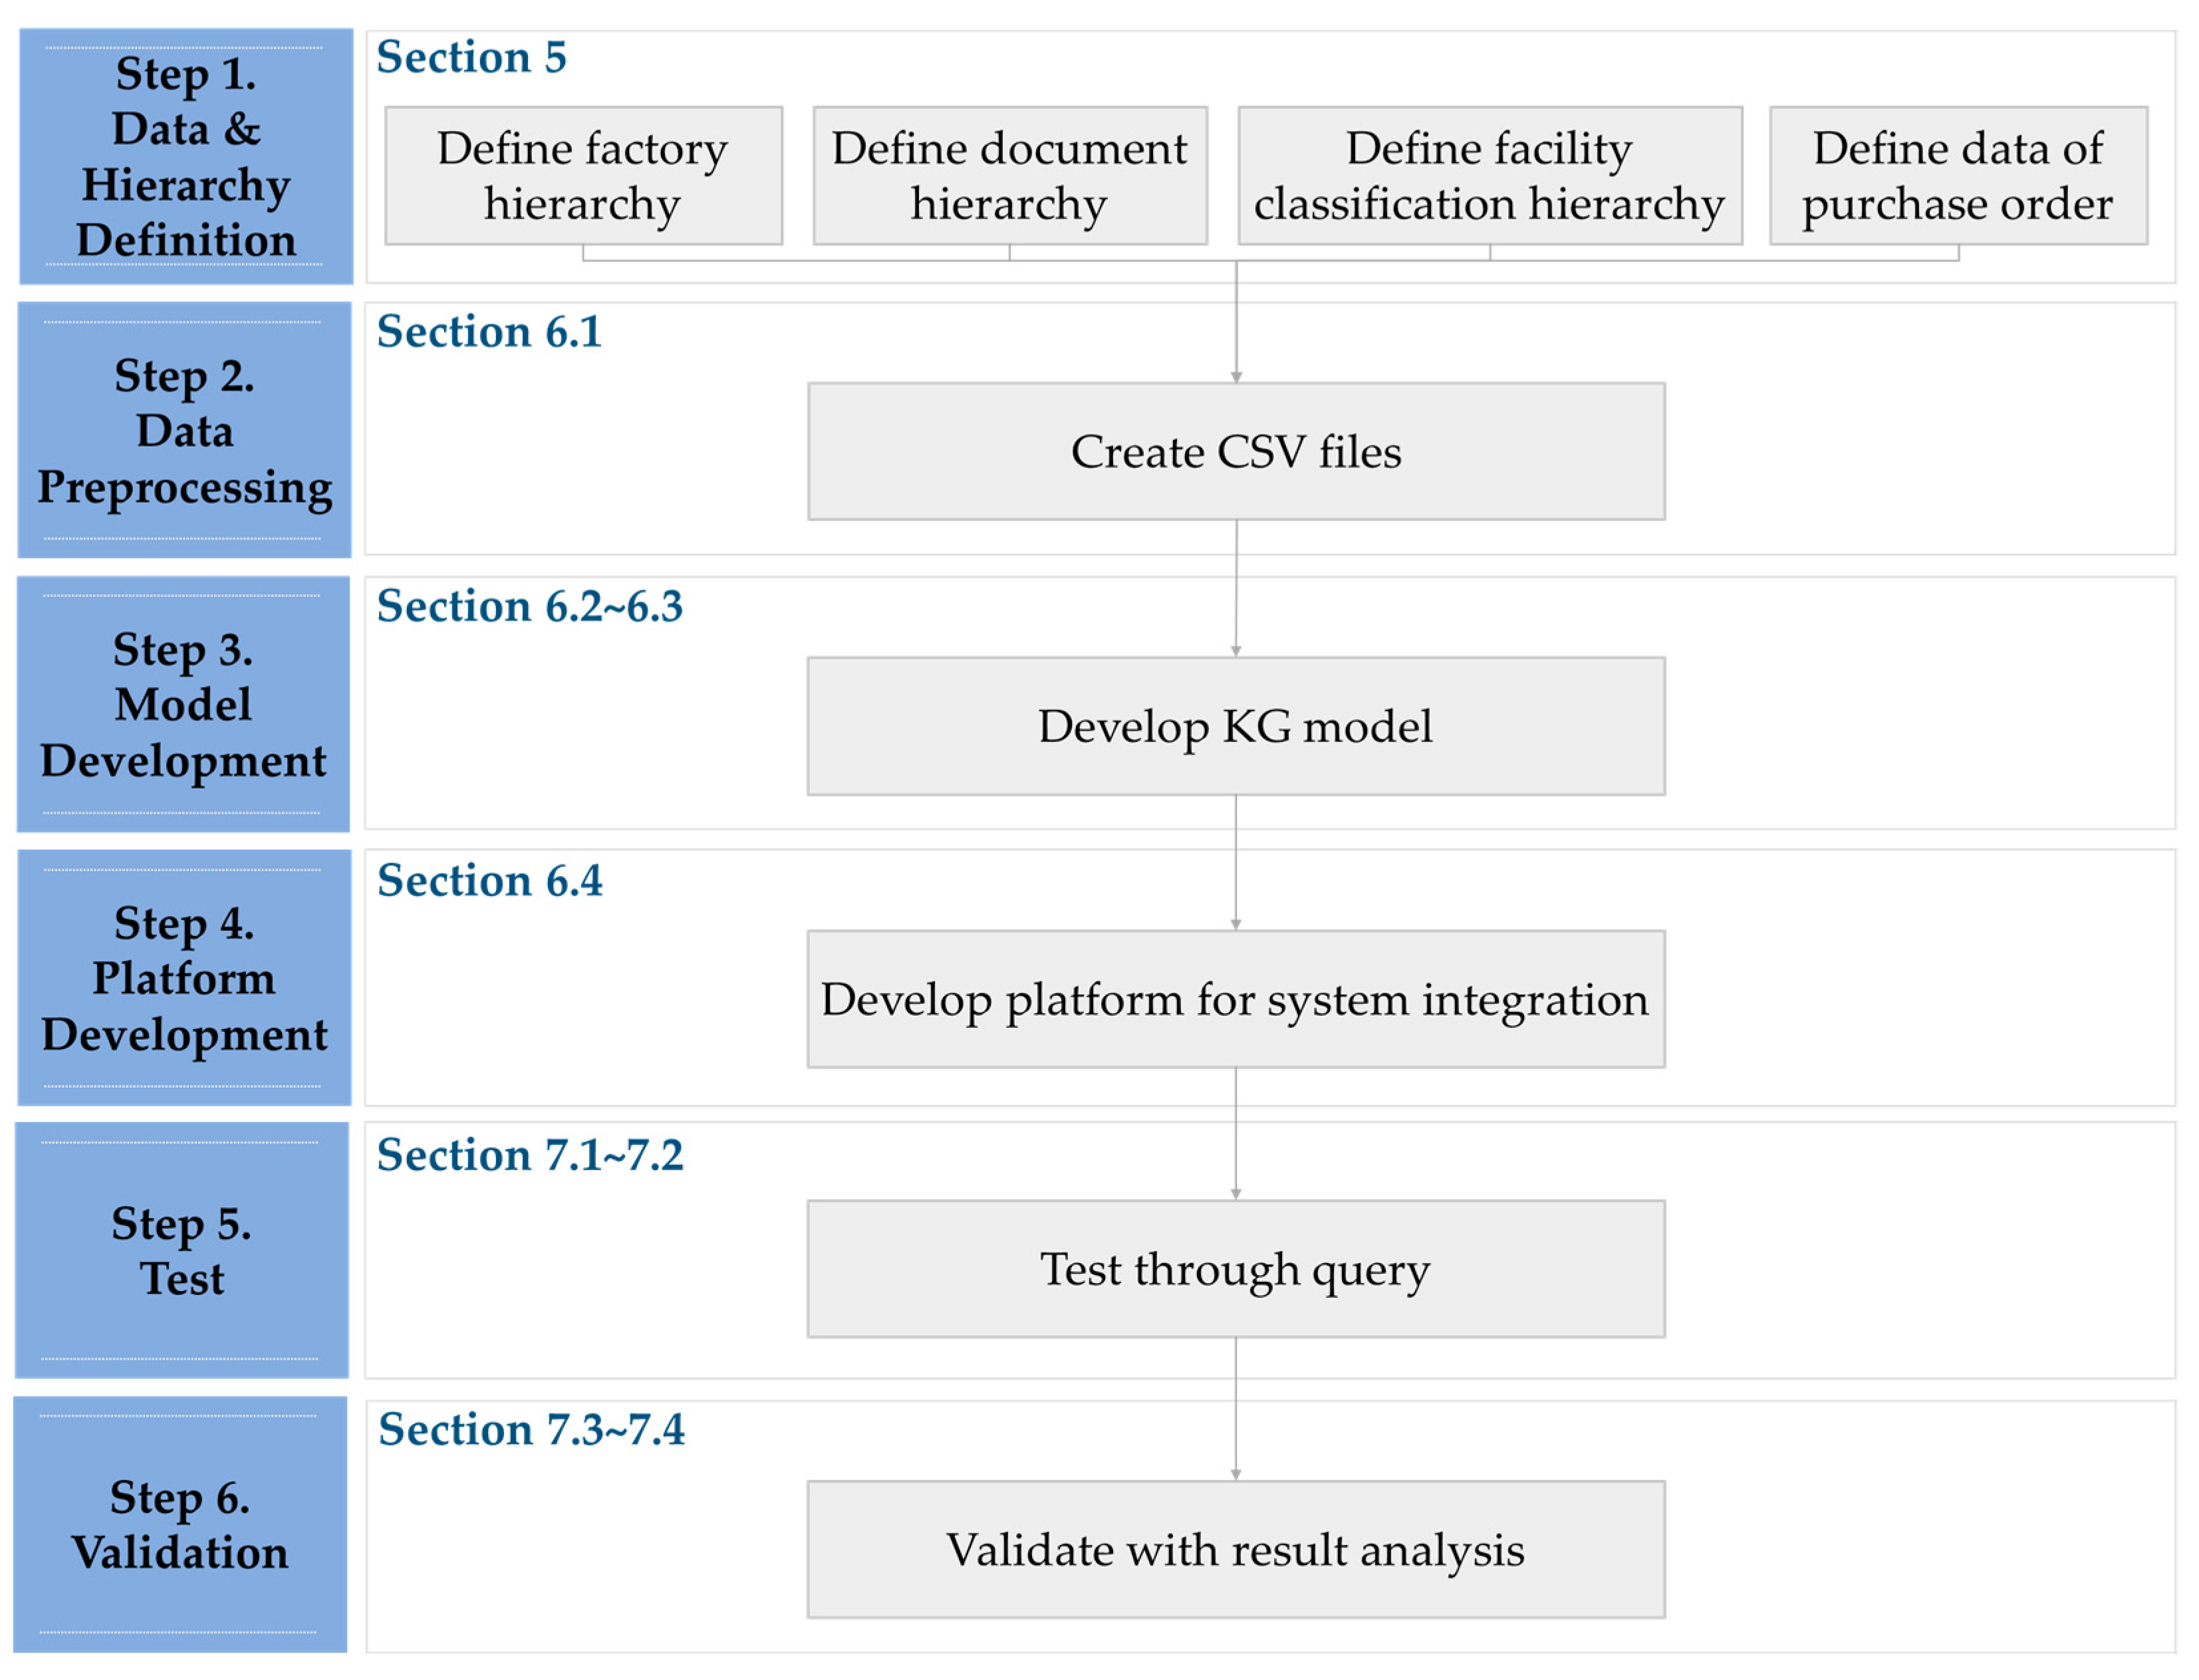
4.1. Research Framework
The subject of this study is the PO documents of the cold rolling mill of Company P. Company P was chosen as the research subject because it was possible for workers at Company P to provide the data required for modeling and validating the developed model. Company P is a South Korean conglomerate with more than 30,000 employees. It is a steel manufacturing company that ranks No. 1 in the world’s most competitive steel makers in 2022 [47].
The KRM was built using key information such as the PO’s project title, delivery date, completion date, and scope of supply of the PO. The authors defined the factory, document, and facility classification hierarchies of the supply items for the effective retrieval and classification of the KRM. In this study, the authors constructed the POKREM, a knowledge retrieval model of Pos for a steel plant based on a graph database for the semantic search of PO. As shown in Figure 1, this study consisted of six steps.
Figure 1.
Research process.
- Step 1. Definitions of data and hierarchical structures: Factory hierarchy, document hierarchy, facility classification hierarchy, and PO data were defined.
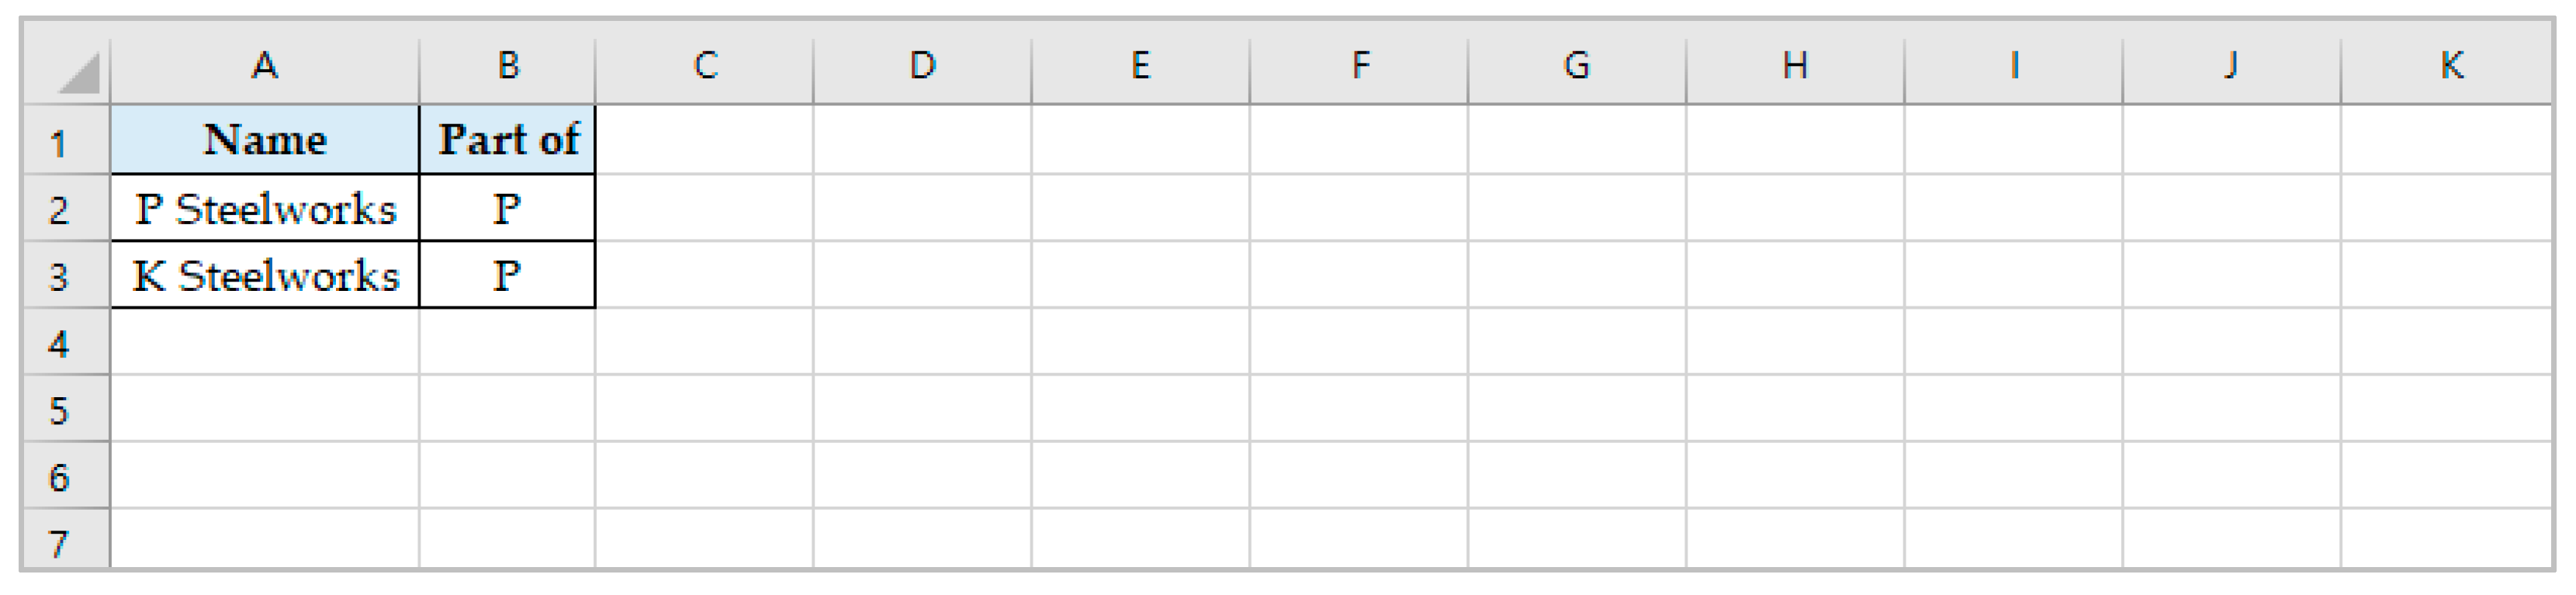
- Step 2. Data preprocessing: A CSV file was developed to create a number of nodes and relationships in the graph database.
- Step 3. Model development: The POKREM was developed using preprocessed CSV files and the reasoning function.
- Step 4. Platform development: A platform was developed for the system integration.
- Step 5. Test: The performance of the POKREM was tested through queries.
- Step 6. Validation: Semantic analysis was performed on the test results.
4.2. Modeling Process Overview
This section describes the development process of the POKREM for the POs of a steel plant. First, the authors defined four domains to configure the POKREM: factory hierarchy, document hierarchy, facility classification hierarchy, and PO data. These four domains facilitate PO document retrieval. Second, the authors created CSV files for the data preprocessing procedure to efficiently generate multiple nodes, relationships, and property values. Information from the four defined domains was used as the input data to create the CSV files. Third, the CSV import function was used to create the structures defined earlier on the Neo4j Graph DBMS, and a rule-based reasoning function was applied. This reasoning function enables a search that considers the context. The four domains were all created in a form connected to the graph database, and many nodes and relationships were created using nine-rule-based reasoning. Subsequently, the POKREM’s platform was developed using a web server for user convenience. The platform was configured such that the developed model could be used at any location with access to a network. Fifth, the tests were performed in three stages. Finally, the test results were checked, and usability verification was performed by the users. The tests were divided into three stages of difficulty, and each test consisted of queries and correct answers. The queries and correct answers in the first stage were related to one domain and those in the second stage to two or more domains. Finally, the third-stage test consisted of queries and correct answers related to reasoning. Tests were conducted to compare the results of executing queries in the developed model with the correct answers, and usability was verified by engineers who had worked for more than ten years in the plant sector.
4.3. Selection of Target PO Data
The PO data items were selected from purchase specifications corresponding to the technical specifications of the PO documents of Company P. From the cover of the documents, the project title, target process, and published date were selected as PO data. From the contents of the documents, the date of delivery, completion date, and supply items (refer to ‘3. Scope of Supply’ in Figure 2b) were selected as PO data. The contract number was used to identify a specific document among many purchase specification documents. Figure 2 presents the purchase specification documents of Company P, which are the source of the PO data. Figure 2a is the cover page of a PO, displaying common information about the document. The PO’s cover page shows the published date, target process, and project title. Figure 2b shows the table of contents of the PO, which consists of nine chapters, from 1. General Description to 9. Delivery. The information on supply items used in this study is in chapter “3. Scope of Supply”.
Figure 2.
(a) Cover page of purchase specification and (b) contents of purchase specification.
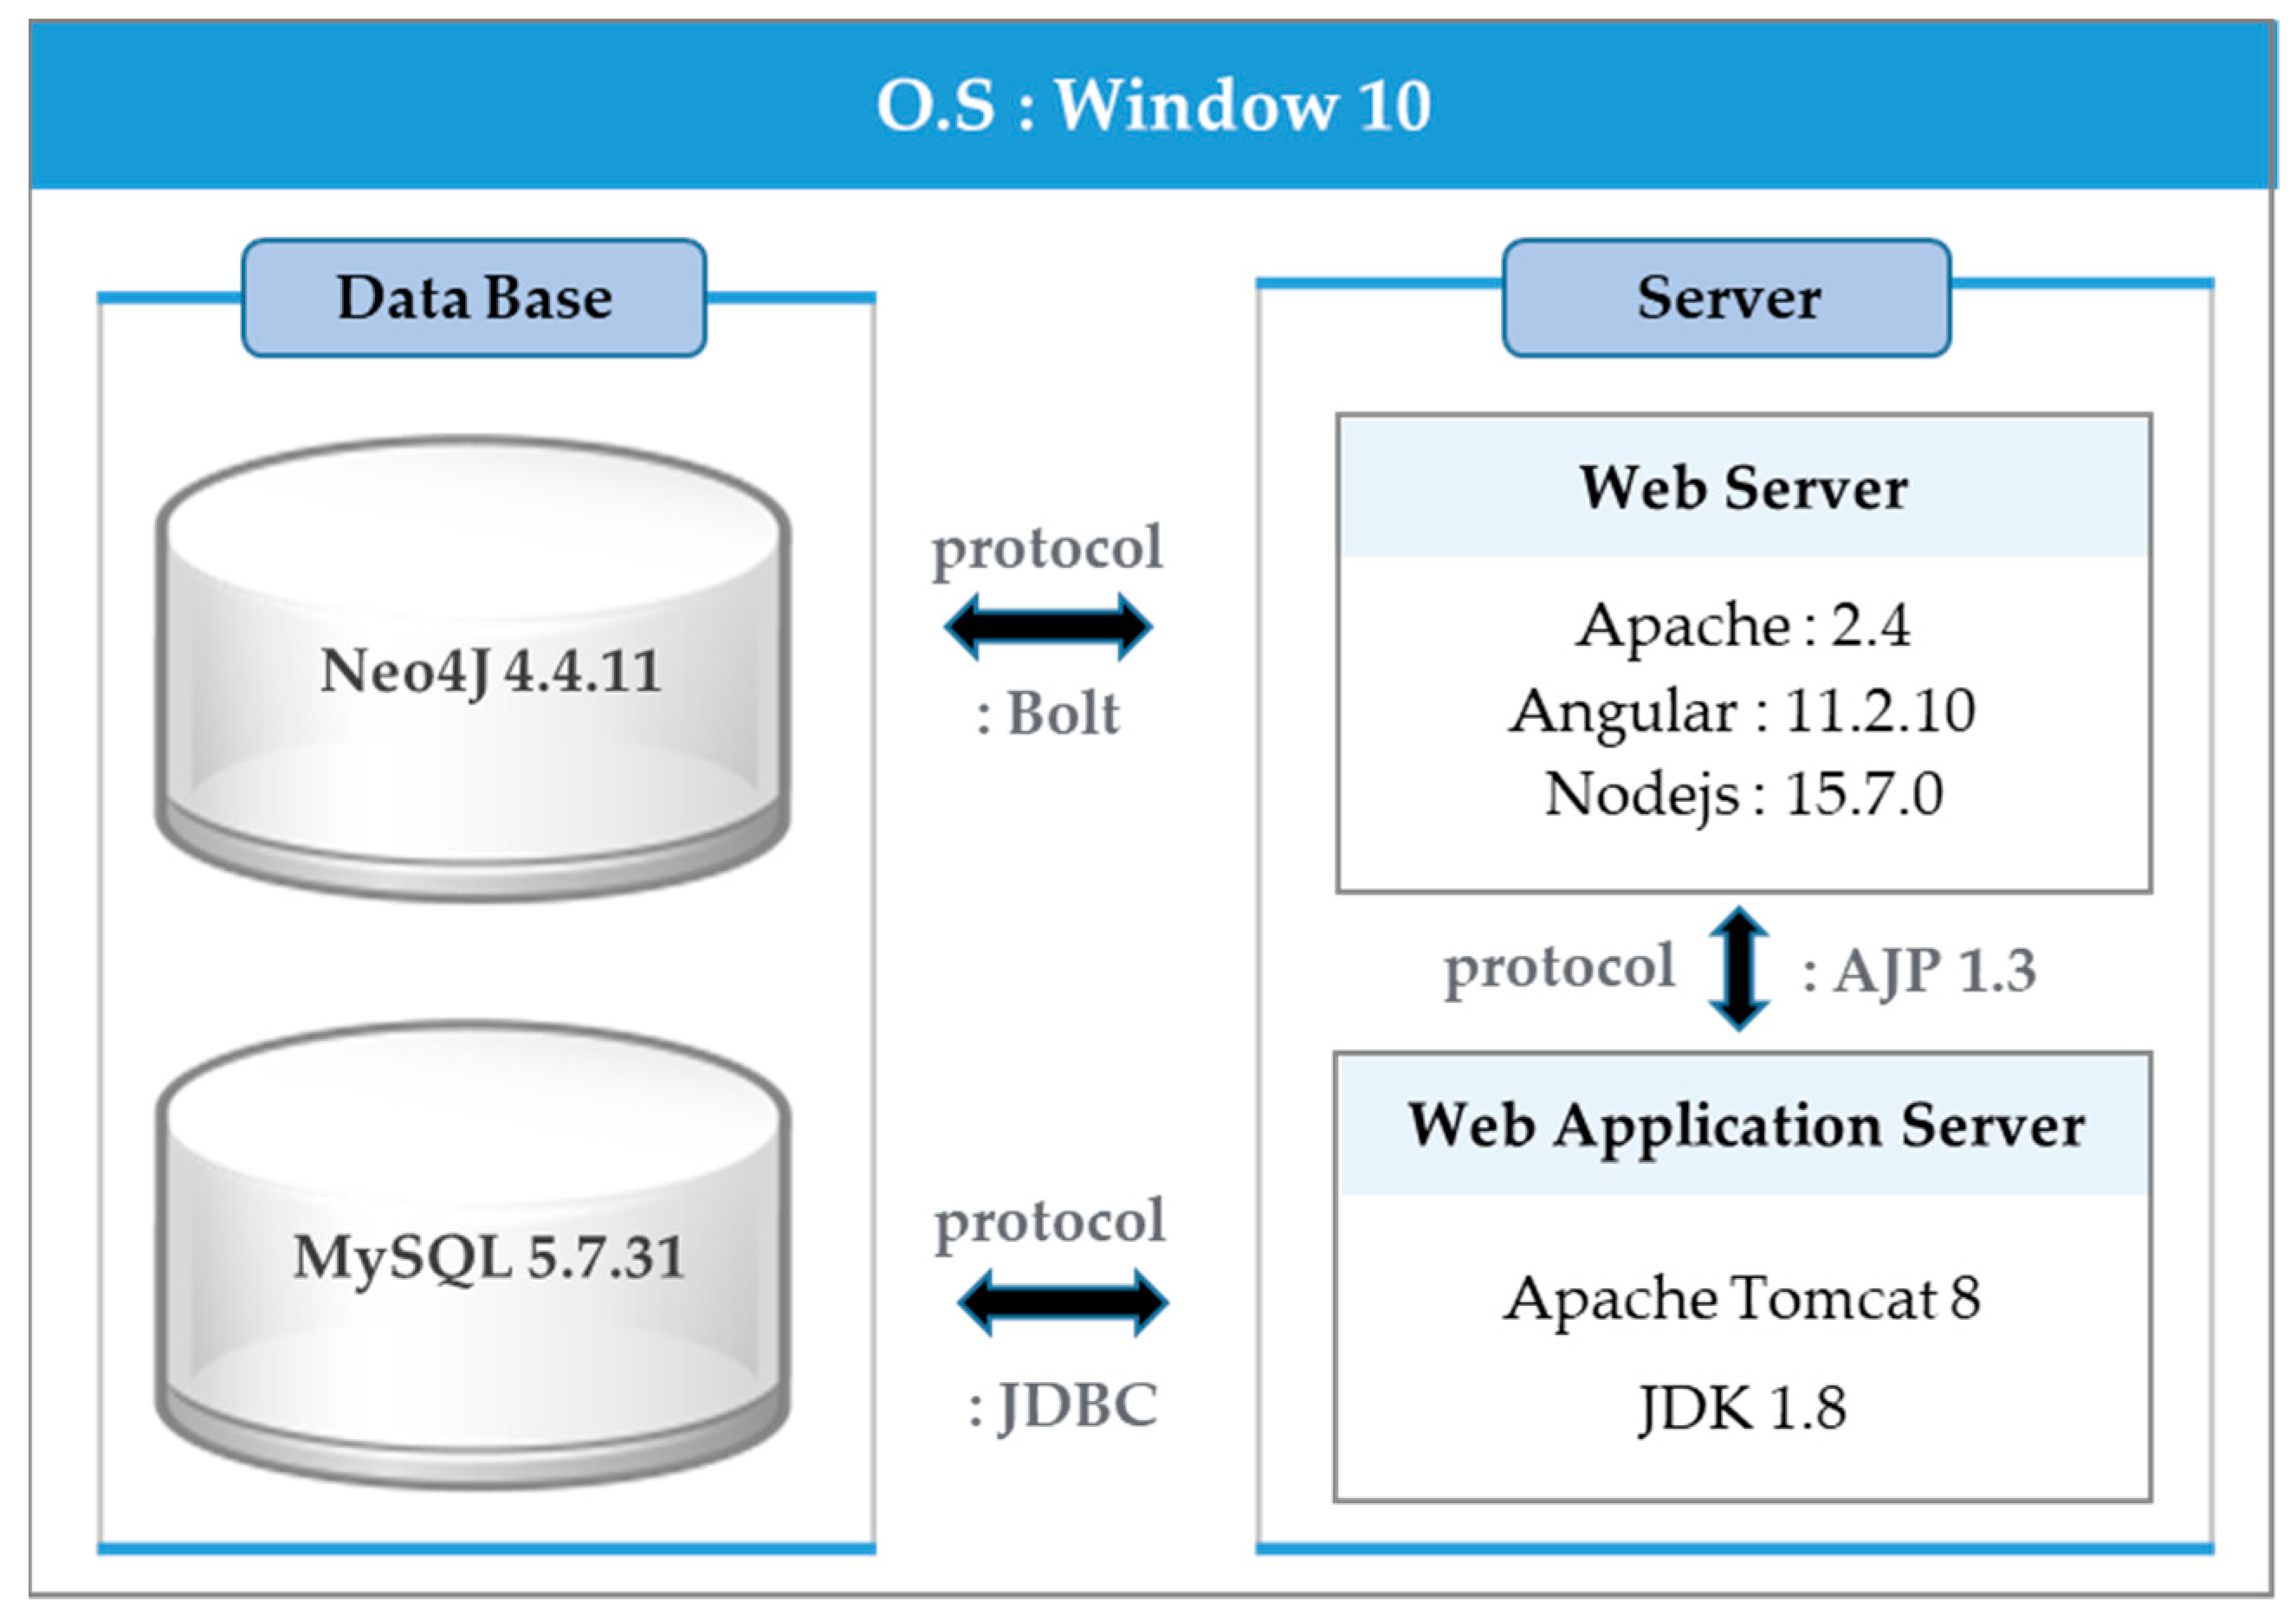
4.4. Development Environment of the POKREM
The operating system (OS) used in this study was Windows 10 [48]. The graph database used by Windows OS was Neo4j [49]. As of 6 February 2022, Neo4j ranked number one in popularity among the graph database engines (DB-engine.com) [50]. Neo4j uses Cipher as its query language and can be accessed from other programming languages using a protocol called Bolt. In the process of developing the POKREM using a graph database engine, the process of developing a KG should not be difficult. Therefore, the authors decided on Neo4j as the graph database DBMS. Considering that the query syntax of Neo4j is not complicated, it is easy to find relevant information, and thus Neo4j has been number one in popularity among graph databases in the last ten years. Table 2 shows the development environment of the POKREM.
Table 2.
Development environment for POKREM.
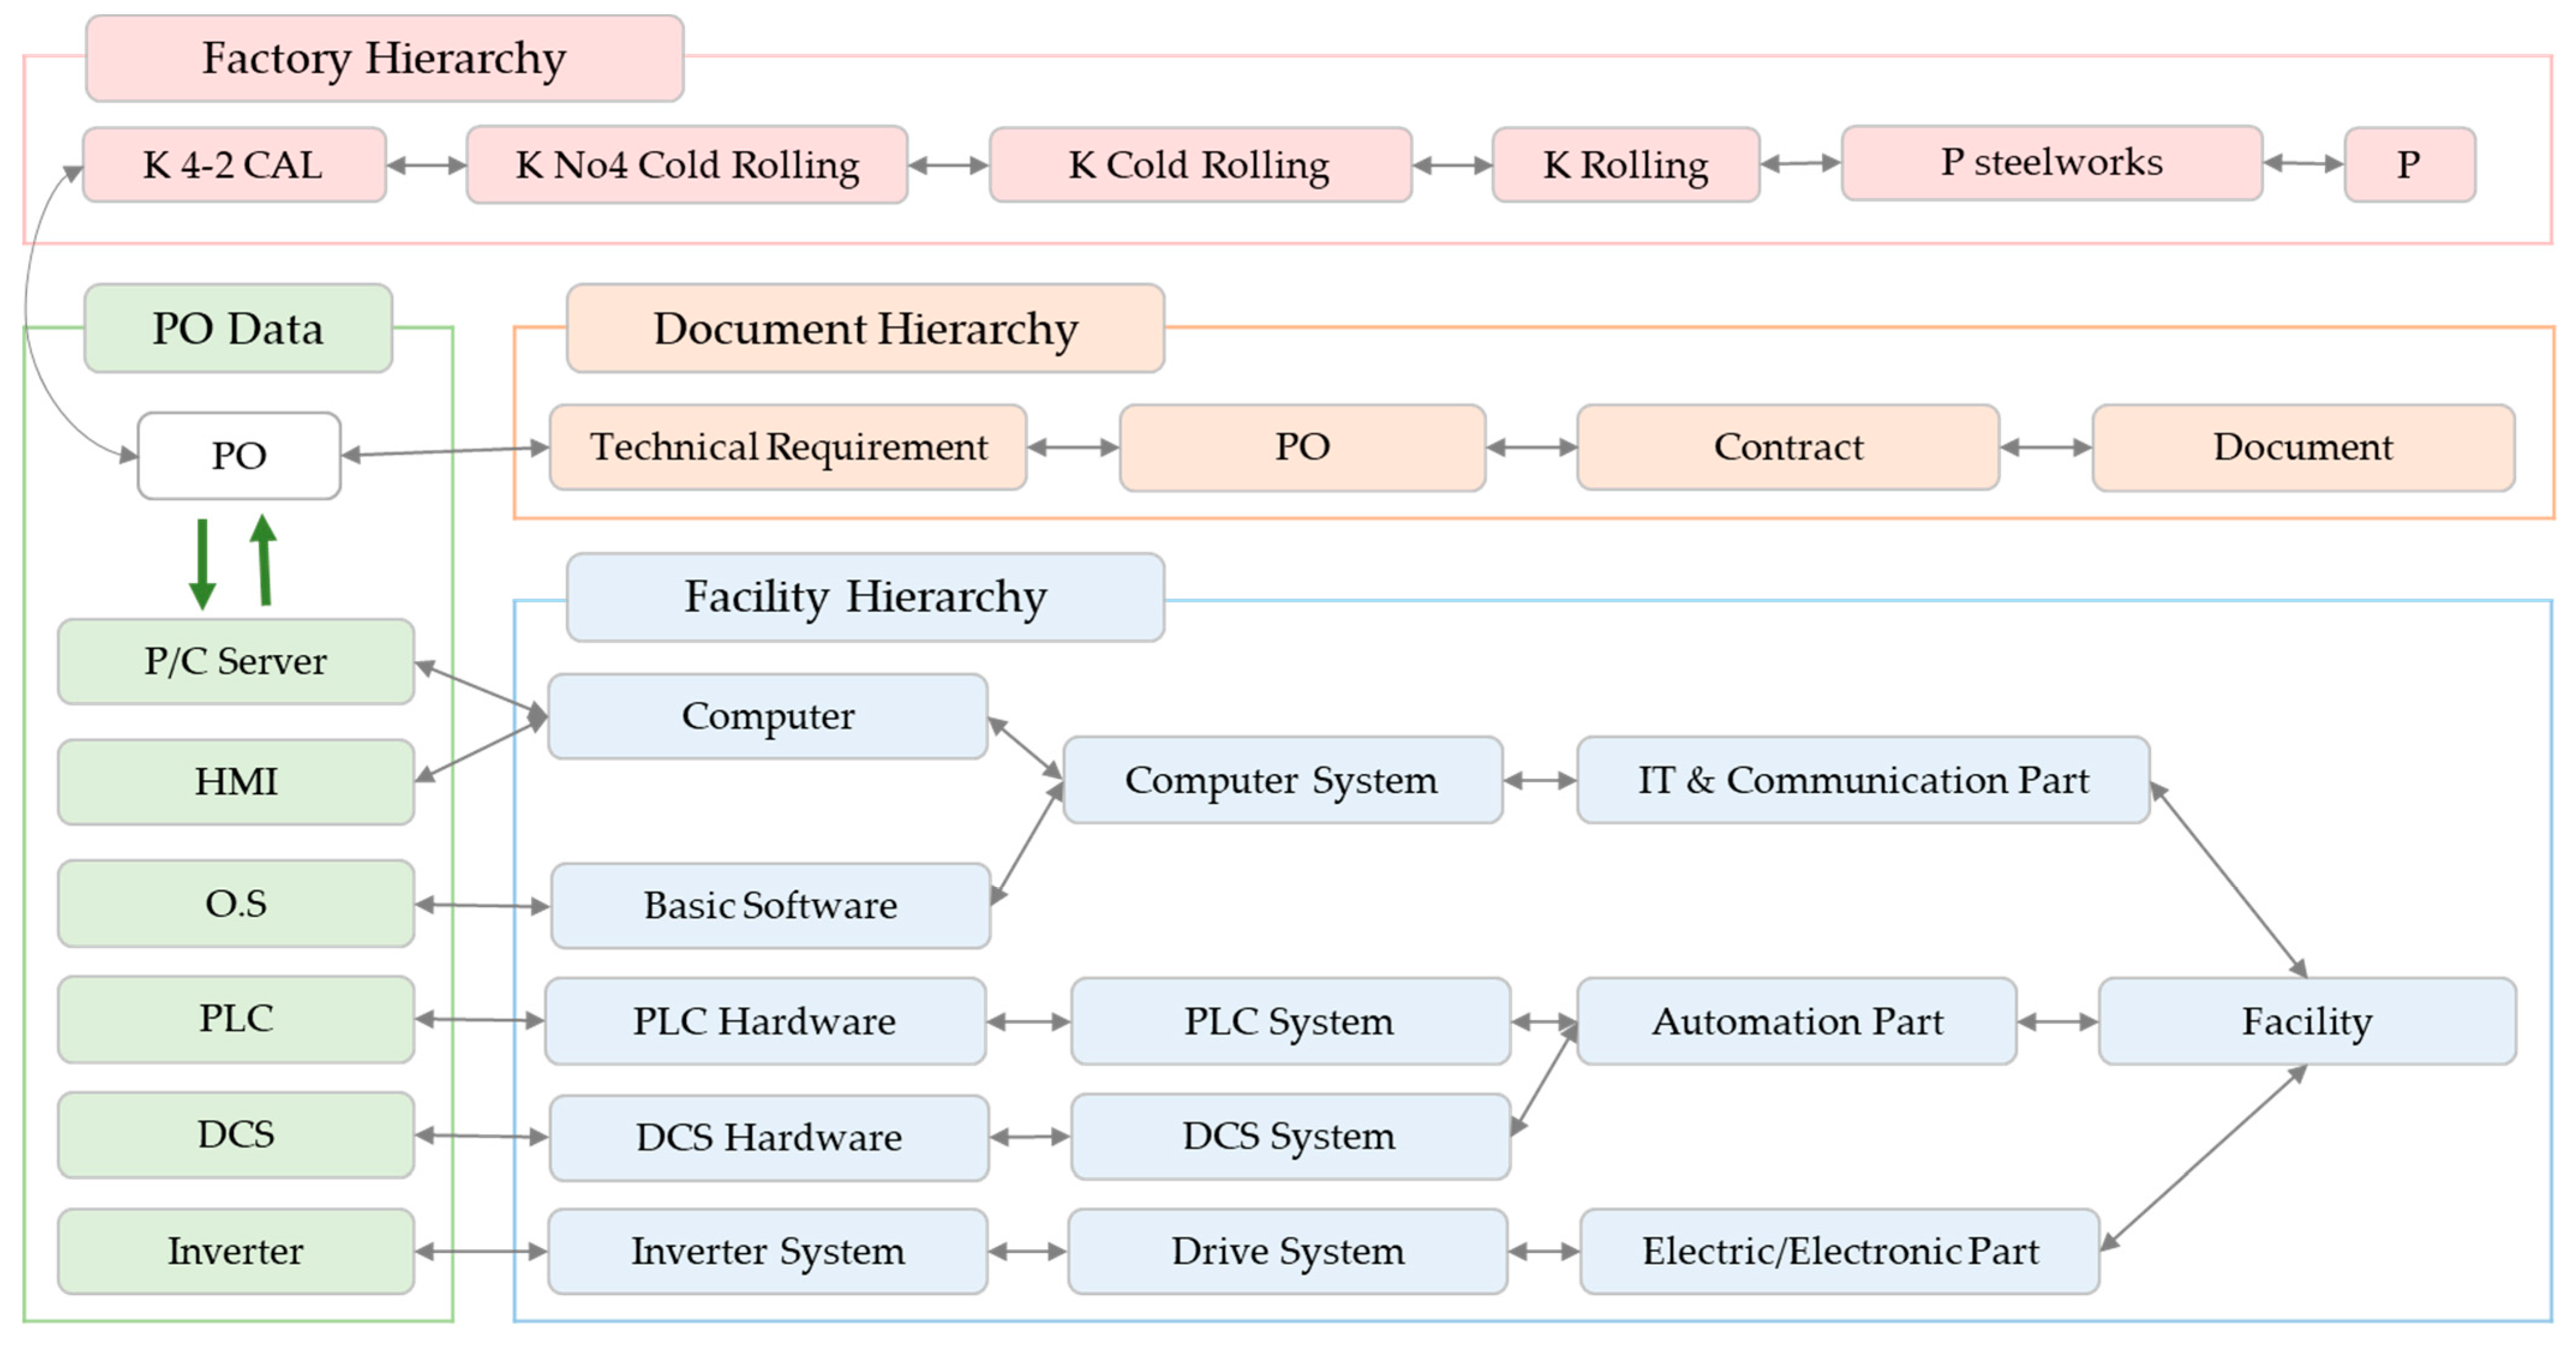
5. Definition of Data Hierarchy
This section describes the process of defining the data for the four domains in KG development. The four domains are factory hierarchy, document hierarchy, facility classification hierarchy, and PO data. The PO data consist of PO document and item data. The factory, document, and facility classification hierarchies were defined to retrieve the PO data by factory, document, and facility classification. The four domains for PO retrieval were chosen after discussions with five engineers who had worked at Company P for more than ten years. The key points for the hierarchical classification of each domain are as follows:
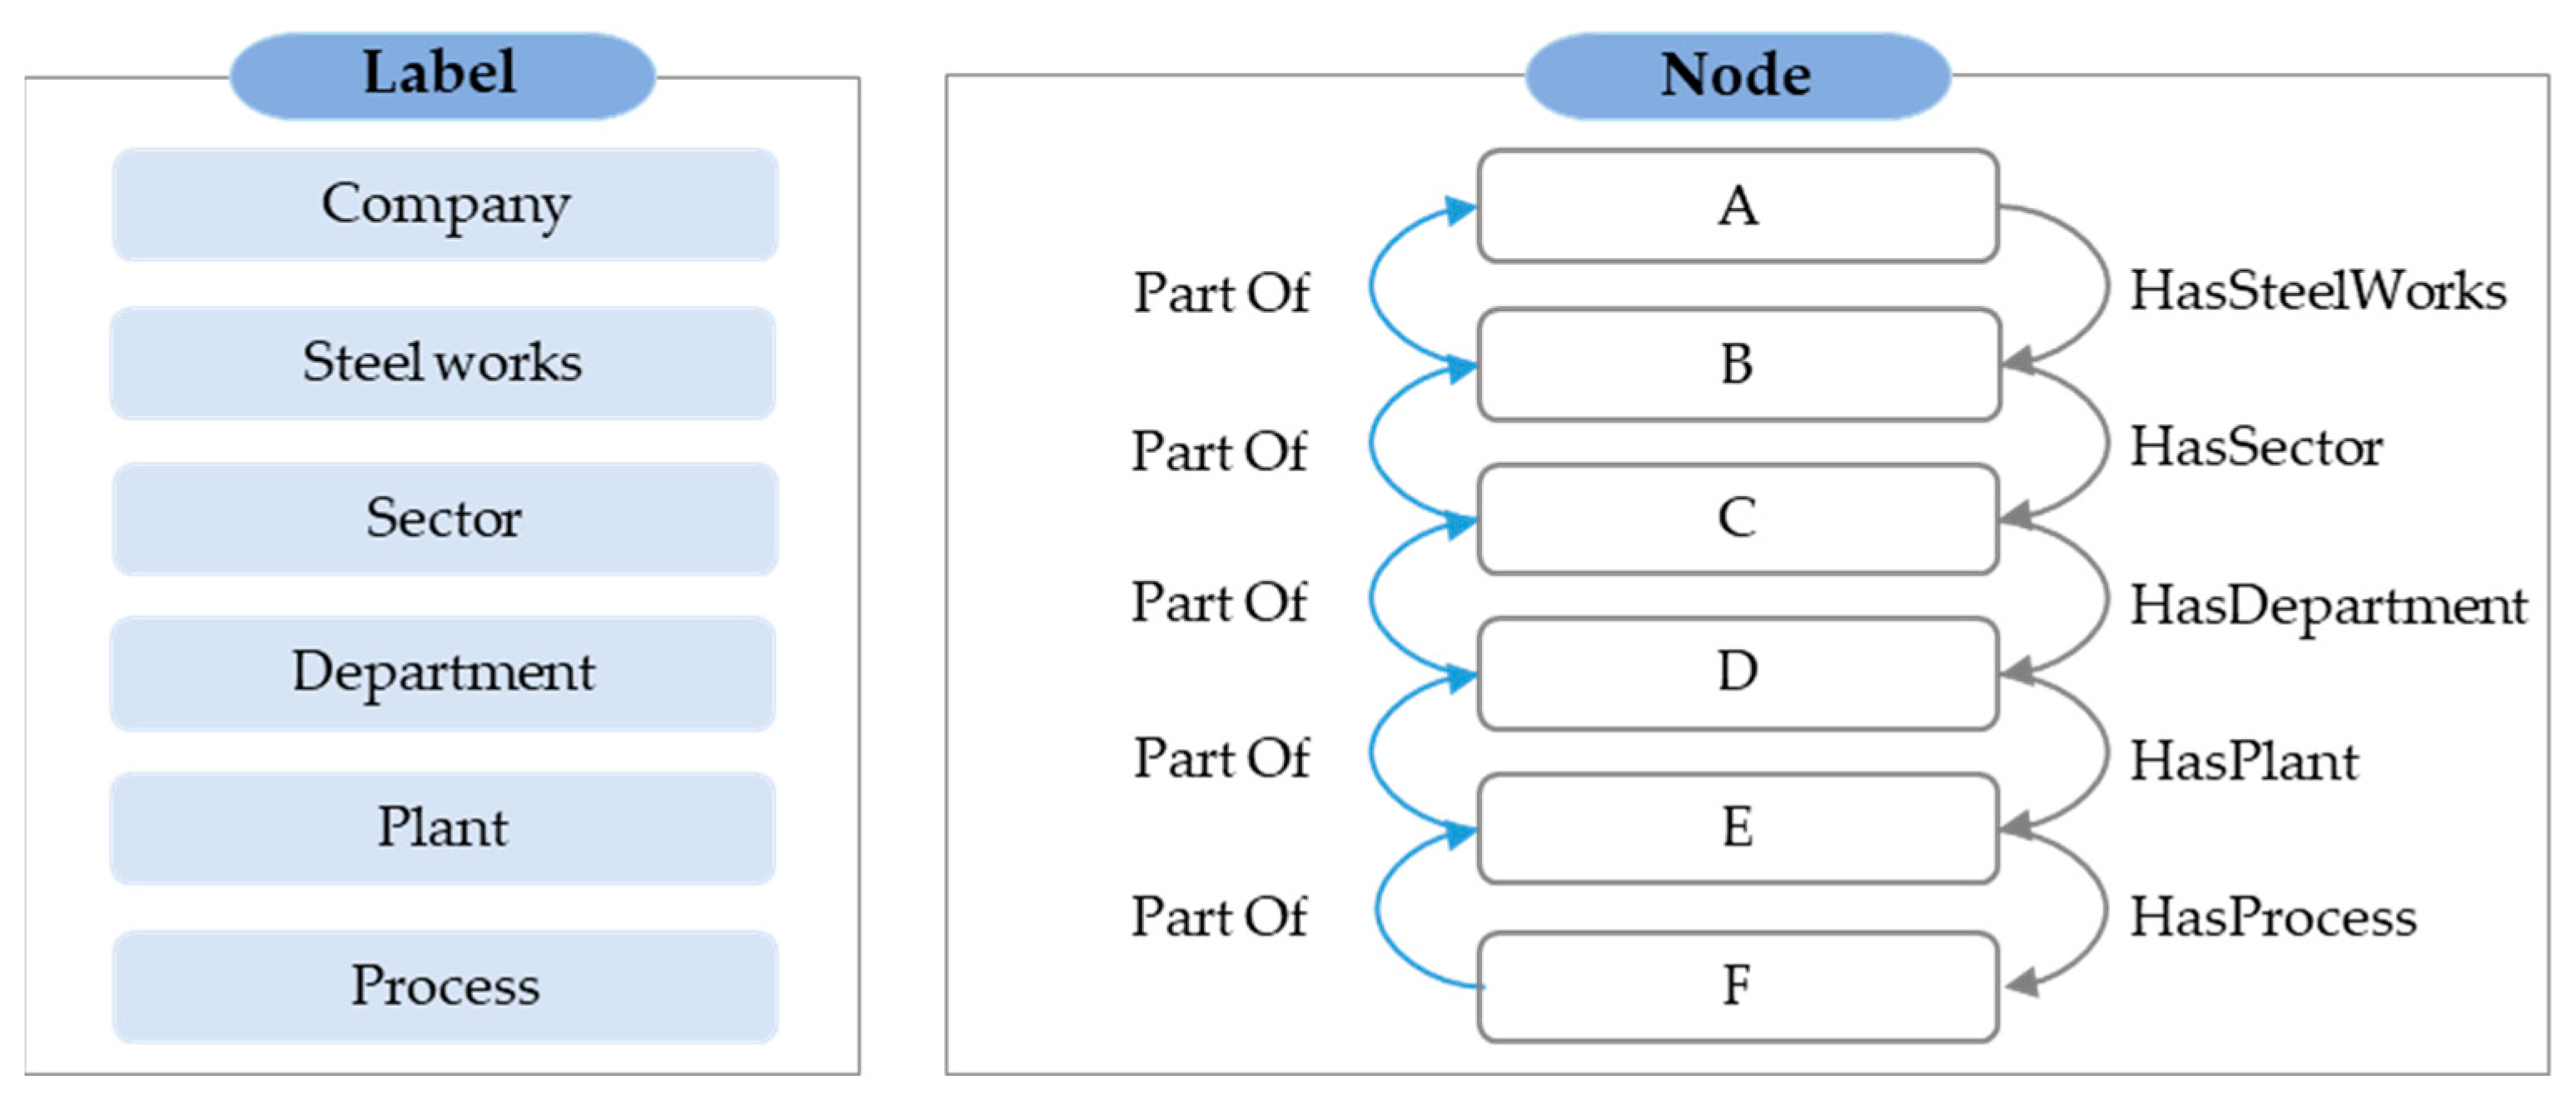
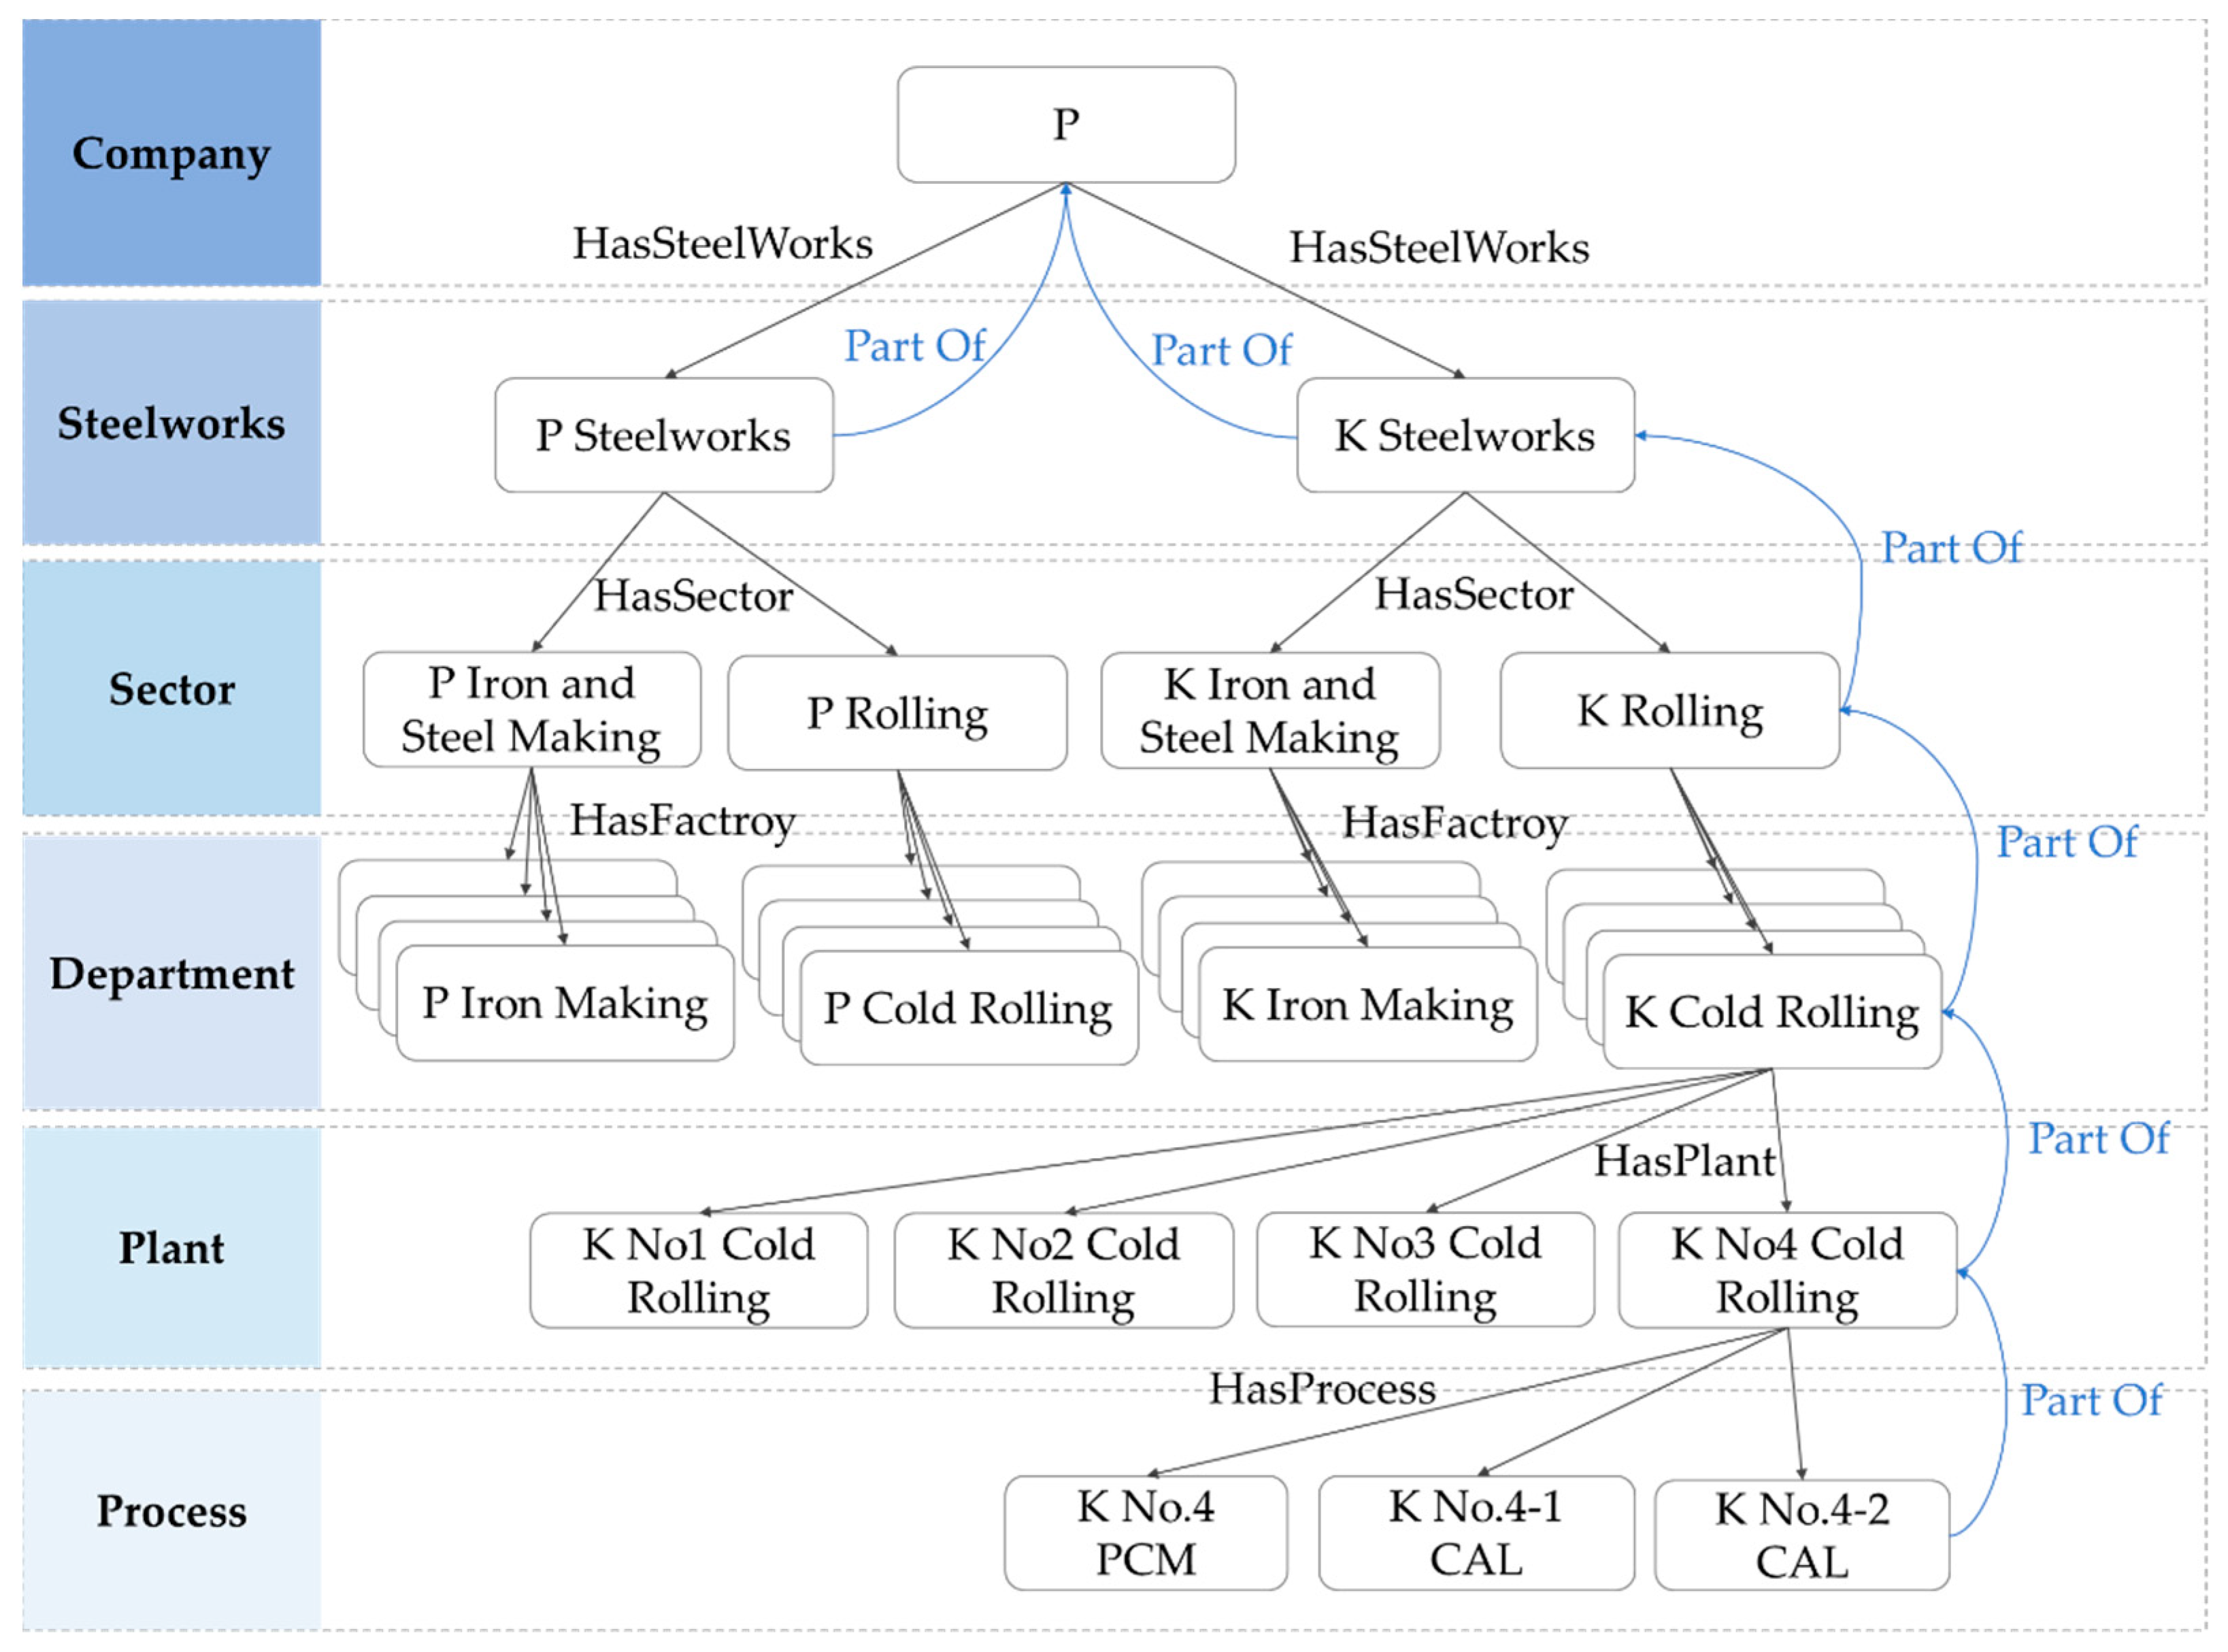
- Factory hierarchy was defined to classify POs by organization. The factory hierarchy consists of six tiers under “company,” ranging from the label of the highest tier to the label of the lowest tier.
- Document hierarchy was defined to classify various documents by type. The document hierarchy consists of four tiers from “document”, which is the node of the highest tier label, to “technical requirement” and “general provision”, which are the nodes of the lowest tier. It was assumed that documents of various categories can be added in the future using the document hierarchy.
- Facility classification hierarchy was defined to classify the items included in the Scope of Supply of POs according to the facility type. The facility classification hierarchy consists of four tiers.
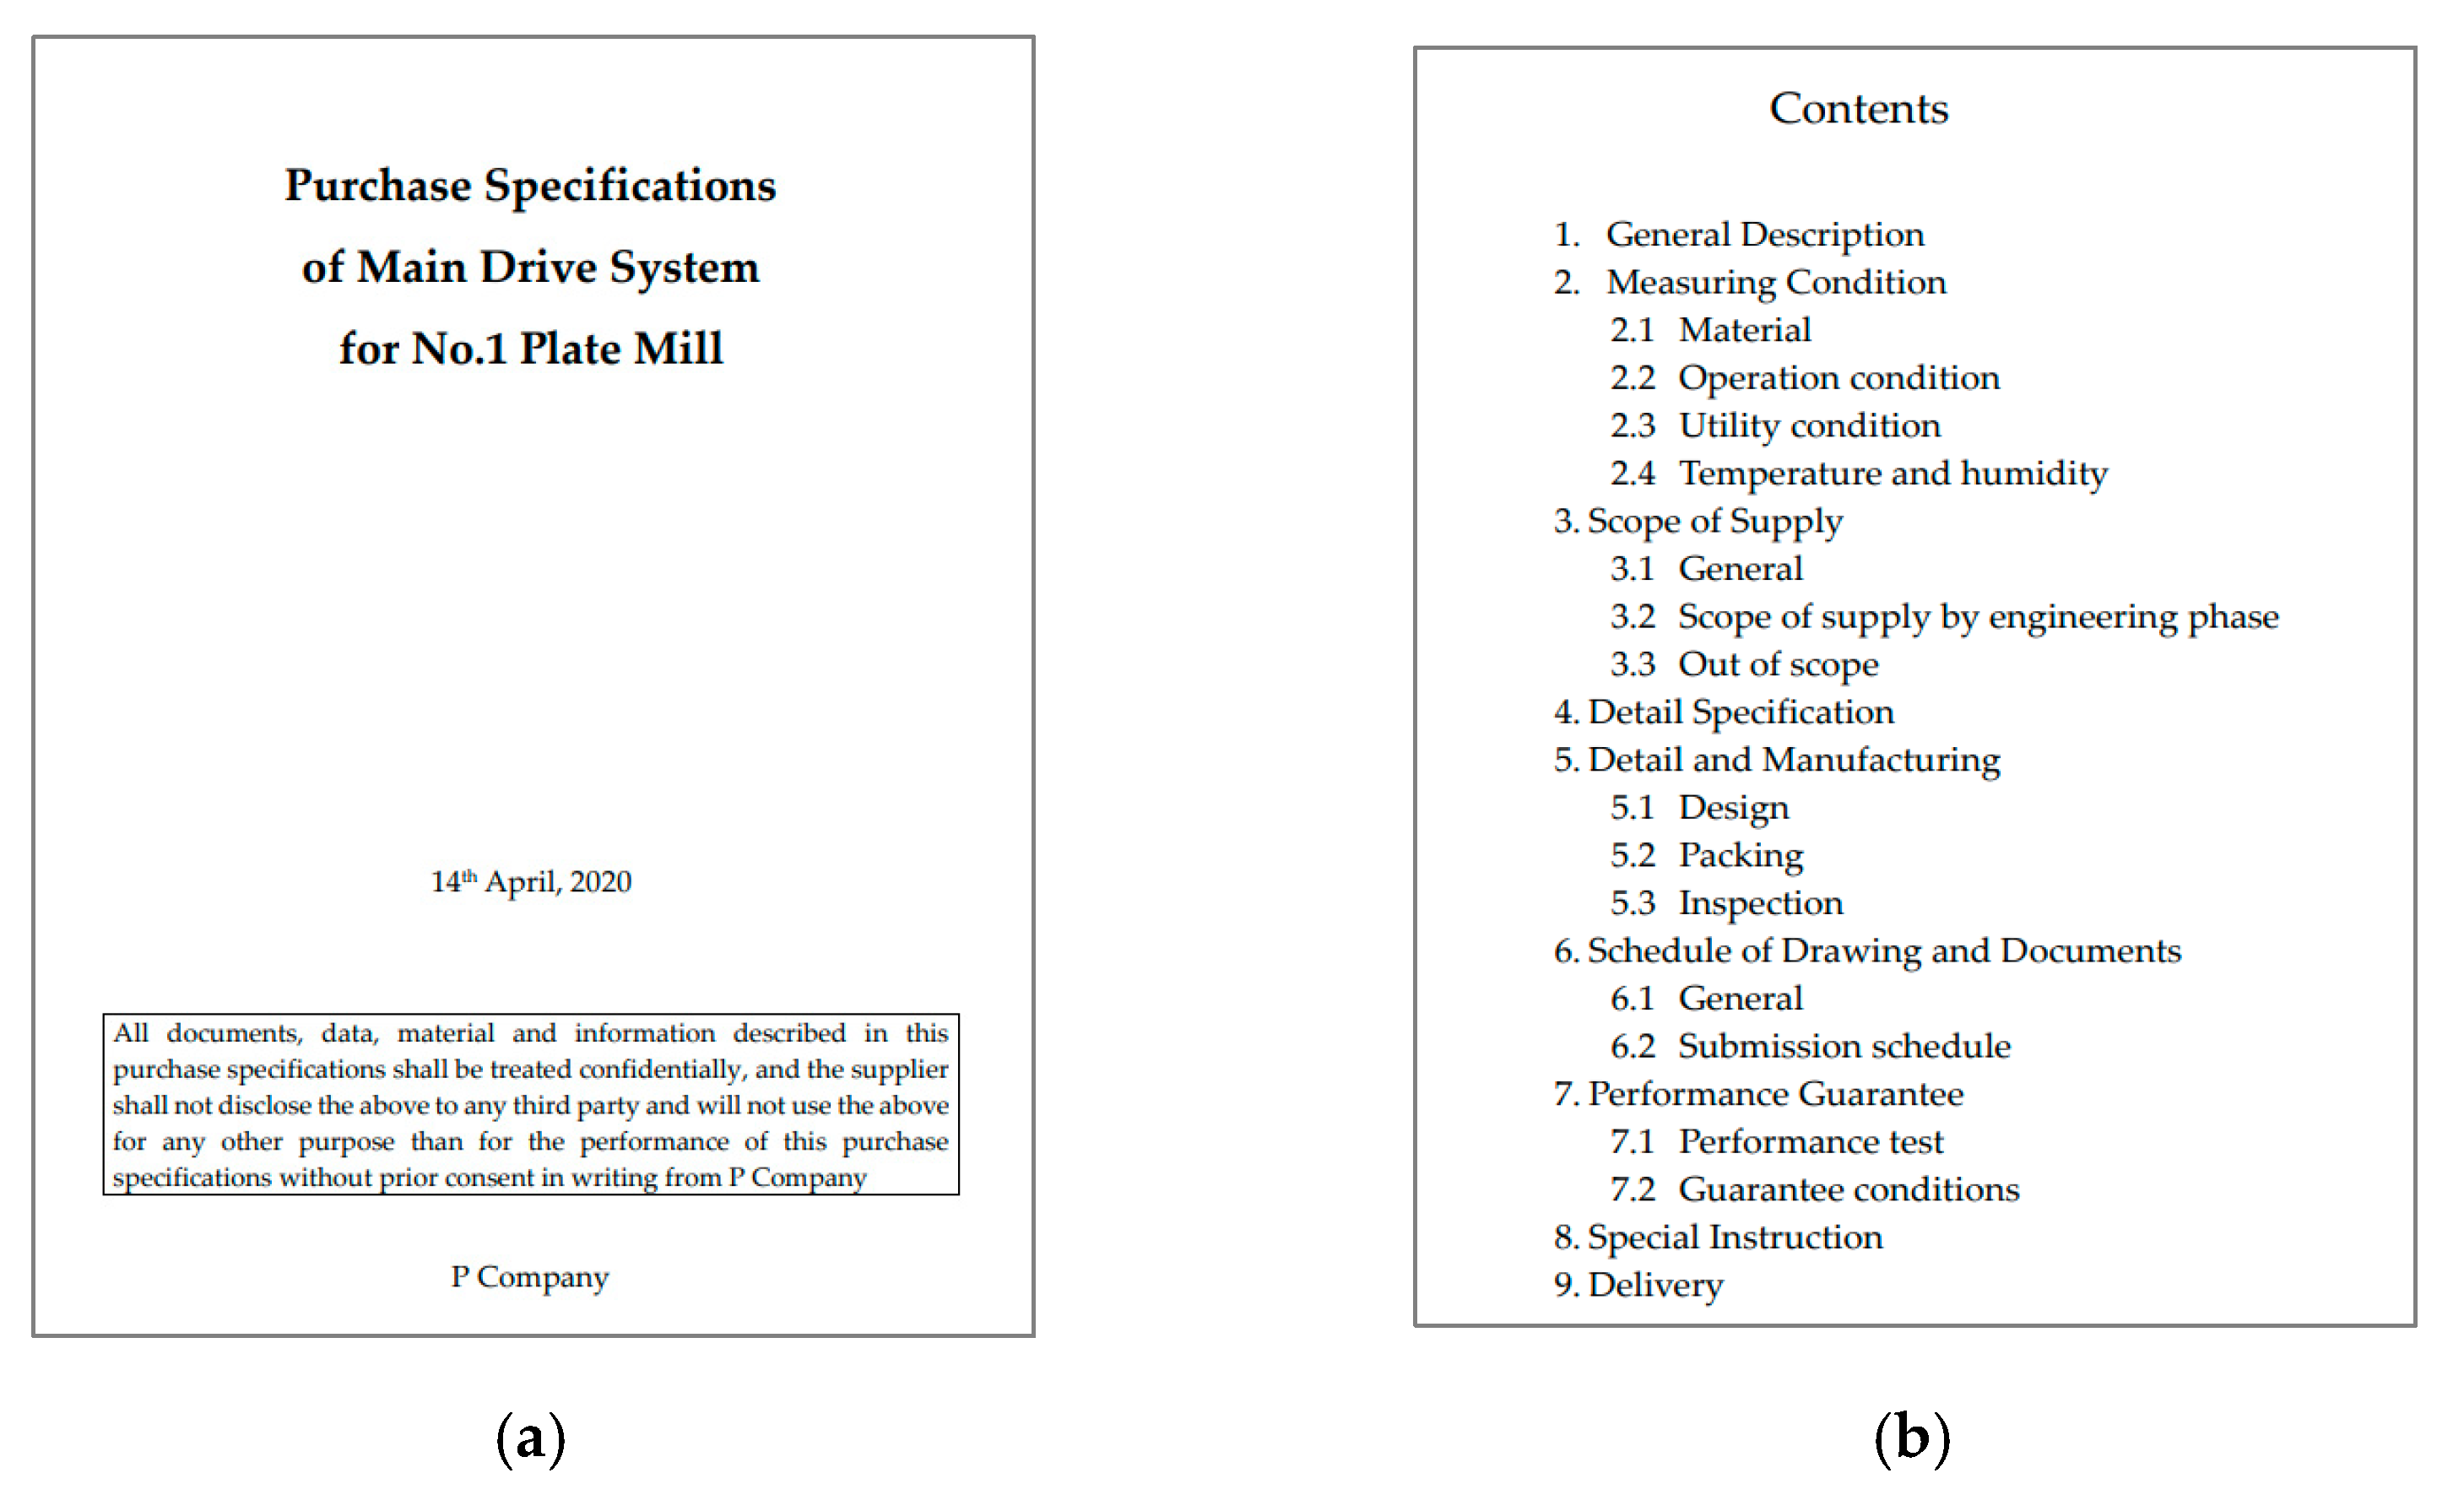
- Definitions of PO data refer to the definitions of the POs of the plant owner, which is the target of this study and consists of the main information on each PO and the item information contained in the Scope of Supply.
5.1. Definition of Factory Hierarchy
5.1.1. Hierarchical Structure
Company P is at the top tier of the factory hierarchy. Company P has two steelworks under the Steelworks label. Because Company P has two steelworks, there may be duplicate names in the tiers lower than steelworks. To solve the problem of duplicate names, “p” was added to the names of the subnodes included in P Steelworks, and “k” was added to the names of the subnodes included in K Steelworks. Each steelwork has a pig iron and steel sector and a rolling sector. The sector label for pig iron and steel has department labels for pig ironmaking and steelmaking. The sector label for rolling has department labels for thick plates, hot rolling, cold rolling, and plating. Each department has at least one plant. However, our definitions in the construction of POKREM were limited to a small number of plants in the cold-rolling department because this study targets POs in the cold-rolling department. Each plant is classified into processes according to its functions, and each plant has at least one process. In the present study, many processes were not defined; only processes deemed necessary for the study were defined to keep definitions to a minimum. To define the factory hierarchy of Company P, we discussed it with five engineers who had worked there for more than ten years. Figure 3 displays the hierarchical structure using specific data based on the steel plant where the case study was conducted. Note that there is not sufficient space to represent the entire factory hierarchy.
Figure 3.
An overview of the factory hierarchy and detailed example.
5.1.2. Node Relationship
In the first four rows of Table 3, Company P is included under “Company” in the hierarchical structure, and P steelworks and K steelworks are included under “Steelworks” in the hierarchical structure. The label of Company P is “Company”, and the label of P steelworks and K steelworks is “Steelworks”. When Company P is the subject, and P steelworks or K steelworks are the objects, the relationship is “HasSteelworks”. By contrast, when P steelworks or K steelworks are the subject, and P company is the object, the relationship is “PartOf”.
Table 3.
Triple format representation of nodes in the factory hierarchy.
If this description in Table 3 is abstracted, it can be expressed as follows: Node A has node B, and node B is part of node A. A relationship called “HasSteelWorks” exists between nodes A and B. As the direction of the arrow is from node A to node B, node A becomes the subject. Node B becomes the object, and “HasSteelworks” becomes the relationship. When the direction of the arrow is from node B to node A, the relationship between the two nodes can be described as follows: Node B is the subject. Node A is the object, and the relationship between the two nodes is “PartOf”. A node included in a relatively lower-tier label in the plant hierarchy is connected to a node included in the upper-tier label by a relationship called “PartOf”. By contrast, a node included in a relatively upper-tier label is connected to a node included in a lower-tier label by a relationship of “HasSteelworks”, “HasSector”, or “HasDepartment”. These descriptions are displayed in Figure 4.
Figure 4.
Concept of relationship between each label and node.
Figure 5 displays the results of applying the factory hierarchy and triple. All the relationships between the nodes in the figure could not be represented because they are quite complex. Therefore, the authors show only some of the arrows associated with the “PartOf” relationship.
Figure 5.
A Conceptual diagram of the relationship between each label class and node.
5.1.3. Converting to Triple
The information entered as input for constructing a KG should be in the form of a triple [10] to facilitate the semantic search. The relationship between the nodes is represented only when the information is defined in the triple form to make it possible to perform reasoning, semantic retrieval, and discovery of new facts using this pattern of nodes and relationships. The triple form allows the KG to be built using the defined factory hierarchy. The name of each tier becomes the label of the nodes belonging to the pertinent tier. Relationships exist between nodes belonging to neighboring tiers, as represented by the arrows in Figure 3. There are two relationships between one node of the upper tier and one node of its neighboring lower tier. The two arrow directions represent this relationship. For example, Company P has P steelworks or K steelworks, and P steelworks or K steelworks are part of Company P. Table 3 lists some of the data shown in Figure 3 in triple form. In Table 3, the subject and object are nodes, whereas “Relationship” refers to the relationship between the subject and object. The arrow of the relationship has a direction starting from the subject and heading toward the object. Referring to the first row of Table 3, the subject is node P, and the object is node P steelworks. A relationship called “HasSteelworks” is observed between the two nodes. In this case, the arrow of the relationship has a direction starting from node P and heading toward node P steelworks. Finally, referring to the first row of Table 3, the label of node P is “company”, and that of P steelworks is “steelworks”.
5.2. Definition of Document Hierarchy
5.2.1. Hierarchical Structure
This study is limited to the POs of Company P as the research target, the authors also defined the document hierarchy for document classification by targeting PO-related classification. The top-level classification label in document classification is dLevel0, and the node name is “Document”. This includes the “Contract” node of the dLevel1 label in the lower tier. Furthermore, the “Contract” node includes the “PO” node on the dLevel2 label. The “PO” node has the “Technical Requirements” and “General Provision” labels of the dLevel3 label. The above document hierarchy was discussed with five engineers who had worked at Company P for more than ten years.
5.2.2. Node Relationship
A relationship called “SubClassOf” connects a node included in a relatively lower class to a node included in a higher class. By contrast, a node included in a relatively higher class is connected to a node included in the lower class by the relationship “Contain”. The words representing the relationships between nodes are different from those used in defining the factory hierarchy. This improves the search accuracy by using a different scope of search or condition depending on the words used in the query stage after the construction of the KG. In this section, the document hierarchy is defined for nodes related to POs. However, the actual user of the model can modify the hierarchical structure according to the purpose because it is easy to create or delete nodes in the graph database-based POKREM.
5.2.3. Converting to Triple
The authors created triples by considering all the relationships in the defined document hierarchy. Table 4 lists the representations of the triple forms for the nodes defined in the document hierarchy. The first row of Table 4 indicates that the subject is the “Document” node; the object is the “Contract” node; and there is a relation called “Contain” between the two nodes. In this case, the arrow of the relationship is starting at the “Document” node and heads toward the Contract node. Finally, referring to the first row of Table 4, the label of the “Document” node is dLevel0, and that of the “Contract” node is dLevel1.
Table 4.
Triple format representation of the nodes in document hierarchy.
5.3. Definition of Facility Classification Hierarchy
5.3.1. Hierarchical Structure
It is necessary to define the facility classification hierarchy to classify the types of items recorded within the Scope of Supply of the PO. This is particularly useful for classifying facilities by type when performing semantic searches after developing the POKREM. In this study, the facility classification hierarchy of the cold-rolling department was defined by discussing with two engineers who had worked at Company P for more than ten years. The top label in the facility classification is fLevel0, and the node name is “Facility”. The sublabels range from fLevel1 to fLevel3, and each label has classification nodes. The lowest classification level is fLevel3.
5.3.2. Node Relationship
In the facility classification hierarchy, a node included in a relatively lower class is connected to a node in the higher class by a relationship called “subGroupOf”. By contrast, a node included in a relatively higher class is connected to a node included in a lower class by the relationship “Include”. Regarding the first entity in Table 5, “Facility”, the node of the fLevel0 label is connected to “Civil Machinery Part”, a node of the fLevel1 label by the “Include” relationship. The same two nodes are also connected by a relationship called “SubGroupOf”, which is heading from the “Civil Machinery Part” node to the “Facility” node. “Civil machinery part”, a node of the fLevel1 label, is connected to “Industrial Machinery”, a node of the fLevel2 label by a relationship of “Include”. By contrast, “Industrial Machinery”, a node of the fLevel2 label, is connected to the “Civil Machinery Part” of the fLevel1 label by a relationship of “SubGroupOf”. “Industrial Machinery”, a node of the fLevel2 label, is connected to “Crane Equipment”, a node of the fLevel3 label, by a relationship of “Include”. By contrast, “Crane Equipment”, a node of the fLevel3 label, is connected to “Industrial Machinery”, a node of the fLevel2 label by a relationship of “SubGroupOf”. In addition, in the second row of Table 5, “Field Instruments”, a fLevel2 node, has relationships of “Include” and “SubGroupOf” with three fLevel3 nodes.
Table 5.
Hierarchical structure for facility classification.
5.3.3. Converting to Triple
Considering all the defined relationships in the facility classification hierarchy, triples were created in the formats listed in Table 3 and Table 4. There are many nodes and relationships included in the facility classification hierarchy, and detailed information is provided in Appendix A and Table A1. Referring to the first row of Appendix A, Table A1, the subject is the “Facility” node; the object is the “Civil Machinery Part” node; and there is a relationship of “Include” between the two nodes. In this case, the arrow of the relationship has a direction starting from the “Facility” node and heading toward the “Civil Machinery Part” node. Finally, referring to the first row of Table 5, the label of the “Facility” node is fLevel0, and that of the “Machinery Part” node is fLevel1.
5.4. PO Document and Data Definition
5.4.1. Data Structure
The PO contract number was defined as the name of the PO node, and the primary information of POs consisting of ProjectTitle, PublishedDate, DateOfDelivery, and CompletionDate was defined in the properties of the PO node. Each PO has a target process to be connected to by a relationship. For example, if the PO node structure is described using the first entity in Table 6, the name of the PO node is “T36695”, and “Project Title”, “Published Date”, “Date Of Delivery”, and “Completion Date” are the properties. In this case, the value of the “Project Title” property is “Purchase Specifications of a Control System for No.1 PCM P Works”. The value of the “Published Date” property is “2020-03-17”, and that of the “Date of Delivery” property is “2020-05-31”. The value of the “Completion Date” property is “2020-10-31”. The data format of the “Published date”, “Date of Delivery”, and “Completion Date” is the date (YYYY-MM-DD). The target process of the PO node is “P 1PCM“, and the relationships of “HasDocument” and “PartOf” exist between the PO node and the target process node. In this study, the security of Company P was discussed with two engineers who had worked at the company for more than ten years and generated ten POs. Table 6 shows specific information on the PO.
Table 6.
PO data developed for a specific case study.
An item node was defined as an item included in the PO’s Scope of Supply. To identify each node, a necessary process in KG development is to set a naming rule to distinguish between names and nodes of the same type. The semantic web uses uniform resource identifiers (URIs) to distinguish the identities of nodes with the same name [10]. Items of the same type are not the same if they are included in different POs even if they have the same name. In this study, the name of each item node was defined using the item name and PO contract number to prevent duplication of the name when the same type of item was included in multiple POs. The type, “Quantity”, and “Quantity Unit” were defined as properties of the item node. Each item was included in the Scope of Supply of the PO node that has the value of the column name “PO ID”. Table 7 presents the information on ten item nodes under PO contract number T36695 among the 80 item nodes. Each item node has a relationship with a facility classification node having as its name the value of the column name “Facility Type”.
Table 7.
Item node information of PO contract number T36695.
5.4.2. Node Relationship
The relationships among the process node of the factory hierarchy, the PO node, the item node, and the node belonging to the facility classification hierarchy are described using the information in the first rows of Table 6 and Table 7. The target process node “P 1PCM” belonging to the factory hierarchy has relationships of “HasDocument” and “PartOf” with PO node “T36695”, and item node “P/C Server_T36695” has relationships of “HasItem”, “SupplyItemOf”, and “PartOf”. Item node “P/C Server_T36695” has relationships of “Include” and “SubGroupOf” with the node “Computer” included in the facility classification hierarchy.
5.4.3. Converting to Triple
A PO node has the Document label, whereas an item node has the Item label. Table 8 presents the above descriptions in the form of triples. Referring to the first row of Table 8, the subject is the P 1PCM node; the object is the T36695 node; and there is a relationship of “HasDocument” between the two nodes. In this case, the arrow of the relationship has a direction starting from the P 1PCM node and heading toward the T36695 node. Finally, referring to the first row of Table 8, the P 1PCM node label is “Process”, and the T36695 node label is “Document”.
Table 8.
Triple format representation of the relationship between process, PO, item, and nodes belonging to the facility hierarchy.
In Figure 6, the relationships between the nodes of the four domains defined thus far are displayed. In Figure 6, the white node in the upper-left part represents a PO node. In this case, the PO node has a relationship of “PartOf” or “HasDocument” with “K 4-2CAL”, which is the “Continuous Annealing Line” node belonging to the factory hierarchy. The PO node also has a relationship of “SubClassOf” or “Contain” with the “Technical Requirements” node belonging to the document hierarchy. The PO node has a relationship of “HasItem” or “SupplyItemOf” with the item nodes included in Scope of Supply. In Figure 6, the PO node has relationships with six-item nodes. Each of the six-item nodes has a “SubGroupOf” or “Include” relationship with the node corresponding to its own facility category. For example, since the item node “O.S” is included in “Basic Software” among the facility categories, the item node “O.S” has a relationship with the “Basic Software” node.
Figure 6.
Relationships among nodes included in factory, document, facility hierarchy, and PO data.
For the security of the company, the authors defined the PO data through a process of discussion with engineers with field experience without extracting data through document recognition. The task of generating the information on numerous documents in the graph database may be time-consuming and inefficient if there is no automatic document recognition function. In the future, a document recognition function will be developed to facilitate efficient input of numerous documents in real-world applications.
6. Development of the POKREM
This section describes the process of generating a graph of the defined data in the graph database using the defined four domains. First, the preprocessing of the four-domain data executed to efficiently generate many defined nodes is described along with the relationships in the graph database. Second, the process of importing preprocessed data into the graph database is described. Then, the rule-based reasoning applied to complete the POKREM is described. For the POKREM, a knowledge retrieval model was created using the Neo4j graph database and developed as a platform using a web server. Finally, the development process of the POKREM platform using a web server is described.
6.1. Data Preprocessing
There are five methods for creating nodes in Neo4j [51]. The first uses Cipher’s CREATE command. This method is slow when importing large amounts of data. The second method uses CSV files. This method is useful when importing batch data, but the speed is reduced when importing more than ten million nodes. The third method uses the official Java API-batch insert. This method can only be used in Java. The fourth method uses the batch import tool created by Michael Hunger, one of the authors of Neo4j. Neo4j must be stopped before using the batch import tool. The fifth method uses the official Neo4j import tool. This method uses fewer resources than the batch import tool; however, it can only be used to create a new database, and it is impossible to import data into an existing database. In this study, the authors used the method of CSV files, considering the disadvantages and constraints of the aforementioned node creation methods.
For example, the nodes and properties are basically to create a graph for the first entity in Table 7, after which the relationships and labels of the nodes are created. This is performed using the “Create”, “Match”, and “Merge” commands for each node in Cipher, a query language of Neo4j. The same commands are repeatedly executed for all nodes and relationships to build POKREM, which is a time-consuming task. Neo4j creates many nodes with a batch command by writing the information of each node in the CSV file format to easily handle such repetitive tasks [51]. To use this function, the authors created CSV files using information, such as each node’s name, properties, and names of the nodes, to connect by relationships. These Excel files must be saved in the “CSV UTF-8” format. Figure 7 illustrates the CSV file used to create the nodes in Table 7. In the file, the item called “Name” defines the name of each node, and the columns “Type”, “Quantity”, and “QuantityUnit” define the properties of each node. The names of neighbor nodes to form relationships are defined in the “POID” and “FacilityType” columns.
Figure 7.
Example CSV file for node creation.
Table 9 lists ten CVS files that were prepared to create multiple nodes effectively. A few nodes not included in the CSV files were created by manually entering the “Create” or “Merge” command. In Table 9, the values in the column “CSV File Name” show file names, and the values in the column “Label” show the label values of the nodes created by those files. The values in the column “Number of Nodes Included” represent the quantities of the nodes created by those files.
Table 9.
List of CSV files for node creation.
6.2. CSV File Import Processing
Nodes can be created using commands, such as “Create” and “Merge”, but the authors used the method of importing CSV files to create multiple nodes effectively. For example, to create nodes included under the Steelworks label, the authors created a CSV file, as shown in Figure 8. In Figure 8, the values in the column “Name” are the names of the nodes to be created, and the names in the column “PartOf” are the names of the nodes that will be connected to the nodes of the column “Name” by relationships of “PartOf” and ”HasSteelworks”. The two nodes to be created were defined by “P Steelworks” and “K Steelworks”.
Figure 8.
Example steelworks.csv file for node creation of steelworks label.
Figure 9 shows the results of executing the aforementioned commands. Figure 9 shows the created “K Steelworks” and “P Steelworks” nodes; they have a relationship of “PartOf” or “HasSteelworks” with the node P that was created earlier. Similarly, all nodes and relationships related to plant hierarchy, document hierarchy, facility classification hierarchy, and PO data were created in the graph database. Detailed information on program source codes is provided in Appendix B.
Figure 9.
Company Node and Steelworks Node created in a graph database.
6.3. Application of Rule-Based Reasoning
The completion of a KG refers to predicting the missing nodes or relationships in the KG and discovering unknown factors [52]. Using the KG’s reasoning function, one can obtain additional facts in addition to the simple facts entered in the existing KG model. Reasoning is a method of creating new data from existing data while drawing conclusions based on known data [10]. In this study, considering that the POKREM consists of a small number of nodes and relationships, the authors used rule-based reasoning among the reasoning methods to complete the POKREM. The rules used in rule-based reasoning are as follows:
- If node A and node B have a relationship of “HasSteelworks”, “HasSector”, “HasDepartment”, “HasPlant”, “HasProcess”, “HasDocument”, or “HasItem”, then nodes A and B have a “Has” relationship.
- If there is a relationship of “Has” from node A to node B, then there is a relationship of “PartOf” from node B to node A.
- If there is a “PartOf” relationship from node A to node B, then there is a “Has” relationship from node B to node A.
- If node A has a “Has” relationship with node B, and node B has a “Has” relationship with node C, then nodes A and C have a “Has” relationship.
- If node A has a “PartOF” relationship with node B, and node B has a “PartOF” relationship with node C, then nodes A and C have a “PartOF” relationship.
- If node A has a “SubClassOf” relationship with node B, and node B has a “SubClassOf” relationship with node C, then nodes A and C have a “SubClassOf” relationship.
- If node A has a “Contain” relationship with node B, and node B has a “Contain” relationship with node C, then nodes A and C have a “Contain” relationship.
- If node A has a “SubGroupOf” relationship with node B, and node B has a “SubGroupOf” relationship with node C, then nodes A and C have a “SubGroupOf” relationship.
- If node A has an “Include” relationship with node B, and node B has an “Include” relationship with node C, then nodes A and C have an “Include” relationship.
The above reasoning rules are applied using the semantics of “SubClassOf” used in the Resource Description Framework Schema (RDFS) language [10]. When the rule-based reasoning method is used, the conditions and results of the reasoning are relatively simple. In the future, it is expected that neural network reasoning or distributed representation-based reasoning can be applied to produce various reasoning results in a development environment in which additional domains and many nodes can be created.
Using the reasoning rules and CSV files with data defined in the four domains, the authors developed a POKREM consisting of 191 nodes, 16 types of labels, and 2704 relationships.
6.4. System Integration of POKREM
This section describes the system integration of the POKREM. First, the composition of the web server and the flow of functional processing are presented followed by an example of an interface using system integration.
6.4.1. Configuration and Flow of Web Server
After applying rule-based reasoning, the authors developed a POKREM platform by building a web server for user convenience. Windows 10 was the OS used to build the platform. Two databases were used to build this POKREM platform. Neo4J, which is the subject of this study, was used as a graph database, and the MySQL database was used to handle the web server login and query-saving functions [53]. For the web server, the authors used Apache [54]. ‘Angular’ was used as the web server’s user interface framework [55]. Angular’s TypeScript is Node.js [56]. Apache Tomcat was used as the web application server (WAS) [57]. Apache Tomcat operates using the Java Development Kit (JDK). JDK is a distributed version of Java technology developed by Oracle [58]. Bolt was used as the protocol between Neo4j and the web server [59]. For the protocol between MySQL and WAS, the authors used Java Database Connectivity (JDBC) [60]. Finally, the Apache JServ Protocol (AJP) was used as a protocol between the web server and WAS [61]. Figure 10 illustrates the system architecture of the POKRM platform.
Figure 10.
Configuration of web server system.
The functional processing flows of the web server are as follows:
- Process of the user accessing the server: When a user enters a URL and accesses the system, the web server displays the login screen to the user. Then, when the user inputs their ID and password on the login screen, the entered ID and password information is sent from the web server to the MySQL DBMS through the WAS. The login is either processed successfully or fails based on the operation of comparing to the actual ID and password.
- Process of handling a PO-related query: When the user inputs a query related to the PO in the query input window after logging in successfully, the web server passes the query to the Neo4J DBMS and receives and displays the processed result on the user’s screen.
- Process of saving a PO-related query: When the user writes a PO-related query and requests to save the query, the web server saves the query created in the MySQL DMBS through the WAS.
- Process of using a saved query: When the user queries a saved query, the web server displays the query saved in the MySQL DMBS on the user screen through WAS. When the user selects the saved query and requests processing, the web server passes the query to the Neo4j DBMS and upon receiving the processed result, displays it on the user screen.
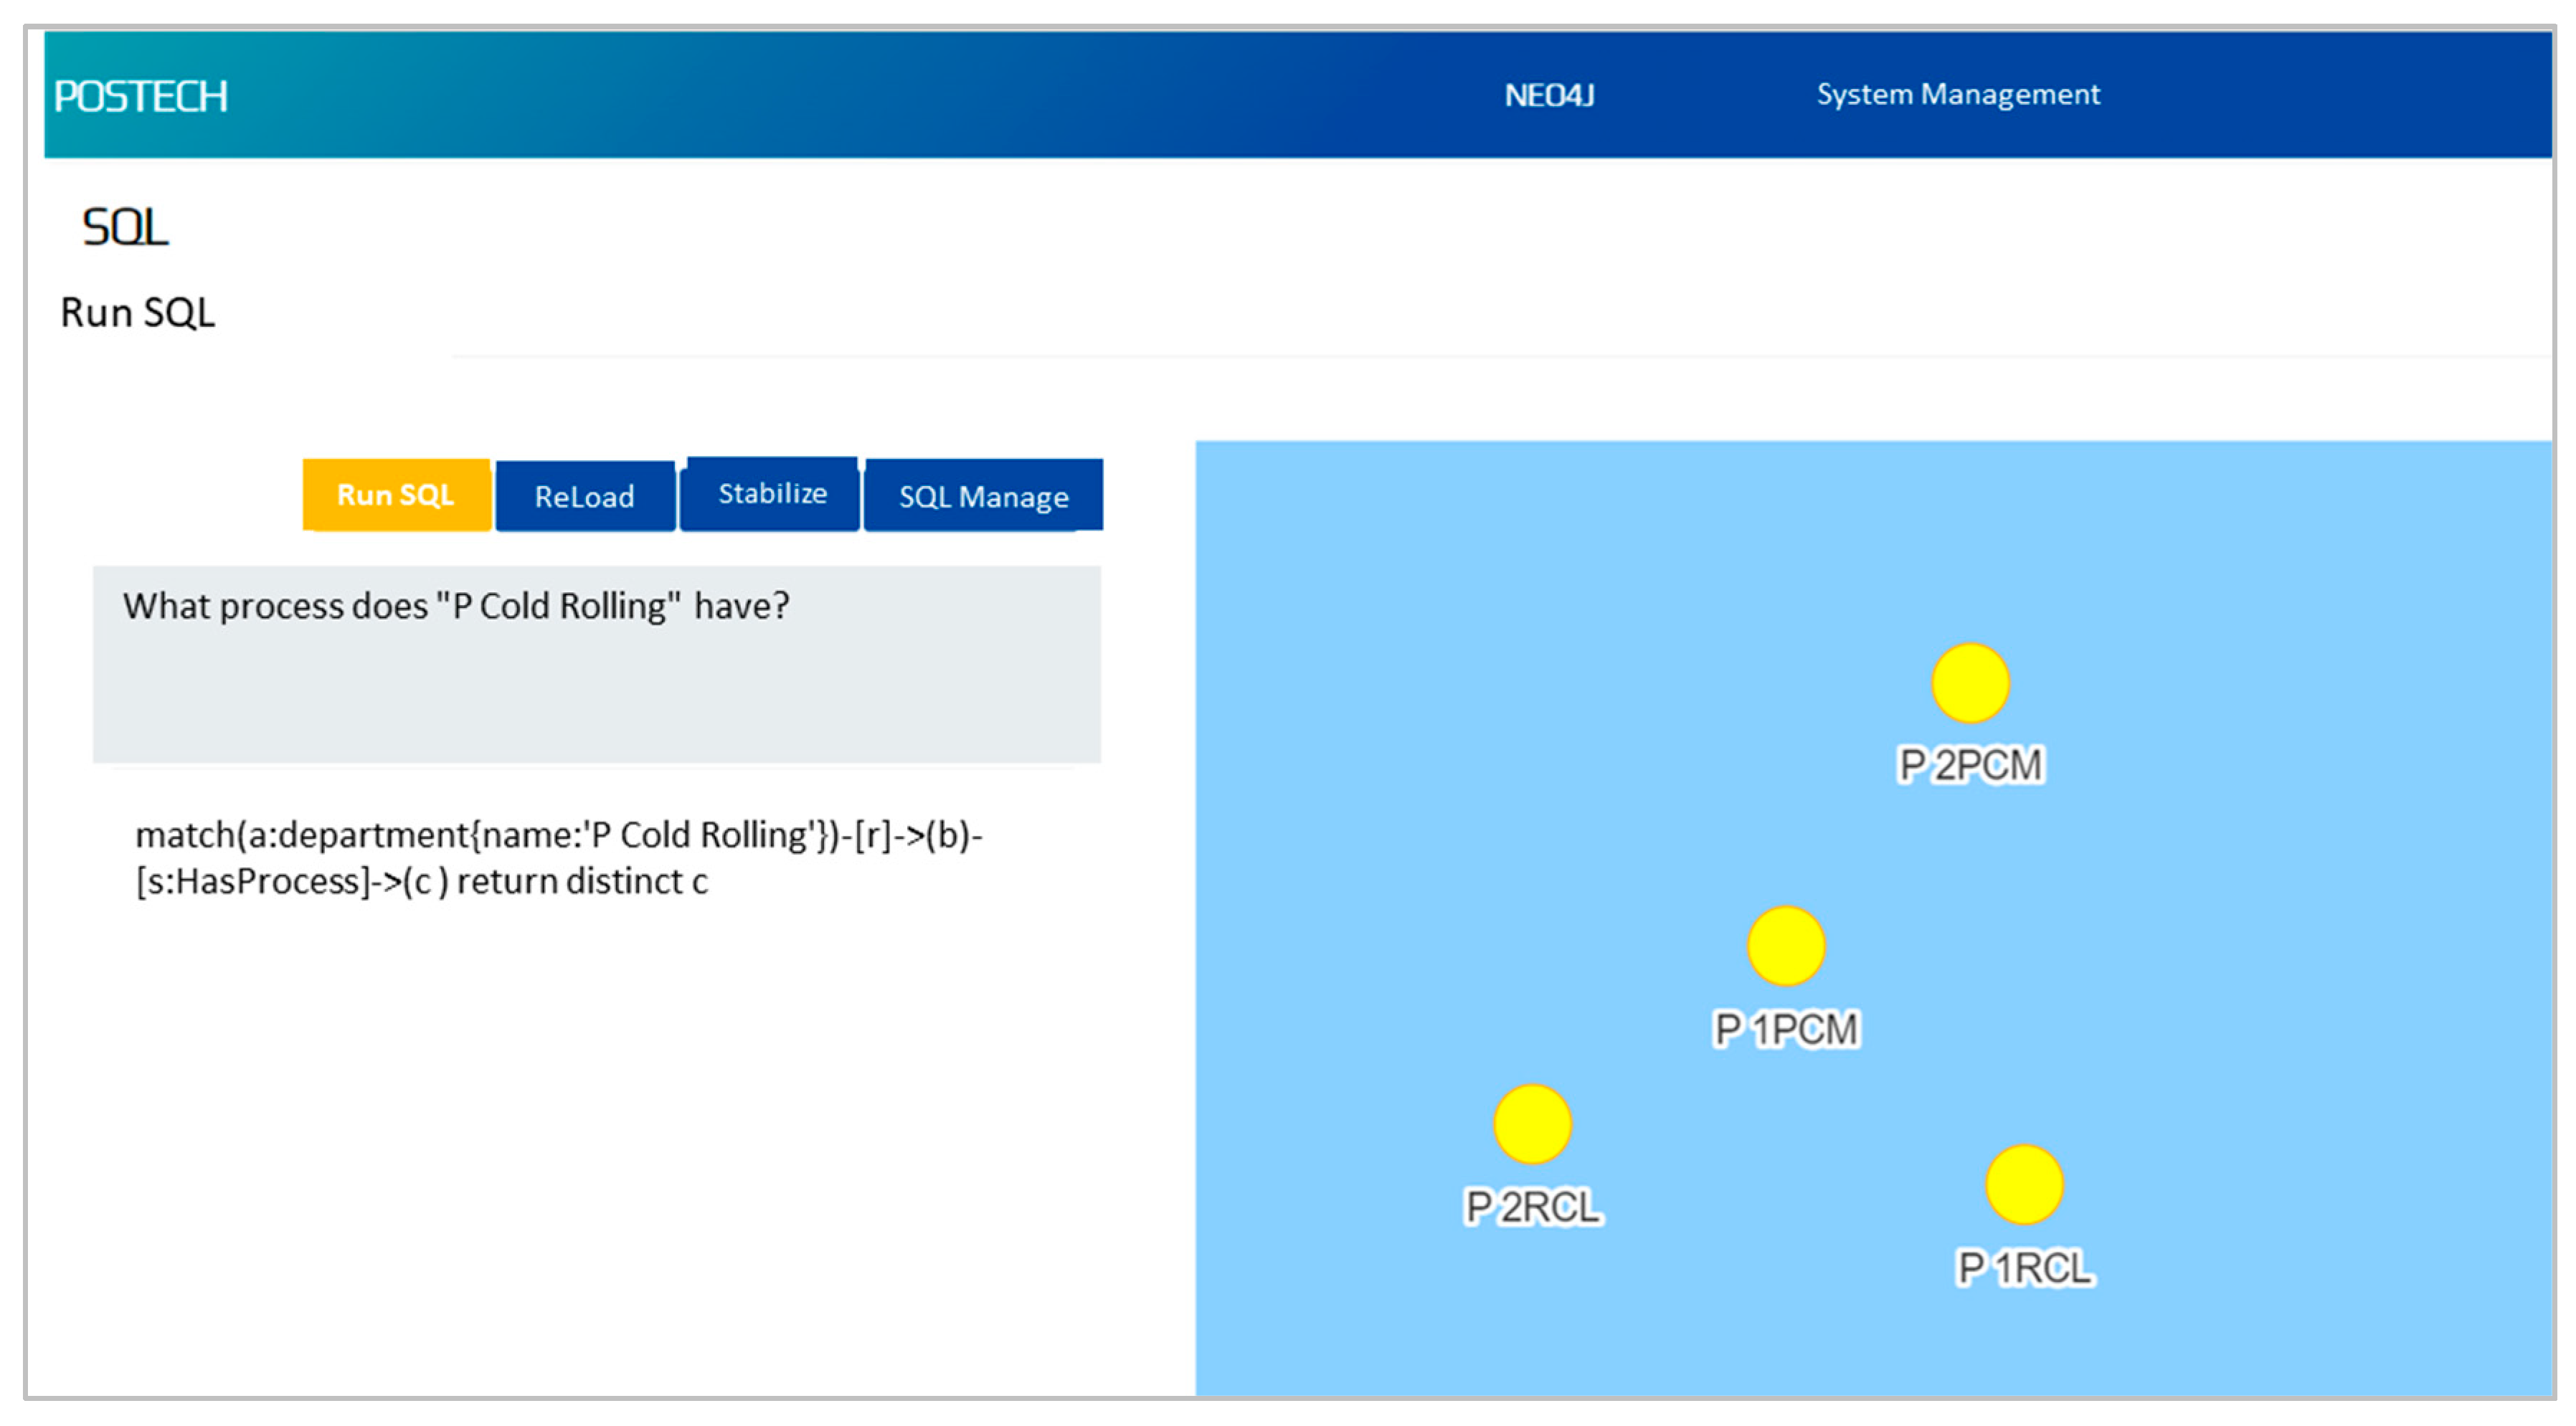
6.4.2. Interface Example Using SI
The POKREM platform, built using the web server, allows for the use of the POKREM anywhere with access to the network. The platform provides functions to write and save queries, thereby using the saved queries. Figure 11 shows a screenshot of the developed POKREM platform. In the screenshot of Figure 11, the middle left shows the query. A sentence expressing the meaning of the query is shown at the top of the query. This is a manually written sentence, saved with the query.
Figure 11.
A screenshot of the POKREM platform.
7. Test and Validation
This section describes the process of testing the developed POKREM, examining the test results, and determining the validity of the model. First, the test data are divided into three stages to evaluate the performance of the POKREM. Second, the performance evaluation metrics, which are the basis of the performance measurement in the tests, and their meanings are described followed by a description of the validation of the test results. Fourth, the evaluations by the users of Company P are described. Finally, the results are presented.
7.1. Test Data
To check whether the constructed POKREM submitted correct search results for the input information, the authors prepared a total of 45 questions and correct answers, 15 each, for each of the three stages. The first-stage test (Test 1) consisted of queries and correct answers related to internal input information for each domain of the factory hierarchy, document hierarchy, facility classification hierarchy, and PO data. The goal of Test 1 was to examine whether the completed POKREM normally responds to queries of the input information for each domain. For example, query no. 1 is related to the factory hierarchy domain. The query is “What are the steelworks of Company P?” and the correct answer is “P Steelworks” and “K Steelworks”. Queries 1 through 7 are related to the factory hierarchy. Query 8 is related to the document hierarchy. Queries 9 through 11 are related to the PO data. Finally, Queries 12 through 15 are related to the facility classification hierarchy. Table 10 shows the queries and correct answers for Test 1.
Table 10.
Query and correct answers for the first stage of the test.
The second-stage test (Test 2) consisted of queries and correct answers related to two or more domains. The goal was to check whether the POKREM produces correct answers by considering the information from multiple domains. In this test, the authors check whether the developed POKREM can provide semantic search results beyond simply checking the input information. Appendix C and Table A2 present the queries and correct answers for Test 2.
The goal of the third-stage test (Test 3) was to examine whether the results inferred by the completed POKREM for queries related to the reasoning rules matched the correct answers. In this test, the authors examine the performance of the developed POKREM’s inference ability for new facts rather than using simple input information. Appendix C and Table A3 present the queries and correct answers for Test 3.
7.2. Performance Evaluation Metrics for Testing
To evaluate the performance of the constructed POKREM, the authors applied a method commonly used in the performance evaluation of a KG in accordance with this study [62]. Queries were processed, and the responses received from the constructed POKREM were compared with the correct answers to evaluate the performance in each of the three-stage tests. The performance evaluation metrics included accuracy, precision, recall, and F1 score. The classification values of the confusion matrix in the current test are as follows:
- True Positive (TP): The case of a correct answer that is included in the query result of the constructed POKREM.
- False Negative (FN): The case of a correct answer that is not included in the query result of the constructed POKREM.
- False Positive (FP): The case of an incorrect answer that is included in the query result of the constructed POKREM.
- True Negative (TN): The case of an incorrect answer that is not included in the query result of the constructed POKREM.
The performance evaluation metrics for the KG included accuracy, precision, recall, and F1 score, which can be calculated from the TP, TN, FP, and FN of the confusion matrix. A study by Sokolova and Lapalme [63] is referenced for the equations of the four performance evaluation metrics. Accuracy in Equation (1) is calculated as the ratio of the correct answers in the query results of the POKREM to the query results of the POKREM:
Precision in Equation (2) is the ratio of the number of cases in which the POKREM query result is a correct answer to the number of cases included in the POKREM query results.
Recall in Equation (3) is calculated as the ratio of the number of cases in which the query result is regarded as a correct answer by the POKREM to the number of cases of correct answers:
The F1 score is the harmonic mean of precision and recall, as shown in Equation (4):
7.3. POKREM Modeling Accuracy Test
In this test, the queries prepared in Section 6.1 were processed in the developed model, and the processing results and responses were compared to the correct answers. Test 1 consisted of 15 queries and 43 correct answers. The test at this stage was designed to evaluate the POKREM’s ability to derive accurate answers for queries related to a single defined domain in the POKREM development process. Test 2 consisted of 15 queries and 52 correct answers. The test at this stage was designed to evaluate the POKREM’s ability to derive accurate answers for queries related to two or more domains in the POKREM development process. Test 3 consisted of 15 queries and 93 correct answers. The test of this stage was designed to evaluate the POKREM’s rule-based reasoning and whether new facts are accurately derived in the POKREM development process. According to the test results, the constructed POKREM derives correct answers for simple queries related to the data of a single domain. It also derives correct answers for complex queries related to two or more domains. In the reasoning-related results, the authors found cases in which the results were not correct answers but were included in the POKREM’s responses. The overall performance of the developed POKREM was excellent, displaying an accuracy of 99.7%. The precision value was 91.7%, which means that the KG’s responses included incorrect answers. The value of recall was 100%, indicating that the correct answers were all included in the POKREM responses without any misses. The F1 score was 95.7%, indicating that the PORKREM’s overall performance was excellent. Table 11 displays the values of the performance evaluation metrics for each test.
Table 11.
Test result.
7.4. Validation for User’s System Applicability
After the test of the POKREM system, a focus group interview (FGI) was conducted to analyze the effectiveness of the PO review for the model. Although the sample size is small, the FGI method was applied to examine the effectiveness of the POKREM model in order to obtain technical information [64]. This FGI is the second survey of this study. Only 7 persons with more than 10 years of PO-related work experience were targeted among the 18 respondents to the first survey conducted in Section 3.1. Table 12 shows the information on the 7 participants in the FGI.
Table 12.
The information on participants in focus group interview (FGI).
Subsequently, a survey was conducted on the effectiveness of the POKREM in their field. The FGI discussed two issues. The first is whether the POKREM system would be helpful in the PO business process if used as a business support function. The second issue relates to how much the POKREM could reduce the time used for the PO business process. According to the survey results, 57.1% of the respondents answered that the POKREM would be very helpful if used as an assistant in their work, and 28.6% responded that the POKREM would be helpful in their work. Of the respondents, 14.3% answered that they were unsure if the POKREM would be helpful in their work. In the survey, 33.3% of the respondents answered that over 80% of the total document review time would be reduced when asked how much time would be saved by the POKREM in the process of reviewing documents. Another 33.3% of respondents answered that the use of the POKREM would reduce the time spent reviewing documents by 40% to 60%. For the same question, 16.7% of the respondents answered that the POKREM would reduce the time spent reviewing documents by 20% to 40%, while another 16.7% answered that it would reduce the document review time by less than 20%.
7.5. Discussion
In the results of Tests 1 and 2, all 4 performance evaluation metrics scored 100%. These results demonstrate that the constructed POKREM provides accurate answers to all queries for simple facts related to one or more domains. In the results of Test 3, which consisted of reasoning-related questions, the accuracy was 99.7%, and the precision was 84.5%. The precision value indicates that the percentage of correct answers among all answers of the developed POKREM was 84.5%. This result means that 15.4% of the model’s answers were incorrect. The recall value in Test 3 was 100%, which means that all correct answers were included, and there were no misses in the reasoning query results.
With the transitive reasoning applied in this study, there were cases of correct answers but also cases of incorrect answers. For example, there is not much to dispute in the following sentence: “Since the CPU is a part of the motherboard, and the motherboard is a part of the computer, therefore, the CPU is a part of the computer”. However, the following sentence may be subject to dispute: “Paul McCarthy’s fingers are part of Paul McCarthy, and Paul McCarthy is part of The Beatles. Then, is Paul McCarthy’s finger parts of The Beatles?” In Test 3, where reasoning performance was examined, the same type of results as the example was derived. This can be explained by the following two types: First, a PO item node is part of a PO node, and the PO node is part of the nodes belonging to the factory hierarchy, but a PO item node may not be part of a factory hierarchy node depending on its type. If the type of the item node is “service”, then it is concluded that the item node is not part of the physical factory hierarchy. If the type of the item node is “physical product”, not “service”, then it may be part of the physical factory hierarchy, but it cannot be part of a node included in the organizational tier higher than the plant label. Second, a node belonging to the factory hierarchy has a PO node, and the PO node has an item node, but a node belonging to the factory hierarchy may not have an item node depending on the type of item node. If the type of an item node is “service”, it is concluded that the nodes of the physical factory hierarchy do not have that item node.
8. Conclusions and Future Works
This section explains the overall results of this study. The study is summarized as follows: The contributions and limitations of this study are explained below.
8.1. Conclusions
In this study, the authors developed the POKREM using the data definitions of the four domains for the semantic search of POs in the steel plant sector. The four domains consisted of factory hierarchy data, document hierarchy data, facility classification hierarchy data, and PO data. The research targets were the POs of the cold-rolling plant of Company P. Neo4j was used as a graph database for the development of the POKREM, and Cypher was used as the query language. The POKREM was built using key information in the PO, such as the project title, delivery date, completion date, and scope of supply. The authors created CSV files containing the information of many nodes to reduce the inefficiency of repeatedly using query commands to generate multiple nodes during data preprocessing. To complete the POKREM, a rule-based reasoning function was applied. Subsequently, the POKREM platform was developed by building a web server for user convenience. The POKREM platform consists of a web server, web application server, graph database, and MySQL. Users can use the POKREM at any location with access to a network. The test consisted of three stages. The first stage comprised simple queries related to a single domain and their correct answers. The second stage comprised relatively complex queries related to two or more domains and their correct answers. The third stage consisted of queries related to the reasoning function applied in the POKREM development phase and their correct answers. A test was conducted to evaluate the POKREM’s performance by comparing the POKREM’s response with the correct answer after each query was sent to the POKREM. The authors used accuracy, precision, recall, and F1 score as performance evaluation metrics for the test results. In the first- and second-stage tests, the values of the performance evaluation metrics were all 100%, indicating that the KG derived correct answers for all queries. This shows that the developed KG retrieved correct answers to queries for simple input facts related to a single domain as well as for complex facts related to two or more domains. In the third-stage test, accuracy was 99.4%; precision was 84.5%; and recall was 100%. The F1 score was 91.6%. This means that the model exhibits excellent performance for queries related to rule-based reasoning. The accuracy of all tests was 99.7%. Precision and recall were 91.7% and 100%, respectively. The F1 score was 95.7%, indicating excellent performance. The test results were explained to seven employees who had worked for more than ten years at Company P, and a survey was conducted on the use of the POKREM in their actual work. In the survey, 85.7% of the respondents answered positively about the effect of using the POKREM in reducing the time spent on handling work. Furthermore, 66.7% of the respondents answered that the time spent reviewing documents could be reduced by at least 40% if the POKREM were used in actual work.
8.2. Research Contributions
The contributions of this study are as follows: The authors improved the conventional work processing method related to a PO, a contract document, and proposed a method that would help improve the work efficiency of users through the POKREM developed in this study. In the conventional work processing process, it takes considerable time and effort for workers to process all work-related documents through web search-based document retrieval, select the documents that are actually needed from the search results, and identify the content of the documents after reading the documents to achieve the intended goal. Users can reduce the time and effort required to retrieve the content of documents by using the POKREM developed in this study, which has been demonstrated to be feasible in improving work productivity. Furthermore, the use of the POKREM can improve accuracy, preventing the inadvertent omission of some target documents, which may occur in the search for required documents. Therefore, the POKREM can improve the consistency and accuracy of PO review results, which is helpful for both buyers and sellers. Moreover, because effective solutions are provided by automating the traditional manual PO review workflow, it is expected that the POKREM will help innovate the purchasing process of steel plants. Although the POKREM was developed for the POs of steel plants, it can also be developed for other types of documents. In other words, the POKREM can be used for efficient semantic searches across various departments of a company. Consequently, the POKREM is expected to provide users with efficient and useful insights related to various areas of work.
8.3. Limitations and Further Research
The limitations of this study and a discussion of future follow-up studies include the following: First, information is created in the graph database through a process in which humans recognize the content of the PO documents and create CSV files. However, this method is inefficient when inputting a large number of documents. In the future, it will be necessary to develop a method that can automatically generate the information in a graph database by recognizing the contents of numerous documents. Second, this study applied transitive rule-based reasoning because of the lack of data, and there is a considerable scope for improvement in simple rule-based reasoning. A reasoning method using neural networks or distributed representation needs to be applied, and more data should be used for training in follow-up research to obtain more diverse reasoning results.
This study highlights the need for well-established standards of documentation. Standardizing the words used in documents and the formats of documents will improve document recognition by programs and help create graph databases automatically.
Author Contributions
Conceptualization, H.-J.C., S.-W.C. and E.-B.L.; methodology, H.-J.C., S.-W.C. and E.-B.L.; software, H.-J.C. and S.-W.C.; validation, H.-J.C., S.-W.C. and E.-B.L.; formal analysis, H.-J.C. and S.-W.C.; investigation, H.-J.C.; resources, H.-J.C., S.-W.C. and D.-M.L.; data curation, H.-J.C.; writing original draft preparation, H.-J.C.; writing review and editing, H.-J.C., S.-W.C., D.-M.L. and E.-B.L.; visualization, H.-J.C. and S.-W.C.; supervision, E.-B.L.; project administration, E.-B.L.; funding acquisition, E.-B.L. and D.-M.L. All authors have read and agreed to the published version of the manuscript.
Funding
This research was sponsored by POSCO-HOLDINGS with grant number: POSCO-HOLDINGS-POSTECH Research ID = 2022Q012.
Institutional Review Board Statement
Not applicable.
Informed Consent Statement
Not applicable.
Data Availability Statement
Not applicable.
Acknowledgments
The authors of this study would like to thank POSCO-HOLDINGS Co for their informational support and technical cooperation. The authors would like to thank Sea-Eun Park (a Researcher at Pohang University of Science and Technology) for her academic and technical support to this study. The views expressed in this thesis/paper are solely those of the authors and do not represent those of any official organization or research sponsor.
Conflicts of Interest
The authors declare no conflict of interest.
Abbreviations
The following abbreviations and parameters are used in this paper:
| AJP | Apache JServ Protocol |
| CAL | Continuous Annealing Line |
| CSV | Comma-separated Values |
| DB | Database |
| DBMS | Data Base Management System |
| DCS | Distributed Control Systems |
| DGC | Document-grounded Conversation |
| FGI | Focus Group Interview |
| ICT | Information and Communication Technologies |
| IIR | Interactive Information Retrieval |
| IR | Information Retrieval |
| IT | Information Technology |
| JDBC | Java Database Connectivity |
| JDK | Java Development Kit |
| KG | Knowledge Graph |
| POKREM | Purchase Order’s Knowledge Retrieval Model |
| MCC | Motor Control Centers |
| ML | Machine Learning |
| NLP | Natural Language Processing |
| OS | Operating System |
| PCM | Pickling and Tandem Rolling Coiling Mill |
| PLC | Programmable Logic Controllers |
| PO | Purchase Order |
| RCL | Recoiling Line |
| RDF | Resource Description Framework |
| RDFS | Resource Description Framework Schema |
| UPS | Uninterruptible Power Supply |
| URI | Uniform Resource Identifier |
| WAS | Web Application Server |
Appendix A. Triple Representation
Table A1.
Triple representation of a node in a facility classification hierarchy.
Table A1.
Triple representation of a node in a facility classification hierarchy.
| Subject | The Label of the Subject | Relationship | Object | The Label of the Object |
|---|---|---|---|---|
| Facility | fLevel0 | Include | Civil Machinery Part | fLevel1 |
| Facility | fLevel0 | Include | Instrumentation Part | fLevel1 |
| Facility | fLevel0 | Include | Electric and Electronic Part | fLevel1 |
| Facility | fLevel0 | Include | Automation Part | fLevel1 |
| Facility | fLevel0 | Include | IT and Communication Part | fLevel1 |
| Civil Machinery Part | fLevel1 | subGroupOf | Facility | fLevel0 |
| Instrumentation Part | fLevel1 | subGroupOf | Facility | fLevel0 |
| Electric and Electronic Part | fLevel1 | subGroupOf | Facility | fLevel0 |
| Automation Part | fLevel1 | subGroupOf | Facility | fLevel0 |
| IT and Communication Part | fLevel1 | subGroupOf | Facility | fLevel0 |
| Civil Machinery Part | fLevel1 | Include | Industrial Machinery | fLevel2 |
| Industrial Machinery | fLevel2 | subGroupOf | Civil Machinery Part | fLevel1 |
| Industrial Machinery | fLevel2 | Include | Crane Equipment | fLevel3 |
| Crane Equipment | fLevel3 | subGroupOf | Industrial Machinery | fLevel2 |
| Instrumentation Part | fLevel1 | Include | Field Instruments | fLevel2 |
| Field Instruments | fLevel2 | subGroupOf | Instrumentation Part | fLevel1 |
| Field Instruments | fLevel2 | Include | Flow Instruments | fLevel3 |
| Field Instruments | fLevel2 | Include | Level Instruments | fLevel3 |
| Field Instruments | fLevel2 | Include | Special Measuring Instruments | fLevel3 |
| Flow Instruments | fLevel3 | subGroupOf | Field Instruments | fLevel2 |
| Level Instruments | fLevel3 | subGroupOf | Field Instruments | fLevel2 |
| Special Measuring Instruments | fLevel3 | subGroupOf | Field Instruments | fLevel2 |
| Electric and Electronic Part | fLevel1 | Include | Power Distribution Panel | fLevel2 |
| Electric and Electronic Part | fLevel1 | Include | Transformer | fLevel2 |
| Electric and Electronic Part | fLevel1 | Include | Aux Equipments | fLevel2 |
| Electric and Electronic Part | fLevel1 | Include | Mortor & Brake | fLevel2 |
| Electric and Electronic Part | fLevel1 | Include | Drive System | fLevel2 |
| Electric and Electronic Part | fLevel1 | Include | Power Control Equipment | fLevel2 |
| Electric and Electronic Part | fLevel1 | Include | Operation Panel | fLevel2 |
| Electric and Electronic Part | fLevel1 | Include | Process Sensors | fLevel2 |
| Electric and Electronic Part | fLevel1 | Include | Spare Part | fLevel2 |
| Power Distribution Panel | fLevel2 | subGroupOf | Electric and Electronic Part | fLevel1 |
| Transformer | fLevel2 | subGroupOf | Electric and Electronic Part | fLevel1 |
| Aux Equipments | fLevel2 | subGroupOf | Electric and Electronic Part | fLevel1 |
| Mortor & Brake | fLevel2 | subGroupOf | Electric and Electronic Part | fLevel1 |
| Drive System | fLevel2 | subGroupOf | Electric and Electronic Part | fLevel1 |
| Emergency Power Supply | fLevel2 | subGroupOf | Electric and Electronic Part | fLevel1 |
| Power Control Equipment | fLevel2 | subGroupOf | Electric and Electronic Part | fLevel1 |
| Operation Panel | fLevel2 | subGroupOf | Electric and Electronic Part | fLevel1 |
| Process Sensors | fLevel2 | subGroupOf | Electric and Electronic Part | fLevel1 |
| Spare Part | fLevel2 | subGroupOf | Electric and Electronic Part | fLevel1 |
| Power Distribution Panel | fLevel2 | Include | High Voltage Panel | fLevel3 |
| Power Distribution Panel | fLevel2 | Include | Low Voltage Panel | fLevel3 |
| Power Distribution Panel | fLevel2 | Include | MCC | fLevel3 |
| High Voltage Panel | fLevel3 | subGroupOf | Power Distribution Panel | fLevel2 |
| Low Voltage Panel | fLevel3 | subGroupOf | Power Distribution Panel | fLevel2 |
| MCC | fLevel3 | subGroupOf | Power Distribution Panel | fLevel2 |
| Aux Equipments | fLevel2 | Include | Power Monitoring System | fLevel3 |
| Aux Equipments | fLevel2 | Include | Aux’ Panel and Box | fLevel3 |
| Aux Equipments | fLevel2 | Include | Air Conditioner | fLevel3 |
| Power Monitoring System | fLevel3 | subGroupOf | Aux Equipments | fLevel2 |
| Aux’ Panel and Box | fLevel3 | subGroupOf | Aux Equipments | fLevel2 |
| Air Conditioner | fLevel3 | subGroupOf | Aux Equipments | fLevel2 |
| Mortor & Brake | fLevel2 | Include | Motor | fLevel3 |
| Mortor & Brake | fLevel2 | Include | Brake and Control Unit | fLevel3 |
| Motor | fLevel3 | subGroupOf | Mortor & Brake | fLevel2 |
| Brake and Control Unit | fLevel3 | subGroupOf | Mortor & Brake | fLevel2 |
| Drive System | fLevel2 | Include | Converter System | fLevel3 |
| Drive System | fLevel2 | Include | Inverter System | fLevel3 |
| Converter System | fLevel3 | subGroupOf | Drive System | fLevel2 |
| Inverter System | fLevel3 | subGroupOf | Drive System | fLevel2 |
| Power Control Equipment | fLevel2 | Include | UPS System | fLevel3 |
| Power Control Equipment | fLevel2 | Include | Battery Charger System | fLevel3 |
| Power Control Equipment | fLevel2 | Include | Rectifier | fLevel3 |
| UPS System | fLevel3 | subGroupOf | Power Control Equipment | fLevel2 |
| Battery Charger System | fLevel3 | subGroupOf | Power Control Equipment | fLevel2 |
| Rectifier | fLevel3 | subGroupOf | Power Control Equipment | fLevel2 |
| Automation Part | fLevel1 | Include | PLC System | fLevel2 |
| Automation Part | fLevel1 | Include | DCS System | fLevel2 |
Appendix B. Code for KG Model Development
//Creating the nodes for factory hierarchy definition
//Creating the company node
create(a:company{name:’P’})
//Creating the steelworks nodes
load csv with headers from “file:///steelworks.csv” as steelworks merge(a:steelworks{name:steelworks.name})
load csv with headers from “file:///steelworks.csv” as steelworks match(a:steelworks{name:steelworks.name}),(b:company{name:steelworks.partof})merge(a)-[r:PartOf]->(b)
load csv with headers from “file:///steelworks.csv” as steelworks match(a:steelworks{name:steelworks.name}),(b:company{name:steelworks.partof})merge(b)-[r:HasSteelworks]->(a)
//Creating the sector nodes
load csv with headers from “file:///sector.csv” as sector merge(a:sector{name:sector.name})
load csv with headers from “file:///sector.csv” as sector match(a:sector{name:sector.name}),(b:steelworks{name:sector.partof})merge(a)-[r:PartOf]->(b)
load csv with headers from “file:///sector.csv” as sector match(a:sector{name:sector.name}),(b:steelworks{name:sector.partof})merge(b)-[r:HasSector]->(a)
//Creating the department nodes
load csv with headers from “file:///department.csv” as department merge(a:department{name:department.name})
load csv with headers from “file:///department.csv” as department match(a:department{name:department.name}),(b:sector{name:department.partof})merge(a)-[r:PartOf]->(b)
load csv with headers from “file:///department.csv” as department match(a:department{name:department.name}),(b:sector{name:department.partof})merge(b)-[r:HasDepartment]->(a)
//Creating the plant nodes
load csv with headers from “file:///plant.csv” as plant merge(a:plant{name:plant.name})
load csv with headers from “file:///plant.csv” as plant match(a:plant{name:plant.name}),(b:department{name:plant.partof})merge(a)-[r:PartOf]->(b)
load csv with headers from “file:///plant.csv” as plant match(a:plant{name:plant.name}),(b:department{name:plant.partof})merge(b)-[r:HasPlant]->(a)
//Creating the process nodes
load csv with headers from “file:///process.csv” as process merge(a:process{name:process.name})
load csv with headers from “file:///process.csv” as process match(a:process{name:process.name}),(b:plant{name:process.partof})merge(a)-[r:PartOf]->(b)
load csv with headers from “file:///process.csv” as process match(a:process{name:process.name}),(b:plant{name:process.partof})merge(b)-[r:HasProcess]->(a)
//Creating the nodes for document hierarchy definition
merge (a:dLevel0{name: ‘Document’})
merge (a:dLevel1{name: ‘Contract’})
merge (a:dLevel2{name: ‘PO’})
merge (a:dLevel3{name: ‘Technical Requirement’})
merge (a:dLevel3{name: ‘General Provision’})
match (a:dLevel0{name: ‘Document’}) match(b:dLevel1{name: ‘Contract’}) merge(b) - [r:SubClassOf] -> (a)
match (a:dLevel1{name: ‘Contract’}) match(b:dLevel2{name: ‘PO’}) merge(b) - [r:SubClassOf] -> (a)
match (a:dLevel2{name: ‘PO’}) match(b:dLevel3{name: ‘Technical Requirement’}) merge(b) - [r:SubClassOf] -> (a)
match (a:dLevel2{name: ‘PO’}) match(b:dLevel3{name: ‘General Provision’}) merge(b) - [r:SubClassOf] -> (a)
match (a:dLevel0{name: ‘Document’}) match(b:dLevel1{name: ‘Contract’}) merge(a) - [r:Contain] -> (b)
match (a:dLevel1{name: ‘Contract’}) match(b:dLevel2{name: ‘PO’}) merge(a) - [r:Contain] -> (b)
match (a:dLevel2{name: ‘PO’}) match(b:dLevel3{name: ‘Technical Requirement’}) merge(a) - [r:Contain] -> (b)
match (a:dLevel2{name: ‘PO’}) match(b:dLevel3{name: ‘General Provision’}) merge(a) - [r:Contain] -> (b)
//Creating the nodes for facility classification hierarchy definition
//Creating the fLevel0 node
merge (a:fLevel0{name: ‘Facility’})
//Creating the fLevel1 nodes
load csv with headers from “file:///f1.csv” as f1 merge(a:fLevel1{name:f1.name})
match(a:fLevel1),(b:fLevel0) merge(a)-[r:SubGroupOf]->(b)
match(a:fLevel1),(b:fLevel0) merge(b)-[r:Include]->(a)
//Creating the fLevel2 nodes
load csv with headers from “file:///f2.csv” as f2 merge(a:fLevel2{name:f2.name})
load csv with headers from “file:///f2.csv” as f2 match(a:fLevel2{name:f2.name}),(b:fLevel1{name:f2.SubGroupOf})merge(a)-[r:SubGroupOf]->(b)
load csv with headers from “file:///f2.csv” as f2 match(a:fLevel2{name:f2.name}),(b:fLevel1{name:f2.SubGroupOf})merge(b)-[r:Include]->(a)
//Creating the fLevel3 nodes
load csv with headers from “file:///f3.csv” as f3 merge(a:fLevel3{name:f3.name})
load csv with headers from “file:///f3.csv” as f3 match(a:fLevel3{name:f3.name}),(b:fLevel2{name:f3.SubGroupOf})merge(a)-[r:SubGroupOf]->(b)
load csv with headers from “file:///f3.csv” as f3 match(a:fLevel3{name:f3.name}),(b:fLevel2{name:f3.SubGroupOf})merge(b)-[r:Include]->(a)
//Creating the nodes for data definition of purchase order
//Creating the PO nodes
load csv with headers from “file:///POID.csv” as po merge(a:Document{name:po.ID, ProjectTitle: po.ProjectTitle_eng, PublishedDate: date(po.PublishedDate), DateOfDelivery: date(po.DateOfDelivery), CompletionDate: date(po.CompletionDate)})
load csv with headers from “file:///POID.csv” as po match(a:Document{name:po.ID}),(b:process{name:po.Process})merge(a)-[r:PartOf]->(b)
load csv with headers from “file:///POID.csv” as po match(a:Document{name:po.ID}),(b:process{name:po.Process})merge(b)-[r:HasDocument]->(a)
match(a:Document),(b:dLevel3{name:”Technical Requirement”})merge(a)-[r:SubClassOf]->(b)
match(a:Document),(b:dLevel3{name:”Technical Requirement”})merge(b)-[r:Contain]->(a)
//Creating the item nodes
load csv with headers from “file:///POItem.csv” as Item merge(a:Item{name:Item.name, Type: Item.Type, Quantity: Item.Quantity, QuantityUnit: Item.QuantityUnit})
load csv with headers from “file:///POItem.csv” as Item match(a:Item{name:Item.name}),(b:Document{name:Item.POID})merge(a)-[r:SupplyItemOf]->(b)
load csv with headers from “file:///POItem.csv” as Item match(a:Item{name:Item.name}),(b:Document{name:Item.POID})merge(b)-[r:HasItem]->(a)
load csv with headers from “file:///POItem.csv” as Item match(a:Item{name:Item.name}),(b:Document{name:Item.POID})merge(a)-[r:PartOf]->(b)
load csv with headers from “file:///POItem.csv” as Item match(a:Item{name:Item.name}),(b{name:Item.facilityType})merge(a)-[r:SubGroupOf]->(b)
load csv with headers from “file:///POItem.csv” as Item match(a:Item{name:Item.name}),(b{name:Item.facilityType})merge(b)-[r:Include]->(a)
//Code for rule-based reasoning
match (a) - [r:HasSteelworks] -> (b) merge (a) -[t:Has] -> (b)
match (a) - [r:HasSector] -> (b) merge (a) -[t:Has] -> (b)
match (a) - [r:HasDepartment] -> (b) merge (a) -[t:Has] -> (b)
match (a) - [r:HasPlant] -> (b) merge (a) -[t:Has] -> (b)
match (a) - [r:HasProcess] -> (b) merge (a) -[t:Has] -> (b)
match (a) - [r:HasDocument] -> (b) merge (a) -[t:Has] -> (b)
match (a) - [r:HasItem] -> (b) merge (a) -[t:Has] -> (b)
match (a) - [r:Has] -> (b) merge (a) <-[t:PartOf] - (b)
match (a) - [r:PartOf] -> (b) merge (a) <-[t:Has] - (b)
match (a) - [r:Has] -> (b) - [s:Has] -> (c) merge (a) -[t:Has] -> (c)
match (a) - [r:PartOf] -> (b) - [s:PartOf] -> (c) merge (a) -[t:PartOf] -> (c)
match (a) - [r:SubClassOf] -> (b) - [s:SubClassOf] -> (c) merge (a) -[t:SubClassOf] -> (c)
match (a) - [r:Contain] -> (b) - [s:Contain] -> (c) merge (a) -[t:Contain] -> (c)
match (a) - [r:SubGroupOf] -> (b) - [s:SubGroupOf] -> (c) merge (a) -[t:SubGroupOf] -> (c)
Appendix C. Query and Correct Answers for the Test
Table A2.
Query and correct answers for the second stage of the test.
Table A2.
Query and correct answers for the second stage of the test.
| No. | Sortation | Content |
|---|---|---|
| 1 | Query | How many PO’s are there for “K No3 Cold Rolling”? |
| Correct answer | 2 | |
| 2 | Query | What is the PO of “P No1 Cold Rolling”? |
| Correct answer | T36695, 356435, 729381, 743696 | |
| 3 | Query | Which group does the PO of “P No2 Cold Rolling” belong to in the document classification? |
| Correct answer | Technical Requirement | |
| 4 | Query | What is the name and quantity of items in the “K No3 Rolling” PO that are included in the “Computer Network Device”? |
| Correct answer | (Backbone Switch_474883, 1), (Local Switch_474883, 6) | |
| 5 | Query | Between the PO nodes of “K No3 Rolling”, what is the name of the PO that has the item included in the Computer Network Device? |
| Correct answer | 474883 | |
| 6 | Query | Between the PO nodes of “K No3 Rolling”, when is the delivery date of the PO with the item included in the Computer Network Device? |
| Correct answer | 2021-06-30 | |
| 7 | Query | Which PO has an item included in the facility classification “Computer”? |
| Correct answer | T36695, 356435, 743696, 739345, 474883, 569323 | |
| 8 | Query | Which PO has an item included in the facility classification “DCS System”? |
| Correct answer | T36695, 356435, 927386, 739345 | |
| 9 | Query | What is the project name and completion date of the PO with the items included in the facility classification “Air Conditioner”? |
| Correct answer | (Purchase Specifications of a Control System for No.1 RCL P Works, 2018-09-30), (Purchase Specifications of a Control System for No.3-1 RCL K Works, 2020-12-31) | |
| 10 | Query | What is the name and delivery date of the PO with the item included in the facility classification “Operation Panel”? |
| Correct answer | (356435, 2021-06-30), (743696, 2019-10-31), (739345, 2020-10-31), (T674271, 2019-10-31) | |
| 11 | Query | What is the name of the PO with the item included in the facility classification “UPS System” and what is name of the item, quantity of the item, and the unit of the quantity? |
| Correct answer | (729381, UPS_729381, 3, Set), (739345, UPS_739345, 1, Set) | |
| 12 | Query | Among the POs that have items included in the facility classification “UPS System”, what is the name of the PO whose date of delivery is after 2019? |
| Correct answer | 739345 | |
| 13 | Query | Among the “K No4 Cold Rolling” PO, what is the project title and completion date of the PO whose completion date is after January 2023? |
| Correct answer | (Purchase Specifications of a Control System for No.4-1 CAL K Works, 2023-06-30), (Purchase Specifications of a Control System for No.4-2 CAL K Works, 2023-07-31) | |
| 14 | Query | Among the “P No1 Cold Rolling” PO, what is the project title and target process, published date, date of delivery and completion date of the PO with delivery date before December 2019? |
| Correct answer | (Purchase Specifications of a Control System for No.1 RCL P Works, P 1RCL, 2018-04-04, 2018-07-31, 2018-09-30), (Purchase Specifications of a Control System for No.2 RCL P Works, P 2RCL, 2019-07-20, 2019-10-31, 2020-03-31) | |
| 15 | Query | Among the “P No1 Cold Rolling” PO, what is the project title and item of the PO whose completion date is after July 2020? |
| Correct answer | (Purchase Specifications of a Control System for No.1 PCM P Works, P/C Server_T36695, HMI_T36695) (Purchase Specifications of a Control System for No.1 PCM P Works, GUI Dev Studio_T36695) (Purchase Specifications of a Control System for No.1 PCM P Works, HMI_T36695) (Purchase Specifications of a Control System for No.1 PCM P Works, GUI Runtime_T36695) (Purchase Specifications of a Control System for No.1 PCM P Works, V Studio_T36695) (Purchase Specifications of a Control System for No.1 PCM P Works, VTS_T36695) (Purchase Specifications of a Control System for No.1 PCM P Works, Process Control Function_T36695) (Purchase Specifications of a Control System for No.1 PCM P Works, HMI Screen Function_T36695) (Purchase Specifications of a Control System for No.1 PCM P Works, DCS CPU Panel_T36695) (Purchase Specifications of a Control System for No.1 PCM P Works, PLC CPU Panel_T36695) (Purchase Specifications of a Process Computer System for No.1 PCM P Works, P/C Server_356435) (Purchase Specifications of a Process Computer System for No.1 PCM P Works, HMI_356435) (Purchase Specifications of a Process Computer System for No.1 PCM P Works, Process Control Function_356435) (Purchase Specifications of a Process Computer System for No.1 PCM P Works, DCS CPU Panel_356435) (Purchase Specifications of a Process Computer System for No.1 PCM P Works, PLC CPU Panel_356435) (Purchase Specifications of a Process Computer System for No.1 PCM P Works, Local Operation Panel_D_356435) (Purchase Specifications of a Process Computer System for No.1 PCM P Works, Local Operation Panel_W_356435) (Purchase Specifications of a Process Computer System for No.1 PCM P Works, Local Operation Panel_P_356435) (Purchase Specifications of a Process Computer System for No.1 PCM P Works, HMI Screen Function_356435) |
Table A3.
Query and correct answers for the third stage of the test.
Table A3.
Query and correct answers for the third stage of the test.
| No. | Sortation | Content |
|---|---|---|
| 1 | Query | Item “Process Control Function_740711” is part of which node? |
| Correct answer | P, K Steelworks, K Rolling, K Cold Rolling, K No4 Cold Rolling, K 4-2CAL, 740711 | |
| 2 | Query | Item “P/C Server_T36695” is part of which node? |
| Correct answer | P, P Steelworks, P Rolling, P Cold Rolling, P No1 Cold Rolling, P 1PCM, T36695 | |
| 3 | Query | What node does the node “P 2PCM” have? |
| Correct answer | 927386, iba IPC_927386, iba software package_927386, PLC CPU Panel_927386, DCS CPU Panel_927386, PLC Control Panel_927386 | |
| 4 | Query | What node does the node “K 4-2CAL” have? |
| Correct answer | 740711 | |
| 5 | Query | Item “PLC CPU Panel_927386” is subclass of which node? |
| Correct answer | Facility, Automation Part, PLC System, PLC Hardware | |
| 6 | Query | Item “Air Conditioner_739345” is subclass of which node? |
| Correct answer | Facility, Electric and Electronic Part, Aux Equipments, Air Conditioner | |
| 7 | Query | Which node does the node “PLC Hardware” include? |
| Correct answer | iba IPC_743696, PLC Control Panel_739345, iba IPC_927386, PLC CPU Panel_T36695, PLC CPU Panel_927386, PLC CPU Panel_743696, PLC Control Panel_743696, PLC CPU Panel_739345, PLC CPU Panel_356435, iba IPC_739345, PLC Control Panel_927386 | |
| 8 | Query | Which node does the node “Field Instrument” include? |
| Correct answer | Special Measuring Instruments, Flow Instruments, Level Instruments, Width Gauge_729381, Thickness Gauge_739345, Width Gauge_739345, Thickness Gauge_729381 | |
| 9 | Query | Which node does the node “Document” Contain? |
| Correct answer | Contract, PO, Technical Requirement, General Provision, T36695, 356435, 729381, 743696, 927386, 739345, 474883, T674271, 569323, 740711 | |
| 10 | Query | Which node does the node “Technical Requirement” Contain? |
| Correct answer | T36695, 356435, 729381, 743696, 927386, 739345, 474883, T674271, 569323, 740711 | |
| 11 | Query | PO “729381” is subclass of which node? |
| Correct answer | Technical Requirement, PO, Contract, Document | |
| 12 | Query | Node “General Provision” is subclass of which node? |
| Correct answer | Document, Contract, PO | |
| 13 | Query | What node does the node “P 1PCM” have? |
| Correct answer | P/C Server_T36695, HMI_T36695, GUI Dev Studio_T36695, GUI Runtime_T36695, V Studio_T36695, VTS_T36695, DCS CPU Panel_T36695, PLC CPU Panel_T36695, P/C Server_356435, HMI_356435, DCS CPU Panel_356435, PLC CPU Panel_356435, Local Operation Panel_D_356435, Local Operation Panel_W_356435, Local Operation Panel_P_356435, 356435, T36695 | |
| 14 | Query | Node “K 4-2CAL” is part of which node? |
| Correct answer | P, K Steelworks, K Rolling, K Cold Rolling, K No4 Cold Rolling | |
| 15 | Query | Node “P Steel Making” is part of which node? |
| Correct answer | P, P Steelworks, P Iron and Steel Making |
References
- Attaran, M. Information technology and business-process redesign. Bus. Process Manag. J. 2003, 9, 440–458. [Google Scholar] [CrossRef]
- Our World in Data. Interactive Charts on Internet. Available online: https://ourworldindata.org/internet#citation (accessed on 15 March 2023).
- Synergy Research Group. Hyperscale Data Center Count Reaches 541 in Mid-2020. Available online: https://www.srgresearch.com/articles/hyperscale-data-center-count-reaches-541-mid-2020-another-176-pipeline (accessed on 14 December 2022).
- Synergy Research Group. Huge Cloud Market Still Growing at 34% Per Year. Available online: https://www.srgresearch.com/articles/huge-cloud-market-is-still-growing-at-34-per-year-amazon-microsoft-and-google-now-account-for-65-of-all-cloud-revenues (accessed on 1 December 2022).
- Ministry of Science and ICT. Wireless Data Traffic. Available online: https://www.msit.go.kr/bbs/view.do?sCode=user&mId=99&mPid=74&bbsSeqNo=79&nttSeqNo=3173481 (accessed on 3 December 2022).
- Brynjolfsson, E.; Yang, S. Information technology and productivity: A review of the literature. Adv. Comput. 1996, 43, 179–214. [Google Scholar] [CrossRef]
- Dedrick, J.; Kraemer, K.L.; Shih, E. Information technology and productivity in developed and developing countries. J. Manag. Inf. Syst. 2013, 30, 97–122. [Google Scholar] [CrossRef]
- Duc, D.T.V.; Nguyen, P.V. The Nexus of ICT, Manufacturing Productivity and Economic Restructuring in Vietnam. J. Asian Financ. Econ. Bus. 2021, 8, 235–247. [Google Scholar] [CrossRef]
- Sanderson, M.; Croft, W.B. The history of information retrieval research. Proc. IEEE 2012, 100, 1444–1451. [Google Scholar] [CrossRef]
- Allemang, D.; Hendler, J.; Gandon, F. Semantic Web for the Working Ontologist: Effective Modeling for Linked Data, RDFS, and OWL, 3rd ed.; ACM Books: New York, NY, USA, 2020. [Google Scholar]
- Brennan, D. Process Industry Economics: Principles, Concepts and Applications, 2nd ed.; Elsevier Science: Amsterdam, The Netherlands, 2020; pp. 1–15,95–125. [Google Scholar]
- Kim, C.-Y.; Jeong, J.-G.; Choi, S.-W.; Lee, E.-B. An AI-Based Automatic Risks Detection Solution for Plant Owner’s Technical Requirements in Equipment Purchase Order. Sustainability 2022, 14, 10010. [Google Scholar] [CrossRef]
- Dobler, D.W.; Burt, D.N. Purchasing and Supply Management: Text and Cases, 6th ed.; McGraw-Hill: New York, NY, USA, 1996. [Google Scholar]
- Zobel, J. What we talk about when we talk about information retrieval. In Proceedings of the 41st Annual ACM SIGIR Conference on Research & Development on Information Retrieval, Ann Arbor, MI, USA, 8–12 July 2018; pp. 18–26. [Google Scholar]
- Cooper, W.S. A definition of relevance for information retrieval. Inform. Storage Ret. 1971, 7, 19–37. [Google Scholar] [CrossRef]
- Wong, S.K.M.; Ziarko, W.; Raghavan, V.V.; Wong, P.C. On modeling of information retrieval concepts in vector spaces. ACM Trans. Database Syst. 1987, 12, 299–321. [Google Scholar] [CrossRef]
- Wiesman, F.; Hasman, A.; Van den Herik, H. Information retrieval: An overview of system characteristics. Int. J. Med. Inform. 1997, 47, 5–26. [Google Scholar] [CrossRef]
- Rehma, A.A.; Awan, M.J.; Butt, I. Comparison and evaluation of information retrieval models. VFAST Trans. Softw. Eng. 2018, 6, 7–14. [Google Scholar] [CrossRef]
- Merrouni, Z.A.; Frikh, B.; Ouhbi, B. Toward contextual information retrieval: A review and trends. Procedia Comput. Sci. 2019, 148, 191–200. [Google Scholar] [CrossRef]
- Yu, B. Research on information retrieval model based on ontology. EURASIP J. Wirel. Commun. Netw. 2019, 2019, 1–8. [Google Scholar] [CrossRef]
- Azad, H.K.; Deepak, A. Query expansion techniques for information retrieval: A survey. Inf. Process Manag. 2019, 56, 1698–1735. [Google Scholar] [CrossRef]
- Bai, T.; Ge, Y.; Guo, S.; Zhang, Z.; Gong, L. Enhanced natural language interface for web-based information retrieval. IEEE Access 2020, 9, 4233–4241. [Google Scholar] [CrossRef]
- Angdresey, A.; Lamongi, M.A.; Munir, R. Information Retrieval System in the Bible. Cogito Smart J. 2021, 7, 111–120. [Google Scholar] [CrossRef]
- Sansone, C.; Sperlí, G. Legal Information Retrieval systems: State-of-the-art and open issues. Inf. Syst. 2022, 106, 101967. [Google Scholar] [CrossRef]
- Ibrihich, S.; Oussous, A.; Ibrihich, O.; Esghir, M. A Review on recent research in information retrieval. Procedia Comput. Sci. 2022, 201, 777–782. [Google Scholar] [CrossRef]
- Moe, W.W.; Fader, P.S. Fast-track: Article using advance purchase orders to forecast new product sales. Mark. Sci. 2002, 21, 347–364. [Google Scholar] [CrossRef]
- Wang, G.; Miller, S. Intelligent aggregation of purchase orders in e-procurement. In Proceedings of the 9th IEEE International EDOC Enterprise Computing Conference (EDOC’05), Enschede, The Netherlands, 19–23 September 2005; pp. 27–36. [Google Scholar]
- Li, Y. Process-focused risk analysis and management of purchase-order financing under logistic financing innovation. In Proceedings of the 2008 4th International Conference on Wireless Communications, Networking and Mobile Computing, Dalian, China, 12–14 October 2008; pp. 1–5. [Google Scholar]
- Baraka, R.S.; Al-Ashqar, Y.M. Building a SOA-Based Model for Purchase Order Management in E-Commerce Systems. In Proceedings of the 2013 Palestinian International Conference on Information and Communication Technology, Gaza, Palestine, 15–16 April 2013; pp. 107–114. [Google Scholar]
- Huang, Y.-S.; Ho, R.-S.; Fang, C.-C. Quantity discount coordination for allocation of purchase orders in supply chains with multiple suppliers. Int. J. Prod. Res. 2015, 53, 6653–6671. [Google Scholar] [CrossRef]
- Bock, S.; Isik, F. A new two-dimensional performance measure in purchase order sizing. Int. J. Prod. Res. 2015, 53, 4951–4962. [Google Scholar] [CrossRef]
- Yamanaka, S. Quantitative credit risk monitoring using purchase order information. JSIAM Lett. 2017, 9, 49–52. [Google Scholar] [CrossRef]
- Liu, J.; Hwang, S.; Yund, W.; Boyle, L.N.; Banerjee, A.G. Predicting purchase orders delivery times using regression models with dimension reduction. In Proceedings of the International Design Engineering Technical Conferences and Computers and Information in Engineering Conference, Quebec, QC, Canada, 26–29 August 2018; p. V01BT02A034. [Google Scholar]
- Zou, X. A survey on application of knowledge graph. In Proceedings of the 4th International Conference on Control Engineering and Artificial Intelligence, Singapore, 17–19 January 2020; p. 012016. [Google Scholar]
- Berners-Lee, T.; Hendler, J.; Lassila, O. The Semantic Web. Sci. Am. 2001, 284, 34–43. Available online: https://www.jstor.org/stable/26059207 (accessed on 15 February 2023). [CrossRef]
- The Keyword. Introducing the Knowledge Graph. Available online: https://blog.google/products/search/introducing-knowledge-graph-things-not/ (accessed on 14 November 2022).
- Auer, S.; Mann, S. Towards an open research knowledge graph. Ser. Libr. 2019, 76, 35–41. [Google Scholar] [CrossRef]
- Auer, S.; Kovtun, V.; Prinz, M.; Kasprzik, A.; Stocker, M.; Vidal, M.E. Towards a knowledge graph for science. In Proceedings of the 8th International Conference on Web Intelligence, Mining and Semantics, Novi Sad, Serbia, 25–27 June 2018; pp. 1–6. [Google Scholar]
- Wang, R.; Yan, Y.; Wang, J.; Jia, Y.; Zhang, Y.; Zhang, W.; Wang, X. Acekg: A large-scale knowledge graph for academic data mining. In Proceedings of the 27th ACM International Conference on Information and Knowledge Management, Torino, Italy, 22–26 October 2018; pp. 1487–1490. [Google Scholar]
- Chen, Y.; Kuang, J.; Cheng, D.; Zheng, J.; Gao, M.; Zhou, A. AgriKG: An agricultural knowledge graph and its applications. In Proceedings of the 24th International Conference on Database Systems for Advanced Applications, Chiang Mai, Thailand, 22–25 April 2019; pp. 533–537. [Google Scholar]
- Noy, N.; Gao, Y.; Jain, A.; Narayanan, A.; Patterson, A.; Taylor, J. Industry-scale Knowledge Graphs: Lessons and Challenges: Five diverse technology companies show how it’s done. Queue 2019, 17, 48–75. [Google Scholar] [CrossRef]
- Guo, Q.; Zhuang, F.; Qin, C.; Zhu, H.; Xie, X.; Xiong, H.; He, Q. A survey on knowledge graph-based recommender systems. IEEE Trans. Knowl. Data Eng. 2020, 34, 3549–3568. [Google Scholar] [CrossRef]
- Chen, X.; Jia, S.; Xiang, Y. A review: Knowledge reasoning over knowledge graph. Expert. Syst. Appl. 2020, 141, 112948. [Google Scholar] [CrossRef]
- Huang, H.; Hong, Z.; Zhou, H.; Wu, J.; Jin, N. Knowledge graph construction and application of power grid equipment. Math. Probl. Eng. 2020, 2020, 8269082. [Google Scholar] [CrossRef]
- Liu, J.; Schmid, F.; Li, K.; Zheng, W. A knowledge graph-based approach for exploring railway operational accidents. Reliab. Eng. Syst. Saf. 2021, 207, 107352. [Google Scholar] [CrossRef]
- Kim, B.; Lee, D.; Kim, D.; Kim, H.; Kim, S.; Kwon, O.; Kim, H. Generative Model Using Knowledge Graph for Document-Grounded Conversations. Appl. Sci. 2022, 12, 3367. [Google Scholar] [CrossRef]
- S & P Global Commodity Insights. Winners 2022. Available online: https://www.spglobal.com/commodityinsights/global-metals-awards/winners (accessed on 16 March 2023).
- Microsoft. Windows 10. Available online: https://www.microsoft.com/ (accessed on 15 December 2022).
- Neo4j. Neo4j Graph Database. Available online: https://neo4j.com/product/neo4j-graph-database/ (accessed on 6 November 2022).
- DB-ENGINES. DB-Engines Ranking of Graph DBMS. Available online: https://db-engines.com/en/ranking/graph+dbms (accessed on 11 November 2022).
- Liu, P.; Huang, Y.; Wang, P.; Zhao, Q.; Nie, J.; Tang, Y.; Sun, L.; Wang, H.; Wu, X.; Li, W. Construction of typhoon disaster knowledge graph based on graph database Neo4j. In Proceedings of the 2020 32nd Chinese Control and Decision Conference (CCDC), Hefei, China, 22–24 August 2020; pp. 3612–3616. [Google Scholar]
- Chen, Z.; Wang, Y.; Zhao, B.; Cheng, J.; Zhao, X.; Duan, Z. Knowledge graph completion: A review. IEEE Access 2020, 8, 192435–192456. [Google Scholar] [CrossRef]
- MySQL. Database Design and Modeling. Available online: https://dev.mysql.com/doc/workbench/en/wb-data-modeling.html (accessed on 11 December 2022).
- APACHE. Apache HTTP Server Project. Available online: https://httpd.apache.org/ (accessed on 13 December 2022).
- Angular. The Web Development Framework for Building the Future. Available online: https://angular.io/ (accessed on 17 November 2022).
- Open JS Foundation. Node.js. Available online: https://nodejs.org/en/ (accessed on 20 November 2022).
- Apache Tomcat. Apache Tomcat. Available online: https://tomcat.apache.org/ (accessed on 26 December 2022).
- Oracle. Java Technical Details. Available online: https://www.oracle.com/java/technologies/ (accessed on 30 December 2022).
- Neo4j. Bolt Protocol. Available online: https://neo4j.com/docs/bolt/current/bolt/ (accessed on 9 December 2022).
- Oracle. Java JDBC API. Available online: https://docs.oracle.com/javase/8/docs/technotes/guides/jdbc/ (accessed on 12 December 2022).
- Apache Tomcat. The Apache Tomcat Connectors-AJP Protocol Reference. Available online: https://tomcat.apache.org/connectors-doc/ajp/ajpv13a.html (accessed on 17 November 2022).
- Paulheim, H. Knowledge graph refinement: A survey of approaches and evaluation methods. Semant. Web 2017, 8, 489–508. [Google Scholar] [CrossRef]
- Sokolova, M.; Lapalme, G. A systematic analysis of performance measures for classification tasks. Inf. Process Manag. 2009, 45, 427–437. [Google Scholar] [CrossRef]
- Lambert, S.D.; Loiselle, C.G. Combining individual interviews and focus groups to enhance data richness. J. Adv. Nurs. 2008, 62, 228–237. [Google Scholar] [CrossRef] [PubMed]
Disclaimer/Publisher’s Note: The statements, opinions and data contained in all publications are solely those of the individual author(s) and contributor(s) and not of MDPI and/or the editor(s). MDPI and/or the editor(s) disclaim responsibility for any injury to people or property resulting from any ideas, methods, instructions or products referred to in the content. |
© 2023 by the authors. Licensee MDPI, Basel, Switzerland. This article is an open access article distributed under the terms and conditions of the Creative Commons Attribution (CC BY) license (https://creativecommons.org/licenses/by/4.0/).