Article

What Can Machine Learning Teach Us about Australian Climate Risk Disclosures?

1
School of Earth and Environmental Sciences, The University of Queensland, St. Lucia, QLD 4072, Australia
2
School of Chemical Engineering, The University of Queensland, St. Lucia, QLD 4072, Australia
*
Author to whom correspondence should be addressed.
Sustainability 2022, 14(16), 10000; https://doi.org/10.3390/su141610000
Submission received: 9 July 2022 / Revised: 10 August 2022 / Accepted: 10 August 2022 / Published: 12 August 2022

Abstract

:
There seems to be no agreed taxonomy for climate-related risks. The information in firms’ climate risk disclosures represents a new resource for identifying the priorities and strategies of Australian companies’ management of climate risk. This research surveys 839 companies listed on the Australian Stock Exchange for the presence of climate risk disclosures, identifying 201 disclosures on climate risk. The types of climate risks and the risk management strategies were extracted and evaluated using machine learning. The analysis revealed that Australian firms are focused on acute physical climate risks, followed by market and regulatory risks. The predominant management strategy for these risks was to use a risk reduction approach, rather than avoiding or transferring risk. The analysis showed that key Australian industry sectors, such as materials, banking, insurance, and energy are focusing on different mixtures of risk types, but they are all primarily managing risks through risk-reduction strategies. An underlying driver of climate risk disclosure was composed of the financial implications of climate risk, particularly with respect to acute physical risks. The research showed that emission reductions represent a primary consideration for Australian firms in their disclosures identifying how they are responding to climate risk. Further research using machine learning to evaluate climate risk disclosure should focus on analysing entire climate risk reports for key topics and trends over time.

1. Introduction

Human-induced climate change due to greenhouse gas (GHG) emissions is changing the environment in which firms operate. Weather and climate are becoming less stable due to increasing atmospheric GHG concentrations, with extreme weather events predicted to impact society at the local, national, and global levels [1]. These impacts will be exacerbated by ongoing emissions even as a shift towards net zero emissions occurs [2]. The move from a carbon-intensive economic and industrial model to a low-carbon future poses new risks for firms. Risk is defined as uncertainty that matters because it can positively and negatively affective the achievement of objectives (ISO31000). Firms must now contend with both direct risks posed by climate change as well as the transitional risks which arise from one of the most momentous changes to human productivity since the industrial revolution [3]. The movement toward adapting to and mitigating climate change risk is being accelerated by the influence of investment and trade, whether there are policies to support it or not [4]. These new pressures mean firms are having to adapt their risk management practices to adequately respond [5].
Firms are responding to pressure to be perceived as constructive actors on the climate crisis by undertaking climate risk assessments and disclosures. Climate risk disclosure (CRD) requires firms to report on work they have performed to identify material (i.e., relevant to the firm’s interests) climate risks and detail efforts they are making to manage relevant climate risks [6]. Disclosure can take a variety of forms and in most countries is performed at the company’s discretion. The need for disclosures to be rigorous and useful led the Financial Standards Boards to develop the Taskforce for Climate-related Financial Disclosures (TCFD) reporting framework, which has become the industry standard reporting tool [7].
Australian firms face the same pressure to manage climate risks as international firms. Australian regulators have begun providing guidance on the need for companies to align financial disclosures with CRD in line with the best practice. The Australian Prudential Regulation Authority released guidance on the importance of CRD, noting “the disclosure of decision-useful, forward-looking climate risk information allows interested stakeholders to assess an institution’s resilience to climate risks,” while identifying that uncertainty about the type and scale of risks should not mean that the risks are not disclosed [8]. In 2021, the Australian Council of Financial Regulators indicated a joint commitment to measuring the exposure of the Australian financial system to climate risks, increasing the regulatory supervision of the management of climate-related risks and improving the quality, consistency, and breadth of disclosures [9]. Stakeholders’ demand for climate disclosure has increased as investors seek to determine if those responsible for managing their investments are accounting for increased climate risks [10]. This means it is more important than ever for firms to understand their exposure to climate risks and best practice-related management of these risks. However, there is limited research into which climate risks and management responses are identified as significant by Australian companies. The CRDs offer a significant data source that can be explored to begin to understand climate risks and the associated risk-management practices disclosed by Australian firms. Specifically, this research will seek to answer the following research questions: what risk types and risk responses are dominant in CRDs and are different industry sectors identifying climate risk and climate risk responses differently in their CRDs? In addition, the study will explore whether the use of natural language processing techniques can identify underlying themes in the text that are not apparent using manual evaluation techniques. The novelty of this work stems from it being the first published work that meta-analyses Australian CRDs and the first to use natural language processing techniques on the CRDs. The outputs of these analyses will contribute to the CRD discourse in Australia.

2. Background

2.1. Climate Change Context

Anthropogenic climate change is a nonlinear risk event, leading to impacts that vary across temporal and spatial scales [11]. Associated impacts are subject to variable future intensity, with their severity dependent on global action taken to mitigate GHG emissions [12]. Burke, Hsiang, and Miguel [12] demonstrate that economic productivity is intrinsically linked with the global climate, with increasing temperatures correlating with declining labour supply and labour productivity. Climate change alters the value of financial assets in two ways: through an enhanced or complete depreciation of capital asset value, and through changing the output attainable with a given input [13]. This highlights why climate change is of increasing interest to firms to understand and manage.
The recognition of the potential impacts of climate change has resulted in growing awareness that it represents a significant risk to the stability of global financial markets [14]. The risk of a carbon bubble (the hypothesized bubble in the valuation of companies dependent on fossil-fuel-based energy production) has increased the desire of stakeholders to be able to evaluate a firms’ carbon exposure as a measure of their climate risk exposure [15]. The ability to evaluate the level of climate risk that firms are exposed to has traditionally been difficult due to a lack of transparency from firms [16]. Firms themselves are often unaware of their own exposure to a variety of climate risks due to a lack of tools to evaluate risks with radical uncertainty and non-normal probability distributions [16].

2.2. Climate Risk Types

Climate risk encompasses numerous interrelated risks, of which some or all may be material to a company’s activities. Three classes of climate risk are physical risks, transitional risks, and litigation risk. Physical risks arise from interactions between a predicted increase in the regularity and scale of climate-related natural hazards and the associated impacts to financial activity or asset value [17]. Physical risks can be divided into acute risks that are event driven, or chronic risks that are realisations of climatic trends [7]. Transition risks describe the risks to firms from the change from the current carbon-intensive economy to a low-carbon economy. Transitional risks are typically framed by whether they are regulatory risks, technology risks, reputational risks, or market risks. The severity of risks originating from these factors are reliant on the form, speed, and focus of transitional changes [7]. Litigation risk is the potential for firms to be liable for past or present contributions to GHG emissions and the harm arising from those emissions [10]. Climate risks are typically assessed separately but are interconnected. Table 1 shows the potential breadth of the risks that firms may need to consider in order to determine which risks are material.
The materiality (i.e., the relevance and importance of the risks to the firm’s business) of these risks will depend on the type of work a business undertakes, their size, and the level of diversification of the activities they perform [19].

2.3. Climate Risk Disclosure: History, Value, and Drivers

Corporate environmental reporting began in the 1980s, focusing on a firms impacts on the environment through metrics such as environmental pollution [20]. Current CRD practice was precipitated by Article 173 of the 2015 French Energy Transition Act, which required compulsory disclosure on climate change from financial institutions and non-financial companies in France [16]. Article 173 did not require firms to take action on the risks they disclosed, and subsequent reviews have found that the quality and robustness of disclosures are variable and that the risk assessment methodologies employed to align with the law were diverse [16,21]. Around the time Article 173 became law, the Governor of the Bank of England, Mark Carney, gave the influential speech ‘Tragedy of the Horizon’ which emphasised the critical role the financial system has in responding to the climate crisis [22].
The Financial Stability Board subsequently established the Task Force on Climate-related Financial Disclosures (TCFD), which developed and released a set of guiding principles for the best practices of climate risk assessment, governance, and disclosure [7]. The use of the TCFD reporting framework is voluntary in most countries, with limited oversight of the quality of reporting. The content of CRDs is at the discretion of the firm, but is typically expected to contain information on strategy and policy, risks and opportunities, GHG emissions and targets, and GHG emissions-reduction initiatives [23]. Firms choosing to report against the TCFD disclosure framework will report against the four categories of governance, strategy, risk management and performance metrics, and targets. These elements represent key managerial fields for firms, and are intended to drive awareness within firms that high-risk industries are not just those with significant carbon emissions, but also those whose practices are directly and indirectly affected by climate change risks [20].
The value of firms’ disclosures of climate risk has been widely discussed [24,25,26,27]. The CRD is in part driven by the mantra “you manage what you measure” [28]. There is an assumption that if firms actively assess and disclose climate risks, external finance will respond to those risks rationally by reducing its exposure, leading to outcomes that reduce climate risk and improve climate action [29]. The research by Thomä [28] found that 40% of companies who were informed about their level of alignment with the Paris Agreement subsequently chose to implement climate strategies into their investment processes. This suggests that improved information gathered for disclosure improves climate risk governance. By undertaking CRDs, firms gain legitimacy, reduce risk and uncertainty, enhance brand value, gain competitive advantages, and achieve financial gain [23]. Ameli [30] suggests assumptions that disclosure results in shifts of finance from risky to less risky is an “efficient market hypothesis” (EMH) whereby market participants are all rational actors. However, Ameli [30] further argues that the EMH is inherently flawed and transparency alone is not effective for reducing the impact of firms on climate change. Christophers (ref. [25]) agrees, suggesting that disclosure alone will not protect the financial system and regulatory directives are critical. Baker [24] suggests that mandatory disclosure standards are required for reports to be sufficiently detailed and thus more useful and influential.
The push and pull factors causing firms to choose to disclose on climate risk are the subject of increasing research [15,23,31,32,33,34,35,36]. Chithambo [37] suggests that stakeholder factors such as ownership concentration, employee pressure, creditor pressure, regulatory pressure, supplier and customer pressure, C-suite executives’ age, and social stakeholders influence firms choice to voluntarily disclose climate risk. Achenbach [38] identifies the determinants of disclosure as being the likelihood that potential opportunities will be identified, company resources, data availability, investment decision-making and litigation risk. There is also growing pressure on firms to undertake CRD due to stakeholder demands [33]. Disclosure can also be beneficial for firms. The choice to disclose financial risk can increase the capital that a company has access to. In an analysis of the Carbon disclosure Project (CDP) disclosures of S&P 500 companies, Flammer [32] found that companies voluntarily disclosing climate risk subsequently achieve an increased valuation. Firms that increase transparency through CRD also build trust and social license to operate that can be critical for their ability to conduct business [39]. For companies that are seen as bad or indifferent actors on climate change, a CRD represents an opportunity to control the narrative on their performance on key factors including emissions reduction [40].

2.4. Evaluating Existing Research on Climate Risk Disclosures

There are no similar studies either in Australia or other economic regions that use machine learning tools to evaluate the contents of CRDs. Instead, this review evaluates the existing research on CRDs, which has been performed using manual evaluation techniques. The existing research often focuses on the analysis of the presence of reports and the firm characteristics that could be used as determinants for the presence of reporting. Amran [41] reviewed climate change disclosures in 10 industries across 13 countries in the Asia Pacific region. The study used content analysis to create disclosure indices combined with an analysis of external factors to identify the determinants leading to climate change disclosures. de Grosbois [23] sought to extract information about the determinants leading to CRD from hotel companies. The research highlighted that there was significant reporting on qualitative indices such as strategy but limited reporting on quantitative indicators such as emission reductions [23]. Kouloukoui [29] sought to evaluate CRDs by the world’s 100 largest companies within the Global Reporting Initiative (GRI) or the Carbon Disclosure Project (CDP) reporting frameworks. This study used key phrase searches and content analysis to analyse reports by codifying indicators and analysing them to identify patterns in the communication of information [29]. The analysis demonstrated that the industry sector, continent, and board of directors’ characteristics correlated with the extent of their CRD [29]. This study provided a precedent for using market valuation to set a cutoff for the inclusion of CRDs into a study.
A growing number of analyses choose to focus on evaluating TCFD reporting. Demaria [20] sought to evaluate whether French firms were compliant with the TCFD’s reporting recommendations by undertaking a manual content analysis on disclosures from 2015–2018. The study found an increasing compliance with TCFD recommendations but highlighted that there were significant disparities between sectors [20]. It was proposed by the authors that systematisation would enable more source material to be analysed. Siew [42] researched the alignment of firms in the property and construction sector with TCFD reporting using data from the top 100 firms on the Bursa Malaysia capital market. The analysis found poor levels of disclosure against TCFD metrics by Malaysian property and construction firms, and the content analysis demonstrated variable levels and degrees of quality of the disclosures against key TCFD elements [42]. This analysis demonstrated the value of evaluating CRDs at a national level to give an overview of the approaches to climate risk reporting in a country.
Researchers have also evaluated disclosures made using different reporting frameworks, such as environmental social and governance (ESG) reports, CDP reports, GRI reporting, and annual financial disclosures. Dahl [31] reviewed three climate reports from international companies in the energy sector using a qualitative linguistic approach. The study found each of the companies’ reports framed climate risk as either a responsibility, a business risk, or a business opportunity [31]. This study highlighted that disclosures provide insight into climate change response strategies. Efimova [43] analysed the reporting by the 13 largest oil and gas companies in Russia. These reports were in various formats, including environmental, sustainability, and integrated reports and were analysed using linguistic, statistical, and qualitative analyses. The researchers found that there was no comprehensive or universal approach to revealing climate risk; therefore, the utility of reporting to stakeholders was lower [43]. Sakhel [44] drew on data from 126 companies making CDP entries from 2011 to 2013 to evaluate the risk-response strategy firms used to manage the physical, regulatory, and market risks associated with climate change. This analysis found that firms predominantly assess and manage regulatory climate risks, potentially leading to a systemic underestimation of physical and market risks, and that companies’ risk management procedures are biased to the short term [44]. This study demonstrated the utility of focusing on the type of risks and risk responses as key components of firms’ CRDs.
Haque [45] reviewed the disclosures by non-governmental organisations’ in Australia. They identified the existence of disclosures and used content analysis to identify patterns. The study found improvements in both the number and extent of disclosures over time [45]. Foerster [19] reviewed the legal and regulatory basis for Australian CRDs before surveying disclosures by ASX-listed resource and energy companies that were in the top 20 GHG emitters in Australia. This survey considered the presence and accessibility of reporting and the extent and quality of the CRDs provided by these firms. The analysis found that each firm made some mention of climate risks, with a particular focus on acute physical risks, but found that overall the disclosures tended to be limited and provided only general qualitative discussions and that their information accessibility was poor [19]. This study represents the only attempt in the literature at evaluating Australian CRDs by for-profit firms. It was undertaken before CRDs became a more prevalent company action in line with the recommendations in TCFD reporting. Further research on a broader dataset of CRDs was recommended by the researchers.

2.5. Gaps for Research

There is limited information regarding the number of Australian companies disclosing climate-related risks and the type of risk disclosure frameworks used to disclose risk. There is no published research on the types of climate risk that Australian companies are disclosing. There is no research on what type of risk responses Australian firms are undertaking after having identified material climate risks. It is unknown whether there are differences between sectors in Australia, as has been highlighted by studies in other jurisdictions [20]. In addition, none of the research utilised leading machine learning approaches for natural language processing. This research begins to address all these gaps with the methodology described next.

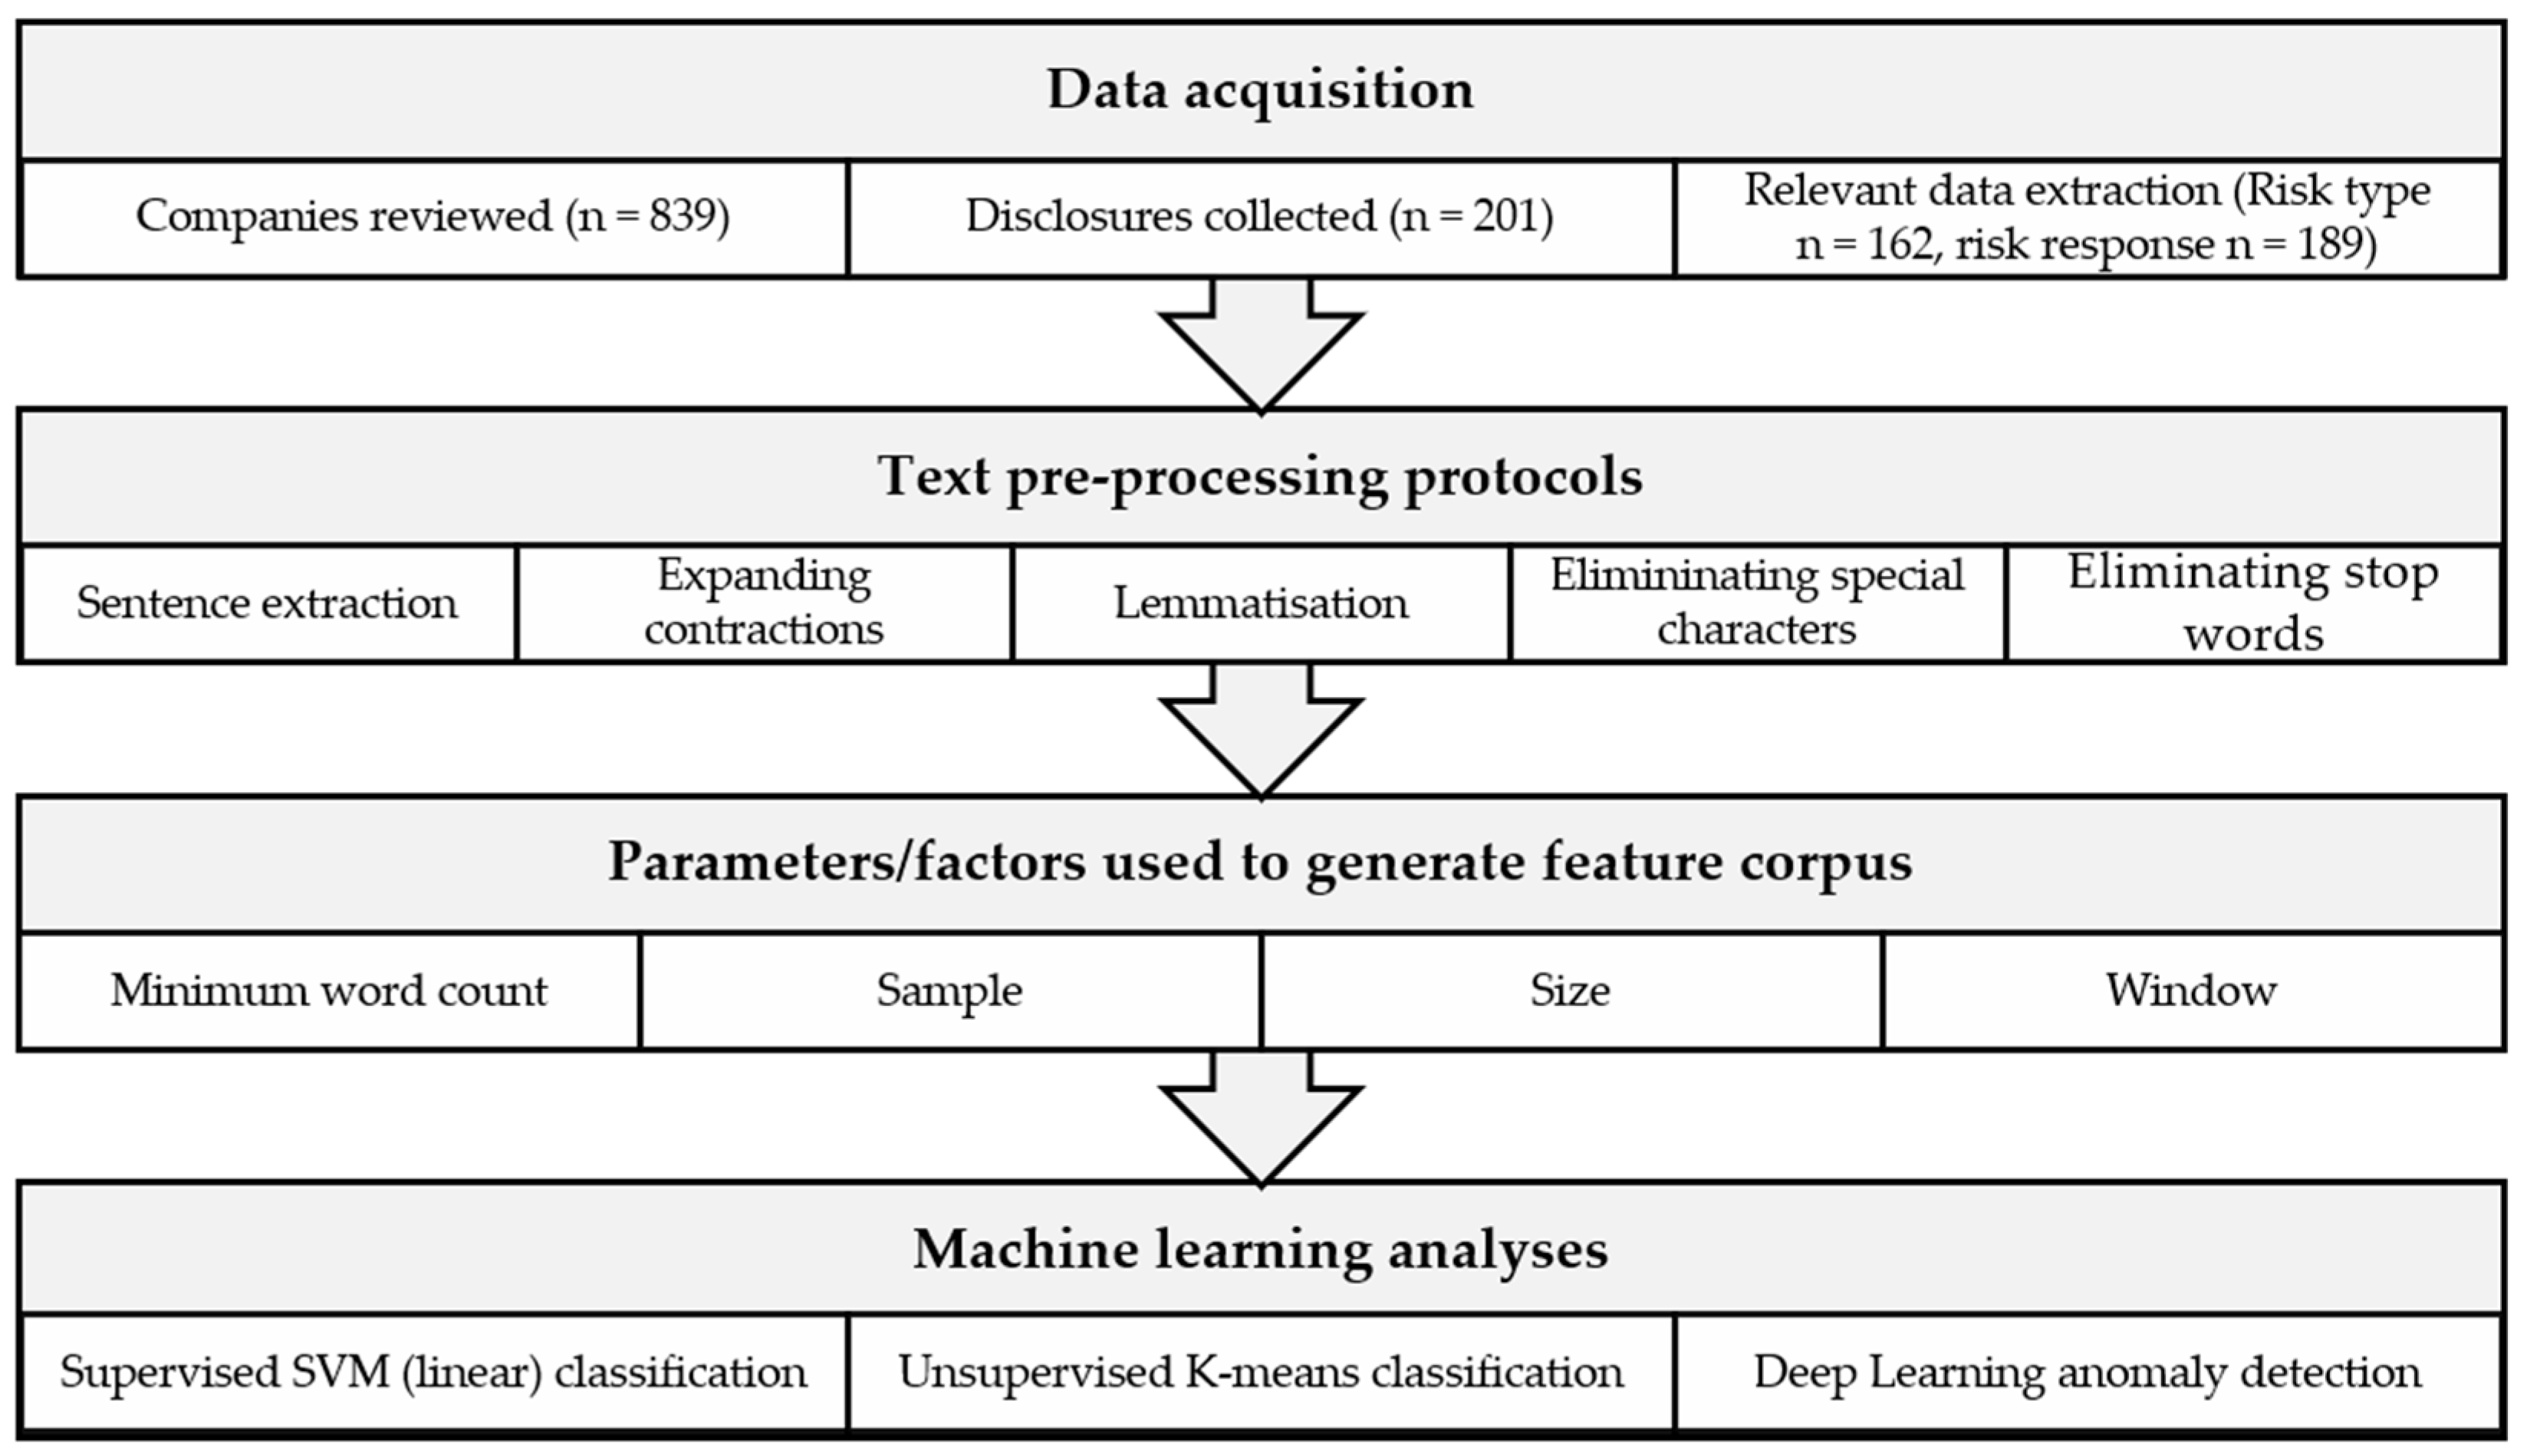
3. Materials and Methods

There were four stages to the analysis of CRDs, which were data acquisition, pre-processing, parametrisation, and machine learning analyses. The workflow used to undertake this machine learning analysis is shown in Figure 1 and explained in the following section.

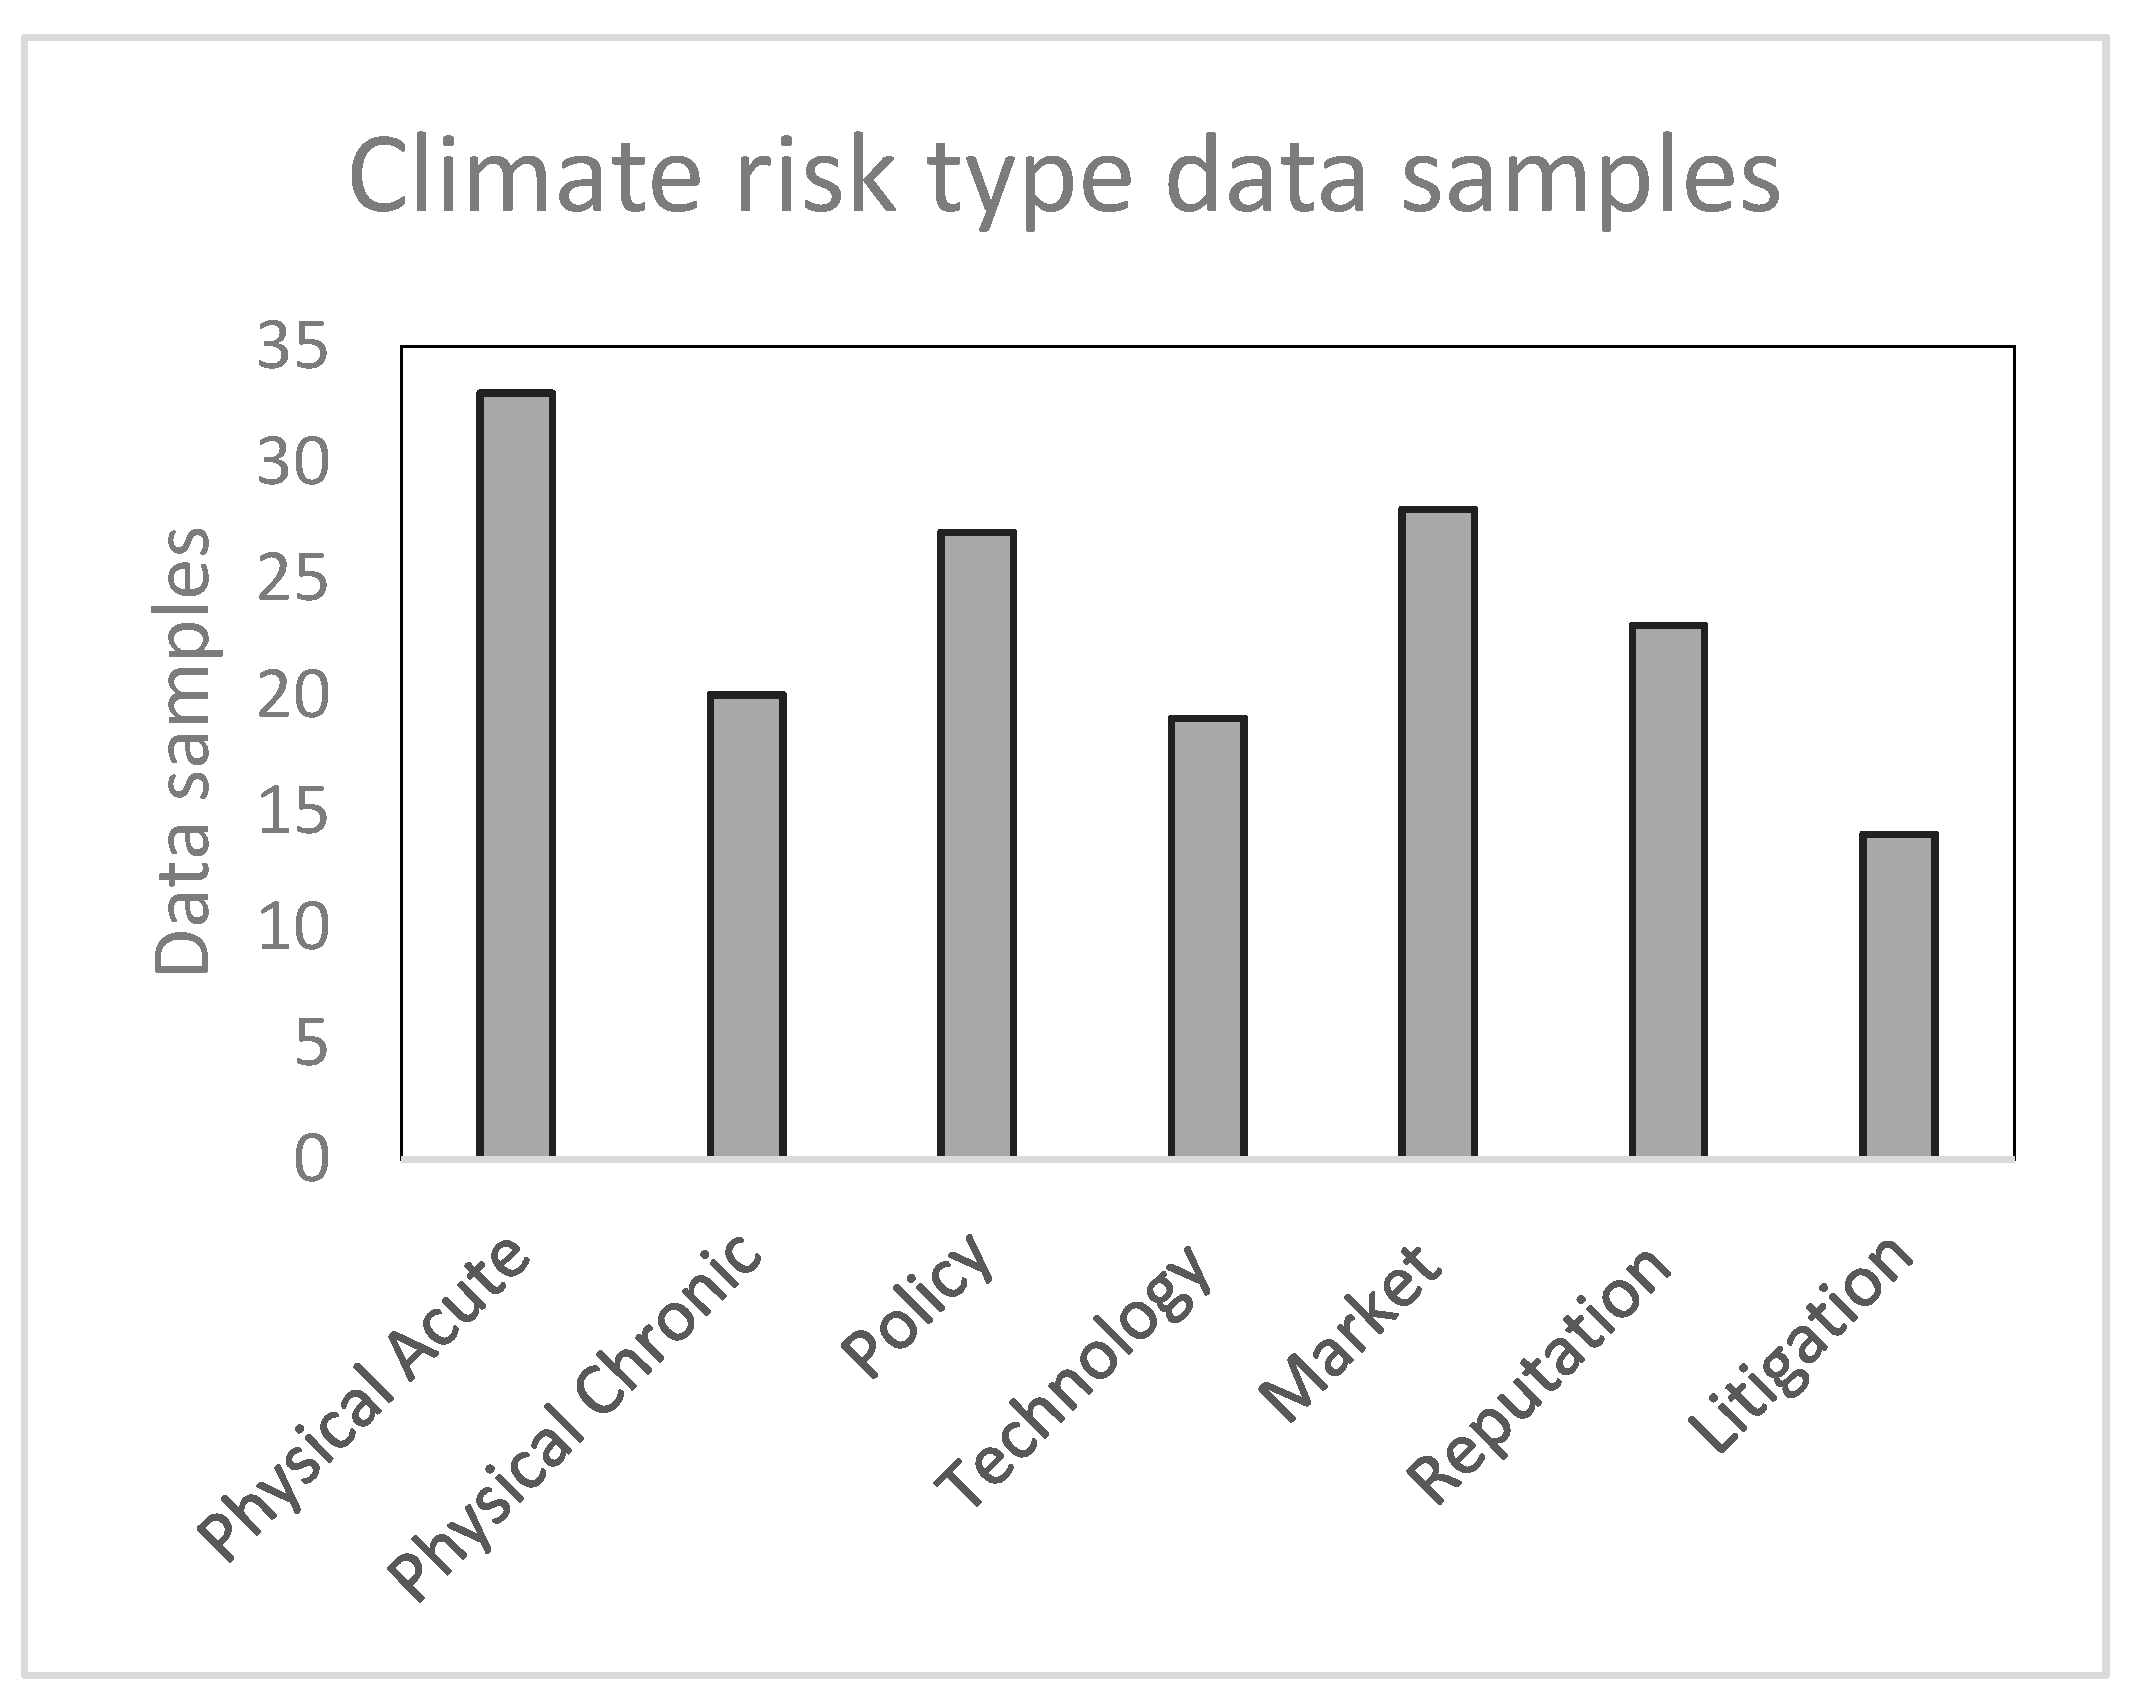
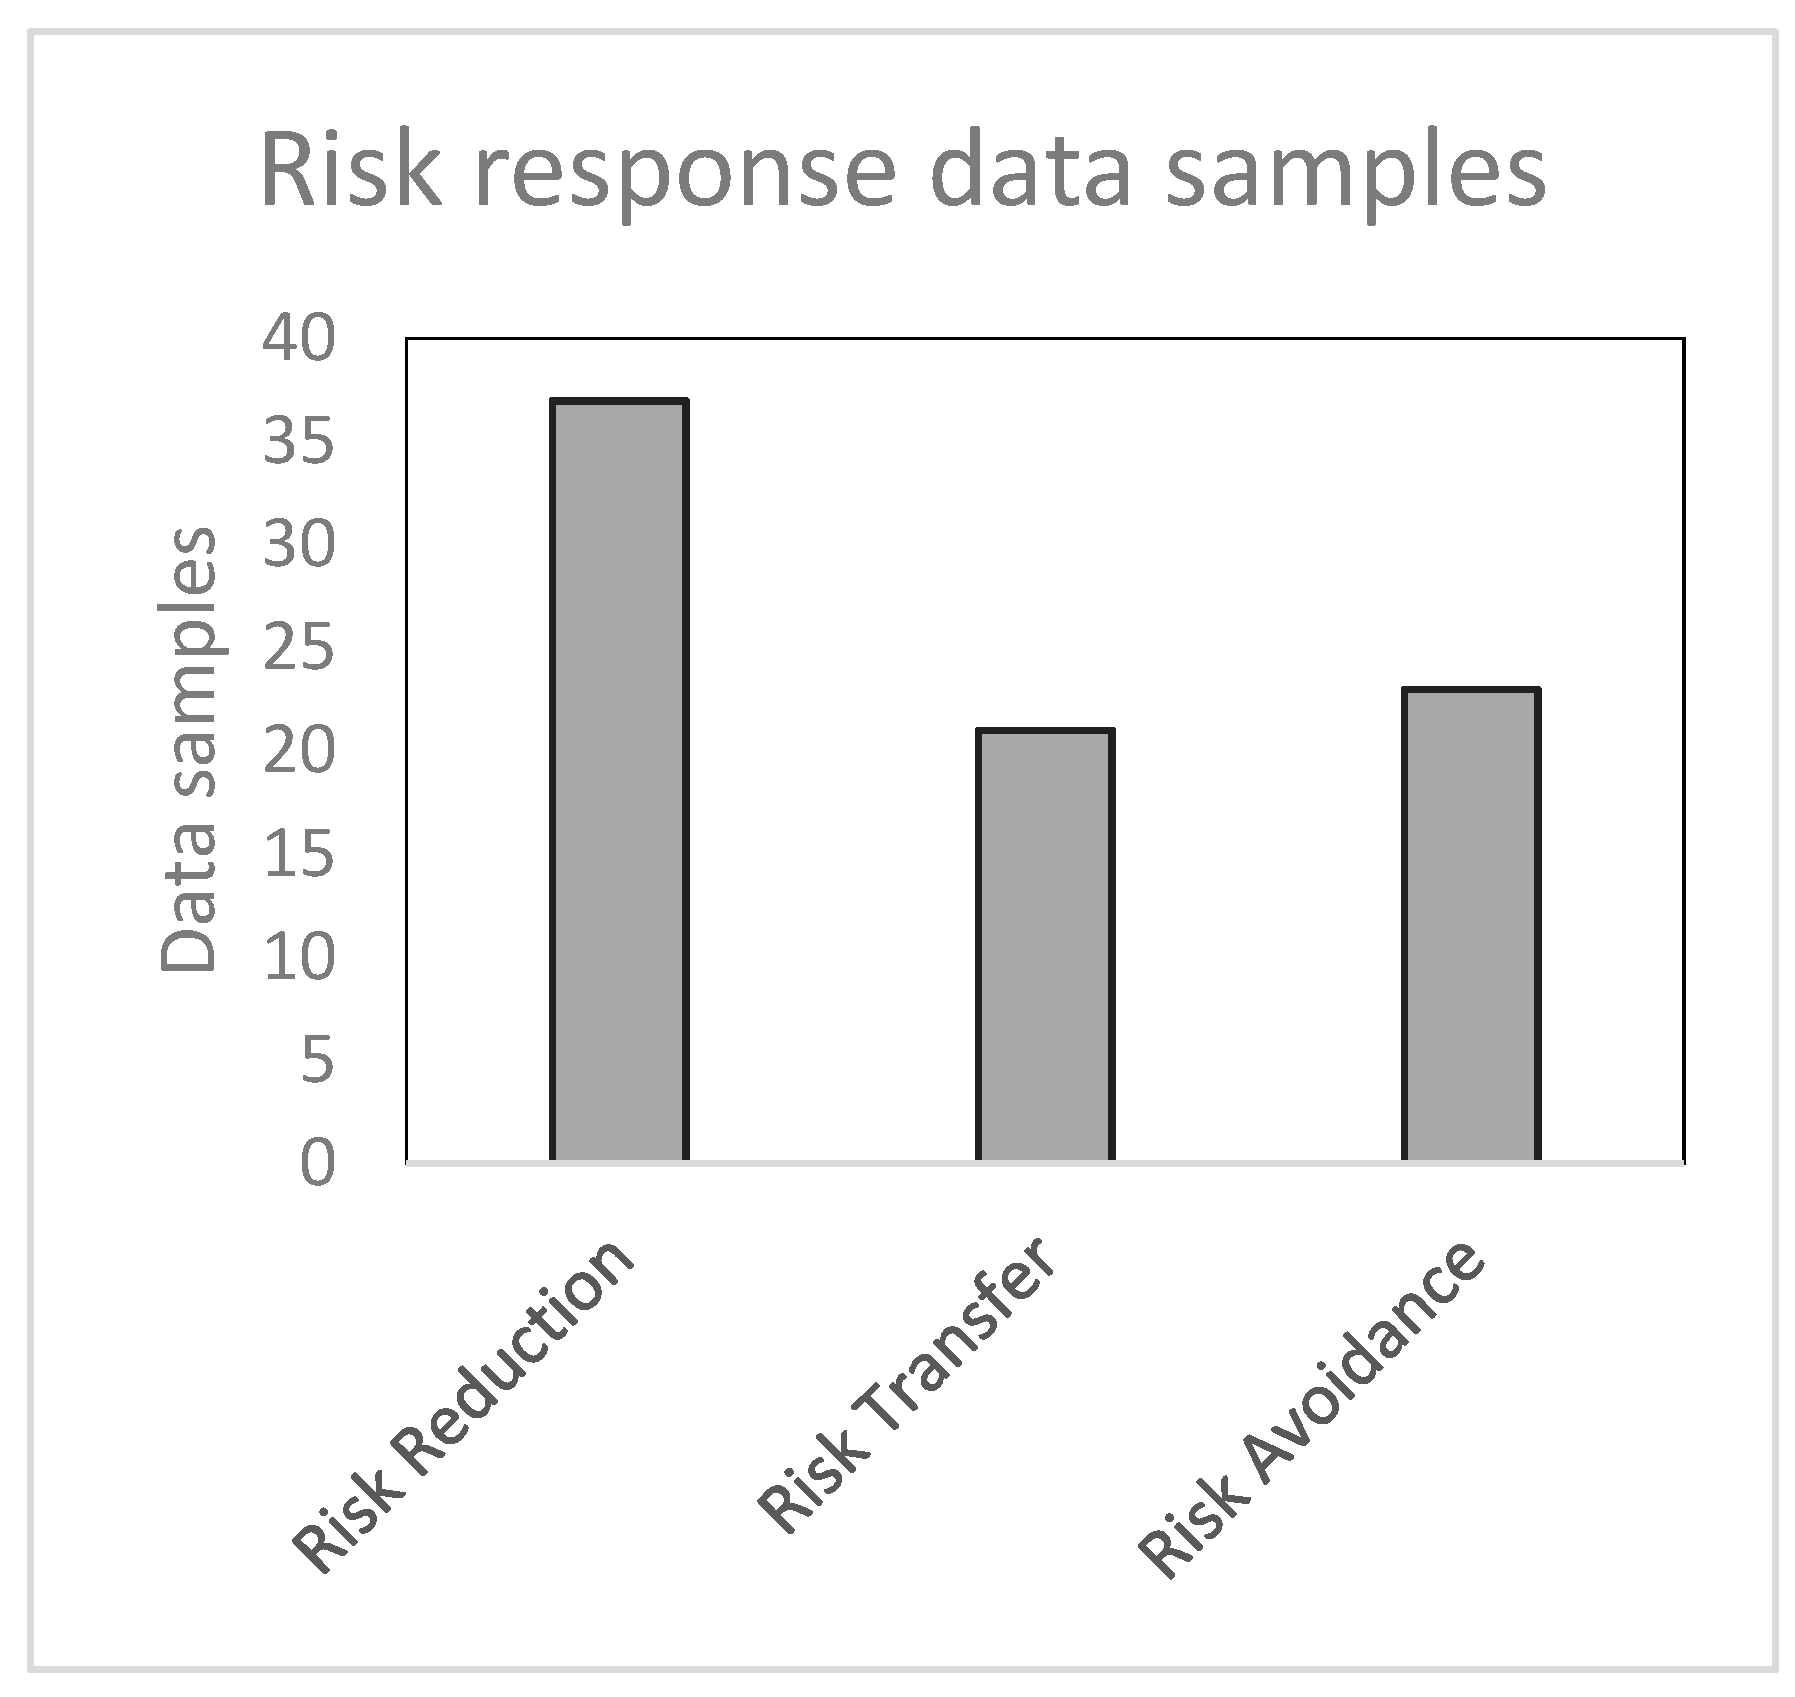
3.1. Data Acquisition

This analysis focuses on a dataset of climate-risk disclosures by Australian firms listed on the Australian Securities Exchange Ltd. (ASX) at the time of data collection (n = 2007) in April 2022. As ASX-listed companies are publicly listed they are most likely to be subjected to scrutiny from investors, regulators, and shareholders, thereby increasing the likelihood that they will choose to undertake CRD [42]. Firms with a market capitalisation at time of data acquisition of greater than $100 million AUD (n = 839) were reviewed for this analysis. This sampling strategy was supported by existing research demonstrating that company size is a key determinant on the probability of disclosing climate risk [46].
The CRDs are meant to be publicly accessible for stakeholders; therefore, it was determined that a web search process was suitable for determining if ASX-listed companies had made a disclosure. Data were acquired by visiting firms’ websites and accessing their investor information portal, where companies store public disclosures, during a one-month period in April 2021. Targeted reports (e.g., TCFD reporting) were automatically included, while other reporting frameworks and recent financial disclosures were subject to a pdf key term search (climate, climate risk, carbon risk, emissions, and sustainability) in order to identify CRDs. All relevant disclosures were collected for analysis, with Table 2 showing data acquisition results.
Table 2 shows that of the 839 companies with a market capitalisation of over $100 million, 201 had performed some form of climate risk disclosure. Disclosures aligned with the TCFD framework were the most common, representing over half of all CRDs. The next most common were disclosures made without a specific framework within the annual financial disclosures required by the ASX. The remaining disclosures made use of ESG-, GRI-, or CDP-reporting frameworks, which are aligned with climate risk but less targeted than TCFD reporting.
Following data collection, the 201 disclosures were accessed to extract data relevant to the types of climate risks Australian companies disclosed and the types of risk response Australian companies pursued. To select sections of the disclosures relevant to risk identification, Table 1 was used as a guide for inclusion. Entire sections, paragraphs, or sentences containing risk identification were extracted. To identify text related to firms’ risk responses, the framework proposed by Busch [47] and revised by Sakhel [44] was employed. This framework categorises climate-risk responses by firms as falling into three categories: risk reduction, risk transfer, and risk avoidance. Table 3 shows examples of the types of responses belonging to each category.
The relevant text section was extracted from the pdf and placed into a spreadsheet. The selective extraction process returned 162 companies who disclosed the types of risk they face (80.6%) and 189 companies who identified a risk-response strategy (94%).

3.2. Text Pre-Processing and Parametrization

Text pre-processing and parametrisation for this analysis is based on the work of Rybak [48], where the methodology is described in detail. Text pre-processing protocols were implemented to clean the text to a more interpretable format by the algorithm used in this research. There were five pre-processing protocols applied to the text data: sentence extraction, expanding contractions, lemmatisation, eliminating special characters, and eliminating stop words. Sentence extraction assigned each line of text with a sentence number for identification and extraction [49]. Expanding contractions required that contracted words were re-expanded to be more easily processed [50]. Lemmatisation was performed to transform a word to its root form [51]. Special characters that did not contribute to text’s meaning were removed to reduce noise for machine learning algorithms [52]. Stop words that did not contribute significantly to meaning in an analysis were removed [53]. Four parameters were applied to generate a feature corpus. A corpus is a collection of machine-readable authentic texts that is sampled to be representative of a larger set of texts. A minimum word count parameter was used to specify the minimum frequency in the entire dataset for the word to be included in the analysis vocabulary [54]. A sample parameter was used to reduce sample effects of frequent words [54]. The size and dimension of word vectors was set for the analysis. A context window parameter was applied to set the size of the window that would be considered by the algorithm to be relevant context when training the machine learning model [54].

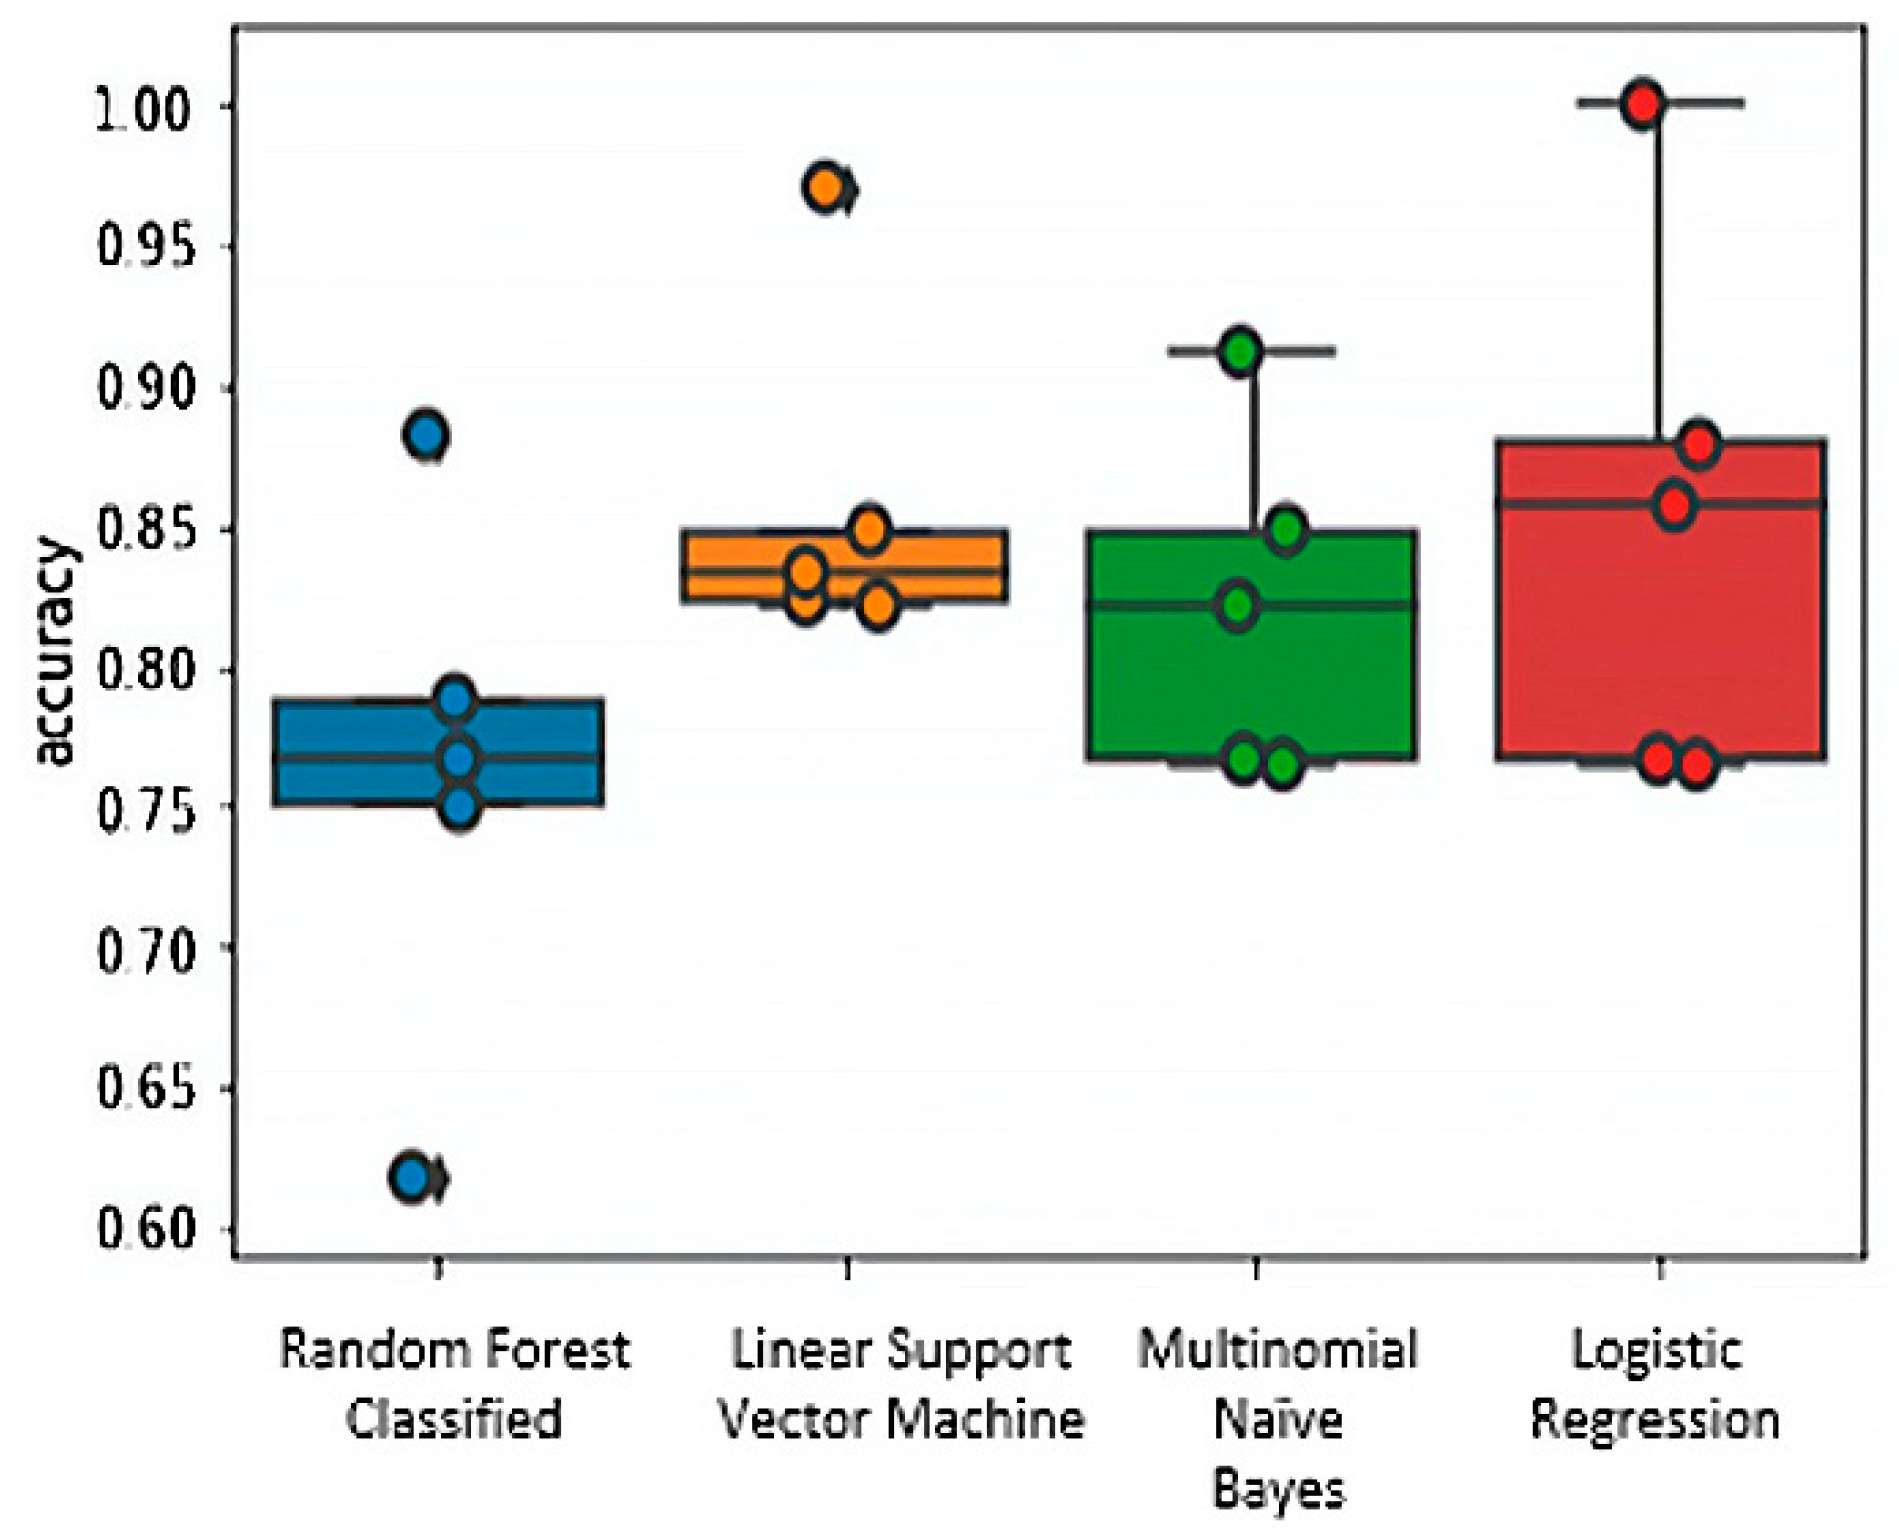
3.3. Supervised Machine Learning Models Comparison and Implementation

The supervised machine learning classification required hand coding of the training data. For this analysis, the methods demonstrated by Rybak [55] were employed. For each dataset, 20% of available data entries were hand-coded to train the machine learning algorithms. The use of 20% of data as a sufficient data sample is supported by Grimmer [56]. Data from each dataset were allocated to relevant categories according to the seven climate risk types and three climate risk response types identified in Table 1 and Table 3. The data disclosed by each firm typically contained multiple types of climate risks and risk responses being disclosed. Labelling of data was evaluated to ensure that training data were correctly assigned to the relevant class.
Figure 2 and Figure 3 show the number of samples assigned to each data label by manual coding for the climate risk types and risk responses datasets. These samples were used as training data for the supervised classification algorithm. Figure 2 shows that each risk type was represented in the samples, with physical acute being the most common risk type sampled. Figure 3 shows risk-reduction samples were overrepresented compared to other risk responses.
Training data enabled the machine learning algorithm to predict the label a human would assign [56]. The intent of this supervised learning analysis was to assess which risk types and risk response strategies were dominant in the Australian CRDs; thus, when a firm disclosed multiple risk types or responses, the most prevalent risk was returned. To determine the most accurate machine learning algorithm for this particular dataset, four different algorithms were evaluated. A random forest classifier, multinomial naïve bayes classifier, logistic regression, and a support vector machine (linear) algorithm were each tested against the training data.

3.4. Unsupervised Machine Learning

The unsupervised machine learning methodology for this analysis is based on the work of Rybak [55]. Unlike a supervised classification, an unsupervised machine learning analysis does not use expert labelling to create training data for the algorithm [50]. Instead, an unsupervised classification algorithm was employed to sort climate risk data using patterns and relationships it identified among the data [50]. A K-means algorithm based on the Hartigan–Wong method was used for clustering of data. The K-means algorithm clustered data by iteratively minimising the distance between the data and the mean of the cluster [53]. Each output represents a cluster of the mean observations assigned to it [56]—for the purposes of this analysis, this represents the words with the strongest relationships in the cluster. One difficulty associated with the K-means model relates to the requirement for researchers to make the initial choice of the number of clusters for the algorithm to fit data to. This can bias or influence the outcomes if an unsuitable number of clusters is chosen. The number of clusters chosen for this analysis was the same as the number used for the supervised analysis, with 7 clusters for climate risk types and 3 clusters for climate-risk responses. This decision was made to retain comparability of the supervised and unsupervised analyses.

4. Results

4.1. Supervised Classification

The results of the supervised classification were derived through the use of the supervised classification algorithm. A random forest classifier, multinomial naïve bayes classifier, logistic regression, and a support vector machine (linear) algorithm were each tested against the training data. The accuracy was defined as the percentage of correct predictions for the test data. It was calculated by dividing the number of correct predictions by the number of total predictions. This can be simply expressed as:
accuracy = correct   predictions   all   predictions
The outputs from each of the four machine learning models were then compared for accuracy utilising the Scikit-learn library and the following parameters:
X_train, X_test, y_train, y_test = train_test_split(X, y, test_size = 0.3, random_state = 42)
The test_size = 0.3 indicates the percentage of the data (30%) that was held over for testing the models. Figure 4 shows the calculated accuracy for the four algorithms’ ability to sort new data into the correct class for the risk type dataset. Figure 5 shows the calculated accuracy for the four algorithms’ ability to sort new data into the correct class for the risk-response dataset. The scale is 0–1.0, where a score of 1.0 indicates 100% accuracy in sorting the data to the correct class.
Figure 4 demonstrates that the model with the highest median accuracy is logistic regression; however, this model had a high variance. The next best-fit model is the linear support vector machine (linear), which has a median accuracy of 0.84, compared to 0.83 for the multinomial naïve bayes and 0.76 for the Random Forest. For Figure 5, the highest median accuracy was found by the linear SVC at 0.93. This was followed by both logistic regression and multinomial naïve bayes with 0.88 and random forest with 0.83. It was preferred to select one algorithm to analyse both of the data sets. Based on the performance across both datasets in this analysis, it was determined that a support vector machine (linear) was the most accurate algorithm. This algorithm had the highest accuracy across both datasets when performing multiclass categorization on the expert coded training data, and the outputs from this algorithm have been included in this report.
Table 4 shows the output of the machine learning analyses for both the climate risk types and risk-response supervised analyses.
Table 4 shows the dominant class of climate risks identified by Australian firms in their disclosures were acute physical risks, with the algorithm detecting this class for 42% of firm disclosures. With chronic physical risks (8%), physical risks comprised the dominant risk type identified in half of all disclosures. The increasingly volatile weather in Australia and the extreme events already impacting firms in the form of bushfires, floods, drought, and hailstorms may enhance the focus of firms on physical risk [57,58,59,60]. Firms have been aware of physical risks from weather and climate for longer than they have been focusing on transitional risks, as these risks can be more easily assessed by analysing historical records [61].
Market risks were the next most prevalent, accounting for 23% of disclosures, followed by regulatory risks (14%), reputation risks (9%) and technology risks (4%). These results give an insight into the priority and precedence given by firms to the different types of transition risks, with the least dominant risks potentially perceived as the least material by firms. Close to 49% of firms’ dominant risk type disclosed were transitional risks, while litigation risks only appeared as dominant in two disclosures (1%). The low representation of litigation risks can be tied to the fact that it is a developing risk that is difficult to quantify and predict [62]. Litigation risks thus far are primarily targeted at the largest emitters, not those who are failing to act on climate risks [63].
The materials sector comprises significant contributors to climate change who are also exposed to both physical and transitional risks [64]. This analysis found that the most prevalent risk type disclosed in the materials sector are acute physical risks (46%) followed by market, reputation, and regulatory risks (each 14%). The dominant risk identified for the energy sector was the market risk type, potentially related to the changing expectations of consumers relating to the carbon intensity of the electricity they purchase [65]. Acute physical risks dominated the real estate sector disclosures (53%) and insurance sector disclosures (60%). The dominant risk type for the banking sector was shared between acute physical risks (43%) and reputation risks (43%).
The analysis of the dominant risk responses being disclosed by Australian firms showed that 93% of all firms preferred to implement a response strategy aimed at reducing risk, not transferring it (1%) or avoiding it (6%). The dominance of managing climate risks through risk reduction techniques was universal across all industry sectors. The sector where risk avoidance was most prevalent was the diversified financials sector, which relates to firms with investment strategies that rule out all fossil fuel companies or are pursuing a divestment approach. The only sector where risk transfer was returned was in the Commercial and Professional Services sector, which relates to strategies to offset emissions.

4.2. Unsupervised Classification

An unsupervised classification using a K-means algorithm was used to generate feature clusters for each dataset. This algorithm sorted the text data into the predetermined number of classes and labelled these classes with the words that defined each cluster. The word clusters returned by the unsupervised analysis, and the frequency with which the firms were assigned to them, are shown in Table 5.
For the risk type dataset, each firm was sorted into the dominant cluster observed by the algorithm within the disclosure. The first two clusters of “water, related, security” (16% of firms) and “environmental, response, security” (12% of firms) are related to firms that identified factors such as water and the environment and their influence on operations. Reduced water security due to climate change has been identified as a risk to the agriculture and resources industries in Australia [66]. The term security is used to describe a firm’s protection from perceived external risks. The cluster “opportunities, transition” (17% of firms) shows that a number of firms are identified in their disclosures that the transition to a low-carbon economy presents opportunities alongside the expected risks and impacts. Firms want their disclosures to identify to stakeholders how business might operate in a new low-carbon economy [67]. The cluster “financial, assessment, assets” draws out a theme from the texts that companies are linking financial outcomes to the assessment of the potential impacts on assets. This suggests that firms are looking to use assessment tools to understand the impacts on finances and assets. This theme is prevalent amongst real estate firms, which can be tied to the level of exposure that property portfolios may potentially have to physical climate risks. The cluster “new infrastructure, building, costs, expenditure” highlights a theme of future expenses related to new infrastructure and building investments in response to climate risks. The “property, insurance” (16% of firms) cluster identifies that firms are transferring risk through insurance to manage physical risks of climate change. The final cluster “carbon, tax, emissions, trading” relates to regulatory mechanisms that firms may need to navigate. The identification of this as a key theme in the dataset indicates that firms are considering emissions trading in their strategies even now while Australia does not have mandatory carbon pricing.
Table 5 also shows the three clusters generated for the risk-response dataset. The three clusters generated by the unsupervised training algorithm were “emissions, transition”, “transition, greenhouse, reduction”, and “investment, risk, impacts”. It is a function of using too few clusters that two of the three clusters generated by this unsupervised analysis are very similar. The “emissions, transition” and “transition, greenhouse, reduction” clusters both relate to the theme of reducing company emissions as part of the transition to a low-carbon economy. A firm’s reporting of their strategies to manage climate risk from Australian companies has a strong focus on a firm’s carbon emissions profile. The “investment, risk, impacts” cluster may indicate that firms see investment as a method for responding to climate risks or that climate impacts represent an investment risk. This theme potentially aligns with either the risk-reduction or risk-avoidance strategy from the supervised classification through a low carbon (risk reduction) or carbon-free investment (risk avoidance) approach. This was the dominant cluster firms were sorted into, with 47% of firms being allocated to this group.

5. Discussion

Australian firms are increasingly disclosing climate risks they are exposed to, in part as a response to stakeholder pressure and expectations [68]. This analysis represents the most comprehensive survey of CRDs by ASX-listed Australian firms. Despite the growing pressure from stakeholders, the proportion of Australian firms disclosing climate risks and the robustness of their disclosures is low. This analysis focused on companies with a market capitalisation greater than $100 million due to low disclosure rates for smaller firms. There are few international evaluations of the proportion of companies disclosing climate risk; however, Jiang [69] surveyed CDP disclosures in the United States and found 52.78% disclosing, compared with 5.86% of Brazilian firms, 2.16% of Russian firms, 21.27% of Indian firms, and 17.93% of Chinese firms. Considering that this is only one disclosure type, it is possible that the true disclosure figures including other frameworks are even higher. Australian CRD rates are likely lagging compared with some comparable countries and exceeding those of others.
This analysis builds upon previous work performed to analyse firms’ CRDs and work that has demonstrated the utility of machine learning for analysing textual resources [19,70]. Previous research evaluating disclosures has relied on content analysis using predetermined indices to evaluate the presence and extent of components in the text. This approach required a higher human input to determine relevant information. Using machine learning to evaluate CRDs represents a novel approach for evaluating the underlying patterns and properties of CRDs by Australian firms. As this is a novel approach to evaluating CRDs, the outcomes of this analysis can only be compared in this discussion to the small number of international CRD evaluations performed using manual methods. This research explores the implications of the information derived from an analysis of the CRD approach of Australian firms.
The information derived from the machine learning analyses identified key patterns and themes within the dataset, providing new insight into the focus areas for CRDs by Australian firms. These outputs enable an evaluation of how the CRD discourse is being constructed by Australian firms, and what subjects are considered material to firms. This improves the understanding of how climate risk practice is performed by Australian firms.
The supervised machine learning classification in this analysis provided insight into the most prevalent material climate risks and risk responses for Australian firms. The analysis demonstrated the predominant material climate risks being reported across Australian disclosures were posed by acute physical events. Australia has an established history of severe bushfires, heatwaves, flooding, drought, cyclones, and hailstorms, and the analysis conducted by the Intergovernmental Panel on Climate Change indicates that these events will be exacerbated by future climate change [2]. Australian firms are focusing on short-term physical risk events associated with weather. This finding is supported by the analysis of Australian firms completed by Foerster [19] that showed Australian firms prioritising physical risks over transition risks. Market risks are the dominant transitional risk being disclosed by Australian firms, followed by regulatory risks. This contrasts with the findings of Sakhel [44] who identified that regulatory risk was the primary focus of European firms disclosing climate risk. This may relate to the political environment in the respective regions, with the EU taking an intervention-based regulatory approach to reducing emissions through an EU wide carbon tax, whereas the Australian government’s approach to managing firms’ emissions and climate change is largely voluntary for firms and has a lower regulatory burden [71].
Different industry sectors focus on different risk types. The key industry sectors, which are materially exposed to climate risks such as the materials, banking, and energy sectors, were each primarily focused on different risk categories based on their own materiality assessments [19]. The materials sector, which accounted for over 18% (the largest single sector) of the total market capitalisation of the analysed companies, was mostly focused on acute physical risks, whereas banking was focused equally on acute physical risks and reputation risks, and the energy sector was focused on market risk. The risks of climate change in Australia are being evaluated differently by different sectors. If financial regulators propose to impose a regulatory requirement on CRD, they will need to understand the ways sectors assess and manage material risks.
The supervised classification of risk response disclosures also found that Australian companies are primarily focused on risk-reduction approaches. This finding aligns with international research by Sakhel [44], which demonstrated that European firms were also focused on risk reduction rather than avoidance or transfer. Kang [72] also found that in Korea, businesses have implemented short-term climate-risk mitigation and adaptation actions in a limited capacity to respond to climate risks. The outcome of this machine learning-analysis aligns with the broader international literature on how firms are responding to climate risk. If emissions regulations change or if the impacts of climate change are realised with significant economic costs, risk responses may evolve accordingly [73].
The unsupervised clustering analysis identified the foremost themes in Australian firm’s CRDs. The topics identified by this approach are the major recurring themes in the Australian CRD discourse. The seven climate-risk-type-assessment cluster’s broad themes were security, transitional opportunities, risk to assets, investment costs, insurance, and regulation. The prevalence of the term security in the clustering analysis was tied to potential risks to food security, water security, energy security, asset security, and supply-chain security in the face of extreme weather events and climactic trends. Firms are identifying how acute physical events impact the security of business operations. The theme of transitional opportunities shows that firms are demonstrating to stakeholders that they are using a climate-risk management approach to pursue investment opportunities. Luo [74] suggests the ability to identify climate-related opportunities is now considered a component of managerial competency, hence the focus on CRDs. By discussing opportunities in CRDs, firms are attempting to allay stakeholder concerns regarding climate risks, and thereby reframe their climate risk narrative. The risk to assets theme signals an awareness among firms that their assets are exposed to increased physical acute weather events and long-term climactic trends. The investment cost’s theme is an acknowledgement that managing and adapting to climate risks has an economic cost and that firms are closely tying that cost to infrastructure expenditure. The investment in climate-resilient infrastructure in Australia may be necessary to respond to a variety of physical risks over the short and long terms [75,76,77]. There is no theme linking costs and expenditure to either transitional or litigation risks, although both may result in costs to businesses. The insurance theme reflects the importance of companies transferring risk from extreme weather events onto insurers. It also reflects concerns about property insurance as a result of climate change in the cyclone and bushfire prone regions of Australia where securing insurance is becoming more costly [78]. The theme of regulation can be tied to firms’ considerations of carbon pricing. Australia had an emissions-trading scheme in the early 2010s, and this analysis would suggest that firms still believe there is a possibility of such a regulatory intervention returning. Six of the generated clusters could be linked more closely to physical risks and only one to transitional risks.
The climate-risk-response text analysis generated three clusters: emissions and transition, transition and greenhouse reduction, and investment, risk, and impacts. It is of note that two clusters from the risk response analysis related to the need to reduce GHG emissions. This suggests that the focus of Australian firms is on managing risk by reducing emissions. This is notable considering the regulatory approach of the Australian government has placed little to no pressure on firms to reduce emissions [79]. This indicates the impetus to manage emissions is being driven by a non-domestic source, such as international investors who must meet carbon-related obligations in their own countries. Further analysis would be necessary to evaluate the context in which emission reductions are described to determine whether the process of emission reductions is being seen as a threat or opportunity in the disclosures. The ‘investment, risks and impacts’ category is too broad a theme to be meaningfully interpreted, with more clusters likely to offer more insight for the risk response analysis.
By interpreting the outputs of the two analyses it is possible to reach some broad conclusions about CRD discourse in Australia. The combination of a strong focus on acute physical risks and transitional market risks and a risk reduction approach is suggestive of a short-term mindset from Australian firms regarding climate risk. An assumption is being made in these disclosures that the climate risks most likely to be realised are from acute physical events, and that the management approach that is most suitable is a gradual reduction of risk [80]. This approach does not consider the nonlinearity of climate change impacts, nor the potential for significant disruption associated with the inevitable attempt to transition to net-zero emissions by 2050, as required by the Paris Agreement. The relative absence of firms attempting to avoid risk entirely indicates that many firms continue to see climate risks as being manageable with fine-tuning to current strategies. This conclusion is supported by a European-focused analysis of disclosures by Sakhel [44] who identified a systemic failure to account for longer-term climate risks.
The thematic focus in the clustering analysis on the risk type data showed linkages between climate risk and costs, investment, finances, insurance, and tax. This suggests that a key underlying motivator for CRD by Australian firms is composed of financial or bottom-line considerations. Across the seven key themes identified, only two related to environmental concerns (water and environment), whereas the rest were tied to economic factors. Even the environmental concerns represent a reflection of how the environment will impact a firm’s security. In the risk response clustering analysis, the focus on reducing GHG emissions was dominant when considered alongside the lack of regulatory measures for its achievement. The clusters highlighting financial implications and the clusters highlighting the need to reduce emissions may be related, although whether firms view this positively or negatively cannot be judged by this analysis.
Without prescriptive metrics and a common approach, CRDs will remain of low utility to stakeholders. An intervention by regulators that requires the disclosure of climate risk and that mandates this disclosure’s performance is likely required to improve the quality and utility of disclosures. This broad conclusion is supported by the literature, with a number of researchers indicating the quality and utility of disclosures for decision-making remains low [16,21,81]. The difficulty in accessing firm’s CRDs is an ongoing constraint upon their broader utility to stakeholders.
The choice to extract data from the reports on climate risk types and climate risk responses instead of evaluating the entire reports limits the scope of this analysis. A data extraction was performed to improve the veracity of the supervised classification. In reality, the unsupervised classification would have been a more valid analysis if performed on the complete CRDs. This was not deemed a viable option due to the time required to extract the data, to clean it, and then to perform pre-processing. The conclusions about the underlying themes are based on incomplete disclosure data. Likewise, frequency does not equate to severity, so whilst this work reveals the risks frequently identified it does not give insight into the inherent significance of the risks being reported.
The decision to use a supervised classification that identifies the dominant class rather than the presence and proportion of a risk type or response reduced the insight into the data (i.e., confirmation bias). Most of the disclosures identified multiple types of risks or risk responses, and this information was discarded in the final output. The coding to develop a tool capable of performing an analysis of this kind was out of the scope for this research.
CRDs’ value can be limited because currently the presence and content of these disclosures is at the company’s discretion. Disclosures of climate risk have variable and often irrelevant content. Firms from emissions-intensive sectors use disclosures to create a narrative around their actions on climate risk. The presence and detail involved in these disclosures are not unbiased indicators of a firm’s good management of climate risk, nor is it an indicator of their strong action on emissions. Disclosures from smaller firms do not typically contain a level of detail sufficient to provide insight to stakeholders or to researchers. As this analysis focused on the underlying trends and themes it is able to ignore the headline narrative and explore the subtextual patterns.

6. Conclusions

The supervised classification analysis revealed that acute physical risks are the foremost risk type that Australian firms are focusing on. Australian firms have not yet moved to assessing chronic physical risks or transitional risks to the same extent. The clustering analysis on the same dataset revealed key themes predominantly linked to the efforts required to manage acute physical climate events. The supervised classification also showed that Australian firms are choosing to manage climate risk with strategies that focus on reducing risk. Risk reduction management strategies require less change than risk avoidance strategies, suggesting that Australian firms see climate risks as insufficient for requiring an immediate revolution in the way they conduct business.
This is the first study to evaluate content across all CRD-reporting frameworks. This work has shown that only a small proportion of Australian companies are choosing to disclose their efforts to assess and manage the climate risks that they are exposed to. Of the companies disclosing, only around half are choosing to do so against the core elements of the international industry standard TCFD-reporting framework. The remaining companies disclose using a variety of frameworks whose origins are typically in environmental sustainability or financial reporting. Diverse reporting approaches have contributed to the variability in the extent and quality of Australian climate risk reporting. Accessing climate-risk disclosures in Australia often requires an extensive process that discourages casual scrutiny.
Further research on CRDs using both machine learning tools and manual analysis is recommended. This analysis capitalises on the ability of machine learning tools to evaluate large textual data resources such as CRDs and thereby identify underlying themes and patterns. Future research should focus on unsupervised analyses of entire climate risk reports. These analyses should be performed using a temporal lens by analysing trends in climate risk themes over time to evaluate how climate risk practice and discourse evolves. An element of climate risk reporting that was not explored by this analysis, but that is worthy of further research, is an evaluation of the metrics and targets Australian companies are using to describe their achievements towards climate goals. An evaluation of the qualitative data disclosed in climate-risk reporting over time has the potential to identify how and to what extent Australian firms are achieving their climate-related goals. Research comparing the key climate-risk themes and practices in Australia to the key themes and practices in other countries would demonstrate how Australia’s CRDs compare internationally.
CRD has been established and promoted globally to serve two primary functions: to improve how companies manage their material climate risks, and to allow investors the information to identify and move money away from highly exposed companies. The extent and quality of the CRDs in Australia identified by this research indicates that these functions are being unfulfilled and will continue to do so in the absence of a uniform and regulated approach to climate risk assessment and disclosure.

Author Contributions

C.H. Conceptualisation, formal analysis, investigation, methodology, resources, visualization, writing—original draft, writing—review and editing; M.H. Conceptualisation, methodology, resources, supervision, writing—review and editing; P.L. conceptualization, resources, supervision, writing—review and editing; N.R. Data curation, formal analysis, methodology, resources, software, validation, visualization, writing—review and editing; P.D. Conceptualisation, project administration, supervision, writing—review and editing. All authors have read and agreed to the published version of the manuscript.

Funding

This research received no external funding.

Data Availability Statement

Data available on request to the corresponding author.

Conflicts of Interest

The authors declare no conflict of interest.

References

  1. IPCC. Summary for Policymakers. In Climate Change 2021: The Physical Science Basis. Contribution of Working Group I to the Sixth Assessment Report of the Intergovernmental Panel on Climate Change; Masson-Delmotte, V., Zhai, P., Pirani, A., Connors, S.L., Péan, C., Berger, S., Caud, N., Chen, Y., Goldfarb, L., Gomis, M.I., et al., Eds.; IPCC: Geneva, Switzerland; Cambridge University Press: Cambridge, UK, 2021. [Google Scholar]
  2. IPCC. Global Warming of 1.5 °C. An IPCC Special Report on the Impacts of Global Warming of 1.5 °C above Pre-Industrial Levels and Related Global Greenhouse Gas Emission Pathways. In The Context of Strengthening the Global Response to the Threat of Climate Change, Sustainable Development, and Efforts to Eradicate Poverty; Masson-Delmotte, V., Zhai, P., Pörtner, H.-O., Roberts, D., Skea, J., Shukla, P.R., Pirani, A., Moufouma-Okia, W., Péan, C., Pidcock, R., et al., Eds.; IPCC: Geneva, Switzerland, 2018. [Google Scholar]
  3. Pearson, P.J.G.; Foxon, T.J. A low carbon industrial revolution? Insights and challenges from past technological and economic transformations. Energy Policy 2012, 50, 117–127. [Google Scholar]
  4. Chipalkatti, N.; Le, Q.V.; Rishi, M. Sustainability and society: Do environmental, social, and governance factors matter for foreign direct investment? Energies 2021, 14, 6039. [Google Scholar] [CrossRef]
  5. Caldwell, Z. Corporations and climate change: An investigation of mandatory climate risk disclosure in australia. Environ. Plan. Law J. 2020, 37, 3–17. [Google Scholar]
  6. Sanderson, H.; Irato, D.M.; Cereto, N.P.; Duel, H.; Faria, P.; Torres, E.F. How do climate risks affect corporations and how could they address these risks? SN Appl. Sci. 2019, 1, 1720. [Google Scholar] [CrossRef]
  7. TCFD. Final Report: Recommendations of the Task Force on Climate-Related Financial Disclosures; Task Force on Climate-related Financial Disclosures. 2017. Available online: https://assets.bbhub.io/company/sites/60/2020/10/FINAL-2017-TCFD-Report-11052018.pdf (accessed on 8 July 2022).
  8. APRA. Prudential Practice Guide: Draft CPG 229 Climate Change Financial Risks; Australian Prudential Regulation Authority: Sydney, Australia, 2021.
  9. Council of Financial Regulators. Council of Financial Regulators Climate Change Activity Stocktake 2021. [cited 18th September 2021]. 2021. Available online: https://www.cfr.gov.au/publications/policy-statements-and-other-reports/2021/council-of-financial-regulators-climate-change-activity-stocktake-2021/ (accessed on 18 September 2021).
  10. Colombo, E. From bushfires to misfires: Climate-related financial risk after Mcveigh v. Retail Employees Superannuation Trust. Transnatl. Environ. Law 2021, 11, 173–199. [Google Scholar] [CrossRef]
  11. Harrington, L.J.; Otto, F.E.L. Attributable damage liability in a non-linear climate. Clim. Change 2019, 153, 15–20. [Google Scholar] [CrossRef]
  12. Burke, M.; Hsiang, S.M.; Miguel, E.J.N. Global non-linear effect of temperature on economic production. Nature 2015, 527, 235–239. [Google Scholar] [CrossRef] [PubMed]
  13. Dietz, S.; Bowen, A.; Dixon, C.; Gradwell, P. Climate value at risk’ of global financial assets. Nat. Clim. Change 2016, 6, 676–679. [Google Scholar] [CrossRef]
  14. Clarke, T. The search for sustainability in financial markets: Carbon bubbles, shifting tectonic paradigms, and natural capital coalitions. Law Financ. Mark. Rev. 2016, 10, 139–149. [Google Scholar] [CrossRef]
  15. Strauch, Y.; Dordi, T.; Carter, A. Constraining fossil fuels based on 2 °C carbon budgets: The rapid adoption of a transformative concept in politics and finance. Clim. Change 2020, 160, 181–201. [Google Scholar] [CrossRef]
  16. Chenet, H. Climate Change and Financial Risk. In Financial Risk Management and Modeling; Zopounidis, C., Benkraiem, R., Kalaitzoglou, I., Eds.; Springer International Publishing: Cham, Switzerland, 2021; pp. 393–419. [Google Scholar]
  17. Fakhruddin, B.S.H.M.; Boyland, K.; Wild, A.; Robertson, R. Assessing vulnerability and risk of climate change. In Climate Extremes and Their Implications for Impact and Risk Assessment; Elsevier: Amsterdam, The Netherlands, 2019; pp. 217–241. [Google Scholar]
  18. IPCC. Managing the Risks of Extreme Events and Disasters to Advance Climate Change Adaptation. In Special Report of Working Groups I and II of the Intergovernmental Panel on Climate Change; Field, C.B., Barros, V., Stocker, T.F., Qin, D., Dokken, D.J., Ebi, K.L., Mastrandrea, M.D., Mach, K.J., Plattner, G.-K., Allen, S.K., et al., Eds.; Cambridge University Press: Cambridge, UK; New York, NY, USA, 2012; p. 582. [Google Scholar]
  19. Foerster, A.; Peel, J.; Osofsky, H.M.; McDonnell, B. Keeping good company in the transition to a low carbon economy? An evaluation of climate risk disclosure practices in Australia. Corp. Secur. Law J. 2017, 1, 3018241. [Google Scholar]
  20. Demaria, S.; Rigot, S. Corporate environmental reporting: Are French firms compliant with the Task Force on Climate Financial Disclosures’ recommendations? Bus. Strateg. Environ. 2021, 30, 721–738. [Google Scholar] [CrossRef]
  21. Evain, J.; Cardona, M.; Nicol, M. Article 173: Overview of Climate-Related Financial Disclosure after Two Years of Implementation Climate Brief No. 59; I4CE: Paris, France, 2018; p. 8. [Google Scholar]
  22. Carney, M. (Lloyd’s of London, London, UK); Breaking the Tragedy of the Horizon—Climate Change and Financial Stability. Speech by Mr Mark Carney, Governor of the Bank of England and Chairman of the Financial Stability Board; Bank of England: London, UK, 2015. [Google Scholar]
  23. De Grosbois, D.; Fennell, D.A. Determinants of climate change disclosure practices of global hotel companies: Application of institutional and stakeholder theories. Tour. Manag. 2021, 88, 104404. [Google Scholar] [CrossRef]
  24. Baker, M. Blue sky mine: Environmental risk disclosure in Australia. Environ. Plan. Law J. 2018, 35, 519–528. [Google Scholar]
  25. Christophers, B. Climate Change and Financial Instability: Risk Disclosure and the Problematics of Neoliberal Governance. Ann. Am. Assoc. Geogr. 2017, 107, 1108–1127. [Google Scholar] [CrossRef]
  26. Lee, S.-Y.; Park, Y.-S.; Klassen, R.D. Market Responses to Firms’ Voluntary Climate Change Information Disclosure and Carbon Communication. Corp. Soc. Responsib. Environ. Manag. 2015, 22, 1–12. [Google Scholar] [CrossRef]
  27. Wasim, R. Corporate (Non) Disclosure of Climate Change Information. Columbia Law Rev. 2019, 119, 1311–1354. [Google Scholar]
  28. Thomä, J.; Murray, C.; Jerosch-Herold, V.; Magdanz, J. Do you manage what you measure? Investor views on the question of climate actions with empirical results from the Swiss pension fund and insurance sector. J. Sustain. Financ. Invest. 2021, 11, 47–61. [Google Scholar] [CrossRef]
  29. Kouloukoui, D.; da Silva Gomes, S.M.; de Oliviera Marinho, M.M.; Torres, E.A.; Kiperstok, A.; de Jong, P. Disclosure of climate risk information by the world’s largest companies. Mitig. Adapt. Strateg. Glob. Change 2018, 23, 1251–1279. [Google Scholar] [CrossRef]
  30. Ameli, N.; Drummond, P.; Bisaro, A.; Grubb, M.; Chenet, H. Climate finance and disclosure for institutional investors: Why transparency is not enough. Clim. Change 2020, 160, 565–589. [Google Scholar] [CrossRef]
  31. Dahl, T.; Fløttum, K. Climate change as a corporate strategy issue: A discourse analysis of three climate reports from the energy sector. Corp. Commun. 2019, 24, 499–514. [Google Scholar] [CrossRef]
  32. Flammer, C.; Toffel, M.W.; Viswanathan, K. Shareholder activism and firms’ voluntary disclosure of climate change risks. Strateg. Manag. J. 2021, 42, 1850–1879. [Google Scholar] [CrossRef]
  33. Hirsch, P.B. There’s a change in the weather: Corporate reputation and climate change. J. Bus. Strateg. 2021, 42, 288–291. [Google Scholar] [CrossRef]
  34. Kouloukoui, D.; Sant’Anna, A.M.O.; da Silva Gomes, S.M.; de Oliveira Marinho, M.M.; de Jong, P.; Kiperstok, A.; Torres, E.A. Factors influencing the level of environmental disclosures in sustainability reports: Case of climate risk disclosure by Brazilian companies. Corp. Soc. Responsab. Environ. Manag. 2019, 26, 791–804. [Google Scholar] [CrossRef]
  35. O’Dwyer, B.; Unerman, J. Shifting the focus of sustainability accounting from impacts to risks and dependencies: Researching the transformative potential of TCFD reporting. Account. Audit. Account. 2020, 33, 1113–1141. [Google Scholar] [CrossRef]
  36. Schiemann, F.; Sakhel, A. Carbon Disclosure, Contextual Factors, and Information Asymmetry: The Case of Physical Risk Reporting. Eur. Account. Rev. 2019, 28, 791–818. [Google Scholar] [CrossRef]
  37. Chithambo, L.; Tingbani, I.; Agyapong, G.A.; Gyapong, E.; Damoah, I.S. Corporate voluntary greenhouse gas reporting: Stakeholder pressure and the mediating role of the chief executive officer. Bus. Strateg. Environ. 2020, 29, 1666–1683. [Google Scholar] [CrossRef]
  38. Achenbach, M. Transparency of Climate-Related Risks and Opportunities: Determinants Influencing the Disclosure in Line with the Task Force on Climate-Related Financial Disclosures. Glocality 2021, 4, 1. [Google Scholar]
  39. Parris, D.L.; Dapko, J.L.; Arnold, R.W.; Arnold, D. Exploring transparency: A new framework for responsible business management. Manag. Decis. 2016, 54, 222–247. [Google Scholar] [CrossRef]
  40. Harrast, S.; Olsen, L. Climate Change Disclosures Are Getting Hotter. J. Corp. Account. Financ. 2016, 27, 21–28. [Google Scholar] [CrossRef]
  41. Amran, A.; Periasamy, V.; Zulkafli, A.H. Determinants of Climate Change Disclosure by Developed and Emerging Countries in Asia Pacific. Sust. Dev. 2014, 22, 188–204. [Google Scholar] [CrossRef]
  42. Siew, R.Y.J. Climate-related financial disclosure and the property and construction sector. In Proceedings of the Institution of Civil Engineers-Engineering Sustainability; Thomas Telford Ltd.: London, UK, 2020; Volume 174, pp. 3–8. [Google Scholar]
  43. Efimova, O.; Rozhnova, O.; Zvyagintseva, E. Creation of a System for Climate-Related Risks Disclosures in Companies’ Reporting. In Lecture Notes in Networks and Systems; Springer: Berlin/Heidelberg, Germany, 2021; pp. 201–211. [Google Scholar]
  44. Sakhel, A. Corporate climate risk management: Are European companies prepared? J. Clean. Prod. 2017, 165, 103–118. [Google Scholar] [CrossRef]
  45. Haque, S.; Irvine, H. The climate change-related disclosures and accountability practices of NGOs: Evidence from Australia. Financ. Account. Manag. 2018, 34, 45–63. [Google Scholar] [CrossRef]
  46. Demertzidis, N.; Tsalis, T.A.; Loupa, G.; Nikolaou, I.E. A benchmarking framework to evaluate business climate change risks: A practical tool suitable for investors decision-making process. Clim. Risk Manag. 2015, 10, 95–105. [Google Scholar] [CrossRef]
  47. Busch, T.; Berger, S.G.; Paquin, R. Managing for Climate Risk. In Environmental Leadership: A Reference Handbook; Gallagher, D.R., Ed.; SAGE Publications, Inc.: Thousand Oaks, CA, USA, 2012; Chapter 56. [Google Scholar]
  48. Rybak, N.; Hassall, M. Deep Learning Unsupervised Text-Based Detection of Anomalies in US Chemical Safety and Hazard Investigation Board Reports. In Proceedings of the International Conference on Electrical, Computer, Communications and Mechatronics Engineering (ICECCME), Moka, Mauritius, 7–8 October 2021. [Google Scholar]
  49. Abraham, A.; Dutta, P.; Mandal, J.K.; Bhattacharya, A.; Dutta, S. Emerging Technologies in Data Mining and Information Security; Springer: Singapore, 2018; pp. 495–505. [Google Scholar]
  50. Hapke, H.; Howard, C.; Lane, H. Natural Language Processing in Action: Understanding, Analyzing, and Generating Text with Python; Simon and Schuster: New York, NY, USA, 2019. [Google Scholar]
  51. Szymański, J. Comparative analysis of text representation methods using classification. Cybern. Syst. 2014, 45, 180–199. [Google Scholar] [CrossRef]
  52. Krishnan, S.; Aydin, N.Y.; Comes, T. Planning Support Systems for Long-Term Climate Resilience: A Critical Review. In Urban Book Series; Springer: Berlin/Heidelberg, Germany, 2021; pp. 465–498. [Google Scholar]
  53. Žižka, J.; Dařena, F.; Svoboda, A. Text Mining with Machine Learning: Principles and Techniques; CRC Press: Boca Raton, FL, USA, 2019. [Google Scholar]
  54. Yildiz, B.; Tezgider, M. Improving word embedding quality with innovative automated approaches to hyperparameters. Concurr. Comput. Pract. Exp. 2021, 33, e6091. [Google Scholar] [CrossRef]
  55. Rybak, N.; Hassall, M. Machine Learning Enhanced Decision-Making. In Handbook of Smart Materials, Technologies, and Devices: Applications of Industry 4.0; Hussain, C.M., Di Sia, P., Eds.; Springer International Publishing: Cham, Switzerland, 2020; pp. 1–41. [Google Scholar]
  56. Grimmer, J.; Roberts, M.E.; Stewart, B.M. Machine Learning for Social Science: An Agnostic Approach. Annu. Rev. Political Sci. 2021, 24, 395–419. [Google Scholar] [CrossRef]
  57. Allen, K.J.; Hope, P.; Lam, D.; Brown, J.R.; Wasson, R.J. Improving Australia’s flood record for planning purposes–can we do better? Aust. J. Water Resour. 2020, 24, 36–45. [Google Scholar] [CrossRef]
  58. Henley, B.J.; Peel, C.M.; Nathan, R.; King, A.D.; Ukkola, A.M.; Karoly, D.J.; Tan, K.S. Amplification of risks to water supply at 1.5 °C and 2 °C in drying climates: A case study for Melbourne, Australia. Environ. Res. Lett. 2019, 14, 084028. [Google Scholar] [CrossRef]
  59. Phillips, N.; Nogrady, B. The race to decipher how climate change influenced Australia’s record fires. Nature 2020, 577, 610–612. [Google Scholar] [CrossRef]
  60. Raupach, T.H.; Martius, O.; Allen, J.T.; Kunz, M.; Lasher-Trapp, S.; Mohr, S.; Rasmussen, K.L.; Trapp, R.J.; Zhang, Q. The effects of climate change on hailstorms. Nat. Rev. Earth Environ. 2021, 2, 213–226. [Google Scholar] [CrossRef]
  61. Kytomaa, H.K.; Boehm, P.; Osteraas, J.; Haddad, B.; Hacker, J.; Gilman, L.; Jampole, E.; Murphy, P.; Souri, S. An integrated method for quantifying and managing extreme weather risks and liabilities for industrial infrastructure and operations. Process Saf. Prog. 2019, 38, e12087. [Google Scholar] [CrossRef]
  62. Pfrommer, T.; Goeschl, T.; Proelss, A.; Carrier, M.; Lenhard, J.; Martin, H.; Niemeier, U.; Schmidt, H. Establishing causation in climate litigation: Admissibility and reliability. Clim. Change 2019, 152, 67–84. [Google Scholar] [CrossRef]
  63. Ganguly, G.; Setzer, J.; Heyvaert, V. If at First You Don’t Succeed: Suing Corporations for Climate Change. Oxf. J. Legal Stud. 2018, 38, 841–868. [Google Scholar] [CrossRef]
  64. MacDonald, C.; Sloman, P. Resource Extraction, Economic Growth, and the Climate Dilemma in Canada and Australia. Political Q. 2020, 91, 780–785. [Google Scholar] [CrossRef]
  65. Hindmarsh, R.; Alidoust, S. Rethinking Australian CSG transitions in participatory contexts of local social conflict, community engagement, and shifts towards cleaner energy. Energy Policy 2019, 132, 272–282. [Google Scholar] [CrossRef]
  66. Horne, J. Water security in Australia. In Water Resources Development and Management; Springer: Cham, Switzerland, 2018; pp. 21–52. [Google Scholar]
  67. Baranova, P. Transition to a low-carbon economy: On the cusp of emerging challenges and opportunities. In The Low Carbon Economy: Understanding and Supporting a Sustainable Transition; Springer: Cham, Switzerland, 2017; pp. 1–14. [Google Scholar]
  68. Kumarasiri, J. Stakeholder pressure on carbon emissions: Strategies and the use of management accounting. Aust. J. Environ. Manag. 2017, 24, 339–354. [Google Scholar] [CrossRef]
  69. Jiang, Y.; Luo, L.; Xu, J.; Shao, X. The value relevance of corporate voluntary carbon disclosure: Evidence from the United States and BRIC countries. J. Contemp. Account. Econ. 2021, 17, 100279. [Google Scholar] [CrossRef]
  70. Biesbroek, R.; Badloe, S.; Athanasiadis, I.N. Machine learning for research on climate change adaptation policy integration: An exploratory UK case study. Reg. Environ. Change 2020, 20, 85. [Google Scholar] [CrossRef]
  71. Koo, Y.; Lee, Y.; Kim, Y.G. The differentiated impact of emissions trading system based on company size. Clim. Policy 2019, 19, 923–936. [Google Scholar] [CrossRef]
  72. Kang, J.E.; Yoon, D.K.; Rhee, J. Factors contributing to business actions in response to climate change in Korea. J. Risk Res. 2017, 20, 385–403. [Google Scholar] [CrossRef]
  73. Bui, B.; de Villiers, C. Business strategies and management accounting in response to climate change risk exposure and regulatory uncertainty. Br. Account. Rev. 2017, 49, 4–24. [Google Scholar] [CrossRef]
  74. Luo, L.; Tang, Q. Corporate governance and carbon performance: Role of carbon strategy and awareness of climate risk. Account. Financ. 2021, 61, 2891–2934. [Google Scholar] [CrossRef]
  75. Hart, P. Energy is at the root of Australia’s political crisis: Building a resilient renewable grid. Dams Reserv. 2019, 29, 158–163. [Google Scholar] [CrossRef]
  76. Mojtahedi, M.; Newton, S.; Von Meding, J. Predicting the resilience of transport infrastructure to a natural disaster using Cox’s proportional hazards regression model. Nat. Hazards 2017, 85, 1119–1133. [Google Scholar] [CrossRef]
  77. Perkol-Finkel, S.; Sella, I.; Rella, A.; Musella, R.; Moriarty, D. Bringing concrete to life: Harnessing biological processes for building resilient ports and coastal infrastructure. In Proceedings of the Australasian Coasts and Ports 2019, Tasmania, Australia, 10–13 September 2019. [Google Scholar]
  78. McAneney, J.; Sandercock, B.; Crompton, R.; Mortlock, T.; Musulin, R.; Pielke, R., Jr.; Gissing, A. Normalised insurance losses from Australian natural disasters: 1966–2017. Environ. Hazards 2019, 18, 414–433. [Google Scholar] [CrossRef]
  79. Maraseni, T.; Reardon-Smith, K. Meeting national emissions reduction obligations: A case study of Australia. Energies 2019, 12, 428. [Google Scholar] [CrossRef]
  80. Sjafjell, B. Beyond climate risk: Integrating sustainability into the duties of the corporate board. Deakin Law Rev. 2018, 23, 41–61. [Google Scholar] [CrossRef]
  81. Tsalis, T.A.; Botsaropoulou, V.D.; Nikolaou, I.E. A methodology to evaluate the disclosure practices of organisations related to climate change risks: A case study of international airports. Int. J. Glob. Warm. 2018, 15, 257–276. [Google Scholar] [CrossRef]
Figure 1. Text processing workflow.
Sustainability 14 10000 g001
Figure 2. Data samples for climate risk types.
Sustainability 14 10000 g002
Figure 3. Data samples for climate risk response.
Sustainability 14 10000 g003
Figure 4. Model accuracy for climate risk response.
Sustainability 14 10000 g004
Figure 5. Model accuracy for climate risk type.
Sustainability 14 10000 g005
Table 1. Examples of climate-related risks; adapted from IPCC [18] and TCFD [7].
Physical RisksTransitional RisksLitigation Risks
Acute PhysicalChronic PhysicalMarketRegulatoryTechnologyReputationLiability
Dust storm
Hail
Extreme sea level
Ice melt/Permafrost melt
Ocean acidification
Ambiguity in market indicatorsIncreased emissions reporting obligationsReplacement of existing products and servicesChange in consumer preferencesExposure to litigation
Drought
Extreme wind
Tornadoes
Changes in precipitation patterns
Sustained temperature
rise
Changing customer behaviourMandates on and regulation of existing products and servicesInvestment in unproductive new technologiesStigmatisation of sectors
Flood
Landslide
Wildfire
Tropical cyclones
Extreme temperature
Water stress
Sea level rise
Higher cost of raw materialsPricing of GHG emissionsCosts of transition to lower emission technologies.Amplified stakeholder concern
Extreme precipitation Negative stakeholder feedback
Table 2. Australian climate risk disclosures.
ASX SectorCompanies > $100 m
Market Capitalisation
TCFDESGGRICDPFinancial ReportTotal Disclosures
(% Reporting)
Automobiles and Components9011002 (22)
Banks15420129 (60)
Capital Goods29301026 (21)
Commercial and Professional Services19420017 (37)
Consumer Durables and Apparel7000000 (0)
Consumer Services34200046 (18)
Diversified Financials506201716 (32)
Energy4415000621 (48)
Food Staples and Retailing4200013 (75)
Food Beverage and Tobacco2540001216 (64)
Healthcare Equipment and Services482000810 (21)
Household and Personal Products4200002 (50)
Insurance10400037 (70)
Materials203310011244 (22)
Media and Entertainment25000123 (12)
Not Applicable64000033 (5)
Pharmaceuticals, Biotech and Life Sciences34000022 (6)
Real Estate5711101922 (39)
Retailing38100113 (8)
Semiconductors and Semiconductor Equipment4000000 (0)
Software and Services64100023 (5)
Technology Hardware and Equipment10000000 (0)
Telecommunication Services14200002 (14)
Transportation14500016 (43)
Utilities14500038 (57)
Total83910482681201 (24)
Table 3. Climate-risk response strategies; adaptation of Sakhel [44].
Risk Response Objective
IndicatorRisk ManagementRisk TransferRisk Avoidance
1.MonitoringTrading/bankingDivestment
2.ReportingHedgingInvestment (carbon-free)
3.DialogueOffsettingEnergy mix (carbon-free)
4.InfluencingOutsourcingRelocation
5.SponsoringInsurance
6.Membership
7.Investment (low carbon)
8.Planning
9.Strategy
10.Diversification
11.Reduction target
12.Supply chain
13.Energy mix (low carbon)
Table 4. Support vector machine classification results for risk types and risk response.
Risk TypeRisk Response
Physical RisksTransition RisksLitigation Risks
SectorAcute Physical Risk (%)Chronic Physical Risk (%)Regulatory Risk (%)Technology Risk (%)Market Risk (%)Reputation Risk (%)Liability Risk (%)Risk Reduction (%)Risk Transfer (%)Risk Avoidance (%)
Automobiles and components0 (0)0 (0)0 (0)0 (0) 2 (100)0 (0)0 (0)0 (0)0 (0)0 (0)
Banks3 (43)0 (0)0 (0)0 (0)1 (14)3 (43)0 (0)8 (89)0 (0)1 (11)
Capital Goods2 (50)0 (0)2 (50)0 (0)0 (0)0 (0)0 (0)5 (100)0 (0)0 (0)
Commercial and Professional Services4 (66)0 (0)1 (17)0 (0)1 (17)0 (0)0 (0)4 (57)2 (29)1 (14)
Consumer Services2 (29) 0 (0)0 (0)0 (0)5 (71) 0 (0)0 (0)5 (83)0 (0)1 (17)
Diversified financials3 (43)1 (14)2 (29)0 (0)0 (0)1 (14)0 (0)13 (81)0 (0)3 (19)
Energy1 (5)2 (10)4 (20)4 (20)9 (45)0 (0)0 (0)18 (95)0 (0)1 (5)
Food and staples retailing2 (67)0 (0)1 (33)0 (0)0 (0)0 (0)0 (0)3 (100)0 (0)0 (0)
Food, beverages, and tobacco8 (53)3 (20)2 (13)0 (0)1 (7)1 (7)0 (0)15 (100)0 (0)0 (0)
Healthcare equipment and services 3 (50)1 (17)0 (0)0 (0)1 (17)0 (0)1 (17)6 (86)0 (0)1 (14)
Household and personal products1 (50)0 (0)0 (0)0 (0)1 (50)0 (0)0 (0)2 (100)0 (0)0 (0)
Insurance3 (60)1 (20)0 (0)0 (0)0 (0)1 (20)0 (0)7 (100)0 (0)0 (0)
Materials17 (46)4 (11)5 (14)1 (3)5 (14)5 (14)0 (0)42 (95)0 (0)2 (5)
Media and entertainment1 (33)0 (0)0 (0)0 (0)1 (33)1 (33)0 (0)2 (100)0 (0)0 (0)
Not applicable0 (0)0 (0)0 (0)0 (0)0 (0)1 (100)0 (0)3 (100)0 (0)0 (0)
Pharmaceuticals, biotech and life sciences0 (0)0 (0)0 (0)0 (0)1 (50)1 (50)0 (0)2 (100)0 (0)0 (0)
Real estate9 (53)0 (0)1 (6)0 (0)7 (41)0 (0)0 (0)21 (100)0 (0)0 (0)
Retailing2 (67)0 (0)0 (0)0 (0)0 (0)0 (0)1 (33)3 (100)0 (0)0 (0)
Software and services1 (100)0 (0)0 (0)0 (0)0 (0)0 (0)0 (0)3 (100)0 (0)0 (0)
Telecommunication 1 (50)0 (0)0 (0)0 (0)1 (50)0 (0)0 (0)2 (100)0 (0)0 (0)
Transportation1 (20)1 (20)2 (40)0 (0)1 (20)0 (0)0 (0)6 (100)0 (0)0 (0)
Utilities4 (57)0 (0)2 (29)1 (14)0 (0)00 (0)5 (71)0 (0)2 (29)
Total68 (42)13 (8)22 (13)6 (4)37 (23)14 (9)2 (1)175 (93)2 (1)12 (6)
Table 5. K-means unsupervised clustering of risk types and risk response datasets.
Risk TypeRisk Response
SectorWater, Related, Security (%)Environmental, Response, Security (%)Opportunities, Transition (%)Financial, Assessment, Assets (%)New Infrastructure, Building, Costs, Expenditure (%)Property, Insurance (%)Carbon, tax, Emissions, Trading (%)Emissions, Transition (%)Transition, Greenhouse Reduction (%)Investment, Risk, Impacts (%)
Automobiles and components1 (50)0 (0)0 (0)0 (0)1 (50) 0 (0)0 (0)0 (0)0 (0)0 (0)
Banks0 (0)1 (14)0 (0)0 (0)0 (0)5 (71)1 (14)2 (22)4 (44)3 (33)
Capital goods1 (25)0 (0)1 (25)1 (25)0 (0)0 (0)1 (25)1 (20)2 (40)2 (40)
Commercial and professional services0 (0)0 (0)0 (0)4 ((57)1 (14)0 (0)2 (29)3 (43)1 (14)3 (43)
Consumer services1 (14)1 (14)3 (43)1 (14)1 (14)0 (0)0 (0)1 (17)1 (17)4 (66)
Diversified financials0 (0)0 (0)4 (57)2 (29)0 (0)1 (14)0 (0)4 (27)3 (20)8 (53)
Energy0 (0)2 (10)2 (10)6 (30)4 (20)2 (10)4 (20)2 (11)5 (26)12 (63)
Food and staples retailing1 (33)0 (0)0 (0)2 (66)0 (0)0 (0)0 (0)3 (100)0 (0)0 (0)
Food, beverages, and tobacco3 (20)3 (20)3 (20)1 (7)1 (7)3 (20)1 (7)4 (27)5 (33)6 (40)
Healthcare equipment and services 2 (33)1 (17)1 (17)0 (0)1 (17)1 (17)0 (0)1 (14)1 (14)5 (71)
Household and personal products0 (0)0 (0)0 (0)2 (100)0 (0)0 (0)0 (0)1 (50)1 (50)0 (0)
Insurance0 (0)0 (0)1 (20)0 (0)0 (0)4 (80)0 (0)3 (43)0 (0)4 (57)
Materials12 (32)9 (24)4 (11)3 (8)6 (16)2 (5)1 (3)10 (23)11 (25)23 (55)
Media and entertainment0 (0)1 (33)1 (33)0 (0)0 (0)1 (33) 0 (0)0 (0)1 (50)1 (50)
Not applicable0 (0)0 (0)1 (100)0 (0)0 (0)0 (0)0 (0)0 (0)1 (33)2 (67)
Pharmaceuticals, biotech and life sciences1 (50)0 (0)1 (50)0 (0)0 (0)0 (0)0 (0)0 (0)2 (100)0 (0)
Real estate1 (6)0 (0)1 (6)9 (53)2 (12)4 (24)0 (0)6 (29)6 (29)9 (42)
Retailing0 (0)0 (0)1 (33)1 (33)0 (0)1 (33)0 (0)1 (33)2 (67)0 (0)
Software and services0 (0)0 (0)1 (100)0 (0)0 (0)0 (0)0 (0)0 (0)1 (33)2 (67)
Telecommunication0 (0)1 (50)1 (50)0 (0)0 (0)0 (0)0 (0)1 (50)0 (0)1 (50)
Transportation2 (40)0 (0)1 (20)1 (20)0 (0)0 (0)1 (20)3 (50)2 (33)1 (17)
Utilities1 (14)0 (0)1 (14)3 (43)0 (0)2 (29)0 (0)2 (29)2 (29)3 (42)
Total26(16)19 (12)28 (17)36 (22)17 (10)26 (16)11 (7)48 (26)51 (27)89 (47)
Publisher’s Note: MDPI stays neutral with regard to jurisdictional claims in published maps and institutional affiliations.

