1. Introduction
Online banking services are becoming more and more common, especially in Korea. The advantage of online banking is that it increases user convenience by simplifying transaction procedures. However, accessibility and simplicity have created an environment prone to fraudulent transactions. The financial loss of users has been increasing due to a variety of fraud techniques [
1,
2]. These techniques include illegal activities such as phishing (sending a fraudulent message to trick a person), smishing (phishing using social network services), and using fraudulent accounts. The victims knowingly or unknowingly transfer lots of money, usually resulting in huge financial losses.
A fraud detection system (FDS) for online banking services collects and analyzes transactions, trying to detect suspicious transactions and block them before execution. One of the widely used approaches is a rule-based model. A rule-based FDS has a set of detection rules generated by analyzing the actual accident cases and uses it to predict fraudulent transactions. Recently, more complex types of fraud using advanced techniques have made it difficult for FDSs to detect fraud with a rule-based approach [
3]. That is, more and more fraudulent transactions will pass through predefined rules as they seem normal.
Another problem with rule-based FDSs is the burden of detection rule writers. As a binary classification problem, false positives that judge normal transactions as frauds occur, while false negatives that judge fraudulent transactions as normal ones do, depending on the predefined detection rules or conditions. In both false cases, a new detection rule should be generated and registered to the FDS manually, and this process is repeated whenever the FDS fails to catch fraud. In addition, as the types of online banking have diversified, the number of rules to be prepared has relatively increased.
On the other hand, as the gender and age of users of online banking services have become very diverse, the types of fraud have also become more personalized, greatly increasing the need for personalized detection. In each user’s transaction log, a clue that can be used to detect fraud might be the fact that the transactions are quite different than usual. However, the conventional FDS takes a general view rather than a personalized one; its common rules may misjudge a particular user’s normal transaction as fraud and determine another user’s fraudulent transaction as normal.
In summary, there are two major problems with the existing FDS. The first problem is the difficulty of updating and managing its detection rules; newly introduced fraud types cannot be covered by existing rules, and rule generation becomes increasingly difficult. The other problem is that general rules do not guarantee the best detection performance on each user’s transaction logs.
In this study, we proposed a personalized alarm model that detects frauds using each user’s individual patterns, instead of applying general rules or conditions. We extracted frequent patterns in an individual’s online banking transaction log, which is a series of changing states, and defined them as normal patterns. Then, when new transactions are incoming, our model observes them in real time and gives an alert if they do not match the normal patterns. We tested the performance of the proposed model on actual online banking transaction data and showed that our method performed better than the rule-based model which is currently in use and the Markov chain model.
Our research contributions are as follows:
Solving the rule management problem of existing FDSs using sequential patterns extracted from normal transaction data;
High performance of our personalized detection model on each user’s actual transaction data.
The rest of this paper is organized as follows.
Section 2 presents some related works on fraud detection algorithms for FDSs, and
Section 3 describes our personalized pattern-based detection method in detail. We discuss the experimental results to verify the performance of our method in
Section 4. Finally,
Section 5 draws the conclusion of our study.
2. Related Works
2.1. Existing Works on the FDS
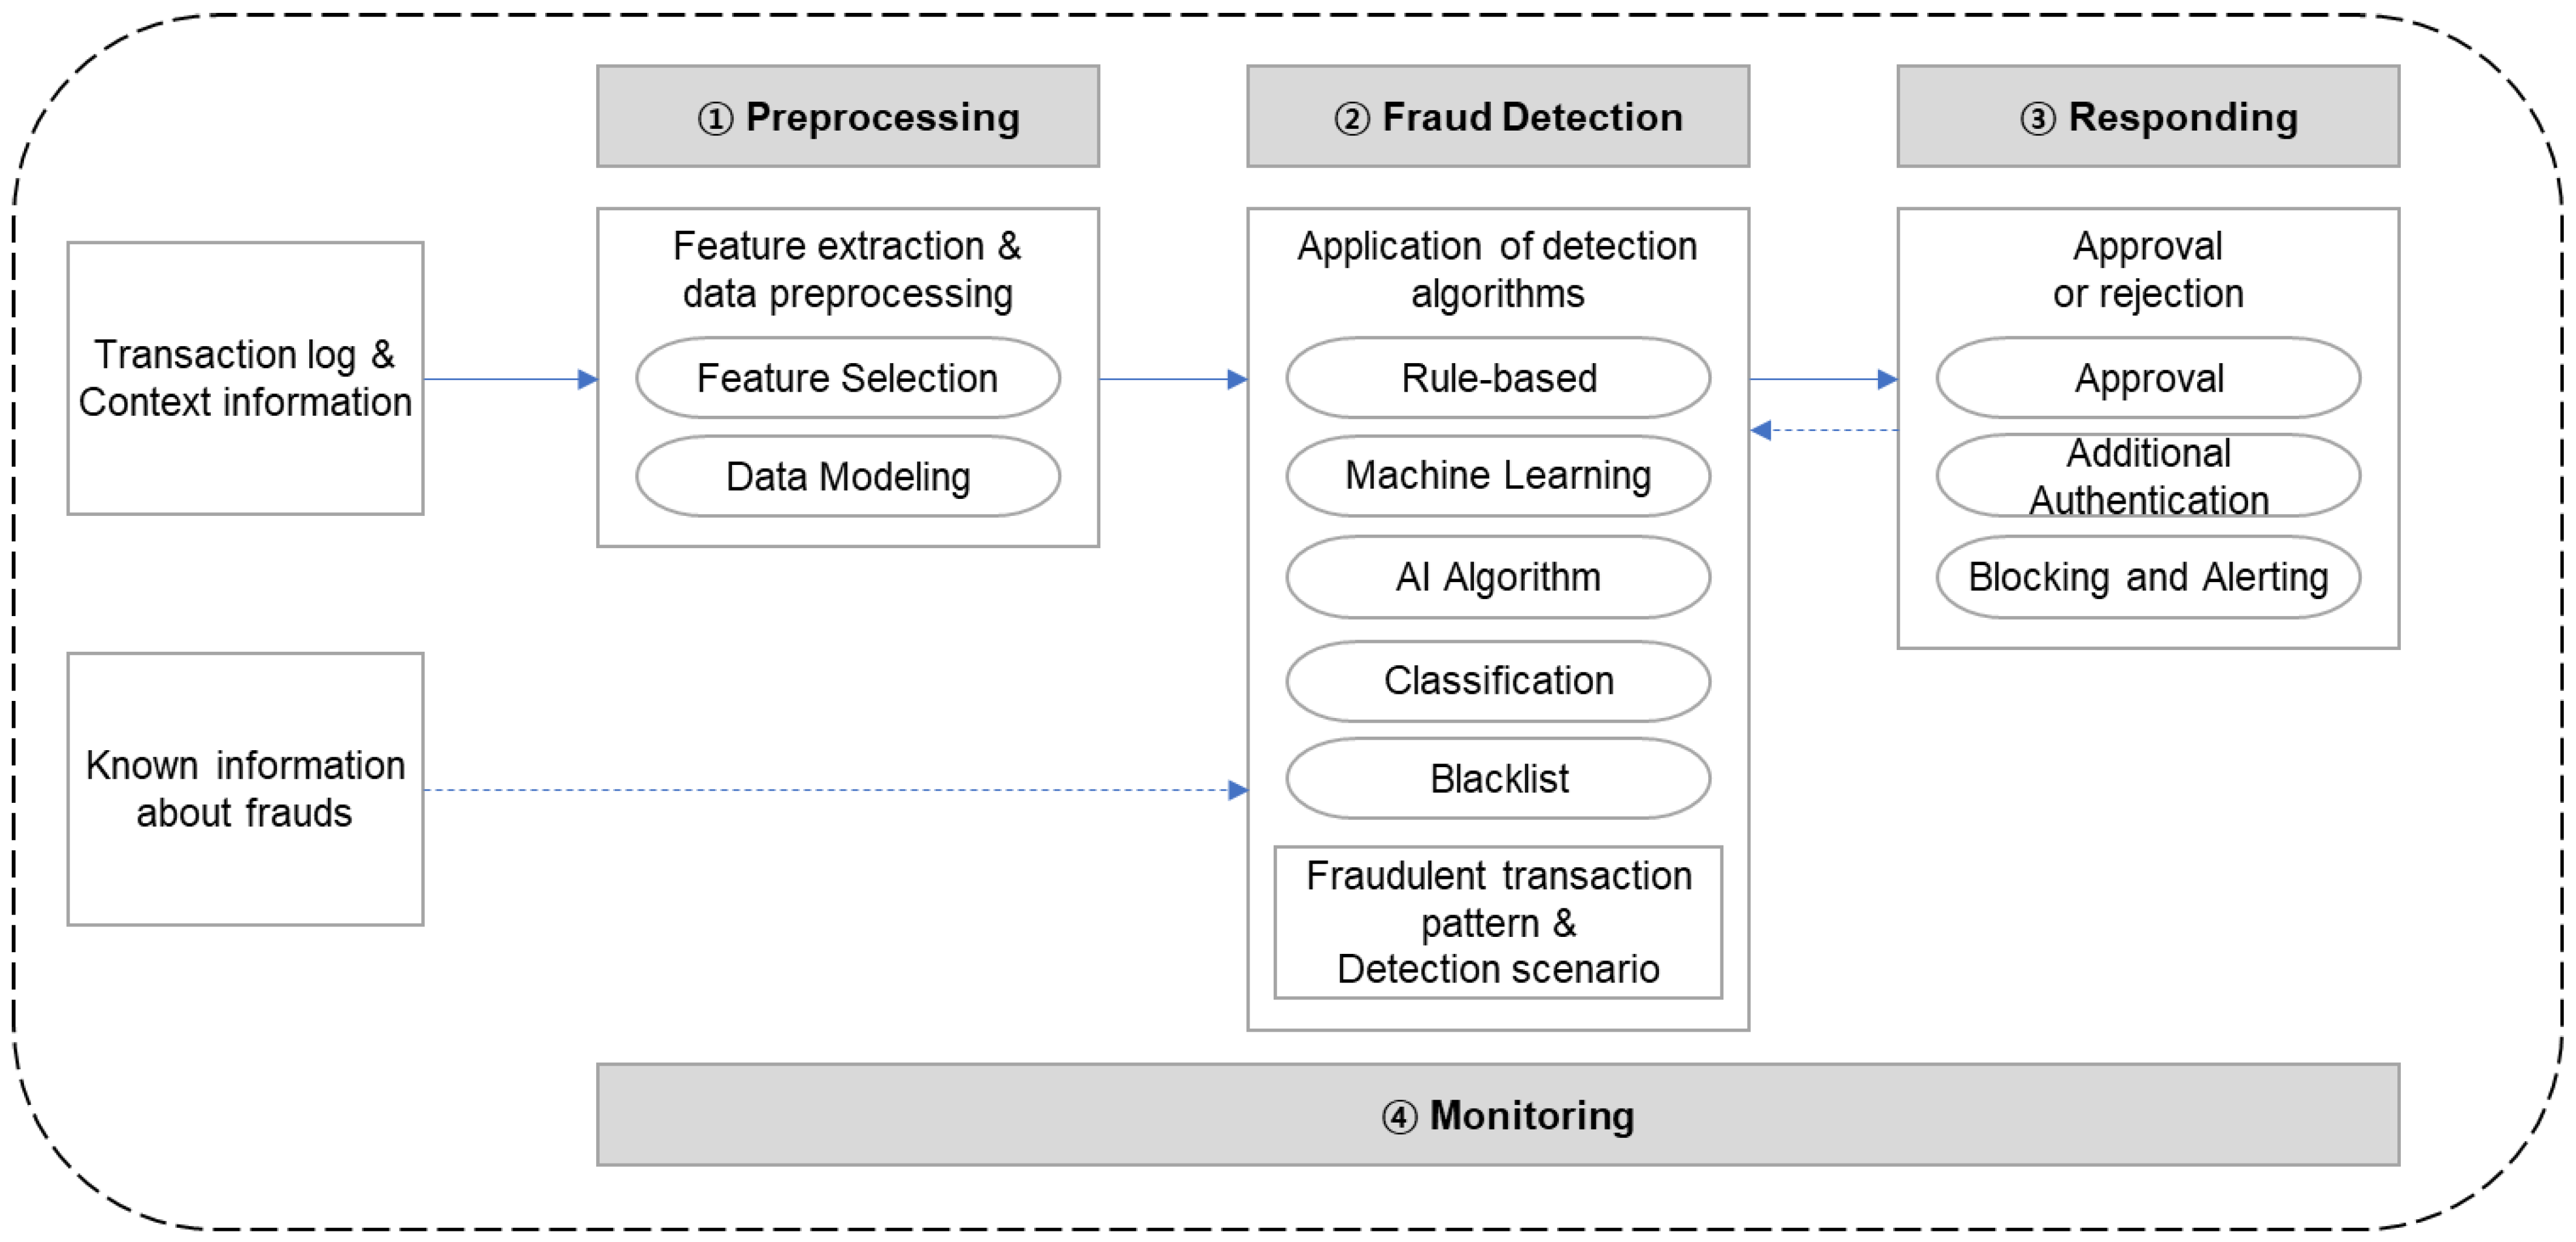
An FDS is a system that detects anomalies in financial transactions based on big data. The structure of the FDS may differ in composition method depending on financial regions such as banks and credit cards, but it is largely composed of four areas as shown in
Figure 1. It consists of data processing responsible for collecting and processing information, fraud detection processing for fraud detection through analysis, response to further authentication or blocking depending on detection results, and monitoring and auditing of the entire process. The data processing part profiles customer characteristic information secured by financial institutions through customer transaction information analysis, and rule-based misuse detection methods are widely used in the fraud detection processing part, but deep-learning-based abnormality detection or hybrid (abuse + abnormal) detection methods are being introduced.
Many existing systems are based on the method of registering rule-based scenarios for each type of fraud and detecting fraud based on the registered scenarios. However, it is considerably difficult to operate the system based on a blacklist (i.e., to perform advance detection based on fraud types). Therefore, through the analysis of historical records of fraudulent transactions, the transaction types were identified, and profiles of media information used for access and transaction information were extracted. Then, profiling groups were categorized into white (normal transaction customers) group, gray (customers with a high probability of fraud) group, and black (customers with a history of fraud) group. Based on the classification, detailed rules were set, which enabled the detection of fraudulent transactions that could not be previously detected based on a blacklist, with an application of state transition technology and deep learning (DL) techniques based on the autoencoder neural network [
4]. However, this method was limited by a low detection rate in situations where real-world data on fraudulent transactions are lacking.
In another study, real-world fraud cases and fraud cases detected by an FDS were comparatively analyzed, and a composition of user profiles and detection rules was presented to reduce false negatives and false positives during detection [
5]. In this method, attribute information, such as IP, MAC, and account number used in fraudulent transactions, was established as rules and was used to detect fraud. However, not all transactions using attribute information utilized in past fraudulent transactions were frauds. That is, research that analyses existing fraud cases uses a limited number of fraud cases as samples. Owing to the limited availability of data on fraudulent transactions, the method may lead to many cases of false positives, causing customer dissatisfaction and complaints.
Another method related to fraud detection in an FDS was to register customer segmentation and state transition rules based on profiling variables and use these rules for detection. That is, various types of information were modeled and used for detection, such as the following:
Whether the device used for the transaction matched the rule;
Information on the terminal that was used in previous transactions;
History of fraudulent transactions;
Type of media with the login history within the last 3 months (e.g., a type of terminal, including web, client program, or mobile applications);
Country of access;
IP used in previous access;
MAC information used in previous transactions.
The profiling model is used as reference data for determining fraud, and when a new transaction is entered, the fraud status is determined by comparing the values of the variables in the transaction and those of variables set in existing profiles. In a detection system with statistical technology, a method that compares the number of known activities that occurred in transaction logs of normal activities and that of activities generated in present transactions is available [
6]. There are also studies that utilize profiling data such as page travel time and page stay time and profiling of clickstream data [
7].
The characteristic of online financial transactions is that the order of achieving the desired transaction is different for each individual, and there are transactions that must occur in advance. However, the above methods are not analysis methods that include information on relationships between actions in order, which are characteristics of an individual’s financial transaction, and it is not possible to know how they are different from their usual actions. For example, suppose a user usually performs a withdrawal transaction after checking the balance without reissuing a public certificate. It is difficult to determine whether a transaction in which a public certificate is reissued and withdrawn to Bank B within 30 min after receiving a deposit from Bank A after frequent balance inquiries is the user’s usual pattern of transaction. It was difficult to find a study on the detection of fraudulent transactions reflecting these characteristics.
In addition, Quah and Sriganesh [
8] focused on real-time fraud detection and presented a method for filtering and analyzing customer transaction behavior for fraud detection. However, it is difficult to detect new fraud patterns because normal transactions and abnormal transactions are defined and detected in advance.
2.2. Existing Research on Fraud Detection Technology
As most financial institutions perform monitoring by applying detection rules for existing techniques of fraud, fraud methods that attempt to evade these rule-based detection systems have become increasingly sophisticated. Thus, there has been continuous research on fraud detection technology.
Fraud detection technologies include not only those based on statistical techniques and rule-based detection technologies, but there are also approaches that use frequent patterns wherein the characteristics of customer transactions are modeled and grouped through segmentation processes. When a transaction activity that deviates from the characteristics of the group is entered, it is detected as fraud based on the extent of deviation [
6]. Other studies on frequent patterns are based on activity pattern analysis with the application of artificial intelligence (AI), such as machine learning (ML) and data mining [
3,
9,
10,
11,
12,
13,
14].
Detection technology based on statistics can be categorized into data processing techniques under the environment of large databases [
15,
16] and techniques for calculation and comparison of various statistical parameters, such as hidden Markov alignment [
17]. Depending on the characteristics of the respective fields of applications, such as credit card, money laundering, computer intrusion detection, and medical and scientific fraud, different methodologies for statistical fraud detection may be proposed [
15].
A study by Bolton RJ, David [
6] suggested an unsupervised profile methodology that detects abnormal transactions by grouping fraud and non-fraud transactions through customer transaction (transaction) data and statistical methods for fraud detection. Furthermore, we present a methodology to investigate in detail the target accounts that exhibit the most different behaviors from the previous peer group summary behaviors through peer group analysis. However, although detection by peer group analysis can suggest that there is a possibility of fraud, there is a limit to the detection of fraud due to changes in individual behavior patterns.
Detection technologies using AI can be categorized into those that use data mining, pattern recognition, and ML. Among these, the data-mining-based detection technology is a technique of automatically classifying abnormal and normal transactions through data classification or clustering [
3,
18]. Major machine learning algorithms include random forest, support vector machine, hidden Markov model, deep learning, etc. Detection methodologies include pattern detection, misuse detection method through state transition analysis model, anomaly detection through supervised and unsupervised analysis models, etc. Fraud or non-fraud is tagged on the collected financial transaction information, and it is determined whether a newly entered transaction is fraudulent or non-fraudulent. However, there is not much information corresponding to fraud among the collected financial transactions, and it is difficult to make it with tagged information. Rule-based fraud detection technology falls under this and is operated by many financial institutions, and the false positive rate is very high, and therefore, it takes a lot of time and effort to deal with it [
19]. In the field of data-mining-based fraud detection, representative techniques investigated in previous studies include sequential patterns [
20,
21,
22], techniques using artificial neural networks, and techniques using Bayesian modeling.
Patel and Ouazane [
7] studied the framework using LSTM and RNN algorithms for detecting normal and malware sequences for sequential customer transactions in online banking. It is a study of sequential state transition. The limitation of this study is that there is no consideration for personalization. In other words, false positive errors still exist for customers with different behavioral patterns because the time of staying on the page and the sequence of page movement are not applied to each individual. Meanwhile, various DL and ML algorithms have been used for credit card fraud detection using neural networks [
3,
23]. Li Z et al. [
24] introduced a new loss function to obtain deep feature representations from credit card transactions. Liu G et al. [
25] proposed a method using a graph structure called transaction graph and graph neural network to train a detection model with various transaction features comprehensively.
The Markov chain model is a model used to predict the state transformation of sequential transactions. Srivastava and Kundu [
26] proposed the HMM (hidden Markov model) methodology to detect fraudulent transactions by profiling and analyzing the general patterns of the past transaction sequences of all cardholders to identify credit card fraud. Even if Markov chain models are widely used to represent transaction patterns of users, they do not work well when user behavior is varied [
27]. Therefore, in the online banking situation where the state change is not stable, the fraud detection performance is relatively poor.
According to a review article [
28], most research papers and journals on data mining related to bank fraud have investigated the use of classification and clustering methods, and only a few studies that used frequent patterns in financial transaction activities have been conducted.
In this paper, we present a methodology to detect fraudulent transactions with personalized transaction patterns by applying sequence pattern mining technology. Among the sequence pattern mining techniques, a comparative experiment was conducted by applying the Markov chain technique and the frequent pattern mining technique. The Markov chain technique is a model that probabilistically predicts the next action (=state), and the frequent pattern mining technique is a model that extracts sequential and frequent transaction patterns. The proposed method is a frequent-pattern-mining-based detection model, and it verifies the performance advantage compared to the Markov chain method.
3. Personalized Fraud Detection Model Based on Sequential Patterns
3.1. Characteristics of Online Banking Transactions and Data Modeling
There are two fundamental characteristics of online banking transactions. First, there is an order in transactions. All transactions occur sequentially, and some transactions must be performed before their next one. For example, in order to withdraw money through a website, the user must log in, check the balance, and go through the verification process.
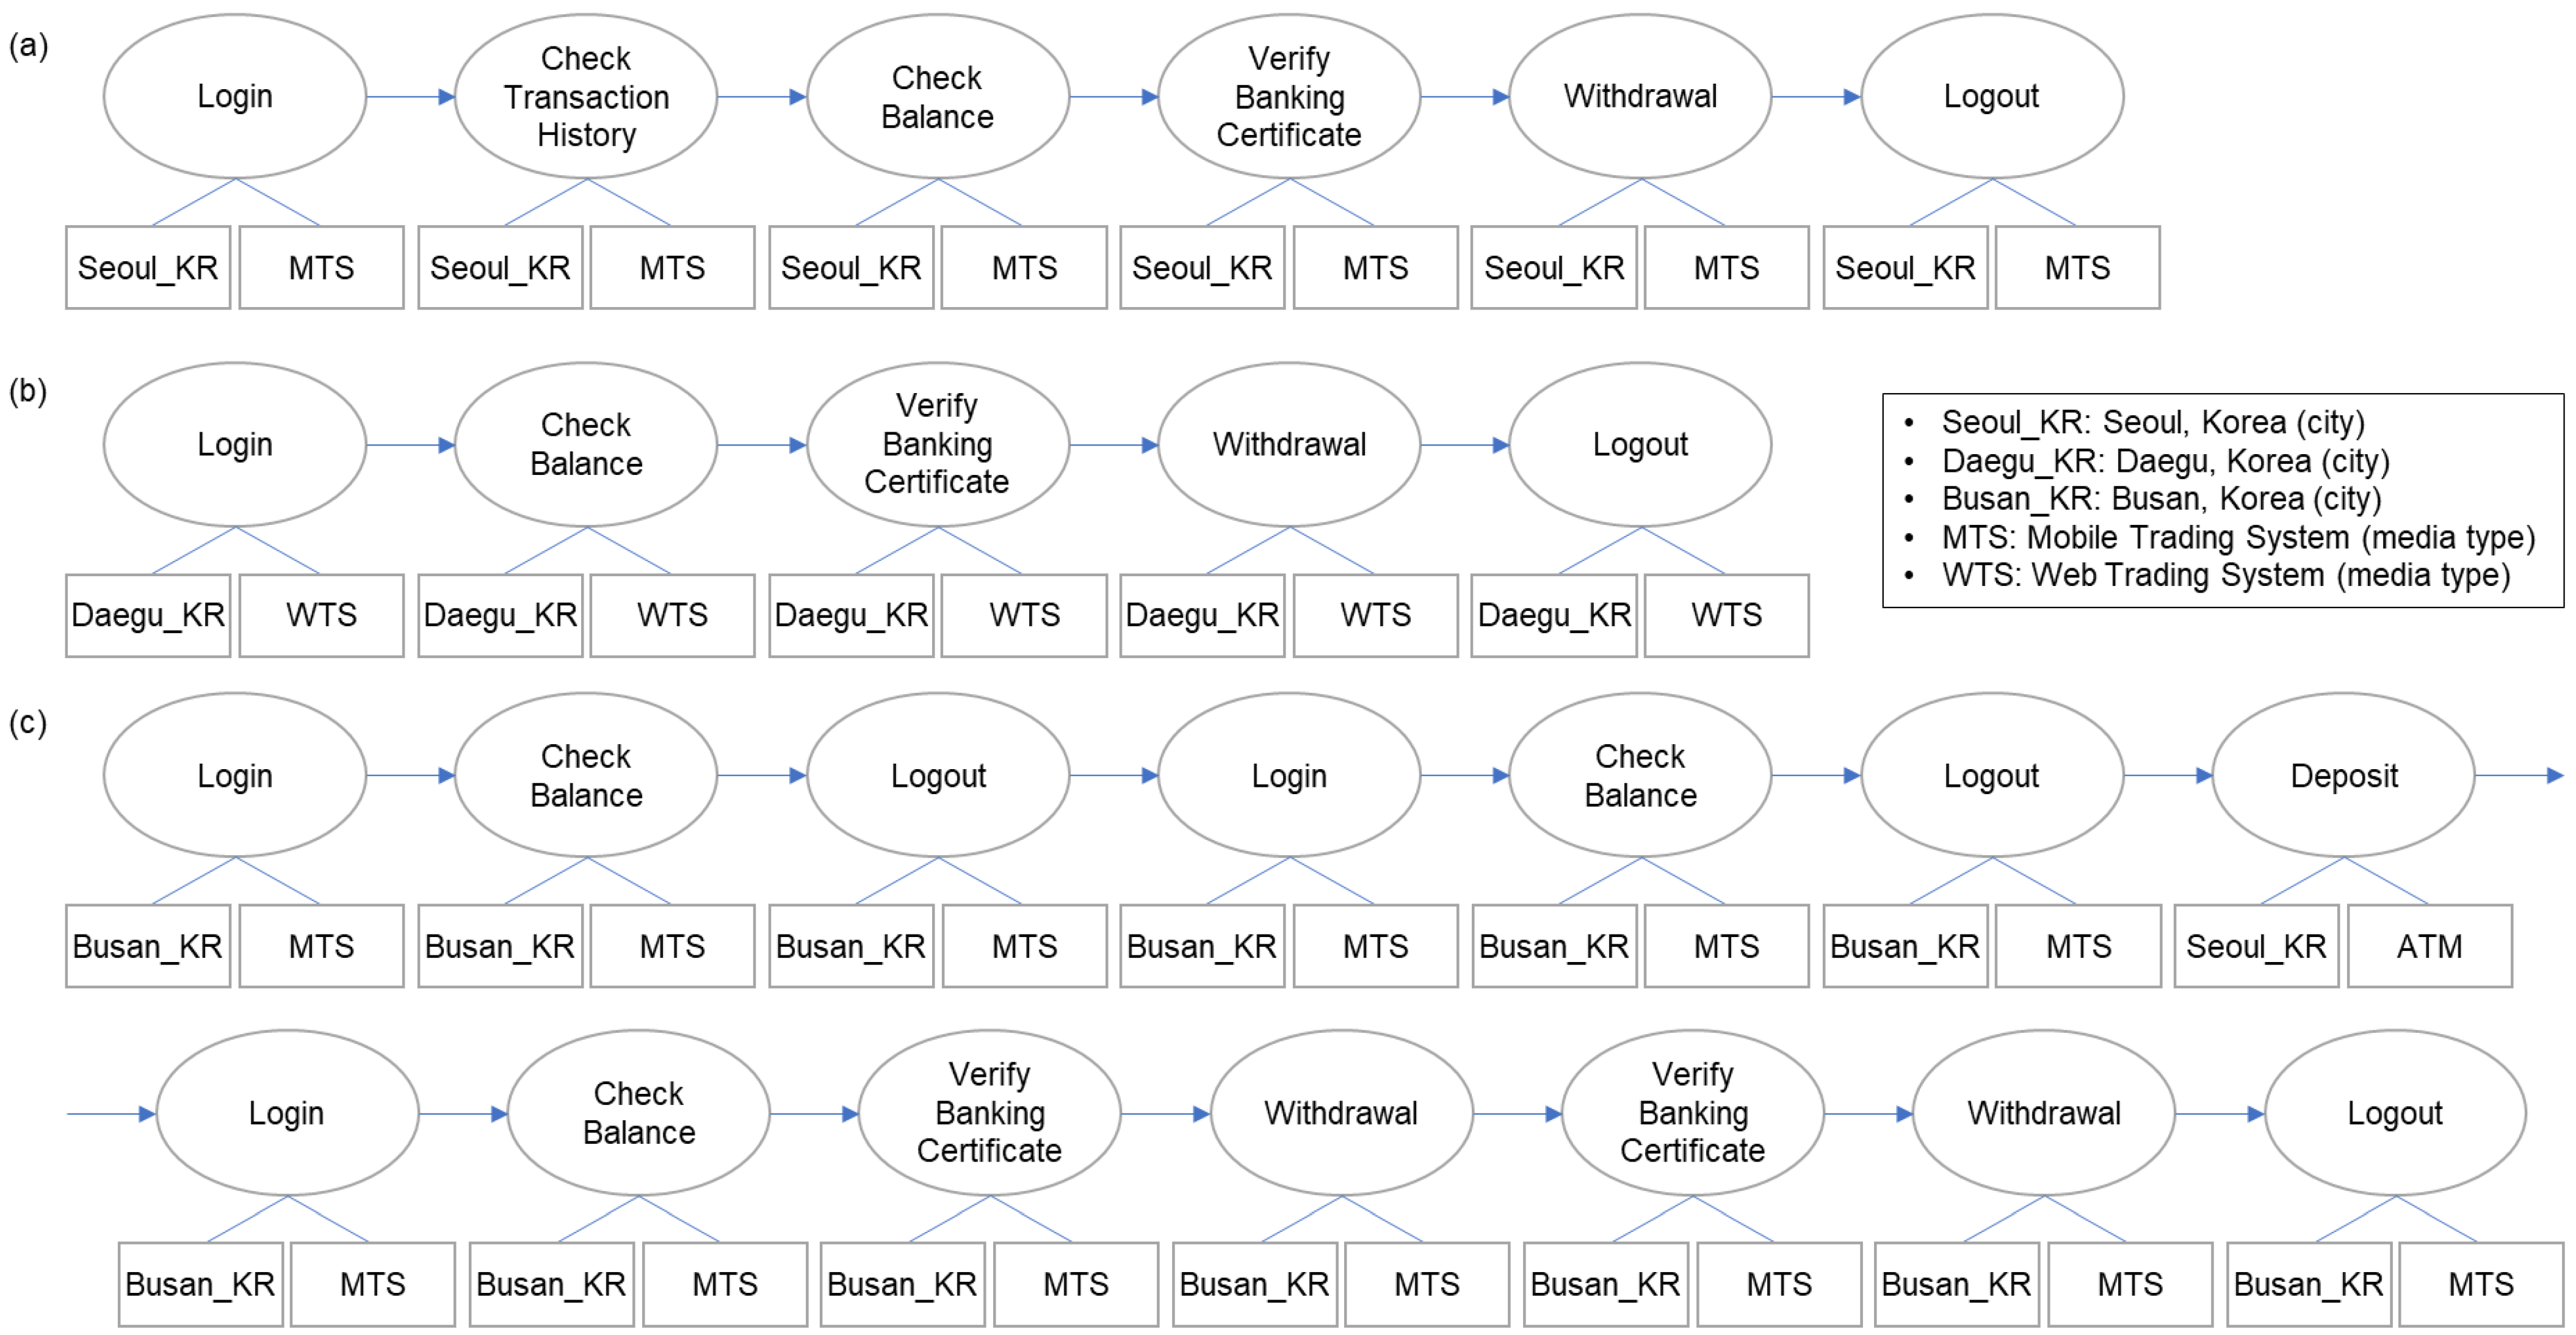
Second, different users have different ways of conducting online transactions. That is, each user’s activity has a different sequence, time, location of access, duration, medium, etc. An example is presented in
Figure 2. The ovals represent events or status, and the attributes of events are attached below. User A (
Figure 2a) uses a smartphone to check the balance and transaction details for withdrawal, whereas user B (
Figure 2b) accesses through the website, checks the balance, and just withdraws after verification.
In most cases of fraudulent transactions, the events before withdrawal are very different from the usual pattern.
Figure 2c shows an actual fraud example of user A. The access was from an IP that had never been used before, and the sequence of events (login–check balance–logout) repeated. Then, a large amount of money came in, and withdrawals occurred several times. Assuming that the pattern in
Figure 2a is a typical pattern of user A, we can expect the sequence in
Figure 2c to be abnormal.
Now, we define an event, transaction, and user log as follows:
A unit activity of a user that can be recognized by the system. It can be represented as a set of attribute values. An event
can be defined as follows:
where
is the set of all possible values of the attribute
and n is the number of attributes that need to be considered.
The main attributes of an event used here include activity type (), user IP (), and media type (). The activity type refers to the code of a log event, such as login, certificate verification, check balance, logout, etc.
Definition 2. Transaction.
A transaction is a sequence of events from login to logout.
The size of transaction is equal to the number of events that make up the transaction sequence.
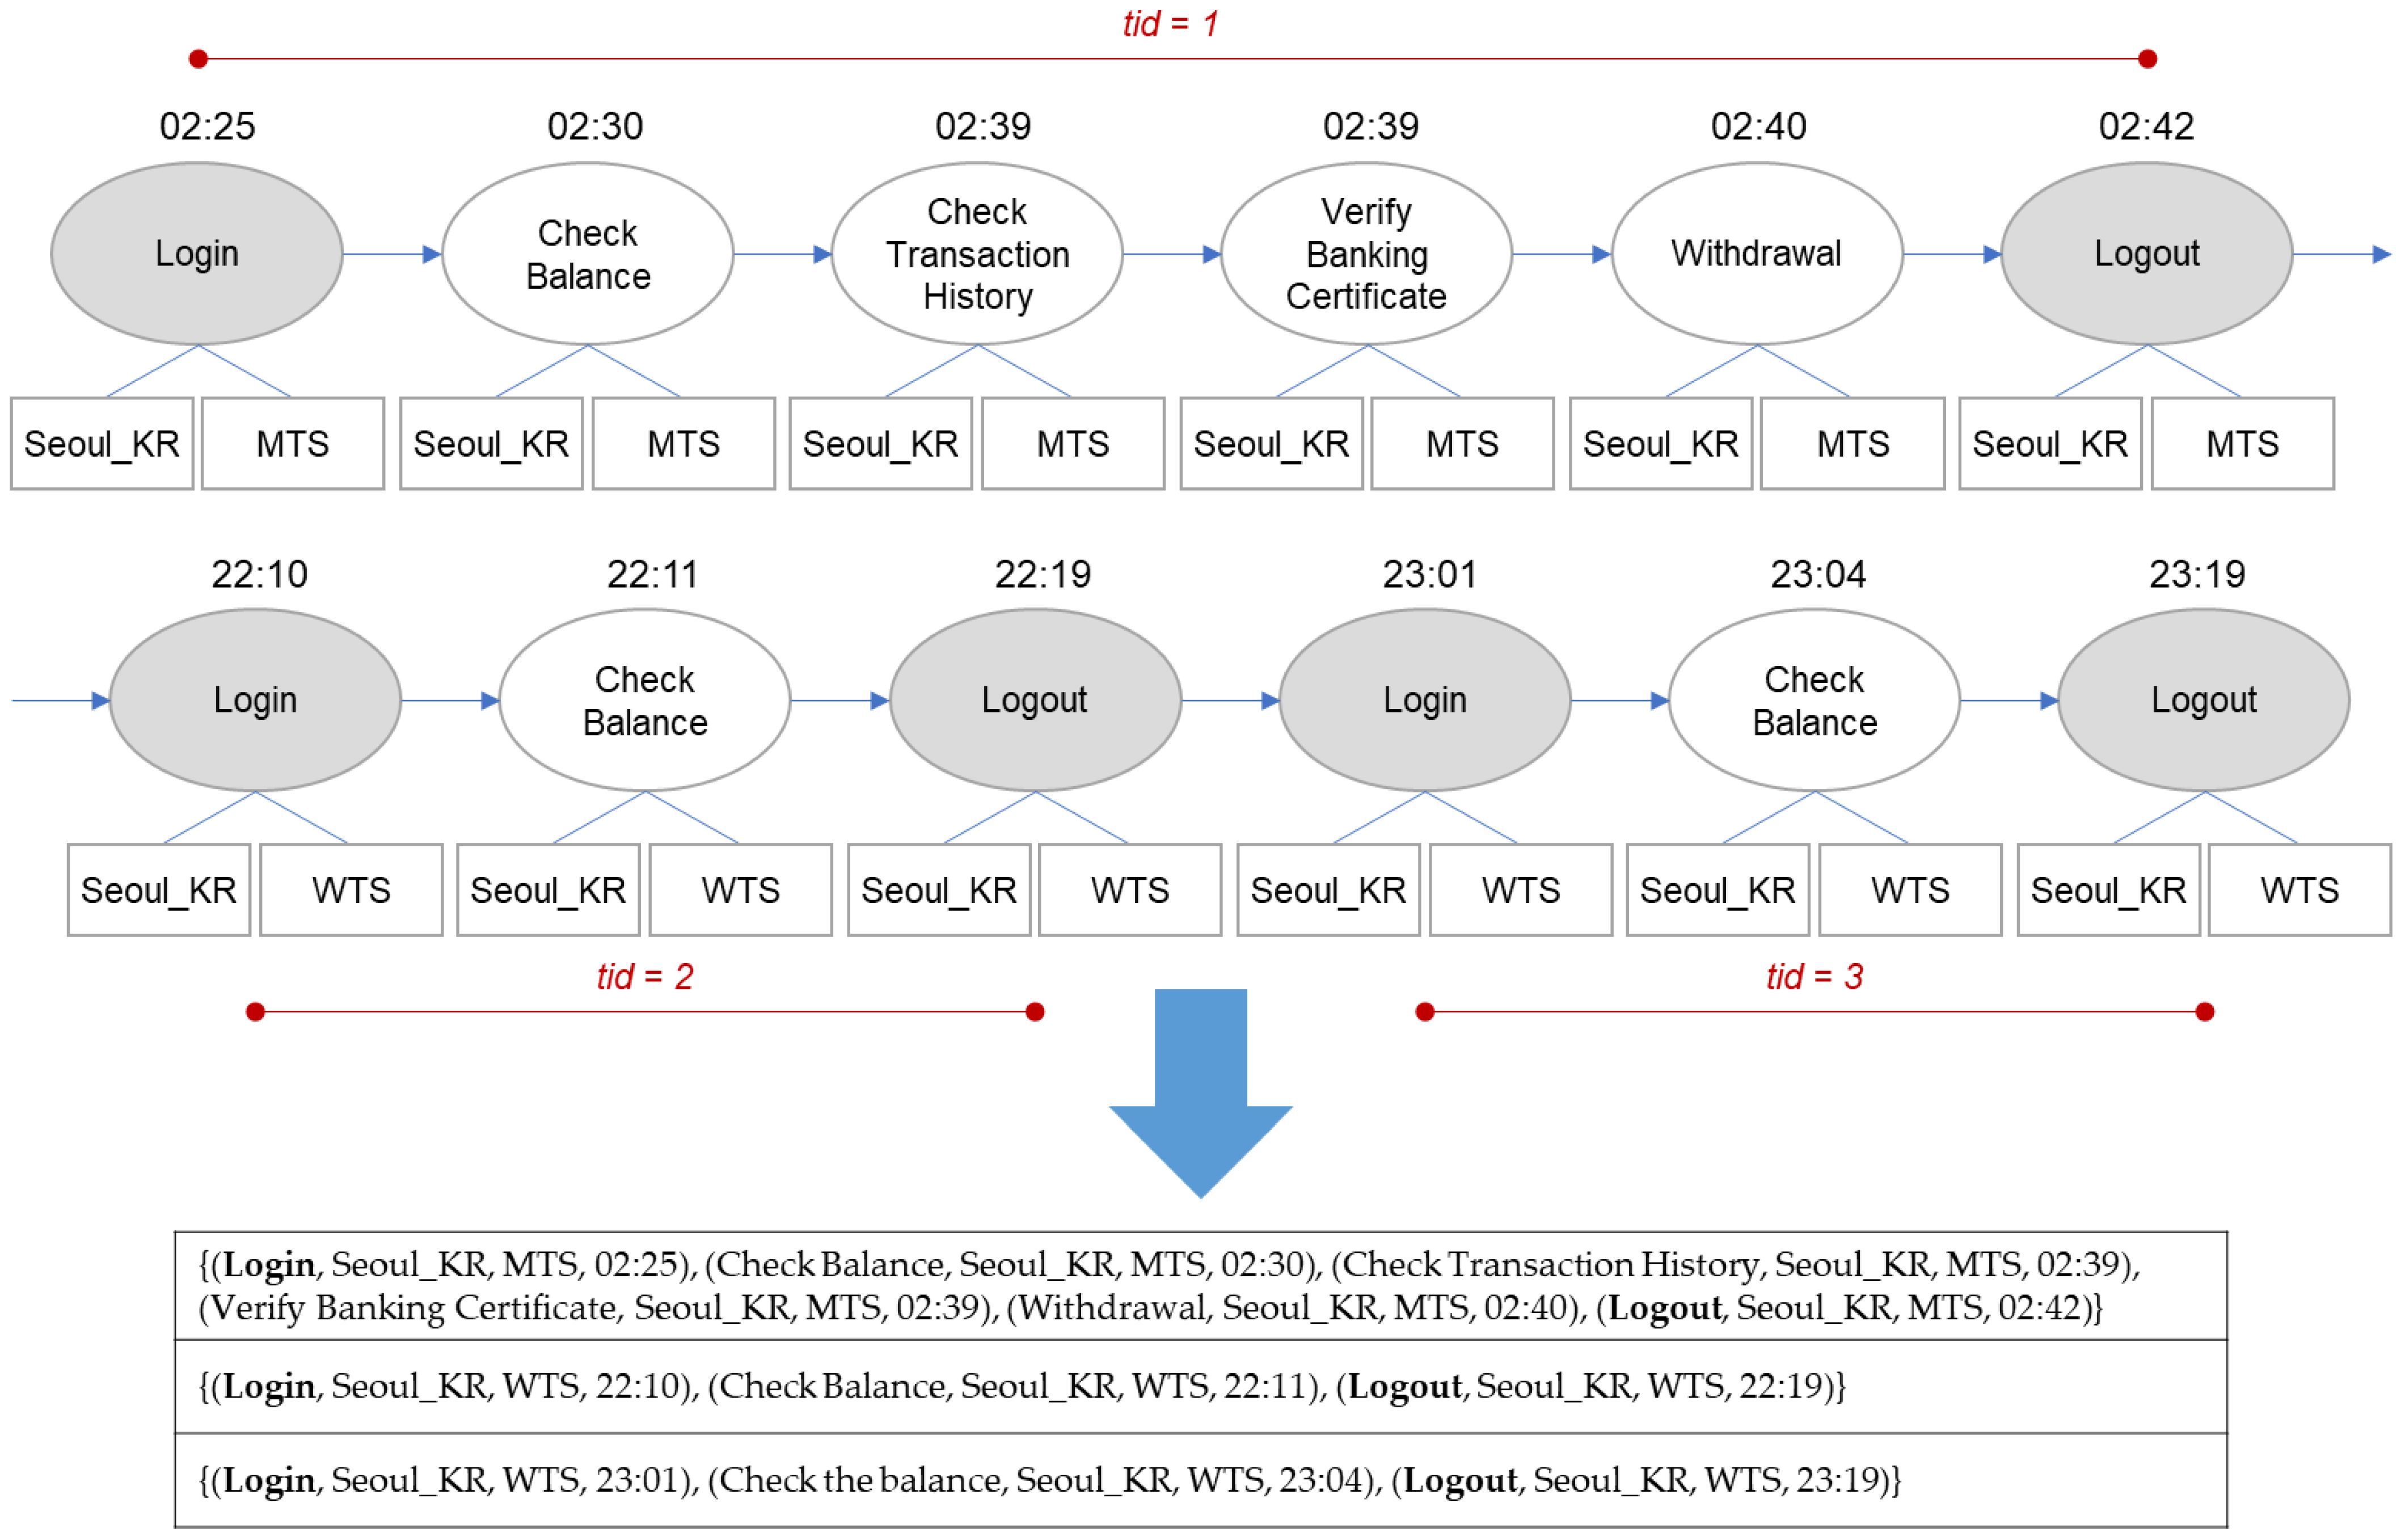
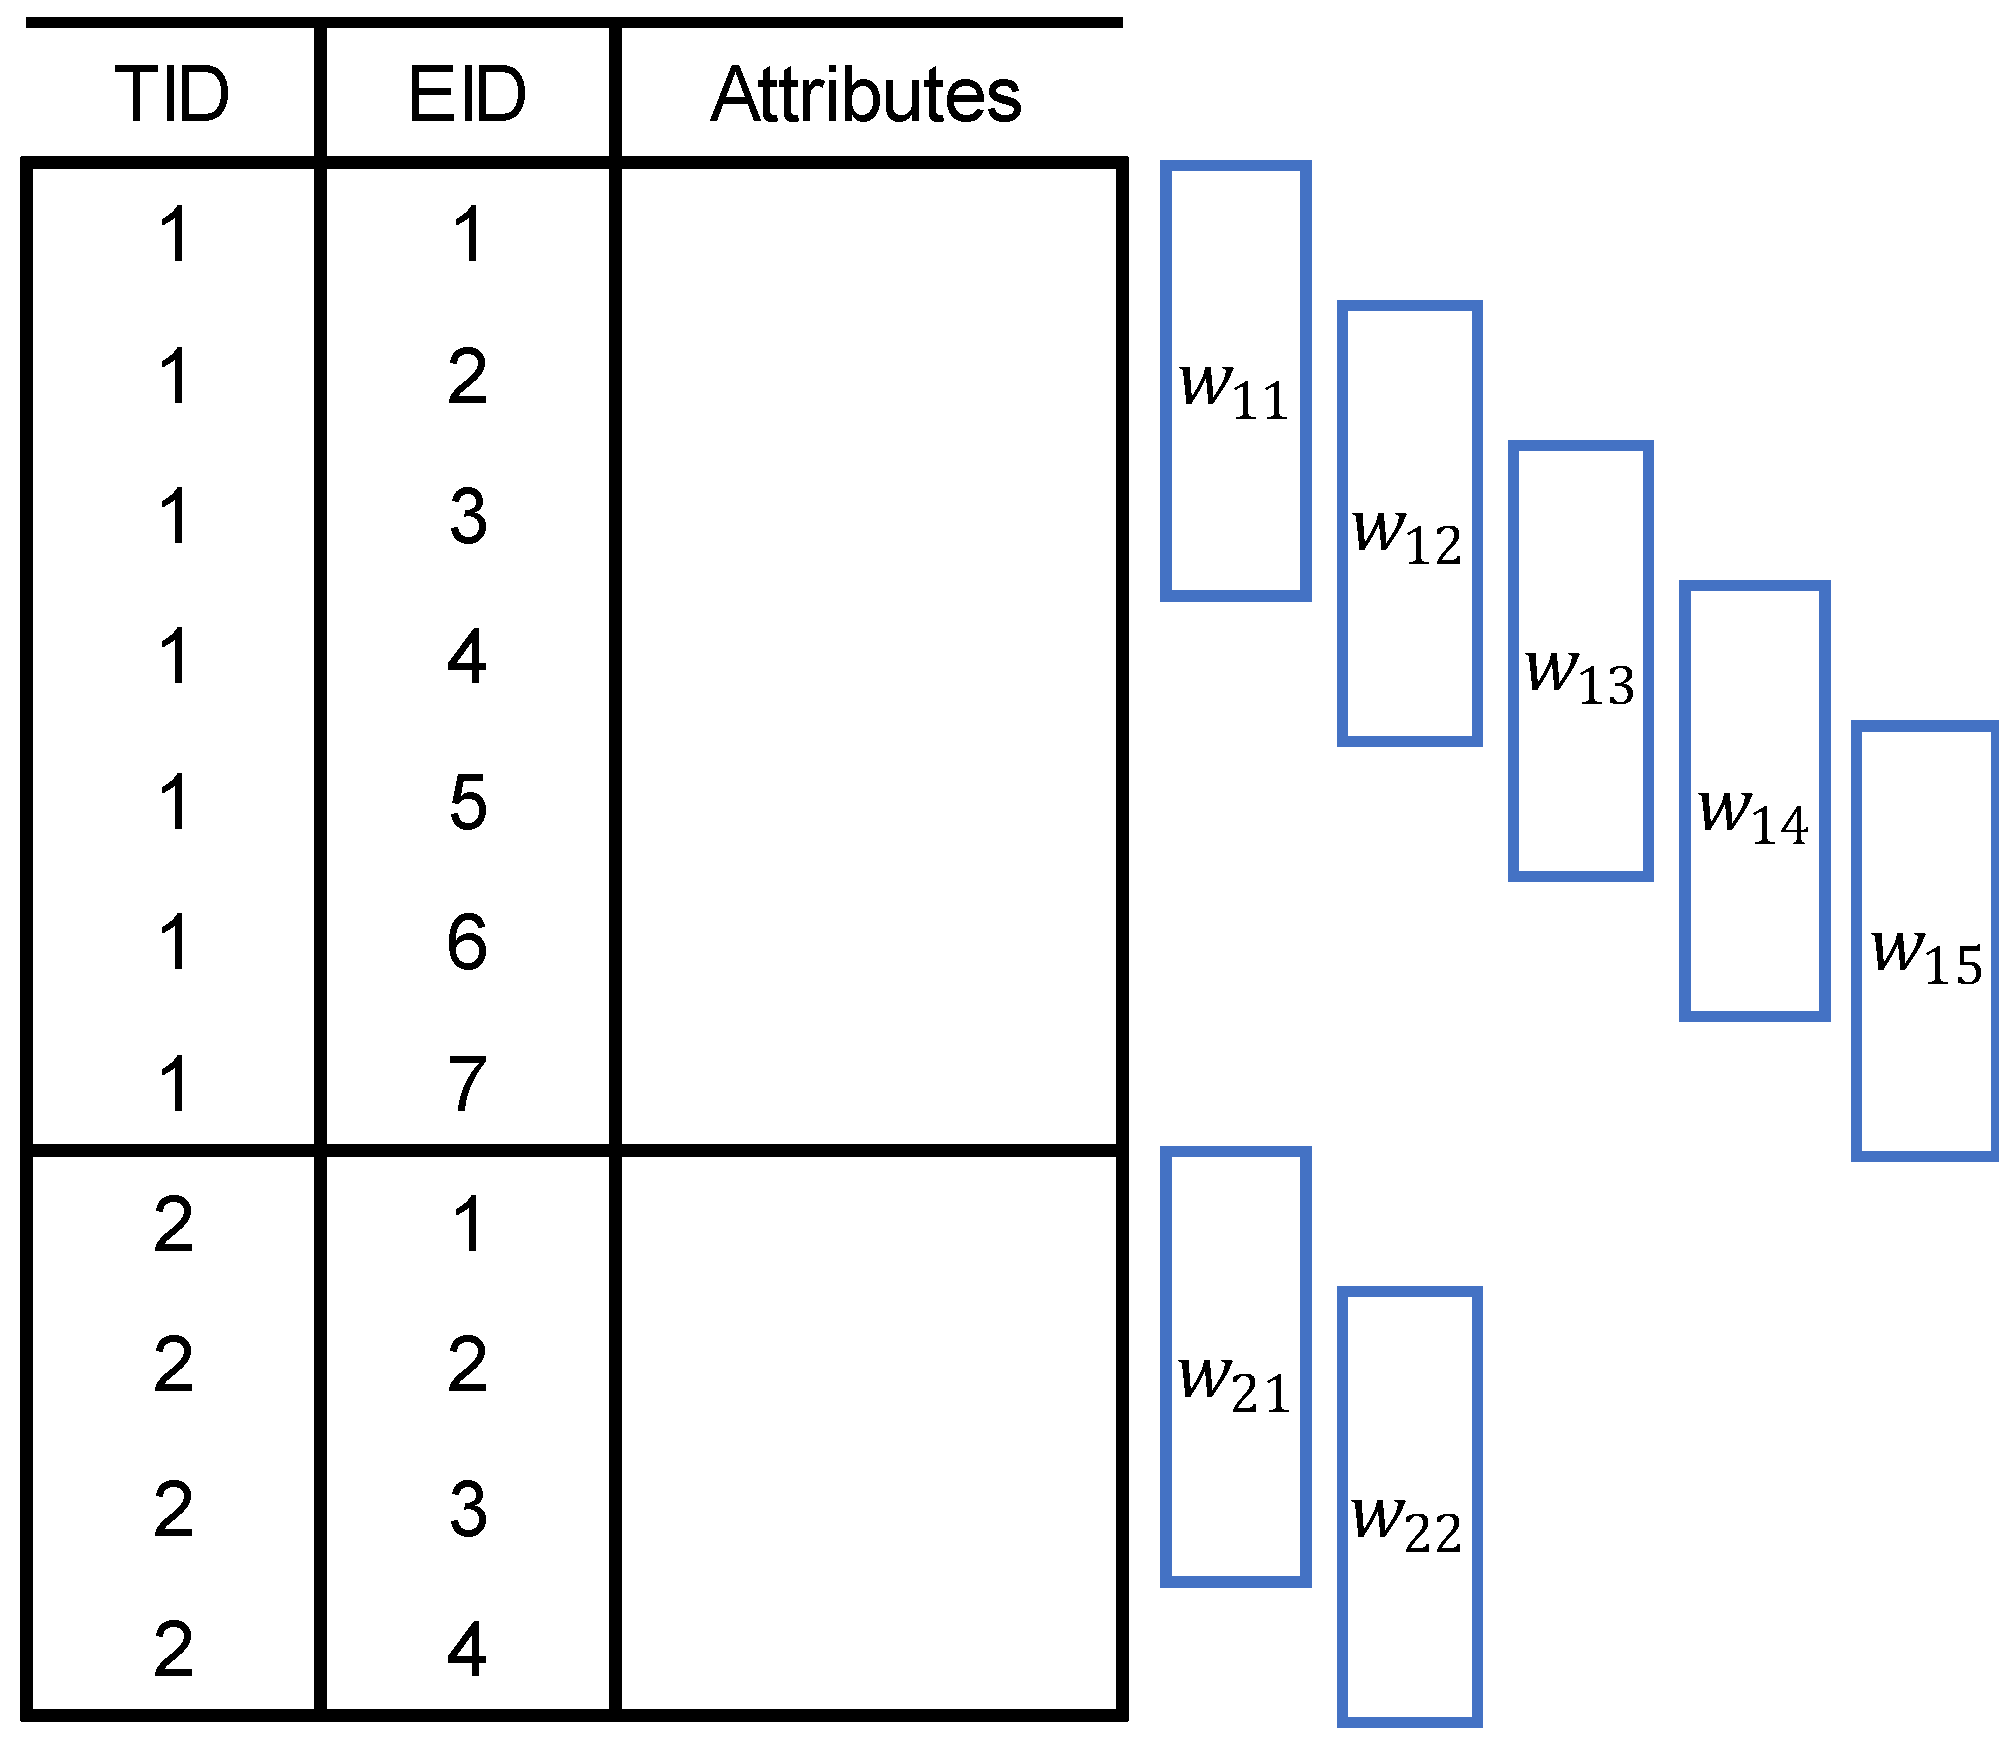
Figure 3 shows how a user log can be divided into multiple transactions; twelve activities are grouped into three transactions. Each transaction gets a unique transaction ID (TID), and each event within the same transaction gets an event ID (EID). The IDs are given by the order of occurrence. The final form of the processed user log is shown in
Table 1.
Records left in the system during the past online banking transactions of an individual user. A user log consists of multiple transactions.
3.2. Extraction of Frequent Patterns
We extract sequence patterns using Zaki’s spade algorithm [
29,
30]. A frequent pattern occurs in more transactions than the threshold called minimum support. It is defined as an individual’s normal activity pattern. For example, suppose that a frequent pattern is extracted with minimum support of 0.6. This means that the probability of the pattern that exists in the user log is more than 60%. Therefore, the number of patterns depends on the threshold value.
Another concept is the candidate pattern, which is likely to be a frequent pattern. After the algorithm finds the candidate patterns, only the ones having support higher than the minimum support become frequent patterns. Candidate patterns can be easily generated using the fact that if a pattern is frequent, all subsets of the pattern are also frequent. For example, if {(A), (C), (B)} is frequent, its subsets {(A)}, {(C)}, {(B)}, {(A), (C)}, {(A), (B)}, {(C), (B)}, and {(A), (C), (B)} are all frequent.
Candidate patterns are identified starting from a candidate set with an item size of 1. If smaller patterns are not frequent, pruning is conducted to remove its descendants including them. This process is iteratively performed until no frequent set can be identified and every candidate set is checked.
Frequent patterns are a collection of events that are accepted as normal. Frequent patterns can be defined as follows:
Definition 4. Frequent Pattern.
Sequence pattern extracted from the user log. Transaction sequence s(m) with a maximum size of m cannot be greater than a frequent pattern item set p(k) with a maximum size of k.
The frequent pattern set P is a set of association rules with support above the threshold, which is the criterion to determine a frequent pattern, and is defined as follows:
where denotes
i-th set of frequent activity items extracted by frequent pattern mining. The frequent pattern size |
| is equal to the number of transactions that make up the frequent pattern.
If a frequent pattern is detected in a transaction, the transaction can be considered normal; otherwise, there is a possibility that the transaction is abnormal.
3.3. Fraud Alarm Model
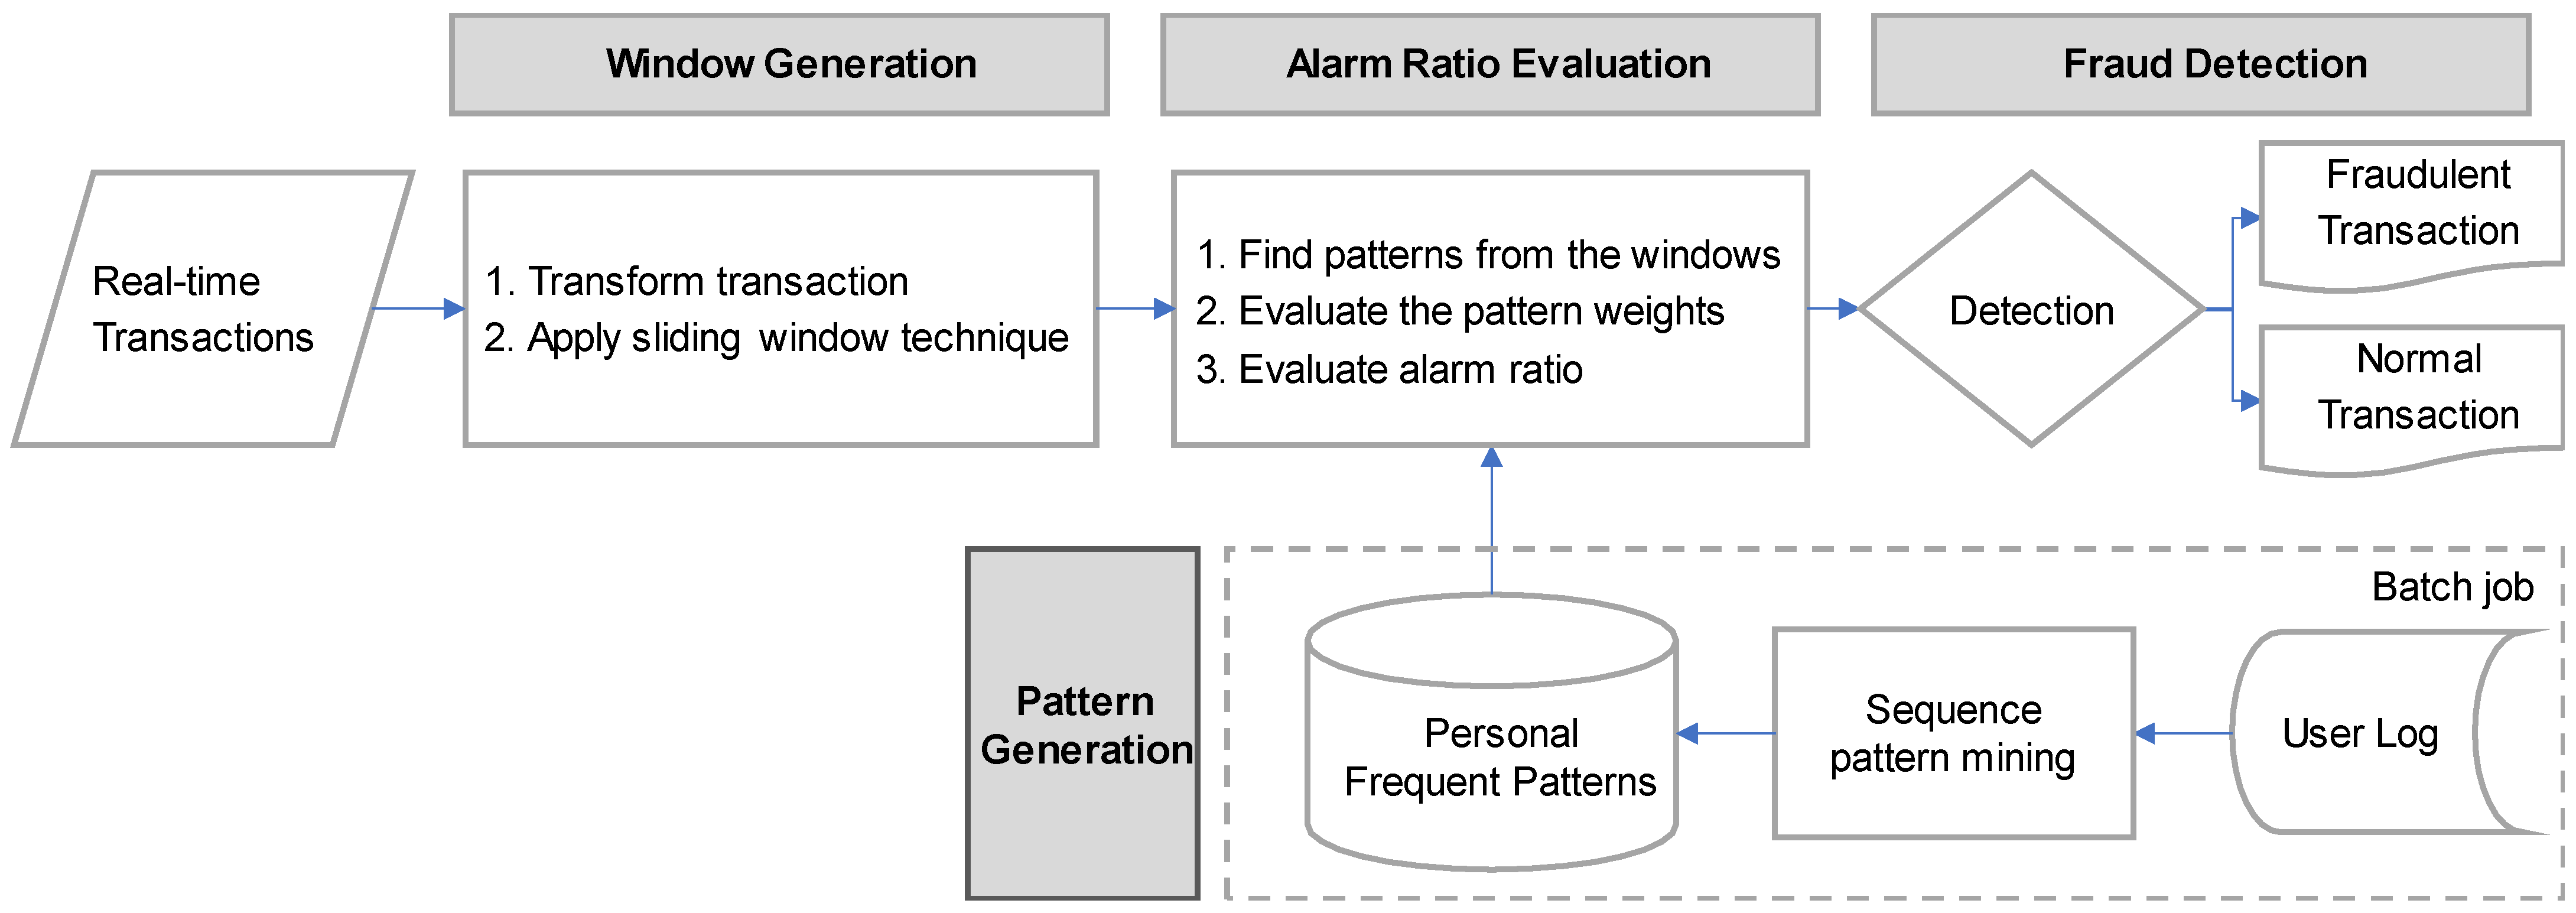
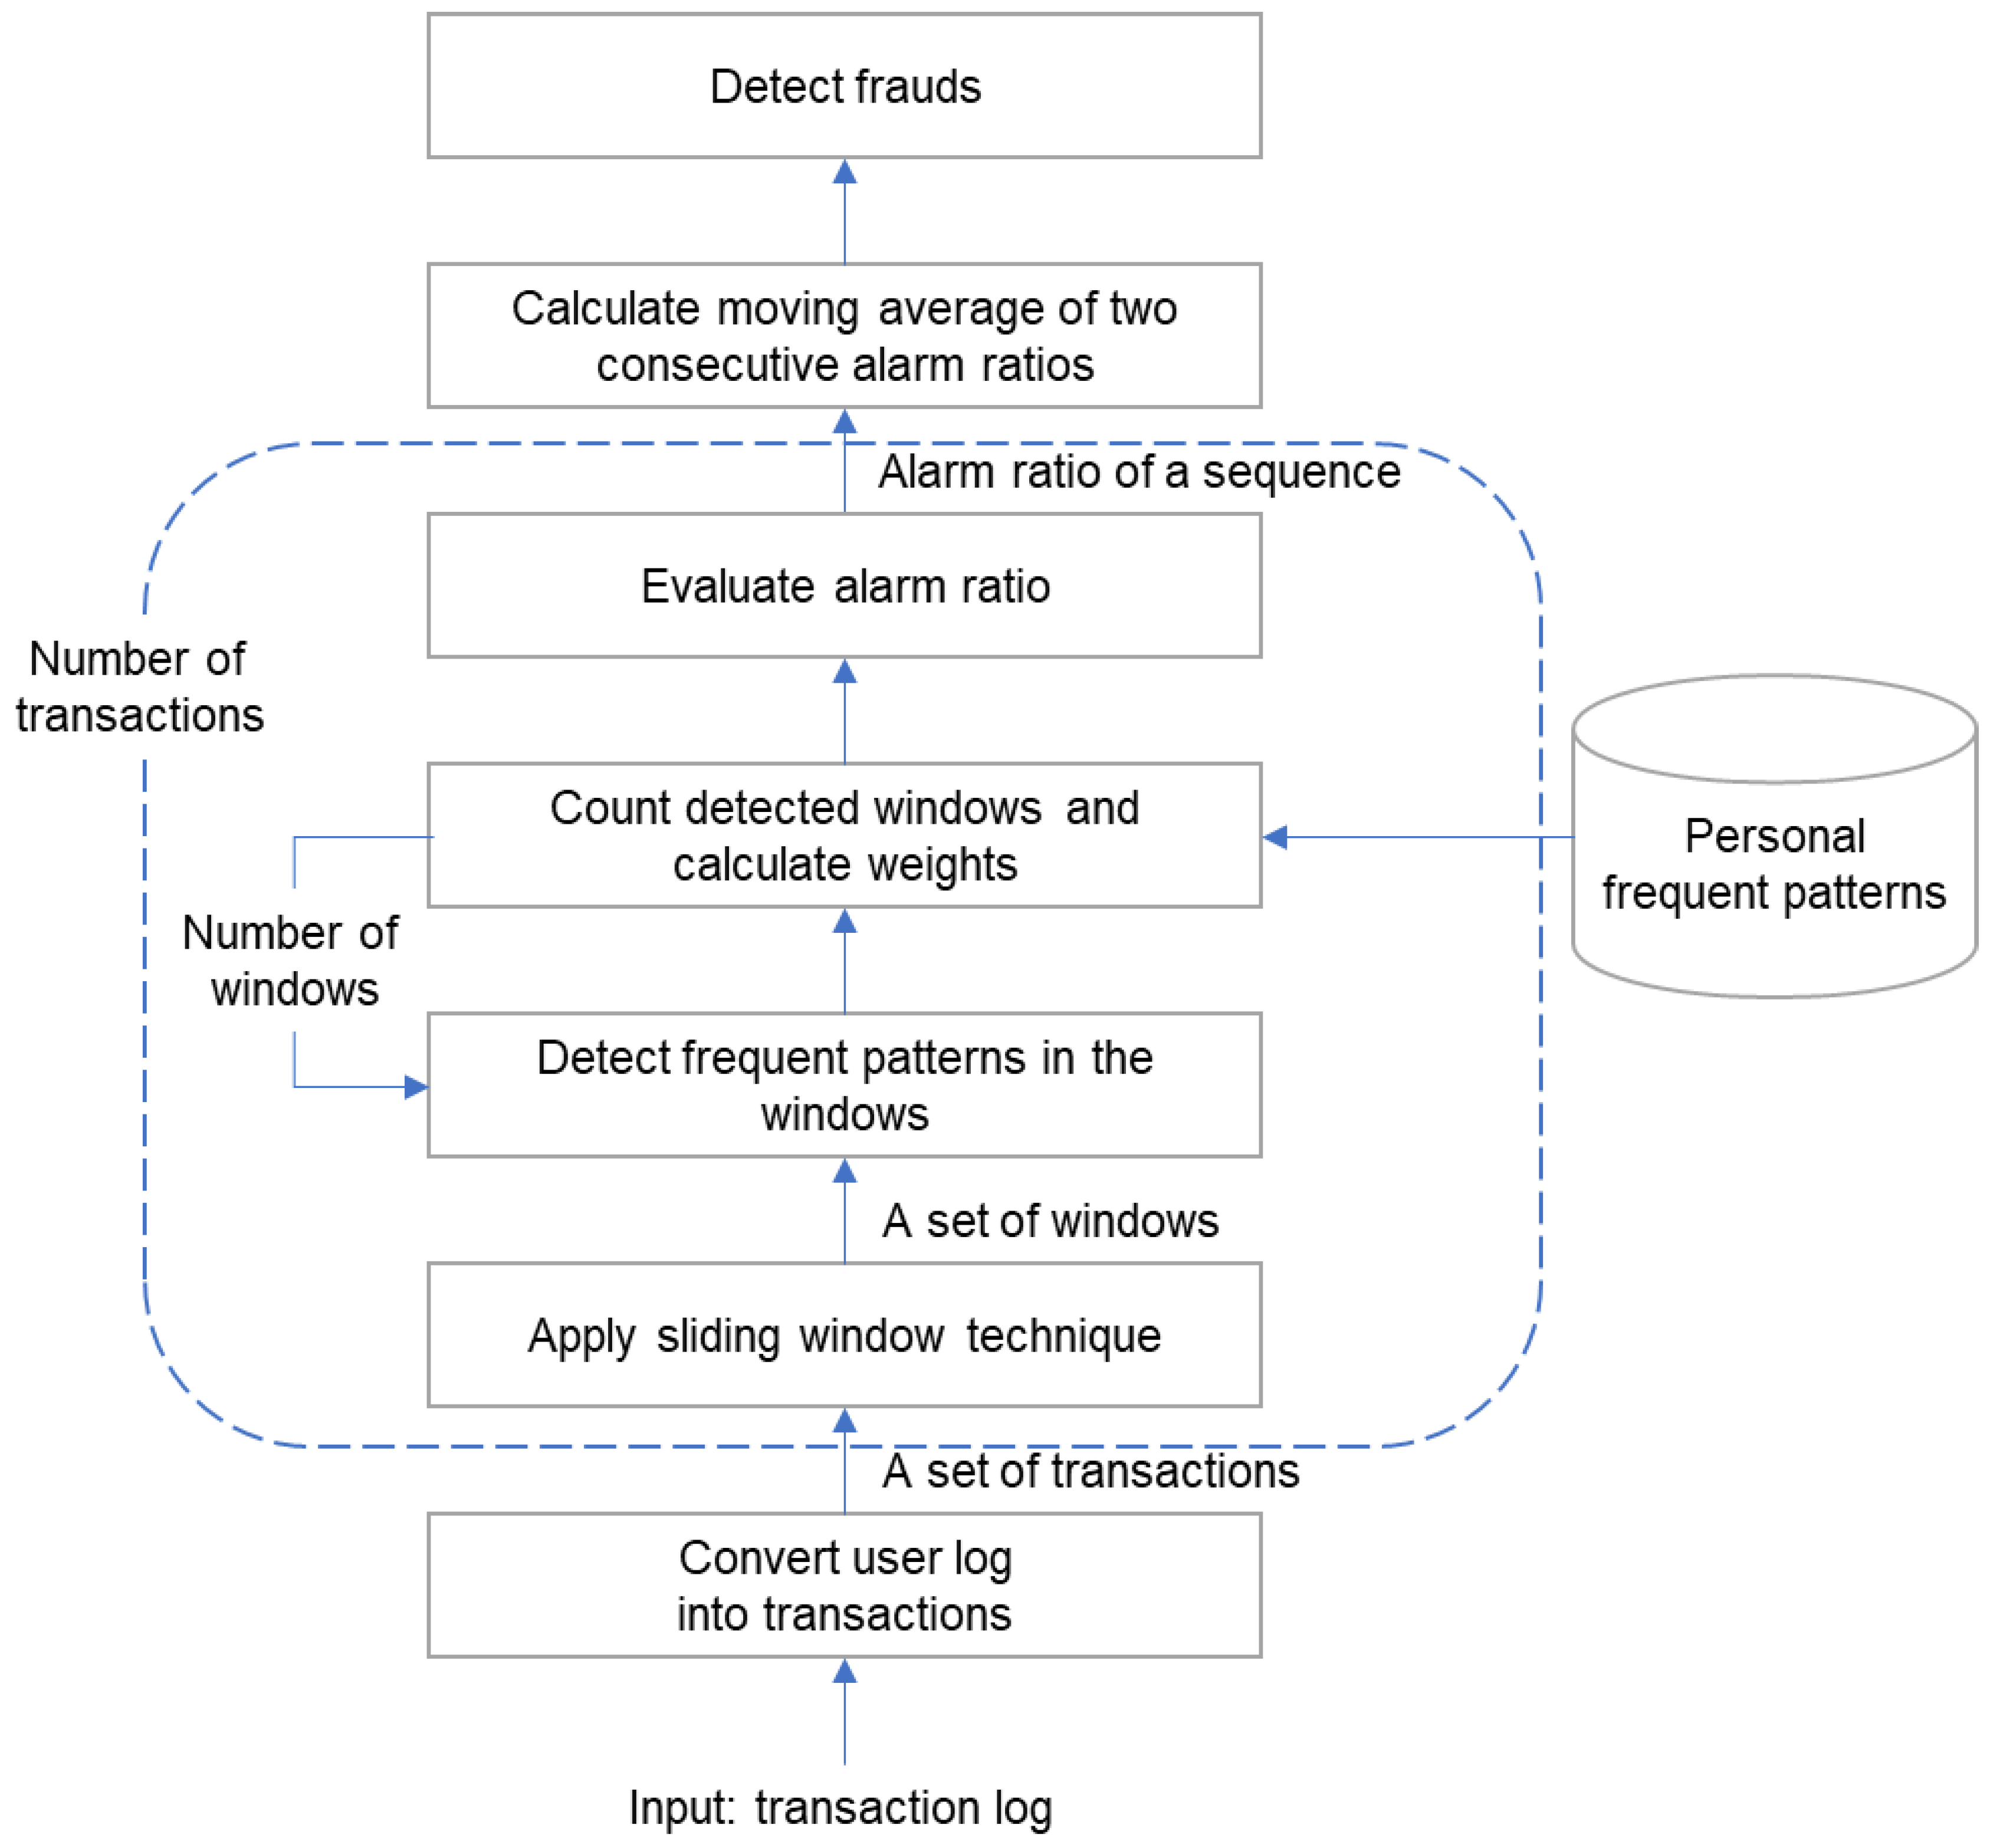
Finally, our alarm model evaluates a metric called an alarm ratio by the weight of the frequent patterns. The proposed model is shown in
Figure 4.
The real-time user logs are converted into a transaction sequence and then configured into a sliding window. First, the patterns are examined in the window list. Then, the weight of the found pattern is calculated to evaluate the alarm ratio. Finally, detection is performed whether it is a fraud or not based on the alarm ratio. In the following section, the processing procedure for each step is described in detail.
3.3.1. Conversion to Sliding Window Object
To determine whether a frequent pattern is included in a transaction, the sliding window technique is applied.
Definition 5. Sliding Window W.
When the window size w is given as a parameter, the window set W(s) for the transaction s is expressed as follows:
After the user log is changed into a set of transactions, a window with the size
w slides over each transaction to generate sliding window objects.
Figure 5 represents the application of a sliding window to the user log when the window size is 3.
Window ID (WID) is given to all window objects. Each window is a unit of occurrence. That is, whether normal patterns are included or not is checked on each window level, not the transaction.
When window size w is smaller than , the checking of the presence of a frequent pattern could not be conducted. If a transaction has smaller size than w, the sequence is excluded from the test. Window size should be adequately set according to the characteristics of the user log dataset.
3.3.2. Alarm Ratio Evaluation Process
This is a process of inspecting whether frequent patterns are found in the sliding windows and evaluating the alarm ratio to determine whether it is fraudulent. A detailed description of each step is provided as follows:
Step 1. Calculate the normal ratio
The normal ratio measures the likelihood of a transaction being normal. It can also be called a pattern detection rate. After applying the sliding window technique, we count windows that include at least one pattern. The more patterns found in a window, the more likely that the window is normal. Moreover, the higher the number of “colored” windows, the more likely that the transaction is normal. A normal ratio is calculated for each transaction. The normal ratio of a transaction
is calculated as follows:
where
is the size of the window set for transaction s. (
)
Step 2. Calculate the weight of the detected pattern
Using the vanilla normal ratio might lead to overestimation. The level of contribution to pattern detection (=weight) is calculated by the support of each pattern.
The level of contribution to pattern detection was calculated as the average of the weights of the found patterns, and the pattern weight was calculated by multiplying the number of cases of pattern detection against the number of windows of the sequence by the pattern support for each identified frequent pattern.
Among the frequent patterns, a set of patterns appearing in the window set is denoted as
, and the number of times its element
appears in the window set is denoted as
. The support of the found pattern is denoted as
. Then, the weight is calculated as follows:
Step 3. Calculate the weighted normal ratio
The weighted normal ratio is the product of the normal ratio and the contribution to pattern detection. We calculate the modified normal ratio value as follows:
Step 4. Calculate the alarm ratio
Up to Step 3, the probability of a normal transaction is measured. In this step, the probability of a fraudulent transaction, the alarm ratio, is calculated as follows:
Since the criteria for determining fraud may vary depending on the operating standards of financial institutions, we separate determining logic in the next section.
3.3.3. Detecting Fraudulent Transaction
A high alarm ratio of a single transaction does not immediately judge it as a fraud. Because in the case of real fraud, different transactions are found several times. Therefore, we focus on when the alarm ratio of two consecutive transactions is high. The moving average of two consecutive transactions’ alarm ratios is compared to the threshold. The threshold we specified in the experiment is 0.5.
If the threshold is less than 0.5, there is a risk of over-detection, while a threshold greater than 0.5 has a risk of under-detection. Since the purpose of fraud detection is to focus more on reducing the false negative, the threshold was set at 0.5 by taking a conservative approach. In real applications, the value of the threshold is adjusted according to the detection performance. An alarm is issued as follows:
The proposed frequent-pattern-based fraudulent transaction detection algorithm is shown in
Figure 6 as a flow chart.
4. Experiment and Evaluation
We applied and evaluated our model to a real-world dataset collected from a financial institution. Although the number of fraudulent events differs depending on the kind of financial institution (insurance company, card company, bank, etc.), financial fraud cases are very rare. That is, the amount of fraudulent transaction data is very unbalanced. In order to solve this problem, there is a study that generates normal and fraudulent transaction data through random sampling based on the Gaussian mixture model [
31]. However, random generation of transaction data is not included in this paper because we tried to find out the usefulness of our model on the user’s actual transaction data.
4.1. Data Collection and Conversion
We extracted online banking transactions from user logs of multiple users over a one-year period and all transaction logs identified as financial fraud among them. In addition, transaction logs including withdrawal transactions were collected by randomly sampling normal users at the same rate as fraudulent users. As shown in
Table 2, 7592 transaction logs were extracted; 4591 transactions were used for training and 3001 transactions for testing. The testing data contain fraudulent transactions but do not contain any financial fraud labels, and therefore it is unknown which transactions are frauds.
The performance was compared with the Markov chain model and the actual rule-based FDS using scenarios, currently operated by a financial institution.
4.2. Markov Chain Based Detection Model
A Markov chain is a stochastic model used to describe how a previous state affects the next state and to predict a future state from a past state. A Markov chain model [
8,
17,
32] consists of a set of states, initial probability, and a matrix of transition probability. For comparison of the alarm performance, personalization and generalization experiments were performed simultaneously.
4.2.1. Data Modeling and Experimental Design
We defined each state as a combination of two selected attributes, an access type and an activity type. There are 8 different access types and 134 activity types, creating a total of 1072 states.
Table 3 shows some states and their attributes.
The state transition probability matrix was calculated by applying a sliding window to the state set
, and the window size
was set to 10 considering that the number of transactions per minute is generally around 10. For comparison between the personalization and generalization performance, the state transition matrix was calculated by dividing it into an individual state transition matrix and a generalization state transition matrix in which the activities of all users are analyzed. The threshold value was defined as the minimum value (min) of the occurrence probability
for each training data window. The Markov chain alarm model predicted whether the state at time
n,
Sn is normal or abnormal. An alarm is issued as follows:
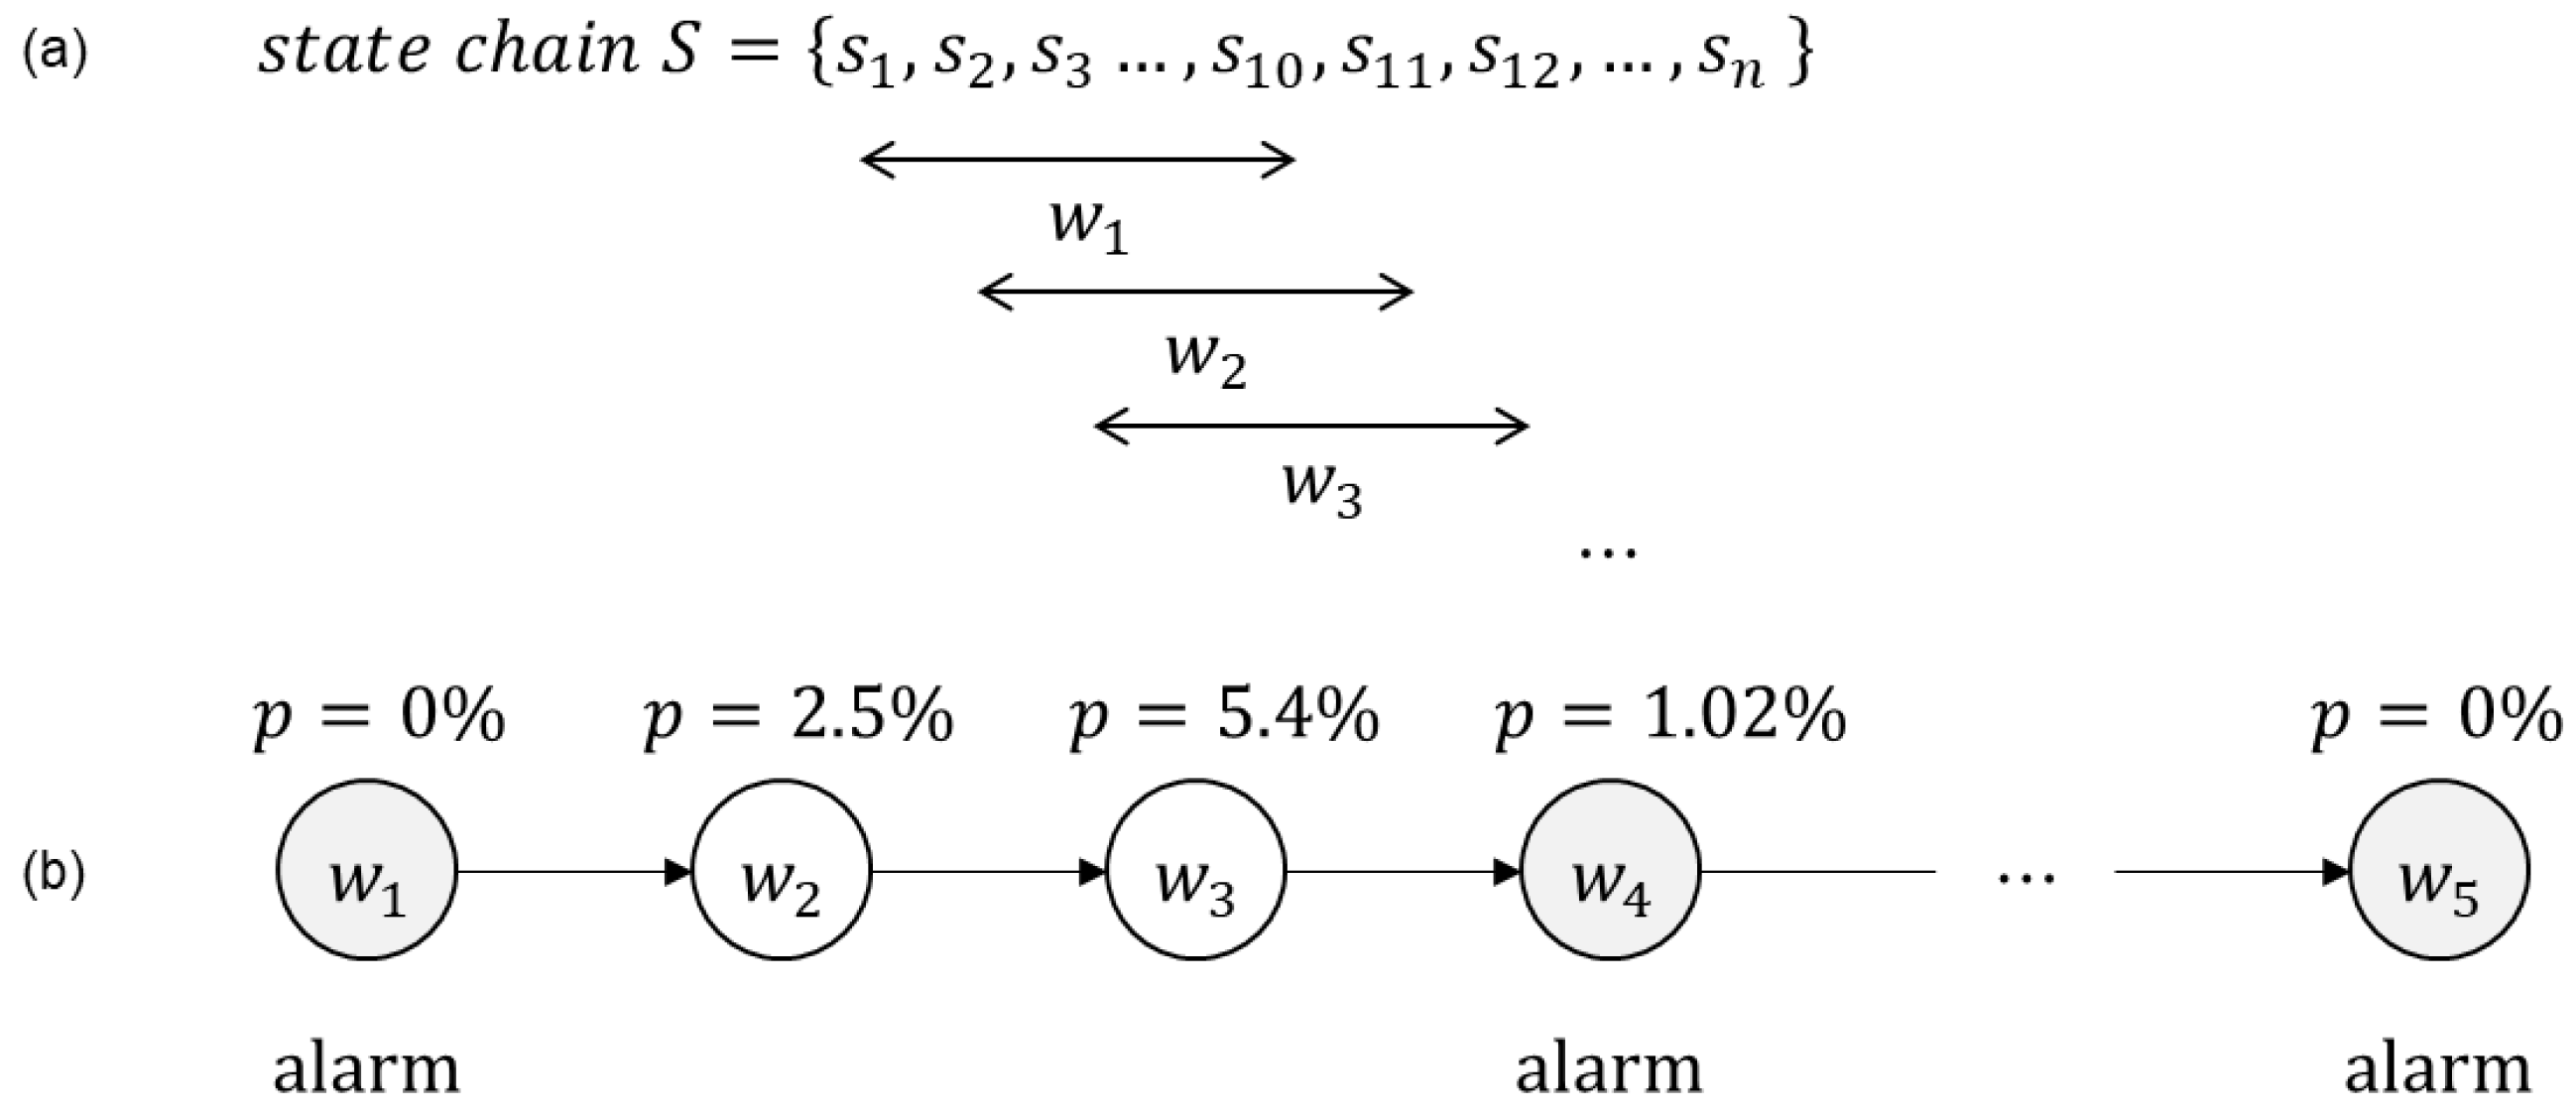
In
Figure 7, the threshold value was set to 2.07% which was the minimum value of transition probability calculated in the training phase. Since the probability of the transition from
to
is 0%, an alarm rings, while the probability from
to
(5.4% > 2.07%) is considered normal.
The performance of the experiment is measured by the alarm rate. The alarm ratio is the ratio of the window in which the alarm was issued in the total transaction window per user, and the detection of the fraudulent transaction threshold is 0.6. The alarm ratio is calculated as follows:
The status of the window created after modeling the test data is shown in
Table 4.
4.2.2. Experimental Results
Experiments were conducted in two ways: a general approach and a personalized approach. In the general approach, the transition probability matrix was calculated considering all users, and the threshold was set as the minimum value of the matrix. In the personalized setting, the probabilities were calculated at each user level, and the minimum value was set as the threshold. The results are shown in
Table 5.
In the general experiment, the fraud detection performance was not good with an alarm ratio of 16.60% in fraud cases, but the alarm ratio of 6.8% for normal cases was judged to be normal in most cases. The results of the personalized experiment show a fraud detection performance of 84.36% in cases of fraud compared to the generalized experiment, and in the cases of normal transactions, the alarm ratio was 28.07%, which was judged to be mostly normal. The performance of personalized detection is better.
4.3. Personalized-Pattern-Based Detection Model
4.3.1. Data Modeling
The elements of the data model include log recording time, IP, access media, and activity type. Training data are converted into a transaction sequence and used to extract usual sequential frequent patterns through frequent pattern mining. Training data are converted into a transaction sequence and used to extract usual sequential frequent patterns through frequent pattern mining, and test data are converted into a transaction sequence and then converted into a sliding window to check whether frequent patterns are included. The process of converting to a transaction sequence was described in
Section 3.1, and the process of converting to a sliding window was described in
Section 3.3.1. As a result of testing data modeling, the transaction sequences and the number of windows are shown in
Table 6.
4.3.2. Experimental Design
The experimental conditions are as follows:
- ▪
Minimum support for personal frequent pattern mining through training data: 0.6.
- ▪
Frequent pattern filtering: the patterns composed of the media alone are removed.
- ▪
Limitations for sliding window frequent pattern detection: stop when the IP of the financial institution is found (recognized as fraud event, report).
- ▪
Window size w: 10.
- ▪
Exclude transaction sequences smaller than the window size.
Table 7 shows some of the frequent patterns extracted from the training data under the above conditions. For example, to explain the “<{
hts,
verificationcert}, {
hts,
verificationcert}>” pattern of sampled customer A, it means that executing the activity called “veriticationcert” twice in succession using hts (home trading) access media is the customer’s usual frequent transaction pattern.
4.3.3. Experimental Results
The proposed model was implemented using Python with R library and Splunk BigData Platform library and the search for frequent patterns using regular expression pattern matching techniques. Fraud is judged as a moving average of two consecutive trading sequences’ alarm ratios, and the detailed experimental results of sampled users A and B are shown in
Table 8. As shown in
Table 8, in the case of A, all 64 frequent patterns were searched for in all windows constituting the transaction sequence, and as a result of 2 Seq’s Moving Average evaluation by applying the weights of the found patterns, it was judged to be a normal transaction. In the case of B, it was judged to be fraudulent from the second transaction sequence.
The results of personalized fraud detection shown in
Table 8 above are summarized in
Table 9. Fraud detection according to the window search result shows a detection success rate of 95.83%, and fraud detection based on the transaction sequence shows a detection success rate of 96.00%. Fraud judgment in this proposed methodology is based on the transaction sequence.
4.4. Performance Evaluation
We compared the performance of our method with the results of the Markov chain model and the existing rule-based model. As shown in
Table 10, the proposed model showed a 96.00% detection rate. A generalized approach of the Markov chain model only showed a 16.60% detection rate, and the rule-based model failed detection. However, the Markov chain model’s personalization experiments showed an 84.36% detection ratio of frauds. This means that personalization-based detection is better and is necessary.
To evaluate the performance of the proposed model, we measured recall, accuracy, and F1-Score. Recall is more meaningful in FDSs because it is the ratio at which actual fraud is detected as fraud. Recall must be high to lower the false negative occurrence rate, and precision must be high to reduce the false positive occurrence rate. Increasing the recall can reduce the risk of financial fraud caused by false negatives. Therefore, recall is more important. The proposed alarm model applying sequence pattern mining outperforms other models in terms of recall, accuracy, and F1-Score (see
Table 11).
5. Conclusions
To overcome the limitations of the existing rule-based FDSs, we proposed a personalized alarm model to detect frauds in online banking transactions using sequence pattern mining. Conventional rule-based FDSs create rules or conditions by extracting the characteristics of past fraudulent cases and applying them to every user universally. This method not only does not take into account the characteristics of personal transaction style but also causes difficulties in managing the rules.
We assumed that the personalized fraud detection model is more effective in responding to the rapid increase in users and diversified fraud patterns. Moreover, we supposed that if a user’s behavior deviates from his or her normal patterns, the possibility of fraud is high.
Therefore, our proposed model divides each user’s log into transactions, extracts a set of sequence patterns, and uses it to determine whether a new incoming transaction is fraudulent. Determination of fraud is judged by the alarm ratio calculated on the window level, and an alarm is sounded in the case of continuous abnormality rather than a single abnormality to prevent false positives. This window-level decision makes it easier to determine fraudulent transactions in real time and is even more effective than the transaction-level decision when normal transactions and fraud transactions occur alternately.
Through experiments, we showed that our model outperforms the rule-based model and the Markov chain model. To validate the performance of our model more accurately, we need a few more datasets to experiment with. However, fraud cases are very rare, and financial institutions do not disclose user transaction data to protect personal information. Therefore, we tried to evaluate our model as much as possible with the limited data available in this paper. We will try to obtain other transaction datasets in the future to test and extend the model.
For our model to be used in real-world applications, three problems need to be addressed. First, because our model uses normal patterns to detect fraud, it can only discover fraudulent transactions when users exhibit very different trading patterns than usual. In real-world applications, additional contextual information such as user profiles should be used for detection in order to complement the proposed model.
Another is the cold start problem. Targeting users with enough existing logs to extract patterns, our model is difficult to apply to new users or users with few transactions. Therefore, general rules of the conventional FDSs must be utilized initially for fraud detection of new users. After the user’s data are collected for a certain period of time, our model can be applied.
Lastly, significant computing power is required to convert the incoming user log into a set of windows, compare it to frequent patterns of each user, calculate the alarm ratio, and determine whether an alarm is necessary. Therefore, we will carry out studies on application architecture and system infrastructure to apply our model.
