Article

Spatial-Temporal Pattern Evolution of Xi’an Metropolitan Area Using DMSP/OLS and NPP/VIIRS Nighttime Light Data

School of Human Settlements and Civil Engineering, Xi’an Jiaotong University, Xi’an 710000, China
*
Author to whom correspondence should be addressed.
Sustainability 2022, 14(15), 9747; https://doi.org/10.3390/su14159747
Submission received: 31 May 2022 / Revised: 29 July 2022 / Accepted: 4 August 2022 / Published: 8 August 2022
(This article belongs to the Section Sustainable Urban and Rural Development)

Abstract

:
A metropolitan area provides valuable space for economic development, and it is the home on which human beings depend for their survival. However, metropolitan areas are often faced with prominent problems caused by the natural environment and city layout. Therefore, understanding metropolitan areas’ spatial-temporal pattern evolution is of vital significance for medium-to-long-term city growth. This study uses the nighttime light data to monitor the urban pattern evolution of the Xi’an Metropolitan Area (XMA) over the past 30 years. The study results suggest that the continuity correction and consistency correction used in this study can construct a stable long-term, multi-source nighttime light dataset and, at the same time, accurately reflect the changes in the urban pattern. The determination coefficient between gross domestic product (GDP) and total nighttime light (TNL) reached 0.90; the nighttime light index (NLI) of the XMA is characterized by high spatial heterogeneity. The NLI of the core areas has been saturated before 2004, while the CNLI value of the peripheral Chang’an District was 0.31 by 2021. Urban land expanded in all directions, with an average expansion rate of 12.9% and an expansion intensity of 2.6%. The nighttime light gravity center generally shifted towards southwest, from (108.915° E, 34.355° N) in 1992 to (108.922° E, 34.343° N) in 2021. The urban pattern of the metropolitan area is influenced by the natural environment, and the southwest and northeast directions will be the primary development directions in the future. The local development policy is a crucial driving factor in the urban pattern evolution, which significantly affects the location and intensity of urban expansion; the center of gravity of the XMA has different migration directions in different periods, meaning that the development of the metropolitan area tends to be balanced.

1. Introduction

A metropolitan area is an important place of human living and development and plays important roles in the modern world. Rapid economic growth has brought the flow of people, capital, and technology to large cities and their surrounding areas [1]. Subsequently, services and industry continued to sprawl into the urban periphery, leading to the rapid expansion of urban suburbs, which were further integrated with the surrounding small towns, and eventually shaped a metropolitan area, whereas big cities formed the core and also maintained close social-economic linkage with the surrounding areas [2]. Nevertheless, this process of urbanization is confronted with several challenges, including irrational layout, discontinuous policies, and blind expansion of urban space, which have caused a series of ecological environment problems, including climate change [3], cultivated land area decrease [4], reduction in vegetation coverage [5], surface temperature anomalies [6], water shortage [7], and air pollution [8]. Thus, it is of vital importance to explore the dynamic changes of the urban spatial temporal pattern evolution and grasp the development level and possible development direction.
Traditional city spatial temporal pattern monitoring relies mainly on statistical data, which cannot accurately reflect the spatial distribution characteristics of cities. Remote sensing technology has the advantages of solid expressiveness, being large-scale, and being capable of periodic observation, and has been widely applied to the dynamic monitoring of urban spatiotemporal patterns [9]. Currently, remote sensing urban monitoring mainly uses medium- or high-resolution optical images, LiDAR, and radar data to extract urban areas and focuses more on land-use-type changes [10]. It is difficult to extract information on the intensity of socioeconomic activities from the above data source, and this monitoring mode cannot reflect the scale of economic development in human settlements [11]. However, the nighttime light images characterize urban nighttime light and other luminous bodies as bright patches so that luminous bodies such as cities and towns are clearly distinguished from dark background regions without lights. That is, nighttime light data can not only identify the distribution of human settlement but also quantify the intensity of socioeconomic activities, thereby providing a new perspective for urban spatial pattern monitoring [12]. The commonly used nighttime light data are derived from the Operational Line-scan System (OLS) carried by the Defense Meteorological Satellite Program (DMSP) and its successor, the Visible Infrared Imaging Radiometer Suite (VIIRS) onboard the National Polar-Orbiting Partnership satellite (NPP) [13]. The DMSP/OLS and NPP/VIIRS have provided invaluable data sources for macro-scale urbanization monitoring and have more excellent application prospects in future studies [14].
Scholars have conducted experimental research and applications in various industries based on nighttime light data. For instance, Elvidge et al. have investigated the relationship between the lighting area obtained by DMSP/OLS and GDP through the data analysis of 21 countries [15]. The logarithmic model between GDP and total nighttime light is established, and the model correlation is above 0.85, proving that nighttime light data can be used to estimate GDP and other social and economic data [16]. Xin et al. used DMSP/OLS data from 1992 to 2013 to monitor the urban expansion of Wuhan City, and discussed related factors combined with socioeconomic data so that the ability of night light data in reflecting urban development policies was demonstrated [17]. Chen et al. used NPP/VIIRS data and various auxiliary data to monitor the evolution of the Yangtze River Delta Urban Agglomeration from 2012 to 2018 and compared it with five major urban agglomerations in Europe, North America, and Asia [18]. Liu et al. corrected multi-year, multi-sensor DMSP nighttime light data from 1992 to 2008 to monitor China’s urbanization stages [19]. Zhang et al. described urbanization processes at regional and global scales using an unsupervised classification method based on multitemporal DMSP/OLS nighttime light data [20]. Niu et al. used nighttime light data to monitor the urban expansion and shrinkage of cities in the Yellow River Basin, and their conclusions provided rapid data support for urban planning [21]. Previous research demonstrates the feasibility of nighttime light data in studying urbanization and urban spatial expansion. Yet, due to the differing designs between DMSP/OLS and NPP/VIIRS sensors in spectral response, spatial resolution, and imaging time, most research studies only used a single type of nighttime light data to monitor urban development in relatively short time frames, and the research period is limited to before or after 2012.
With the advancement of China’s Belt and Road Initiative (B&R) and the implementation of the New-Type Urbanization strategy, the urbanization process in Northwest China has been dramatically accelerated. The Xi’an Metropolitan Area is the economic center of Northwest China and is also the start point of China’s Belt and Road Initiative. It is a typical region in China’s urbanization process. As a substantial industrial production base and transportation hub in Northwest China, XMA is currently in a stage of rapid development, with the continuous expansion of the built-up area and increasing urbanization level [22]. Therefore, it is urgent to promote balanced development, reduce investment waste, and avoid the duplication of construction.
Little attention has been paid to the evolution of the urban pattern in Xi’an Metropolitan Area based on nighttime light data. Therefore, this paper attempted to use nighttime light data to explore the spatial temporal pattern evolution of XMA and influencing factors. The main objectives of this study were: (1) to take a series of methodological steps to construct a long-term stable nighttime light dataset; (2) to use multiple city status indicators, including the nighttime light index, urban expansion rate and intensity, and city center of gravity, for exposing the spatial and temporal evolution characteristics of XMA; (3) to identify the natural factors and human factors in urban pattern evolution.

2. Materials and Methods
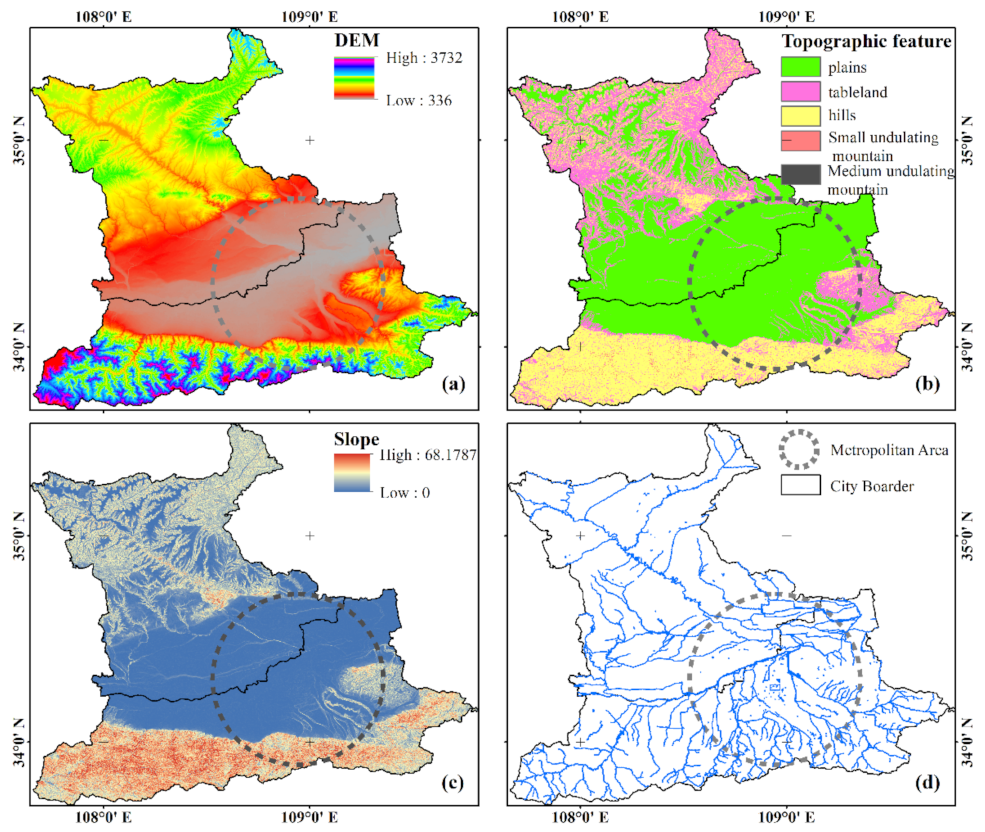
2.1. Research Area

Metropolitan Area refers to the regional economy development phenomenon that appears in the urban agglomeration with the central urban area of a metropolis as the core and the surrounding suburbs, outer suburbs, satellite cities, market towns, villages, and villages participating in the division of labor, cooperation, and integration [23]. Correspondingly, the Xi’an Metropolitan Area is composed of the central urban area of Xi’an City (the capital of the Shaanxi province), the main urban area of Xianyang City, and the advanced road transportation network-connected suburbs and surrounding townships. Major administrative includes Lianhu District, Beilin District, Xincheng District, Yanta District, Weiyang District, Baqiao District and Chang’an District in Xi’an City, and Qindu District and Weicheng District in Xianyang City. As shown in Figure 1, the XMA is located in the middle of the Guanzhong Plain between Xi’an and Xianyang (108°30′–109°15′ E, 33°42′–34°45′ N) and is bordered by Qinling Mountains to the south and the Loess Plateau in the north. The climate of XMA is a warm–temperate, semi-humid continental monsoon climate and has four distinct seasons, with an annual average temperature of 13.7 °C and precipitation of 604 mm [24].

2.2. Data Introduction

2.2.1. DMSP/OLS Nighttime Light Data

As illustrated in Table 1, the DMSP/OLS nighttime light data released by NOAA’s National Geophysical Data Center (NGDC) includes 34 composite images acquired by six different satellite sensors (F10-F18) within 22 years. The OLS instruments onboard the DMSP satellites can map nighttime light emissions from the earth’s surface with an altitude of 833 km, and the overpass time of the satellites is between the local time of 8:30 pm and 9:30 pm [25]. The swath width of the image is 3000 km with a spatial resolution of 30 arcsec, about 1 km at the equator, and the spatial coverage is 180° W–180° E, 65° S–75° N, which covers all areas in the world where human activities exist. The digital number (DN) values of the DMSP/OLS image range from 0 to 63 and generally represent the light intensity.

2.2.2. NPP/VIIRS Nighttime Light Data

The VIIRS sensor is mounted on the Suomi NPP satellite and has been observing the earth in a near-polar, sun-synchronous orbit since its launch in 2011. The spectral response range of VIIRS DNB (Day/Night Band) is 505–890 nm, with a spatial resolution of 742 m and an orbital altitude of about 824 km. In particular, the DNB band of the VIIRS instrument has enhanced its lower limit of detection to 2 × 10⁻¹¹ W·cm −2·sr −1 from 5 × 10⁻¹⁰ W·cm −2·sr −1 as a result of the development of remote sensing engineering technology. Compared with the OLS instrument onboard the DMSP satellite, the VIIRS dramatically improves the clarity and sensitivity [26]. Data time coverage is from 1 January 2012 to the present (see Table 1).

2.2.3. Auxiliary Data
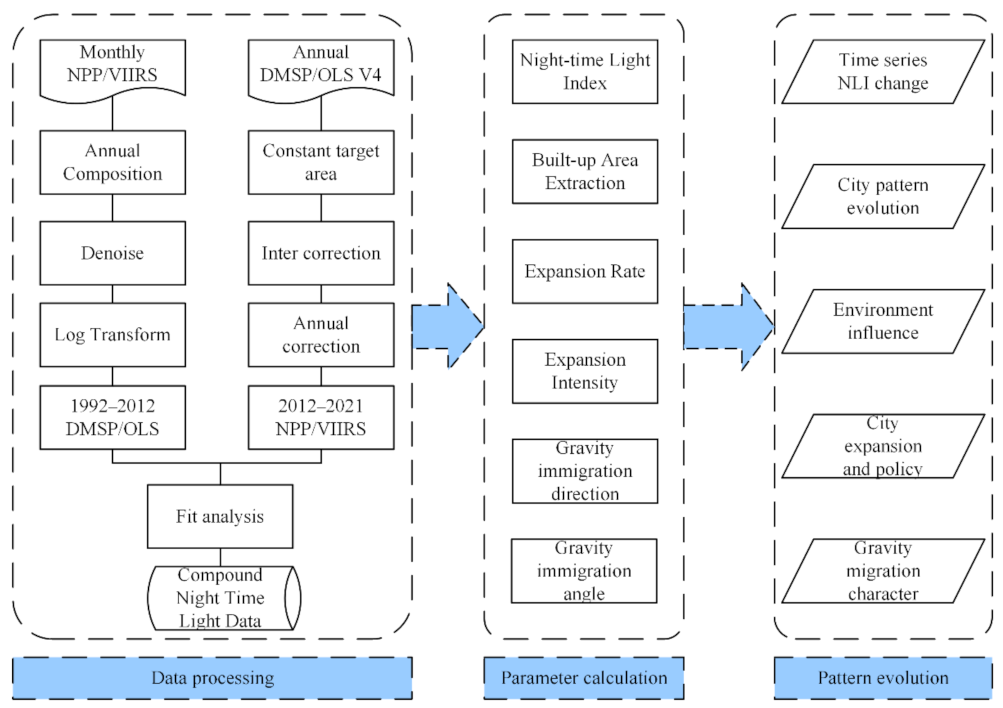
In addition to the two types of nighttime light data, the supporting data used in the study also included vector data of administrative divisions and a digital elevation model (DEM). The vector data of the administrative divisions of Shaanxi Province used in this paper was obtained from the national scale database of the National Geomatics Center of China. The DEM data is the most extensively used Space Shuttle Radar Topography Mission (SRTM) in the past 15 years at a spatial resolution of 30 m, and its projection is UTM [27].

3. Methodology

The workflow of this research is shown in Figure 2. In the first section, time series correction and consistency correction are performed on DMSP/OLS and NPP/VIIRS nighttime light data to establish a 30-year time series nighttime light dataset. The second section calculated multiple nighttime light indices, the expansion rate, expansion intensity, and the migration of the urban gravity center based on the above synthetic dataset. Finally, the analysis and discussion are carried out based on the parameter calculation results.

3.1. Data Pre-Processing

DMSP/OLS and NPP/VIIRS are nighttime light data from two different sources. In order to maintain the consistency of the reference coordinate system and projection between the data, the reference coordinate system of all images and vector data is firstly defined as the WGS-84 coordinate system and projected to the Lambert equal-area projection. Then, the nighttime light image data in China are extracted. At the same time, with the help of ArcGIS software, based on the boundary surface vector files of municipal administrative districts in China, the nighttime light data in the time series are extracted.

3.2. Nighttime Light Data Composition

3.2.1. DMSP/OLS Image Correction

The DMSP/OLS nighttime light datasets were recorded by six distinct satellites. Since the OLS sensors are unequipped onboard calibration systems, DMSP/OLS images acquired by the same satellite may have apparent abnormal fluctuations, and the comparability is poor. Therefore, the acquired data must be corrected before practical use [28]. By analyzing the socioeconomic data of various cities in China, this paper selected the main urban area of Hegang City, Heilongjiang Province, as the reference area [29], wherein the urbanization process is slow, and the inter-annual variation of the DN value is small and evenly distributed in a range from 0 to 63. The F18 sensor data in 2010 with better continuity and a higher total gray value of night light data were selected for the reference calibration year, and a univariate quadratic regression model was established regarding the method used by Elvidge et al. to correct the global night light data:
DN C = p 1   ×   DN 2   +   p 2   ×   DN   +   p 3 DN 2   +   q 1   ×   DN   +   q 2
where DNC is the DN value after mutual correction; DN is the raw value of the original satellite records; the parameters p1, p2, p3, q1, and q2 are determined by fitting the pixel DN value from the image matrix using Equation (1).
Moreover, the pixel value of the images acquired by the satellites in the same year may be different. To make full use of the images of the same year obtained by multiple sensors and ensure the stability and continuity of nighttime light image data, the formula for correcting the images of the same year obtained by different sensors in this paper is as follows:
DN I = DN ( a , i )   +   DN ( b , i ) 2
where i stands for the year where there existed two repetitive observations, such as the year 1994 and the period from 1997 to 2007, DN(a,i) and DN(b,i), respectively, represent pixels obtained by satellite a and satellite b, and DNi is the corrected result.
There is still a chance of abnormal fluctuations for individual pixels in images after inter-correction and continuity correction. Considering China’s growing population and economic level over the past 30 years, this paper assumes that the DN value of the bright image pixel in the next year should be non-inferior to the digital number of the corresponding pixel in the previous year. Based on this hypothesis, the time series continuity correction is performed on DMSP/OLS images, and the formula is as follows:
DN ( n 1 , i ) = DN ( n 1 , i ) , DN ( n 1 , i ) > DN ( n , i ) DN ( n , i ) , DN ( n 1 , i ) DN ( n , i )
where DN(n,i) and DN(n 1,i) represent the DN value from years n and n 1.

3.2.2. NPP/VIIRS Image Correction

The VIIRS instrument can provide more detailed descriptions of nighttime light with higher spatial resolution, and a more sensitive spectral response is available. Nevertheless, other background noises and short-lived light sources were also presented in the VIIRS image. For this reason, VIIRS noise removal is required prior to subsequent use. By referring to the previous studies, radiance values lower than 0.3 × 10⁻⁹ W·cm−2·sr−1 were regarded as noise and were assigned a value of 0 to eliminate the adverse effects of background noise [30]. Apart from this, logarithmic transformation was adopted to suppress the sharp changes in pixel values in the urban core area, which was necessary to maintain consistency in the numerical ranges between the NPP/VIIRS and DMSP/OLS images [31]. The formula is as follows:
VIIRS log = ln ( VIIRS + 1 )
where VIIRS represents the original radiance of the NPP/VIIRS image; VIIRSlog is the log-transformed radiance. In practical applications, it is adding constant 1 to VIIRS to avoid negative values.

3.2.3. Intercalibration of OLS and VIIRS

Nighttime light data from a single sensor cannot meet the requirements of long-term spatiotemporal distribution pattern analysis. Because of this, this study carried out intercalibration of DMSP/OLS and NPP/VIIRS. That is, based on the overlapped OLS and VIIRS nighttime light data in 2013, the logarithmic regression model was established and was subsequently used to correct VIIRS data from 2014 to 2021. The equation was shown as follows:
Y = a   ×   lg ( b   ×   X )
where Y is the pixel value of the VIIRS data converted to the DMSP scale, X is the pixel DN value of the VIIRS data, and a and b are the fitting parameters obtained by logarithmic regression.

3.3. City Status Indicators

3.3.1. Nighttime Light Index

Nighttime Light Indices (NLI) were calculated to reveal a particular region’s urban population distribution, economic scale, and urbanization level. The most frequently used NLI includes Total Nighttime Lights (TNL), Number of Lit Pixels (NLP), and Compound Nighttime Light Index (CNLI) [32]. The TNL refers to the sum of the gray values of all pixels in an administrative cell. The NLP refers to the total number of pixels with a digital number greater than a certain threshold on the light image, which is often used to extract urban built-up areas [33]. The CNLI is the product of the average nighttime light intensity (I) and the ratio of nighttime light to the area (S), where I and S are defined as the ratio of the TNL to the possible maximum light number and the ratio of NLP to the number of all pixels in an administrative unit, respectively. The equations are rendered thus:
TNL = i = DN min DN max DN i   ×   n i
NLP = NLP + 1 ( P i   >   T )   ( i = 1 ,   N )
CNLI = I   ×   S
I = TNL N L   ×   DN max
S = NLP N
where DNi is the gray value of the ith pixel, ni is the number of the gray level pixels, DNmin and DNmax are the minimum and maximum image gray levels, respectively; Pi is the gray value of the pixel, N is the total number of pixels, T is the threshold value used to extract a built-up area.

3.3.2. Urban Built-Up Area

Nighttime light images are composed of visibly distinct bright pixels in cities or towns and dark pixels in rural areas. Therefore, many scholars use different approaches to extract urban built-up areas from nighttime light images, such as the Markov random field model [34], machine learning methods represented by support vector machines (SVM) [35], and deep learning methods represented by convolutional neural networks (CNN) [36]. This study uses the watershed segmentation technique to extract urban built-up areas. The watershed algorithm considers the image as a topographic surface, where the local peak of light represents the watershed bottom, the decay of the radiance value ranging from the hotspot represents the watershed slope, and the local minimum radiance levels represents the watershed divide [37].

3.3.3. Urban Sprawl

The urban expansion rate and expansion intensity were used to obtain insight into urban sprawl characteristics quantumly. The urban expansion rate reflects the average annual growth rate of the urban built-up area within a specific time range by taking into account the urban built-up area at the initial time [38]. Another commonly used indicator, urban expansion intensity, is the proportion of the urban expansion area in the entire land area in a particular research period. It is often used to compare the intensity of urban spatial expansion in different research periods. The calculation formula is as follows:
S = A e     A s A s   ×   1 T
I = S a     S b TLA   ×   1 T
where S is the average annual urban expansion rate, As and Ae are the urban built-up areas in the former and later stages, respectively, and T is the length of the study period in years. I represents the urban expansion intensity, Sa and Sb are the areas of urban built-up areas in the early and late stages, and TLA is the total land area.

3.3.4. Center of Gravity

The urban gravity center is often used in the study of land-use type changes, urbanization process [39], population, and economic research. The relocation of the city gravity center means a change in the urban planning and development direction [40]. In this paper, the nighttime light brightness value is used as the weight to calculate the position of the gravity center of the study area. The formula is:
X = i = 1 N C DNi   ×   x i i = 1 N C DNi
Y = i = 1 N C DNi   ×   y i i = 1 N C DNi
D t = ( X t 1     X t 2 ) 2 + ( Y t 1 Y t 2 ) 2
θ t = arctan Y t 2     Y t 1 X t 2     X t 1
where X and Y are the horizontal and vertical positions of the city gravity center, respectively. CDNi is the gray value of the ith nighttime light pixel, and xi and yi represent the row and column number of the ith pixel. Dt is the gravity transfer distance between time t1 and t2, while θt is the transfer angle of city gravity.

4. Results

4.1. Accuracy Validation with GDP

The accuracy validation is an indispensable step for quantum remote sensing analysis. Previous research shows that night time light data can reflect the local economic development [15]. Therefore, the nighttime light data can also be validated with gross domestic product data to a certain extent. This research acquired the GDP data of Shaanxi Province from the past 30 years, where the XMA is administratively subordinated as reference data. The line chart and scatter plot between total nighttime light and GDP are shown in Figure 3a,b. As is shown in Figure 3a, the GDP and TNL have a good consistency. The determination coefficient between GDP and TNL reached 0.90. The validation results showed that the composited nighttime light data has a higher representativeness compared with previous research [41] and can satisfy the precision requirements of follow-up analysis.

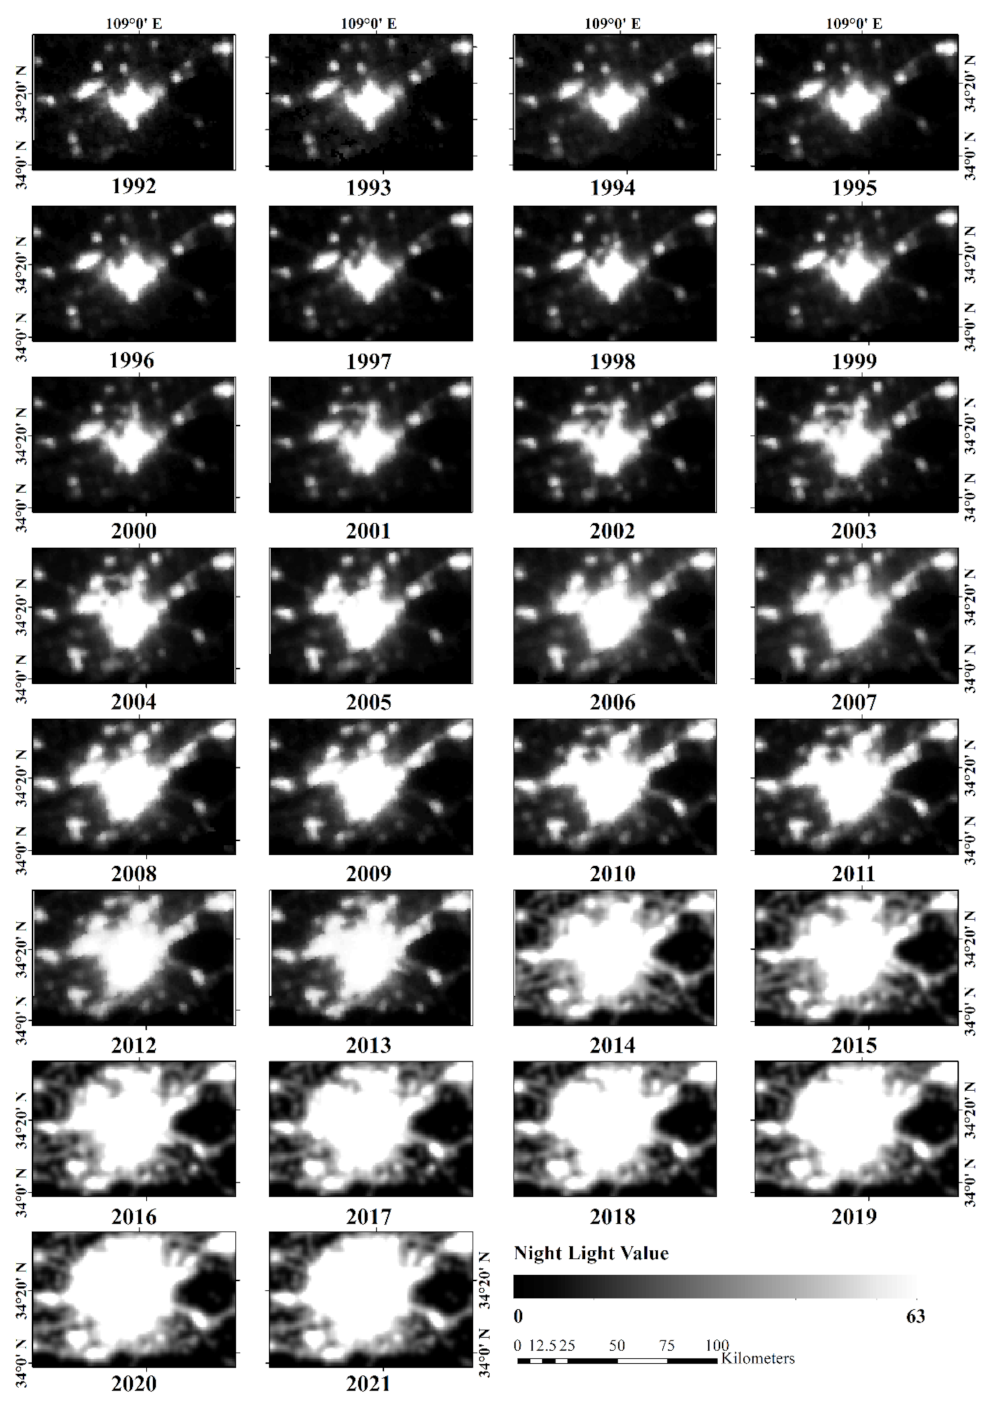
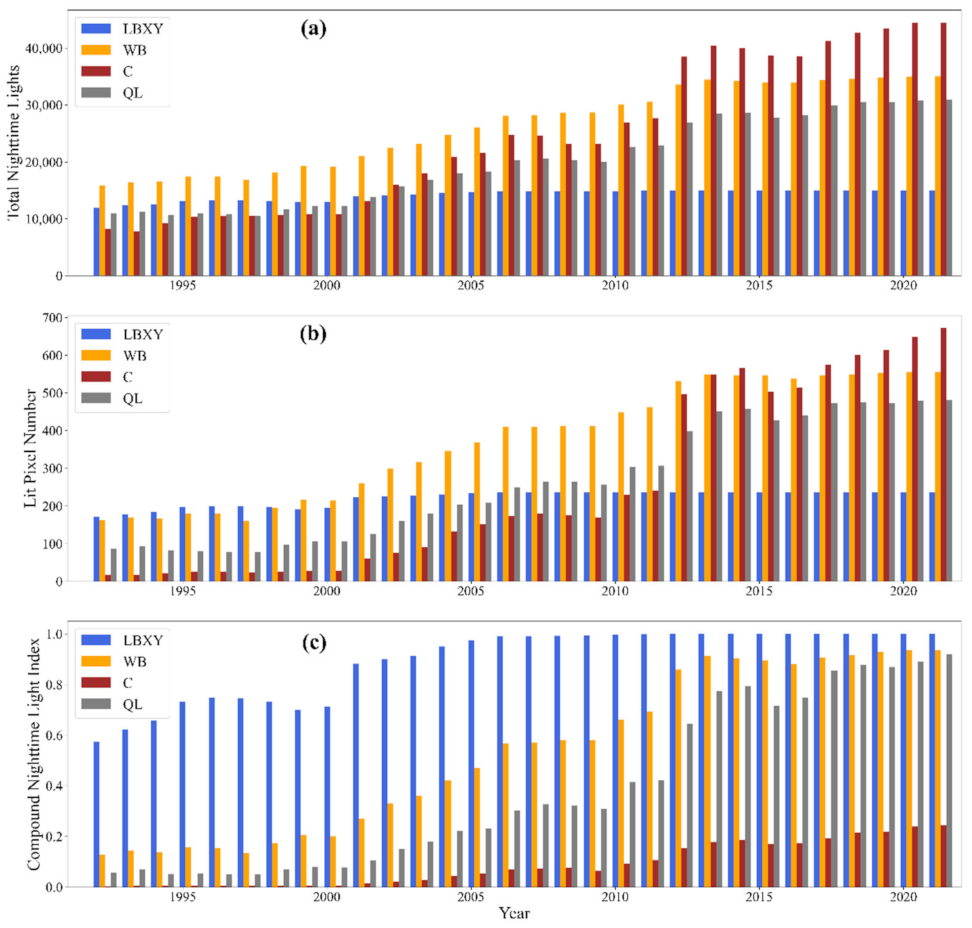
4.2. Spatial-Temporal Pattern of XMA

Figure 4 shows the spatial and temporal distribution and evolution of nighttime lights in XMA from 1992 to 2021. As is evident from the figure, the coverage and intensity of nighttime lights in the XMA increased at varying degrees over the last three decades. Specifically, spatial heterogeneity and collaborative development are seen in the fusion process between the old city of Xi’an and the main city of Xianyang.
Before 1997, the changes in urban nighttime light in the XMA mainly occurred at its periphery, where empty spaces still exist. After 1997, urban morphology showed pronounced expansion, reflecting the saturation of urban development space and the need for more space support.
Before 2000, the old city of Xi’an and the main city of Xianyang in the XMA were displayed as two separate bright patches in the nighttime light image, while the connection between the two adjacent cities became more and more close, exhibiting a tendency toward merging. It should be noted that the main urban area of Xianyang City has a higher expansion intensity in the direction adjacent to the old city of Xi’an than in the opposite.
Compared to the nighttime light brightness in 2012 and 2021, the urban area and the number of towns in the XMA headed by Xi’an have continuously increased in urbanization expansion. From 2008 to 2013, the built-up area of Xi’an expanded in all directions. In the five years from 2017 to 2021, the northern expansion of the entire city has tended to be obvious, which has also driven the development of the Gaoling District in the northern part of the main city.
Specifically, the area of the satellite cities around Xi’an has changed. The main urban area of Xi’an continues to expand to the west and south. In addition, the changes in the light intensity presented by the linear features reflect the closer connection between the central city and the satellite city. At the same time, the growth of some isolated urban areas is also relatively noticeable, and some are integrated due to the increasingly close connection.

4.3. Analysis of Nighttime Light Index

The nighttime light index reflects the regional economic level to a certain extent and also reflects the distribution of the urban population [42]. The XMA can be divided into four sectors according to the sequence of economic development and administrative divisions. That is, the old town of Xi’an City, composed of the comparatively developed Xincheng District, Beilin District, Lianhu District, and Yanta District (XBLY). Next, the Weiyang District and Baqiao District formed the second plate in the north and northeast directions (WB). Then, the Chang’an District, which surrounds the old city of Xi’an from the west and south; the last area is the Qindu District and Weicheng District in Xianyang City (QW).
Equations (6)–(10) can be used to calculate the three nighttime light indices of the four sectors mentioned above, respectively. As shown in Figure 5, as early as 1993, the XBLY area had completed the urbanization construction in main urban area, and the CNLI remained stable after 2002. During this period, the NLP of these four administrative districts changed little and tended to be stable, indicating that the coverage of the area was small and that the economic level reached a saturated state. With an improvement in the level of urban development, various urban construction activities have caused a large amount of land demand, and the construction land area obtained only by the transformation of existing urban areas can no longer meet their needs, resulting in the continuous expansion of urban built-up areas.
The regional TNL of the WB area in the northern part of the metropolitan area increased from 0.44 to 0.8 from 1992 to 2007, remained stable in the following four years, and continued to rise steadily from 2012 to 2020. However, the CNLI of the WB area was lower than that of the XBLY area, which may be related to the positioning of this area as a new eco-city area. The WB area includes a large area of ecological parks and focuses on the division of urban functions.
Before 2002, the CNLI value of Chang’an District remained below 0.2, and the level of economic development remained at a low level. As the administrative level of Chang’an District was upgraded from a county to a district in 2002, the CNLI index changed considerably. The overall intensity has continued to rise, surpassing the central city after 2002. However, by 2021, the CNLI value of Chang’an District will become 0.31, which is the lowest among the four plates. This may be because Chang’an District is large in coverage, but only the northern part of the main urban area is relatively well developed, and there is still a large expansion capacity for futural development.
Moreover, as a sub-center of the XMA, the QW area has a CNLI half of that of LBXY in 1992. The growth of the lighting index in the stage is undeniable, and the CNLI will reached a high level around 2018.

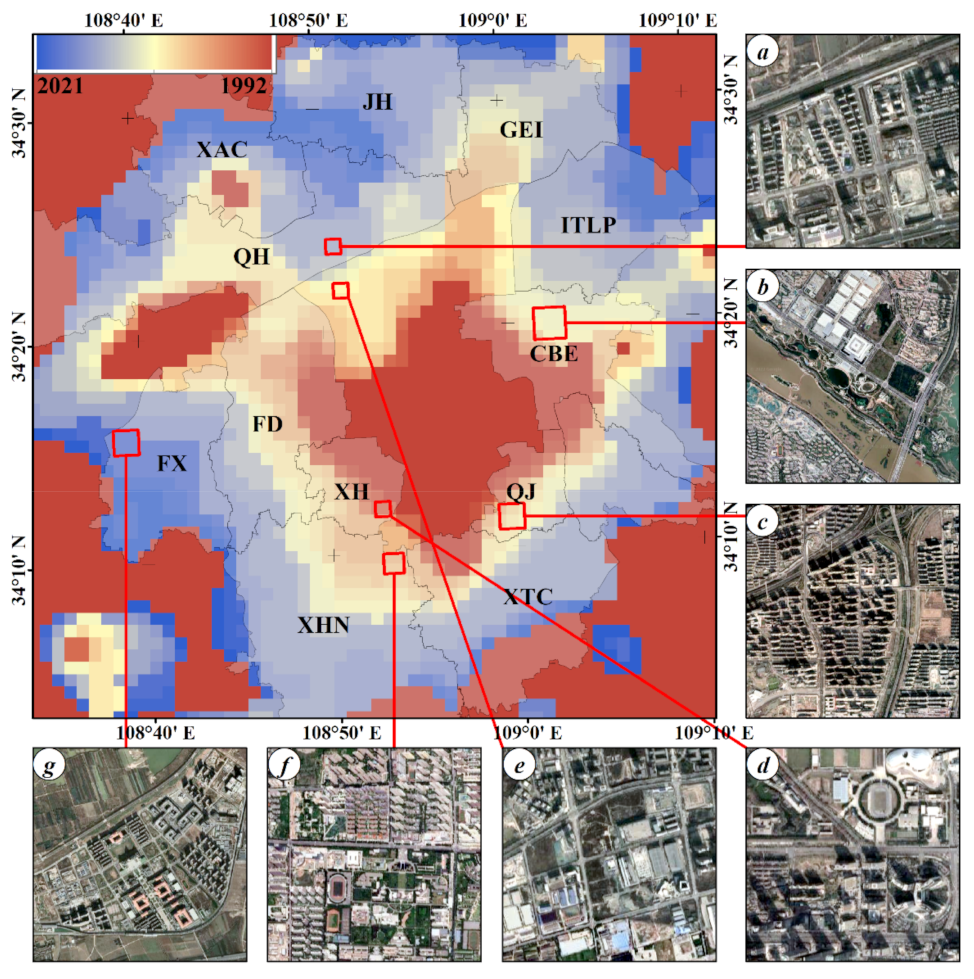
4.4. Built-Up Area Extraction of XMA

According to the extraction results of the built-up area, the built-up area shows the characteristic of a year by year increase in the whole level, which reflects that both the urban area and the number of towns in XMA have been increasing in the process of urbanization expansion. As shown in Figure 6, from 1992 to 2021, the main urban area of Xi’an expanded concentrically with the dual centers of the old city of Xi’an, with the main urban area of Xianyang as the core; however, the expansion patterns showed noticeable spatial differences in different periods. Specifically, the area of urban built-up areas before 1997 was less than 200 km2, and the expansion rate was relatively slow. Urban land expanded in all directions, with an average expansion rate of 12.9% and an expansion intensity of 2.6%. They were mainly concentrated around the two central urban areas, with little overall difference in all directions, showing a trend of spreading from the central urban areas to the surrounding areas.

4.5. Evolution of Nighttime Light Gravity Center in XMA

The migration of the nighttime light gravity center reflects the changes in the spatial distribution of the city economy. To describe the migration law of the nighttime light gravity center of XMA over the past 30 years, this paper obtains the latitude and longitude coordinates of the nighttime light gravity center by utilizing Equations (13) and (14) and harmonized nighttime light dataset and further calculates the migration distance and angle of the center of gravity. The obtained migration trajectory and location of the nighttime light gravity center of XMA from 1992 to 2021 are shown in Figure 7. From 1992 to 2021, the nighttime light gravity center of the XMA was stable and always remained within the Weiyang District. The nighttime light gravity center generally shifted south, from (108.915° E, 34.355° N) in 1992 to (108.922° E, 34.343° N) in 2021. Collectively, this process includes six stages, including one time to the southeast, two times to the northeast, and one time to the southwest.
In the first stage (1992–1997), the nighttime light gravity center moved towards the southeast, with an offset distance of 1300.9 m and an offset angle of −47.46°, which may be related to the construction of the Qujiang New Area in the southeast. In the second stage (1997–2000), from 1996 onwards, the nighttime light gravity center of the XMA continued to shift to the northeast, the migration distance was 1300 m, the average annual velocity was 325 m/a, and the included angle with the previous stage was 40°. The speed is approximately the same as the previous five years. In the third stage (2001–2005), the city center of gravity moved 45° to the southwest, which was opposite the migration direction of the previous stage. The included angle was as high as 180°, the migration distance was 1845 m, and the speed was distinctly higher than that of the previous two stages. During the fourth stage (2006–2011), the nighttime light gravity center moved to the northeast with a migration speed of 400 m/a, and the urban nighttime light gravity center remained nearly unchanged in 2009, 2010, and 2011, possibly due to the influence of the Xi’an International Trade & Logistics Park and ChanBa Ecological area (CBE). In the fifth stage (from 2012 to 2014), the nighttime light gravity center moved to the southwest, and the migration rate reached 550 m/a, which is greater than in the previous stages. In the sixth stage (2015–2021), the city’s center of gravity continued to move back and forth in the southwest and northeast directions, possibly because of the establishment of the Fengxi New City.
The change law of the nighttime light gravity center of the XMA in the past three decades shows that the XMA has diverse development directions in different time stages. Ultimately, the shift of the city’s nighttime light gravity center makes the development more balanced. In addition, the result also reflects the instability and volatility in the continuous expansion process of XMA, which urgently needs to be adjusted according to the scientific plan to finally achieve a coordinated development.

5. Discussion

5.1. Natural Environments around XMA

The digital elevation model of XMA is shown in Figure 8a, with an elevation of over 336 m. Based on the DEM data, the slope was derived in the ArcGIS software. According to the essential characteristics and experience of the landforms of the Loess Plateau in China, the topographic relief in the study area is divided into six types, which are plains (<20 m), platforms (20–75 m), hills (75–200 m), small rolling hills (200–500 m), middle undulating mountains (500–1000 m), and large undulating mountains (1000–2500 m).
It can be seen from Figure 4 and Figure 8a that the economic activities in the XMA mainly occur in the plains with small fluctuations and slopes. After 2011, the nighttime lights on the east side of the metropolitan area experienced very little change, and the light level was close to 0, while the nighttime light brightness in the northeast and southeast directions changed significantly, showing a trend of continuous expansion. The cause of this phenomenon is that the east side of the XMA is close to Mount Hongqing, where the surface elevation and slope are constantly rising, and where the landform has changed from plains to undulating mountains, which cannot be used for urban construction.
Topographical conditions across the XMA are certainly worth considering in the future developments. In Figure 8b, plain areas represented by the northern part of Xi’an and the southern part of Xianyang are conducive to urban expansion, as the steadily improved lighting level will become the core area for further urbanization in the future; the southern side of the XMA is the northern foot of the Qinling Mountains, and the terrain is gradually raised. Most areas within the Qinling Mountains Nature Reserve cannot be developed and utilized. On the north side is the Loess Plateau, and the natural environment is fragile; moreover, it is necessary to strengthen ecological protection continuously (Figure 8c). Therefore, it is not suitable to carry out large-scale urban construction in the north–south direction. The southern and northern parts of the XMA are limited by terrain, and the development space is limited. There is ample development space in the west and northeast. Therefore, in the future, the urbanization construction in the northeast–southwest direction will be the main development direction of the XMA.
As shown in Figure 8d, the Guanzhong Plain has a dense river network and an evident uneven spatial and temporal distribution of runoff, which provides the XMA with abundant water resources to meet the needs of the growing population. Among them, the Weihe River is important in the plain. The north side is the main urban area of Xianyang City, and the south side is the old city area of Xi’an City, which has a significant isolation effect on the continuity of night lighting in the XMA. To further promote the coordinated development of the XMA, it is necessary to establish convenient transportation conditions to enable the Weihe River to become the city river in the metropolitan area so as to realize the barrier-free flow of people and logistics in the XMA. At present, Xi’an’s urban area ranks 16th in China’s urban area, with a total area of 10,752 km2. More rational urban planning is needed. Otherwise, the XMA’s further development will be limited by space, resulting in the waste of investment and slowing down the speed of urbanization.

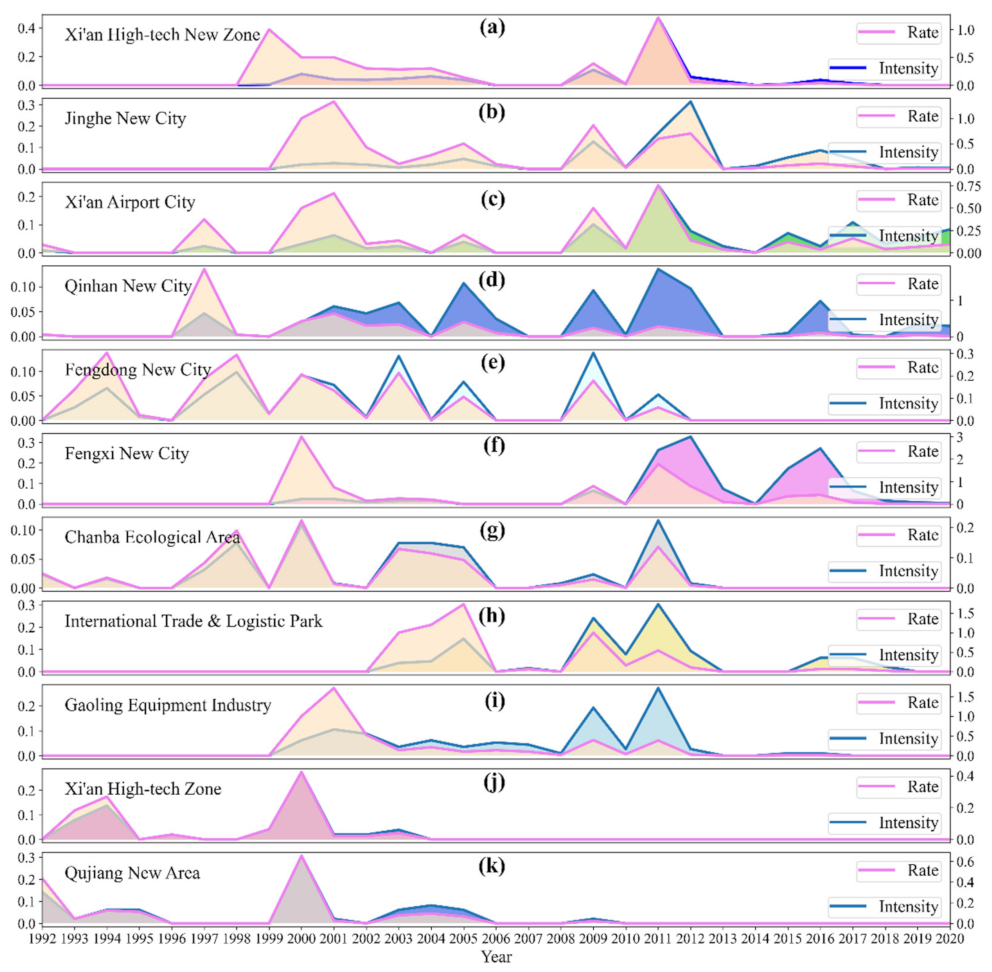
5.2. City Expansion and Development Policy

The expansion of XMA is accompanied by the setup of development zones. Due to the support of various preferential policies from the central and local governments, the excellent infrastructure and service facilities promote the migration of enterprises and population; therefore, the urban expansion is relatively rapid, resulting in the accumulation of population and resources around the government, enhancing economic, cultural, social, and other factors.
In the 1990s, Xi’an setup the Xi’an High-tech Zone (XHZ) in the south direction, and the expansion rate and intensity was 0.2 and 0.18, respectively (Figure 9j). At the same time, the Xi’an Economic and Technological Development Zone (XETD) was established in the north direction in September 1998. It consists of four functional parks, namely the central area, export processing zone, Jingwei New Town, and Caotan Eco-Industrial Park, with a planned total area of 71 km2. It has an expansion rate and intensity at or beyond 0.2 and 0.1, and its expansion was not finished until 2014. In 2003, the Qujiang New Area (QNA), located in the southeast of Xi’an, was officially established, and the real estate industry and cultural tourism developed rapidly (Figure 9k). From 2000 to 2006, the speed of urban construction accelerated. The urban built-up area expanded by 1000 km2 at this stage, and the urban spatial expansion rate and urban expansion intensity were 20% and 0.03, respectively.
At the location shown in Figure 6b, the Chanhe and Bahe rivers on the east side of XMA are relatively wide and are natural wetlands, which is more suitable for ecological protection and the establishment of parks. Therefore, the ChanBa Ecological Zone (CBE) and adjacent International Trade & Logistic Park (ITLP) in the northeast direction was formally established in 2004, which has developed many modern high-end service industries such as finance and commerce, tourism and leisure, conferences and exhibitions, culture and education, and ecological living environment industries. The expansion rate and intensity of CBE and ITLP was depicted in Figure 9g,h.
In Figure 6g, from 1997 to 2000, the Xi’an High-tech Industrial Development Zone (XHIDZ) was approved to be the state-level, high-tech zones by the State Council in March 1991. It is located in the south of the XMA and has an expansion rate of 13% (Figure 9a). This development zone has three leading industries, namely -the manufacturing industry with automobiles and biomedicine and the modern service industry.
In 2002, the government of Shaanxi Province proposed the conception of the integration development of Xi’an and Xianyang. After this, the barrier of the administrative zone was broken, and the Fengdong New City, Fengxi New City, and the Qinhan New City of the Xixian New Area (in Figure 6g), located between the southern part of built-up areas of Xi’an and Xianyang, achieved large-scale development sequentially or simultaneously (in Figure 9e,f). In the north part of the XMA are the Jinghe New City and the Xi’an Airport City, and both have developed at a remarkable speed (Figure 9b,c).
In general, the expansion of built-up areas in the XMA presents prominent spatial differentiation characteristics. The urban built-up area expansion of the XMA is attributed to development policy. Places with policy support will achieve rapid expansion within a few years, showing the advantages of unified planning and strong government. So far, as the XMA took full advantage of its policy and natural environment, a new regional development pattern was formed. That is, the central region is the administrative center. The northeast area is dominated by ecological areas, while the south and southeast are mainly composed of development zones and tourism areas. The expansion of the XMA is subject to the dual impacts of policy and the natural environment; therefore, the effectiveness of urban planning policies offers even more beneficial effects, since the environment is the material and ecological base of human development.

5.3. Comparisons with Traditional Research

In the study of urban spatial-temporal pattern evolution, the generally used geospatial data include land cover data, the Normalized Difference Built-up Index (NDBI) [43], the Index-Based Built-up Index (IBI), impervious surface area (ISA) [44], and point of interest data. Within the context of the integration of the regional economy, this research selected the Xi’an Metropolitan Area as its research area, while the previous research was limited by the administration boundaries [45]. Land-use types change data, and historical maps cannot depict socioeconomic activity information [46]. The natural environment of the XMA, represented by topography, including elevation and slope and the river network, showed significantly negative effects on the expansion, which is consistent with the results acquired by wang et al. [47].

5.4. Shortage and Prospects

To obtain the nighttime light data of a more extended time series, the VIIRS nighttime light data with the higher spatial resolution is reduced to the spatial and spectral range of the DMSP data, and the spatial information of the VIIRS is lost. For this reason, if the DMSP data can be processed into VIIRS data, the analysis accuracy will be significantly improved. Given the article’s main objectives, a more quantitative discussion is left for future work. Apart from the surface elevation, slope, terrain, river network, and city expansion policy, the road traffic construction and Point of Interest (POI) data of public service facilities are also worth consideration and will be the future research directions.

6. Conclusions

Long time-series nighttime light image data provide a data source for the study of large-scale spatial urbanization and human activity monitoring. This study calibrated and fitted two kinds of nighttime light data, DMSP/OLS and NPP/VIIRS, and obtained long-term nighttime light data, which laid a data foundation for the monitoring of the spatiotemporal evolution of urban agglomeration patterns.
Based on the long-term nighttime light remote sensing data after consistency correction, the dynamic threshold method is used to extract urban built-up areas. The urban expansion intensity varies in different stages. The stage with the highest expansion intensity occurred between 2010 and 2015, and the expansion rate slowed down slightly in the past five years. From a spatial point of view, the XMA mainly expands to the south, southeast, northeast, and southwest.
From the analysis of the urbanization process of the XMA from 1992 to 2021 based on the light index, the urban development level of the XMA is spatially unbalanced. High level, the southern and northern regions are in a state of continuous development, and the overall urbanization level is constantly improving.
The expansion is mainly due to government policy support, economies of scale and space spillovers brought about by the integration of urban functional areas, and the impact of foreign investment on the regional economy. In terms of nighttime lighting distribution, the nighttime lighting distribution in the Xi’an Metropolitan Area is closely related to the natural environment, and the southwest and northeast directions will be the leading development and construction directions in the future. The center of gravity of the Xi’an metropolitan area calculated according to the night lights is relatively stable and always located within Weiyang District, with small inter-annual changes and maintaining the same direction of movement within a certain period.
Using the 30-year-old nighttime light dataset to analyze the spatial–temporal pattern of the XMA reveals the expansion status and possible limiting factors in different periods and different spatial locations, thereby reflecting human social and economic activities. Mastering the development characteristics of the Xi’an metropolitan area can provide a reference for constructing a scientific and reasonable urban system and optimizing the regional urban spatial development pattern.

Author Contributions

Conceptualization, S.L.; data curation, S.L.; methodology, S.L.; software, S.L.; formal analysis, S.L.; funding acquisition, M.Z.; investigation, S.L.; supervision, X.L. and M.Z.; validation, S.L.; visualization, S.L.; writing—original draft, S.L.; writing—review & editing, M.Z. All authors have read and agreed to the published version of the manuscript.

Funding

This work was supported in part by the National Natural Science Foundation of China under Grant 41871315 and in part by the Key Research and Development Program of Shaanxi Province (China) under Grant 2020SF-434.

Institutional Review Board Statement

Not applicable.

Informed Consent Statement

Not applicable.

Data Availability Statement

Not applicable.

Acknowledgments

The authors sincerely thank the anonymous reviewers for their constructive comments and suggestions. In addition, special thanks should be given to Zhaolin Gu, Executive Vice-President of the School of Human Settlements and Civil Engineering, for his inspiration and deep understanding of the human settlements in Xi’an city.

Conflicts of Interest

The authors declare no conflict of interest.

References

  1. Chen, M.; Liu, W.; Lu, D. Challenges and the way forward in China’s new-type urbanization. Land Use Policy 2016, 55, 334–339. [Google Scholar] [CrossRef]
  2. Su, S.; Liu, Z.; Xu, Y.; Li, J.; Pi, J.; Weng, M. China’s megaregion policy: Performance evaluation framework, empirical findings and implications for spatial polycentric governance. Land Use Policy 2017, 63, 1–19. [Google Scholar] [CrossRef]
  3. Halder, B.; Bandyopadhyay, J. Evaluating the impact of climate change on urban environment using geospatial technologies in the planning area of Bilaspur, India. Environ. Chall. 2021, 5, 100286. [Google Scholar] [CrossRef]
  4. Liu, F.; Zhang, Z.; Zhao, X.; Wang, X.; Zuo, L.; Wen, Q.; Yi, L.; Xu, J.; Hu, S.; Liu, B. Chinese cropland losses due to urban expansion in the past four decades. Sci. Total Environ. 2019, 650, 847–857. [Google Scholar] [CrossRef]
  5. Yan, Y.; Wu, C.; Wen, Y. Determining the impacts of climate change and urban expansion on net primary productivity using the spatio-temporal fusion of remote sensing data. Ecol. Indic. 2021, 127, 107737. [Google Scholar] [CrossRef]
  6. Agarwal, M.; Tandon, A. Modeling of the urban heat island in the form of mesoscale wind and of its effect on air pollution dispersal. Appl. Math. Model. 2010, 34, 2520–2530. [Google Scholar] [CrossRef]
  7. Bao, C.; He, D. Scenario Modeling of Urbanization Development and Water Scarcity Based on System Dynamics: A Case Study of Beijing-Tianjin-Hebei Urban Agglomeration, China. Int. J. Environ. Res. Public Health 2019, 16, 3834. [Google Scholar] [CrossRef] [Green Version]
  8. Wang, S.; Gao, S.; Li, S.; Feng, K. Strategizing the relation between urbanization and air pollution: Empirical evidence from global countries. J. Clean. Prod. 2020, 243, 118615. [Google Scholar] [CrossRef]
  9. Kadhim, N.; Mourshed, M.; Bray, M. Advances in remote sensing applications for urban sustainability. Euro-Mediterr. J. Environ. Integr. 2016, 1, 7. [Google Scholar] [CrossRef] [Green Version]
  10. Xie, Y.; Weng, Q. Updating urban extents with nighttime light imagery by using an object-based thresholding method. Remote Sens. Environ. 2016, 187, 1–13. [Google Scholar] [CrossRef]
  11. Pesaresi, M.; Huadong, G.; Blaes, X.; Ehrlich, D.; Ferri, S.; Gueguen, L.; Halkia, M.; Kauffmann, M.; Kemper, T.; Lu, L.; et al. A Global Human Settlement Layer from Optical HR/VHR RS Data: Concept and First Results. IEEE J. Sel. Top. Appl. Earth Obs. Remote Sens. 2013, 6, 2102–2131. [Google Scholar] [CrossRef]
  12. Cauwels, P.; Pestalozzi, N.; Sornette, D. Dynamics and spatial distribution of global nighttime lights. EPJ Data Sci. 2014, 3, 2. [Google Scholar] [CrossRef] [Green Version]
  13. Yanhua, X.; Qihao, W.; Anthea, W. A comparative study of NPP-VIIRS and DMSP-OLS nighttime light imagery for derivation of urban demographic metrics. In Proceedings of the 2014 Third International Workshop on Earth Observation and Remote Sensing Applications (EORSA), Changsha, China, 11–14 June 2014; pp. 335–339. [Google Scholar]
  14. Frolking, S.; Milliman, T.; Seto, K.C.; Friedl, M.A. A global fingerprint of macro-scale changes in urban structure from 1999 to 2009. Environ. Res. Lett. 2013, 8, 024004. [Google Scholar] [CrossRef]
  15. Sutton, P.; Elvidge, C.; Tilottama, G. Estimation of Gross Domestic Product at Sub-National Scales Using Nighttime Satellite Imagery. Int. J. Ecol. Econ. Stat. 2007, 8, 5–21. [Google Scholar]
  16. Elvidge, C.; Baugh, K.; Anderson, S.; Sutton, P.; Tilottama, G. The Night Light Development Index (NLDI): A spatially explicit measure of human development from satellite data. Soc. Geogr. 2012, 7, 23–35. [Google Scholar] [CrossRef]
  17. Xin, X.; Liu, B.; Di, K.; Zhu, Z.; Zhao, Z.; Liu, J.; Yue, Z.; Zhang, G. Monitoring urban expansion using time series of night-time light data: A case study in Wuhan, China. Int. J. Remote Sens. 2017, 38, 6110–6128. [Google Scholar] [CrossRef]
  18. Chen, J.; Wei, H.; Li, N.; Chen, S.; Qu, W.; Zhang, Y. Exploring the Spatial-Temporal Dynamics of the Yangtze River Delta Urban Agglomeration Based on Night-Time Light Remote Sensing Technology. IEEE J. Sel. Top. Appl. Earth Obs. Remote Sens. 2020, 13, 5369–5383. [Google Scholar] [CrossRef]
  19. Liu, Z.; He, C.; Zhang, Q.; Huang, Q.; Yang, Y. Extracting the dynamics of urban expansion in China using DMSP-OLS nighttime light data from 1992 to 2008. Landsc. Urban Plan. 2012, 106, 62–72. [Google Scholar] [CrossRef]
  20. Zhang, Q.; Seto, K.C. Mapping urbanization dynamics at regional and global scales using multi-temporal DMSP/OLS nighttime light data. Remote Sens. Environ. 2011, 115, 2320–2329. [Google Scholar] [CrossRef]
  21. Niu, W.; Xia, H.; Wang, R.; Pan, L.; Meng, Q.; Qin, Y.; Li, R.; Zhao, X.; Bian, X.; Zhao, W. Research on Large-Scale Urban Shrinkage and Expansion in the Yellow River Affected Area Using Night Light Data. ISPRS Int. J. Geo-Inf. 2021, 10, 5. [Google Scholar] [CrossRef]
  22. Jaros, K.A. Forging Greater Xi’an: The Political Logic of Metropolitanization. Mod. China 2015, 42, 638–673. [Google Scholar] [CrossRef]
  23. Dijkstra, L.; Poelman, H.; Veneri, P. The EU-OECD Definition of a Functional Urban Area; OECD Publishing: Berlin, Germany, 2019. [Google Scholar] [CrossRef]
  24. Wang, Z.F. The Relationship Between Land Use, Land Cover Change and the Heat Island Effect in Xi’an City, China. Appl. Ecol. Environ. Res. 2019, 17, 7795–7806. [Google Scholar] [CrossRef]
  25. Elvidge, C.D.; Imhoff, M.L.; Baugh, K.E.; Hobson, V.R.; Nelson, I.; Safran, J.; Dietz, J.B.; Tuttle, B.T. Night-time lights of the world: 1994–1995. ISPRS J. Photogramm. Remote Sens. 2001, 56, 81–99. [Google Scholar] [CrossRef]
  26. Román, M.O.; Wang, Z.; Sun, Q.; Kalb, V.; Miller, S.D.; Molthan, A.; Schultz, L.; Bell, J.; Stokes, E.C.; Pandey, B.; et al. NASA’s Black Marble nighttime lights product suite. Remote Sens. Environ. 2018, 210, 113–143. [Google Scholar] [CrossRef]
  27. Bamler, R. The SRTM mission: A world-wide 30 m resolution DEM from SAR interferometry in 11 days. Photogramm. Week 1999, 1999, 145–154. [Google Scholar]
  28. Huang, X.; Shi, K.; Cui, Y.; Li, Y. A Saturated Light Correction Method for DMSP-OLS Nighttime Stable Light Data by Remote and Social Sensing Data. IEEE J. Sel. Top. Appl. Earth Obs. Remote Sens. 2021, 14, 1885–1894. [Google Scholar] [CrossRef]
  29. Jiang, L.; Liu, Y.; Wu, S.; Yang, C. Study on Urban Spatial Pattern Based on DMSP/OLS and NPP/VIIRS in Democratic People’s Republic of Korea. Remote Sens. 2021, 13, 4879. [Google Scholar] [CrossRef]
  30. Zhao, M.; Zhou, Y.; Li, X.; Zhou, C.; Cheng, W.; Li, M.; Huang, K. Building a Series of Consistent Night-Time Light Data (1992–2018) in Southeast Asia by Integrating DMSP-OLS and NPP-VIIRS. IEEE Trans. Geosci. Remote Sens. 2020, 58, 1843–1856. [Google Scholar] [CrossRef]
  31. Yu, B.; Tang, M.; Wu, Q.; Yang, C.; Deng, S.; Shi, K.; Peng, C.; Wu, J.; Chen, Z. Urban Built-Up Area Extraction from Log-Transformed NPP-VIIRS Nighttime Light Composite Data. IEEE Geosci. Remote Sens. Lett. 2018, 15, 1279–1283. [Google Scholar] [CrossRef]
  32. Gao, B.; Huang, Q.; He, C.; Ma, Q. Dynamics of Urbanization Levels in China from 1992 to 2012: Perspective from DMSP/OLS Nighttime Light Data. Remote Sens. 2015, 7, 1721–1735. [Google Scholar] [CrossRef] [Green Version]
  33. Levin, N.; Kyba, C.C.M.; Zhang, Q.; Sánchez de Miguel, A.; Román, M.O.; Li, X.; Portnov, B.A.; Molthan, A.L.; Jechow, A.; Miller, S.D.; et al. Remote sensing of night lights: A review and an outlook for the future. Remote Sens. Environ. 2020, 237, 111443. [Google Scholar] [CrossRef]
  34. Chen, Z.; Yu, B.; Zhou, Y.; Liu, H.; Yang, C.; Shi, K.; Wu, J. Mapping Global Urban Areas From 2000 to 2012 Using Time-Series Nighttime Light Data and MODIS Products. IEEE J. Sel. Top. Appl. Earth Obs. Remote Sens. 2019, 12, 1143–1153. [Google Scholar] [CrossRef]
  35. Cao, X.; Chen, J.; Imura, H.; Higashi, O. A SVM-based method to extract urban areas from DMSP-OLS and SPOT VGT data. Remote Sens. Environ. 2009, 113, 2205–2209. [Google Scholar] [CrossRef]
  36. He, C.; Liu, Z.; Gou, S.; Zhang, Q.; Zhang, J.; Xu, L. Detecting global urban expansion over the last three decades using a fully convolutional network. Environ. Res. Lett. 2019, 14, 034008. [Google Scholar] [CrossRef]
  37. Da Rocha Bragion, G.; Oliveira, G.; Miguel, A.; Monteiro, A.; Körting, T.; Amaral, S. The Watershed Segmentation Approach for VIIRS Night-Time Data. In Proceedings of the IX Brazilian Symposium on Remote Sensing, São Paulo, Brazil, 14–17 April 2020. [Google Scholar]
  38. Liu, J.; Zhang, Q.; Hu, Y. Regional differences of China’s urban expansion from late 20th to early 21st century based on remote sensing information. Chin. Geogr. Sci. 2012, 22, 1–14. [Google Scholar] [CrossRef]
  39. Siewwuttanagul, S.; Inohae, T.; Mishima, N. An Investigation of Urban Gravity to Develop a Better Understanding of the Urbanization Phenomenon Using Centrality Analysis on GIS Platform. Procedia Environ. Sci. 2016, 36, 191–198. [Google Scholar] [CrossRef] [Green Version]
  40. Zhang, B.; Li, J.; Wang, M.; Duan, P.; Li, C. Using DMSP/OLS and NPP/VIIRS Images to Analyze the Expansion of 21 Urban Agglomerations in Mainland China. J. Urban Plan. Dev. 2021, 147, 04021024. [Google Scholar] [CrossRef]
  41. Zhang, Q.; Pandey, B.; Seto, K.C. A Robust Method to Generate a Consistent Time Series From DMSP/OLS Nighttime Light Data. IEEE Trans. Geosci. Remote Sens. 2016, 54, 5821–5831. [Google Scholar] [CrossRef]
  42. Jing, W.; Yang, Y.; Yue, X.; Zhao, X. Mapping urban areas with integration of DMSP/OLS nighttime light and MODIS data using machine learning techniques. Remote Sens. 2015, 7, 12419–12439. [Google Scholar] [CrossRef] [Green Version]
  43. Liu, K.; Su, H.; Zhang, L.; Yang, H.; Zhang, R.; Li, X. Analysis of the Urban Heat Island Effect in Shijiazhuang, China Using Satellite and Airborne Data. Remote Sens. 2015, 7, 4804–4833. [Google Scholar] [CrossRef] [Green Version]
  44. Liu, K.; Su, H.; Li, X.; Wang, W.; Yang, L.; Liang, H. Quantifying Spatial–Temporal Pattern of Urban Heat Island in Beijing: An Improved Assessment Using Land Surface Temperature (LST) Time Series Observations From LANDSAT, MODIS, and Chinese New Satellite GaoFen-1. IEEE J. Sel. Top. Appl. Earth Obs. Remote Sens. 2016, 9, 2028–2042. [Google Scholar] [CrossRef]
  45. Ullah, M.; Li, J.; Wadood, B. Analysis of Urban Expansion and its Impacts on Land Surface Temperature and Vegetation Using RS and GIS, A Case Study in Xi’an City, China. Earth Syst. Environ. 2020, 4, 583–597. [Google Scholar] [CrossRef]
  46. Wang, F.; Gu, N. Exploring the spatio-temporal characteristics and driving factors of urban expansion in Xi’an during 1930–2014. Int. J. Urban Sci. 2022, 1–26. [Google Scholar] [CrossRef]
  47. Wang, X.; Xiao, F.; Zhang, Y.; Yin, L.; Lesi, M.; Guo, B.; Zhao, Y. Thirty-year expansion of construction land in Xi’an: Spatial pattern and potential driving factors. Geol. J. 2018, 53, 309–321. [Google Scholar] [CrossRef]
Figure 1. Location of Xi’an metropolitan area. The inset map shows the location of XMA in Shaanxi province. The red box represents the scope of XMA.
Sustainability 14 09747 g001
Figure 2. Flowchart of data processing and research methods.
Sustainability 14 09747 g002
Figure 3. The comparation between total nighttime light and gross domestic product. (a) is the line chart between TNL and GDP; (b) is the scatter plot between TNL and GDP.
Sustainability 14 09747 g003
Figure 4. Time series composited nighttime light images of XMA from 1992 to 2021.
Sustainability 14 09747 g004
Figure 5. Histogram of nighttime light index changes from 1992 to 2021 ((a) is the TNL index, (b) is the NLP index, (c) is the CNLI).
Sustainability 14 09747 g005
Figure 6. Plot of urban built-up area extraction results in XMA. Note: subfigures (ag) represent the status of real surface construction.
Sustainability 14 09747 g006
Figure 7. The left figure shows the movement trajectory of the center of gravity of XMA from 1992 to 2021, while the right inset shows the location of the enlarged map within XMA. The asterisk represents the location of the center of gravity of XMA at a certain year.
Sustainability 14 09747 g007
Figure 8. The natural environment around Xi’an metropolitan area ((a) is the DEM, (b) is the topographic feature, (c) is the slope, (d) is the river network distribution). The gray circle demonstrated the location of XMA.
Sustainability 14 09747 g008
Figure 9. The expansion rate and intensity of development zones in the Xi’an metropolitan area. (ak) are the expansion rate and expansion intensity of different development zones in XMA.
Sustainability 14 09747 g009
Table 1. DMSP/OLS and 2012–2021 NPP/VIIRS nighttime light images.
YearF10F12F14F15F16F18NPP
1992F101992------
1993F101993------
1994F101994F121994-----
1995-F121995-----
1996-F121996-----
1997-F121997F141997----
1998-F121998F141998----
1999-F121999F141999----
2000--F142000F152000---
2001--F142001F152001---
2002--F142002F152002---
2003- F142003F152003---
2004---F152004F162004--
2005---F152005F162005--
2006---F152006F162006--
2007---F152007F162007--
2008----F162008--
2009----F162009--
2010-----F182010-
2011-----F182011-
2012-----F182012SVDNB2012
2013-----F182013SVDNB2013
2014------SVDNB2014
2015------SVDNB2015
2016------SVDNB2016
2017------SVDNB2017
2018------SVDNB2018
2019------SVDNB2019
2020------SVDNB2020
2021------SVDNB2021
Publisher’s Note: MDPI stays neutral with regard to jurisdictional claims in published maps and institutional affiliations.

