Vision Transformer for Detecting Critical Situations and Extracting Functional Scenario for Automated Vehicle Safety Assessment


Abstract
:1. Introduction
2. Related Work
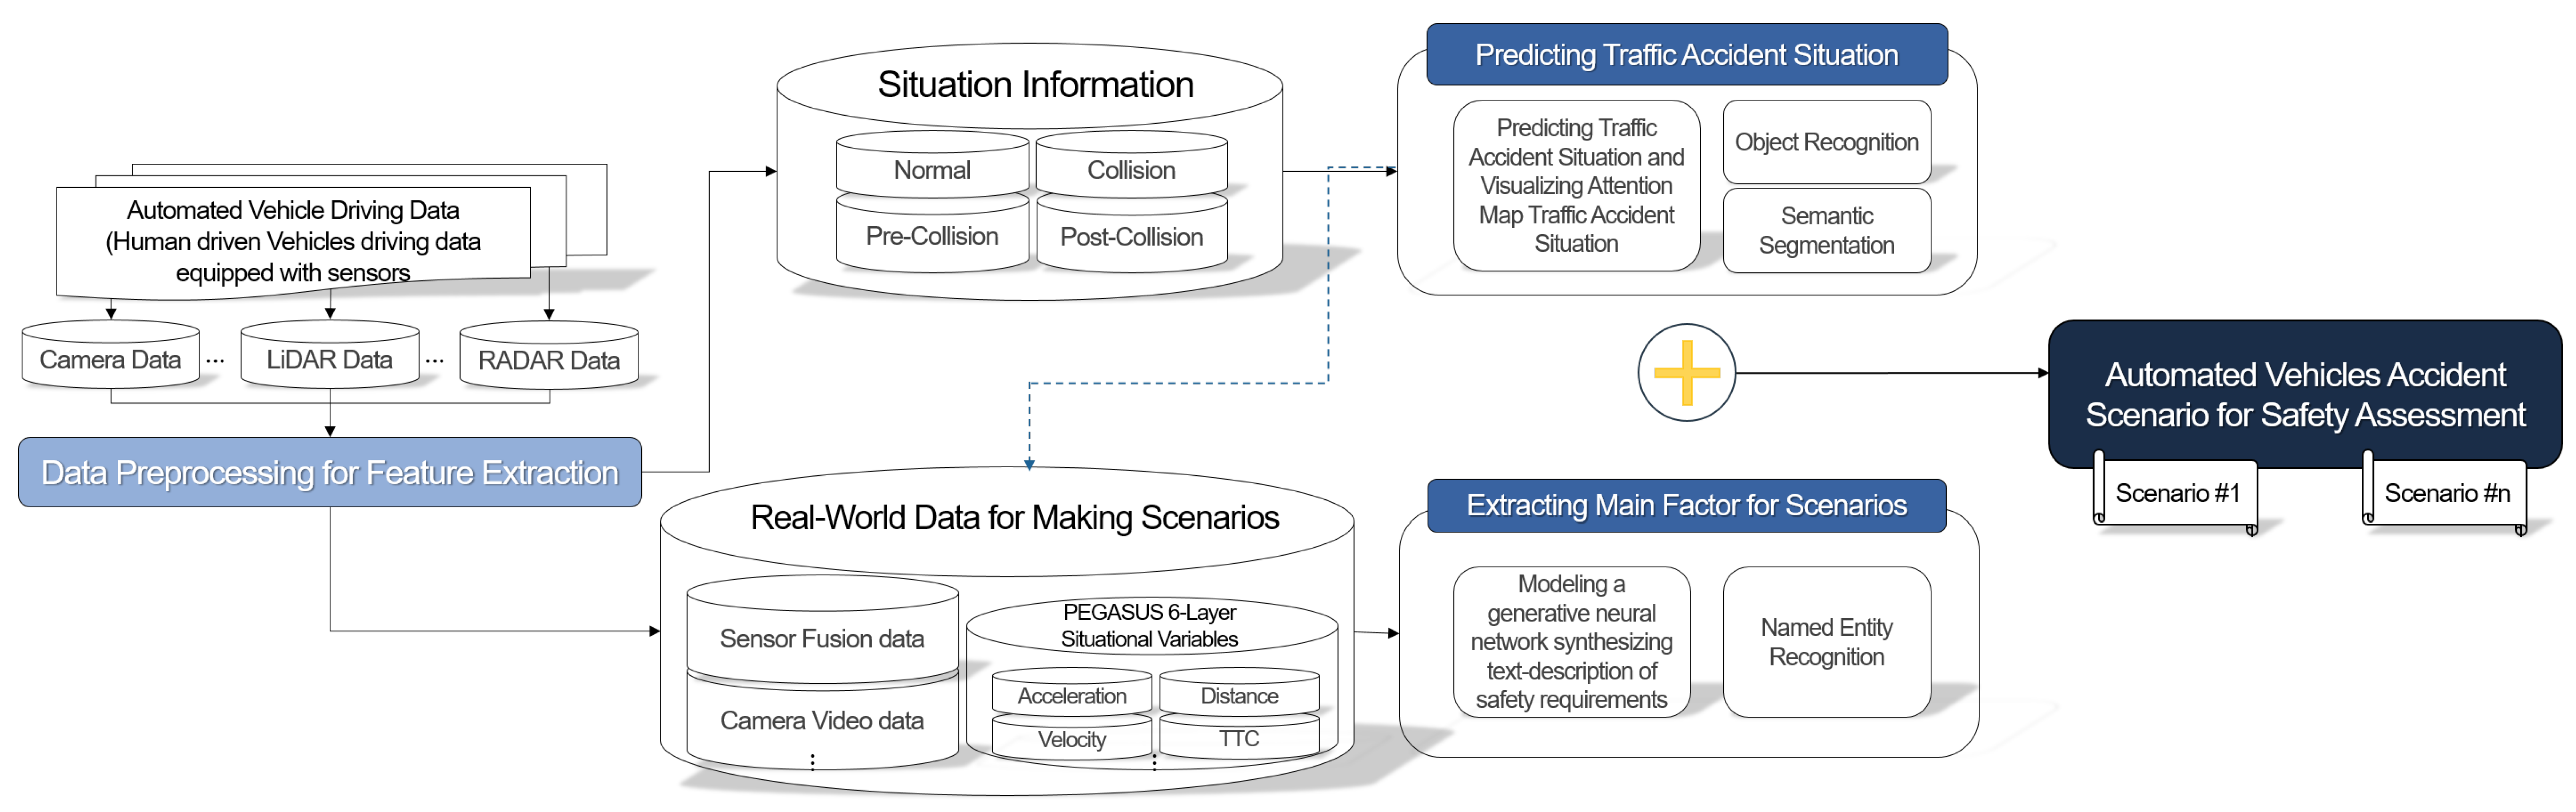
3. Methodology
3.1. Dataset
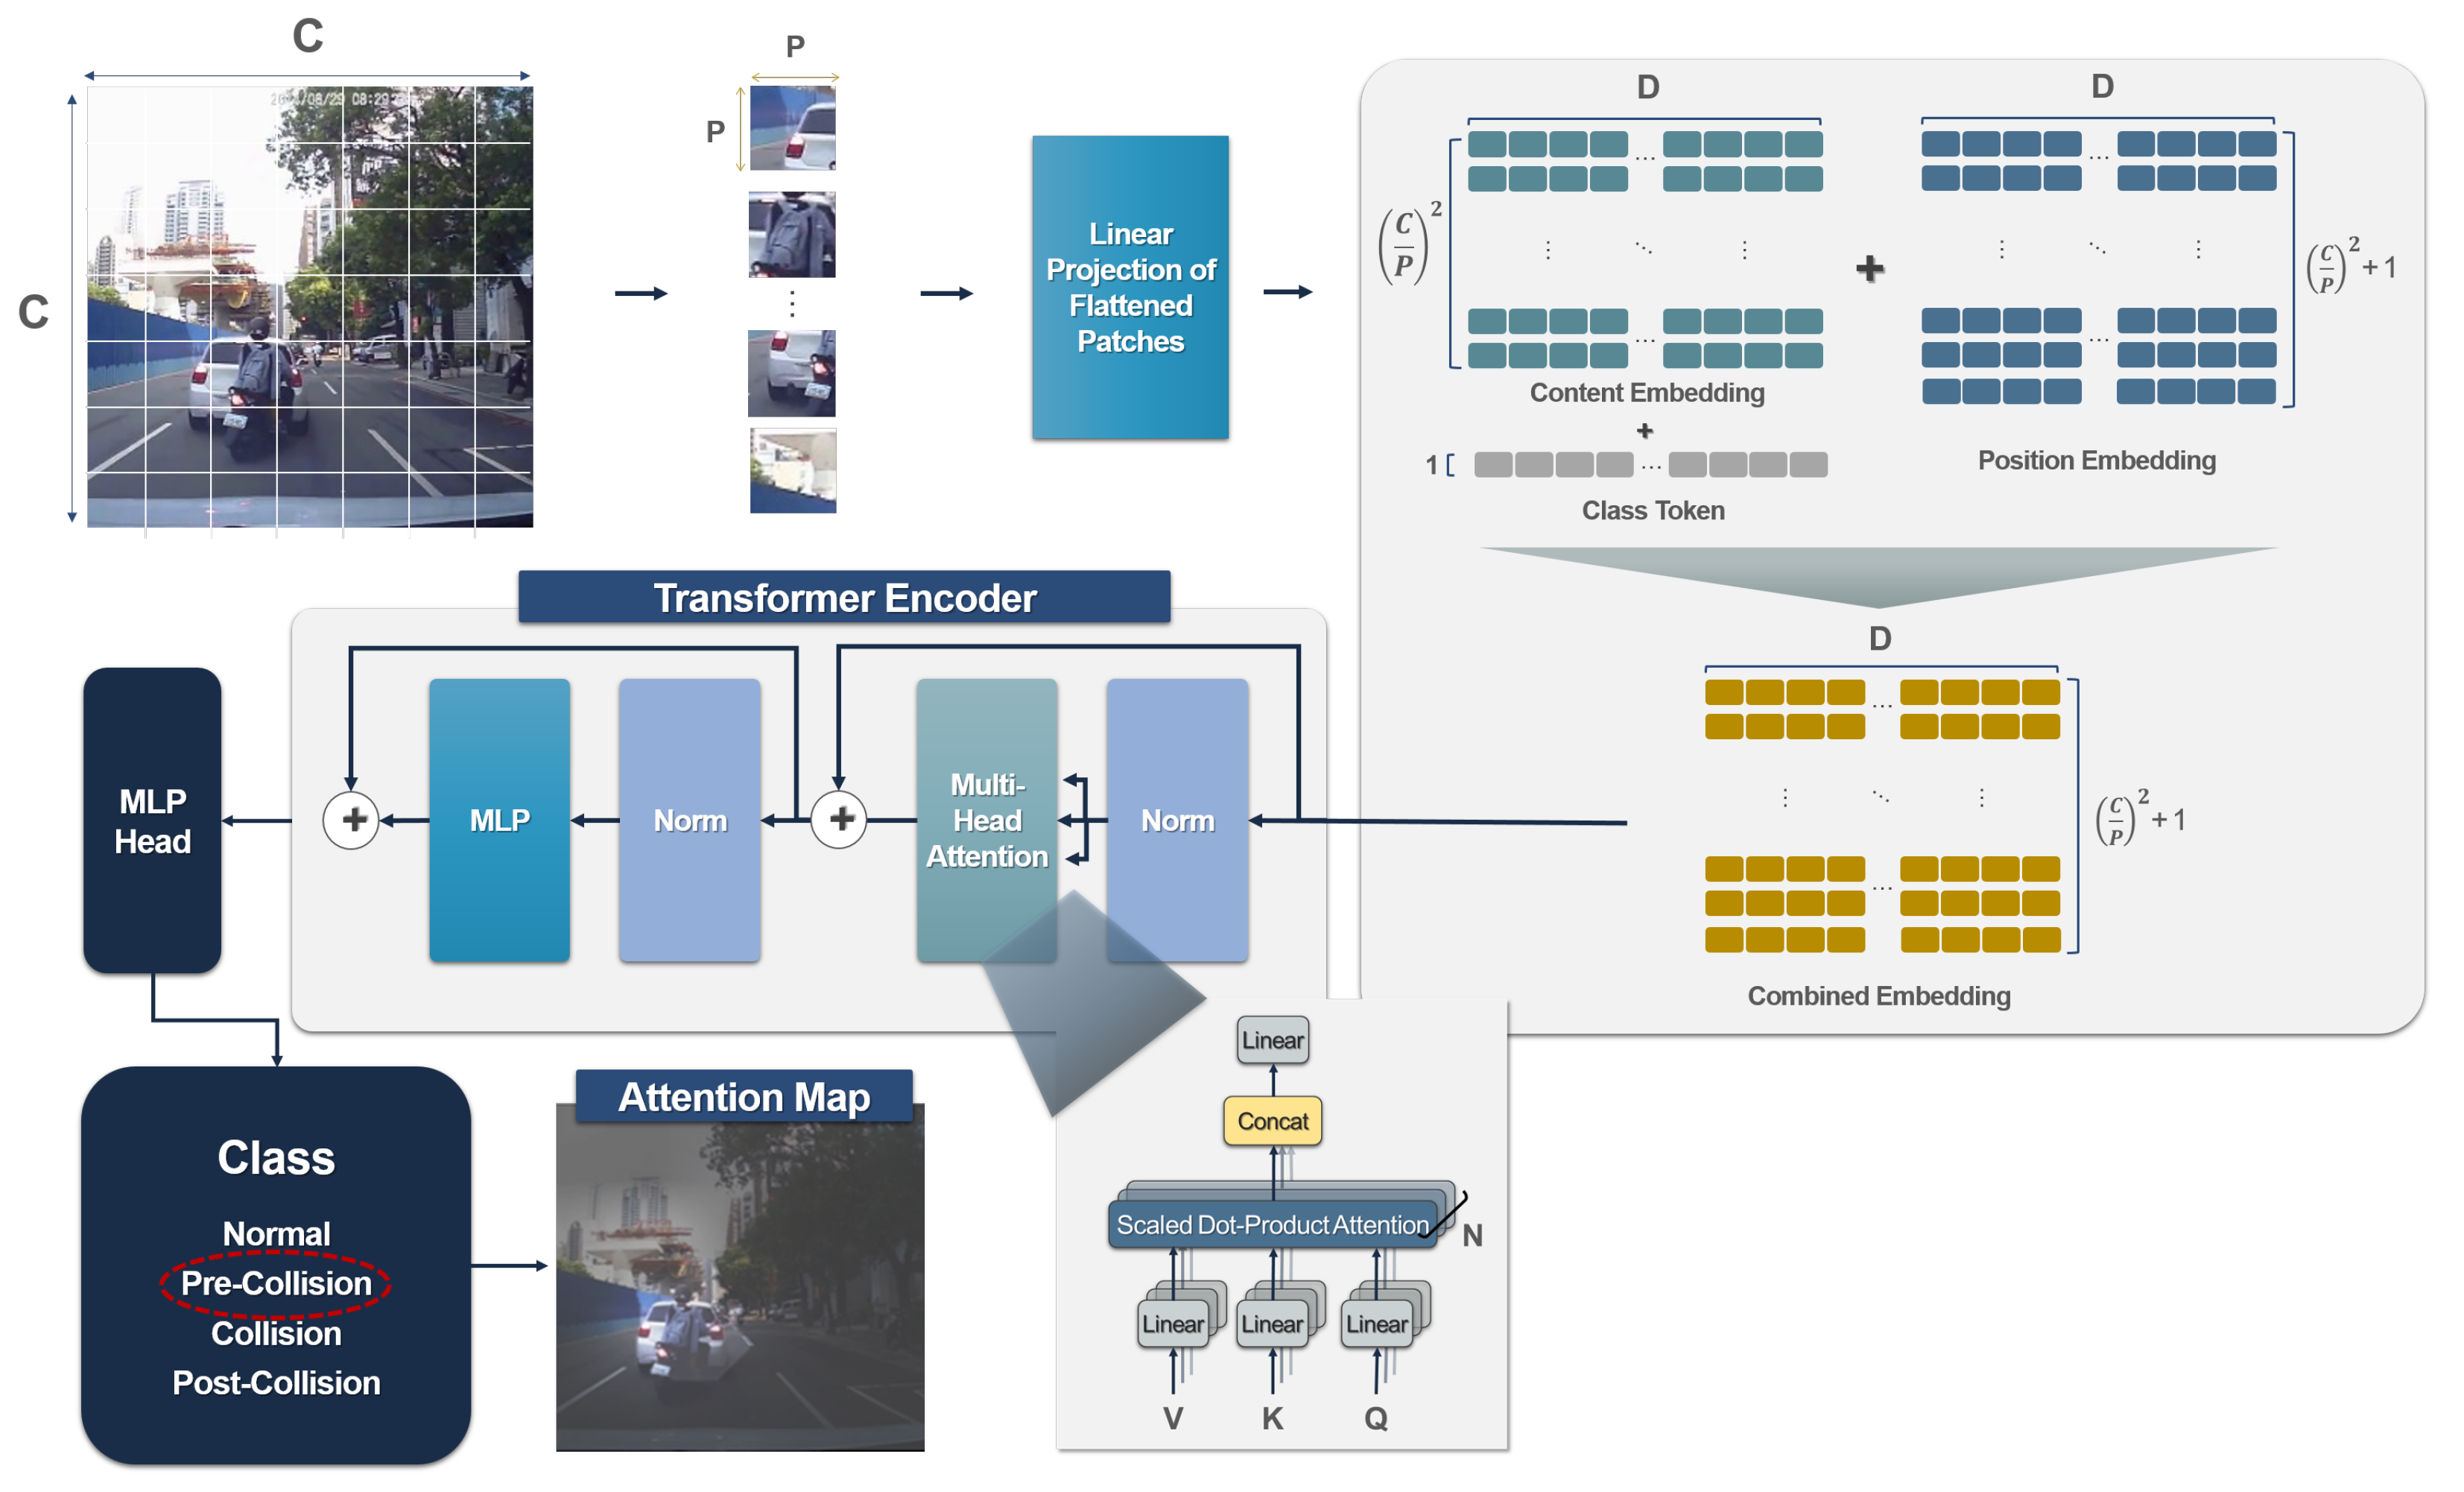
3.2. Vision Transformer-Traffic Accident (ViT-TA)
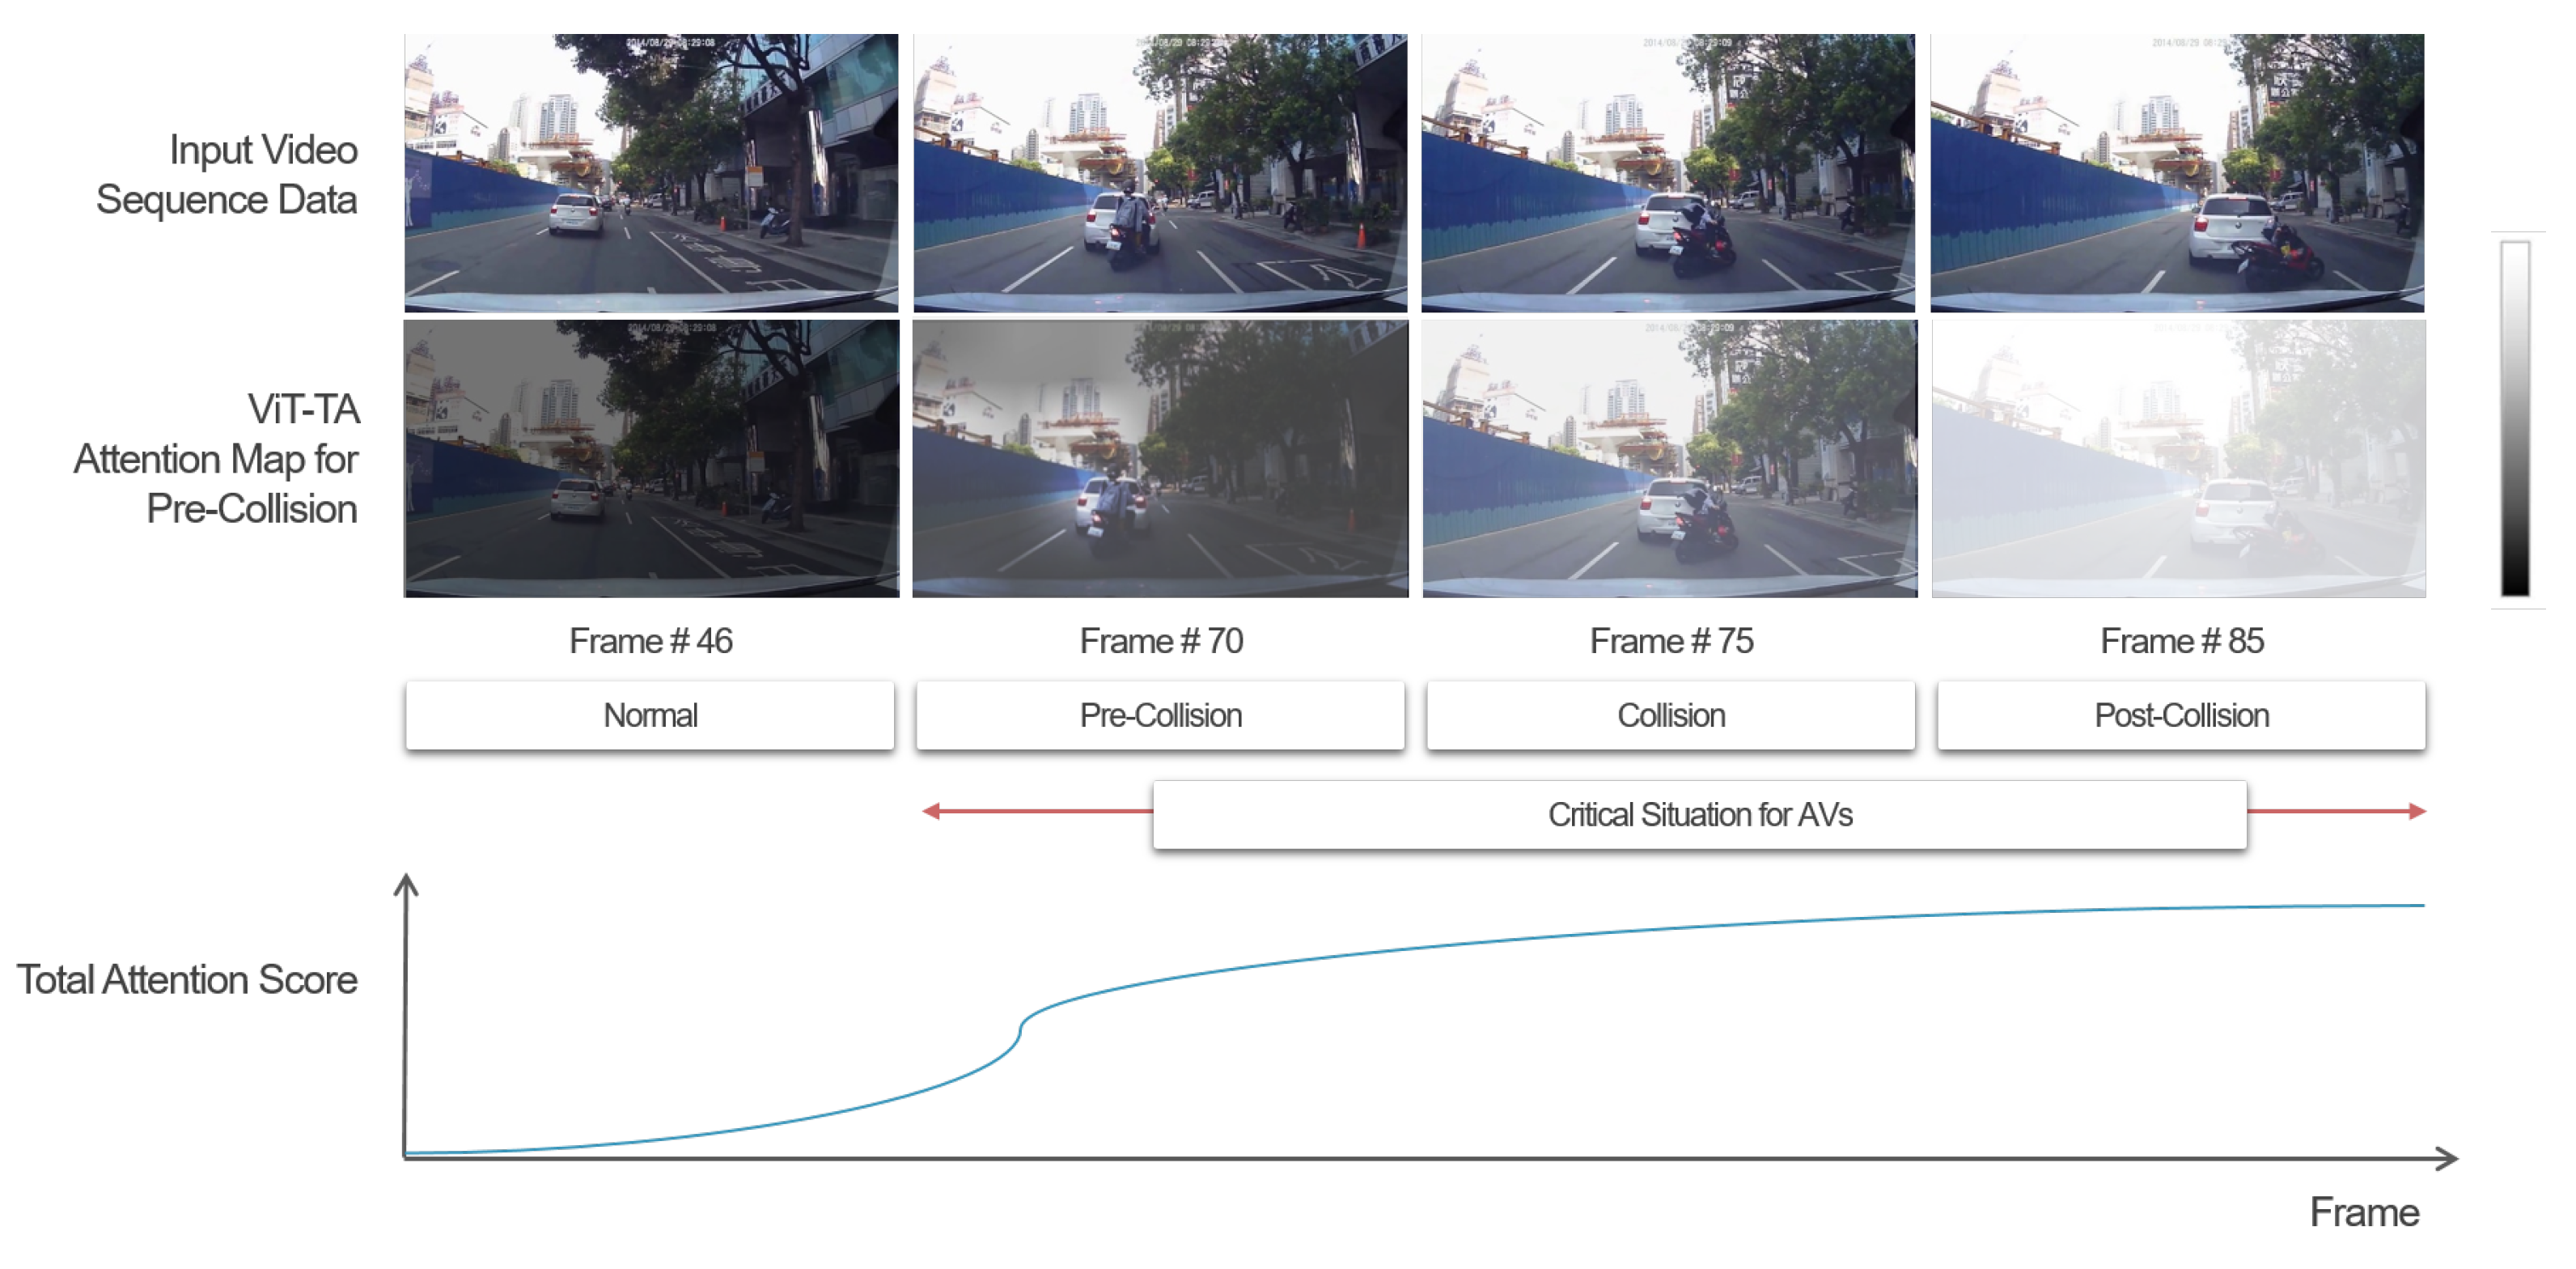
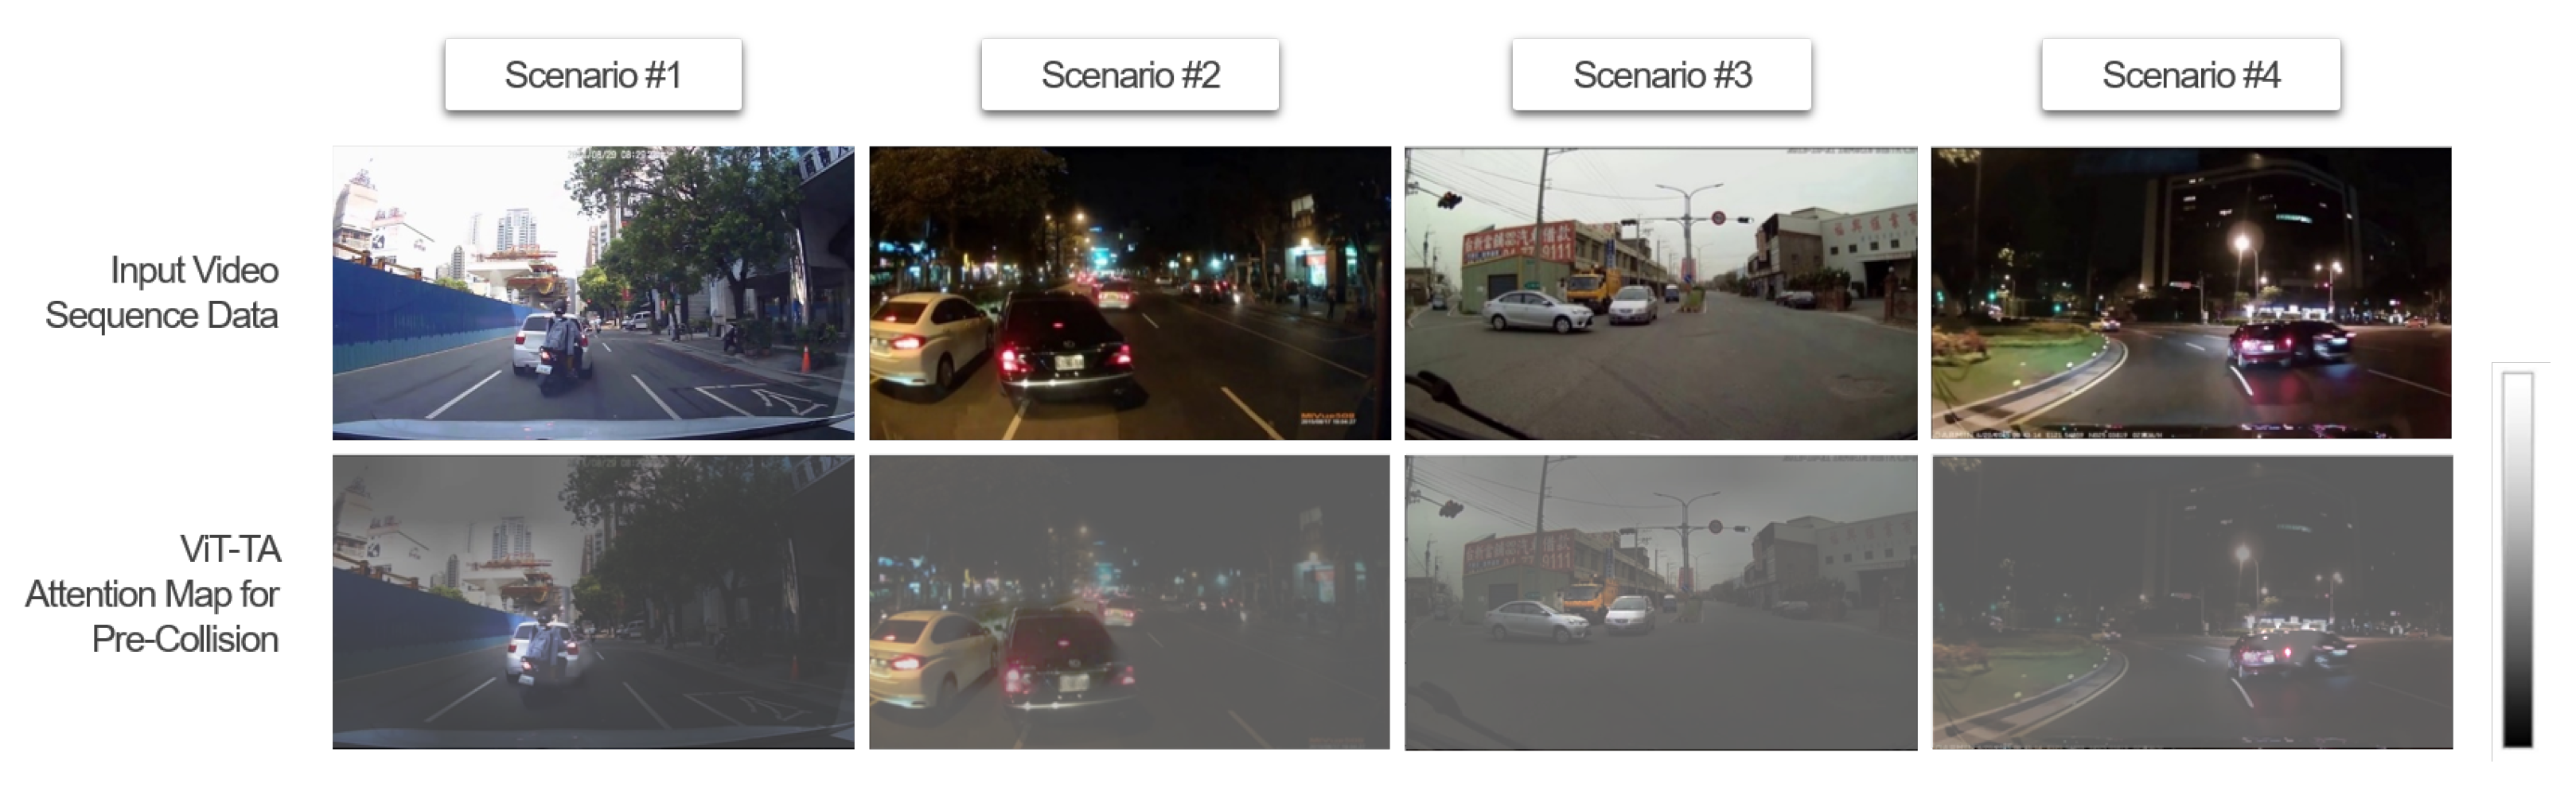
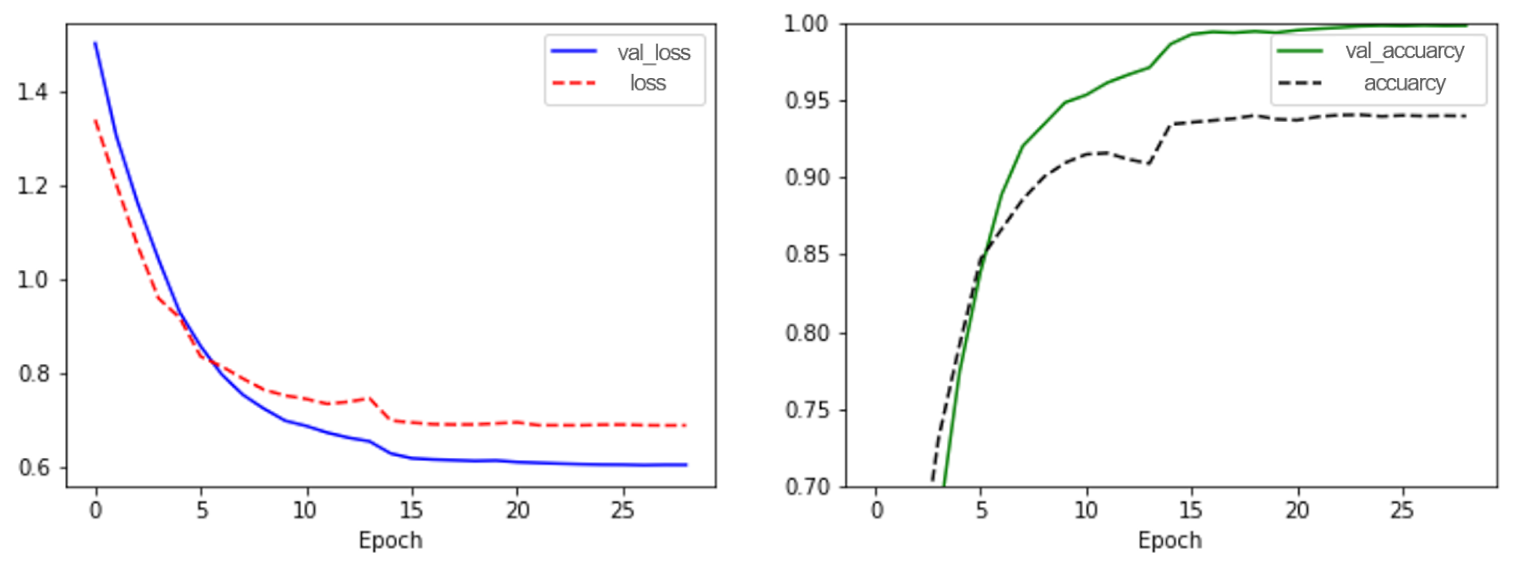
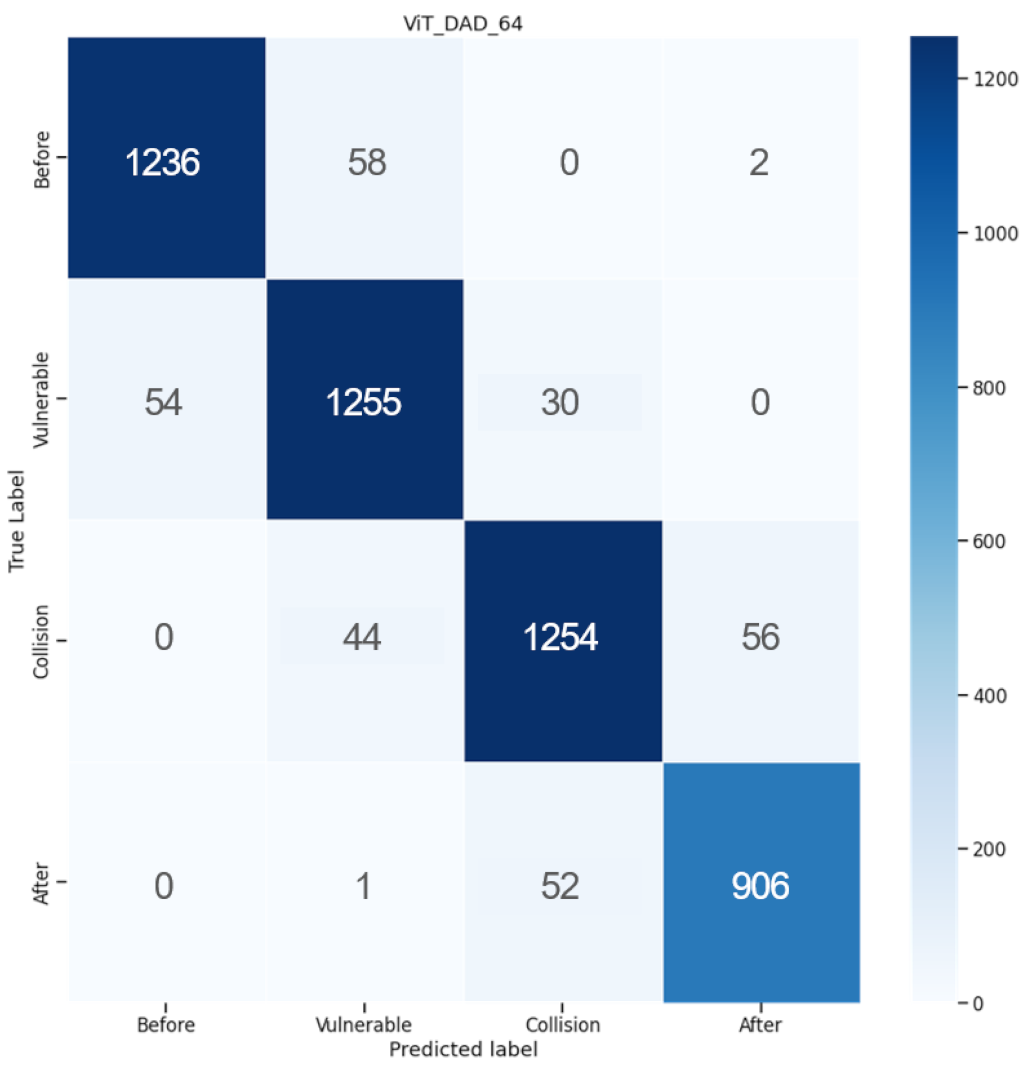
4. Evaluation of ViT-TA Model
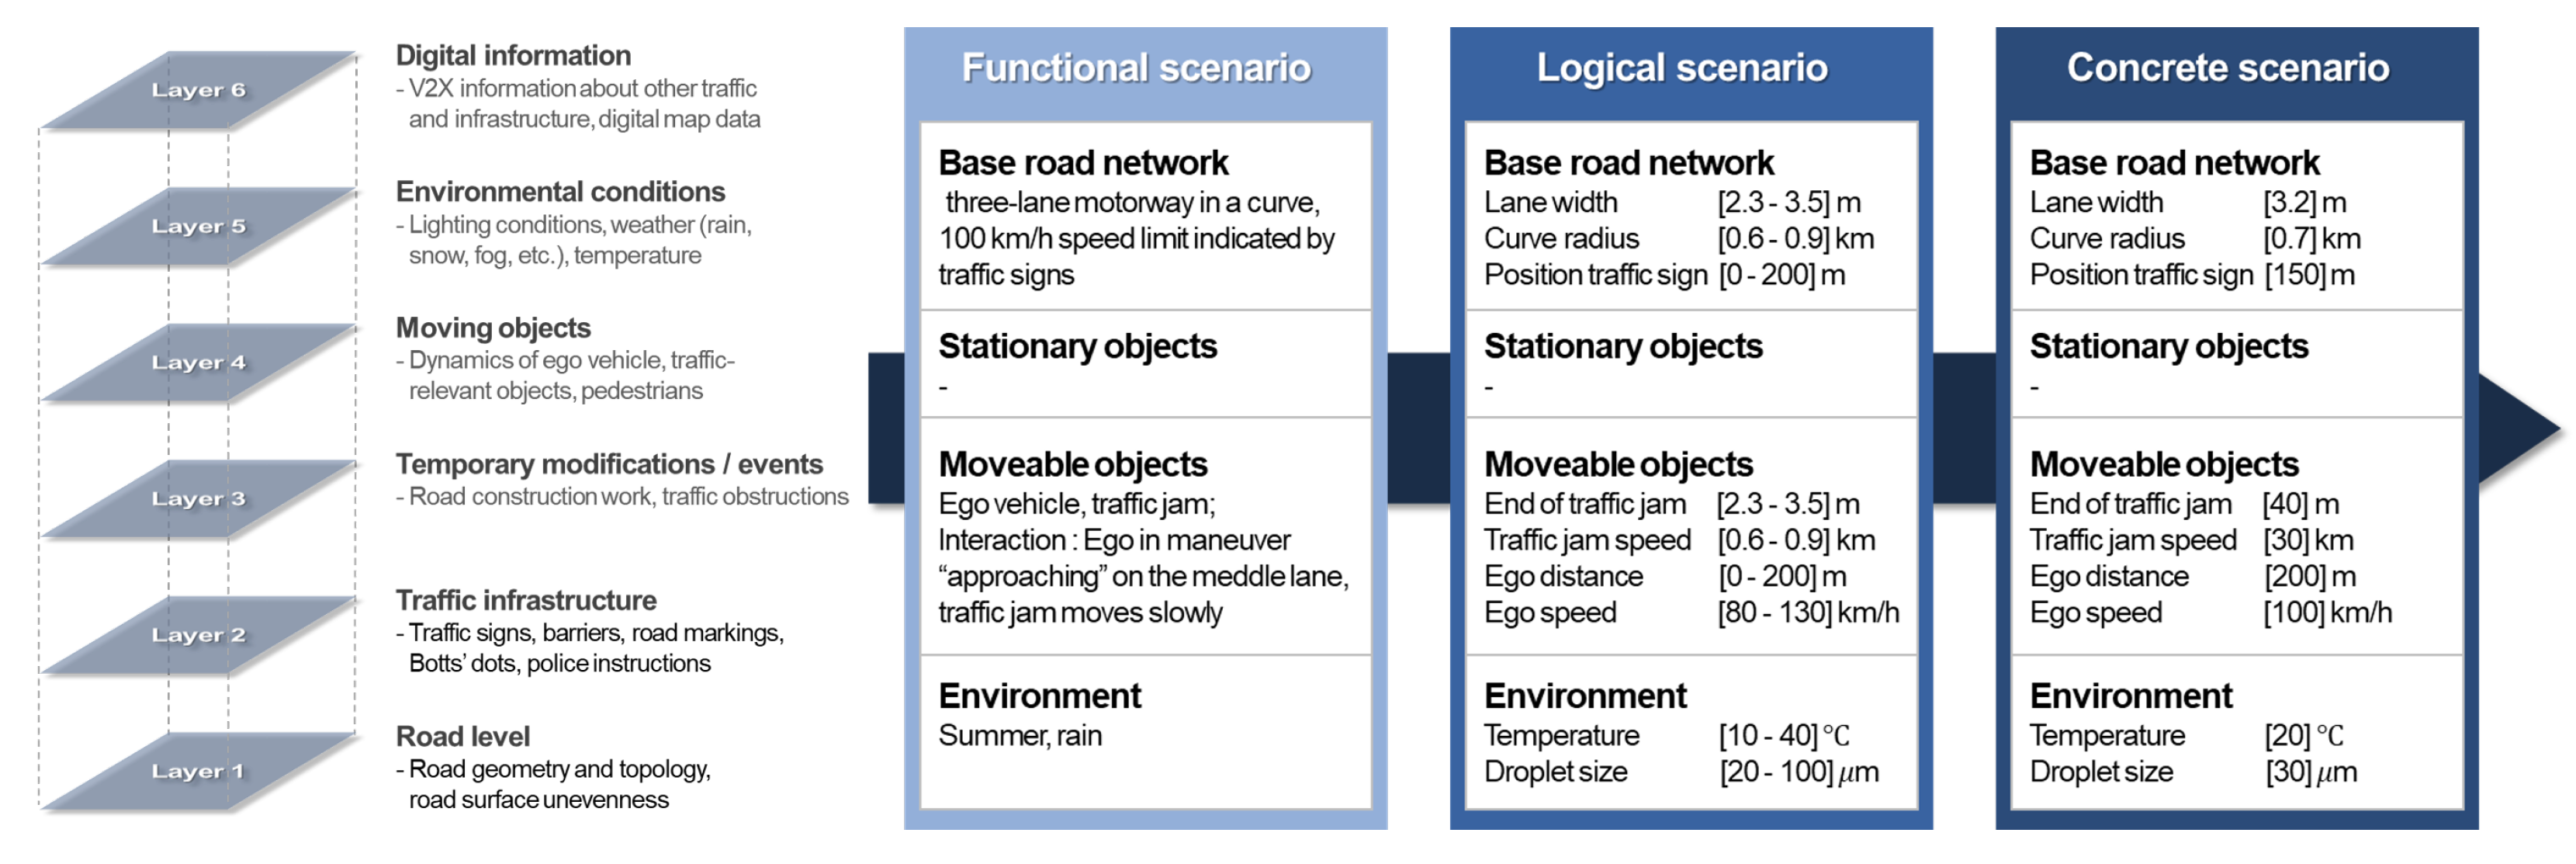
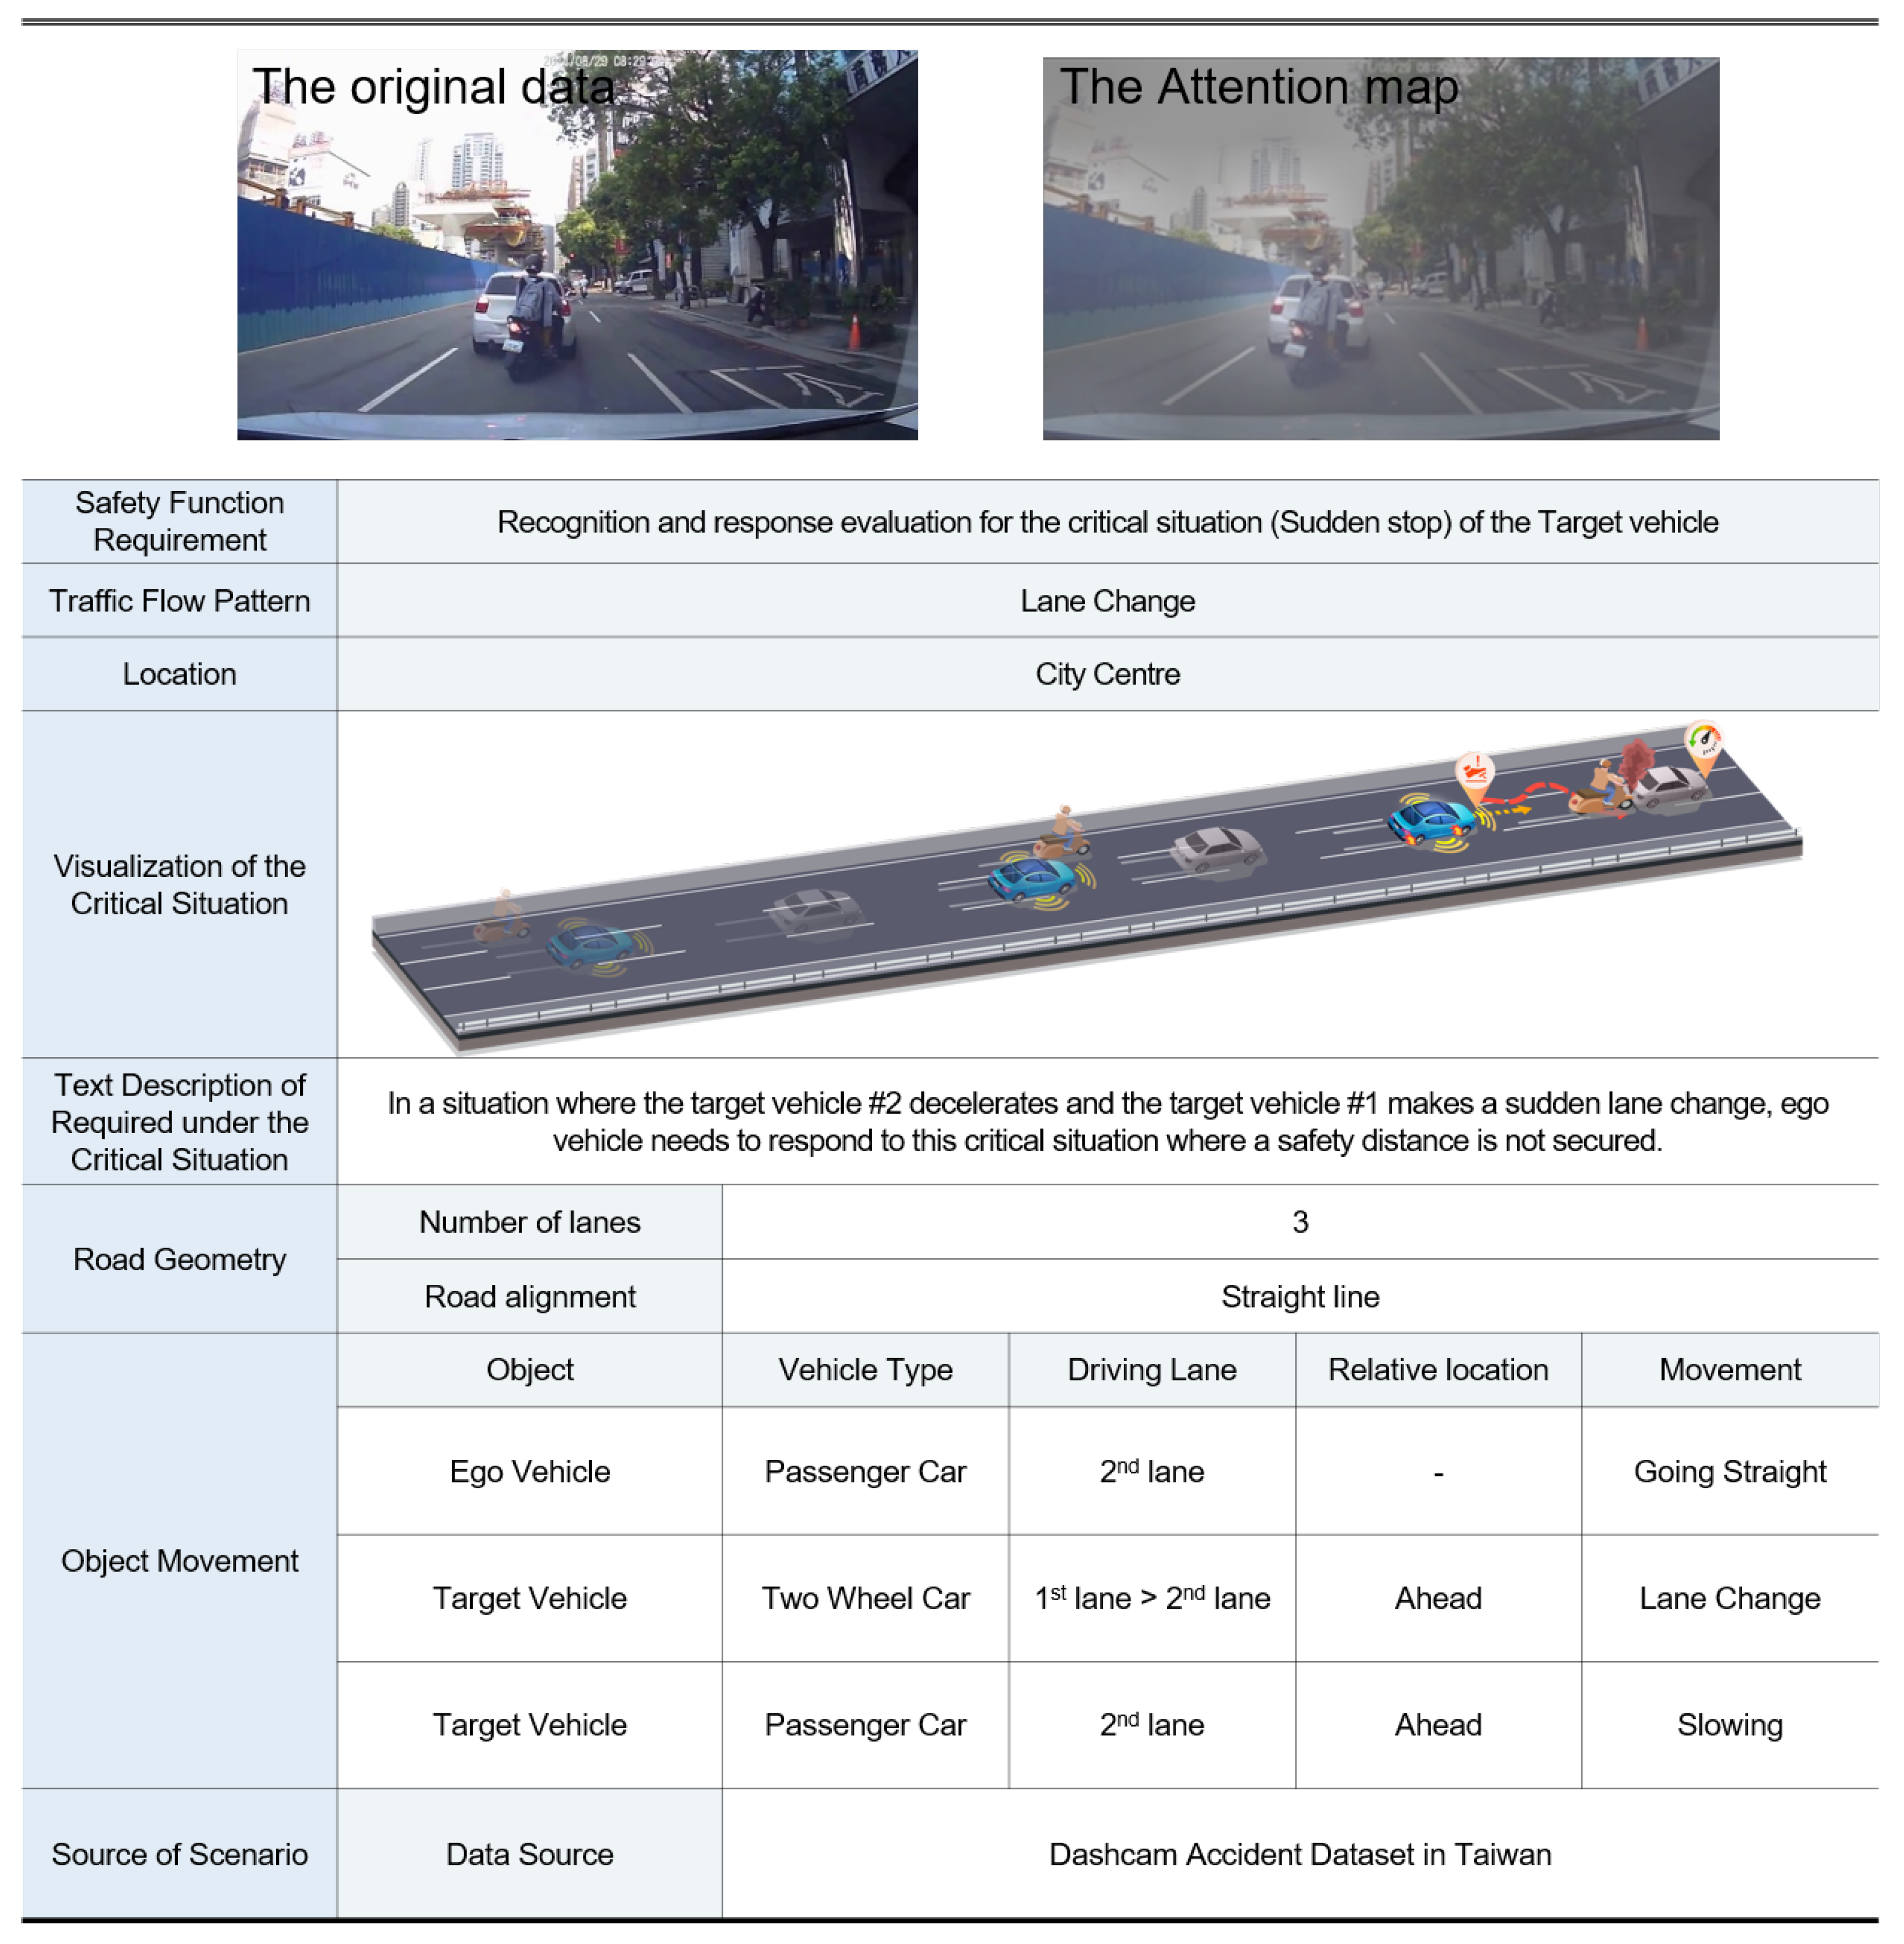
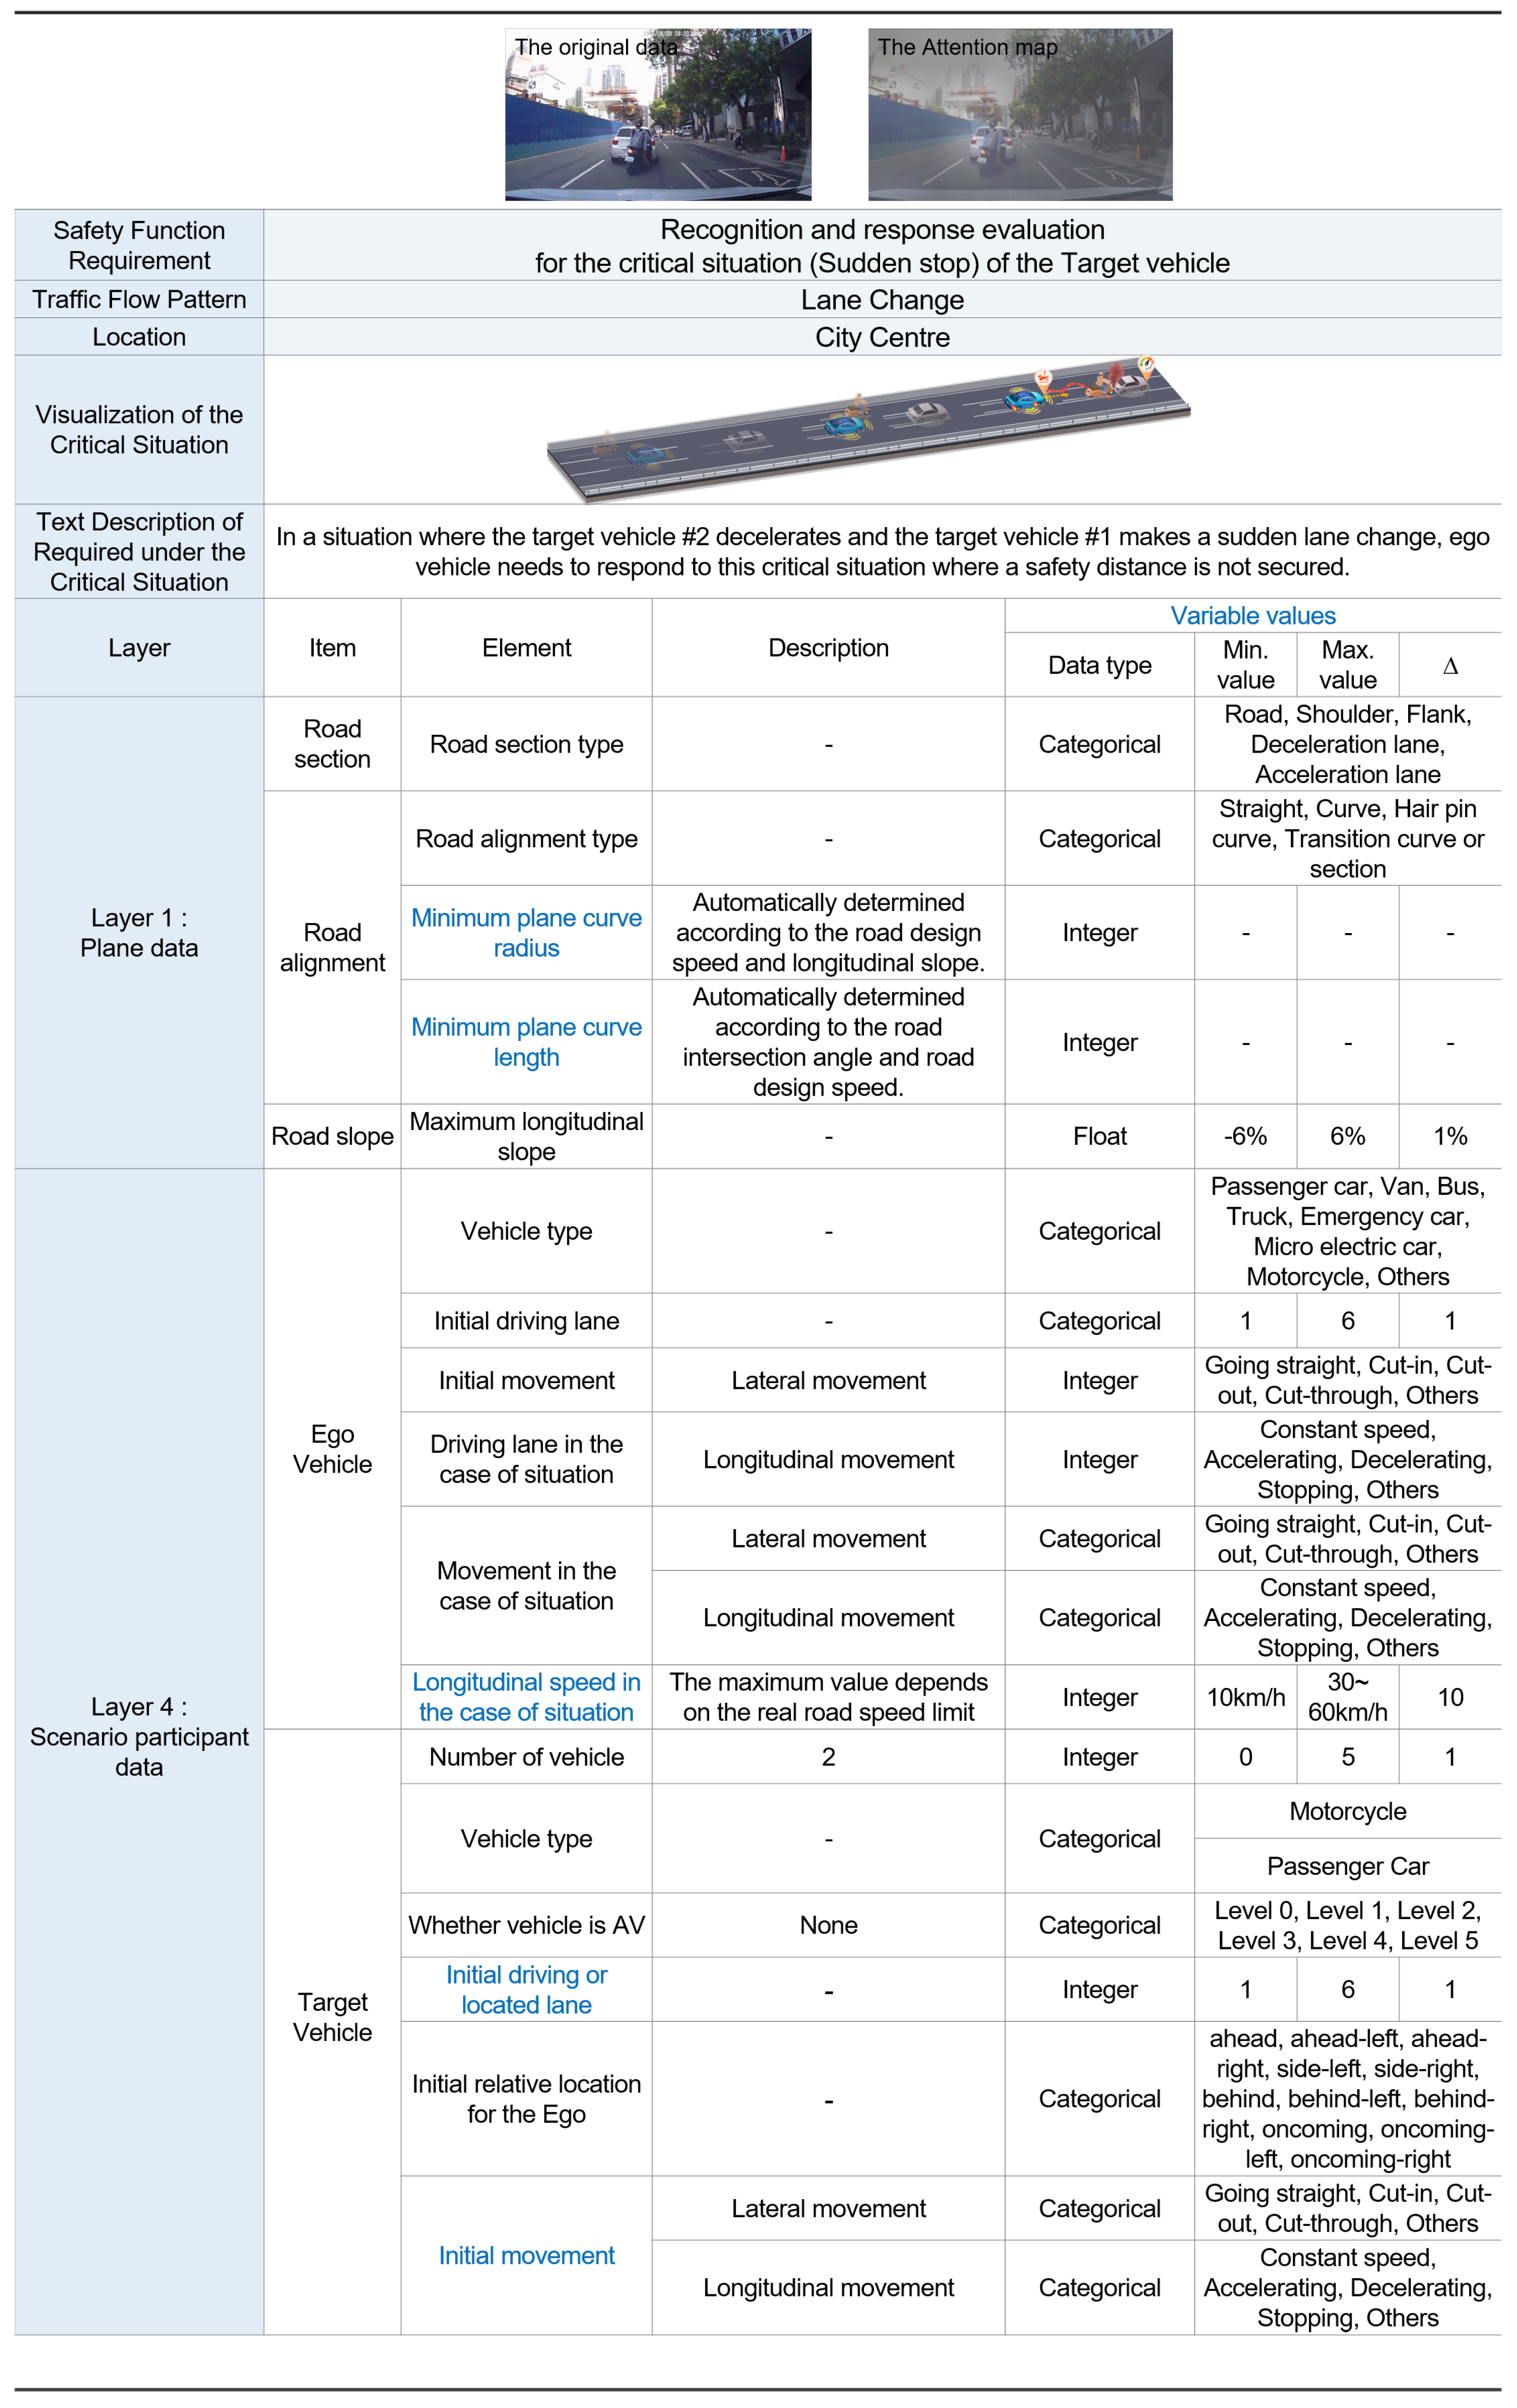
5. Composition of Vulnerable Traffic Accident Scenarios Based on ViT-TA
6. Conclusions
Author Contributions
Funding
Data Availability Statement
Conflicts of Interest
References
- Kim, B.J.; Lee, S.B. Safety Evaluation of Autonomous Vehicles for a Comparative Study of Camera Image Distance Information and Dynamic Characteristics Measuring Equipment. IEEE Access 2022, 10, 18486–18506. [Google Scholar] [CrossRef]
- Wang, Y.; Wang, L.; Guo, J.; Papamichail, I.; Papageorgiou, M.; Wang, F.Y.; Bertini, R.; Hua, W.; Yang, Q. Ego-efficient lane changes of connected and automated vehicles with impacts on traffic flow. Transp. Res. Part C Emerg. Technol. 2022, 138, 103478. [Google Scholar] [CrossRef]
- SAE. Taxonomy and Definitions for Terms Related to Driving Automation Systems for On-Road Motor Vehicles; SAE International: Warrendale, PA, USA, 2018. [Google Scholar]
- U.S. Department of Transportation. Vision for Safety 2.0 Guidance for Automated Vehicles; National Highway Traffic Safety Administration: Washington, DC, USA, 2017.
- Masmoudi, M.; Ghazzai, H.; Frikha, M.; Massoud, Y. Object detection learning techniques for autonomous vehicle applications. In Proceedings of the 2019 IEEE International Conference on Vehicular Electronics and Safety (ICVES), Cairo, Egypt, 4–6 September 2019; pp. 1–5. [Google Scholar]
- Luettel, T.; Himmelsbach, M.; Wuensche, H.J. Autonomous ground vehicles—Concepts and a path to the future. Proc. IEEE 2012, 100, 1831–1839. [Google Scholar] [CrossRef]
- Zhao, L.; Chai, H.; Han, Y.; Yu, K.; Mumtaz, S. A collaborative V2X data correction method for road safety. IEEE Trans. Reliab. 2022, 71, 951–962. [Google Scholar] [CrossRef]
- Boggs, A.M.; Arvin, R.; Khattak, A.J. Exploring the who, what, when, where, and why of automated vehicle disengagements. Accid. Anal. Prev. 2020, 136, 105406. [Google Scholar]
- Song, Y.; Chitturi, M.V.; Noyce, D.A. Automated vehicle crash sequences: Patterns and potential uses in safety testing. Accid. Anal. Prev. 2021, 153, 106017. [Google Scholar] [CrossRef]
- Jenkins, I.R.; Gee, L.O.; Knauss, A.; Yin, H.; Schroeder, J. Accident scenario generation with recurrent neural networks. In Proceedings of the 2018 21st International Conference on Intelligent Transportation Systems (ITSC), Maui, HI, USA, 4–7 November 2018; pp. 3340–3345. [Google Scholar]
- Arena, F.; Pau, G.; Severino, A. V2X communications applied to safety of pedestrians and vehicles. J. Sens. Actuator Netw. 2019, 9, 3. [Google Scholar] [CrossRef] [Green Version]
- Wang, J.; Shao, Y.; Ge, Y.; Yu, R. A survey of vehicle to everything (V2X) testing. Sensors 2019, 19, 334. [Google Scholar] [CrossRef] [Green Version]
- Palin, R.; Ward, D.; Habli, I.; Rivett, R. ISO 26262 Safety Cases: Compliance and Assurance. International Standard ISO/FDIS 26262; ISO: Berlin, Germany, 2011. [Google Scholar]
- Riedmaier, S.; Ponn, T.; Ludwig, D.; Schick, B.; Diermeyer, F. Survey on scenario-based safety assessment of automated vehicles. IEEE Access 2020, 8, 87456–87477. [Google Scholar] [CrossRef]
- Hallerbach, S.; Xia, Y.; Eberle, U.; Koester, F. Simulation-based identification of critical scenarios for cooperative and automated vehicles. SAE Int. J. Connect. Autom. Veh. 2018, 1, 93–106. [Google Scholar] [CrossRef]
- Ulbrich, S.; Menzel, T.; Reschka, A.; Schuldt, F.; Maurer, M. Defining and substantiating the terms scene, situation, and scenario for automated driving. In Proceedings of the 2015 IEEE 18th International Conference on Intelligent Transportation Systems, Gran Canaria, Spain, 15–18 September 2015; pp. 982–988. [Google Scholar]
- Erdogan, A.; Ugranli, B.; Adali, E.; Sentas, A.; Mungan, E.; Kaplan, E.; Leitner, A. Real-world maneuver extraction for autonomous vehicle validation: A comparative study. In Proceedings of the 2019 IEEE Intelligent Vehicles Symposium (IV), Paris, France, 9–12 June 2019; pp. 267–272. [Google Scholar]
- Kang, M.; Song, J.; Hwang, K. For Preventative Automated Driving System (PADS): Traffic Accident Context Analysis Based on Deep Neural Networks. Electronics 2020, 9, 1829. [Google Scholar] [CrossRef]
- Favarò, F.M.; Nader, N.; Eurich, S.O.; Tripp, M.; Varadaraju, N. Examining accident reports involving autonomous vehicles in California. PLoS ONE 2017, 12, e0184952. [Google Scholar] [CrossRef] [PubMed]
- Lee, W.; Kang, M.H.; Song, J.; Hwang, K. The Design of Preventive Automated Driving Systems Based on Convolutional Neural Network. Electronics 2021, 10, 1737. [Google Scholar] [CrossRef]
- Chan, F.H.; Chen, Y.T.; Xiang, Y.; Sun, M. Anticipating accidents in dashcam videos. In Proceedings of the Asian Conference on Computer Vision, Taipei, Taiwan, 20–24 November 2016; Springer: Berlin/Heidelberg, Germany, 2016; pp. 136–153. [Google Scholar]
- Demetriou, A.; Allsvåg, H.; Rahrovani, S.; Chehreghani, M.H. Generation of driving scenario trajectories with generative adversarial networks. In Proceedings of the 2020 IEEE 23rd International Conference on Intelligent Transportation Systems (ITSC), Rhodes, Greece, 20–23 September 2020; pp. 1–6. [Google Scholar]
- Virdi, J. Using Deep Learning to Predict Obstacle Trajectories for Collision Avoidance in Autonomous Vehicles; University of California: San Diego, CA, USA, 2018. [Google Scholar]
- Das, A.; Rad, P. Opportunities and challenges in explainable artificial intelligence (xai): A survey. arXiv 2020, arXiv:2006.11371. [Google Scholar]
- Wang, P.Y.; Galhotra, S.; Pradhan, R.; Salimi, B. Demonstration of generating explanations for black-box algorithms using Lewis. Proc. VLDB Endow. 2021, 14, 2787–2790. [Google Scholar] [CrossRef]
- Kim, Y.J.; Yoon, Y. Speed Prediction and Analysis of Nearby Road Causality Using Explainable Deep Graph Neural Network. J. Korea Converg. Soc. 2022, 13, 51–62. [Google Scholar]
- Vaswani, A.; Shazeer, N.; Parmar, N.; Uszkoreit, J.; Jones, L.; Gomez, A.N.; Kaiser, Ł.; Polosukhin, I. Attention is all you need. Adv. Neural Inf. Process. Syst. 2017, 30. [Google Scholar]
- Di Gangi, M.A.; Negri, M.; Cattoni, R.; Dessi, R.; Turchi, M. Enhancing transformer for end-to-end speech-to-text translation. In Proceedings of the Machine Translation Summit XVII: Research Track, Dublin, Ireland, 19–23 August 2019; pp. 21–31. [Google Scholar]
- Kano, T.; Sakti, S.; Nakamura, S. Transformer-based direct speech-to-speech translation with transcoder. In Proceedings of the 2021 IEEE Spoken Language Technology Workshop (SLT), Shenzhen, China, 19–22 January 2021; pp. 958–965. [Google Scholar]
- Chen, L.; Lu, K.; Rajeswaran, A.; Lee, K.; Grover, A.; Laskin, M.; Abbeel, P.; Srinivas, A.; Mordatch, I. Decision transformer: Reinforcement learning via sequence modeling. Adv. Neural Inf. Process. Syst. 2021, 34, 15084–15097. [Google Scholar]
- Parisotto, E.; Song, F.; Rae, J.; Pascanu, R.; Gulcehre, C.; Jayakumar, S.; Jaderberg, M.; Kaufman, R.L.; Clark, A.; Noury, S.; et al. Stabilizing transformers for reinforcement learning. In Proceedings of the International Conference on Machine Learning, PMLR, Virtual, 13–18 July 2020; pp. 7487–7498. [Google Scholar]
- Liu, Z.; Lin, Y.; Cao, Y.; Hu, H.; Wei, Y.; Zhang, Z.; Lin, S.; Guo, B. Swin transformer: Hierarchical vision transformer using shifted windows. In Proceedings of the IEEE/CVF International Conference on Computer Vision, Montreal, QC, Canada, 11–17 October 2021; pp. 10012–10022. [Google Scholar]
- Arnab, A.; Dehghani, M.; Heigold, G.; Sun, C.; Lučić, M.; Schmid, C. Vivit: A video vision transformer. In Proceedings of the IEEE/CVF International Conference on Computer Vision, Montreal, QC, Canada, 11–17 October 2021; pp. 6836–6846. [Google Scholar]
- Wang, W.; Xie, E.; Li, X.; Fan, D.P.; Song, K.; Liang, D.; Lu, T.; Luo, P.; Shao, L. Pyramid vision transformer: A versatile backbone for dense prediction without convolutions. In Proceedings of the IEEE/CVF International Conference on Computer Vision, Montreal, QC, Canada, 11–17 October 2021; pp. 568–578. [Google Scholar]
- Park, S.; Park, S.; Jeong, H.; Yun, I.; So, J. Scenario-mining for level 4 automated vehicle safety assessment from real accident situations in urban areas using a natural language process. Sensors 2021, 21, 6929. [Google Scholar] [CrossRef]
- Menzel, T.; Bagschik, G.; Maurer, M. Scenarios for development, test and validation of automated vehicles. In Proceedings of the 2018 IEEE Intelligent Vehicles Symposium (IV), Changshu, China, 26–30 June 2018; pp. 1821–1827. [Google Scholar]
- Menzel, T.; Bagschik, G.; Isensee, L.; Schomburg, A.; Maurer, M. From functional to logical scenarios: Detailing a keyword-based scenario description for execution in a simulation environment. In Proceedings of the 2019 IEEE Intelligent Vehicles Symposium (IV), Paris, France, 9–12 June 2019; pp. 2383–2390. [Google Scholar]
- Audi, A.G., Volkswagen, A.G. Pegasus Method: An Overview. Available online: https://www.pegasusprojekt.de/files/tmpl/Pegasus-Abschlussveranstaltung/PEGASUS-Gesamtmethode.pdf (accessed on 7 May 2022).
- Lim, H.; Chae, H.; Lee, M.; Lee, K. Development and validation of safety performance evaluation scenarios of autonomous vehicle based on driving data. J. Auto-Veh. Saf. Assoc. 2017, 9, 7–13. [Google Scholar]
- Kim, H.; Park, S.; Paik, J. Pre-Activated 3D CNN and Feature Pyramid Network for Traffic Accident Detection. In Proceedings of the 2020 IEEE International Conference on Consumer Electronics (ICCE), Las Vegas, NV, USA, 4–6 January 2020; pp. 1–3. [Google Scholar]
- Park, S.; Jeong, H.; Kwon, C.; Kim, J.; Yun, I. Analysis of Take-over Time and Stabilization of Autonomous Vehicle Using a Driving Simulator. J. Korea Inst. Intell. Transp. Syst. 2019, 18, 31–43. [Google Scholar] [CrossRef]
- Abbas, H.; O’Kelly, M.; Rodionova, A.; Mangharam, R. Safe at any speed: A simulation-based test harness for autonomous vehicles. In Proceedings of the International Workshop on Design, Modeling, and Evaluation of Cyber Physical Systems, Seoul, Korea, 15–20 October 2017; Springer: Berlin/Heidelberg, Germany, 2017; pp. 94–106. [Google Scholar]
- Strickland, M.; Fainekos, G.; Amor, H.B. Deep predictive models for collision risk assessment in autonomous driving. In Proceedings of the 2018 IEEE International Conference on Robotics and Automation (ICRA), Brisbane, Australia, 21–25 May 2018; pp. 4685–4692. [Google Scholar]
- Fremont, D.J.; Kim, E.; Pant, Y.V.; Seshia, S.A.; Acharya, A.; Bruso, X.; Wells, P.; Lemke, S.; Lu, Q.; Mehta, S. Formal scenario-based testing of autonomous vehicles: From simulation to the real world. In Proceedings of the 2020 IEEE 23rd International Conference on Intelligent Transportation Systems (ITSC), Rhodes, Greece, 20–23 September 2020; pp. 1–8. [Google Scholar]
- Yao, Y.; Xu, M.; Wang, Y.; Crandall, D.J.; Atkins, E.M. Unsupervised traffic accident detection in first-person videos. In Proceedings of the 2019 IEEE/RSJ International Conference on Intelligent Robots and Systems (IROS), Macau, China, 4–8 November 2019; pp. 273–280. [Google Scholar]
- Maaloul, B.; Taleb-Ahmed, A.; Niar, S.; Harb, N.; Valderrama, C. Adaptive video-based algorithm for accident detection on highways. In Proceedings of the 2017 12th IEEE International Symposium on Industrial Embedded Systems (SIES), Toulouse, France, 14–16 June 2017; pp. 1–6. [Google Scholar]
- Morales Rosales, L.A.; Algredo Badillo, I.; Hernández Gracidas, C.A.; Rangel, H.R.; Lobato Báez, M. On-road obstacle detection video system for traffic accident prevention. J. Intell. Fuzzy Syst. 2018, 35, 533–547. [Google Scholar] [CrossRef]
- Ghahremannezhad, H.; Shi, H.; Liu, C. A real time accident detection framework for traffic video analysis. In Proceedings of the the 16th International Conference on Machine Learning and Data Mining, New York, NY, USA, 18–23 July 2020; pp. 77–92. [Google Scholar]
- Agrawal, A.K.; Agarwal, K.; Choudhary, J.; Bhattacharya, A.; Tangudu, S.; Makhija, N.; Rajitha, B. Automatic traffic accident detection system using ResNet and SVM. In Proceedings of the 2020 Fifth International Conference on Research in Computational Intelligence and Communication Networks (ICRCICN), Online, 26–27 November 2020; pp. 71–76. [Google Scholar]
- Sui, B.; Lubbe, N.; Bärgman, J. A clustering approach to developing car-to-two-wheeler test scenarios for the assessment of Automated Emergency Braking in China using in-depth Chinese crash data. Accid. Anal. Prev. 2019, 132, 105242. [Google Scholar] [CrossRef] [PubMed]
- Holland, J.C.; Sargolzaei, A. Verification of autonomous vehicles: Scenario generation based on real world accidents. In Proceedings of the 2020 SoutheastCon, Raleigh, NC, USA, 12–15 March 2020; Volume 2, pp. 1–7. [Google Scholar]
- Geng, X.; Liang, H.; Yu, B.; Zhao, P.; He, L.; Huang, R. A scenario-adaptive driving behavior prediction approach to urban autonomous driving. Appl. Sci. 2017, 7, 426. [Google Scholar] [CrossRef]
- Yuan, Q.; Xu, X.; Zhau, J. Paving the Way for Autonomous Vehicle Testing in Accident Scenario Analysis of Yizhuang Development Zone in Beijing. In Proceedings of the CICTP 2020, Xi’an, China, 14–16 August 2020; pp. 62–72. [Google Scholar]
- Lenard, J.; Badea-Romero, A.; Danton, R. Typical pedestrian accident scenarios for the development of autonomous emergency braking test protocols. Accid. Anal. Prev. 2014, 73, 73–80. [Google Scholar] [CrossRef] [Green Version]
- Karim, M.M.; Li, Y.; Qin, R.; Yin, Z. A Dynamic Spatial-Temporal Attention Network for Early Anticipation of Traffic Accidents. IEEE Trans. Intell. Transp. Syst. 2022, 23, 9590–9600. [Google Scholar] [CrossRef]
- Bao, W.; Yu, Q.; Kong, Y. Uncertainty-based traffic accident anticipation with spatio-temporal relational learning. In Proceedings of the 28th ACM International Conference on Multimedia, Seattle, WA, USA, 12–16 October 2020; pp. 2682–2690. [Google Scholar]
- Olson, P.L.; Sivak, M. Perception-response time to unexpected roadway hazards. Hum. Factors 1986, 28, 91–96. [Google Scholar] [CrossRef]
- Aashto, A. Policy on Geometric Design of Highways and Streets; American Association of State Highway and Traffic Officials: Washington, DC, USA, 2001; Volume 1, p. 158. [Google Scholar]
- Wortman, R.H.; Matthias, J.S. An Evaluation of Driver Behavior at Signalized Intersections; Arizona Department of Transportation: Phoenix, AZ, USA, 1983; Volume 904.
- Mussa, R.N.; Newton, C.J.; Matthias, J.S.; Sadalla, E.K.; Burns, E.K. Simulator evaluation of green and flashing amber signal phasing. Transp. Res. Rec. 1996, 1550, 23–29. [Google Scholar] [CrossRef]
- Zhi, X.; Guan, H.; Yang, X.; Zhao, X.; Lingjie, L. An Exploration of Driver Perception Reaction Times under Emergency Evacuation Situations. In Proceedings of the Transportation Research Board 89th Annual Meeting, Washington, DC, USA, 10–14 January 2010. [Google Scholar]
- Fildes, B.; Keall, M.; Bos, N.; Lie, A.; Page, Y.; Pastor, C.; Pennisi, L.; Rizzi, M.; Thomas, P.; Tingvall, C. Effectiveness of low speed autonomous emergency braking in real-world rear-end crashes. Accid. Anal. Prev. 2015, 81, 24–29. [Google Scholar] [CrossRef] [Green Version]
- Isaksson-Hellman, I.; Lindman, M. Evaluation of the crash mitigation effect of low-speed automated emergency braking systems based on insurance claims data. Traffic Inj. Prev. 2016, 17, 42–47. [Google Scholar] [CrossRef]
- Cicchino, J.B. Effectiveness of forward collision warning and autonomous emergency braking systems in reducing front-to-rear crash rates. Accid. Anal. Prev. 2017, 99, 142–152. [Google Scholar] [CrossRef] [PubMed]
- Cicchino, J.B. Effects of automatic emergency braking systems on pedestrian crash risk. Accid. Anal. Prev. 2022, 172, 106686. [Google Scholar] [CrossRef] [PubMed]
- Dosovitskiy, A.; Beyer, L.; Kolesnikov, A.; Weissenborn, D.; Zhai, X.; Unterthiner, T.; Dehghani, M.; Minderer, M.; Heigold, G.; Gelly, S.; et al. An image is worth 16x16 words: Transformers for image recognition at scale. arXiv 2020, arXiv:2010.11929. [Google Scholar]
- Szegedy, C.; Vanhoucke, V.; Ioffe, S.; Shlens, J.; Wojna, Z. Rethinking the Inception Architecture for Computer Vision. In Proceedings of the IEEE Conference on Computer Vision and Pattern Recognition, Las Vegas, NV, USA, 27–30 June 2016; pp. 2818–2826. [Google Scholar]
- Liu, L.; Jiang, H.; He, P.; Chen, W.; Liu, X.; Gao, J.; Han, J. On the variance of the adaptive learning rate and beyond. arXiv 2019, arXiv:1908.03265. [Google Scholar]
- de Gelder, E.; den Camp, O.O.; de Boer, N. Scenario Categories for the Assessment of Automated Vehicles; CETRAN: Singapore, 2020; Volume 1. [Google Scholar]
- ENABLE-S3 Consortium. Testing and Validation of Highly Automated Systems. Technical Report. ENABLE-S3. Available online: https://www.tugraz.at/fileadmin/user_upload/Institute/IHF/Projekte/ENABLE-S3_SummaryofResults_May2019.pdf (accessed on 7 May 2022).
- Yoon, Y.; Hwang, H.; Choi, Y.; Joo, M.; Oh, H.; Park, I.; Lee, K.H.; Hwang, J.H. Analyzing basketball movements and pass relationships using realtime object tracking techniques based on deep learning. IEEE Access 2019, 7, 56564–56576. [Google Scholar] [CrossRef]
- Hwang, H.; Choi, S.M.; Oh, J.; Bae, S.M.; Lee, J.H.; Ahn, J.P.; Lee, J.O.; An, K.S.; Yoon, Y.; Hwang, J.H. Integrated application of semantic segmentation-assisted deep learning to quantitative multi-phased microstructural analysis in composite materials: Case study of cathode composite materials of solid oxide fuel cells. J. Power Sources 2020, 471, 228458. [Google Scholar] [CrossRef]
- Hwang, H.; Ahn, J.; Lee, H.; Oh, J.; Kim, J.; Ahn, J.P.; Kim, H.K.; Lee, J.H.; Yoon, Y.; Hwang, J.H. Deep learning-assisted microstructural analysis of Ni/YSZ anode composites for solid oxide fuel cells. Mater. Charact. 2021, 172, 110906. [Google Scholar] [CrossRef]
- Goodall, N.J. Ethical decision making during automated vehicle crashes. Transp. Res. Rec. 2014, 2424, 58–65. [Google Scholar] [CrossRef] [Green Version]
- Yoon, Y. Per-service supervised learning for identifying desired WoT apps from user requests in natural language. PLoS ONE 2017, 12, e0187955. [Google Scholar] [CrossRef] [Green Version]
- Lee, H.; Yoon, Y. Interest Recognition from Online Instant Messaging Sessions Using Text Segmentation and Document Embedding Techniques. In Proceedings of the 2018 IEEE International Conference on Cognitive Computing (ICCC), San Francisco, CA, USA, 2–7 July 2018; pp. 126–129. [Google Scholar]
- Garreau, D.; Luxburg, U. Explaining the explainer: A first theoretical analysis of LIME. In Proceedings of the International Conference on Artificial Intelligence and Statistics, PMLR, Online, 26–28 August 2020; pp. 1287–1296. [Google Scholar]
- Antwarg, L.; Miller, R.M.; Shapira, B.; Rokach, L. Explaining anomalies detected by autoencoders using Shapley Additive Explanations. Expert Syst. Appl. 2021, 186, 115736. [Google Scholar] [CrossRef]

| Cropped-Out Normal Frames | Normal | Pre-Collision | Collision | Post-Collision |
|---|---|---|---|---|
| 20,760 | 6684 | 6691 | 6614 | 4751 |
| 24,740 | ||||
| Layer | Output Shape | Parameter |
|---|---|---|
| Input | [(None,224,224,3)] | 0 |
| Conv2D Embedding | (None,7,7,768) | 2,360,064 |
| Reshape | (None,49,768) | 0 |
| Class Token Embedding | (None,50,768) | 768 |
| Transformer/Position Embedding | (None,50,768) | 38,400 |
| Transformer/Attention Head 0∼11 | (None,50,768),(None,12,None,None) | 7,087,872 |
| Transformer/LayerNormalization | (None,50,768) | 1536 |
| Lambda ExtractToken | (None,768) | 0 |
| Flatten | (None,768) | 0 |
| Batch normalization | (None,768) | 3072 |
| Dense | (None,11) | 8459 |
| Batch normalization | (None,11) | 44 |
| Dense | (None,4) | 48 |
| Parameters | Description |
|---|---|
| Data (Train included validation, Test) | 19,792 (80%), 4948 (20%) |
| Batch size | 16, 32, 64 |
| Loss | Categorical Cross Entropy/label smoothing = 0.2 |
| Optimizer | RAdam (Rectified Adaptive Moment Estimation) |
| Epochs | 1000 |
| Learning Rate | 1 × 10⁻⁴∼1 × 10⁻⁶/monitor = validation accuracy/patience = 2 |
| Early Stoppage | monitor = validation accuracy/patience = 5 |
 | ||||
|---|---|---|---|---|
| Loss | Accuracy | |||
| Batch Size | 64 | Train | 0.6023 | 0.9980 |
| Test | 0.6869 | 0.9401 | ||
| 32 | Train | 0.6014 | 0.9989 | |
| Test | 0.7083 | 0.9348 | ||
| 16 | Train | 0.6056 | 0.9987 | |
| Test | 0.7159 | 0.9338 | ||
 | ||||
| Class | Precision | Recall | f1-Score | Support |
| Normal | 0.9581 | 0.9537 | 0.9558 | 1296 |
| Pre-Collision | 0.9241 | 0.9372 | 0.9306 | 1339 |
| Collision | 0.9386 | 0.9261 | 0.9323 | 1354 |
| Post-Collision | 0.9398 | 0.9447 | 0.9422 | 959 |
| Average | 0.9402 | 0.9404 | 0.9402 | - |
| Total Accuracy | 0.9400 | 4848 | ||
Publisher’s Note: MDPI stays neutral with regard to jurisdictional claims in published maps and institutional affiliations. |
© 2022 by the authors. Licensee MDPI, Basel, Switzerland. This article is an open access article distributed under the terms and conditions of the Creative Commons Attribution (CC BY) license (https://creativecommons.org/licenses/by/4.0/).
Share and Cite
Kang, M.; Lee, W.; Hwang, K.; Yoon, Y. Vision Transformer for Detecting Critical Situations and Extracting Functional Scenario for Automated Vehicle Safety Assessment. Sustainability 2022, 14, 9680. https://doi.org/10.3390/su14159680
Kang M, Lee W, Hwang K, Yoon Y. Vision Transformer for Detecting Critical Situations and Extracting Functional Scenario for Automated Vehicle Safety Assessment. Sustainability. 2022; 14(15):9680. https://doi.org/10.3390/su14159680
Chicago/Turabian StyleKang, Minhee, Wooseop Lee, Keeyeon Hwang, and Young Yoon. 2022. "Vision Transformer for Detecting Critical Situations and Extracting Functional Scenario for Automated Vehicle Safety Assessment" Sustainability 14, no. 15: 9680. https://doi.org/10.3390/su14159680
APA StyleKang, M., Lee, W., Hwang, K., & Yoon, Y. (2022). Vision Transformer for Detecting Critical Situations and Extracting Functional Scenario for Automated Vehicle Safety Assessment. Sustainability, 14(15), 9680. https://doi.org/10.3390/su14159680