Article

Innovative PEDRERA Model Tool Boosting Sustainable and Feasible Renovation Programs at District Scale in Spain

1
Department of Architecture, University of Roma Tre, 00153 Rome, Italy
2
Thermal Energy and Building Performance Group, IREC—Catalonia Institute for Energy Research, 08930 Sant Adrià del Besos, Barcelona, Spain
3
Cíclica Arquitectura SCCL, 08173 Sant Cugat del Vallès, Barcelona, Spain
*
Author to whom correspondence should be addressed.
Sustainability 2022, 14(15), 9672; https://doi.org/10.3390/su14159672
Submission received: 11 July 2022 / Revised: 29 July 2022 / Accepted: 1 August 2022 / Published: 5 August 2022
(This article belongs to the Special Issue Sustainable Spatial Planning and Territorial Governance)

Abstract

:
In accordance with the new recovery plan, Next Generation EU (NGEU), and the need to speed up the transition of cities towards a new sustainable model, this paper provides an overview of the outcomes of the PEDRERA project, which is focused on the development of a novel tool able to calculate multiple key performance indicators that can support renovation actions at the district level, according to a Positive Energy District (PED) concept. The new tool is programmed in Python programming language and is useful to evaluate several strategies for the renovation of existing building stock. It moves from a quick list of input according to several Public Private Partnership (PPP) models, in addition to other potential business models. Furthermore, the design of the model is supported by a step-by-step methodology in order to deal with a “financial appraisal” that is interactive in each context, customizable for each stakeholder, and user-friendly. The paper describes this innovative tool and reports on the stronger potential that this model can offer when it runs in a QGIS software environment and interacts with a PostgreSQL database, as demonstrated in two case studies located in Spain.

1. Introduction

The European Commission’s commitment to energy renovation of building stock and energy sufficiency in the Member States is growing stronger all the time, even more so after the COVID-19 pandemic, and is extremely urgent now due to the war in Ukraine. This ambition was previously revealed in the content and details included in the long-term renovation strategy of Article 2(a) of Directive 2010/31/EU [1,2], following the publication of Directive 2018/844/EU. In addition, this effort is also disclosed in the Green Deal presented by the Commission at the beginning of 2020, in which the “Renovation Wave” plays a leading role [3,4].
According to both the Green Deal and the Renovation Wave objective of making the EU climate-neutral by 2050, and considering the strategy proposed in the Next Generation EU recovery Plan [5], the European Commission aims to at least double renovation rates in the next 10 years, and make sure renovations lead to higher energy and resource efficiency [3]. To decarbonise the European economy, the European Green Deal, together with the Mission on Climate-neutral and Smart Cities, have set ambitious energy and climate targets [1,6] to reduce Europe’s greenhouse gas emissions and energy vulnerability, and to improve the reuse and recycling of materials. At the same time, the new adopted strategies will enhance the renewable energy sufficiency and the quality of life for people living in and using the buildings. In addition, studies confirm that 35 million buildings could be renovated by 2030, and up to 160,000 additional green jobs could be created in the construction sector [4]. Nevertheless, only 1% of buildings undergo energy efficient renovation every year, so effective action is crucial in order to make Europe climate-neutral by 2050 [7]. Promoting a series of strategies and solutions is therefore strongly recommended, which would allow work on the built environment with systemic approaches and the integration of stakeholders involved in the process [8,9,10]. Indeed, this approach aims to develop an innovative ecosystem, based on an integrated co-creation process in which cooperation between multiple stakeholders, and their engagement, are both common strengths of the transformation actions of the urban context. In this sense, business models that support the concrete implementation of renewal interventions are encouraged—e.g., One-Stop-Shops (OSS), Turnkeys and Public–Private Partnership (PPP) models [8,11,12,13]. In this context, the Positive Energy District (PED) is currently considered as one of the pioneering strategies to guide cities in their energy planning process towards climate neutrality in the next few years. Considering PEDs as one of the three pillars of the Driving Urban Transition (DUT) Partnership [14], should also be recognized. PEDs are part of the planned decarbonization of European urban areas, combining high energy efficiency with the production and use of renewables, ramped up to create sustainable smart cities [15]. In addition, the mainstreaming and implementation of PED models in cities, constitutes a very powerful engine of investment, growth, and employment, which could significantly promote the activation of a large rehabilitation of the national building stock, with much greater impact in the market. At the same time, as proposed by the European Commission, it will help meet the objective of 3% in annual rehabilitation, and expand energy citizenship [16]. Energy democracy and energy citizenship are keywords in this future strategy. Both are political, social, and cultural concepts tightly connected to an increased awareness of the need for a rapid, but also fair and inclusive, energy transition [17].
Although different studies and practical experiences on PEDs are focusing on newly built districts, it is necessary to urgently undertake a transformation process of existing districts, in a sustainable and climate-neutral direction [18]. Several ongoing works, initiatives, and research—e.g., COST Action PED-EU-NET, JP Urban Europe, IEA Annex 83 PED, etc.—are addressing the systematization of enabling factors, stakeholders and lessons learnt by mapping PEDs experiences abroad, and by designing an advanced database. Moreover, they are focused on the creation of structured repositories of information and data, aiming at driving urban transformations across the whole complexity of urban challenges, empowering the creation of capacity and community building as key aspects of the decision-making process, implementation, and replication of PEDs [19,20]. Thus, gathering data in a systemized database is one of the main methodologies adopted to assess and monitor multiple Key Performance Indicators (KPIs), supporting the whole process and/or promoting replication. Still, further, there are many barriers, both technological and non-technological (i.e., political/regulatory, economic, social), and most existing frameworks are not yet methodologically sound, which means that KPIs, system boundaries, targets, and business plan are not always clearly defined or addressed [21,22].
The economic and financial aspects of achieving sustainability and decarbonization by 2050 are not the only barriers of the renovation process, and the lack of clarity on how to afford home renovation is often a good reason for leaving the project. [23,24,25]. Furthermore, a stakeholder, e.g., the end-users, will only use the Renovation Wave if the renovation process is feasible, simplified, quick and cheap for them. For these reasons, the most challenging objective is to deal with the complexity of the energy renovation process, while reducing uncertainties regarding costs and time. Hence, it is the lack of certainty of a successful outcome and business model, together with the likely delays on delivery of renovated buildings, which can be considered as the most worrying aspects in this regard, and which make people unwilling to risk investment. Consequently, at an early stage, these aspects represent the first barriers for end-users, as well as for private investors and Public Administration, which are asked to engage in these large actions, especially when targeting renovation programmes on a district scale [26]. In cases where investment is very high, and access to external financing sources is mandatory, this usually consists of favorable loans (potentially subsidized), as well as public grants and revolving funds for vulnerable people [27,28]. Usually, economic and financial details are progressively refined as technical choices and costs are clarified. However, given the lack of capacity of homeowners to cope with the complexity and technicality of renovation schemes, energy renovation can only be upscaled if appropriate services and new PPP participants (e.g., General Contractors, Turnkey, etc.) are put in place on the supply side, in order to decrease the burden of renovation.

2. The PEDRERA Model’s Tool and Methodology

As explained above, the different strategies and plans promoted by the EU are not only focused on making existing buildings more energy efficient and climate neutral: namely, they can trigger an additional large-scale transformation and impact on our perception of cities and built environment [29]. Hence, the district is the right scale to be considered to start a forward-looking process matching sustainability with health and inclusion, while fostering economic growth and creating jobs in the next years. [30,31]. For all these reasons, advanced knowledge is required from the initial stage of the process to overcome other uncertainties and criticalities that are related to both the state and consistency of the building, and the affordability of end users. According to all these premises, the PEDRERA model has been designed to provide a coordinated and coherent response to the needs of the three main stakeholders considered in the process: end-users, the Public Sector, and Private Parties. Furthermore, at each step of their customer journey, the criticalities and potentialities from each stakeholder have been studied, thus making the renovation process as feasible as possible [11].
The work carried out by the PEDRERA project has been focused on developing a model able to support and boost energy retrofitting projects at large scale that are based on different energy conservation and active measures aiming at improving the behavior and sustainability of a district [32]. On the other hand, the PEDRERA model moves from the idea that both the aggregation of the demand side (the needs) and the intervention scale allow the reduction of the expenses and general costs of the intervention process together with other economies of scale. Due to the complexity and the large number of aspects and administrative barriers that must be resolved in this type of process (e.g., vertical and horizontal property, building consistency, building regulations or the technical building code), the estimation of financial and economic effort together with the collaborations between all local actors (SMEs, financial institutions, energy agencies or private investors, entities, and PAs, etc.) are crucial elements for the success of these large-scale transformation processes. Hence, the cities and communities, in cooperation with local financial institutions and investors, can help to overcome these shortcomings by developing user-customized financial products and models—e.g., PPP models—and adopting innovative services—e.g., One-Stop Shop (OSS)—or Turnkeys solutions which allow the investment to be more attractive, more agile, and adapted for different types of owners and for different types of buildings, and with economic conditions that are more reliable and profitable [10].
To reach this objective, the project team has created a new tool able to reduce the time delivery and tackle the uncertainties of most usual business models. Indeed, the PEDRERA tool represents a very operative solution to accomplish several lead goals:
  • Embracing accessibility and well-targeted funding streams, as well as multiple incentives for private financing.
  • Supporting the very beginning activities of One-Stop Shops and Turnkeys models for building renovation at large scale.
  • Increasing the capacity building and the implementation of renovation projects by reducing uncertainties to regional and local authorities (Public Sector) and private investors (Private Parties) as well.
  • Developing neighborhood-based approaches for local communities to integrate renewable energy production and digital solutions dealing with zero-energy districts.
According to these objectives and ideas, the PEDRERA project led to the design of a tool able to set up and analyze a reliable prediction of potential business scenarios on large-scale retrofitting actions and to evaluate the overall co-benefits deriving from the renovation process of a group of buildings at the district level. Therefore, the designed framework of the model is systematized in a way that the information database is collected in a Geographical Information Systems (GIS) environment, and then data are used to forecast and manage, from the very early stage, the feasibility of a large-scale project thanks to the tool algorithms programmed in Python. Then, the tool has been tested and validated in two demonstration districts located in Spain: Santa Coloma de Gramenet and Palma de Mallorca.

2.1. PEDRERA Model Input

The PEDRERA model is designed as a multidisciplinary tool that starts from the aggregation and systematization of several gathered information (input) at the building scale in a semiautomatic way. Once all the information is collected, then the model engine returns a set of multiple features (output) related to the adopted parameters and renovation measures that have been aggregated and stated for the district-scale intervention. These input and output are organized according to different categories and KPIs that include economic, technological, and non-technological aspects, namely issues [32].
The model methodology is based on two pillars: (1) the creation of a database by collecting a wide range of information and data available from cadaster (cadastral code, type and functions of the buildings, age, properties rate) and other sources, and (2) the integration of these primary inputs with the other queries, thus allowing the final design of the intervention within the innovative engineered tool. The interoperability of input within the model regards three stages of integration:
  • The aggregation of semantic data from cadaster with data mapping processes in GIS environment to ensure interoperability to the model among different platform components and consistency of communications.
  • The adoption of Energy Conservation Measures (ECMs) and Active measures from a database of technical solutions that, according to the physical consistency of selected buildings on GIS map, return information on design, intervention costs, energy upscale and potential subsidies achievable from Next Generation EU programs.
  • The integration of the results from the previous step as input to be enclosed in the financial and business model engine, thus allowing the design of several large-scale scenarios and finally the implementation of the selected one.
The input collection represents the first key activity of the adopted methodology deployed in the PEDRERA project, and follows a multiparametric approach as shown in Figure 1 that involves three matching processes referring to the above-mentioned stages:
  • Stage 1: Gathering information from multiple sources of data available in a database (i.e., open data as the national cadaster) based on a GIS environment (PostgresSQL) for clustering and characterizing each building.
  • Stage 2: Applying measures and cadastral data to the selected buildings (Table 1) for economic appraisal and cost analysis across the two so-called PEDRERAs: “Extra Core programming model 1” and “Extra Core programming model 2”.
  • Stage 3: Importing input as CSV files in the designed wizard of the “Core programming module” to enhance the business model scenarios, and to compare and definitively select the most suitable.
The “Extra Core programming module 1” (ECpm1) has been designed to collect data from the selection of buildings on the GIS Map and includes all the information available from cadaster. Data are imported as CSV from PostgresSQL and systemized in “Building Attributes”, “Architectural Characteristic”, “Cost Analysis”, and “User Type”. Once imported, all the gathered information in ECp1 can be adopted also in the “Extra Core programming 2” (ECpm2), where both passive and active “Renovation Measures” are implemented on the selected buildings on GIS for a more detailed “Cost Analysis” at building scale. Hence, the analysis in the ECpm2 is focused on applying several intervention menus to each selected building to assess the economic effort (“PEC”) and achievable funds (“Grants%”) from each building to be considered in the “Cost Analysis” and “Business Model” design within the “Core programming module” (Cpm). Indeed, the application of each intervention measure enables us to: (a) define the potential reduction of the energy demand required to access to the percentage of achievable grants (40, 65, 80%) as stated by the Spanish Recovery, Transformation and Resilience Plan regulated by the Real Decreto RD 853/2021 [33]; and (b) estimate the duration of intervention works required for the cashflow analysis (“Cash Flow Diagram”) as output of the PEDRERA Cpm. The widespread knowledge of the building stock is crucial for the development of an effective energy retrofit aimed at reducing energy consumption and greenhouse gas emissions and increasing RES production [34,35]. Regarding to the estimation of (a) the cost of intervention (PEC), (b) the predictable level of energy efficiency, and (c) the grants obtainable with the retrofit action, two different methodologies have been applied.
The first method means an indirect, simplified, and quick analysis to be conducted on the selected buildings, according to the customized clusterization [36,37] and/or the acknowledged literature [38], by typology (single family/multifamily buildings) and age, and then applying an average renovation cost for dwellings (EUR/dwelling) to each type of selected building, according to the literature [39,40]. Otherwise, costs for each technical solution are imported by available platform [41,42,43,44]. The cost and grants analysis can be calculated without the use of the ECpm2. The characterization of buildings is incorporated in ECpm1 as CSV file that includes a systemized selection of the “Building Attributes”, “Architectural Characteristic”, and “User Type” from the entire database loaded in PostgresSQL. Once buildings are selected on the map, then data are merged in the module and systematized according to the cadastral reference codes “14” and “20” provided by the Spanish cadaster. Each code is related to each building and to each household within the building, respectively. In this way, parametric costs can be applied taking into account the main information on use (residential, commercial, etc.), typology (n. of dwellings/premises), and age (construction period). In addition, the “cadastral ref. code 20” is adopted also to collect the information on the “partition rate (i)” within each building where the breakdown of expenses is, of a kind, proportional. The weight of these coefficients is very important for the feasibility of the renovation programme, as also when the cost of intervention is shared among owners of the same building, because its value may considerably vary according to the type and size or position of each single unit (dwellings or premises) in the building.
The second method means a direct estimation and the systemized information on the selected buildings is imported from ECpm1 according to the “cadastral ref. code 14”. For this scope, a database with renovation measures has been created to be used in the ECpm2 according to different market-based budget generation sources and taking into account the most effective solutions that are traditionally adopted in the Spanish retrofit market sector. The measurement of the building’s consistency—e.g., facade and roof m2—is carried out with a very fast survey method based on calculation from numeric and digital information (i.e., *.dxf, *.shp, *.gml, *.kml format file) available from the Spanish national cadaster web page [45] and is assigned to each building. In addition, a quick visual ratification from online platforms allows the geospatial data to be displayed and validated on a map (e.g., “3D maps” and “Street View”) [46]. In this way, the data is organized in the ECpm2 and systematized for each building according to the roof, external vertical walls, and window extensions. Once consistency is collected, renovation measures are applied. Then, the renovation measures are refereed to each category of the renovation menus (A, B, C) (see Figure 2) and their cost is evaluated and validated according to consolidated regional construction costs repositories, i.e., the BEDEC database from the Institut de Tecnologia de la Construcció de Catalunya and/or the CYPE Ingenieros Generador de precios de la construcción [47,48].
Several measures were identified according to each menu of intervention, for windows (aluminum and PVC framing with thermal cut, low emissivity, and standard double glazing), walls (ETICS—External thermal insulation composite system), and roofs (engineered polyurethane, agglomerated cork, expanded polystyrene), as well as for other active solutions (BIPV—Building Integrated Photovoltaics and solar panels), equipment (heat pumps, MVHR—mechanical ventilation and heat recovery, but also elevators if required for accessibility), and structural improvement solutions (reinforcement, new roof, etc.). For each efficient measure, information on the physical and thermal properties as well as its investment costs are collected. Furthermore, the inputs are finalized to provide specific information for calculating the potential investment KPIs and several other co-benefits to be achieved through the renewal process, ones that are profitable and/or feasible for the actors involved in the process; i.e., the prediction of energy demand reduction associated to each measure and cost of intervention is a key aspect for calculating grants % in the model, as mentioned above. Indeed, once the collection of input on cost of intervention (PEC) and on achievable grants is concluded, then an advanced Cost Analysis is performed in the ECpm1.
The first phase of the financial appraisal is based on the cost analysis obtained with one of the two methods. In addition, further information and characterization of the User Types (UTs) is needed to design the entire business model as well as to overcome the economic vulnerability of some low-income users. Indeed, the “cadastral ref. 20 code” provides the information on the “partition rate (i)” coefficient, as explained above. The awareness of the UTs therefore allows the reduction of the monthly fees necessary to cover the retrofit costs by single users and, at the same time, allows the calculation of the effort of dedicated public subsidies requested from the Public Administration. Furthermore, this estimation is functional for the calculation of other relevant business model KPIs, e.g., the Financial Amount required, the Financial Costs for Private Parties, the Financial Needs and the Cashflow of the entire renovation process, etc. For the calculation of entire outputs from the model, additional and customizable inputs are required and, so, they are programmed within the model. Data are collected in a special wizard panel of the Cpm programmed in Python. These customizable parameters run together with that data deriving from the above described ECpm1. The Cpm is designed in a way that data from ECpm1 can be automatically gathered in Python as .csv file or, if required, the data can be entered manually without the need of the extra core. The selection and ranking of the main parameters are based on specific information or the needs of the stakeholders, or as a requirement of renovation program.

2.2. PEDRERA Model Output

Once inputs are collected from ECpm1 and ECpm2 in the Core programming module, algorithms return several outputs based on additional parameters ranked in the wizard panel of the Cpm, which will help to design customized business model scenarios according to each stakeholder perspective. Each output is assigned to five main targets related with several scopes: (i) Financial Appraisal, (ii) Renovation Strategy, (iii) Energy Community, (iv) Welfare and Security, (v) Marketing. Hence, it must be noted that the outputs obtained by running a typical simulation of the PEDRERA model return a wide number of KPIs and other information deriving by the aggregation of data. The model calculates several KPIs for different stakeholders in addition to intermediate results (the shared cost of the operation to be added to the single building renovation costs). The main KPIs adopted in the financial appraisal are: (1) the Monthly payments (the total value of monthly payments that each type of user should pay. The amount should stay within the user’s ability to pay: namely, EUR 120 is the upper monthly limit, or a maximum amount of EUR 6300 per dwelling is considered); (2) End-user Savings (the percentage of investment an end-user can save if they adhere to large-scale intervention, compared to the same type of retrofitting works done on the single-building scale); (3) Public Sector Operational costs (the operational cost assumed by the Public Sector); (4) the Revolving funds (the investment amount granted to UT4—inscription—that will be recovered when the property is transferred to a new user; (5) Private Parties Operational costs (the operational cost assumed, considering both direct and indirect costs assuming overheads); (6) Gross Benefits and EBT (Earnings Before Taxes), expressed as value and % of operational costs; (7) Financial costs (estimated financial costs according to the loan rate and its duration); (8) Financial needs (the loan capital necessary to cover operation costs); (9) Cash-flow (based on the economic model’s calculation of the operation-related cash flow ROI).
Specific outputs are presented for each type of stakeholder, i.e., End-users, Public Sector, and Private Parties (Table 1). One of the most relevant End-user key parameters in the Financial Appraisal, displayed in the output dashboard is the average value of the final investment according to the monthly/rate payments depending on the User Types (UT) characterization. Indeed, each UT category means one to five typologies considering the number of scheduled fees (pay), the loan duration between 5 and 10 years, or the level of vulnerability:
  • UT 1 (2 pay).
  • UT 2 (60 pay/5 years).
  • UT 3 (120 pay/10 years).
  • UT 4* (2 pay/5 years). * Financing scheme for vulnerable people covered by Public Sector.
  • UT 5 (96 pay/8 years).
The first category UT1 means that type of user—e.g., companies or commercial—is able to cover two payments at the beginning and at the end of the rehabilitation works. The UT2 means that the investment is covered within the time frame of 5 years in 60 monthly quotes to pay. The UT4 represents the financing scheme adopted for vulnerable persons and that is entirely covered by Public Sector in the time frame of 5 years. The last two user types, UT3 and UT5, refer to the payment of the whole financial operation for a longer time frame (10 and 8, respectively) with, consequently, a higher number of monthly quotes and an extra cost considered for the extended loan, but a reduced monthly payment.

3. Case Studies

The first important step in order to validate the PEDRERA model was to test the methodology and the model prototype in existing energy-efficient retrofitting projects at district level. Thus, the idea was to compare the results provided by the model with at least one performed project where data related to the performance of the district before and after retrofitting was available. Finally, two specific case studies were selected to test the model’s performance under different conditions including climate aspects, boundary conditions, uses, building typologies, intervention levels, conservation conditions, existence of specific barriers, consideration of historical buildings, and other aspects.
Therefore, once the model had been designed, the PEDRERA tool was tested in two case studies in Spain: one in St. Coloma de Gramenet, deputy of Barcelona; and the second in the city of Palma de Mallorca. For this test, before the selection of the buildings, two cadastral databases were completed.
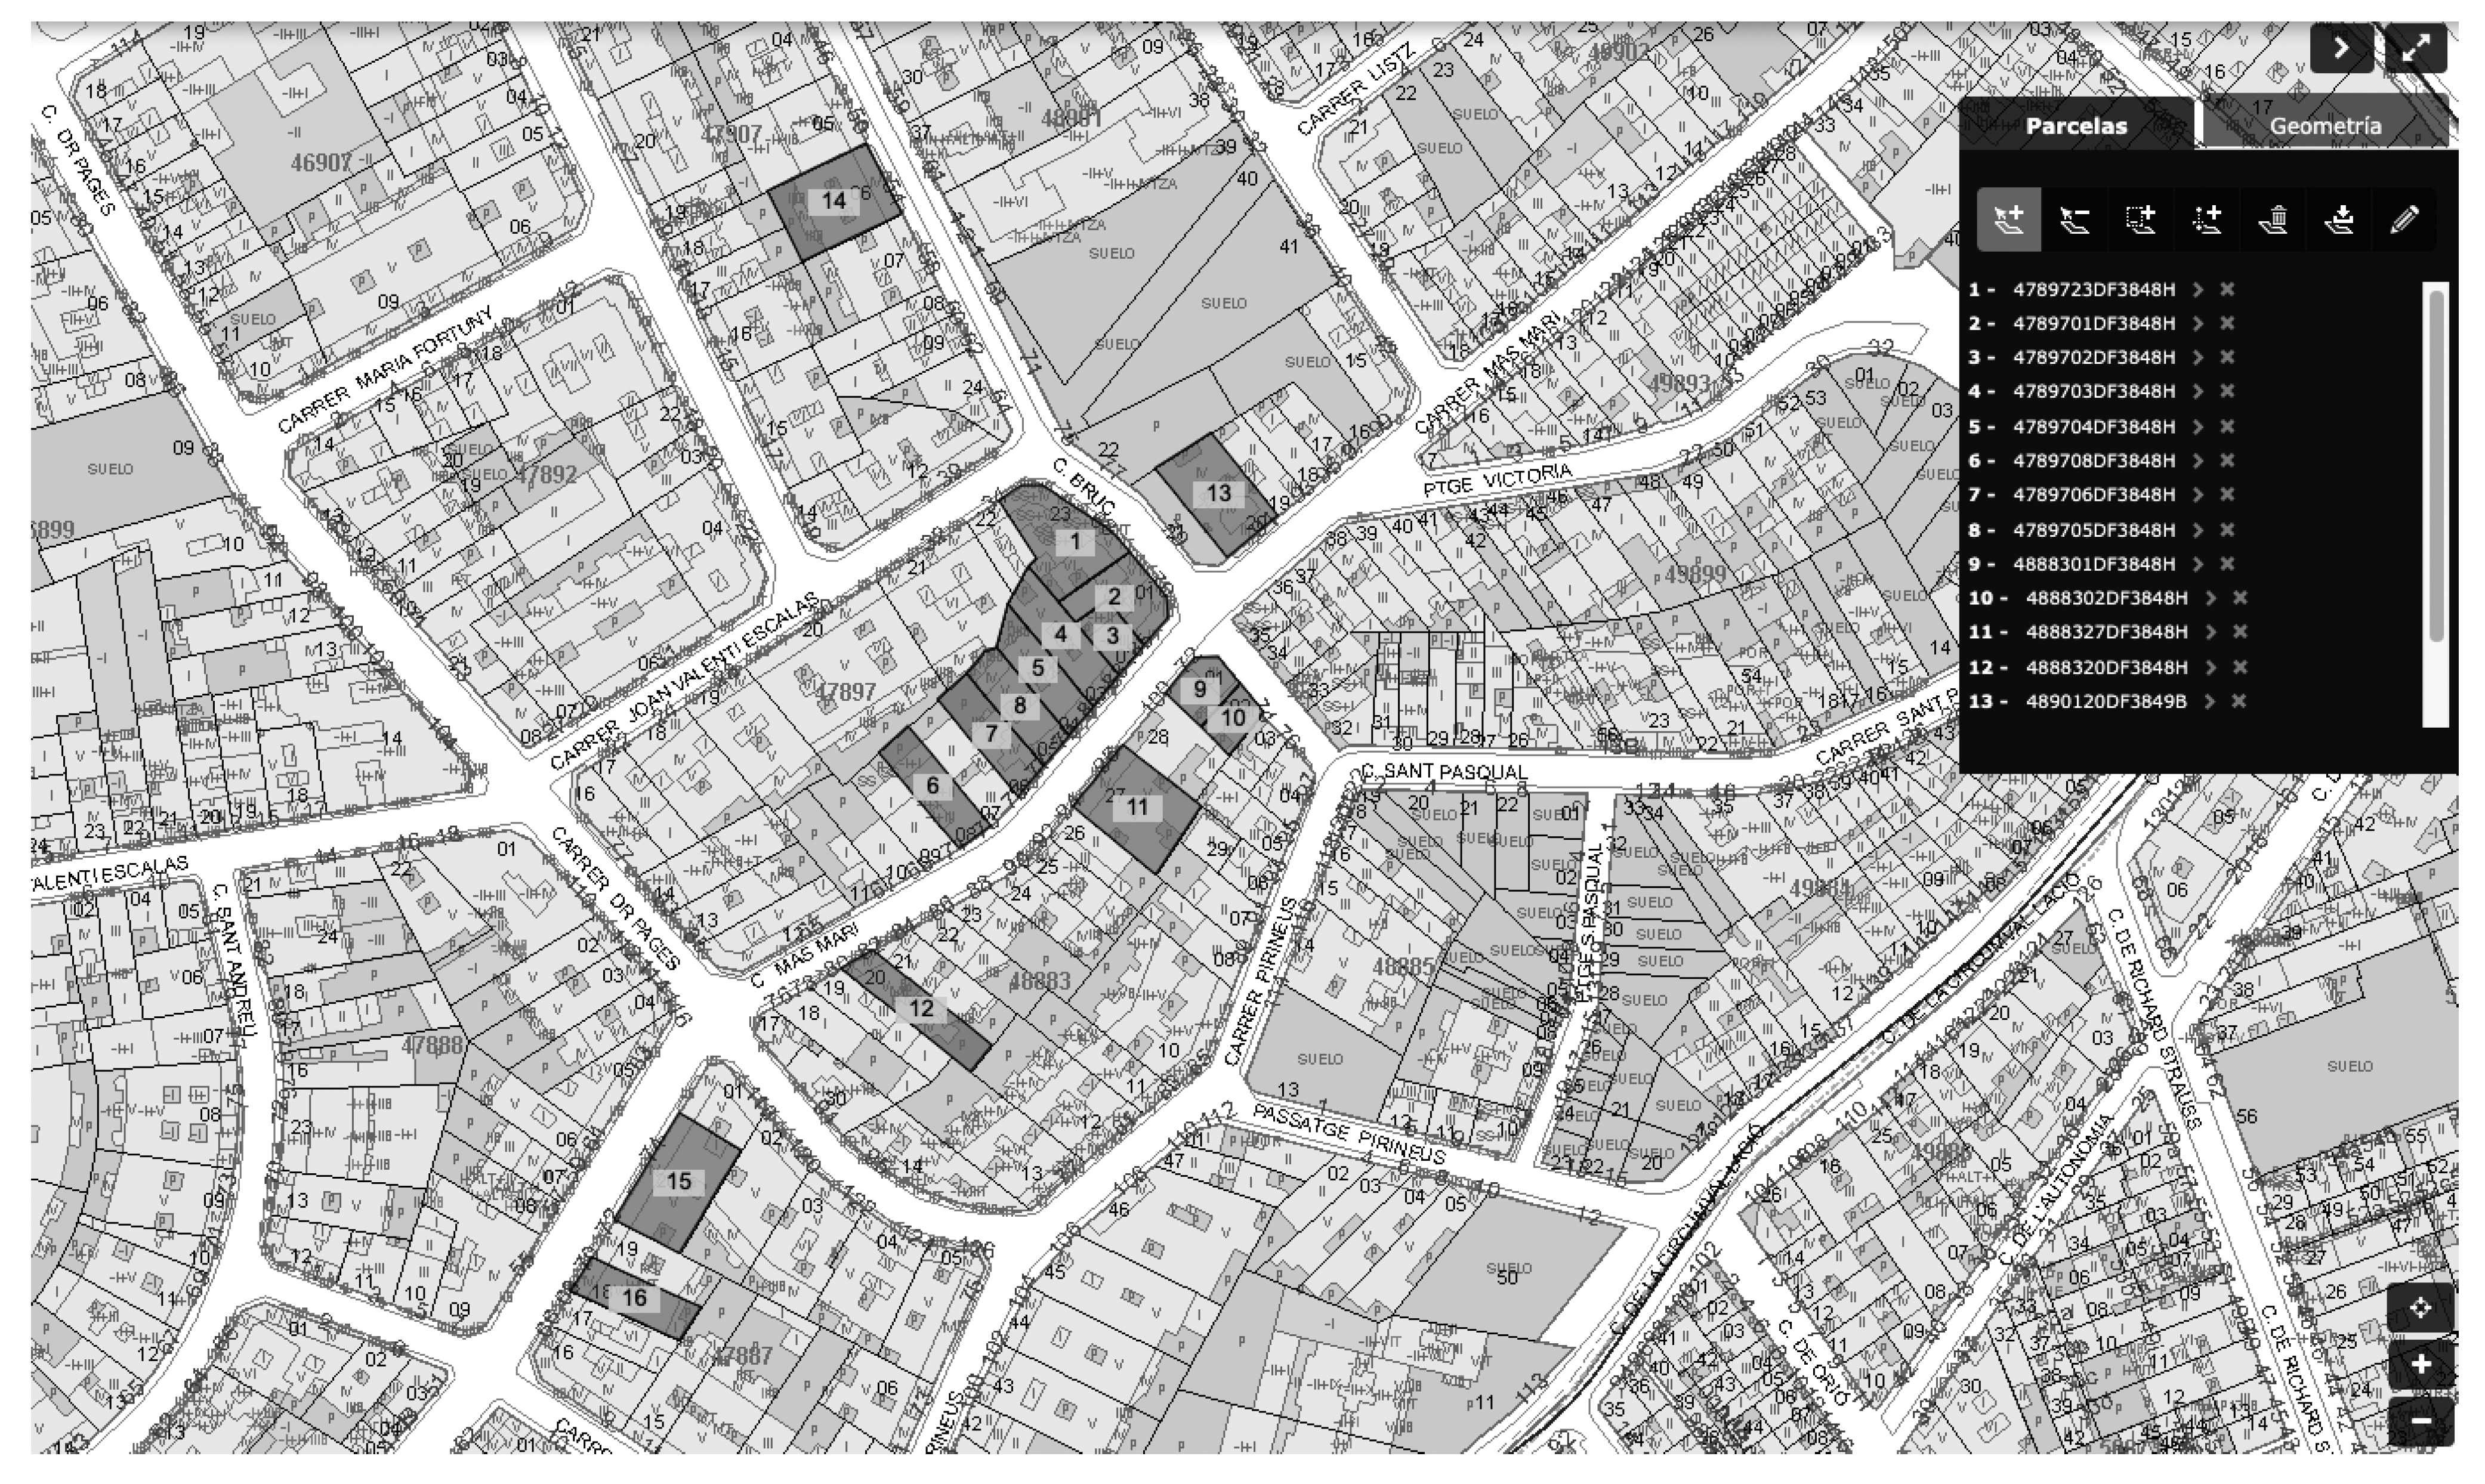
In the first case study, St. Coloma de Gramenet, 16 buildings were selected from a recently concluded real large-scale renovation plan (ACR 2, “Mas Marí”) [8,49,50] as showed in Table 2 and Figure 3. In this case study, wider and more detailed information was already available from a recently concluded intervention and has been adopted to validate both the model and the operating of the whole tool as well. The available information regarded the renovation costs and solutions from each building (e.g., the adopted measures on façade and equipment) and also the cost of design, construction supervision, and other operational costs (Opex) from public and private parties engaged in the process. Furthermore, the UTs categories (i.e., UT1, UT2, UT3, and UT5) for the different households and tenants were considered as well as the provision of revolving funds covered by the PA (UT4).
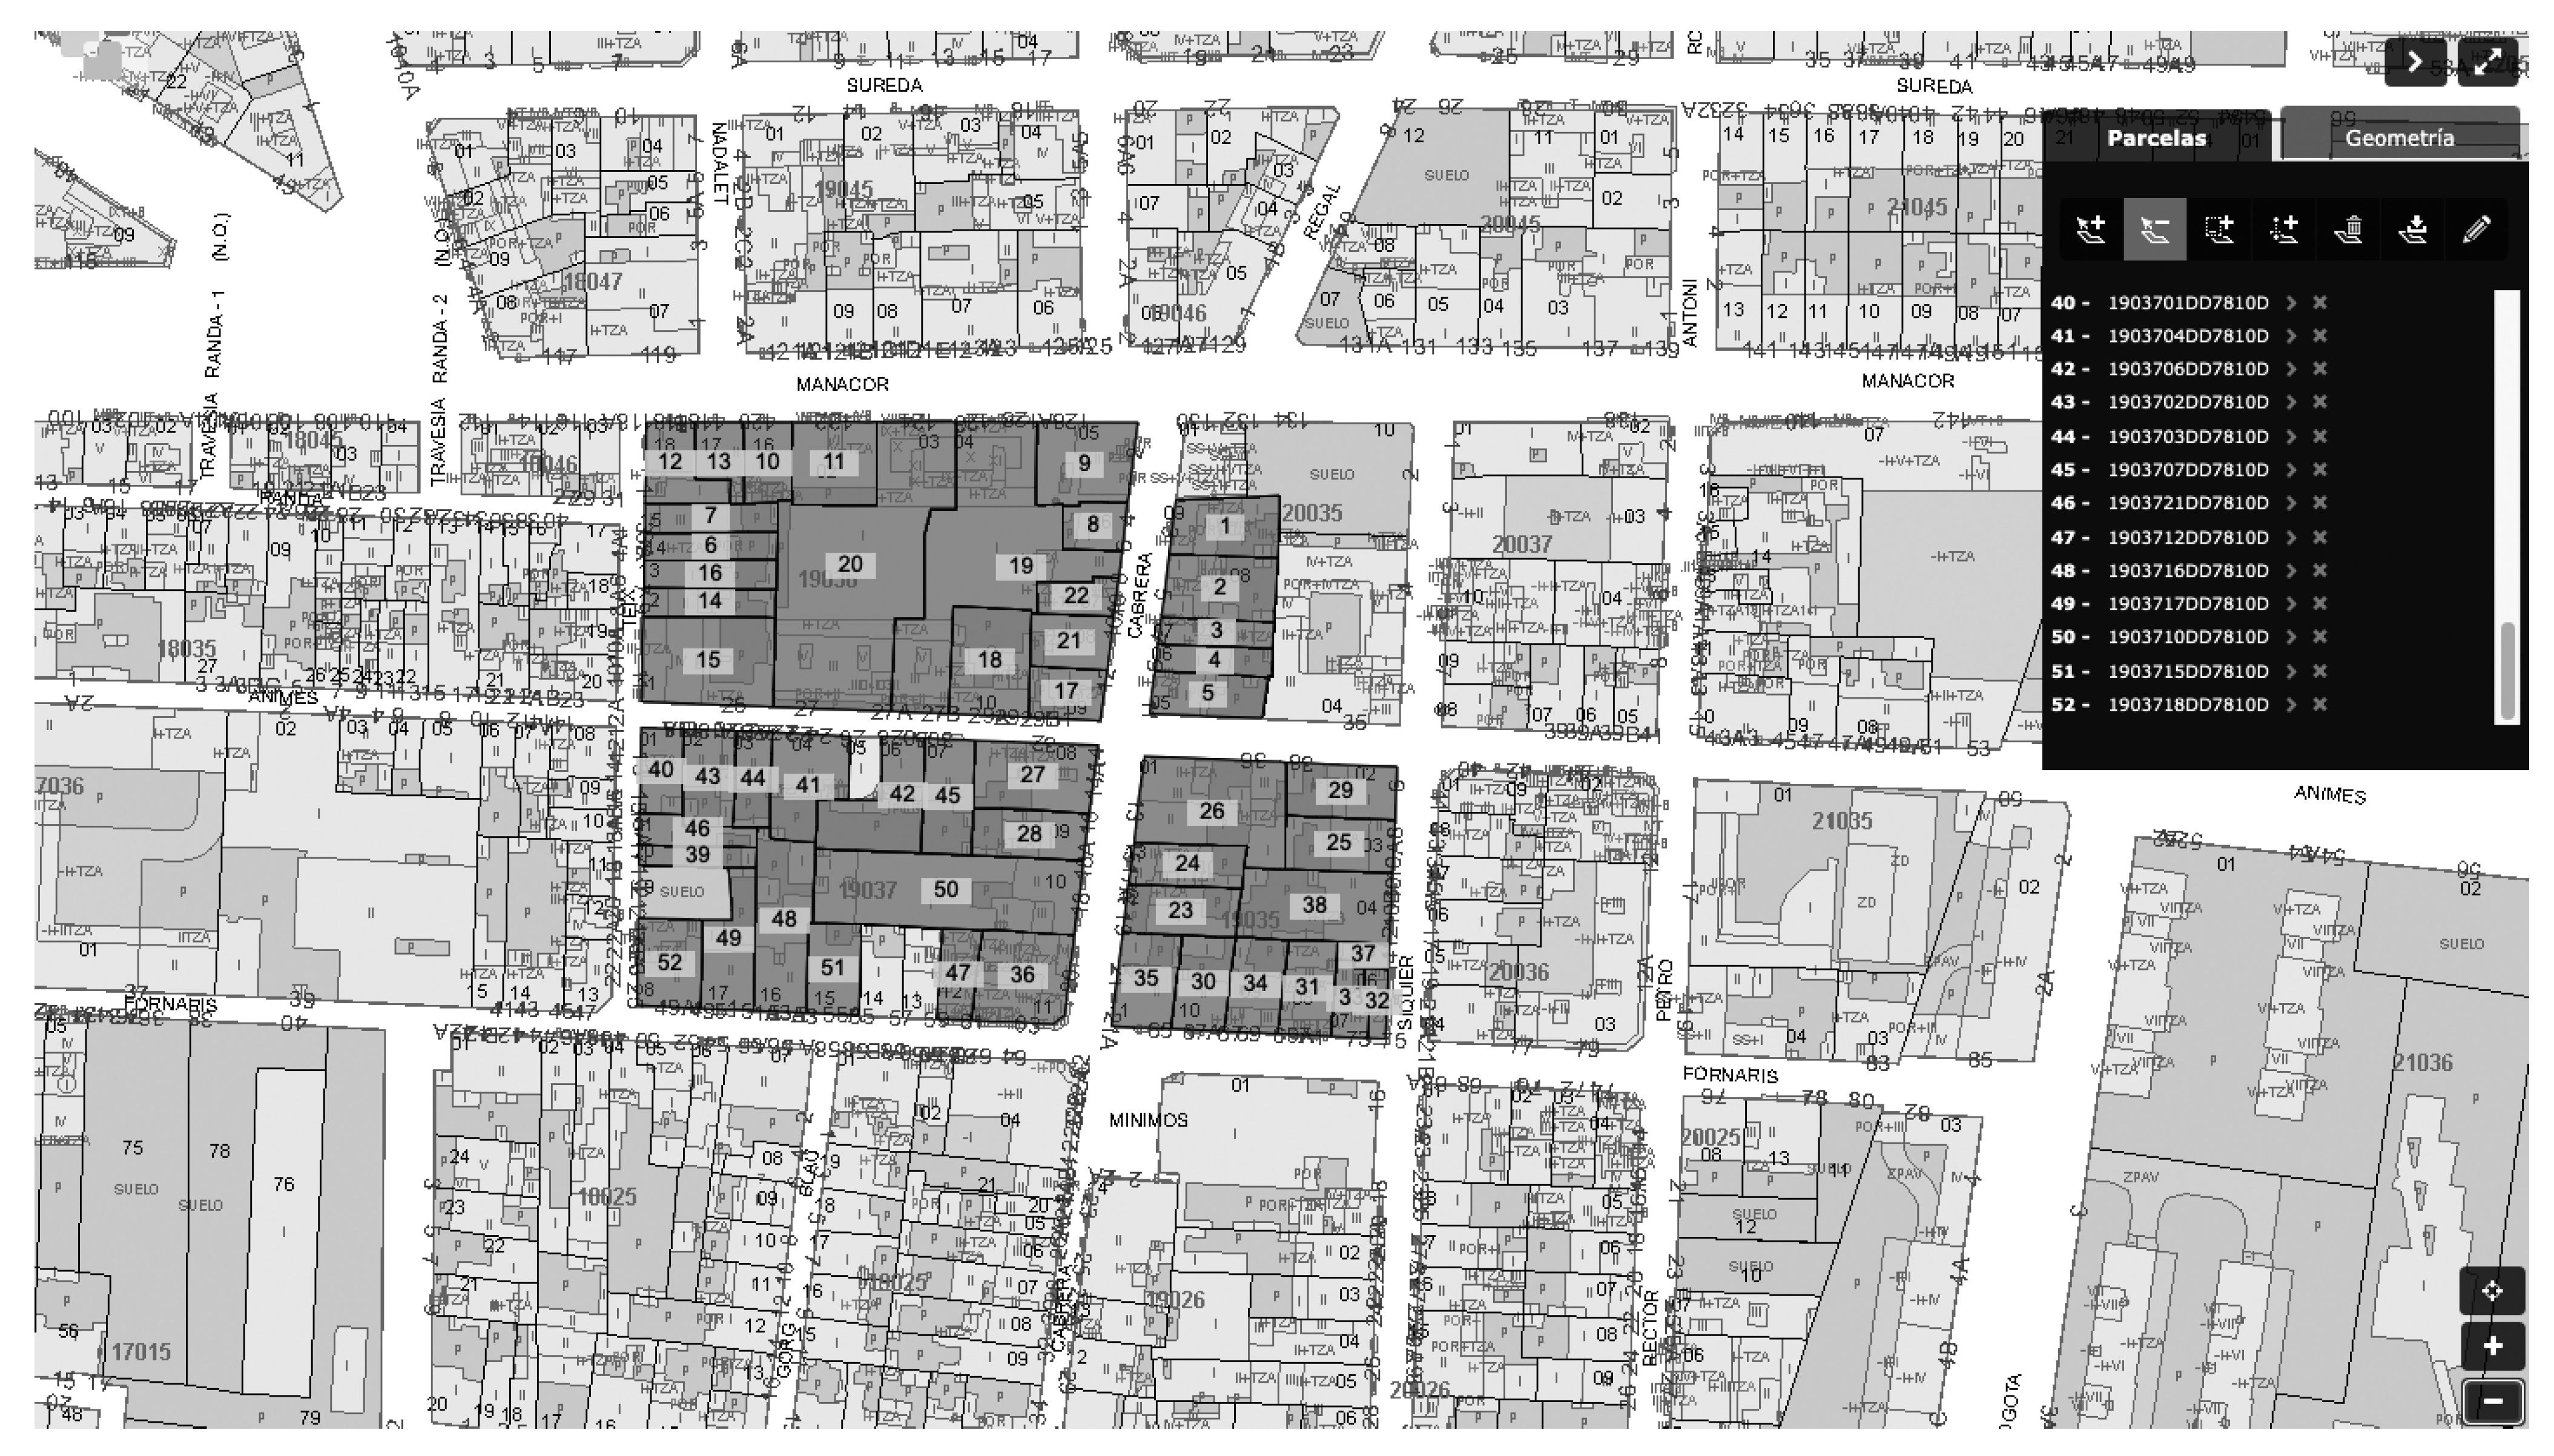
In the second case study, 52 buildings were selected (Table 3) within a consolidated urban area of La Soledat Sud district in the city of Palma de Mallorca, as part of a new, broader refurbishment program planned by the municipality in the next few years with the particular objective of reaching a nearly net-zero energy district.
The wider large-scale retrofitting action in La Soledat Sud is part of the ARV-funded project [51] aiming to renovate 250 private dwellings (26,800 m2) by means of a novel Public–Private Partnership mechanism (Figure 4). The retrofitting project is an opportunity to improve the quality of life of the whole neighborhood. The aim of the retrofitting is to achieve both a reduction in the energy demand of dwellings by around 35% as well as reducing the energy cost for residents and, therefore, CO2 emissions. Likewise, the interests of potential stakeholders, such as the promoters and the constructors in the districts, are addressed. Currently, these buildings are not insulated on facades or roofs, so an action of refurbishment in these elements will substantially improve the thermal conditions and comfort.
In the second case study of Palma de Mallorca, some of the settings of the model handled in St. Coloma de Gramenet had been used in order to be able to compare the results. In this case, the clustering of buildings was defined by typologies (single-family/multifamily buildings) and age, as stated above, and then, according to the literature, a customized cost of intervention (EUR/dwelling) was applied to each type of selected building [28,43,52].
In both methods, the potential energy benefits of each building were assessed according to the “energy renovation strategies” report of the Institut Català d’Energia (ICAEN) [37]. The report represents the consolidated reference adopted by the Spanish LTRS plan [53] for the updated Long-Term Strategy for Energy Renovation in the Building Sector in Spain (ERESEE 2020) [27], and by the Enerpat and Enerhat platforms [39,42]. Nevertheless, as explained above, for the determination of the cost of intervention and energy savings for each building, a quick survey of the consistency of the buildings was carried out to subsequently establish a cost comparison with the advanced studies of ICAEN.
A first package of passive measures, “PQ1+” (“PQ1” meaning insulation of exterior façade with EPS of 6 cm, insulation of interior roof with 8 cm of mineral wool and renovation of windows with a PVC frame and low-emissivity glass, “+” meaning additional solar shading systems), was adopted in both case studies. According to the above-mentioned report from ICAEN, this package of energy efficiency measures achieves important savings, up to 40% of final energy consumption in most types of housing. Specifically, the savings are less than 40% only in some Spanish climatic zones of types C, D, E, and I. A second comprehensive rehabilitation package of passive and active solutions, “PQ5+” (i.e., “PQ1+” meaning insulation in the facade, insulation of roof, change of windows, solar shading, “+” meaning renovation of the boiler and PV/solar panels for RES), was limited to just three buildings in Palma de Mallorca where the extension of the envelope and therefore the economic effort were minimal. In that case, the renovation package allows very significant energy savings, between 32 and 57% final energy savings in mild climates (B3) and between 46 and 66% in cold climates (E1).
According to the different measures adopted in each building, the average costs of intervention had been calculated (Table 4). The obtained average cost in the Palma case study was EUR 17,335.58 for a single-family dwelling and EUR 13,858.99 for a multi-family dwelling. In the Santa Coloma case, this value drops to EUR 7797.02 for a multi-family dwelling. The discrepancy of these intervention costs (PEC) is mainly the result of the differences in consistency (building typology, no. of floors, extension of the envelope and state of conservation) of the buildings, rather than the package of measures adopted.
In order to endorse both the methodology and the test, these costs have been compared with the average costs per dwelling (both multi-family and single-family) from four different sources: ITEC LCQA 2016 [24], ERESEE 2020 [27], PMRH 2021 [28], and ICAEN 2016 [37]. This activity confirmed that the values adopted as model input in the Palma de Mallorca case study are quite below the average value per dwelling obtained from the different databases described above: i.e., EUR 25,936.10 for single-family homes and EUR 11,165.46 for multi-family homes (Table 5). As a result, there is evidence of a deviation span around −24% and +23% (with an average value of −8%) in the case of Palma de Mallorca when compared to parametric costs from the literature in Spain [27,37]. This comparison was also implemented in the case study of Santa Coloma of Gramenet where the final real costs provided by the Local Administration had been assumed in the model. In that case, the results confirmed a higher deviation span around +2% and +124% between real intervention and parametric costs [27,37] with an average span of +52%. Therefore, a quick smart survey of the state of the buildings and/or an existing database is very relevant for the evaluation of building consistency while calculating the economic effort of each measure to be adopted in a large-scale action. Indeed, the initial knowledge about consistency is essential for making the process smarter and more predictable.
All the proposed packages of measures have been designed to achieve a reduction in energy demand above 35%. This reduction means a grant percentage of 35% based on the national grants that can be obtained for retrofitting in Spain [33]. Otherwise, for the definition of the different scenarios, higher costs of intervention can be accepted, thus achieving a reduction in energy demand around 45–50% or higher, which would allow access to a subsidy between 40 and 65%, or 80%.

4. Results

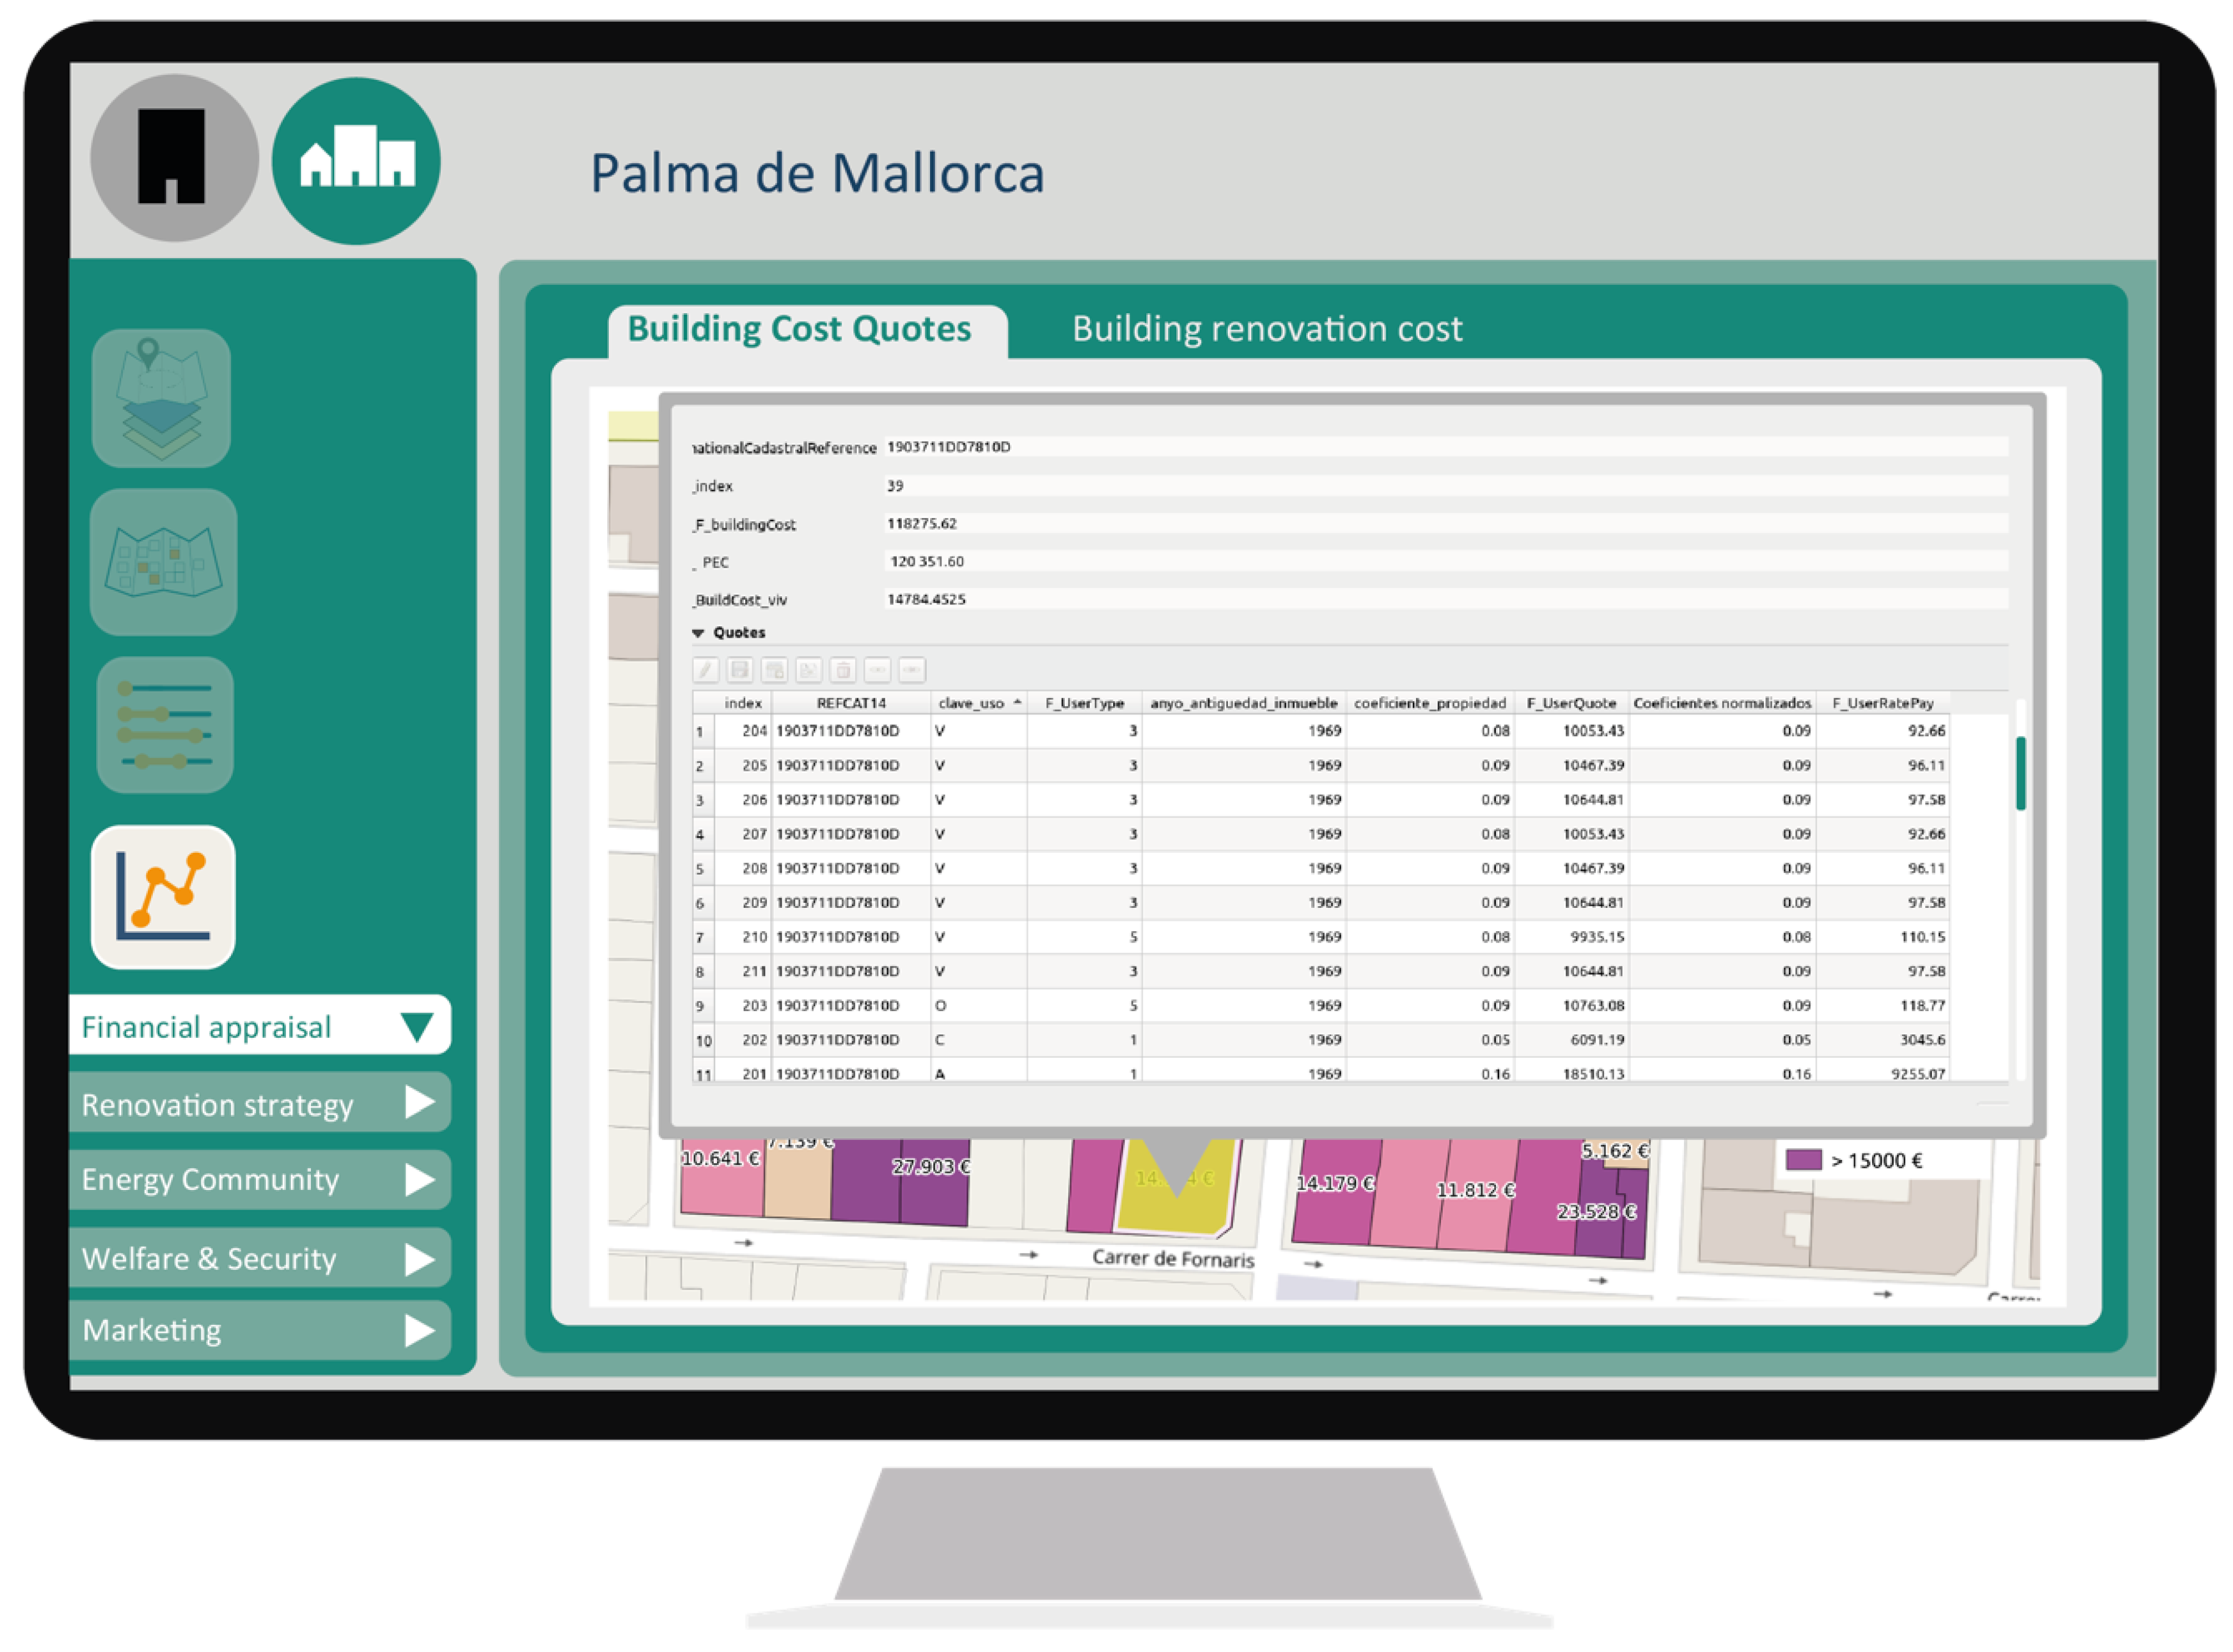
The main insights of the PEDRERA project can be considered to be the broader “envisioning” of the project and the design of a tool able to support the renovation process thanks to: (a) the gathering and aggregation of information and data according to the four domains in separate databases as described above; (b) the management of a large number of buildings that can be directly selected on a GIS-based map, in order boost large-scale actions; (c) the design of the scenarios in a Python programming environment inspiring a multidisciplinary approach and stakeholders’ perspectives; (d) the prediction of multiple scenarios as a result of the designed tool and algorithms able to consider a large amount of data; and (e) the visualization of the planned economic scenario in a QGIS environment as briefly shown in Figure 5, Figure 6 and Figure 7.
The results of the economic model demonstrate that the model is robust and flexible enough to allow different breakdowns between user types, variations in operational costs, variations in financial costs (i.e., interest rates), investment per dwelling (7000–14,000 EUR/dwelling) for single and multi-family homes, and number of entities that are involved (over 150). Its robustness refers mainly to the feasibility of the final monthly end-user payments (UTs 2,3 and 5) remaining below EUR 120 or rising to undergo a large-scale retrofitting operation (Table 6 and Table 7). Its flexibility mainly refers to the capacity to adapt the business model not only to the different schemes available or to the target feasibility, but also to provide: multiple technical solutions; multiple deductions/subsidies based on the planned level of energy efficiency; different durations of loans; and other benefits and savings for all stakeholders (shared costs, reduction of operating costs, increasing property value as a result of economies of scale).
In addition, the test demonstrated that while adopting both methods (direct/indirect), the costs of intervention were partially satisfactorily coherent among them. In some cases, a range deviation greater than 15% was observed due to the varied and spontaneous building typologies (mainly single-family buildings) in this area, and their age (62% were originally built before 1940). For this reason, the second method with direct cost analysis was adopted when deviation was higher than 15 % compared to the indirect method (parametric) based on the literature applied to the cluster of buildings. As result of the test phase, the PEDRERA tool has been shown to be very flexible when modifying the input data, such as the number of entities that are used for dwellings or other uses, percentage of grants, service costs (e.g., operational, financial costs) for the agent involved, public–private participation fees in the different phases of the renovation process, percentage of users of different types (UTs), duration and cost of loans, and the distribution of shared costs and quotes within each building. Furthermore, the model is designed to define the type of loan (duration, number, and amount of rates) based on each main type of user (UTs), and thus is able to foresee and to mitigate situations of economic vulnerability or other arrears situations.
On the other hand, static data from external sources are stored in a database provided by CICLICA [32]. As a result of the PEDRERA tool, having access to databases such as the cadaster permits a very fast analysis and a formidable collection of information for the agents interested in the business model. Once data are gathered in the PEDRERA model from selection on the GIS Map, then they are combined with editable ones from users in both the Core and Extra Core wizards. However, the interoperability of the tool does not make it exempt from a direct analysis of the building and social consistency, or from the verification of the data contained in the cadaster that, in some cases, have been proven to be incorrect or out of date. For example, if a building did not exist anymore due to previously unreported or outdated demolition, or maybe recent renovations had been carried out but not registered in the cadaster, it was excluded from the analysis.
When all the inputs are correctly collected, then agents can design different scenarios by customizing several business models. The scenarios are displayed directly in the PEDRERA app, as well as output files in .csv format that successively will be exported to PostGIS. Before exporting and visualizing the selected scenario in GIS, up to three comparable scenarios can be displayed in the user-friendly frontend of the PEDRERA app. Therefore, the model provides a comparison of the different results as a multi-radial diagram visualization that covers each KPI resulting from the model and that is organized for each stakeholder in both the analytics and the diagram. In this way, the user of the tool can select a scenario that better fulfills their expectations and objectives.

5. Discussion

One of the main challenges faced by the PEDRERA project was to tackle the lack of a coherent and coordinated business plan from design to implementation, and to deal with the absence of feasibility and prediction which discourages people and limits the potential savings and co-benefits achievable by large-scale actions. The use of the model methodology and PEDRERA tool is helpful to reduce the burden of renovation programs that are crucial to deliver these goals at the right scale required.
The financial appraisal module is part of a larger vision of the PEDRERA model [32] that also considers other relevant aspects of the PED approach, i.e., energy production, CO2 reduction, and impact on citizens’ security and welfare, among others. A wide list of input and related KPIs are partly included within the algorithms of the financial appraisal (Figure 2) and are part of the “inter ecosystem compatibility” concept of the PEDRERA model. Indeed, thanks to the interoperability of the designed tool with GIS and the whole Python programming environment, these aspects can be easily considered in the multidimensional analysis while designing the renovation process. In addition, the PEDRERA model is open and flexible enough to implement the financial appraisal module in other ongoing available tools [44,54,55], which adopt a similar interoperable methodology to PEDRERA and are also focused on energy production, balance, and flexibility in Renewable Energy Community (REC) and PED design. This strength allows to assess the wider and complex feasibility of the process.
The economic evaluation is likely the most important achievement considered in the PEDRERA model [8,22,32], and the algorithms leading to the financial appraisal are based on numerous considerations and experiences that have been previously tested and implemented in several cities/regions across Europe [56]. Moving from these experiences and successful business models, one of the most proven and attractive outputs for nearly all household types is the impact of soft loans. Indeed, soft loans lend money to homeowners at a lower interest rate than standard market conditions, enabling homeowners to borrow money to carry out renovation work that increases the energy efficiency of their homes. Furthermore, as a key input of the financial plan, the loan costs affect the marketing effectiveness as well the calculation of the Return of Investment (ROI). Therefore, soft loans are part of the third-party investment plans and include other advantages, such as a longer term to maturity, and lower administrative and insurance costs. The overall budget and the financial conditions are meant as key aspects able to ensure the viability and success of the global operation. It should be ensured and demonstrated to the neighborhoods that the overall budget is quite reduced compared to the market condition. Easy-to-use financial mechanisms should manage the budget, ensuring minimal to no initial spills and, typically, long payment periods. Indeed, the payment period adheres to a time frame acceptable to both end-users and financial institutions (typically 5 to 10 years). These aspects have been widely examined for all involved stakeholders, and two main factors are considered as fundamental factors for success in the smart management of the specifically customizable PPP model: provisions for grants and subsidies. Because homeowners and market actors perceive city and regional governments to be trustworthy and legitimate coordinators of housing retrofit programs, the business model is designed to enable cooperation with local financing institutions, investors, and technical project managers. In addition, the Public Sector is expected to assume a portion of operational works and uses subsidies to compensate User Type 4 with an equivalent payment (mode inscription). Moreover, the model is able to account for a tailored rate of default payments. Therefore, the remaining users will pay an incrementally higher amount to cover the cost of defaulters even if they will be urged to pay their debt.
On the other hand, the information gathered in the PEDRERA model and the data preparation (detection of missing and anomalous data), significantly affects the accuracy of the obtained result. For these reasons, the PEDRERA database is based on a preliminary extensive cadastral survey provided by CICLICA as partner of the PEDRERA project. Nevertheless, the lack of a more detailed preliminary analysis on consistency could affect the whole business model that is not limited to the prediction of energy production or energy demand reduction. Advanced projects such as RENOVEU [44], RETABIT [54], and other online platforms such as GENCAT [43,57] support the provision of deeper information at the building scale on building consistency, property, and environmental impact from the very beginning. Hence, further collaboration and the implementation of the PEDRERA model with new capabilities are expected.

6. Conclusions

The European Union’s target of halving greenhouse gas emissions by 2030 and reaching climate neutrality by 2050 requires innovative solutions and services to boost the annual renovation rate and to ensure that renovations reach the expected low/positive energy renovation standards. Energy rehabilitation actions constitutes a fundamental component of meeting environmental objectives and the fight against climate change, defined by current legislation and international commitments. Along with the macroeconomic impacts, PEDs will contribute directly to the prosperity of consumers and families, to the improvement in the environment of residential neighborhoods and to the quality of life in cities. On the other hand, the transition to renewable energy sources will also generate new opportunities in the labor market, increasing human capital and job creation, which also benefits economic growth. Finally, investing in an entire district would benefit all residential and also tertiary (shopping centers, sports centers, etc.) or educational buildings. Indeed, the intervention at district level generates high returns for energy savings or production, as well allows the acquisition of returns on investments in residential buildings that would not be financially attractive if they were renovated independently.
In conclusion, the test phase of the PEDRERA tool led to the following considerations on its potential and impact:
  • The data-driven solutions adopted allow a rapid analysis and a formidable data collection. Nevertheless, this solution is not exempt from a preliminary direct analysis of the building and social consistency. For example, in buildings where there is a lack of internal horizontal division according to the condominium regulation, the building is stacked as if it were a single-family building. However, there may be separate apartments, commercial spaces, or other functions inside. For this reason, a granular validation of the building consistency is always necessary.
  • The direct calculation of the renovation cost obtained by an analysis of the building consistency and by the application of the construction costs coming from BEDEC and other official databases determines a very acceptable deviation equal to 1% (in the case of Palma) and 13% (in the case of St. Coloma) with respect to the values tabulated by the literature (i.e., ERESEE 2020). Furthermore, the deviation of the cost (PEC) in the case of St Coloma is due to the reduction of the intervention costs because of the economic context of the district. Although this reduced span may be acceptable in large-scale interventions (for example in the compilation of a SECAP or earlier business opportunities for investors), a customized plan for each end-user must consider a detailed assessment case-by-case.
  • The possibility offered by the model to intervene in advance on each main input of a business model, (e.g., by modifying the type/duration of loan based on the amount of the intervention) makes it possible to reduce the monthly fee as far as possible and to meet situations in which a user is economically vulnerable.

Author Contributions

Conceptualization, P.C.; methodology, P.C., J.S. and J.P.; software, P.C. and J.S.; validation, P.C. and J.S.; investigation, P.C.; resources, P.C., J.S. and J.P.; data curation, P.C. and J.S.; writing—original draft preparation, P.C. and J.S.; writing—review and editing, P.C. and J.S.; visualization, P.C. and J.A.A.; project administration, P.C.; funding acquisition, P.C.; supervision, J.S.; All authors have read and agreed to the published version of the manuscript.

Funding

The research leading to these results has received funding from the European Union’s Horizon 2020 research and innovation program under the Marie Skłodowska-Curie grant agreement No 712949 (TECNIOspring PLUS) and from the Agency for Business Competitiveness of the Government of Catalonia. TECNIOspring PLUS. Investigator: Paolo Civiero, Project: PEDRERA. Positive Energy Districts renovation model.

Conflicts of Interest

The authors declare no conflict of interest.

References

  1. EC. 2050 Long-Term Strategy; European Commission: Brussels, Belgium, 2018. Available online: https://eur-lex.europa.eu/legal-content/EN/TXT/?uri=SWD%3A2020%3A550%3AFIN (accessed on 16 June 2022).
  2. EC. A Renovation Wave for Europe—Greening Our Buildings, Creating Jobs, Improving Lives, SWD(2020) 550 Final. 2020. Available online: https://eur-lex.europa.eu/legal-content/en/ALL/?uri=CELEX:52020DC0662 (accessed on 16 June 2022).
  3. BPIE. On the Way to a Climate Neutral Europe: Contributions from the Buildings Sector to a Strengthened 2030 Climate Target. 2020. Available online: https://www.bpie.eu/wp-content/uploads/2021/04/BPIE_Renovation-Wave-Analysis_052021_Final.pdf (accessed on 16 June 2022).
  4. EC. A European Green Deal. 2019. Available online: https://ec.europa.eu/info/strategy/priorities-2019-2024/european-green-deal (accessed on 16 June 2022).
  5. EC. Next Generation EU; European Commission: Brussels, Belgium, 2021.
  6. International Energy Agency (IEA). Net Zero by 2050: A Roadmap for the Global Energy Sector. 2021. Available online: https://www.iea.org/reports/net-zero-by-2050 (accessed on 16 June 2022).
  7. EC. Fit for 55—Delivering the EU’s 2030 Climate Target on the Way to Climate Neutrality; European Commission: Brussels, Belgium, 2021.
  8. Salom, J.; Pascual, J. Residential Retrofits at District Scale. In Business Models under Public Private Partnership; InnoEnergy: Eindhoven, The Netherlands, 2018; ISBN 978-84-09-07914-8. Available online: https://www.buildup.eu/en/node/57005 (accessed on 16 June 2022).
  9. Krosse, L.; Monclus, M.; Nijrolder, A. Building Refurbishment Initiatives and Business Models; InnoEnergy: Eindhoven, The Netherlands, 2021; Available online: https://www.fundacionnat-urgy.org/en/product/77630/ (accessed on 16 June 2022).
  10. STUNNING. 2022. Available online: https://www.stunning-project.eu/ (accessed on 16 June 2022).
  11. TURNkey. 2022. Available online: https://cordis.europa.eu/project/rcn/222724/en (accessed on 16 June 2022).
  12. Hunkin, S.; Krell, K. Supporting Energy Renovation of Private Households through One-Stop-Shops. A Policy Brief from the 1027 Policy Learning Platform on Low-Carbon Economy. Interreg Europe. 2019. Available online: https://www.interregeurope.eu/filead-min/pb/20190210_PolicyBrief_OSS.pdf (accessed on 16 June 2022).
  13. Cicmanova, J.; Eisermann, M.; Maraquin, T.-E.C. How to Set up a One-Stop-Shops for Integrated Home Energy Renovation? A Step-by-Step Guide for Local Authorities and Other Actors. INNOVATE Project. Energy Cities. 2020. Available online: https://energy-cities.eu/wp-content/uploads/2020/07/INNOVATE_guide_final.pdf (accessed on 16 June 2022).
  14. Bylund, J.; Gollner, C.; Jäger, M.; Riegler, J.; Noll, M.; Klaming, G. Driving Urban Transitions Roadmap; JPI Urban Europe: Vienna, Austria, 2021. [Google Scholar]
  15. Bossi, S.; Gollner, C.; Theierling, S. Towards 100 Positive Energy Districts in Europe: Preliminary Data Analysis of 61 European Cases. Energies 2020, 13, 6083. [Google Scholar] [CrossRef]
  16. Gabaldón Moreno, A.; Vélez, F.; Alpagut, B.; Hernández, P.; Sanz Montalvillo, C. How to Achieve Positive Energy Districts for Sustainable Cities: A Proposed Calculation Methodology. Sustainability 2021, 13, 710. [Google Scholar] [CrossRef]
  17. Wahlund, M.; Palm, J. The role of energy democracy and energy citizenship for participatory energy transitions: A comprehensive review. Energy Res. Soc. Sci. 2022, 87, 102482. [Google Scholar] [CrossRef]
  18. European Commission. Clean Energy for All Europeans; European Commission: Brussels, Belgium, 2019.
  19. Zhang, X.; Penaka, S.R.; Giriraj, S.; Sánchez, M.N.; Civiero, P.; Vandevyvere, H. Characterizing Positive Energy District (PED) through a Preliminary Review of 60 Existing Projects in Europe. Buildings 2021, 11, 318. [Google Scholar] [CrossRef]
  20. Turci, G.; Alpagut, B.; Civiero, P.; Kuzmic, M.; Pagliula, S.; Massa, G.; Albert-Seifried, V.; Seco, O.; Soutullo, S. A Comprehensive PED-Database for Mapping and Comparing Positive Energy Districts Experiences at European Level. Sustainability 2021, 14, 427. [Google Scholar] [CrossRef]
  21. Brozovsky, J.; Gustavsen, A.; Gaitani, N. Zero emission neighbourhoods and positive energy districts–A state-of-the-art review. Sustain. Cities Soc. 2021, 72, 103013. [Google Scholar] [CrossRef]
  22. Salom, J.; Tamm, M.; Andresen, I.; Cali, D.; Magyari, Á.; Bukovszki, V.; Balázs, R.; Dorizas, P.; Toth, Z.; Mafé, C.; et al. An Evaluation Framework for Sustainable Plus Energy Neighbourhoods: Moving Beyond the Traditional Building Energy Assessment. Energies 2021, 14, 4314. [Google Scholar] [CrossRef]
  23. Bertoldi, P.; Economidou, M.; Palermo, V.; Boza-Kiss, B.; Todeschi, V. How to finance energy renovation of residential buildings: Review of current and emerging financing instruments in the EU. Wiley Interdiscip. Rev. Energy Environ. 2021, 10, e384. [Google Scholar] [CrossRef]
  24. ITeC. La Rehabilitación Energética Planteada Como Inversión. 2016. Available online: https://www.lacasaqueahorra.org/ficheros/esp/Documentos/BDDE304A-734A-448F-0360-9EE1BF3B3C1B.pdf/ (accessed on 16 June 2022).
  25. D’Oca, S.; Ferrante, A.; Veld, P.O.; Peraudeau, N.; Peters, C.; Pernetti, R.; Schippers-Trifan, O.; Decorme, R. Exploitation of Business Models for Deep Renovation. Proceedings 2019, 20, 11. [Google Scholar] [CrossRef] [Green Version]
  26. European Commission. National Energy and Climate Plans (NECPs). Available online: https://ec.europa.eu/info/energy-climate-change-environment/implementation-eu-countries/energy-and-climate-governance-and-reporting/national-energy-and-climate-plans_en (accessed on 16 June 2022).
  27. MITMA. ERESEE 2020. Actualización 2020 de la Estrategia a Largo Plazo Para la Rehabilitación Energética en el Sector de la Edificación en España. Available online: https://www.mitma.gob.es/recursos_mfom/paginabasica/recursos/es_ltrs_2020.pdf (accessed on 16 June 2022).
  28. Consorci Metropolità de l’Habitatge, AMB. PMRH Pla Metropolità de Rehabilitació 2020–2030. AMB, Barcelona. 2021. Available online: https://www.cmh.cat/documents/598409/10470805/PMRH+2020-2030+%2804.12.2020%29/163f60c5-106c-4217-b217-3563fe0f44a2 (accessed on 16 June 2022).
  29. EC; Directorate-General for Research and Innovation; Schellnhuber, H.; Widera, B.; Kutnar, A. Horizon Europe and new European Bauhaus NEXUS Report: Conclusions of the High-Level Workshop on ‘Research and Innovation for the New European Bauhaus’, Jointly Organised by DG Research and Innovation and the Joint Research Centre. 2022. Available online: https://data.europa.eu/doi/10.2777/49925 (accessed on 16 June 2022).
  30. EC. Directive of the European Parliament and of the Council Amending Directive (EU) 2018/2001 of the European Parliament Regards the Promotion of Energy from Renewable Sources. EUR-Lex. 2018. Available online: https://eur-lex.europa.eu/legal-content/EN/LSU/?uri=uriserv:OJ.L_.2018.328.01.0082.01.ENG (accessed on 16 June 2022).
  31. Rose, J.; Thomsen, K.E.; Domingo-Irigoyen, S.; Bolliger, R.; Venus, D.; Konstantinou, T.; Mlecnik, E.; Almeida, M.; Barbosa, R.; Terés-Zubiaga, J.; et al. Building renovation at district level—Lessons learned from international case studies. Sustain. Cities Soc. 2021, 72, 103037. [Google Scholar] [CrossRef]
  32. Civiero, P.; Pascual, J.; Arcas Abella, J.; Bilbao Figuero, A.; Salom, J. PEDRERA. Positive Energy District Renovation Model for Large Scale Actions. Energies 2021, 14, 2833. [Google Scholar] [CrossRef]
  33. MITMA. Real Decreto 853/2021, de 5 de Octubre, por el que se Regulan los Programas de Ayuda en Materia de Rehabilitación Residencial y Vivienda Social del Plan de Recuperación, Transformación y Resiliencia. 2021. Available online: https://www.boe.es/eli/es/rd/2021/10/05/853 (accessed on 16 June 2022).
  34. Arcas Abella, J.; Pages-Ramon, A. UrbanZEB, Estrategias urbanas de transicion energetica de edificios. In Proceedings of the 14th National Congress Conama 2018, Madrid, Spain, 26–29 November 2018; Available online: http://www.conama11.vsf.es/conama10/download/files/conama2018/CT%202018/222224182.pdf (accessed on 16 June 2022).
  35. Loga, T.; Stein, B.; Diefenbach, N. TABULA building typologies in 20 European countries—Making energy-related features of residential building stocks comparable. Energy Build. 2016, 132, 4–12. [Google Scholar] [CrossRef]
  36. Pernetti, R.; Pinotti, R.; Lollini, R. Repository of Deep Renovation Packages Based on Industrialized Solutions: Definition and Application. Sustainability 2021, 13, 6412. [Google Scholar] [CrossRef]
  37. ICAEN. Rehabilitació Energètica D’edificis. General. Catalunya. Inst. Català d’Energia. 2016. Available online: http://icaen.gencat.cat/web/.content/10_ICAEN/17_publicacions_informes/04_coleccio_QuadernPractic/quadern_practic/arxius/10_rehabilitacio_edificis.pdf (accessed on 16 June 2022).
  38. OptEEmAL. The Solution for Designing Your Energy Efficient District Retrofitting Project. OptEEmAL Final Booklet. Steinbeis-Europa-Zentrum der Germany. 2019. Available online: https://www.opteemal-project.eu/press-corner/publications/further-downloads.html (accessed on 16 June 2022).
  39. ENERHAT (Energy Housing Assessment Tool). Available online: http://enersi.es/es/enerhat (accessed on 16 June 2022).
  40. IVE Instituto Valenciano de la Edificación, Visualizador de Bases de Datos. Base de Precios del IVE 2021. Available online: https://bdc.f-ive.es/BDC21/1 (accessed on 16 June 2022).
  41. Consorci Metropolità de l’Habitatge. 2022. Available online: https://www.cmh.cat/web/cmh/ajuts/simulador-energetic (accessed on 16 June 2022).
  42. ENERPAT. Available online: http://enersi.es/es/enerpat#C6lud96rher (accessed on 16 June 2022).
  43. ICAEN. Simulador de Mesures de Rehabilitació Energética d’edificis, General. Catalunya. Inst. Català d’Energia. 2019. Available online: http://simuladoredificis.icaen.gencat.cat/ (accessed on 16 June 2022).
  44. IVE Instituto Valenciano de la Edificación. RenovEU. 2021. Available online: http://renoveu.five.es/#/home (accessed on 16 June 2022).
  45. Sede Electrónica del Catastro. Available online: https://www.sedecatastro.gob.es (accessed on 16 June 2022).
  46. Google. 3D maps” and “Street View”. 2022. Available online: https://mapsplatform.google.com/intl/en/ (accessed on 16 June 2022).
  47. ITeC. Database of Construction Elements. 2022. Available online: https://en.itec.cat/database/ (accessed on 16 June 2022).
  48. CYPE Ingenieros, S.A. Generador de Precios de la Construcción. 2022. Available online: http://www.generadordeprecios.info (accessed on 16 June 2022).
  49. Ajuntament de Santa Coloma de Gramenet. Renovamos los Barrios, Áreas de Conservación y Rehabilitación (ACR). 2018. Available online: https://www.gramenet.cat/es/ayuntamiento/areas-municipales/renovamos-los-barrios/ (accessed on 16 June 2022).
  50. Ajuntament de Santa Coloma de Gramenet. Declaració de l’Àrea de Conservació i Rehabilitació ACR2-Mas Marí. 2020. Available online: https://www.gramenet.cat/fileadmin/Files/Ajuntament/informacio_urb/Gestio_Urbanistica/Exp_Gestio_Urbanistica/GU057_AC/GU057_AD_document_unitari.pdf (accessed on 16 June 2022).
  51. Available online: https://greendeal-arv.eu/ (accessed on 16 June 2022).
  52. Ibañez Iralde, N.S.; Pascual, J.; Salom, J. Energy retrofit of residential building clusters. A literature review of crossover recommended measures, policies instruments and allocated funds in Spain. Energy Build. 2021, 252, 111409. [Google Scholar] [CrossRef]
  53. ERESEE. Update of the Long Term Strategy for Energy Renovation in the Building Sector in Spain. 2020. Available online: https://cdn.mitma.gob.es/portal-web-drupal/planes_estartegicos/en_ltserb.pdf (accessed on 16 June 2022).
  54. Available online: https://retabit.es/ (accessed on 16 June 2022).
  55. Marrone, P.; Montella, I. An experimentation on the limits and potential of Renewable Energy Communities in the built city: Buildings and proximity open spaces for energy decentralization. Renew. Sustain. Energy Transit. 2022, 2, 100025. [Google Scholar] [CrossRef]
  56. Energy Cities. Infinite Solutions Project. Available online: https://energy-cities.eu/wp-content/uploads/2019/01/PUBLI_infinite_solutions_guidebook_intracting_2017_en.pdf (accessed on 16 June 2022).
  57. Generalitat de Catalunya. Available online: https://sig.gencat.cat/visors/hipermapa.html#param=param&color=vermell&background=orto_ICC_grisos&BBOX=410860,4567836,419125,4572271&layers=ENERGIA_CERTIFICATS_EDIFICIS (accessed on 16 June 2022).
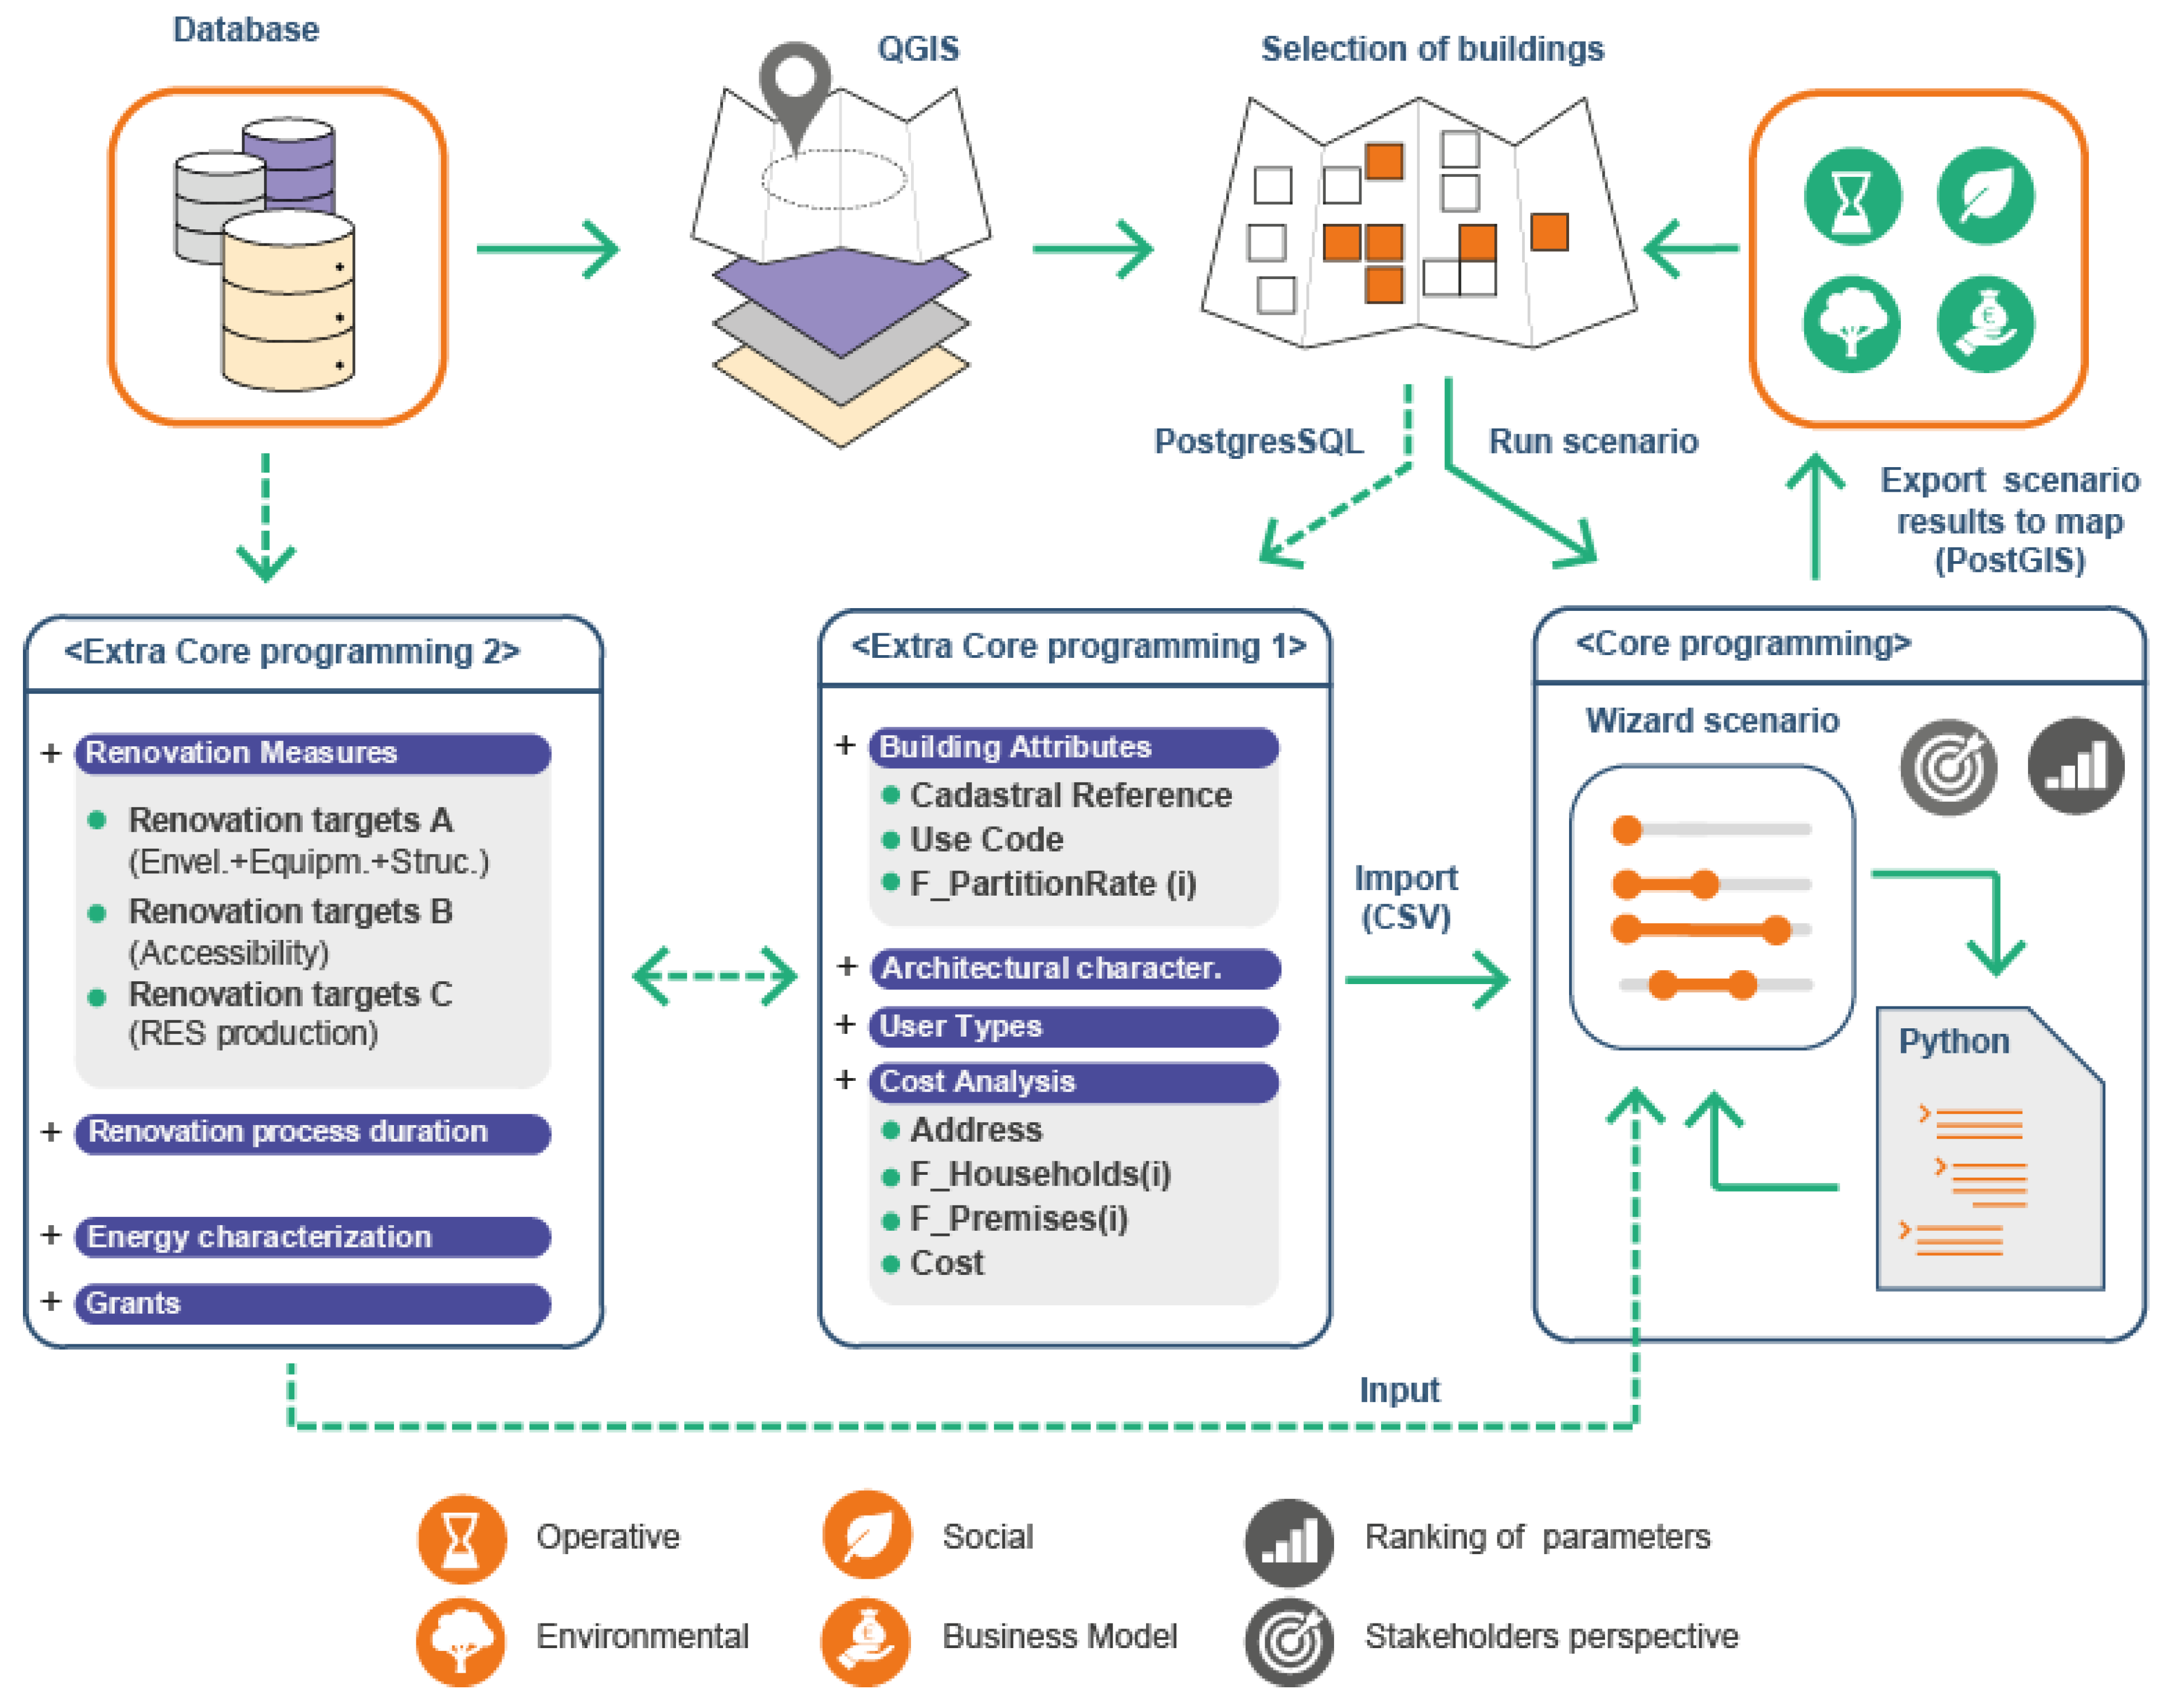
Figure 1. The interactive approach of the PEDRERA model supporting large-scale renovation actions, from the integration of aggregated and gathered data for the cost analysis at urban level, to the scenario results visualization on webmap according to priorities from stakeholders. Source: authors.
Sustainability 14 09672 g001
Figure 2. Main input and output implemented and managed in the PEDRERA model across “Core” and “Extra Core” programming modules. Source: authors.
Sustainability 14 09672 g002
Figure 3. Selection of 16 buildings in the “ACR 2 Mas Marí” neighborhood of St. Coloma de Gramenet (Spain). Source: authors.
Sustainability 14 09672 g003
Figure 4. Selection of 52 buildings in the “La Soledat Sud” neighborhood of Palma de Mallorca (Spain). Source: authors.
Sustainability 14 09672 g004
Figure 5. Single-unit and gradient visualization on QGIS map of the intervention cost of each building once the designed scenario from PEDRERA model had been chosen. Source: authors.
Sustainability 14 09672 g005
Figure 6. The average fees to pay for each user (UTs) according to building retrofit. Source: authors.
Sustainability 14 09672 g006
Figure 7. Visualization of the fees to be paid by each user according to User-Type (UT) categories and internal repartition rates within the selected buildings.
Sustainability 14 09672 g007
Table 1. Key economic and financial outputs of the Financial Appraisal and stakeholders.
Output KPIsAcronymPS *PP *Eu *
End-users contributionUsersQuote xx
Monthly/rate payments UT1 (2 pay)UTPay_1 x
Monthly/rate payments UT2 (60 pay/5 years)UTPay_2 x
Monthly/rate payments UT3 (120 pay/10 years)UTPay3 x
Monthly/rate payments UT4 (2 pay/5 years) **UTPay4x x
Monthly/rate payments UT5 (96 pay/8 years)UTPay5 x
SharedCost End-usersShCost xx
Operational Costs Public SectorDirOpex (PS)x
Revolving fund grants Public SectorRevGrant (PS)x
Operational Costs Private PartiesOvH_OpCost (CS) x
Early Before Taxes Private PartiesEBT (CS) x
Gross. Benefits Private partiesGrossBen (CS) x
Financial amount requiredFinan€ x
Financial CostsFinan_Cost (CS) x
Financial NeedsFinanNeed x
Full Operational Costs Private PartiesOpex€ (CS)_Tot x
EoS 1_ savings on OPEX reduction ***SavEoSOpex_Incxx
EoS 2_ savings by Market value increment ***SavEoSMarket_Incxx
EoS 3_ savings by PEC reduction ***SavEoSPEC_Incxx
Impact % of Financial Cost on Financed amountFinCost_percent x
Impact % of Financial Cost on UTs amountFinCost_Impact_UT x
Employment opportunities. New jobs impactsNewJobsEntx
Cash flow analysisCssh Flow Diagramxx
* PS—Public Sector; PP—Private Parties; Eu—End-users. ** Vulnerable people. *** EoS: Economies of Scale.
Table 2. Clustering buildings selection by type of building, age, and use from ACR no. 2 “Mas Marí” in St. Coloma de Gramenet case study.
Área de Conservación y Rehabilitación (ACR) No. 2, “Mas Marí”, St. Coloma de Gramenet
≤1940≥1941 ≤ 1980≥1981Total
BuildingsNo.014216
%0%87.5%12.5%
Single familyNo.00000%
%0%0%0%
MultifamilyNo.014216100%
%0%87.5%12.5%
Dwellings 137157
Other uses 20
Table 3. Clustering the buildings selection by type of buildings, age and use from “La Soledat Sud” neighborhood, in Palma de Mallorca case study.
“La Soledat Sud” Neighborhood, Palma de Mallorca
≤1940≥1941 ≤ 1980≥1981Total
BuildingsNo.3216452
%62%31%8%
Single familyNo.10501529%
%72%25%0%
MultifamilyNo.221143771%
%59%30%11%
Dwellings 159239
Other uses 80
Table 4. Synthesis of the intervention cost (PEC) EUR/dwelling by type of buildings (single/multifamily) and age from St. Coloma de Gramenet and Palma de Mallorca case studies.
Área de Conservación y Rehabilitación (ACR) No. 2 “Mas Marí”, St. Coloma de Gramenet
≤1940≥1941 ≤ 1980≥1981Average Cost
Single family----
Multi-family-7924.07 EUR/dw6907.67 EUR/dw7797.02 EUR/dw
“La Soledat Sud” Neighborhood, Palma de Mallorca
≤1940≥1941 ≤ 1980≥1981Average Cost
Single family17,484.78 EUR/dw17,012.30 EUR/dw-17,335.58 EUR/dw
Multi-family13,419.84 EUR/dw14,546.23 EUR/dw14,226.89 EUR/dw13,858.99 EUR/dw
Table 5. Synthesis of the intervention cost (PEC) EUR/dwelling according to the adopted literature.
Demo CaseRef. Literature
ERESEE 2020ICAENITEC Lcqa 2016ITEC 2016 + PMRH 2021ICAEN + PMRH 2021Avarage
(from Ref.
Literature)
Deviation Span
(Avarage
Ref. Literature—Demo Case)
Área de conservación y rehabilitación (ACR) no. 2 “Mas Marí”, St. Coloma de Gramenet
SF *-16,628.0022,623.2533,903.0033,903.0022,623.2525,936.10-
MF *7797.0210,592.0016,454.507471.0010,654.9010,654.9011,165.46+43.20%
“La Soledat Sud” neighborhood, Palma de Mallorca
SF *17,335.5816,628.0022,623.2533,903.0033,903.0022,623.2525,936.10+49.61%
MF *13,858.9910,592.0016,454.507471.0010,654.9010,654.9011,165.46−19.43%
* SF = single family, MF = multi-family. All values are expressed in EUR/dw.
Table 6. Synthesis of fees to be paid by each user according to User-Type (UT) categories in the St. Coloma de Gramenet case study.
Área de Conservación y Rehabilitación (ACR) No. 2 “Mas Marí”, St. Coloma de Gramenet
User-Type (UT)No. UTsF_UserTypesQuote (€)F_UserRatePay (€)
AverageMax.Min.
UT1(2 pay)57005.333502.665529.091796.60
UT2(60 pay/5 years)335245.4887.42120.0259.89
UT3(120 pay/10 years)727819.5472.05112.1234.82
UT4(2 pay/5 years)25065.182532.593389.391675.78
UT5(96 pay/8 years)457093.4179.06108.6358.65
Total Users involved157
Table 7. Synthesis of fees to be paid by each user according to User-Type (UT) categories in the Palma de Mallorca case study.
“La Soledat Sud” Neighborhood, Palma de Mallorca
User-Type (UT)No. UTsF_UserTypesQuote (€)F_UserRatePay (€)
AverageMax.Min.
UT1(2 pay)128956.764478.389255.07546.22
UT2(60 pay/5 years)734457.8074.30166.1135.70
UT3(120 pay/10 years)8614,230.25118.59212.9566.76
UT4(2 pay/5 years)67774.203887.106804.631334.40
UT5(96 pay/8 years)6210,934.96113.91143.9879.01
Total Users involved239
Publisher’s Note: MDPI stays neutral with regard to jurisdictional claims in published maps and institutional affiliations.