Review

The History of Air Quality in Utah: A Narrative Review

by
Logan E. Mitchell
1,* and
Chris A. B. Zajchowski
2
1
Department of Atmospheric Sciences, The University of Utah, Salt Lake City, UT 84112, USA
2
Department of Human Movement Sciences, Old Dominion University, Norfolk, VA 23529, USA
*
Author to whom correspondence should be addressed.
Sustainability 2022, 14(15), 9653; https://doi.org/10.3390/su14159653
Submission received: 31 May 2022 / Revised: 19 July 2022 / Accepted: 20 July 2022 / Published: 5 August 2022
(This article belongs to the Special Issue Air Quality Characterisation and Modelling)

Abstract

:
Utah has a rich history related to air pollution; however, it is not widely known or documented. This is despite air quality being a top issue of public concern for the state’s urban residents and acute episodes that feature some of the world’s worst short-term particulate matter exposure. As we discuss in this narrative review, the relationship between air pollution and the state’s residents has changed over time, as fuel sources shifted from wood to coal to petroleum and natural gas. Air pollution rose in prominence as a public issue in the 1880s as Utah’s urban areas grew. Since then, scientific advances have increased the understanding of air quality impacts on human health, groups of concerned citizens worked to raise public awareness, policy makers enacted legislation to improve air quality, and courts upheld rights to clean air. Utah’s air quality future holds challenges and opportunities and can serve as useful case for other urbanizing regions struggling with air quality concerns. Population growth and changing climate will exacerbate current air quality trends, but economically viable clean energy technologies can be deployed to reduce air pollution, bringing substantial public health and economic benefits to the state’s residents and other settings with similar public health concerns.

1. Introduction

The city’s atmosphere can be cleared of smoke and grime, but not in a single day or year, not by a single group or group of persons, not by a single invention nor without efforts or price. There is nothing magical going to happen. It will take a properly guided, united and continued effort to solve the problem.
—George W. Snow, Chief of Salt Lake Bureau of Mechanical Inspections, 8 February 1917 [1].
In recent decades, degraded air quality ranked among the top concerns of Utahns, particularly the state’s residents who live along the rapidly urbanizing Wasatch Front (Figure 1) (e.g., [2]). Both social and ecological factors affect the state’s ability to mitigate the impacts of anthropogenic air pollution. Utah is situated in the arid, intermountain, western United States (U.S.) with major population centers located in northern topographic basins. Two-thirds of Utah’s population, roughly 2 million residents, live adjacent to the Wasatch Mountain range and the Great Salt Lake. Air pollutants are emitted almost entirely by local sources within Utah [3] and these topographic features exacerbate air quality events, leading this urbanizing region to regularly feature some of the worst short-term air pollution episodes in the world (e.g., [4]).
With air quality a dominant health risk of the 21st century (e.g., [5,6]), the prevalence of acute air pollution events in Utah presents significant challenges to public health, quality of life, and economic vitality. The impacts from poor air quality episodes on human health (e.g., respiratory, circulatory, cancer, mortality, etc.) are well documented [4,6,7], as are cascading economic impacts (e.g., health care costs, decreased worker productivity, etc.) [8,9] and environmental impacts (e.g., O3 injury to plants, viewshed impacts from haze, etc.) [10]. Moreover, recent scholarship documenting the impact of degraded air quality in Utahn’s quality of life, ranging from recess closures for children (e.g., [11]) to substituted outdoor recreation for adults (e.g., [12]), demonstrates the holistic impacts of air pollution on the wellness of state residents.
As we document in this narrative review, Utah’s struggles with poor air quality are not new. Recent digitization of newspaper articles and scientific reports increased the availability of historical accounts of how Utahns historically grappled with air pollution issues. The dominant narrative in U.S. air quality history focuses on eastern cities, such as Pittsburgh, Philadelphia, and Chicago, where coal combustion led to severe air quality issues, as well as Californian cities such as Los Angeles, where photochemical smog was the primary air quality issue [13]. However, drawing from resources recently made available, we situate Utah’s important role in the national and international history of air pollution, focusing on scientific advances, public opinion, and policy responses from the mid-19th century to present day. In doing so, we discuss how this history informs the present understanding of air resource management in Utah, the success of regulatory and scientific advances in reducing air pollution events, and potential future efforts to mitigate poor air quality conditions in the rapidly urbanizing state. Our findings help forward not only technical solutions for other urban areas plagued by poor air quality, but also present structural and behavioral challenges and opportunities to pursue clean air and improve quality of life.

2. Materials and Methods

Here, we deploy a narrative review to understand the history of air quality in Utah, with a particular focus on northern urban centers along the Wasatch Front. Narrative reviews differ from other systematic review types, in part, as they are a qualitative synthesis of literatures from diverse fields without statistical analyses [14]. Additionally, they are useful in understanding the “historical account” of a topic (p. 755, [14]), such as the coupled human and natural system of air quality in Utah. Narrative reviews are becoming increasingly common in interdisciplinary scholarship (e.g., [15,16]), making them relevant to our use of various forms of data (i.e., newspaper articles, scientific manuscripts, policy statements, etc.) to illuminate the historical arc of the human relationship with air quality in Utah.
We conducted a keyword search-based literature review using the Utah Digital Newspaper Archive (https://digitalnewspapers.org/, accessed on 1 May 2020) for articles containing terms such as “air quality”, “smoke”, “nuisance”, “inversion”, “smog”, and “abatement”. We applied a snowballing search methodology using the references in the newspaper articles to identify and include peer-reviewed articles (e.g., primary research, reviews, commentaries), theses, government reports, online reports, and press releases. Each identified item was assessed for relevance by a member of the study team. This review is intended to cover the major events and public issues related to the history of air quality in Utah but is not meant to be an exhaustive account.

3. Results

3.1. 1800s to 1910s

Air quality has been an issue in Utah for as long as human residents have been combusting fuel. Early non-indigenous explorers in the 1800s noted how blue smoke from wood fires would hang in the Salt Lake Valley for extended periods of time [17]. Mormon pioneers settled in the Salt Lake Valley in 1847, and as they developed Salt Lake City, air pollution quickly became a persistent problem. One of the earliest notable comments about air pollution in Utah surfaced in 1860 from Brigham Young, the second president of The Church of Jesus Christ of Latter-day Saints. In those days, homes were heated primarily with wood burning stoves, making adequate ventilation essential. As Young said:
What constitutes health, wealth, joy, and peace? In the first place, good, pure air is the greatest sustainer of animal life. Other elements of life we can dispense with for a time, but this seems to be essential every moment; hence the necessity of well-ventilated dwelling houses—especially the rooms occupied for sleeping.
[18]
Young’s focus on the importance of indoor air quality preceded the science that would corroborate it. Even today, there is a continued international focus on the indoor air quality impacts from burning natural gas for home cooking and the need for adequate ventilation [19].
By the late 1800s, coal became the dominant fuel for factories and home heating both in Utah and nationally (Figure 2). Although Utah’s population of 200,000 was smaller than the Wasatch Front’s approximately 2 million residents today, unregulated emissions and inefficient combustion created a persistent “smoke nuisance” [20]. The direct health impacts of air quality were not well known at the time, but there was an understanding that the smoke nuisance degraded the cleanliness of the air and caused other socioeconomic impacts, particularly from soot particles falling from the air, soiling clothing and affecting outdoor markets that sold furniture, fruit, groceries, and other products. There was even an understanding that ambient air pollution from outside the home penetrated into homes and affected indoor air quality [20,21].
Published commentary advocating how to address air pollution in the late 1800s is not wholly dissimilar from certain attitudes existent in the state today [24]. One preference was for private industry to take initiative to reduce emissions and avoid regulation. For example, a Deseret Evening News editorial in 1881 stated:
Salt Lake is beginning to suffer in some degree from the effects of the smoke nuisance, and judging from the dense clouds which arise especially in the evening in the central part of the city, we are of the opinion that the time is not far distant when some municipal regulation will have to be adopted and enforced here—as elsewhere—to abate it. But would it not just as well for those whose business is such as to require the use of coal in large quantities, to look about for some remedy for excessive smoke, of their own volition, and thus avoid the necessity of declaring their works a public nuisance? We think so and throw out the suggestion in kindness.
[25]
However, at that time, low-emission technologies were not available, and efforts to address inefficient combustion of coal were nascent. As the population continued to grow and the air pollution problem became worse, focus turned to municipal ordinances to control emissions.
The first legislative effort focused on improving air quality in Utah was a Salt Lake City municipal ordinance mandating the installation of emission control devices (“smoke consumers”) on large furnaces in 1891 [26,27]. These devices were designed to control the rate that coal was added to the boiler to optimize combustion efficiency since incomplete combustion caused excess “smoke” air pollution. Since this ordinance was introduced five years before Utah became the 45th state in the United States of America, in 1896, and Utah continues to have air pollution challenges today, with several counties in nonattainment for National Ambient Air Quality Standards, it is fair to say poor air quality has been a permanent fixture in Utah for the entire history of the state.
Today, there is an understanding that wintertime air pollution is exacerbated by multi-day temperature inversions that last several days to weeks and trap emissions near the surface [28,29]; however, in the late 1800s, that phenomenon was not understood. Instead, there was a basic understanding of the interaction between topography and meteorology. Urban planners of the time recognized that if a factory was located at the mouth of one of the canyons adjacent to Salt Lake City, the emissions from the factory would be transported through the city and worsen air pollution issues; thus, factories were built west of the Jordan River that defines the topographic low point within the Salt Lake Valley [30]. These urban planning decisions in the 1890s reverberate to the present day since the commercial and industrial infrastructure generally remain in the same location over a century later. Areas of the city near industrial facilities were then the focus of redlining practices in the 1930s, dictating where racial minorities lived. These demographic patterns persist today contribute to modern environmental justice challenges [31].
The same 1893 article that discussed the location of factories also articulated an important value system that appears throughout Utah’s history, stating:
Factories that blacken the city with smoke can be as much a detriment as they are an advantage, for Salt Lake has as much to expect from the increase she will receive from persons who will select it as their residence on account of its pure air and cleanliness as it has to gain from factories.
[30]
This desire to balance economic development with environmental stewardship is present throughout Utah’s history across all aspects of society, including activists, regulators, academics, stakeholders, and policy makers. A recent example is Governor Spencer Cox’s OneUtah Roadmap that incorporates sustainable growth that addresses air quality and climate change as part of the state’s overall economic advancement strategy [32].
Smelting and refining of ores in the Salt Lake Valley from nearby mines began in the 1900s, with the first copper smelter opening in Murray in 1899, and several more opening in the following years. These early smelters featured no pollution controls and emitted toxic smoke that included lead, arsenic, and sulfur dioxide. In the years that followed, crops near the smelters began to die and farmers blamed the “smelter smut” for causing these crop failures. Farmers eventually sued the smelter owners and federal courts forced the smelters to process ore with less than 10% sulfur content and prevented them from emitting arsenic [33]. In the aftermath of the court decision, several of the smelters moved to the less-populous Tooele Valley, and efforts to address toxic air emissions led to several innovations [34]: specifically, filters installed at the smelting factories collected lead, arsenic, and other solid particles that were then processed into chemical products and sold. Smelter owners also funded research into farming practices that examined how crops responded to sunlight, fertilizer, watering, etc. This latter effort, in part, was design to discredit farmers, who they accused of “smoke farming”, i.e., suing smelters instead of growing crops [35] (Figure 3).
By 1912, dozens of cities across the country were passing ordinances targeted at improving air quality [13,36]. Salt Lake City was no exception, and by that point passed several ordinances that imposed fines or hired inspectors to suggest efficiency improvements at factories [37,38,39]. There was also a growing recognition that air pollution would affect tourism [40]. The Salt Lake Telegram published an in-depth six-part series about air quality that discussed impacts on health, economics, and ecosystems:
Aside from the immense cost of smoke to the owners of the plants which make it–a cost represented in needless coal bills–the national smoke bill represents millions of dollars of economic waste to the public at large. The blighting influence of a municipal smoke pall on the health of a community alone might justify its abatement, for it has been shown at home and abroad that smoky cities are cities with high death rates from all bronchial and pulmonary diseases.
[41]
In the following years, efforts to improve air quality saw sustained community interest. Several women’s groups banded together to form a “Smoke Abatement League” to assist in public education efforts and lobby for regulations [42,43,44]. The Smoke Abatement League gathered information about how cities were reducing emissions from across the country and printed 7000 leaflets that they distributed across the city [45,46].

3.2. Air Quality Research (1910s–1920s)

In 1914, the University of Utah began to officially study air pollution. The 1914 Utah Legislature established the Metallurgical department and began a collaboration with the U.S. Bureau of Mines to investigate how low-grade coal contributed to air pollution. The research partnership investigated methods of processing soft coal into a “fool proof” fuel that did not produce smoke when it was burned [47]. The Bureau of Mines also became involved in air quality abatement campaigns and studies with an overall objective to increase efficiency and prevent waste in the utilization of mineral resources throughout the U.S. Salt Lake City was chosen as a demonstration city for this effort. Osborne Monnett, the head of the project, noted after he arrived that “in no other city of the country has the smoke problem been attacked with the vigor shown in this campaign” [48].
One aspect of this effort was to determine if smelters located 8–16 miles away from Salt Lake City contributed a disproportionate amount to the poor air quality in the city. Samples of sulfur dioxide (SO2) were collected around the city and at various times of day. The highest concentrations of SO2 were located in the business district of the city, not downwind of the nearby smelters [49]. Another popular hypothesis at the time was that SO2 emitted from smelters created a “heavy blanket which prevents the smoke from rising”. That a gas could create a blanket above the city to prevent atmospheric mixing “seemed untenable” to St. John Perrot, but he tested this hypothesis by collecting SO2 samples from several altitudes with a biplane [50] (Figure 4). Only three samples were collected, but each demonstrated that there was not a high concentration layer of SO2 over the city that prevented vertical mixing. While there was an understanding at the time that wintertime pollution episodes were associated with low wind speeds, it would be several decades before it was widely understood that the vertical temperature profile of the atmosphere during inversions was responsible for the lack of mixing in the atmosphere and buildup of pollutants [51,52,53].
The study concluded in the following year and several reports were issued. Total suspended particles (TSP) as high as 2500 μg/m3 were measured in the early 1920s, which would be considered “hazardous” by today’s federal air quality standards [54]. Additionally, enamel pails were used as passive samplers to measure soot deposition of 300 to 1000 t/mi2 in the residential and industrial districts, respectively, during the winter heating season. About 30–50 percent of the soot fall was combustible, indicating that much of it resulted from incomplete combustion and represented wasted energy resources. In December 1919 and January 1920, SO2 concentrations in Salt Lake City averaged 150 ppb, with the highest measurement being 800 ppb, which is far higher than today’s federal air quality SO2 standard of 75 ppb and typical observations of approximately 1 ppb.
At that time, there was also a growing understanding of the ways that air pollution was affecting human health, particularly in connection with tuberculosis and pneumonia [55]. The first systematic inventory of large point sources concluded that the large heating and industrial plants in the business district were a key contributor to the air quality issues [56]. The interventions and technological approaches to improving air quality at this time were still focused on burning fuel without visible smoke. A scientific concept that was not understand at the time was that pollutants such as particulate matter could be formed from secondary chemical reactions of gaseous precursor species and that coal combustion, even if performed efficiently, was still contributing to air pollution [57]. Despite this lack of understanding, Monnett and his colleague’s effort concluded that air quality problems would persist while soft coal was used for domestic heating. So, when natural gas was introduced into the Salt Lake Valley in 1930, there was optimism that its usage would improve air quality conditions, and the natural gas industry began promoting its usage to improve local air quality as compared to coal combustion [54,58] (Figure 5).

3.3. 1930s–1960s

During the economic challenges of the Great Depression, public attention on air quality issues declined, but the problem persisted. Jobs for air quality monitoring of point sources were created as part of the New Deal Works Projects Administration (WPA) program in Salt Lake City [59]. Interest was renewed in 1941 when Salt Lake City again considered new smoke ordinances modeled after a program in St. Louis, Missouri. For 30 days, the Salt Lake Telegram published daily air quality reports under the title “Today’s Smoke” [60] (Figure 6). In addition, the Telegram published the time series of 13 years of daily Ringelmann chart observations from the Smoke Abatement Division that began after the major studies of the 1920s [61] (Figure 7). After some debate, regulations were passed that went into effect on 1 October 1941. Shortly thereafter, on 7 December 1941, the attack on Pearl Harbor occurred and the country mobilized for WWII.
During the war, air quality regulations were relaxed in favor of increasing production capacity and public attention to air quality once again receded. Throughout this period, visibility was tracked at the Salt Lake Airport and used as a proxy for visible air pollution in the winter months (November–February). A retrospective analysis of winter visibility conditions suggested that air quality worsened significantly during the war years in the 1940s but improved markedly after WWII was over [53] (Figure 8). For example, soot deposition from coal combustion was 83 t/mi2 in 1942–1943 and decreased to 22 t/mi2 in 1957 [62].
After WWII concluded and through the 1950s, there was a substantial decrease in coal consumption as homes and industries transitioned from coal usage to natural gas (Figure 2). However, while air pollution from coal combustion was declining, a new air quality problem was emerging: vehicle emissions were unregulated. In large population centers in the western U.S. that featured abundant sunshine and reliance on personal vehicles for transportation (e.g., Los Angeles), severe levels of photochemical smog became a serious issue. This led to several U.S. states forming air quality control agencies. This time period also saw several high-profile, high-mortality air pollution episodes associated with wintertime inversions and industrial pollution such as in Meuse Valley, Belgium in 1930 [63]; Donora, Pennsylvania in 1948 [64,65]; and the London “fog” event in 1952 [66]. These high-profile events and action across several states led the federal government to pass the Air Pollution Control Act of 1955. This act provided technical assistance for state air pollution control boards and funding for the U.S. Public Health Service to study the health impacts of air pollution, but did not impose regulations on emissions. In 1959, the California Motor Vehicle Control Board set the first vehicle emissions standards to control nitrogen oxide (NOx) emissions that took effect in 1963 model year vehicles.
Back in Utah, the role of persistent wintertime atmospheric stratification events (“inversions”) that exacerbated air quality issues along the Wasatch Front began to be studied and understood. This was first explored in 1947 [52], but it was not until daily radiosondes began launching in 1956 that it was extensively studied [51,53]. It was noted that local inversions were often accompanied by high pressure aloft, which could persist for 2–3 weeks at a time and during these extended time periods, air pollutants would accumulate. Research on how inversions play a key role in exacerbating air quality conditions has continued through the present day and is the focus of upcoming projects [28,29,67].
In the early 1960s, Representative David King called for a major assessment of the air resources in the Utah that was submitted to the Legislature in 1962 [62]. The report summarized the history of air pollution to date, described the latest understanding of how topography and meteorology contributed to air pollution, how population growth was contributing to the issue, specific pollutants, and what efforts were being made to further study and address the issue. Some of the focus at the time was related to exposure to nuclear fallout, and monitoring stations were being installed accordingly. The report concluded by finding a lack of continuous measurements of air pollutants taken with standardized procedures and recommended that additional systematic measurements take place in Utah. In response to this report, the Utah Legislature codified air pollution as a public nuisance and made it a misdemeanor to create air pollution injurious to human life, plants, animals, or property [68]. The air pollution control law was updated significantly in 1967 with the passage of the Air Conservation Act that created the Air Conservation Committee within the State Department of Health and empowering it in control, abatement, and prevention of air pollution [69], which formed the foundation of what today is the Division of Air Quality.
Throughout the 1960s, air quality and meteorology research continued by, for example, deploying new air quality measurement sites [70,71], studying impacts on health and ecosystems [72,73], and developing better understanding of inversions [74]. Private companies were also working to install pollution control devices [75], and discussion began about how electric cars could help to mitigate air pollution [76] (Figure 9). A conference on Air Quality was held in 1969 at the University of Utah, sponsored by the Utah Air Conservation Committee, women’s civic groups, researchers, and legislators [77]. Throughout this time, however, problems with air pollution persisted.

3.4. The Federal Regulatory Framework (1970s)

The dawn of the federal air quality regulatory era began in 1970 with an amendment of the Clean Air Act, which created the Environmental Protection Agency (EPA). The EPA established the first National Ambient Air Quality Standards (NAAQS) to protect public health and welfare in 1971. Around the same time, the EPA conducted a series of epidemiologic studies, known as the Community Health and Environmental Surveillance System (CHESS), and the Wasatch Front was one of six urban regions selected for the study [78]. The CHESS studies had several methodological and operational problems, which were discovered in part by comparing the EPA CHESS air quality data against data collected by the Utah Division of Health. These issues spurred a U.S. congressional investigation and after several years led to major improvements in EPA measurement and quality control procedures [79].
While the CHESS saga unfolded on the federal stage, the Utah Division of Health used their own monitoring data to evaluate compliance with the new NAAQS in a report on “Utah Health Facts” [80]. This report found widespread exceedances for total suspended particles (TSP), sulfur dioxide (SO2), carbon monoxide (CO), oxidants (primarily ozone, O3), and nitrogen oxides (NOx) (Table 1). Although the NAAQS thresholds for each pollutant became more stringent over time as air quality impacts became better understood, the number of exceedances in 1970 demonstrate that air quality conditions were far worse than they are today. The report discussed ways in which Utah could achieve compliance with air quality standards but noted that several factors were beyond Utah’s control; some of the TSP exceedances were caused by natural dust storms, and exceedances of CO and NOx were due to vehicle emissions regulated at the federal level. Air quality research in Utah continued to increase in the 1970s, with at least 26 active research projects across a wide range of disciplines being active in 1972 [81].
The potential influence of dust storms on TSP was particularly important for Utah. At that time, there were several competing methods to measure particulate pollution. In the United Kingdom, the “smoke shade” method collected particles on filter paper and then examined their optical properties to establish the level of “black smoke” (BS). A similar technique used in the U.S. measured the “coefficient of haze” (CoH). These devices utilized pumps with a low flow rate that biased the measurements towards smaller particles [82,83] and are analogous to modern black carbon measurements [84,85]. These instruments were originally devised as a way to quantify subjective smoke density observations, but in the U.S. there was a desire to use the TSP method since it was thought to be a more objective technique. The TSP measurement method used a high-volume sampler with much higher flow rates that collected nearly all suspended particles, including a large range of particle sizes up to 60 μm in diameter, or about the same diameter as human hair [79]. However, these large particles can be filtered out by the body’s defense mechanisms in the nose, mouth, and upper respiratory tracts and, while irritable, do not cause the same kinds of substantial health effects that smaller particles cause. These deficiencies and differing approaches led to disagreements within the epidemiology community, with some scientists supporting strong standards and other scientists supported by the American Iron and Steel Institute arguing that the research was inconclusive about the health risks of low concentrations of particulates [82,86,87]. Utah was caught in the middle of this controversy since many of the TSP exceedances were from natural dust storms and, since there was uncertainty about the health impacts, there was not a strong focus on addressing particulate pollution [80].
To investigate the health impacts of smaller particles, the EPA created a new monitoring network called the Inhalable Particulate Network (IPN) in 1979 that eventually spread to 157 cities [88,89]. The IPN deployed several new instruments, one of them being a dichotomous sampler that measured the mass of aerosols in two size fractions: fine particulate matter with a diameter smaller than 2.5 μm (PM2.5), thought to be derived primarily from combustion processes, and coarse particulate matter with a diameter of 2.5–15 μm. When added together, they yielded the mass of all particles smaller than 15 μm (PM15). In 1981, based on recommendations from the scientific community, the size of the coarse fraction was changed to 2.5–10 μm to obtain measurements of PM10.
The IPN initially hosted two sites in Utah, one at the Salt Lake City Health Department (6 South, 200 East), and one in Magna, UT (Brockbank Jr. high school). Only the Salt Lake City site was equipped with the new dichotomous sampler, so these were the first measurements of PM2.5 collected in Utah [90] (Figure 10). These 24 h average measurements were laborious, so they were only collected every sixth day. Based on the current 24 h PM2.5 NAAQS of 35 μg m−3, the winter of 1981–1982 exceeded this level on at least four days. If we assume that the sampling strategy of once every sixth day was representative of conditions that winter, it indicates that concentrations exceeded that level on about 24 days. This number of days is approximately equivalent to the 18 exceedances per winter that were found in the decade after regular measurements of PM2.5 began in Salt Lake City in 1998 [29].

3.5. Science, Regulations, Disinformation and State Action (1980s–1990s)

The 1980s–1990s were a critical time for air quality in Utah. Data from the IPN were leading to an increased awareness of the impact of particulates on health, but it was the Geneva Steel case study that shocked the scientific community and once again thrust Utah onto the global scientific stage. These scientific advances then led to increased regulatory scrutiny, and industrial polluters sought to spread disinformation about the scientific findings to delay the implementation of regulations. Meanwhile, sustained public dissatisfaction with air quality and exceedances of federal air quality standards led the Utah state government to explore state-level efforts to address air pollution. All these events occurred simultaneously, but since each of them have their own historical narrative arc, we discuss each in turn.

3.5.1. Scientific Advances

In the 1980s, a natural experiment at the Geneva Steel plant in Provo, UT, demonstrated the significant health impacts of particulate air pollution [91,92]. The Geneva plant was a large industrial source of air pollution, which was the focus of air quality concerns for some time (e.g., [62,93,94]). Nearby monitoring of Total Suspended Particles began in the early 1960s, and PM10 was added in April 1985 [95]. On 1 August 1986, a labor strike forced the steel plant to shut down for 13 months. When it reopened on 1 September 1987, there was a resumption of emissions from the smokestack [96] (Figure 11). In the following months, there were near daily complaints in the Provo Daily Herald about the pollution from the plant, contrasted with plant workers and industry lobbyists who claimed that the pollution was not that bad and the jobs provided by the plant were more important than any potential health impacts from pollution (e.g., [97,98,99]). The strike and plant closure allowed for a comparison of health outcomes during the winter season when the plant was shut down and the winter seasons before and after. The design of this natural experiment controlled for many of the typical confounding variables in health studies, such as smoking, weight, and physical activity, by using the same population of the same city in a different year as comparison. The results showed that bronchitis and asthma hospital admissions for preschool-age children in Provo were approximately twice as frequent in the winters when the steel mill was operating versus the winter when it was idled [95,100]. This startling result demonstrated the considerable health impacts from particulate pollution and set the stage for a series of influential scientific studies.
Building on the Geneva Steel case study, Pope joined a team of researchers at the EPA and Harvard University examining health impacts of particulate pollution across multiple cities. In what became known as the “Harvard Six Cities” study, the team examined the measurements from the IPN network in six cities with sufficiently long records (5–8 years) and found a robust linear relationship between PM2.5 and mortality after controlling for confounding variables [101] (Salt Lake City was not included in this study because it only collected one year of PM2.5 data from the IPN (Figure 10)). This was a groundbreaking result because the relationship between mortality and PM2.5 was so clear, even at low concentrations typically found in cities. Even the investigators were skeptical of the strength of the relationship between PM2.5 and mortality, so Pope sought a way to replicate the results with a broader population data set. He collaborated with investigators working on the American Cancer Society (ACS) Cancer Prevention Study II (CPS-II) that had long patient history records to compare the IPN data to health outcomes for 500,000 people across 151 cities. The results of this study confirmed the relationship between fine particulate and mortality in the six cities study [102]. This pair of studies demonstrated how important minimizing fine particulates was for public health and they have since become some of the most cited publications in the field of air pollution research [103]. Additionally, this pair of studies set off protracted struggles over particulate matter regulations between industry, public health advocates, scientists, and regulators that continue to the present day.

3.5.2. Regulatory Advances

The Clean Air Act requires the EPA to re-evaluate the NAAQS for each pollutant every five years based on the latest scientific knowledge. The original 1970 particulate standard was based on TSP, but given the methodological and epidemiological questions about TSP, it was not until 1987 that the TSP standard was changed to PM10. In 1992, despite the new research on particulates being published by Pope and others, the EPA declined to conduct its five-year review of the standard and the American Lung Association thus sued the EPA in 1994. The American Lung Association won their lawsuit, and the court ordered the EPA to review the standard by 1997. Based on the new scientific findings of the importance of fine particulate matter (PM2.5) on public health, the EPA created a new standard for PM2.5 in addition to the existing PM10 standard. Industrial trade organizations then sued to prevent the standards from being implemented; the cases worked their way up through U.S. courts until, in 2001, the Supreme Court unanimously decided that the EPA had the authority to establish the standards and the agency had a suitable approach for determining the standards. The Supreme Court remanded the remaining issues to the D.C. Circuit Court of Appeal, which rejected all remaining challenges to the PM2.5 standards in 2002 and determined that the standards were not “arbitrary and capricious”. A more comprehensive account of the legal conflict at the national level can be found elsewhere [13,91].

3.5.3. Disinformation

Faced with tighter regulations, industry trade groups mounted disinformation campaigns questioning the health impacts of particulate pollution by using techniques similar to those employed by tobacco and fossil fuel companies [104,105]. These efforts are well documented at the national level [91,106], but events in Utah are not as widely documented. A few months after the publication of the Geneva Steel case study in the summer of 1989, the Utah Air Conservation Committee met to discuss the State Implementation Plan to gain compliance with the PM10 NAAQS. To cast doubt about the scientific findings, Geneva Steel hired Dr. Steven Lamm, an epidemiologist associated with John Hopkins and Georgetown University, to reanalyze the Geneva Steel case study data [107]. Lamm examined the data for a few weeks, and instead of submitting his analysis for peer review, he held a press conference where he presented his claims publicly to create the appearance of scientific disagreement and inject Geneva’s desired narrative into newspaper articles [108,109]. Lamm claimed that a respiratory syncytial virus (RSV) caused the variation in pediatric respiratory hospital admissions, not variations in PM10 from the Geneva plant. This was despite the fact that Pope’s analysis controlled for effects like this by examining hospital admissions in several cities across Utah that would have had similar levels of RSV [100]. Lamm did eventually submit his analysis for peer review several months later, but the very short paper was not published until 1994, five years after Lamm held his press conference [110]. In the intervening years, a large body of research was published linking fine particulates to a wide range of health impacts, including hospitalizations, lung function, respiratory symptoms, school absences, and mortality [111,112,113,114,115,116,117]. That said, the disinformation effort to create misleading news coverage had the desired effect of creating an artificial controversy that muddled public understanding of the health impacts of air quality in Utah for years (e.g., [118,119]).

3.5.4. State Initiatives in Utah

While the science of air pollution was advancing and conflicts between regulators and industries were playing out in Utah, the state government was working on its own air quality initiatives in response to sustained public pressure and the continued violation of federal air quality standards. In 1989, Governor Norman Bangerter created the Governor’s Clean Air Commission (GCAC) composed of community leaders, elected officials, and industry leaders along the Wasatch Front to develop a plan for Utah to address its air quality concerns. The GCAC was organized into five working groups (energy utilization, industry, socioeconomic, technology assessment, and transportation) that each released a report in 1990, and then the final report of 146 legislative and budget recommendations was released in 1991 [120,121]. The Energy Utilization working group report noted that Utah was growing rapidly in terms of population, households, jobs, and vehicles, all of which would create additional air pollution in the coming decades. Given the underlying growth assumptions, the working group outlined three overall policy options for Utah to address air pollution: (1) allow air pollution to increase, (2) meet federal air quality standards, or (3) reduce pollution levels significantly below federal standards.
The first option was not considered viable because of significant public concern about air pollution and because Utah was already exceeding the NAAQS, violating federal law. The second option would take substantial work to achieve and was viewed as the most feasible path; however, the committee also explored what it would take to achieve the third option. In their exploration of approaches to reduce pollution levels significantly below federal standards, they noted that there were economic, technical, legal/regulatory, socioeconomic, and political barriers, and significant tradeoffs would be necessary to significantly improve air quality. It was determined by the group that, at the time, there were no technical or economically viable solutions available to dramatically improve air quality. Governor Bangerter discussed the need to strike a balance between environmental issues and economic development [122]. In the final report, the priority policy recommendations from the GCAC to meet federal air quality standards included recommendations to reduce wood burning, incentivize clean vehicles, improve vehicle emissions inspections, fund public education programs, and improve emission inventories [121]. Three decades later, despite substantial progress, these same policies continue to be state priorities to address air pollution and meet federal air quality standards.

3.6. Air Quality and the New Millennium

In the 30 years since the GCAC report was written, meteorological modeling has advanced dramatically and new air quality concerns, such as in Utah’s Uinta basin, surfaced [123,124,125]. One ongoing scientific question concerns the formation of fine particulates during wintertime inversions resulting from complex interactions of meteorology, emission sources, and atmospheric chemistry. A future field campaign using an aircraft to examine the atmospheric chemistry during inversions is planned for the coming years [67], https://atmos.utah.edu/aquarius/index.php (accessed on 1 May 2022). Incidentally, this field campaign would come ~100 years after the St. John Perrot’s first aircraft field campaign to study air pollution during inversion conditions.
Meanwhile, growing scientific evidence of the health impacts from air quality led to tightening federal air quality standards and to increased public awareness. Nationally, the initial PM2.5 NAAQS of 65 μg m−3, averaged over 24 h, was introduced in 1997. Upon further data collection and analysis, the 24 h standard was lowered to 35 μg m−3 in 2006. After a delay and change in administration, the standard was implemented in 2009, and Salt Lake and Davis counties as well as portions of Cache, Weber, Box Elder, Tooele, and Utah counties were found to be out of compliance with the 24 h PM2.5 NAAQS [126].
This official designation of “moderate” nonattainment triggered the State Implementation Planning (SIP) process requiring Utah to plan for reducing emissions to meet federal PM2.5 standards. It also raised public awareness of the issue; in 2014, a survey of public opinion found that air quality was the third highest priority for Utahns but ranked last in terms of the state’s performance on priorities [2]. In the winter during these years, there were frequent, large rallies for clean air at the Utah state capitol (e.g., [127] (Figure 12). By 2015, Utah still did not meet the 24 h standard and several areas were reclassified as “serious” nonattainment, triggering further action to reduce emissions. Finally, in 2019, Utah had a three-year period with measurements just below the 24 h PM2.5 NAAQS [128]. This is likely due to reduced emissions that contribute to PM2.5 but might also be due to frequent winter storms and a lack of extended inversion conditions over several years. The EPA is currently reevaluating the PM2.5 NAAQS based on extensive studies showing the health impacts of particulate pollution (e.g., [129]) and, if the standards are lowered, Utah will once again be out of compliance with federal air quality standards.
The other major air pollutant of concern in Utah in recent decades is ozone. Ozone is a secondary pollutant that forms when VOCs (volatile organic compounds) and nitrogen oxides (NO and NO2, a.k.a. NOx) combine in the presence of ultraviolet sunlight. Similar to PM2.5, the NAAQS for ozone tightened as the scientific evidence for health impacts grew. The standards were 80 ppb (averaged over 8 h) in 1997 and were lowered to 75 ppb in 2008 and 70 ppb in 2015. At the current standard, Salt Lake and Davis counties as well as portions of Weber, Tooele, Utah, Uintah, and Duchesne counties are out of compliance and the state is designated as “moderate” for compliance with federal ozone standards [130].
There are several factors contributing to high ozone concentrations in Utah today. Local emissions of NOx and VOCs from fossil fuel combustion constitute a primary factor affecting urban and rural areas downwind of metropolitan regions [131]. In addition, in recent decades, atmospheric methane has increased globally, and the long-range transport of ozone precursors from fossil fuel combustion in Asia is contributing to higher levels of background ozone [132,133]. As temperatures warm from the changing climate, the chemical reactions forming ozone will also speed up, leading to higher ozone concentrations. Lastly, precursors in wildfire smoke can form ozone, and increasing wildfires in the western U.S. will also contribute to increasing ozone trends in Utah [134,135].
Utah’s unique topography also contributes to elevated ozone in two relatively unusual ways. First, lake breezes along the Great Salt Lake lead to elevated ozone in the urban areas bordering the lake [136,137]. This process has been documented by field campaigns for discrete time periods but the frequency and climatology of elevated ozone lake breezes contributing to exceeding NAAQS have not been investigated along the Wasatch Front. Second, unusually elevated ozone was discovered in 2009 to occur in the Uinta basin in the wintertime [125]. Ozone was typically only monitored in the summertime when ultraviolet radiation and warm temperatures contribute to typical ozone formation conditions. However, a station in the Uinta basin was left on over the 2009–2010 winter and recorded 8 h average ozone concentrations of ~120 ppb, far higher than those typically observed along the Wasatch Front in the summertime of ~75 ppb. The Utah Division of Air Quality and teams of researchers studied this phenomenon in subsequent years, finding that exceptionally high VOC concentrations from oil and gas operations are trapped near the surface by strong thermal inversions, and then reflective snow on the ground increases UV radiation that then produces elevated ozone concentrations [123]. Studies of this phenomenon are ongoing.

3.7. The Future of Air Quality in Utah

The future of air quality in Utah will be dictated by how the state responds to several challenges and opportunities. Utah has one of the fastest growing populations in the U.S. and the population is projected to increase by 66% by 2060, putting upward pressure on emissions with more vehicles, buildings, and commercial or industrial activities. In addition, the changing climate is expected to exacerbate air quality conditions by increasing ozone concentrations, particulates from wildfire smoke, and windblown dust from drying lake beds (as well as many other climate impacts unrelated to air quality) [138]. Despite these challenges, there is enormous potential to address air pollution as we are currently in the middle of a rapid energy and economic transition away from fossil fuel-based energy towards renewable and zero-emission energy sources. This transition is being driven by energy innovation and a rapid decline in prices over the past decade that is expected to continue (e.g., [139,140,141,142,143]).
In addition to the technical and environmental aspects, there is growing interest among policy makers to structurally tackle these challenges. In 2018, the Utah Legislature adopted a resolution on environmental and economic stewardship, committing to use sound science to reduce emissions that are contributing to the changing climate and air pollution [144]. The Legislature then requested a report from the University of Utah’s Kem Gardner Policy Institute outlining a roadmap for the state to reduce emissions. The “Utah Roadmap: Positive Solutions on Climate and Air Quality” recommended seven mileposts for the state government to take to address these challenges in the coming decades [145]. This approach has gained broad support among leaders from business, government, faith, and civic institutions across Utah [146].
It is notable how different the situation is from any time since the 1880s, when there were not technically, economically, or politically viable solutions available to significantly improve air quality. Today, the balance between environmental stewardship and economic development has shifted and technically, economically, and politically viable solutions are available that present a historic opportunity to lower air pollution to near background levels in the coming decades. Doing this would have enormous public health and economic benefits and would protect Utah from any future tightening of federal air quality standards.

4. Conclusions

Air quality has had an important and storied legacy in Utah, affecting many aspects of society. Scientific studies in Utah and by Utahn scientists have substantially contributed to the scientific understanding of air quality. The dominant pollution sources changed over time with changes in the production and combustion of fuels used for energy and the state’s unique topography of high mountain basins and lakes that exacerbate air quality conditions. In response to regulations and public pressure (Figure 12), policies to improve air quality were implemented based on the best available scientific information and the economically and technically viable solutions available. These policies have improved air quality over time, and although Utah still exceeds federal air quality standards, air quality today is likely better than at any time since the late 19th century. The coming decades present a unique opportunity to substantially improve air quality since clean energy technologies are economically viable and are being rapidly deployed. At the same time, many scientific advances will be made and the societal benefits of clean air will become clearer. If Utah harnesses innovation and leadership, the future of air quality will be bright.

Author Contributions

Conceptualization, L.E.M.; methodology, L.E.M. and C.A.B.Z.; software, L.E.M.; validation, L.E.M.; investigation, L.E.M.; resources, L.E.M.; data curation, L.E.M.; writing—original draft preparation, L.E.M.; writing—review and editing, L.E.M. and C.A.B.Z.; visualization, L.E.M. and C.A.B.Z.; funding acquisition, L.E.M. All authors have read and agreed to the published version of the manuscript.

Funding

This research was funded by NOAA grant number NA19OAR4310078, NSF grant number 1912664, and the Uinta Institute.

Data Availability Statement

Not applicable.

Acknowledgments

We are grateful for the Utah Digital Newspapers (https://digitalnewspapers.org/, accessed on 1 May 2020), Hathi Trust, and Google Books for digitizing historical documents and making them freely available, which made this research possible. We also thank Alfred Mowdood for research assistance.

Conflicts of Interest

The authors declare no conflict of interest. The funders had no role in the design of the study; in the collection, analyses, or interpretation of data; in the writing of the manuscript, or in the decision to publish the results.

References

  1. Check Smoke Evil by Educational Campaign. Salt Lake Telegram. 8 February 1917. Available online: https://newspapers.lib.utah.edu/details?id=20017332 (accessed on 18 April 2020).
  2. Envision Utah. 2014 Values Study Results. 2014. Available online: https://yourutahyourfuture.org/images/final_values_study_report.pdf (accessed on 8 June 2020).
  3. Utah Division of Air Quality. Utah’s Air Quality 2021 Annual Report; Utah Division of Air Quality: Salt Lake City, UT, USA, 2022. Available online: https://documents.deq.utah.gov/air-quality/planning/air-quality-policy/DAQ-2022-000342.pdf (accessed on 13 July 2022).
  4. Ou, J.; Pirozzi, C.S.; Horne, B.D.; Hanson, H.A.; Kirchhoff, A.C.; Mitchell, L.E.; Coleman, N.C.; Arden Pope, C. Historic and Modern Air Pollution Studies Conducted in Utah. Atmosphere 2020, 11, 1094. [Google Scholar] [CrossRef]
  5. Lelieveld, J.; Evans, J.S.; Fnais, M.; Giannadaki, D.; Pozzer, A. The contribution of outdoor air pollution sources to premature mortality on a global scale. Nature 2015, 525, 367–371. [Google Scholar] [CrossRef] [PubMed]
  6. Landrigan, P.J.; Fuller, R.; Acosta, N.J.R.; Adeyi, O.; Arnold, R.; Basu, N.; Baldé, A.B.; Bertollini, R.; Bose-O’Reilly, S.; Boufford, J.I.; et al. The Lancet Commission on pollution and health. Lancet 2017, 391, 462–512. [Google Scholar] [CrossRef] [Green Version]
  7. Di, Q.; Wang, Y.; Zanobetti, A.; Wang, Y.; Koutrakis, P.; Choirat, C.; Dominici, F.; Schwartz, J.D. Air Pollution and Mortality in the Medicare Population. N. Engl. J. Med. 2017, 376, 2513–2522. [Google Scholar] [CrossRef] [PubMed]
  8. Errigo, I.M.; Abbott, B.W.; Mendoza, D.L.; Mitchell, L.; Sayedi, S.S.; Glenn, J.; Kelly, K.E.; Beard, J.D.; Bratsman, S.; Carter, T.; et al. Human Health and Economic Costs of Air Pollution in Utah: An Expert Assessment. Atmosphere 2020, 11, 1238. [Google Scholar] [CrossRef]
  9. Zivin, J.G.; Neidell, M. Air pollution’s hidden impacts. Science 2018, 359, 39–40. [Google Scholar] [CrossRef]
  10. U.S. EPA. Integrated Science Assessment (ISA) of Ozone and Related Photochemical Oxidants; U.S. EPA: Washington, DC, USA, 2013. Available online: https://cfpub.epa.gov/ncea/isa/recordisplay.cfm?deid=247492 (accessed on 1 December 2017).
  11. Mendoza, D.L.; Pirozzi, C.S.; Crosman, E.T.; Liou, T.G.; Zhang, Y.; Cleeves, J.J.; Bannister, S.C.; Anderegg, W.R.L.; Robert, P.I. Impact of low-level fine particulate matter and ozone exposure on absences in K-12 students and economic consequences. Environ. Res. Lett. 2020, 15, 114052. [Google Scholar] [CrossRef]
  12. Zajchowski, C.A.B.; Brownlee, M.T.J.; Blacketer, M.; Rose, J.; Rumore, D.L.; Watson, J.; Dustin, D.L. “Can you take me higher?”: Normative thresholds for air quality in the Salt Lake City Metropolitan area. J. Leis. Res. 2019, 50, 157–180. [Google Scholar] [CrossRef]
  13. Bachmann, J. Will the Circle Be Unbroken: A History of the U.S. National Ambient Air Quality Standards. J. Air Waste Manag. Assoc. 2007, 57, 652–697. [Google Scholar] [CrossRef]
  14. Siddaway, A.P.; Wood, A.M.; Hedges, L.V. How to Do a Systematic Review: A Best Practice Guide for Conducting and Reporting Narrative Reviews, Meta-Analyses, and Meta-Syntheses. Annu. Rev. Psychol. 2019, 70, 747–770. [Google Scholar] [CrossRef]
  15. Franchini, M.; Mannucci, P.M. Mitigation of air pollution by greenness: A narrative review. Eur. J. Intern. Med. 2018, 55, 1–5. [Google Scholar] [CrossRef] [PubMed]
  16. Holland, I.; DeVille, N.V.; Browning, M.H.E.M.; Buehler, R.M.; Hart, J.E.; Hipp, J.A.; Mitchell, R.; Rakow, D.A.; Schiff, J.E.; White, M.P.; et al. Measuring Nature Contact: A Narrative Review. Int. J. Environ. Res. Public. Health 2021, 18, 4092. [Google Scholar] [CrossRef]
  17. Fairbanks, J.L. City Planning. Munic. Rec. 1920, 9, 4–7. Available online: https://babel.hathitrust.org/cgi/pt?id=nyp.33433015315769&view=1up&seq=253 (accessed on 27 April 2020).
  18. Deseret News. Remarks by President Brigham Young. 26 September 1860. Available online: https://newspapers.lib.utah.edu/details?id=2585051 (accessed on 22 October 2021).
  19. Lebel, E.D.; Finnegan, C.J.; Ouyang, Z.; Jackson, R.B. Methane and Nox Emissions from Natural Gas Stoves, Cooktops, and Ovens in Residential Homes. Environ. Sci. Technol. 2022, 56, 2529–2539. [Google Scholar] [CrossRef] [PubMed]
  20. The Smoke Nuisance. Deseret News. 9 May 1883. Available online: https://newspapers.lib.utah.edu/details?id=2644770 (accessed on 30 March 2020).
  21. The Smoke Nuisance. Salt Lake Tribune. 26 June 1893. Available online: https://newspapers.lib.utah.edu/details?id=12517223 (accessed on 30 March 2020).
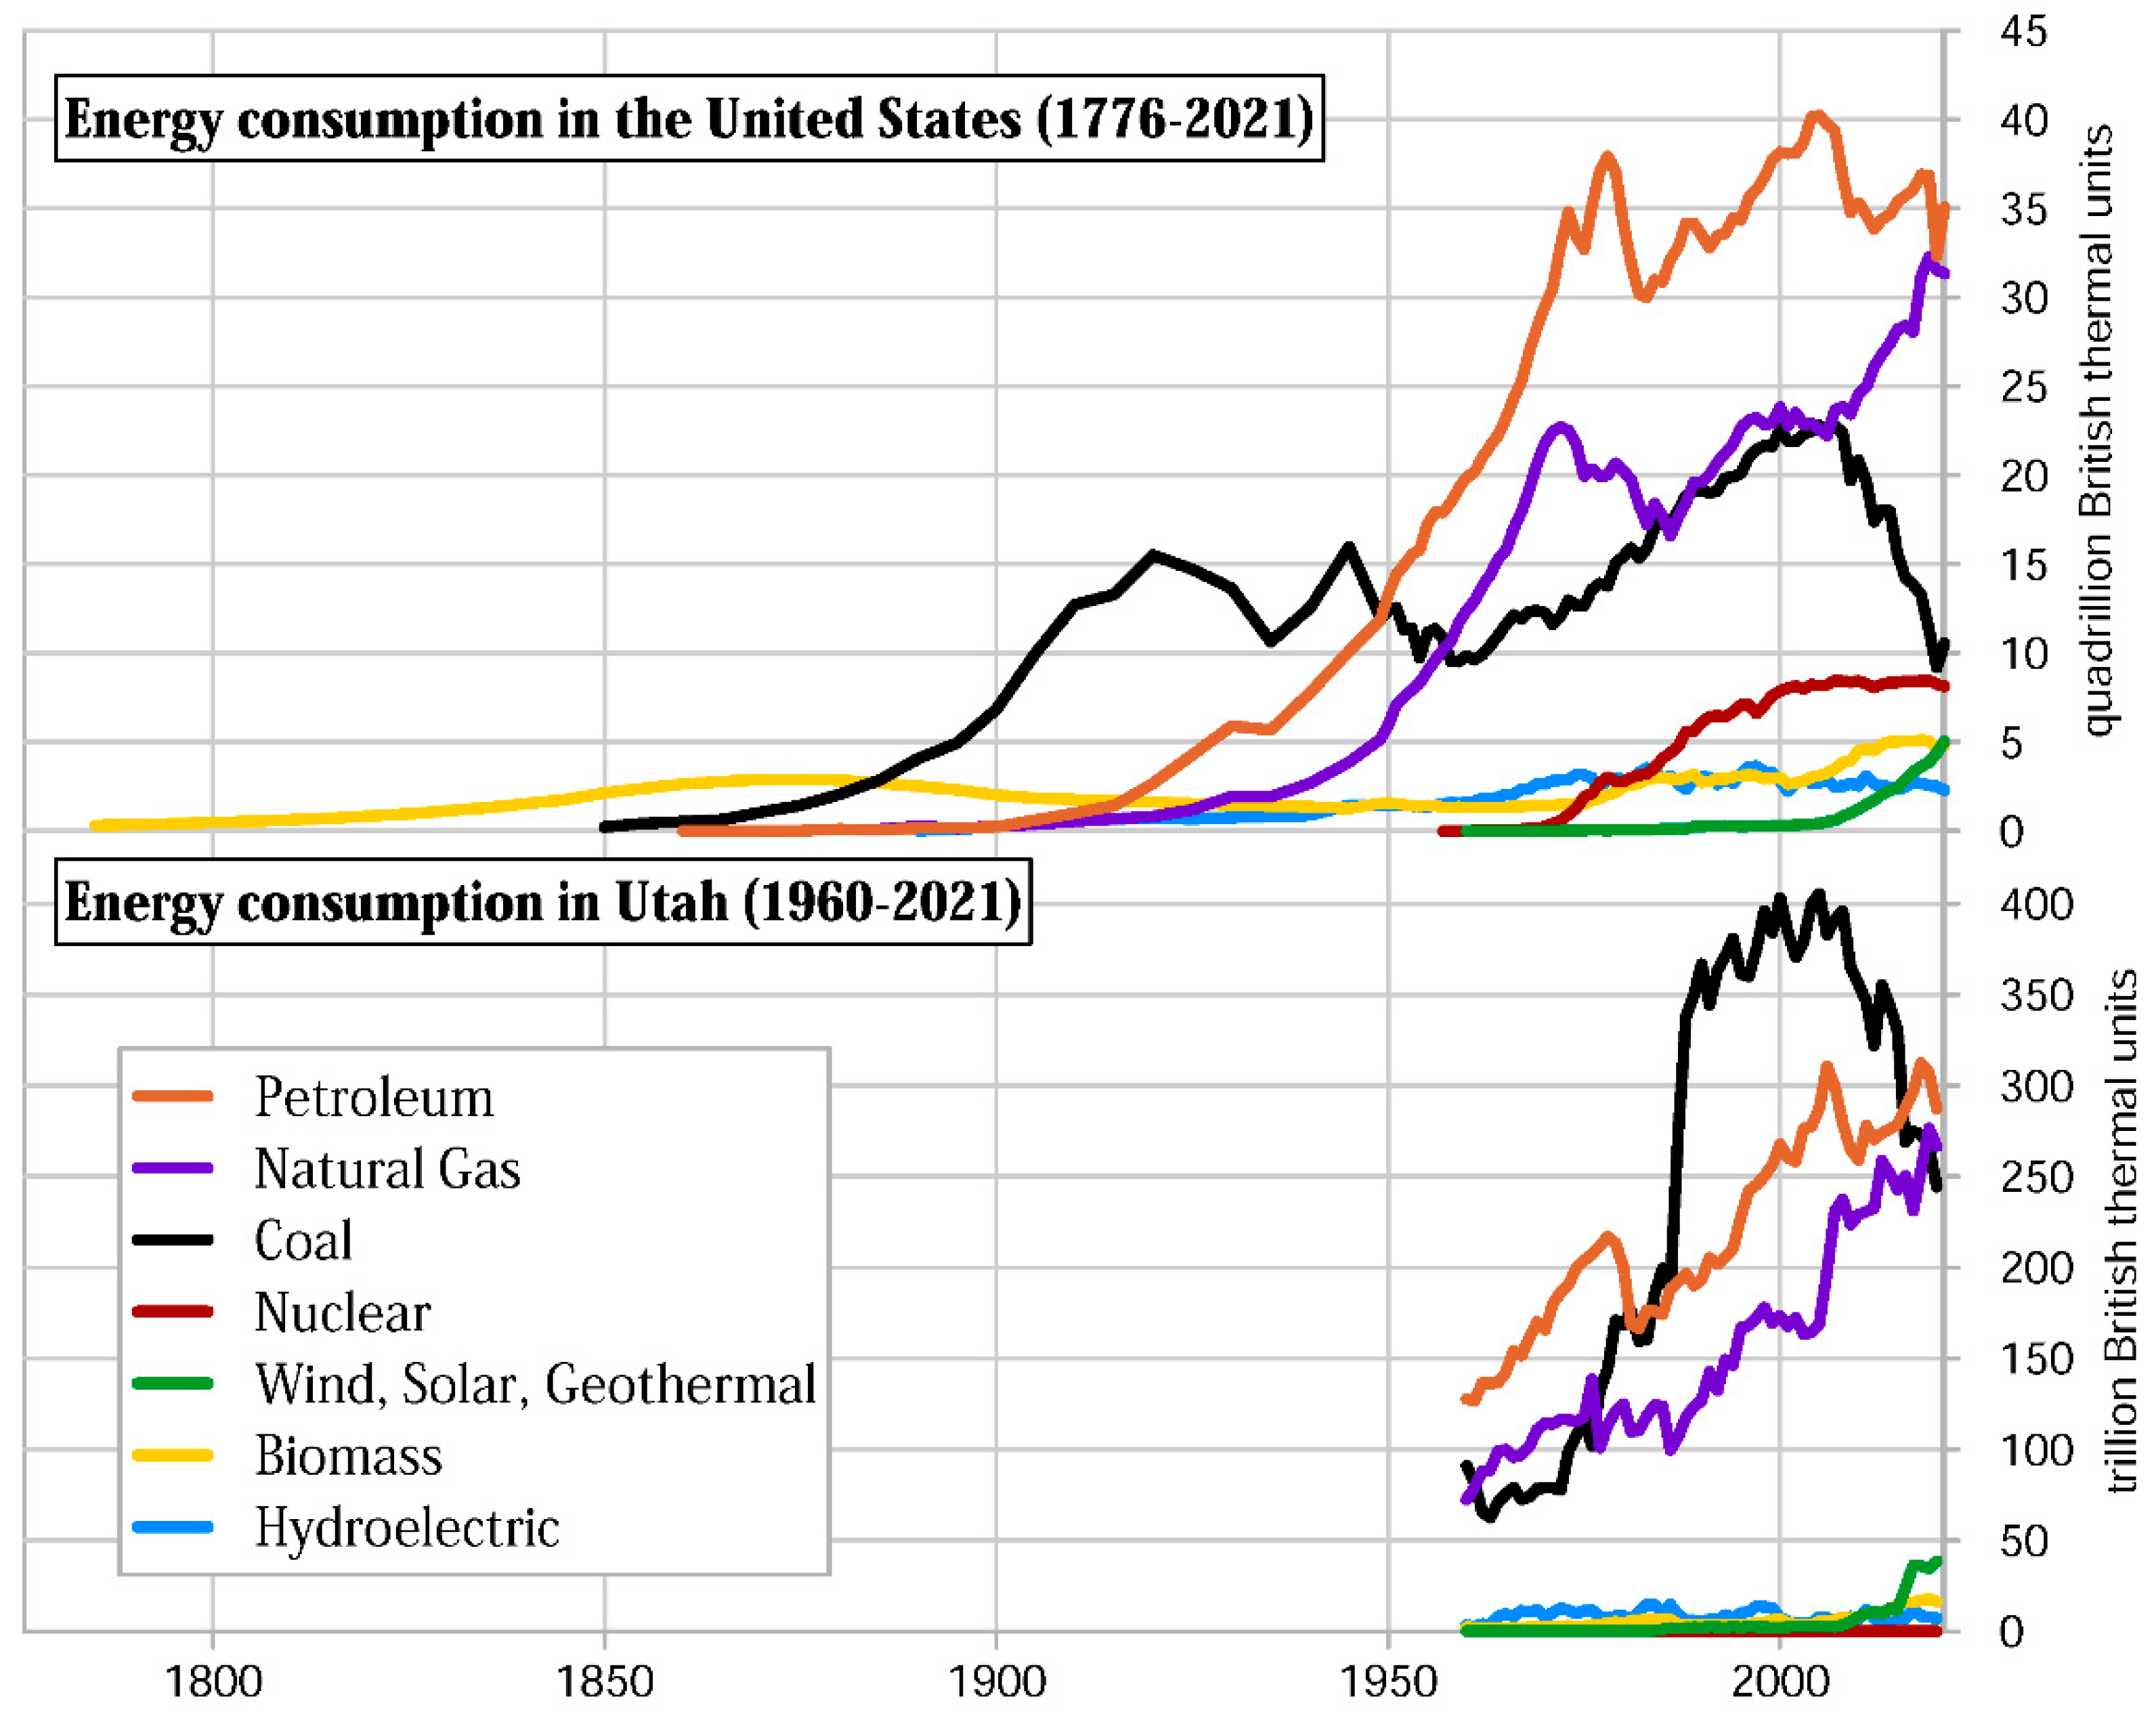
  22. U.S. Energy Information Administration Total Energy Monthly Data. Available online: https://www.eia.gov/totalenergy/data/monthly/index.php (accessed on 21 May 2022).
  23. U.S. Energy Information Administration State Energy Data System (SEDS): 1960–2020. Available online: https://www.eia.gov/state/seds/seds-data-complete.php?sid=UT (accessed on 18 July 2022).
  24. Johnston, F.R. Small Business Owners on Compliance with Environmental Regulations in Utah’s Manufacturing Industry: A Case Study. Ph.D. Thesis, Northcentral University, Prescott Valley, AZ, USA, 2016. [Google Scholar]
  25. The Nuisance of Smoke. Deseret News. 21 December 1881. Available online: https://newspapers.lib.utah.edu/details?id=2634016 (accessed on 17 April 2020).
  26. Salt Lake City Corporation. Smoke Emitted from Chimneys; Salt Lake City Corporation: Salt Lake City, UT, USA, 1891; pp. 294–295. [Google Scholar]
  27. To Abate the Smoke Nuisance. Deseret Evening News. 3 September 1891. Available online: https://newspapers.lib.utah.edu/details?id=1588551 (accessed on 30 March 2020).
  28. Lareau, N.P.; Crosman, E.; Whiteman, C.D.; Horel, J.D.; Hoch, S.W.; Brown, W.O.J.; Horst, T.W. The Persistent Cold-Air Pool Study. Bull. Am. Meteorol. Soc. 2012, 94, 51–63. [Google Scholar] [CrossRef] [Green Version]
  29. Whiteman, C.D.; Hoch, S.W.; Horel, J.D.; Charland, A. Relationship between particulate air pollution and meteorological variables in Utah’s Salt Lake Valley. Atmos. Environ. 2014, 94, 742–753. [Google Scholar] [CrossRef]
  30. Location of Factories. Salt Lake Herald-Republican. 22 February 1893. Available online: https://newspapers.lib.utah.edu/details?id=11049267 (accessed on 4 April 2020).
  31. Lane, H.M.; Morello-Frosch, R.; Marshall, J.D.; Apte, J.S. Historical Redlining Is Associated with Present-Day Air Pollution Disparities in U.S. Cities. Environ. Sci. Technol. Lett. 2022, 9, 345–350. [Google Scholar] [CrossRef]
  32. Governor Spencer Cox Gov. Cox and Lt. Gov. Henderson Release One Utah Roadmap Update. Available online: https://governor.utah.gov/2021/10/20/gov-cox-and-lt-gov-henderson-release-one-utah-roadmap-update/ (accessed on 29 May 2022).
  33. American Smelting & Refining Co. v. Godfrey, 158 F. 225. 1907. Available online: https://cite.case.law/f/158/225/ (accessed on 16 April 2020).
  34. Church, M.A. Smoke Farming: Smelting and Agricultural Reform in Utah, 1900–1945. Utah Hist. Q. 2004, 72, 196–218. [Google Scholar]
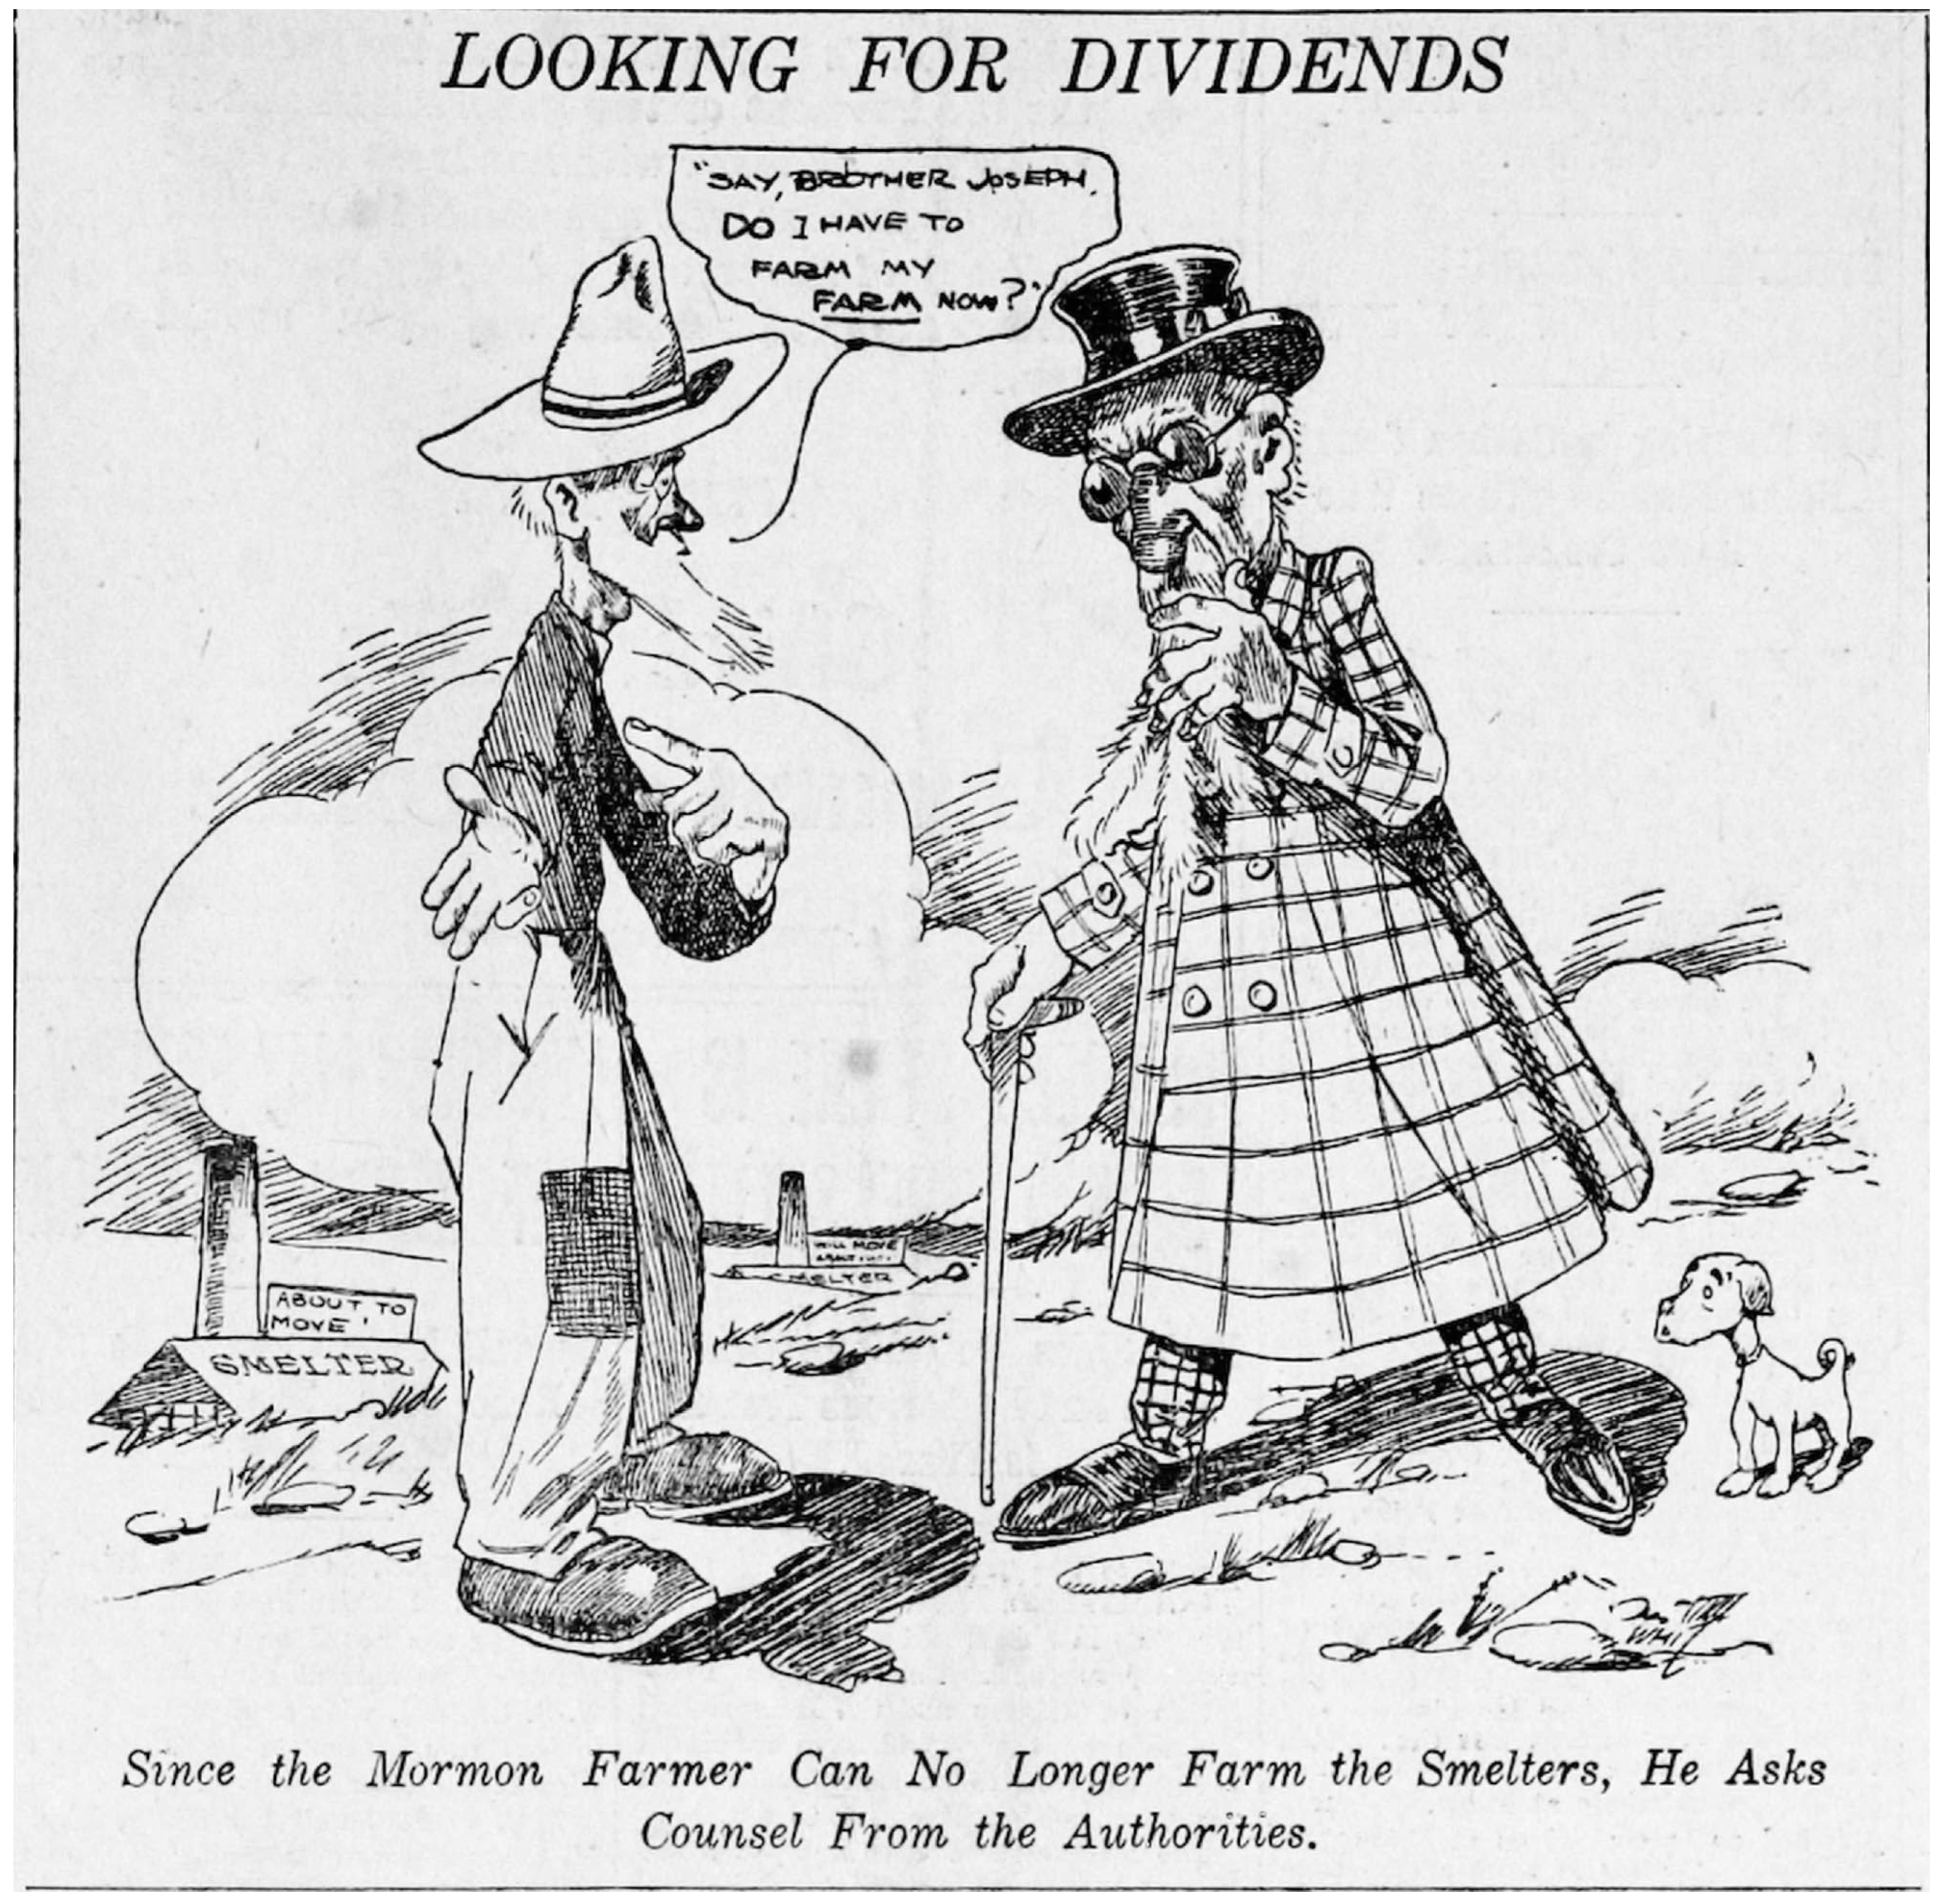
  35. Looking for Dividends. Salt Lake Tribune. 28 December 1906. Available online: https://newspapers.lib.utah.edu/details?id=13893263 (accessed on 19 July 2022).
  36. Flagg, S.B. City Smoke Ordinances and Smoke Abatement; United States Department of the Interior, Bureau of Mines; Government Printing Office: Washington, DC, USA, 1912; Available online: https://digital.library.unt.edu/ark:/67531/metadc12845/ (accessed on 13 April 2020).
  37. Smoke Trouble Can be Stopped. Salt Lake Herald-Republican. 3 February 1908. Available online: https://newspapers.lib.utah.edu/details?id=11872203 (accessed on 9 March 2022).
  38. Council Aids in Smoke Abatement. Salt Lake Herald-Republican. 7 November 1911. Available online: https://newspapers.lib.utah.edu/details?id=9937330 (accessed on 9 March 2022).
  39. New Anti-Smoke Ordnance Will Be Strictly Enforced, Says the Mayor. Salt Lake Telegram. 30 April 1903. Available online: https://newspapers.lib.utah.edu/details?id=18371733 (accessed on 9 March 2022).
  40. Smoke Clouds Greet Tourists in Salt Lake. Salt Lake Herald-Republican. 19 December 1912. Available online: https://newspapers.lib.utah.edu/details?id=10092789 (accessed on 17 April 2020).
  41. The Smoke Nuisance II-The Economic Problem. Salt Lake Telegram. 18 November 1912. Available online: https://newspapers.lib.utah.edu/details?id=19570261 (accessed on 17 April 2020).
  42. Women Will Assist in Fight on Smoke. Salt Lake Tribune. 7 October 1913. Available online: https://newspapers.lib.utah.edu/details?id=14397839 (accessed on 17 April 2020).
  43. Smoke Talks Engage Ears of Officials. Salt Lake Tribune. 22 January 1914. Available online: https://newspapers.lib.utah.edu/details?id=14493134 (accessed on 17 April 2020).
  44. Form League for Smoke Abatement. Salt Lake Tribune . 7 April 1914. Available online: https://newspapers.lib.utah.edu/details?id=14478448 (accessed on 17 April 2020).
  45. Women Gather Data to Wage War on Smoke. Salt Lake Telegram. 31 January 1914. Available online: https://newspapers.lib.utah.edu/details?id=15979425 (accessed on 17 April 2020).
  46. Push Campaign to Lessen Smoke. Salt Lake Tribune. 25 August 1914. Available online: https://newspapers.lib.utah.edu/details?id=14610418 (accessed on 17 April 2020).
  47. Metallurgists to Attact Zion Smoke. Salt Lake Tribune. 28 September 1914, pp. A1–A2. Available online: https://newspapers.lib.utah.edu/details?id=14578784 (accessed on 17 April 2020).
  48. Airplane to Aid in Smoke Probe. Salt Lake Tribune. 2 November 1919. Available online: https://newspapers.lib.utah.edu/details?id=15076993 (accessed on 18 April 2020).
  49. Perrott, G.S.J. Smoke Problem at Salt Lake City. Power Plant Eng. 1920, 24, 784–785. [Google Scholar]
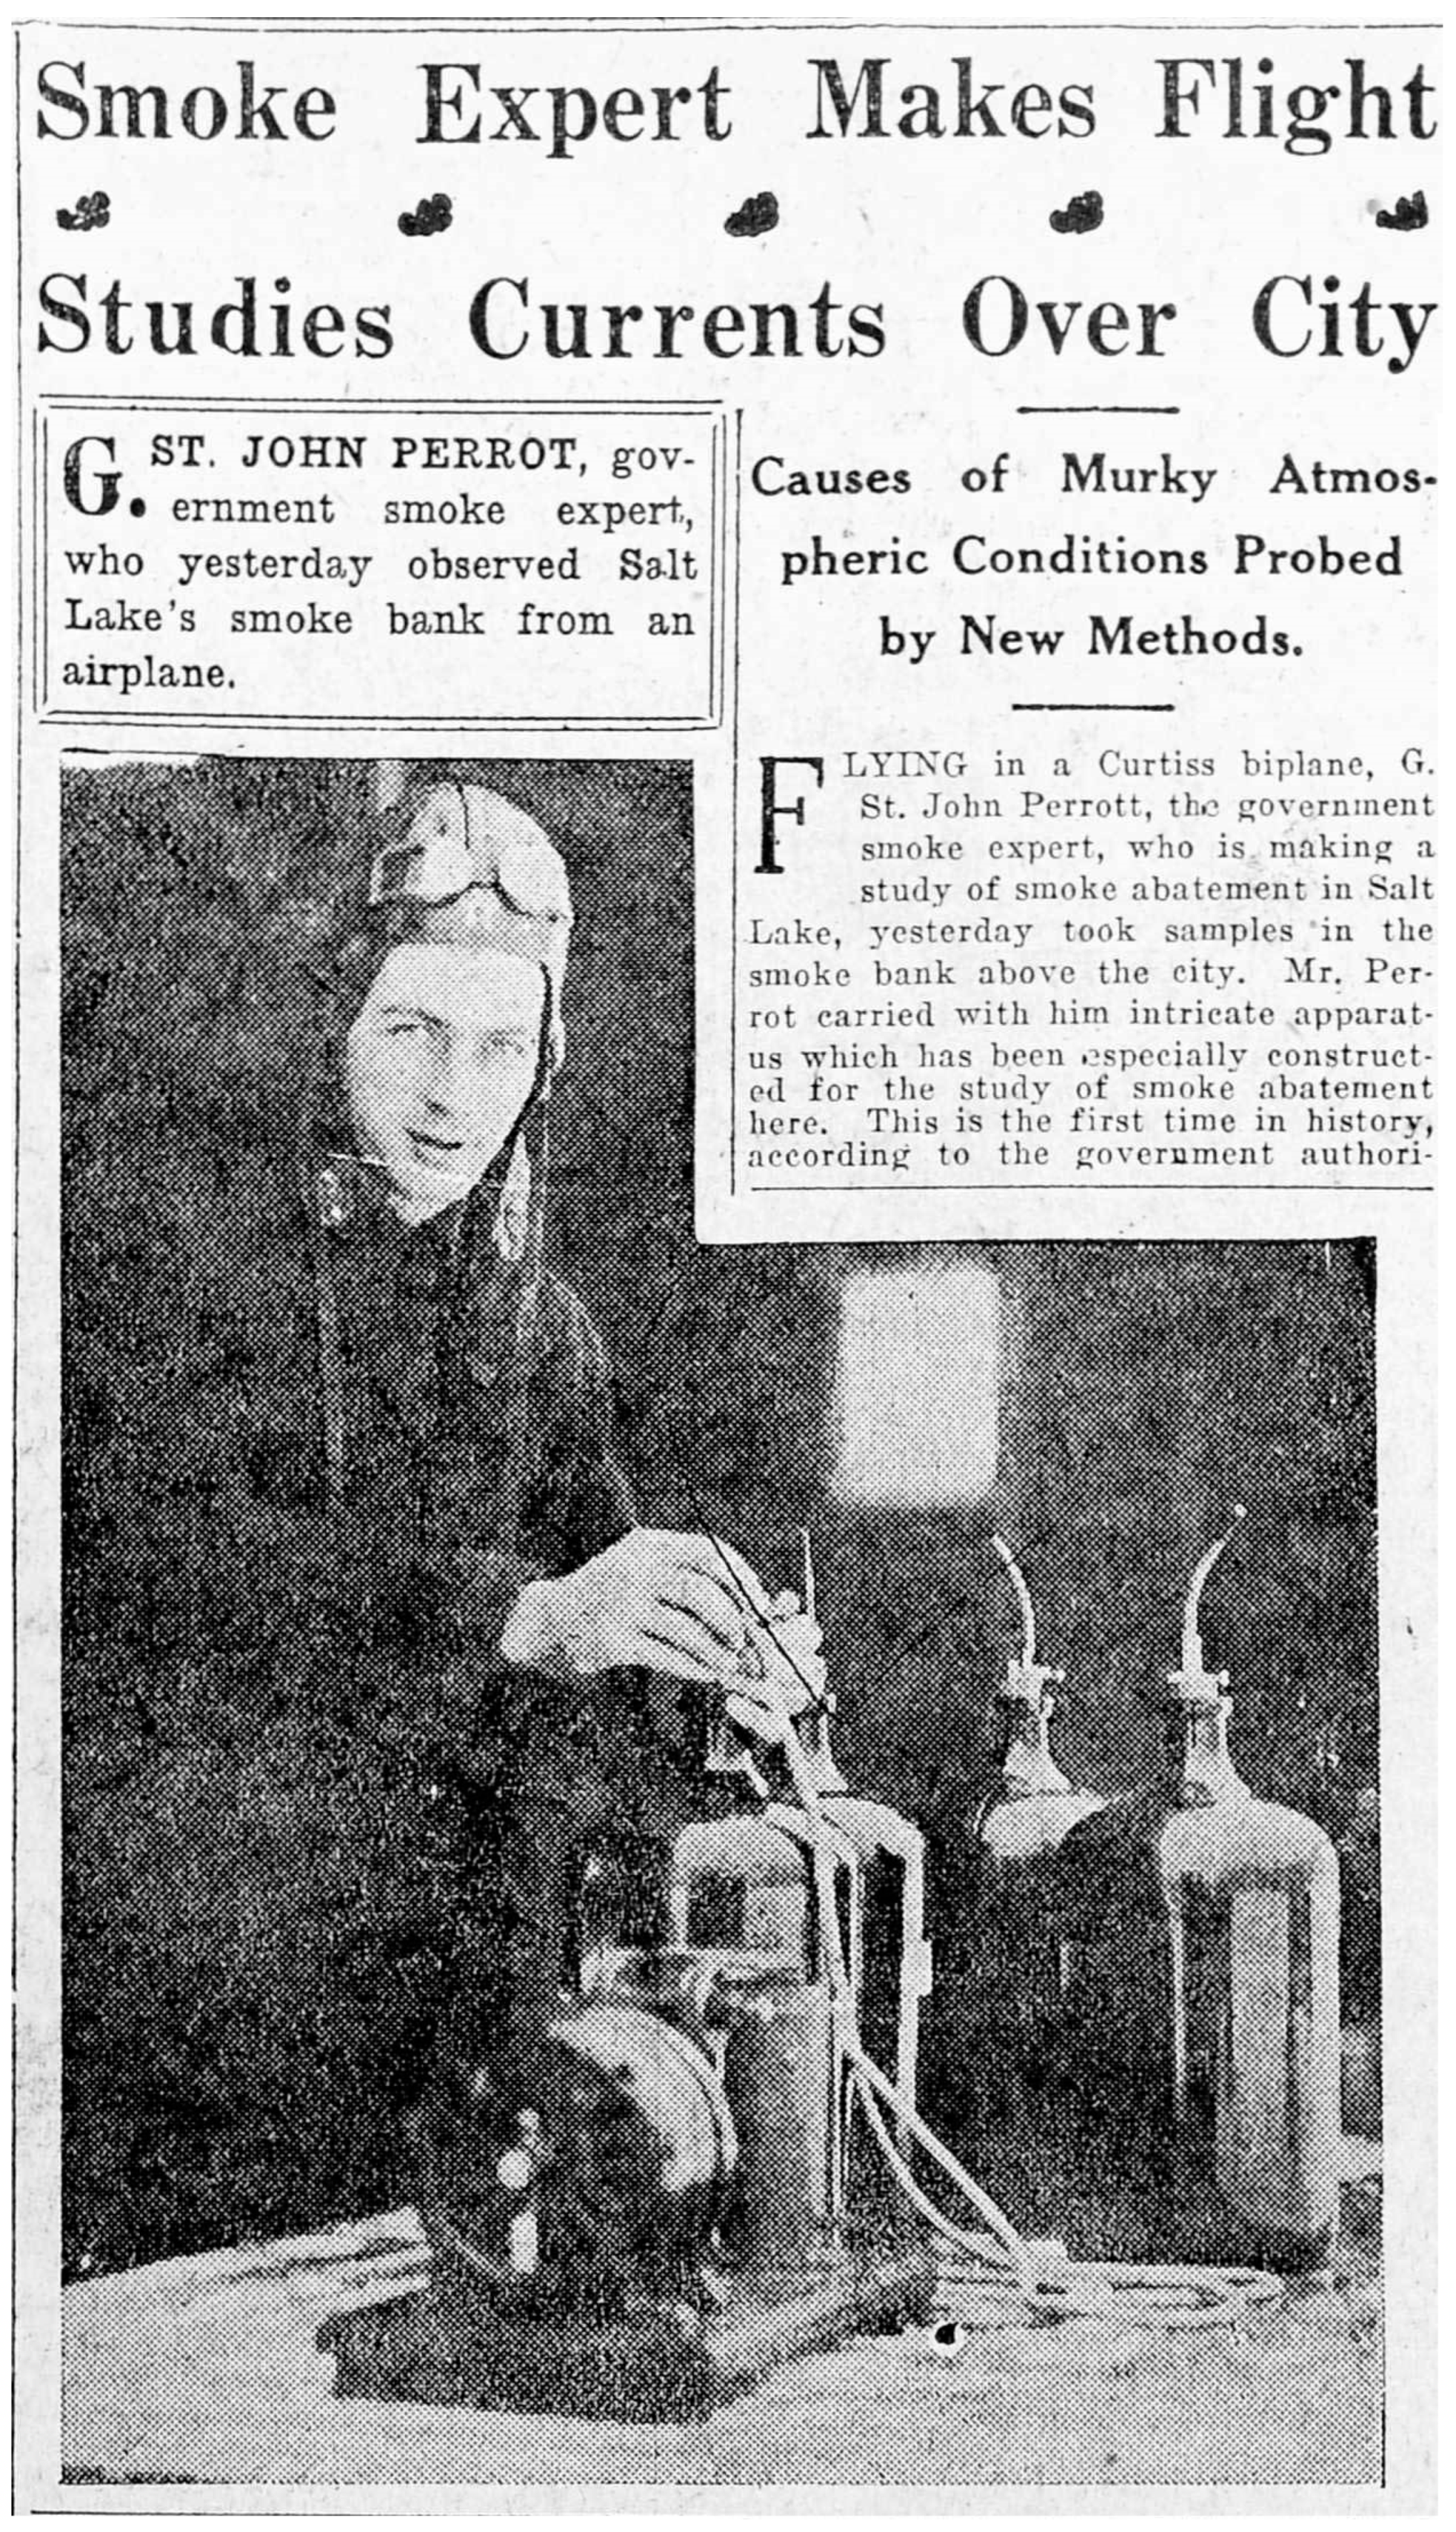
  50. Smoke Expert Makes Flight Studies Currents Over City. Salt Lake Tribune. 10 November 1919. Available online: https://newspapers.lib.utah.edu/details?id=15043354 (accessed on 18 April 2020).
  51. Dickson, C.R. A synoptic climatology of diurnal inversions in the Jordan Valley. Master’s Thesis, University of Utah, Salt Lake City, UT, USA, 1957. [Google Scholar]
  52. Schmalz, W.M. Some Notes on Visibilities at Salt Lake Airport. Bull. Am. Meteorol. Soc. 1947, 28, 179–186. [Google Scholar] [CrossRef] [Green Version]
  53. Williams, P. Air Pollution Potential over the Salt Lake Valley of Utah as Related to Stability and Wind Speed. J. Appl. Meteorol. 1964, 3, 92–97. [Google Scholar] [CrossRef] [Green Version]
  54. Gudmundsen, A. Nine Years of Smoke-Abatement Work at Salt Lake City; U.S. Department of Commerce, Bureau of Mines: Washington, DC, USA, 1930; Available online: https://catalog.hathitrust.org/Record/006865386 (accessed on 13 April 2020).
  55. Monnett, O. Smoke Abatement; U.S. Department of Commerce, Bureau of Mines: Washington, DC, USA, 1923; Available online: http://hdl.handle.net/2027/mdp.39015077560111 (accessed on 13 April 2020).
  56. Monnett, O.; Perrott, G.S.J.; Clark, H.W. Smoke-Abatement Investigation at Salt Lake City, Utah; U.S. Bureau of Mines: Washington, DC, USA, 1926; Available online: https://babel.hathitrust.org/cgi/pt?id=mdp.39015024579750&view=1up&seq=5 (accessed on 26 April 2020).
  57. Kuprov, R.; Eatough, D.J.; Cruickshank, T.; Olson, N.; Cropper, P.M.; Hansen, J.C. Composition and secondary formation of fine particulate matter in the Salt Lake Valley: Winter 2009. J. Air Waste Manag. Assoc. 2014, 64, 957–969. [Google Scholar] [CrossRef] [PubMed] [Green Version]
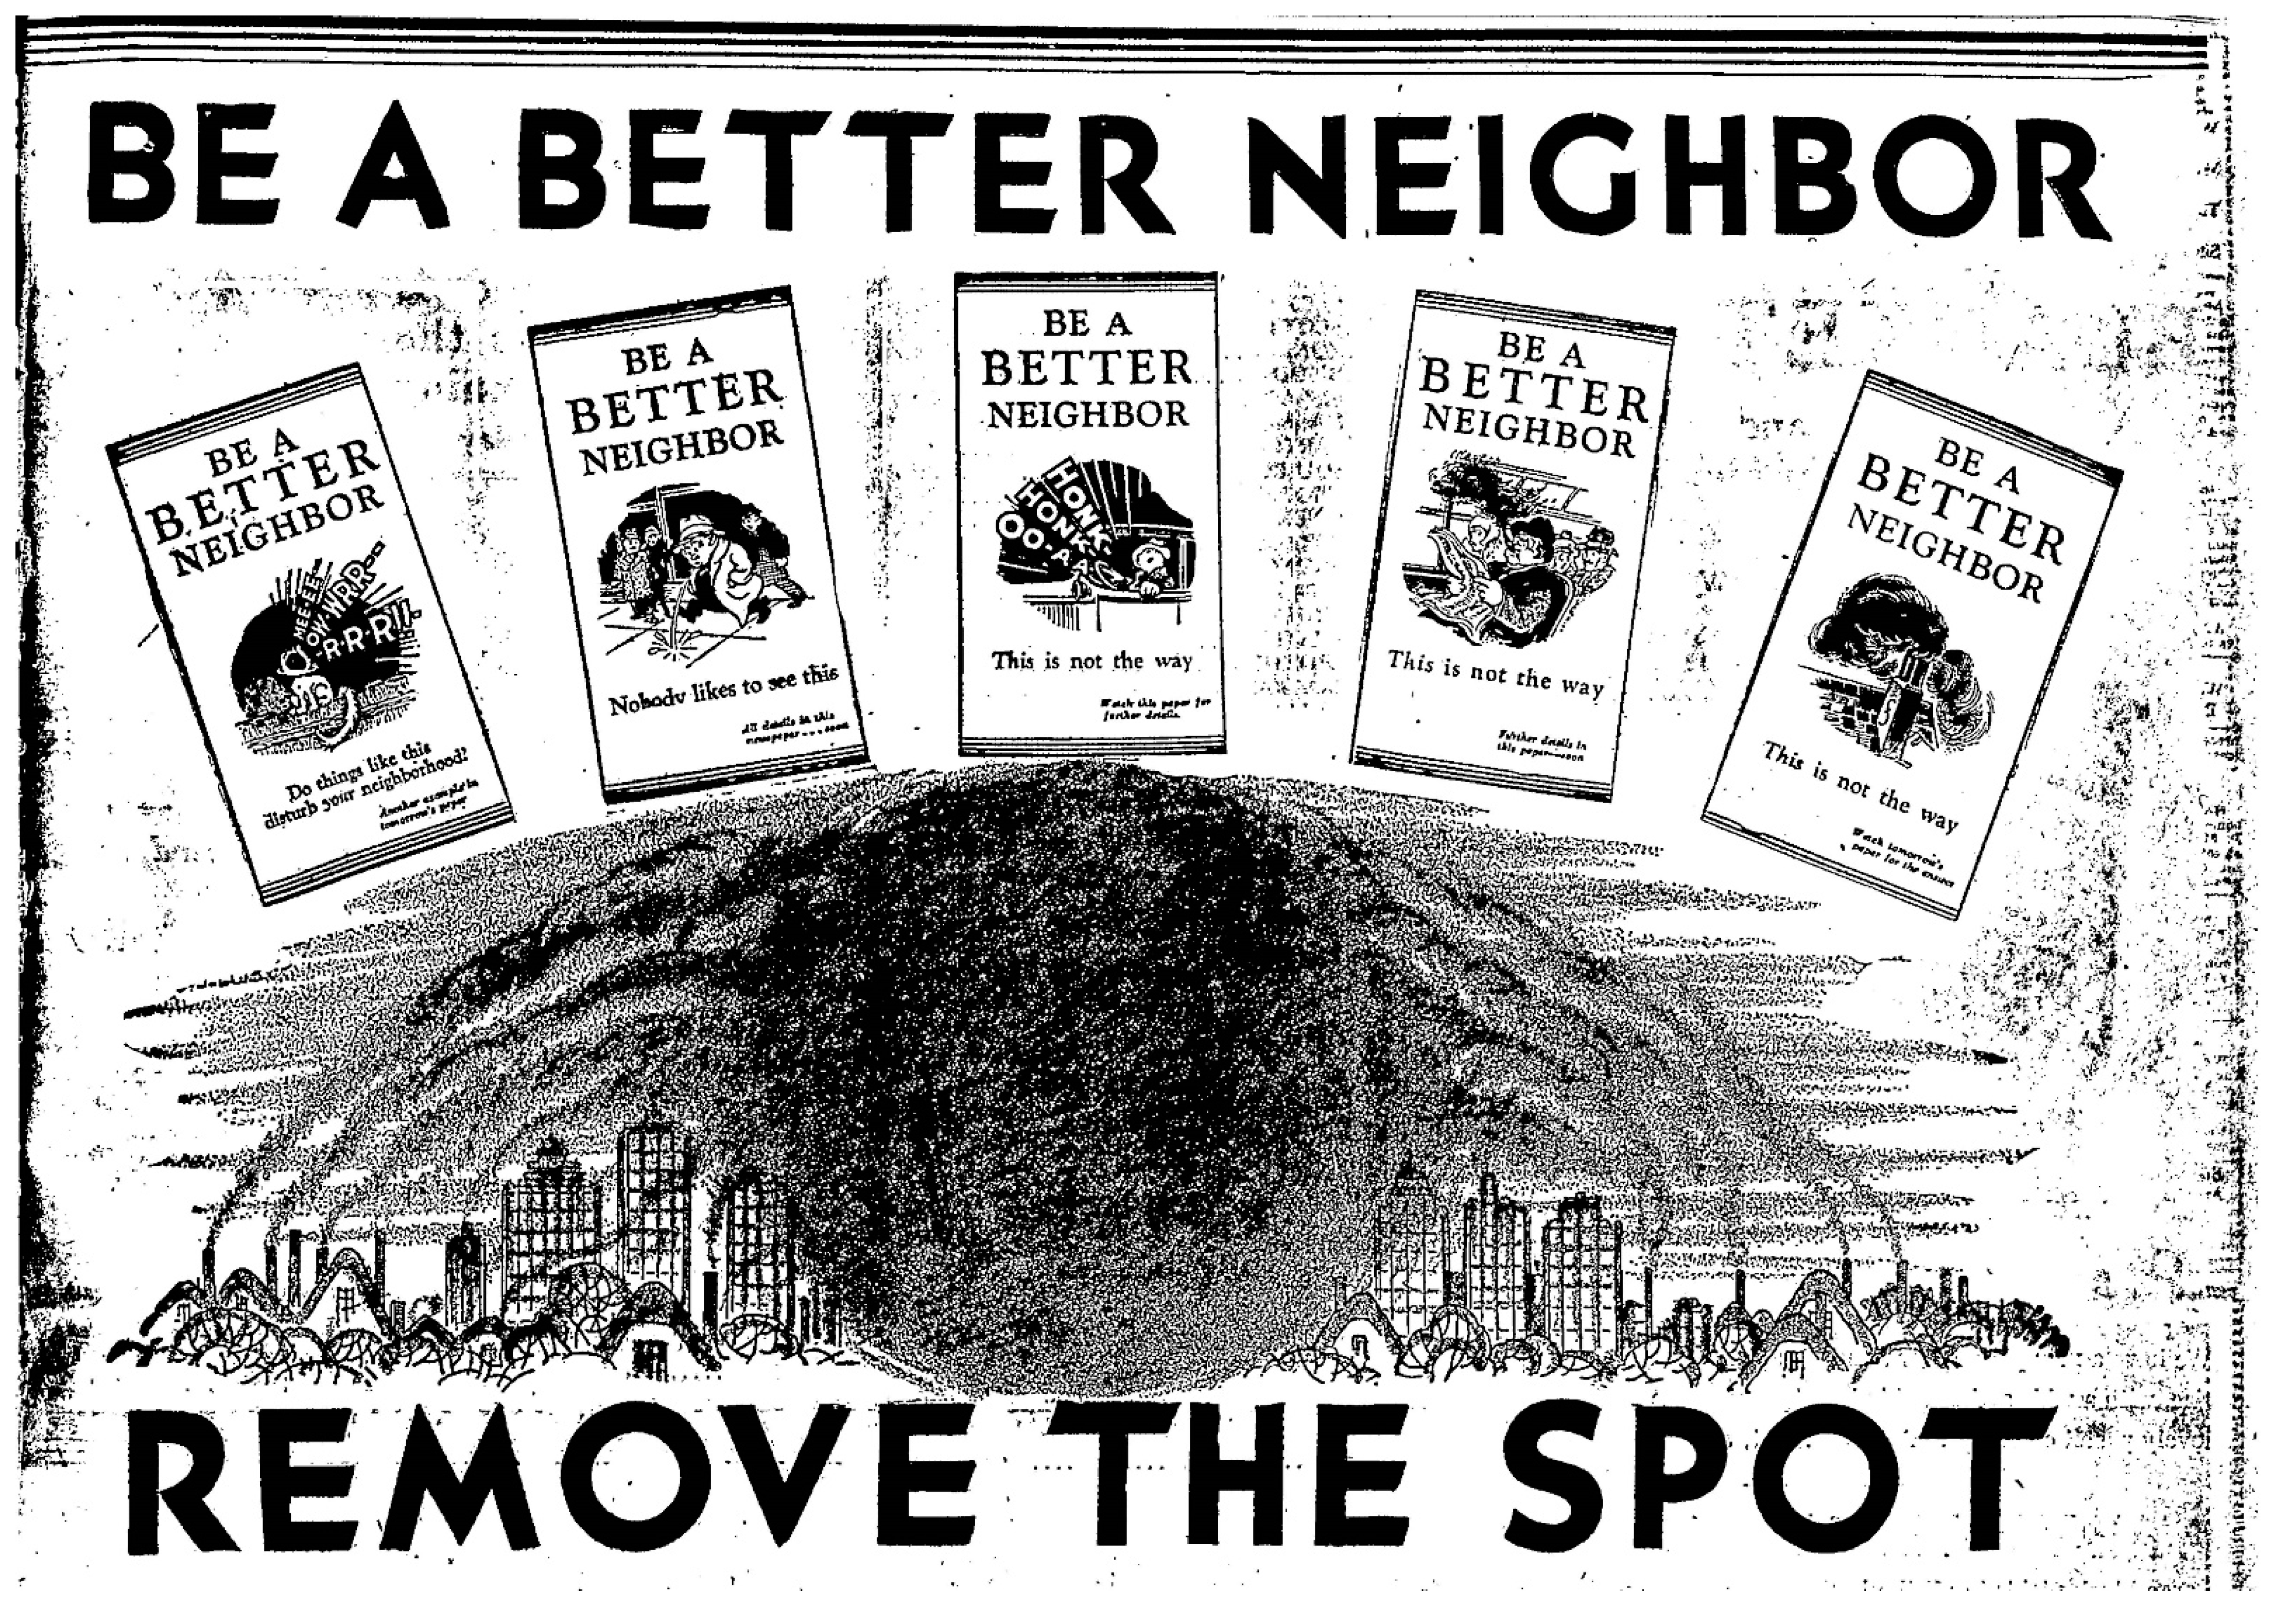
  58. Be a Better Neighbor Remove the Spot. Salt Lake Telegram. 24 October 1930. Available online: https://newspapers.lib.utah.edu/details?id=15680318 (accessed on 30 March 2022).
  59. Assistant Smoke Abatement Engineer Appointed by City. Salt Lake Telegram . 24 December 1937. Available online: https://newspapers.lib.utah.edu/details?id=18727234 (accessed on 20 April 2020).
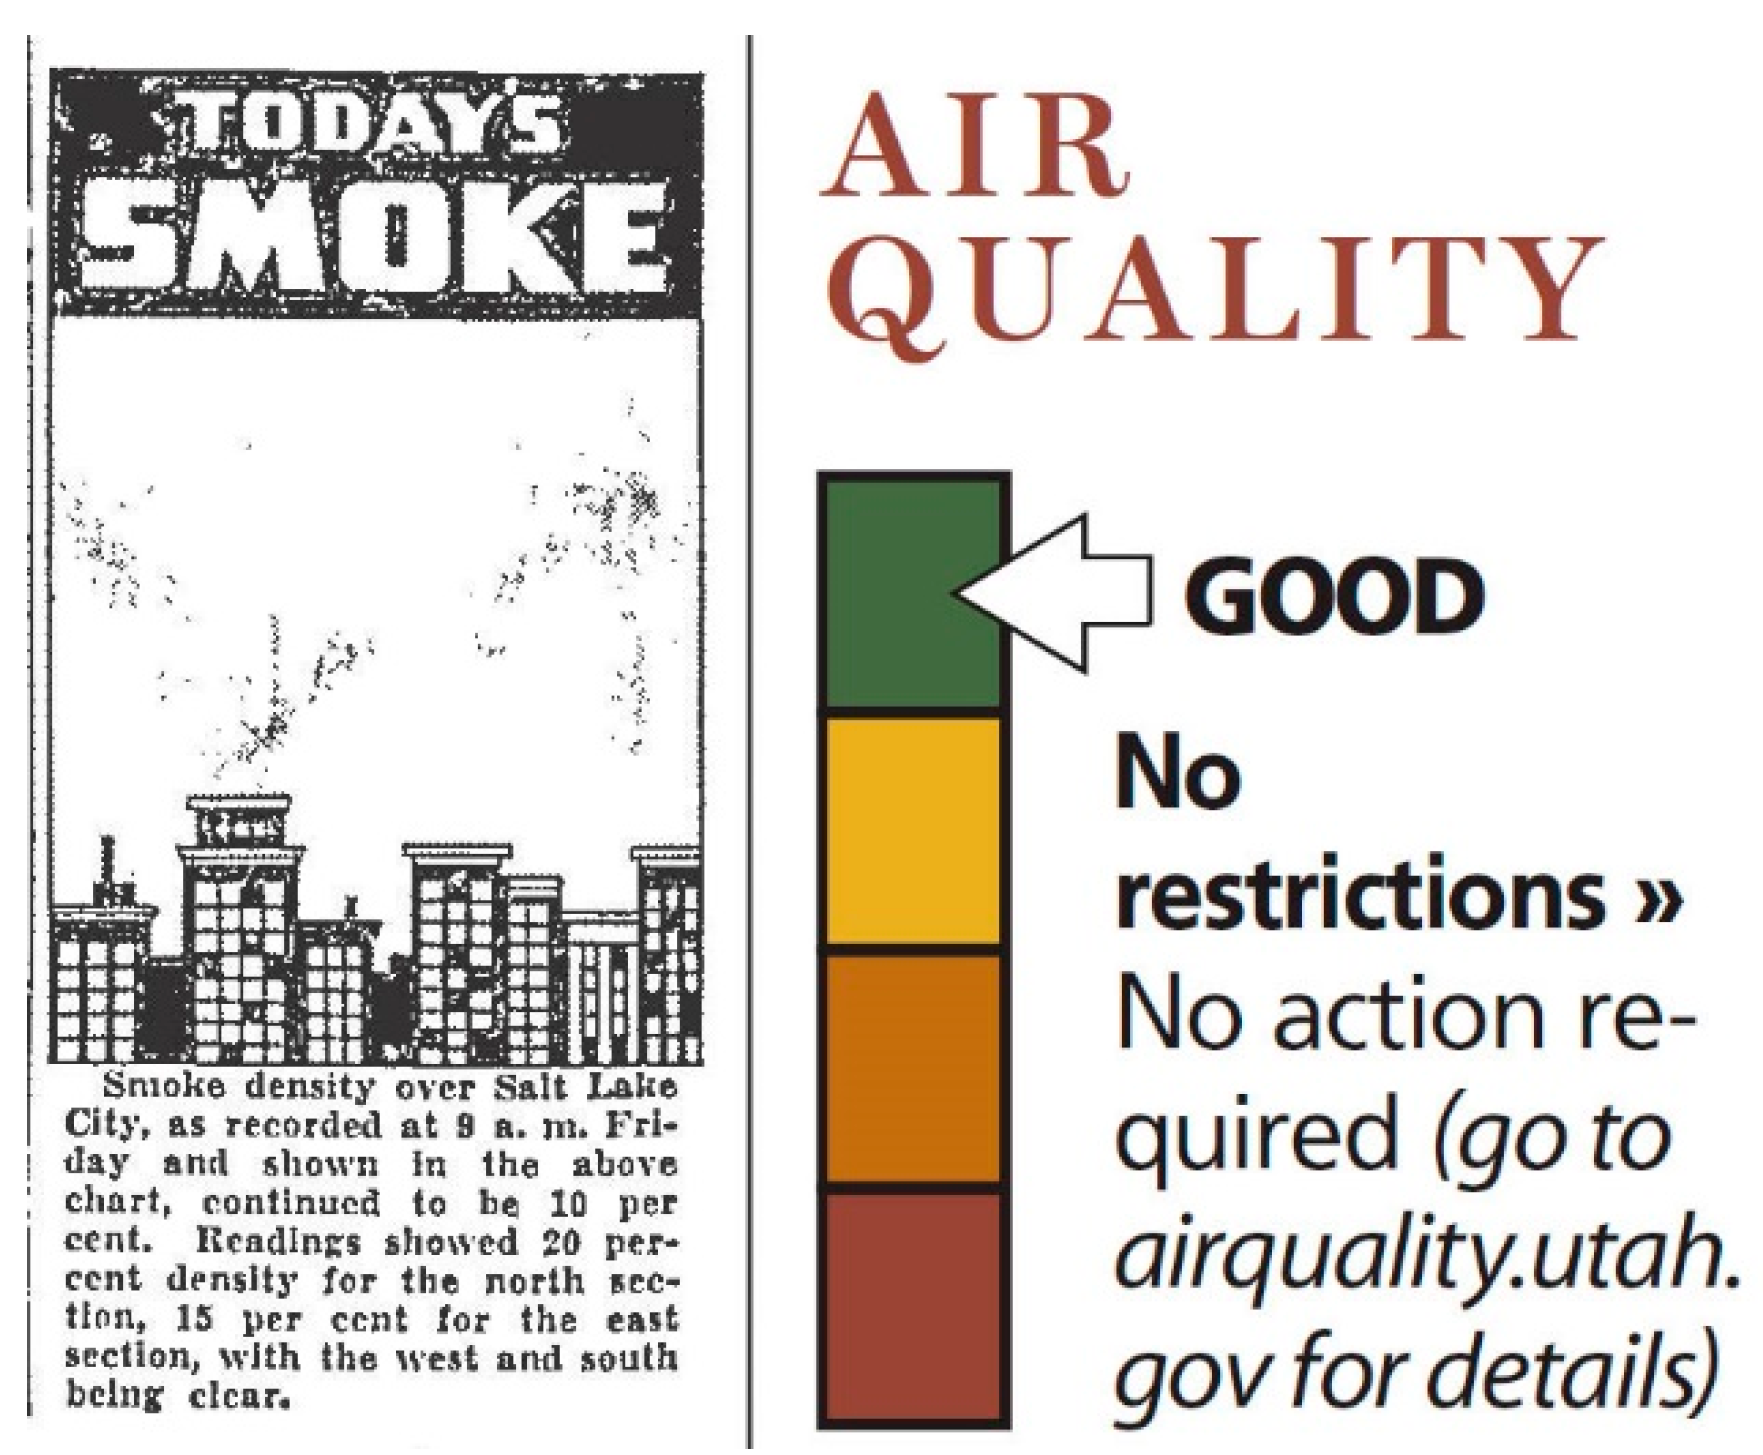
  60. Today’s Smoke. Salt Lake Telegram. 7 March 1941. Available online: https://newspapers.lib.utah.edu/details?id=16906496 (accessed on 19 July 2022).
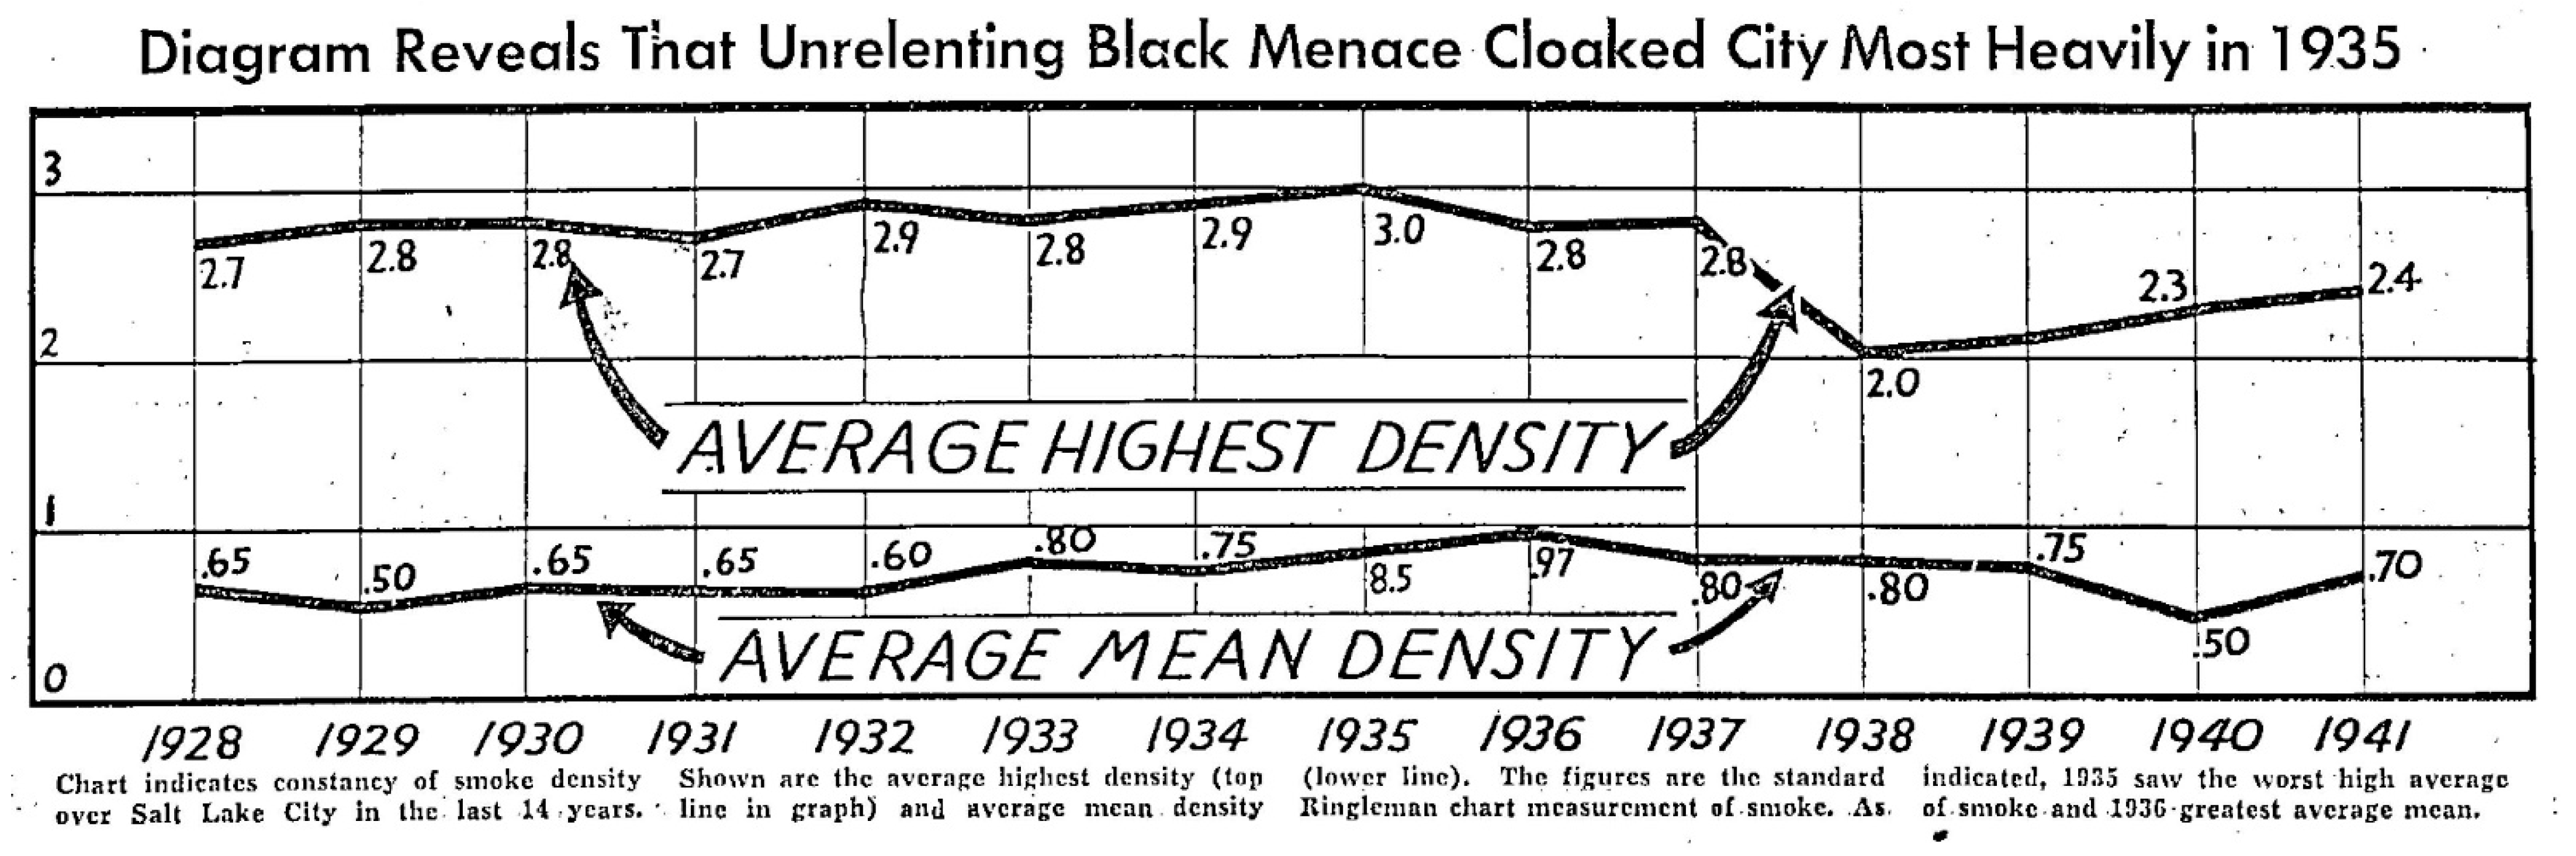
  61. Diagram Reveals That Unrelenting Black Menace Cloaked City Most Heavily in 1935. Salt Lake Telegram. 1 March 1941. Available online: https://newspapers.lib.utah.edu/details?id=16899625 (accessed on 6 April 2020).
  62. Heaney, R.J.; Winn, G.S.; Thorne, W.; Lloyd, L.H. Air Resources of Utah; Utah Legislative Council; Air Pollution Advisory Committee: Salt Lake City, UT, USA, 1962. Available online: https://digitallibrary.utah.gov/awweb/guest.jsp?smd=1&cl=all_lib&lb_document_id=62246 (accessed on 14 April 2020).
  63. Nemery, B.; Hoet, P.H.; Nemmar, A. The Meuse Valley fog of 1930: An air pollution disaster. Lancet 2001, 357, 704–708. [Google Scholar] [CrossRef]
  64. Jacobs, E.T.; Burgess, J.L.; Abbott, M.B. The Donora Smog Revisited: 70 Years after the Event That Inspired the Clean Air Act. Am. J. Public Health 2018, 108, S85–S88. [Google Scholar] [CrossRef] [PubMed]
  65. Schrenk, H.H.; Heimann, H.; Clayton, G.D.; Gafafer, W.M.; Wexler, H. Air Pollution in Donora, Pa. Epidemiology of the Unusual Smog Episode of October 1948; Public Health Bulletin; Public Health Service, U.S. Government Printing Office: Washington, DC, USA, 1949; Available online: https://hdl.handle.net/2027/uc1.c060945791 (accessed on 27 April 2020).
  66. Anderson, H.R. Air pollution and mortality: A history. Atmos. Environ. 2009, 43, 142–152. [Google Scholar] [CrossRef]
  67. Hallar, A.G.; Brown, S.S.; Crosman, E.; Barsanti, K.C.; Cappa, C.D.; Faloona, I.; Fast, J.; Holmes, H.A.; Horel, J.; Lin, J.; et al. Coupled Air Quality and Boundary-Layer Meteorology in Western U.S. Basins during Winter: Design and Rationale for a Comprehensive Study. Bull. Am. Meteorol. Soc. 2021, 102, E2012–E2033. [Google Scholar] [CrossRef]
  68. Utah Legislature. Air Pollution. 1963. Available online: https://digitallibrary.utah.gov/aw-server/rest/product/purl/USL/i/48ef689a-2211-4b03-b0b3-921eefa674a9 (accessed on 8 April 2022).
  69. Utah Legislature. Air Conservation Act. 1967. Available online: https://digitallibrary.utah.gov/aw-server/rest/product/purl/USL/i/ea9963f4-565f-42d7-8d8b-9c5dfe7fe2cd (accessed on 8 April 2022).
  70. Air Pollution Studies Planned by Utah State Health Department. Salt Lake Times . 13 April 1962. Available online: https://newspapers.lib.utah.edu/details?id=13317874 (accessed on 7 April 2022).
  71. Air Pollution Equipment Being Installed. Springville Herald. 9 July 1964. Available online: https://newspapers.lib.utah.edu/details?id=22363878 (accessed on 30 March 2022).
  72. Red Butte Canyon Goes to Service. Davis County Clipper. 9 May 1969. Available online: https://newspapers.lib.utah.edu/details?id=823736 (accessed on 8 April 2022).
  73. Salt Lake City; Emphysema Capital. The Daily Utah Chronicle . 19 May 1969. Available online: https://newspapers.lib.utah.edu/details?id=22473861 (accessed on 8 April 2022).
  74. Jackman, D.N. A Study of Meteorological Effect on Air Pollution in the Salt Lake Valley. Master’s Thesis, University of Utah, Salt Lake City, UT, USA, 1968. [Google Scholar]
  75. PSCIP Company Cooperating with City on Smog Problem. Springville Herald. 19 March 1964. Available online: https://newspapers.lib.utah.edu/details?id=22362037 (accessed on 13 April 2022).
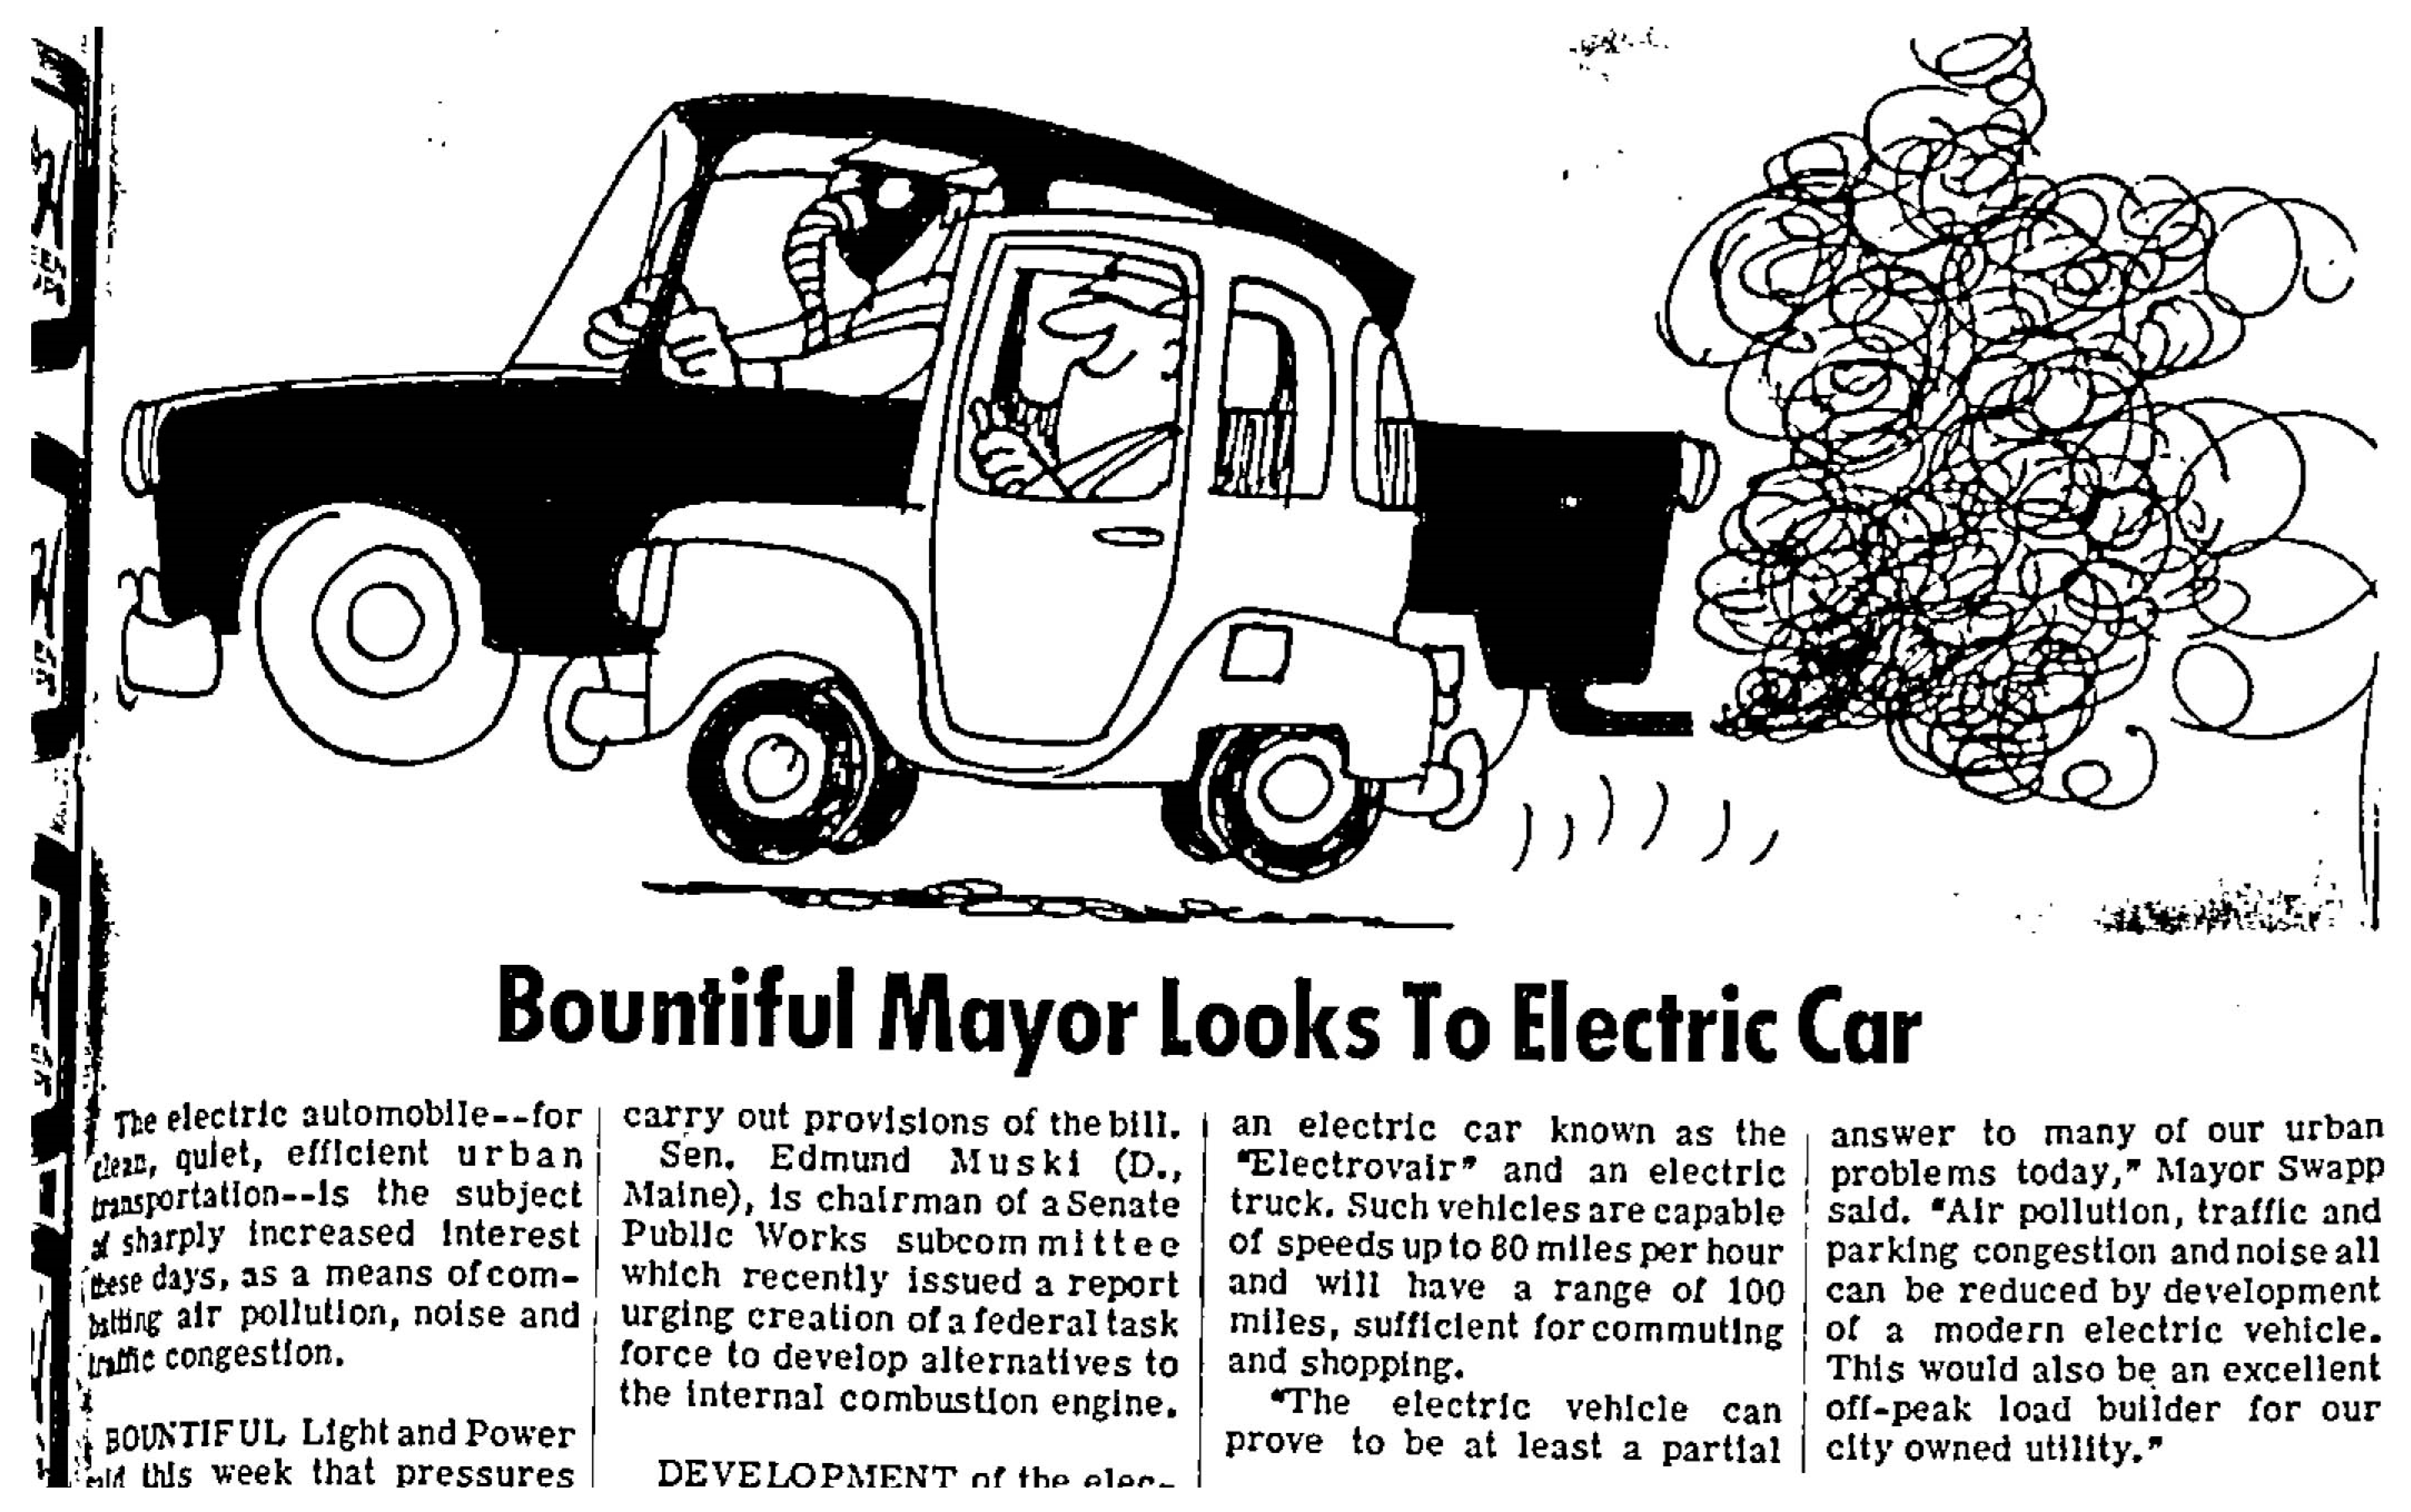
  76. Bountiful Mayor Looks to Electric Car. Davis County Clipper. 18 November 1966. Available online: https://newspapers.lib.utah.edu/details?id=791722 (accessed on 13 April 2022).
  77. Air Pollution Conference Planned in SLC. Springville Herald. 30 January 1969. Available online: https://newspapers.lib.utah.edu/details?id=22394024 (accessed on 13 April 2022).
  78. Hertz, M.; Truppi, L.; English, T.; Sovocool, G.W.; Burton, R.; Heiderscheit, T.; Hinton, D. Human Exposure to Air Pollutants in Salt Lake Basin Communities, 1940–1971. 1974. Available online: https://nepis.epa.gov/Exe/ZyPURL.cgi?Dockey=20015S4I.txt (accessed on 27 April 2022).
  79. U.S. Government. The Environmental Protection Agency’s Research Program with Primary Emphasis on the Community Health and Environmental Surveillance System (CHESS), an Investigative Report; U.S. Government Printing Office: Washington, DC, USA, 1976; Available online: https://www.google.com/books/edition/The_Environmental_Protection_Agency_s_Re/_MhCiLTlSbQC?hl=en&gbpv=0 (accessed on 22 May 2022).
  80. Utah Center for Health Statistics. Utah Health Facts; Utah State Division of Health: Salt Lake City, UT, USA, 1972. Available online: https://digitallibrary.utah.gov/aw-server/rest/product/purl/USL/f/b2f9ab69-027a-4762-8838-52c922954c4d (accessed on 11 May 2020).
  81. Center for Air Environment Studies. Guide to Research in Air Pollution; U.S. EPA, Research Triangle Park: Durham, NC, USA, 1972. Available online: https://nepis.epa.gov/Exe/ZyPURL.cgi?Dockey=20013P97.txt (accessed on 11 May 2020).
  82. Holland, W.W.; Bennett, A.E.; Cameron, I.R.; Florey, C.D.V.; Leeder, S.R.; Schilling, R.S.F.; Swan, A.V.; Waller, R.E. Health effects of particulate pollution: Reappraising the evidence. Am. J. Epidemiol. 1979, 110, 527. [Google Scholar] [CrossRef]
  83. Sullivan, J.L. The Calibration of Smoke Density. J. Air Pollut. Control Assoc. 1962, 12, 474–478. [Google Scholar] [CrossRef]
  84. Kirchstetter, T.W.; Preble, C.V.; Hadley, O.L.; Bond, T.C.; Apte, J.S. Large reductions in urban black carbon concentrations in the United States between 1965 and 2000. Atmos. Environ. 2017, 151, 17–23. [Google Scholar] [CrossRef] [Green Version]
  85. Kirchstetter, T.W.; Aguiar, J.; Tonse, S.; Fairley, D.; Novakov, T. Black carbon concentrations and diesel vehicle emission factors derived from coefficient of haze measurements in California: 1967–2003. Atmos. Environ. 2008, 42, 480–491. [Google Scholar] [CrossRef] [Green Version]
  86. Shy, C.M. Epidemiologic evidence and the United States air quality standards. Am. J. Epidemiol. 1979, 110, 661–671. [Google Scholar] [CrossRef] [PubMed]
  87. Ware, J.H.; Thibodeau, L.A.; Speizer, F.E.; Colome, S.; Ferris, B.G. Assessment of the health effects of atmospheric sulfur oxides and particulate matter: Evidence from observational studies. Environ. Health Perspect. 1981, 41, 255–276. [Google Scholar] [CrossRef] [PubMed]
  88. Hinton, D.; Sune, J.; Suggs, J.; Barnard, W. lnhalable Particulate Network Report: Operation and Data Summary (Mass Concentrations Only); U.S. EPA: Research Triangle Park, NC, USA, 1985. Available online: https://nepis.epa.gov/Exe/ZyPURL.cgi?Dockey=500024O4.txt (accessed on 6 June 2020).
  89. Miller, F.J.; Gardner, D.E.; Graham, J.A.; Lee, R.E.; Wilson, W.E.; Bachmann, J.D. Size Considerations for Establishing a Standard for Inhalable Particles. J. Air Pollut. Control Assoc. 1979, 29, 610–615. [Google Scholar] [CrossRef]
  90. Hinton, D.; Sune, J.; Suggs, J.; Barnard, W. lnhalable Particulate Network Report: Data Listing (Mass Concentrations Only) Vol II April 1979-December 1982; U.S. EPA: Research Triangle Park, NC, USA, 1984. Available online: https://nepis.epa.gov/Exe/ZyPURL.cgi?Dockey=20015OZX.txt (accessed on 17 September 2020).
  91. Dockery, D.W. Health Effects of Particulate Air Pollution. Ann. Epidemiol. 2009, 19, 257–263. [Google Scholar] [CrossRef] [PubMed] [Green Version]
  92. Smart, M.D. Clearing the Air. Y Magazine. Spring. 2007. Available online: https://magazine.byu.edu/article/clearing-the-air/ (accessed on 11 November 2021).
  93. Air Quality Plan Opposed in Part. Provo Daily Herald . 14 September 1972. Available online: https://newspapers.lib.utah.edu/details?id=23795843 (accessed on 29 May 2022).
  94. Christian, P. U.S. Steel Wins OK for Pollution, Cash-Saving Idea. The Daily Herald. 23 August 1982. Available online: https://newspapers.lib.utah.edu/details?id=23901151 (accessed on 29 May 2022).
  95. Pope, C.A. Respiratory disease associated with community air pollution and a steel mill, Utah Valley. Am. J. Public Health 1989, 79, 623–628. [Google Scholar] [CrossRef] [Green Version]
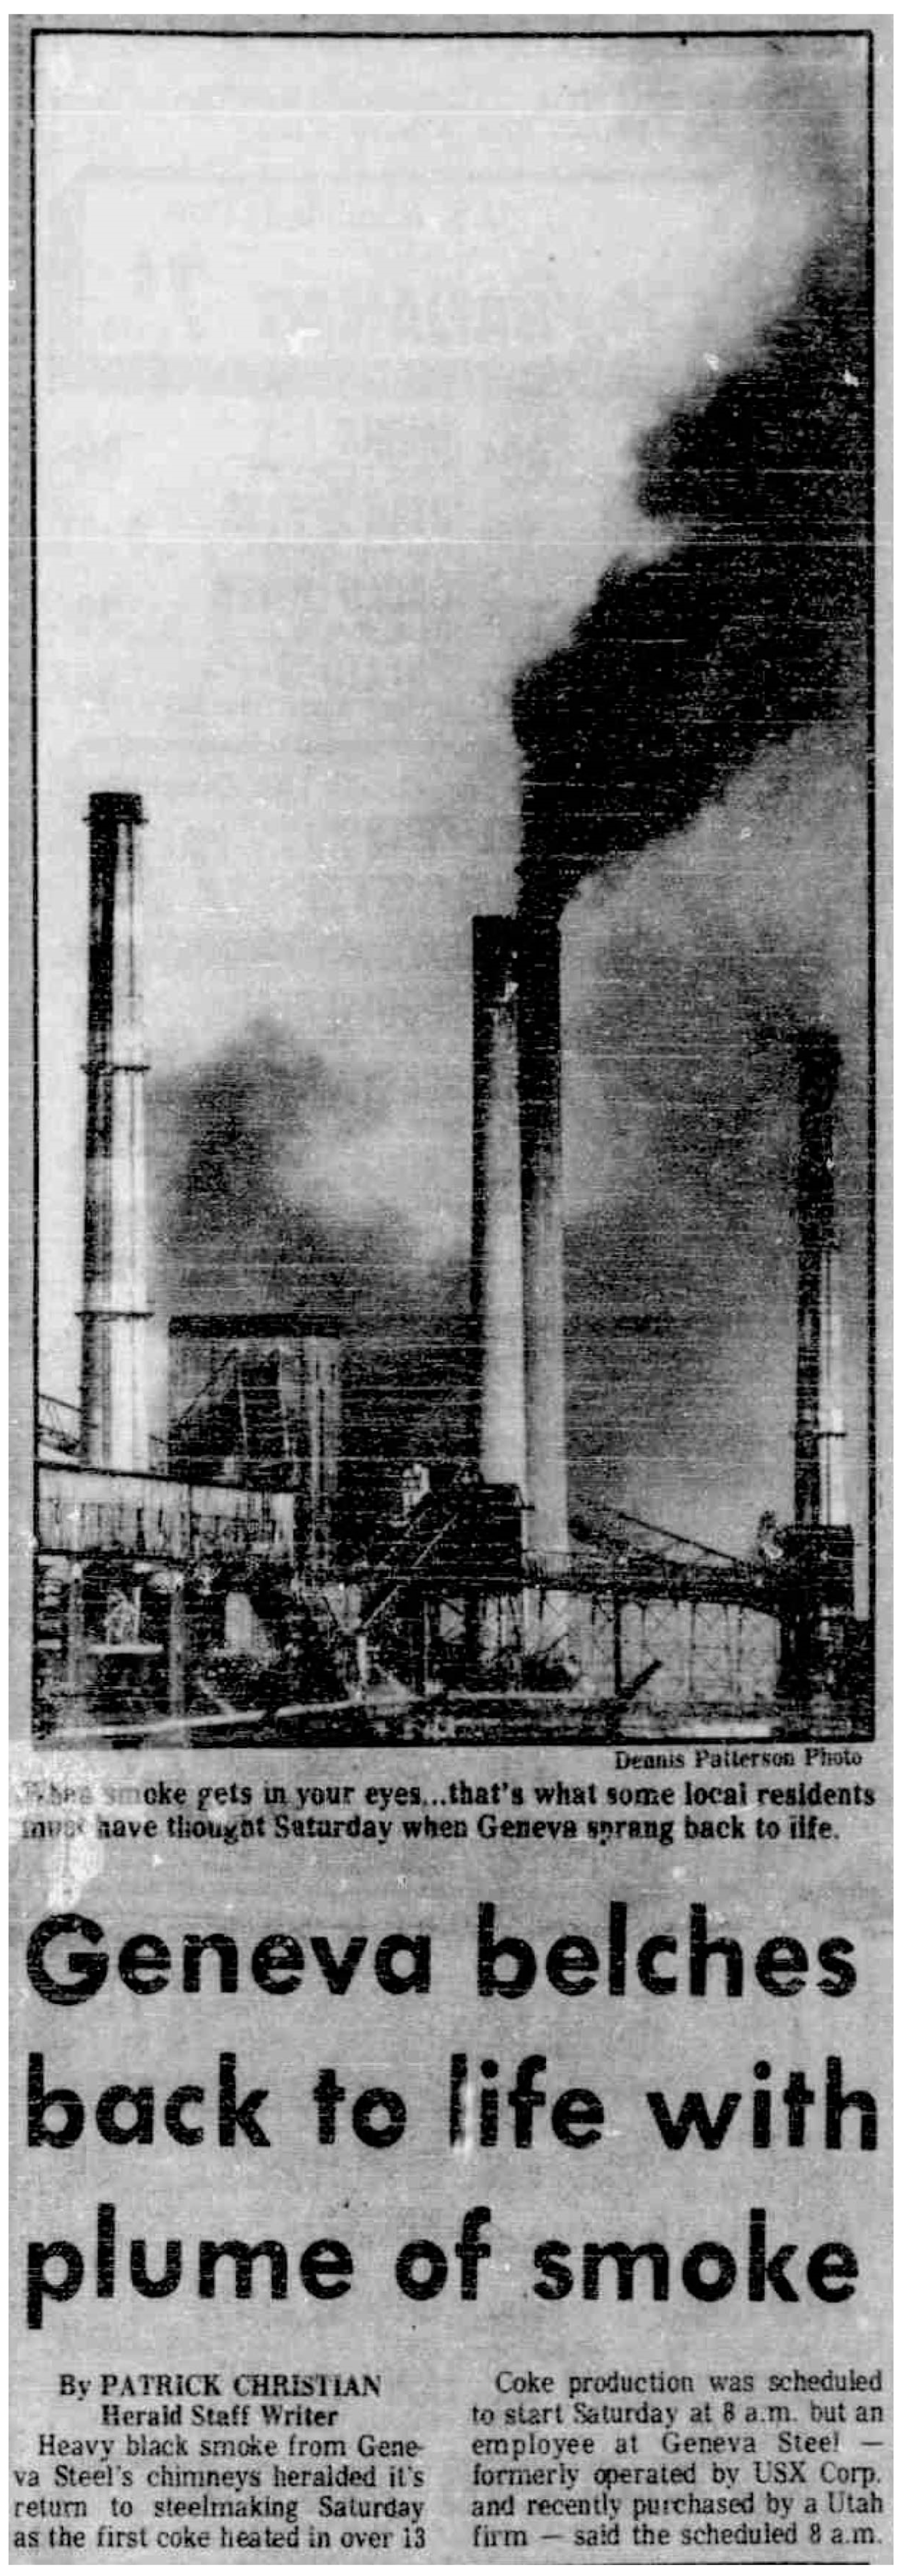
  96. Geneva Belches Back to Life with Plume of Smoke. Provo Daily Herald. 13 September 1987. Available online: https://newspapers.lib.utah.edu/details?id=24048164 (accessed on 19 July 2022).
  97. Feedback: Pollution in Air Is Bread on the Table. Provo Daily Herald. 10 February 1988. Available online: https://newspapers.lib.utah.edu/details?id=24064701 (accessed on 21 May 2022).
  98. Feedback: Geneva Pollution Takes Its Toll. Provo Daily Herald. 6 March 1988. Available online: https://newspapers.lib.utah.edu/details?id=24063610 (accessed on 21 May 2022).
  99. Evans, M. Dirty Air Angers Residents. Provo Daily Herald. 25 February 1988. Available online: https://newspapers.lib.utah.edu/details?id=24065124 (accessed on 21 May 2022).
  100. Pope, C.A. Respiratory Hospital Admissions Associated with PM10 Pollution in Utah, Salt Lake, and Cache Valleys. Arch. Environ. Health Int. J. 1991, 46, 90–97. [Google Scholar] [CrossRef]
  101. Dockery, D.W.; Pope, C.A.; Xu, X.; Spengler, J.D.; Ware, J.H.; Fay, M.E.; Ferris, B.G.; Speizer, F.E. An Association between Air Pollution and Mortality in Six U.S. Cities. N. Engl. J. Med. 1993, 329, 1753–1759. [Google Scholar] [CrossRef] [Green Version]
  102. Pope, C.A.; Thun, M.J.; Namboodiri, M.M.; Dockery, D.W.; Evans, J.S.; Speizer, F.E.; Heath, C.W. Particulate Air Pollution as a Predictor of Mortality in a Prospective Study of U.S. Adults. Am. J. Respir. Crit. Care Med. 1995, 151, 669–674. [Google Scholar] [CrossRef]
  103. Zell, H.; Quarcoo, D.; Scutaru, C.; Vitzthum, K.; Uibel, S.; Schöffel, N.; Mache, S.; Groneberg, D.A.; Spallek, M.F. Air pollution research: Visualization of research activity using density-equalizing mapping and scientometric benchmarking procedures. J. Occup. Med. Toxicol. Lond. Engl. 2010, 5, 5. [Google Scholar] [CrossRef] [Green Version]
  104. Oreskes, N.; Conway, E.M. Merchants of Doubt: How a Handful of Scientists Obscured the Truth on Issues from Tobacco Smoke to Global Warming, 1st ed.; Bloomsbury Press: New York, NY, USA, 2010; ISBN 978-1-59691-610-4. [Google Scholar]
  105. Supran, G.; Oreskes, N. Assessing ExxonMobil’s climate change communications (1977–2014). Environ. Res. Lett. 2017, 12, 084019. [Google Scholar] [CrossRef] [Green Version]
  106. Kaiser, J. Showdown Over Clean Air Science. Science 1997, 277, 466–469. [Google Scholar] [CrossRef] [PubMed] [Green Version]
  107. Morrey, S. Geneva to Counter Study by Pope. Provo Daily Herald. 30 August 1989. Available online: https://newspapers.lib.utah.edu/details?id=24081733 (accessed on 16 November 2021).
  108. Adams, B. Illness Blamed on Virus, Not Pollution: Doctor Hired by Geneva to Analyze Data Disputes Findings of BYU Professor. Deseret News. 2 September 1989. Available online: https://www.deseret.com/1989/9/2/18822398/illnesses-blamed-on-virus-not-pollution-br-doctor-hired-by-geneva-to-analyze-data-disputes-findings (accessed on 16 November 2021).
  109. Morrey, S. Expert: Virus, Not Pollution, Causes Illness. Provo Daily Herald. 1 September 1989. Available online: https://newspapers.lib.utah.edu/details?id=24081819 (accessed on 16 November 2021).
  110. Lamm, S.H.; Hall, T.A.; Engel, A.; Rueter, F.H.; White, L.D. PM10 Particulates: Are They the Major Determinant of Pediatric Respiratory Admissions in Utah County, Utah (1985–1989). Ann. Occup. Hyg. 1994, 38, 969–972. [Google Scholar] [CrossRef]
  111. Archer, V.E. Air Pollution and Fatal Lung Disease in Three Utah Counties. Arch. Environ. Health Int. J. 1990, 45, 325–334. [Google Scholar] [CrossRef] [PubMed]
  112. Pope, C.A.; Schwartz, J.; Ransom, M.R. Daily Mortality and PM10 Pollution in Utah Valley. Arch. Environ. Health Int. J. 1992, 47, 211–217. [Google Scholar] [CrossRef] [PubMed]
  113. Pope, C.A. Particulate pollution and health: A review of the Utah valley experience. J. Expo. Anal. Environ. Epidemiol. 1996, 6, 23–34. [Google Scholar] [CrossRef] [PubMed]
  114. Pope, C.A.; Dockery, D.W.; Spengler, J.D.; Raizenne, M.E. Respiratory Health and PM10 Pollution: A Daily Time Series Analysis. Am. Rev. Respir. Dis. 1991, 144, 668–674. [Google Scholar] [CrossRef] [PubMed]
  115. Pope, C.A.; Dockery, D.W. Acute Health Effects of PM10 Pollution on Symptomatic and Asymptomatic Children. Am. Rev. Respir. Dis. 1992, 145, 1123–1128. [Google Scholar] [CrossRef] [PubMed]
  116. Pope, C.A.; Kanner, R.E. Acute Effects of PM10 Pollution on Pulmonary Function of Smokers with Mild to Moderate Chronic Obstructive Pulmonary Disease. Am. Rev. Respir. Dis. 1993, 147, 1336–1340. [Google Scholar] [CrossRef]
  117. Ransom, M.R.; Pope, C.A. Elementary school absences and PM10 pollution in Utah Valley. Environ. Res. 1992, 58, 204–219. [Google Scholar] [CrossRef]
  118. Hicken, R. Geneva Officials Challenge PM10 Study’s Results. Provo Daily Herald. 30 March 1991. Available online: https://newspapers.lib.utah.edu/details?id=24117199 (accessed on 16 November 2021).
  119. Meyers, D. Blame It on Bugs, Not Air, Group says. Provo Daily Herald. 29 May 1997. Available online: https://newspapers.lib.utah.edu/details?id=24241709 (accessed on 16 November 2021).
  120. Governor’s Clean Air Commission. Summary of Recommendations; All Five Work Group Reports; Governor’s Clean Air Commission: Salt Lake City, UT, USA, 1990. Available online: https://digitallibrary.utah.gov/awweb/guest.jsp?smd=1&cl=all_lib&lb_document_id=62223 (accessed on 28 April 2020).
  121. Governor’s Clean Air Commission. Final Report; Governor’s Clean Air Commission: Salt Lake City, UT, USA, 1991. Available online: https://digitallibrary.utah.gov/awweb/guest.jsp?smd=1&cl=all_lib&lb_document_id=62036 (accessed on 28 April 2020).
  122. Zimmerman, J.; Governor Urges Environmental Health Department. Provo Daily Herald . 12 January 1990. Available online: https://newspapers.lib.utah.edu/details?id=24086483 (accessed on 19 November 2021).
  123. Edwards, P.M.; Brown, S.S.; Roberts, J.M.; Ahmadov, R.; Banta, R.M.; deGouw, J.A.; Dubé, W.P.; Field, R.A.; Flynn, J.H.; Gilman, J.B.; et al. High winter ozone pollution from carbonyl photolysis in an oil and gas basin. Nature 2014, 514, 351–354. [Google Scholar] [CrossRef]
  124. Schnell, R.C.; Oltmans, S.J.; Neely, R.R.; Endres, M.S.; Molenar, J.V.; White, A.B. Rapid photochemical production of ozone at high concentrations in a rural site during winter. Nat. Geosci. 2009, 2, 120–122. [Google Scholar] [CrossRef]
  125. Utah Division of Air Quality. Utah Area Designation Recommendation for the 2015 8-Hour Ozone National Ambient Air Quality Standard; Utah Division of Air Quality: Salt Lake City, UT, USA, 2016. Available online: https://www.epa.gov/sites/production/files/2016-11/documents/ut-rec-tsd.pdf (accessed on 14 October 2020).
  126. U.S. EPA. Air Quality Designations for the 2006 24-Hour Fine Particle (PM2.5); 40 CFR 81; U.S. EPA: Washington, DC, USA, 2009; pp. 58687–58781. Available online: https://www.federalregister.gov/documents/2009/11/13/E9-25711/air-quality-designations-for-the-2006-24-hour-fine-particle-pm25 (accessed on 25 April 2022).
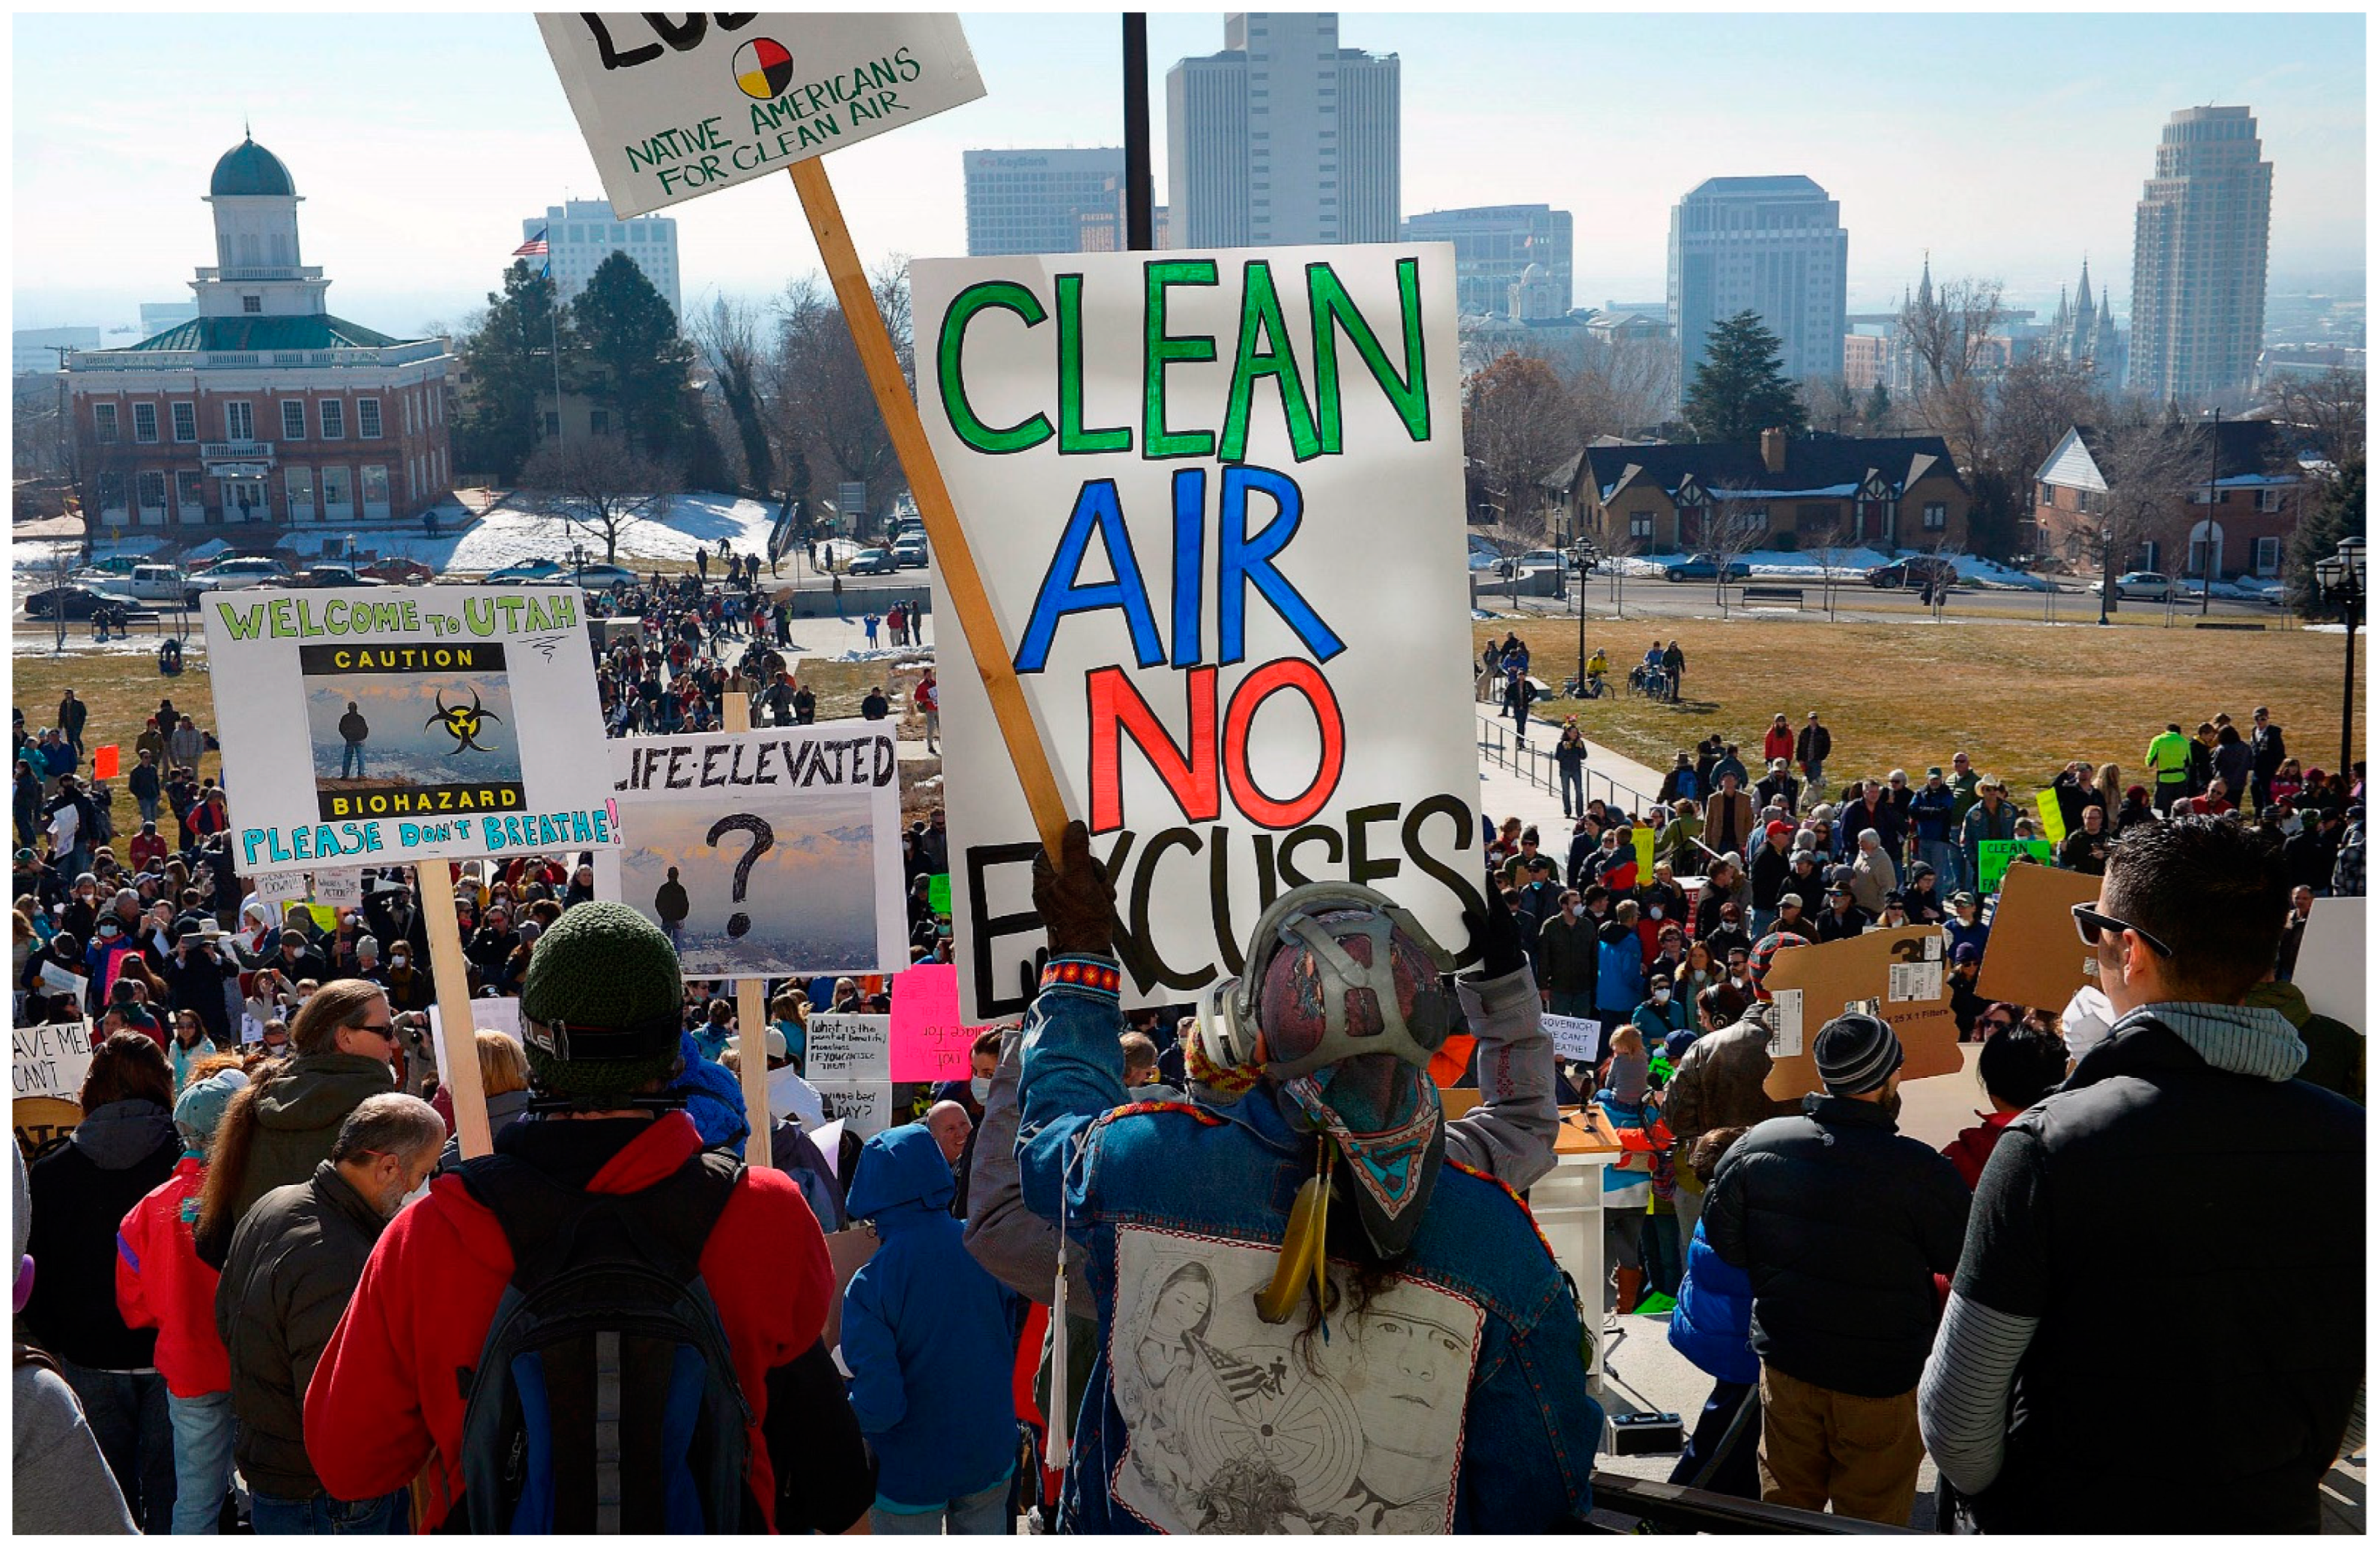
  127. Napier-Pearce, J. Utah Clean Air Rally Draws Thousands to Capitol. The Salt Lake Tribune. 26 January 2014. Available online: https://archive.sltrib.com/article.php?id=57447995&itype=CMSID#:~:text=In%20what%20organizers%20called%20the,gas%20masks%2C%20swarmed%20Capitol%20Hill (accessed on 25 April 2022).
  128. U.S. EPA. Clean Data Determination; Salt Lake City, Utah 2006 Fine Particulate Matter Standards Nonattainment Area; 40 CFR 52; U.S. EPA: Denver, CO, USA, 2019; pp. 26053–26057. Available online: https://www.federalregister.gov/documents/2019/06/05/2019-11702/clean-data-determination-salt-lake-city-utah-2006-fine-particulate-matter-standards-nonattainment (accessed on 25 April 2022).
  129. U.S. EPA. EPA to Reexamine Health Standards for Harmful Soot that Previous Administration Left Unchanged. Available online: https://www.epa.gov/newsreleases/epa-reexamine-health-standards-harmful-soot-previous-administration-left-unchanged (accessed on 25 April 2022).
  130. U.S. EPA. Determinations of Attainment by the Attainment Date, Extensions of the Attainment Date, and Reclassification of Areas Classified as Marginal for the 2015 Ozone National Ambient Air Quality Standards; 40 CFR 52; U.S. EPA: Washington, DC, USA, 2022; pp. 21842–21858. Available online: https://www.federalregister.gov/documents/2022/04/13/2022-07513/determinations-of-attainment-by-the-attainment-date-extensions-of-the-attainment-date-and (accessed on 25 April 2022).
  131. U.S. EPA. Integrated Science Assessment for Ozone and Related Photochemical Oxidants; U.S. EPA: Research Triangle Park, NC, USA, 2020. Available online: https://cfpub.epa.gov/ncea/isa/recordisplay.cfm?deid=348522 (accessed on 25 November 2020).
  132. Langford, A.O.; Alvarez, R.J.; Brioude, J.; Fine, R.; Gustin, M.S.; Lin, M.Y.; Marchbanks, R.D.; Pierce, R.B.; Sandberg, S.P.; Senff, C.J.; et al. Entrainment of stratospheric air and Asian pollution by the convective boundary layer in the southwestern U.S. J. Geophys. Res. Atmos. 2017, 122, 1312–1337. [Google Scholar] [CrossRef]
  133. Zhang, L.; Jacob, D.J.; Downey, N.V.; Wood, D.A.; Blewitt, D.; Carouge, C.C.; van Donkelaar, A.; Jones, D.B.A.; Murray, L.T.; Wang, Y. Improved estimate of the policy-relevant background ozone in the United States using the GEOS-Chem global model with 1/2× 2/3 horizontal resolution over North America. Atmos. Environ. 2011, 45, 6769–6776. [Google Scholar] [CrossRef] [Green Version]
  134. Abatzoglou, J.T.; Williams, A.P. Impact of anthropogenic climate change on wildfire across western US forests. Proc. Natl. Acad. Sci. USA 2016, 113, 11770–11775. [Google Scholar] [CrossRef] [PubMed] [Green Version]
  135. Lin, M.; Horowitz, L.W.; Payton, R.; Fiore, A.M.; Tonnesen, G. US surface ozone trends and extremes from 1980 to 2014: Quantifying the roles of rising Asian emissions, domestic controls, wildfires, and climate. Atmos. Chem. Phys. 2017, 17, 2943–2970. [Google Scholar] [CrossRef] [Green Version]
  136. Blaylock, B.; Horel, J.D.; Crosman, E.T. Impact of Lake Breezes on Summer Ozone Concentrations in the Salt Lake Valley. J. Appl. Meteorol. Climatol. 2016, 56, 353–370. [Google Scholar] [CrossRef]
  137. Horel, J.; Crosman, E.; Jacques, A.; Blaylock, B.; Arens, S.; Long, A.; Sohl, J.; Martin, R. Summer ozone concentrations in the vicinity of the Great Salt Lake. Atmos. Sci. Lett. 2016, 17, 480–486. [Google Scholar] [CrossRef]
  138. USGCRP. Impacts, Risks, and Adaptation in the United States: Fourth National Climate Assessment, Volume II; U.S. Global Change Research Program: Washington, DC, USA, 2018; p. 1515. [Google Scholar]
  139. Abbott, B.W.; Bliss, A.; Barros, L.; Moyer, T.; Moore, F.; Rapp, M.; Gilbert, S.; Bekker, J.; Mitchell, L.; Hill, S.; et al. Clean Electrification of the U.S. Economy; Brigham Young University: Provo, UT, USA, 2021. [Google Scholar] [CrossRef]
  140. Bloch, C.; Newcomb, J.; Shiledar, S.; Tyson, M. Breakthrough Batteries: Powering the Era of Clean Electrification; Rocky Mountain Institute: Basalt, CO, USA, 2019; p. 84. Available online: https://rmi.org/insight/breakthrough-batteries/ (accessed on 7 November 2019).
  141. He, G.; Lin, J.; Sifuentes, F.; Liu, X.; Abhyankar, N.; Phadke, A. Rapid cost decrease of renewables and storage accelerates the decarbonization of China’s power system. Nat. Commun. 2020, 11, 2486. [Google Scholar] [CrossRef]
  142. Lazard. Lazard’s Levelized Cost of Energy Analysis—Version 14.0. 2020, p. 21. Available online: https://www.lazard.com/media/451419/lazards-levelized-cost-of-energy-version-140.pdf (accessed on 21 October 2020).
  143. Wilson, C.; Grubler, A.; Bento, N.; Healey, S.; Stercke, S.D.; Zimm, C. Granular technologies to accelerate decarbonization. Science 2020, 368, 36–39. [Google Scholar] [CrossRef] [Green Version]
  144. Edwards, R.; Weiler, T. Concurrent Resolution on Environmental and Economic Stewardship. 2018. Available online: https://le.utah.gov/~2018/bills/static/HCR007.html (accessed on 20 October 2020).
  145. Kem, C. Gardner Policy Institute. The Utah Roadmap: Positive Solutions on Climate and Air Quality; Kem C. Gardner Policy Institute: Salt Lake City, UT, USA, 2020; Available online: https://gardner.utah.edu/utahroadmap/ (accessed on 8 June 2020).
  146. Utah Climate & Clean Air Compact. Available online: https://climateandcleanaircompact.org/ (accessed on 20 October 2020).
Figure 1. Map of the Wasatch Front and major Utah population centers. Note. The mountainous topography surrounding metropolitan areas exacerbates air quality challenges.
Sustainability 14 09653 g001
Figure 2. Energy consumption in the United States (top) and in Utah (bottom) by fuel type [22,23]. Utah energy consumption data are only available after 1960.
Sustainability 14 09653 g002
Figure 3. Anti-farmer sentiment related to suit of smelting operations depicted in this cartoon, Salt Lake Telegram, 28 December 1906, digitalnewspapers.org [35].
Sustainability 14 09653 g003
Figure 4. Photo of G. St. John Perrot and the sampling flasks used in the first aircraft sampling campaign to study SLC’s air pollution, Salt Lake Tribune, 10 November 1919, digitalnewspapers.org [50].
Sustainability 14 09653 g004
Figure 5. Natural gas advertisement, Salt Lake Tribune, 24 October 1930, digitalnewspapers.org [58].
Sustainability 14 09653 g005
Figure 6. “Today’s Smoke” column, Salt Lake Telegram, 7 March 1941, digitalnewspapers.org [60] (left) and the present-day equivalent (right).
Sustainability 14 09653 g006
Figure 7. Smoke density from Ringelmann smoke charts collected by the Salt Lake City Smoke Abatement Division, Salt Lake Telegram, 1 March 1941, digitalnewspapers.org [61].
Sustainability 14 09653 g007
Figure 8. Five-year average of the number of hours with visibility three miles or less at the Salt Lake Airport in winter (November–February), which was used as a proxy for air pollution [53].
Sustainability 14 09653 g008
Figure 9. Editorial discussing how electric vehicles could improve air quality along the Wasatch Front, Davis County Clipper, 18 November 1966, digitalnewspapers.org [76].
Sustainability 14 09653 g009
Figure 10. The first measurements of fine particulate matter (PM2.5) in Utah in the Inhalable Particulate Network (IPN) [90]. Measurements are 24 h averages made every sixth day. Dashed line indicates the current 24 h PM2.5 National Ambient Air Quality Standard.
Sustainability 14 09653 g010
Figure 11. Restarting the Geneva steel mill after a 13-month closure due to a labor strike caused an increase in pollution, Provo Daily Herald, 13 September 1987, digitalnewspapers.org. Note: Reprinted with permission from [96]. 1987, Ryan Christner.
Sustainability 14 09653 g011
Figure 12. Protesters at the Utah State Capitol in 2014 demanding government action to address poor air quality. Note: Reprinted with permission from [126]. 2014, Scott Sommerdorf.
Sustainability 14 09653 g012
Table 1. Performance on federal air quality standards in Utah, 1970 [80].
PollutantAvg. TimeNAAQS of 1970No. of Exceedances in 1970
TSP 124 h Primary260 μg m−35
TSP 124 h Secondary150 μg m−332
SO224 h Primary140 ppb11
SO224 h Secondary100 ppb32
SO23 h500 ppb36
CO8 h9 ppm641
CO1 h35 ppm2
Oxidants 21 h80 ppb42
NOx 3Annual50 ppb1
1 TSP = total suspended particles, 2 oxidants primarily refer to ozone, 3 NOx = nitrogen oxides (NO + NO2).
Publisher’s Note: MDPI stays neutral with regard to jurisdictional claims in published maps and institutional affiliations.

