Article

The Characteristics of Soil Ca and Mg Leakage in a Karst Depression

1
School of Karst Science, Guizhou Normal University/State Engineering Technology Institute for Karst Desertification Control, Guiyang 550001, China
2
School of Tourism and Resources Environment, Qiannan Normal University for Nationalities, Duyun 558000, China
Sustainability 2022, 14(15), 9627; https://doi.org/10.3390/su14159627
Submission received: 28 May 2022 / Revised: 1 July 2022 / Accepted: 8 July 2022 / Published: 5 August 2022

Abstract

:
The soil leakage characteristics of depressions in karst areas should be explored by investigating their soil Ca and Mg contents. As a starting point, in a karst landform typical of Guizhou Huajiang dry valley karst watersheds, we selected surface depression and performed a field investigation, soil profile excavation, and soil sample collection. The soil samples were pretreated and taken to the laboratory for soil physical and chemical analysis. The data were processed, and the Ca and Mg contents of the soils were analyzed to determine the spatial variation characteristics of soil leakage in the depression. We found that in the depression watershed, the Ca and Mg contents in the 0–30 cm soil profile generally increased with increasing soil depth, and the Ca and Mg contents in the 30–150 cm soil profile exhibited more variability with increasing soil depth. The Ca and Mg in the soil surface profiles from the top of the slope, middle of the slope, base of the slope, bottom of the depression, and sinkhole showed obvious characteristics of a sedimentary soil leakage migration path. In combination with analyses of the soil K and N contents, the soil Ca and Mg contents can be used as an index of the likelihood of soil and water leakage in karst depressions.

1. Introduction

Depressions are important geomorphic types during the development of karst landforms. The combination of a fengcong-depression or a fenglin-depression is often formed between depressions and fengcong (peak cluster) or fenglin (peak forest) landforms [1,2,3]. The study of these karst ecosystems focuses on geomorphic development and evolution, hydrological processes, water and soil leakage, soil and water conservation, the fragile ecological environment, ecological restoration, crop cultivation, human habitation and development, and other important processes [4]. Due to the unique dual spatial structure of karst areas [5], the soil erosion that occurs in these areas is made up of both surface soil and water loss and underground soil and water leakage. As an important link in the development of karst landforms, depressions are not only the source of and pathway for these losses but are also deposition area for soil and other materials. Depressions usually accurately represent the surface watershed boundaries and clearly define the entire watershed area, thus facilitating determinations of soil and water leakage. The typical combination of fengcong/fenglin depression includes areas of various terrain types, such as slope, flat (bottom), and sinkhole terrain, and, therefore, provide useful land complete field environment conditions for experimental research. Compared with research on the development and evolution of karst landforms, soil erosion, and water and soil conservation, research on basic theories of karst ecosystem development and related technology development is still in a relatively early stage. Compared with the traditional, well-developed research methods for soil erosion [6,7], systematic methods for research on soil and water leakage, such as monitoring methods, monitoring indicators, conservation measures, and evaluation methods, are still lacking. Moreover, the correlation and weighting relationships between the factors affecting soil and water loss are not clear. The monitoring indexes that are currently used in relevant studies of soil and water loss research need further experimental verification and standardization, and their applicability needs to be determined; moreover, there is a serious lack of related research on technology for soil and water loss monitoring and control [8].
Ca and Mg are the main components of limestone and dolomite in karst areas [9]. The aims of this study were to determine the roles that Ca and Mg play in the process of soil and water leakage, the characteristics of the distributions of Ca and Mg components in the soil in karst areas based on limestone, dolomite and transitional rocks in depressions [10,11], and whether differences in the spatial distributions of Ca and Mg can reflect the characteristics of soil and water leakage in depressions in order to promote the quantitative analysis of soil and water leakage in depressions [12,13]. The solutions to these problems can promote the development of soil leakage research, which will be of great significance to the current research on soil leakage in karst areas.

2. Materials and Methods

2.1. Experimental Site

The research area is located in the area of Rongfa Cave and the surface depression in Beipanjiang town, Zhenfeng County, Guizhou Province. Rongfa Cave is a passage that contains several sinkholes. The coordinates of the ground center point of the depression are 25°38′14.1″ N, 105°38′18.44″ E, and the altitude is between 1050 and 1152 m. The area where the depression is located experiences a subtropical humid monsoon climate with an average annual precipitation of approximately 1100 mm. The rainfall occurs mainly from May to October, accounting for 83% of the total annual precipitation. Before sampling, the depression was in the process of transitioning from farmland to forest. The depression and its surrounding areas are currently covered with various types of irrigated areas, grassland vegetation, mosses, and other plants [14,15]. The bedrock in the depression and surrounding areas is mainly dolomitic limestone with high Ca and Mg contents. The soil in the area is mainly Calcareous soil. The average thickness of the slope soil is approximately 30 cm, the average thickness of the bottom soil is approximately 150 cm, and the thickness of the sedimentary soil in the sinkhole varies dramatically, from 0 to 400 cm. The depression is a typical karst plateau fengcong-depression landform. The peaks around the depression are higher in the south and lower in the north, and a main trench flows into the bottom of the depression from southeast to northwest. Secondary grooves along the wings of the depression flow into the bottom of the depression along the northeast and southwest sides, respectively (Figure 1). The sinkhole is located at the bottom of the mountain wall in the northern part of the depression. Currently, the sinkhole forms a cave passageway that can be freely entered in the dry season. The passage slopes down from the entrance to the north and extends more than 100 m underground. Several depressions of different sizes are located around the sinkhole and form an interrelated fengcong-depressions system with the studied depression.

2.2. Methods

2.2.1. Soil Sampling

To ensure the uniformity of the soil texture and the stability of the elemental content, sampling was conducted during periods when there had been no rain at the study site for more than half a month. The actual soil sampling was completed in early November 2018. For the sampling methods, refer to GB/T 36197-2018 Soil Quality Soil Sampling Technical Guide [16]. Sampling was conducted in three areas at different locations within the depression: on the slope of the depression, at the bottom of the depression, and in the sinkhole. At each part of the slope surface, three sampling points were established. The intervals between the points were 10 m along the longitudinal slope surface. Sampling at each point was repeated three times. One sampling point was selected at the bottom of the depression due to the small size of the area, and the sampling was repeated three times. Sampling was also conducted at three sites in the sinkhole, namely, the entrance, the middle of the cave and the bottom of the cave. One sampling point was established at each sinkhole sampling site. Due to the limited width of the cave passage and the unequal distribution of the sedimentary soil in the cave, repeated sampling was not performed in the sinkhole (Table 1). The soil sampling depth on the slope of the depression varied due to the shallow surface soil depth and high rock exposure rate in the karst area [17]. The depth of the excavated soil profile at each point was 30 cm, and samples were taken at intervals of 5 cm. At the bottom of the depression, the ground is relatively flat and the sedimentary soil is relatively thick; therefore, the soil profile was excavated to a depth of 150 cm when sampling. Samples were taken at intervals of 5 cm in the 0–40 cm profile and intervals of 10 cm in the 40–150 cm profile. The profile depth for the sinkhole was 30 cm at each point because there is relatively little sedimentary soil at the entrance and middle of the cave. Samples were taken at intervals 5 cm. At the bottom of the sinkhole, the soil profile was excavated to a depth of 150 cm due to the thicker sedimentary soil. Samples were taken at intervals of 5 cm from 0–40 cm in the profile and at intervals of 10 cm from 40–150 cm in the profile.

2.2.2. Experimental Method

After the soil samples were collected, they were immediately brought back to the laboratory for drying, grinding, and screening with 100-mesh. The samples were sorted by sample number, digested in batches, and prepared with the testing liquid. The Ca and Mg contents of the samples were determined by flame atomic absorption spectrometry. For more detailed methods, refer to GB11905-89 Water Quality-Determination of Calcium and Magnesium-Atomic Absorption Spectrophotometric Method [18]. Flame atomic absorption spectrometry was performed with a Seymour Fisher Scientific Co., Ltd., Waltham, MA, USA, ICE3000 atomic absorption spectrometer. The contents of K, N, and other related indicators were measured with soil agricultural chemical analysis methods [19]. The N content was determined by the semitrace Kjeldahl method. The K content was determined by NaOH alkali fusion flame photometry. The instrumental measurements were converted into the actual Ca and Mg contents of the soil with the following two formulas:
X = f c
In the formula: X—The Ca or Mg content, in mg/L;
f—The ratio of the constant volume of the test material to the volume of the sample;
c—The Ca or Mg concentration obtained from the standard curve, mg/L.
X 1 = f 1 c 1
In the formula: X1—The Ca or Mg content, in g/kg;
f1—The ratio of the constant mass of the test material to the sample weight;
c1—The value of c from the previous equation in mg/L converted to g/kg.

2.2.3. Statistical Analysis

The statistical analysis and processing of the experimental data were performed in SPSS 22.0, Excel2007, and Origin2018 software. The main experimental data were determined to have a normal distribution (Figure 2). The Pearson method was adopted to analyze the correlations between the different sites and the Ca and Mg contents. The satellite image was derived from Google Map data, and the topographic map and satellite image processing were completed using ArcGIS10.5 software.

3. Results Analysis

3.1. Characteristics of Ca and Mg in the Soil Profile on the Slope and at the Bottom of the Depression

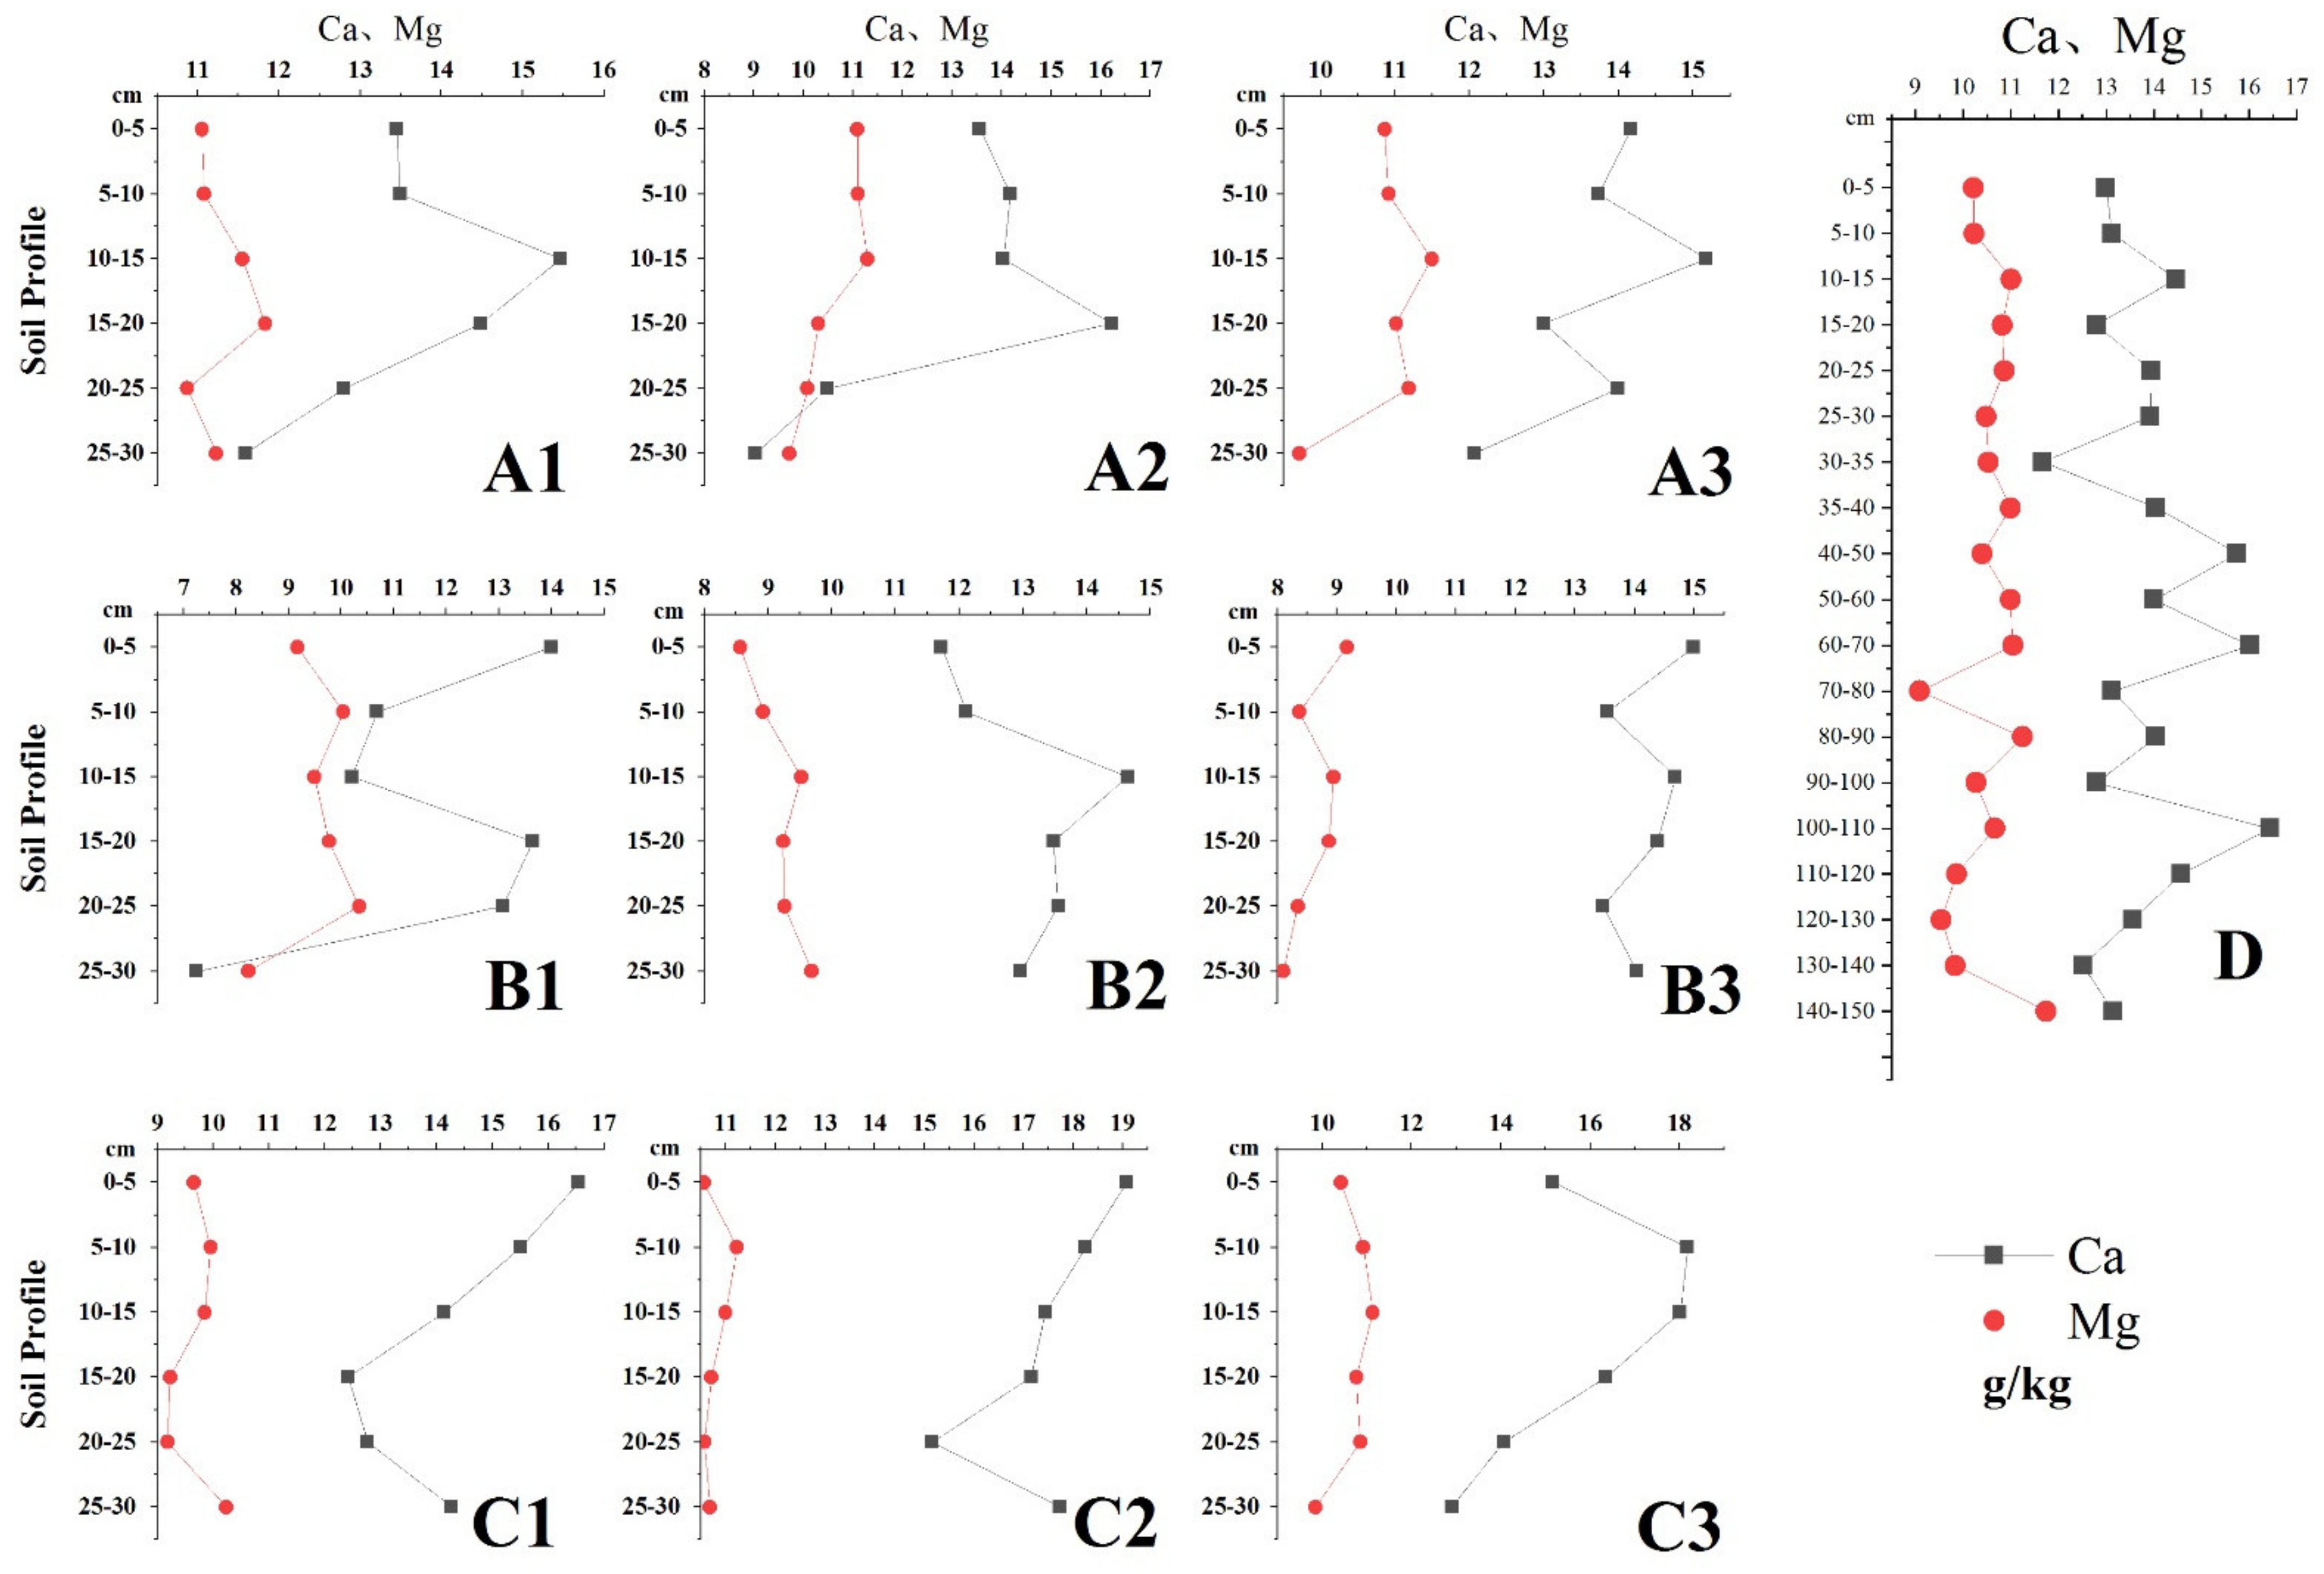
The Ca and Mg contents within each soil profile changed dramatically between 0 and 10 cm depth. The increase in Mg was the greatest change, and the increase and decrease in Ca accounted for half of the total changes. Peak values of the two elements appeared mostly within 10–20 cm depth, except at a few points outside of this range. The Ca and Mg contents at most sampling points decreased with increasing soil depth between 20 and 30 cm (Figure 3). The Ca and Mg contents in the soil at the top, middle, and foot of the slope of the depression were different. In the 0–30 cm soil profile at the top of the slope, the soil Ca and Mg contents first increased and then decreased. In the 0–30 cm soil profile at the middle and bottom of the slope, the soil Ca and Mg contents first increased and then decreased at some points, and first decreased and then increased at other points. The Ca and Mg contents in the soil profile at the 0–30 cm depth at the bottom of the depression fluctuated less than those in the soil profile at the 30–150 cm depth, and the Ca and Mg contents varied increasingly with increasing soil depth. However, the changes in the Ca and Mg contents within the same soil profile showed high consistency in both surface and deep soils.

3.2. Characteristics of Ca and Mg in the Sedimentary Soil Profile of the Sinkhole

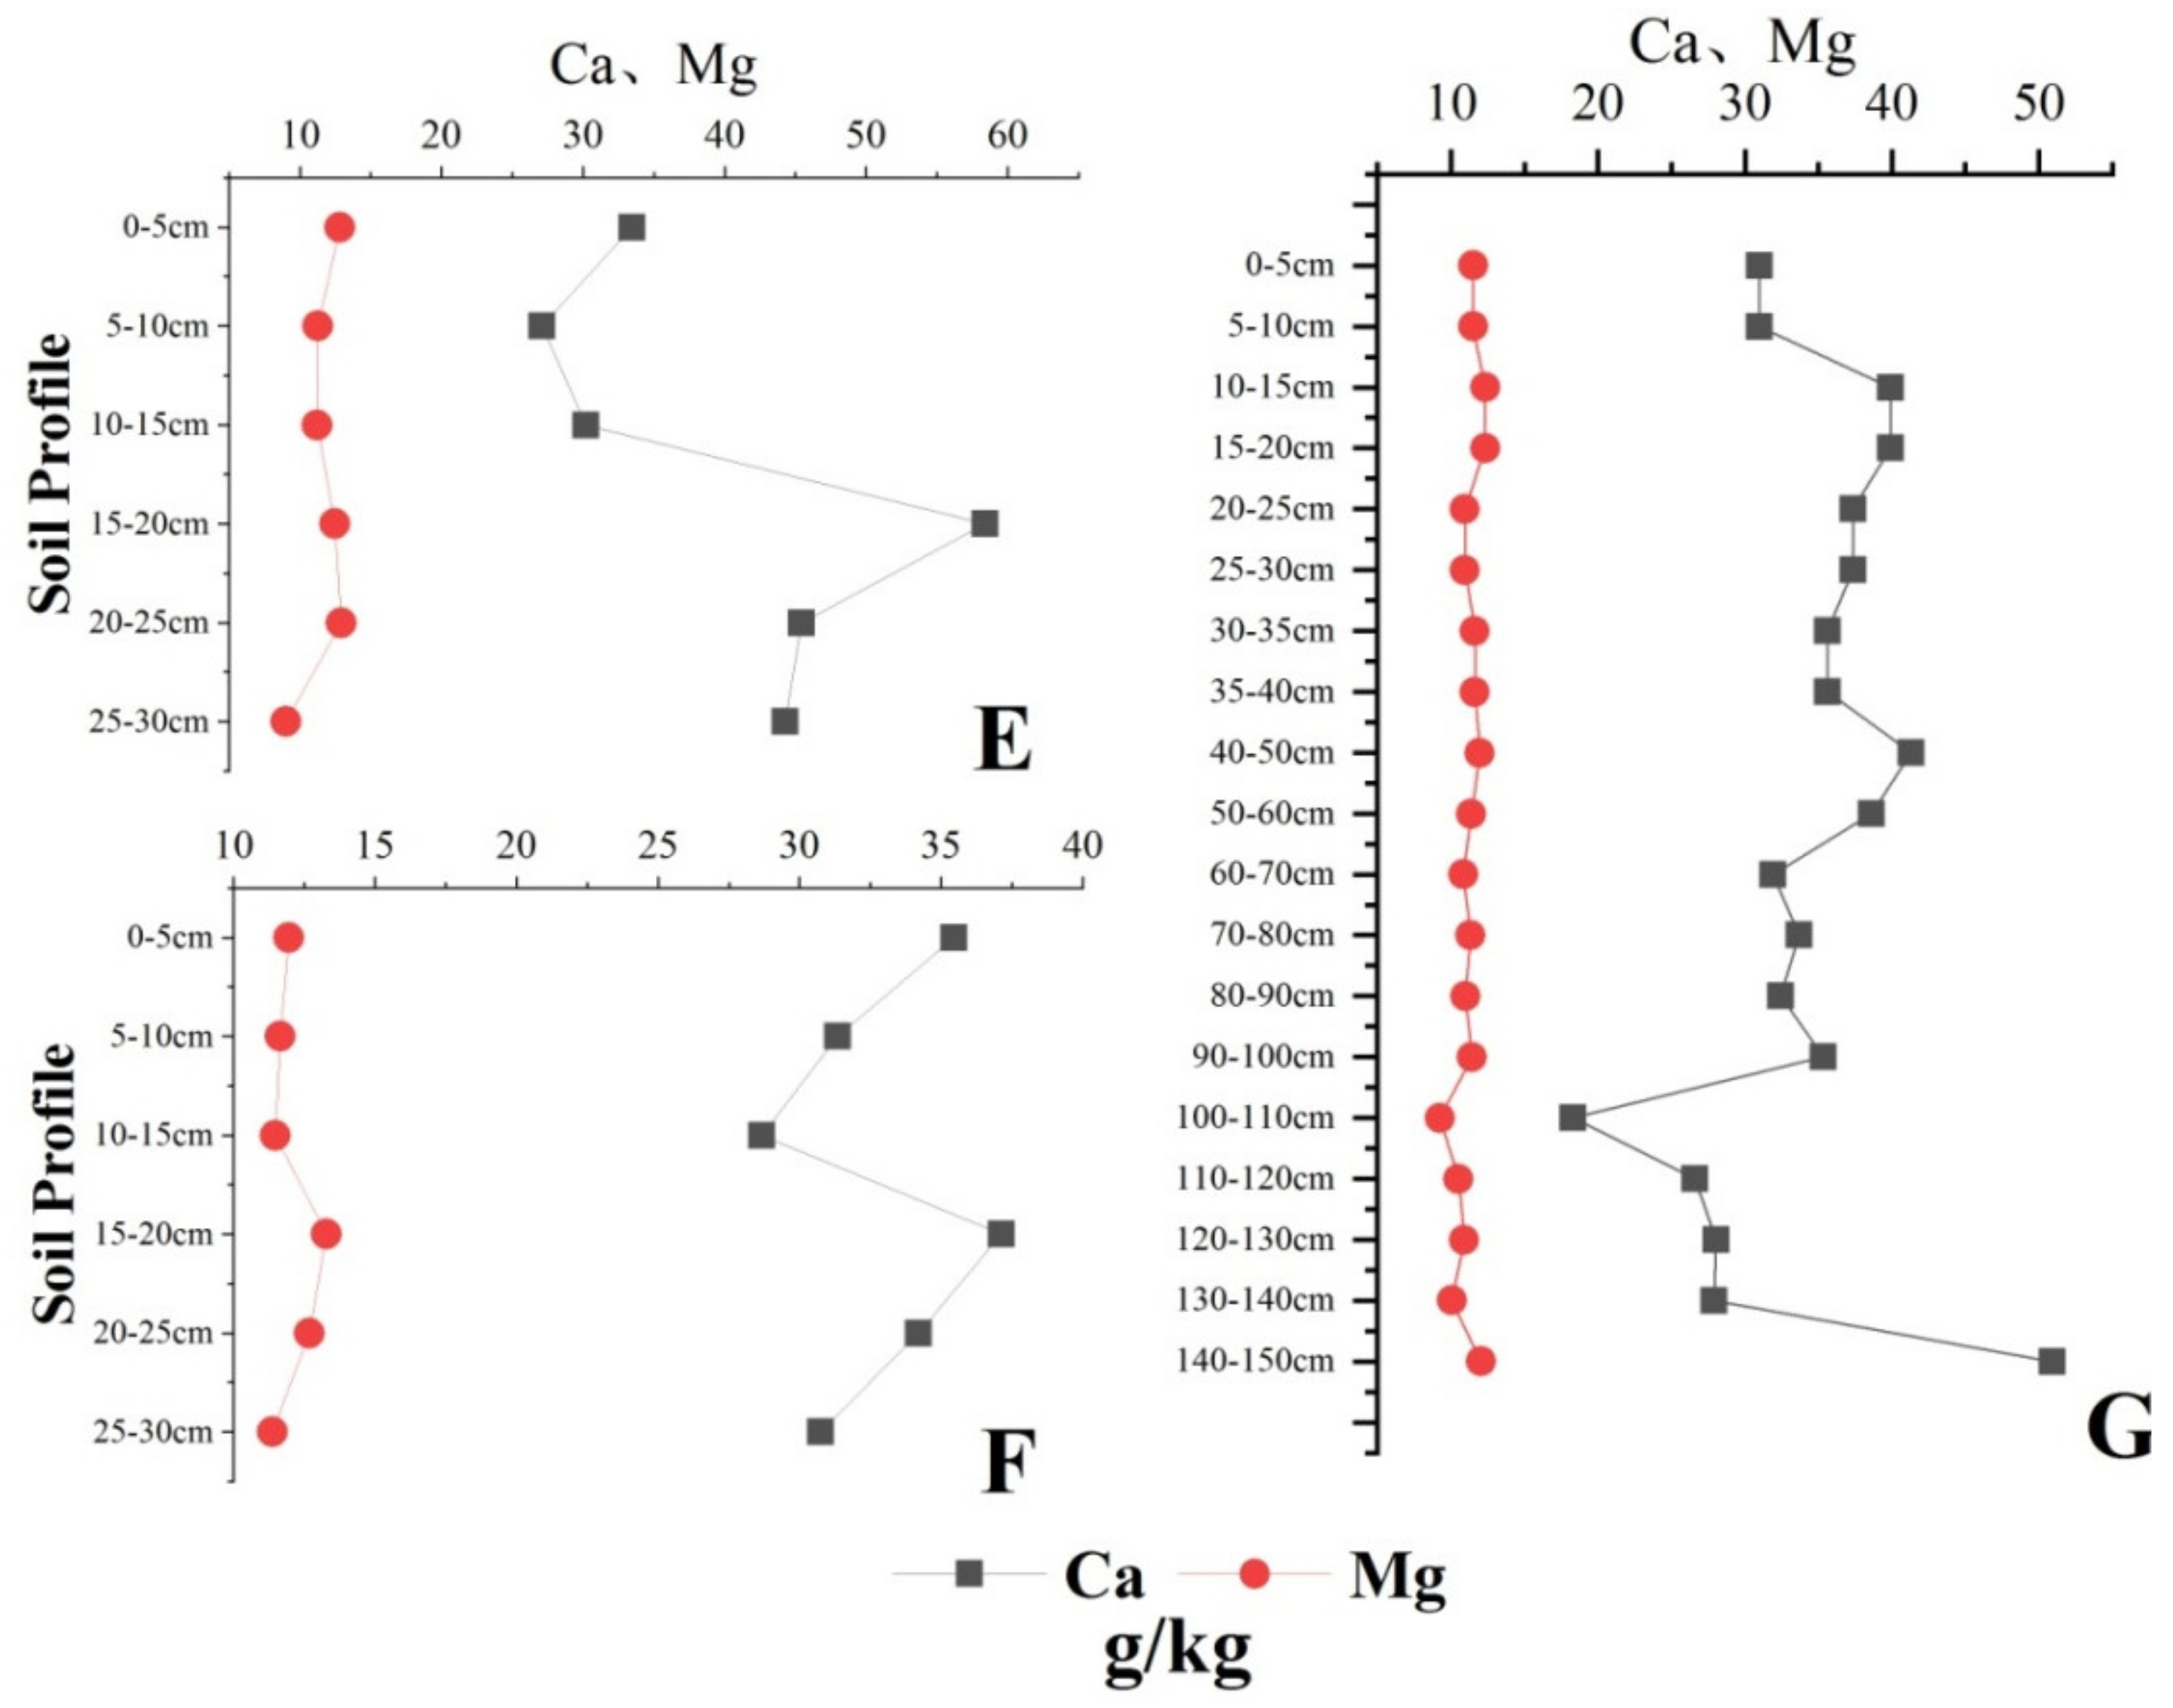
The contents of Ca and Mg in the sedimentary soil of the sinkhole varied greatly among the soil samples from the entrance of the cave, the middle of the cave and the bottom of the cave. Within 0–30 cm depth in each soil profile, the contents of Ca and Mg in the soil in the three regions showed a decreasing–increasing–decreasing change trend with increasing soil depth, and the contents of Ca and Mg in the three regions increased significantly at a depth of 15–20 cm compared with those at other depths. At 30–150 cm, the soil Ca and Mg contents changed irregularly, and there was no obvious increasing or decreasing trend (Figure 4).

3.3. Distribution Characteristics of Ca and Mg Atthe Soil Surface of the Slope, Depression and Sinkhole

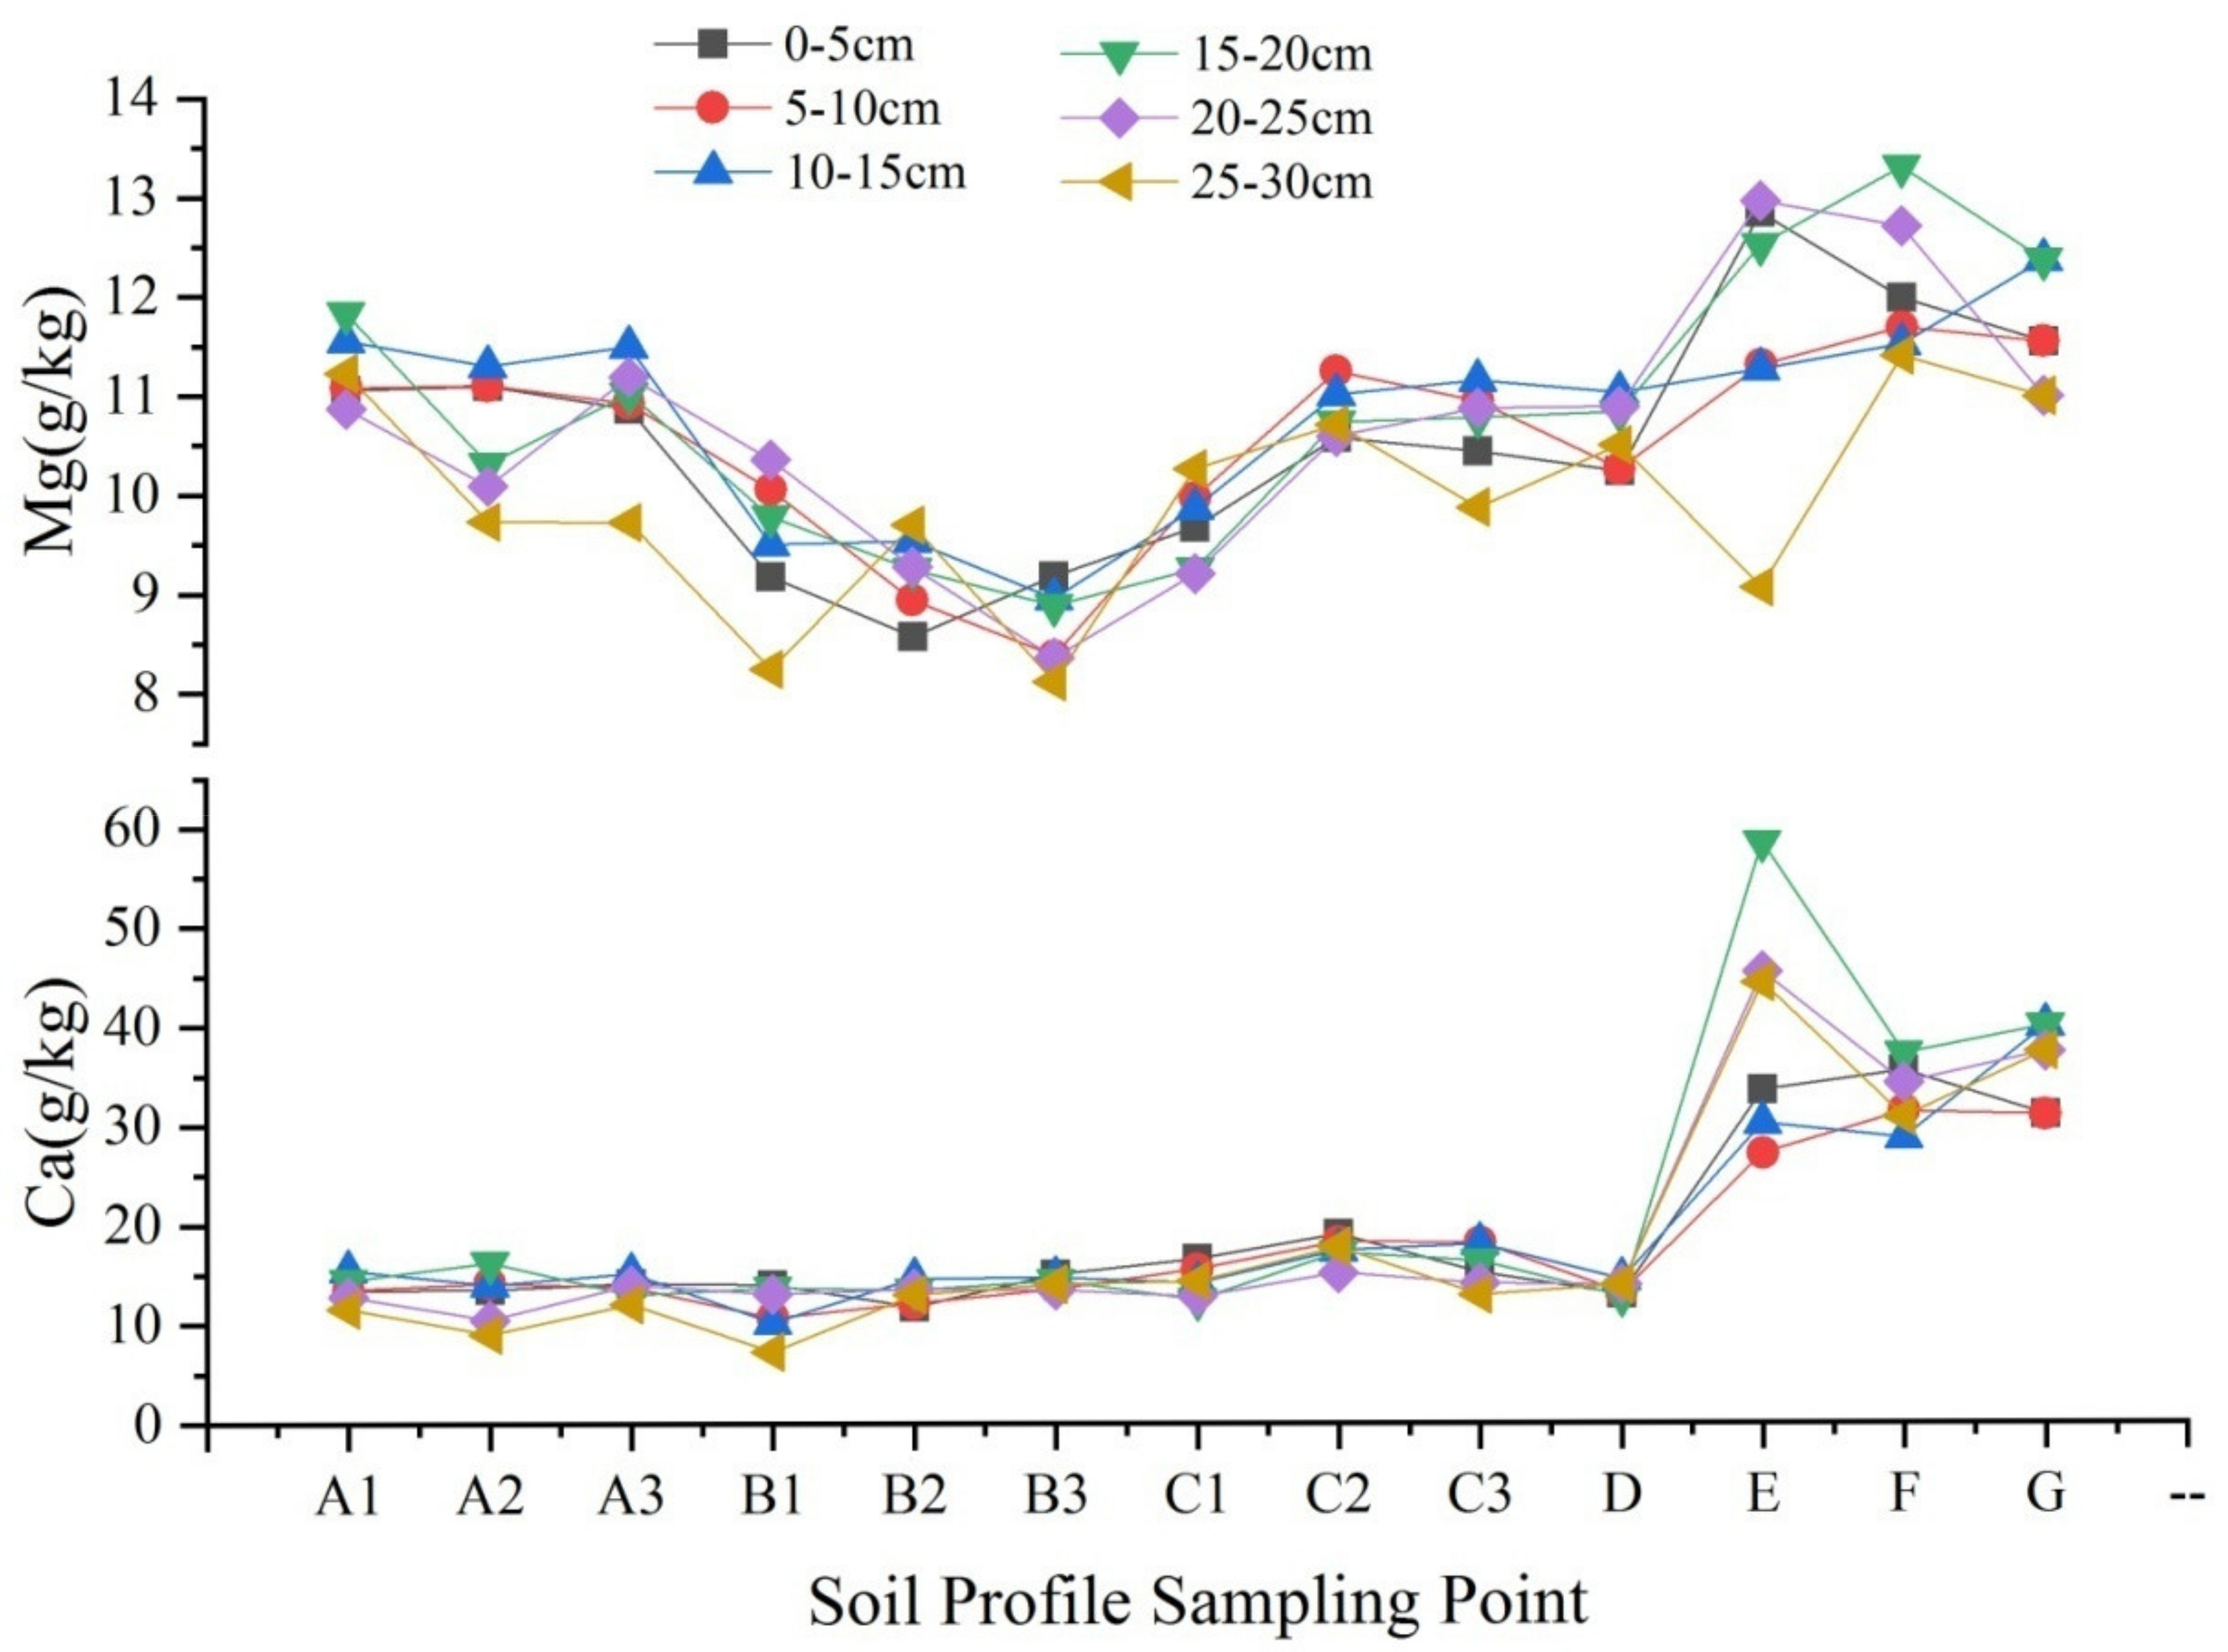
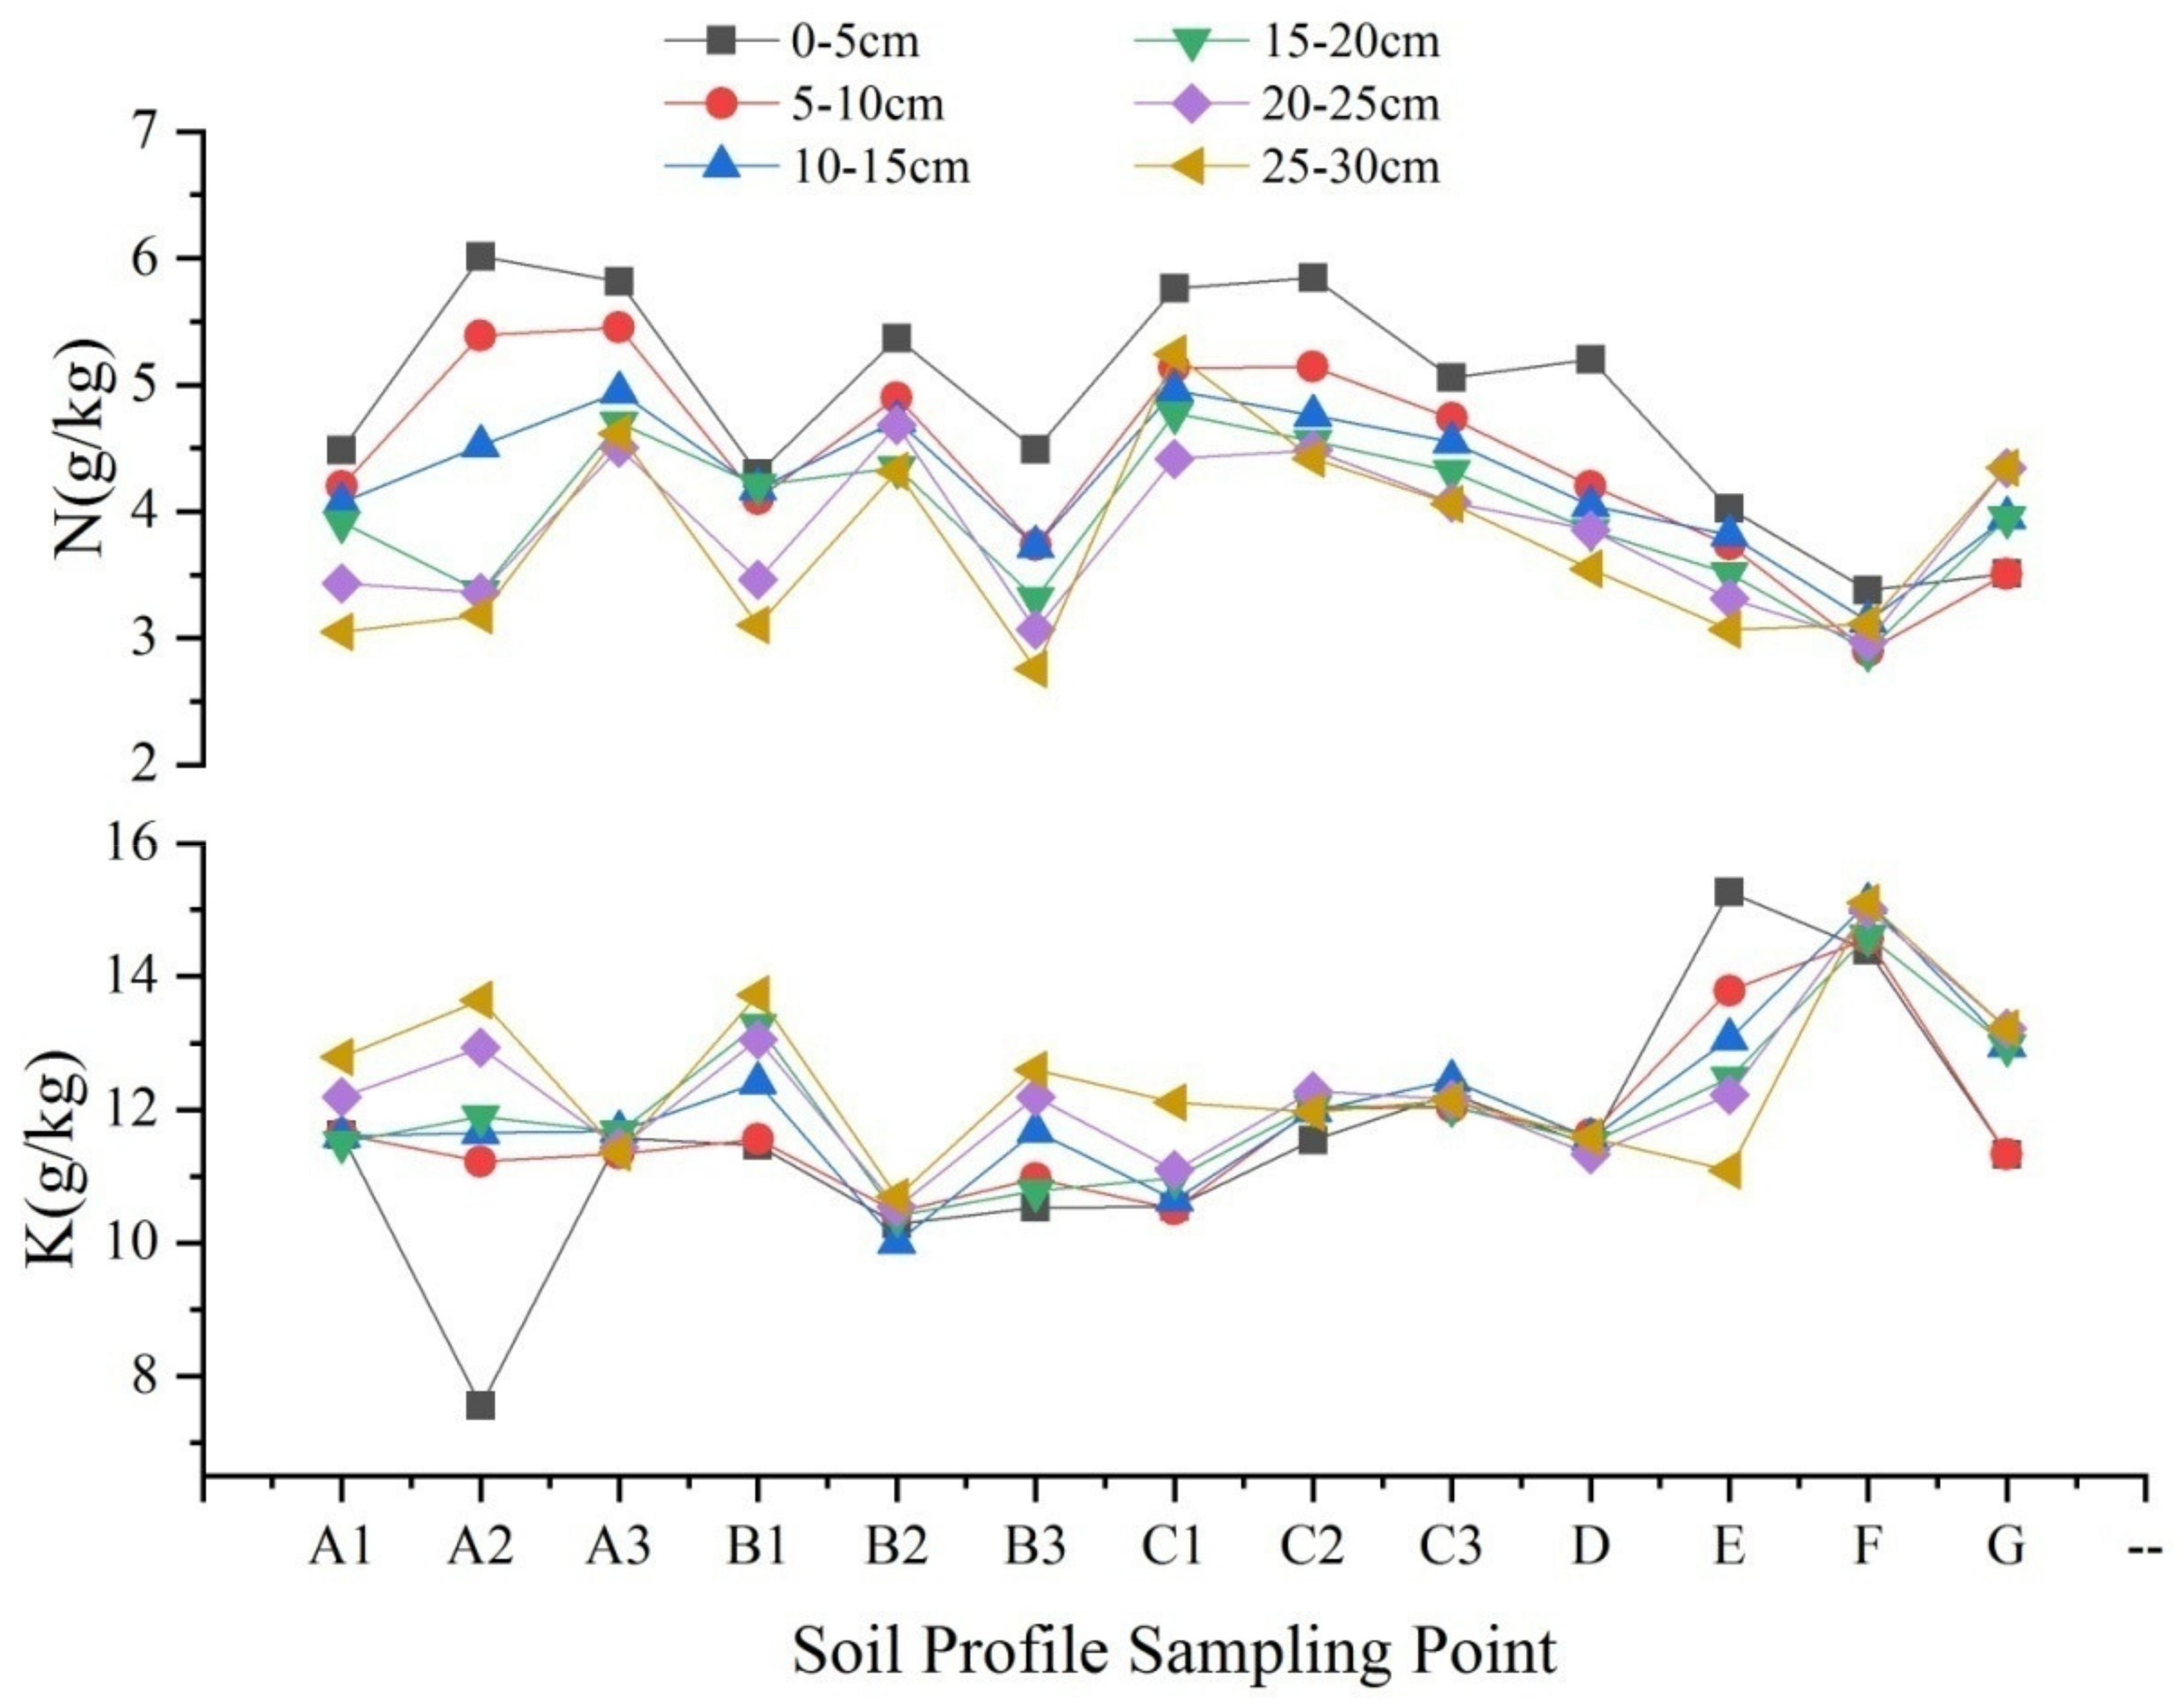
The Ca and Mg contents and distribution in the surface soil at 0–30 cm depth from different locations in and around the depression were analyzed. Ca and Mg were found in all soil profiles throughout the karst depression. The profile from the top of the sinkhole showed an increasing trend in Ca and Mg contents with increasing soil depth. The surface soil profile from the top of the slope has a good linear correlation with that of the sinkhole, showing a gradual decrease with increasing soil depth (Figure 5, Table 2). A relatively obvious peak value of Ca appeared at the cave entrance. The variation in Ca content was relatively low in the top, middle, and foot of the slope and at the bottom of the depression, and the lowest values appeared at the bottom of the depression and at the bottom of the slope. The Mg content showed a “W” pattern, with high–low–high–low–high distributions in the top slope–middle slope–bottom slope–bottom of the depression–sinkhole sampling areas, respectively. The highest value of Mg appeared at the top and in the sinkhole, the second highest value appeared at the foot of the slope, and the lowest values appeared at the middle of the slope and at the bottom of the depression. The correlation between the Ca and Mg contents and the K and N contents in the soil surface profiles at the 0–30 cm depth was significant within the 0–20 cm depth, but not within 20–30 cm depth.

4. Discussion

4.1. The Ca and Mg Contents Showed the Same Change Trend in the Same Soil Profile

The contents of Ca and Mg within the same soil profile in the depression showed relatively consistent increasing or decreasing trends in the 0–30 cm soil depth in the slope, at the bottom of the depression, and in the interior of the sinkhole. Even though the soils at the bottom of the depression and the bottom of the sinkhole were deeper than 30 cm and the amounts of Ca and Mg in the soil were more variable than those in other profiles, the two profiles still exhibited the same trends in Ca and Mg content. Soil formation processes in depression conditions are the same, whether the sedimentary soil profile is influenced by a leakage source or by soil loss after a disturbance. The differences in the sedimentary soil composition as well as the forces driving Ca and Mg loss interact at the same time and cause synchronous changes within the soil profile, such as soil loss and sedimentary soil migration. The Ca and Mg contents on the slope and at the bottom of the depression first increased and then decreased at depths of 0–30 cm. Under the influence of previous tillage activity, the anthropogenic disturbance at depths of 0–15 cm was strong, while the degree of anthropogenic disturbance at depths of 15–30 cm was low; Ca and Mg were deposited near a depth of 15 cm. Soils at 30 cm depth are close to the geotechnical interface or are already at the geotechnical interface. The soil Ca and Mg contents are affected by the flow at the geotechnical interface, and the amount of Ca and Mg deposited is reduced by the flow. The depression in this study was a major farming area before the farmland began to be restored to forestland. On the one hand, the sedimentary soil was strongly influenced by farming activities, and the disturbance led to substantial Ca and Mg deposition. On the other hand, the bottom of the depression periodically receives slope surface soil in the rainy season due to sedimentary soil runoff. Soil loss continues toward to the cave. At the bottom of the depression, farming activities during the dry season reduce soil disturbance, and the soil becomes tight. This creates the conditions for sedimentary soil loss during the following rainy season. The Ca and Mg contents in the soil profile from the bottom of the depression were influenced by cyclical change. The soil in the sinkhole comes from the surface soil and has experienced little human disturbance in recent years. During the rainy season, surface loss and water loss have an obvious influence on the sediment in the cave, where soils of different particle sizes accumulate in a disorderly manner.

4.2. Soil Loss from the Depression Was Relatively Concentrated in the Direction of the Sinkhole, and the Changes in the Ca and Mg Contents in the Bottom of Cave Were Affected by Seasonal Ponding

When rainwater seeps downward, it carries sediment into holes, soil pores, and pipes. Some of the rainwater forms slope runoff and carries sediments that collect at the bottom of the depression and enter underground rivers through shafts, skylights, and sinkholes. Karst fissures, sinkholes, and underground river systems are the main factors causing soil and water leakage [20]. Ca, Mg, and other components carried by sediments enter karst fissures, sinkholes, and underground rivers together. Karst depressions are well sealed due to their surface morphology, and the runoff and sediment from the depression in this study easily collect in the direction of the sinkhole entrance at a relatively low altitude. Sediments and other substances in the sinkhole are mixed together without clears tratification patterns, and the sediment sources are diverse [21]. The contents of Ca and Mg in the sedimentary soil are similar to those in the surface soil. When factors such as rainfall, lithology, vegetation, and soil are relatively consistent, the surface and underground soil profiles show an obvious synchronous change relationship. Therefore, the soil and water leakage in the depression is relatively directionally focused. Under the influence of various factors, the lost material is mainly collected toward the direction of the sinkhole, and a large amount of soil is lost through the sinkhole [22,23].
Precipitation directly affects soil and water leakage, and water leakage is the driving force behind soil migration. Underground water migration makes up a large proportion of the water leakage that occurs in karst regions. Atmospheric precipitation results in the formation of slope runoff. Soil seepage into the ground occurs through shafts and sinkholes. The rain carries silt in underground three-dimensional migration patterns into underground karst fissures, pipes, and underground rivers. Precipitation leakage is one of the primary causes of soil and water leakage in karst ecosystems [24,25,26]. The presence of sedimentary soils in caves can indicate the occurrence of water and soil leakage [27]. The analysis in this study found that the Ca and Mg contents in the depression tended to increase from the top of the slope to the sinkhole, and it was expected that the highest Ca and Mg contents would occur at the bottom of the sinkhole, in the deposited soil. In fact, the Ca and Mg contents were relatively low in the middle of the sinkhole. Considering the soil source channel and direction inside the sinkhole and the seasonal water accumulation at the bottom of the sinkhole, seasonal water is one of the important factors leading to the low Ca and Mg contents in the deposited soil in the sinkhole. Seasonal periods of high water can result in the dissolution of Ca and Mg in the deposited soil and the dissolved Ca and Mg being carried away from the bottom of the sinkhole with the water flow. Changes in the water level lead to differences in the amount of Ca and Mg dissolved. The high water level does not last long but involves a large amount of water with a strong dissolution capacity. As a result, the Ca and Mg in the deposited soil are dissolved rapidly, resulting in a sharp decrease in storage in the deposited soil. The low water level lasts for a long time but does not have a high dissolution capacity; thus, the Ca and Mg in the sedimentary soil dissolve relatively slowly. With the continuous inflow of external soil, the contents of Ca and Mg in the sedimentary soil decreased slowly.

4.3. Soil Ca and Mg, like K and N, Can Be Used as Indicators of Soil and Water Leakage

The change trends of Ca and Mg in surface soil were the same as the basic change characteristics of soil erosion and underground soil erosion [10]. In the process of soil and water loss, materials lost from the high-altitude location constantly migrate to the low-altitude location. Aside from the part directly removed from the basin by runoff, a large amount of these materials is deposited in foothills, estuaries, deltas, alluvial fans, and other locations for a long time or temporarily [28,29]. The contents of elements such as nitrogen, phosphorus, and potassium in surface runoff as well as soil and soil solution components in the different phases of migration have been used as important indexes for soil and water loss monitoring. These indexes have been demonstrated to be very effective for a variety of landforms, soil types, and climates, and many laboratory simulation experiments simulating soil loss in karst area have also demonstrated their efficacy [23]. The strong correlation between the Ca and Mg contents and the K and N contents in the soil lost from the depression (Figure 6), as well as the regular characteristics of the Ca and Mg contents in the depression soils, indicates that Ca and Mg can also be used as indicators for soil and water leakage monitoring in depressions.

5. Conclusions

The change in the water level in the sinkhole directly affects the change and migration trends of Ca and Mg in the sedimentary soil. Ca and Mg can be used as indicators in soil and water leakage monitoring in the same way as K and N. Ca and Mg, as the two main elements in rocks in karst areas, are also two important elements in karst soils. In the process of soil and water leakage, the main component of the leakage material is the water loss. The soil migration and change patterns in karst regions can be used as indexes for monitoring soil and water leakage. Due to a lack of water and soil leakage monitoring systems, the relationship between mineral leakage characteristics and water leakage factors in soils also needs to be further verified by determining the feasibility of applying soil and water leakage monitoring indexes. Soil and water leakage research is complex and multifaceted. Elements such as Ca and Mg can be used as typical indicator elements in the process of water loss and can play an important role in tracking the direction of water leakage and the regularity of periodic changes in water leakage. Other indicators of soil and water leakage also play important roles. We should continue to search for correlations between other indicators and typical indicators such as Ca and Mg and to clarify the importance of the relationships between indicators under different conditions in order to better monitor and study soil and water leakage.

Funding

This study was supported by the Key Project of Science and Technology Program of Guizhou Province (No. 5411 2017 Qiankehe Pingtai Rencai), the World Top Discipline Program of Guizhou Province (No. 125 2019 Qianjiao Keyan Fa) and the China Overseas Expertise Introduction Program for Discipline Innovation (No. D17016).

Institutional Review Board Statement

Not applicable.

Informed Consent Statement

Not applicable.

Data Availability Statement

Data are contained within the article.

Conflicts of Interest

The authors declare no conflict of interest.

Nomenclature

Depression“Depression” is “karst depression”, a common closed negative terrain in karst areas, relatively flat and covered with loose sediment, which is conducive to farming.
Fengling“Fengling” is “Peak forest”, carbonate rocks are strongly eroded, their peaks rise, and they have underground drainage systems.
Fengcong“Fengcong” is “Peak cluster”, the Peak forest with their bases connected together.

References

  1. Xiong, K.N. Hdyrological model and hydrodynamic processes in development of the cone karst. J. Guizhou Norm. Univ. Nat. Sci. 1995, 14, 14–22. [Google Scholar]
  2. Peng, X.; Dai, Q.; Ding, G.; Li, C. Role of underground leakage in soil, water and nutrient loss from a rock-mantled slope in the karst rocky desertification area. J. Hydrol. 2019, 578, 124086. [Google Scholar] [CrossRef]
  3. Williams, P.W. The role of the epikarst in karst and cave hydrogeology: A review. Int. J. Speleol. 2008, 37, 1–10. [Google Scholar] [CrossRef] [Green Version]
  4. Xiong, K.N.; Li, J.; Long, M. Features of soil and water loss and key issues in demonstration areas for combating karst rocky desertification. Acta Geogr. Sin. 2012, 67, 878–888. [Google Scholar] [CrossRef]
  5. Yang, M.D. The geomorphological regularities of karst water occurrences in Guizhou plateau. Carsologica Sin. 1982, 2, 81–91. [Google Scholar]
  6. Soil and Water Conservation Monitoring Center of Ministry of Water Resources. Soil and Water Conservation Monitoring Manual for Runoff Plot and Small Watershed; China Water Resources and Hydropower Press: Beijing, China, 2015; pp. 5–56.
  7. Department of Water and Soil Conservation, Ministry of Water Resources. Technical Regulations on Dynamic Monitoring of Regional Soil and Water Loss; Department of Soil and Water Conservation, Ministry of Water Resources: Beijing, China, 2018; pp. 11–27.
  8. Wu, Q.L.; Liang, H.; Xiong, K.N.; Li, R. Eco-benefits coupling of agroforestry and soil and waterconservation under KRD environment. Front. Theor. Outlook Agrofor. Syst. 2018, 93, 1927–1938. [Google Scholar] [CrossRef]
  9. Ren, M.E.; Liu, Z. Karstologygenerality; The Commercial Press: Beijing, China, 1983; pp. 21–35. [Google Scholar]
  10. Hu, J.; Wang, Y.; Peng, C.; Cheng, Y.; Zheng, Q.; Yuan, J. Evaluation of soil exchangeable calcium and magnesium in Panzhihua tobacco-growing areas. Southwest China J. Agric. Sci. 2011, 24, 1415–1418. [Google Scholar] [CrossRef]
  11. Ford, D.C.; Williams, P.W. Karst Hydrogeology and Geomorphology; John Wiley & Sons: Hoboken, NJ, USA, 2007; pp. 30–66. [Google Scholar]
  12. Yue, K.Q.; Gu, Z.K.; Li, R. Research progress and prospect of underground soil erosion in karst rocky desertification areas. Soil Water Conserv. China 2015, 5, 58–61. [Google Scholar] [CrossRef]
  13. Zhou, Y.; Luo, W.; Jiang, Z.; Liang, J.; Huang, J.; Su, J.; Hu, B. Research progress on soil erosion in karst peak-cluster depression. Pearl River 2018, 39, 13–28. [Google Scholar] [CrossRef]
  14. Zhang, Y. Tree-Shrub-Grass Restoration Mechanism and Characteristic High-Efficiency Forestry Model in the Karst Rocky Desertification Control; Guizhou Normal University: Guiyang, China, 2020; pp. 44–71. [Google Scholar]
  15. Bao, E.Y.; Xiong, K.N.; Liu, Z.Q.; Li, Y.; Wang, J. Particle size distribution and erodibilitr of soils under different erosion sites in karst. J. For. Environ. 2020, 40, 156–163. [Google Scholar] [CrossRef]
  16. Ministry of Agriculture and Rural Affairs, PRC. Soil Quality-Guidance on Sampling Technology GB/T36197-2018; China Standard Press: Beijing, China, 2018; pp. 2–10.
  17. Xiong, K.N. The Midas Touch-Technology and Model of Rocky Desertification Control in Guizhou Province; Guizhou Science and Technology Press: Guiyang, China, 2011; pp. 14–22. [Google Scholar]
  18. National Environmental Protection Agency. Water Quality—Determination of Calcium and Magnesium—Atomic Absorption Spectrophotometry GB11905-89; Ministry of Water Resources: Beijing, China, 1989; pp. 1–20.
  19. Lu, R.Q. Methods of Soil Agricultural Chemical Analysis; China Agricultural Science and Technology Press: Beijing, China, 1999; pp. 18–96. [Google Scholar]
  20. Zhou, N.; Li, C.; Jiang, S.; Tang, Y. Models of soil and water loss and soil leakage in Puding karst area. Bull. Soil Water Conserv. 2009, 29, 7–11. [Google Scholar] [CrossRef]
  21. Cheng, Q.; Peng, T.; Zhang, X.; Cao, L.; Wang, S. Trcaing fine sediment sources in the surface and subsurface rivers of a karst watershed using compound fingerprinting 137Cs and magnetic suceptibility in southwest china. J. Soil Water Conserv. 2019, 33, 140–145. [Google Scholar] [CrossRef]
  22. Wang, F.; Chen, H.; Lian, J.; Fu, Z.; Nie, Y. Seasonal recharge of spring and stream waters in a karst catchment revealed by isotopic and hydrochemical analyses. J. Hydrol. 2020, 591, 125595. [Google Scholar] [CrossRef]
  23. Gao, R.X.; Dai, Q.H.; Gan, Y.; Yan, Y.; Peng, X.D. The mechanisms of nutrient output through water flow from sloping farmland with slight rocky desertification in a karst region. Environ. Res. Lett. 2020, 15, 094085. [Google Scholar] [CrossRef]
  24. Jiang, Z.; Luo, W.; Deng, Y.; Cao, J.; Qin, X.; Li, Y.; Yang, Q. The Leakage of Water and Soil in the Karst Peak Cluster Depressionand Its Prevention and Treatment. Acta Geogr. Sin. 2014, 35, 535–542. [Google Scholar] [CrossRef]
  25. Tang, Y.; Zhang, X.; Zhou, J.; She, T.; Yang, P.; Wang, J. The mechanism of underground leakage of soil in karstrocky desertification areas—A case in Chenqi small watershed, Puding, Guizhou Province. Carsologica Sin. 2010, 29, 121–127. [Google Scholar] [CrossRef]
  26. Cao, J.; Lu, S.; Yang, D.; Jiang, Z.; Kang, Z. Process of soil and water loss and its control measures in karst regions southwest China. Sci. Soil Water Conserv. 2011, 9, 52–56. [Google Scholar] [CrossRef]
  27. Li, J.; Xiong, K.N. Particle analysis of soil in karst caves and its significance for water and soil erosion. J. Guizhou Norm. Univ. Nat. Sci. 2011, 29, 16–18. [Google Scholar] [CrossRef]
  28. Peng, X.D.; Dai, Q.H.; Li, C. Research progress on the process and mechanism of soil water loss or leakage on slope in southwest karst of China. J. Soil Water Conserv. 2017, 31, 1–8. [Google Scholar] [CrossRef]
  29. Peng, X.D.; Dai, Q.H.; Li, C.; Yuan, Y.; Zhao, L. Effect of simulated rainfall intensities and underground pore fissure degrees on soil nutrient loss from slope farmlands in karst region. Trans. Chin. Soc. Agric. Eng. 2017, 33, 131–140. [Google Scholar] [CrossRef]
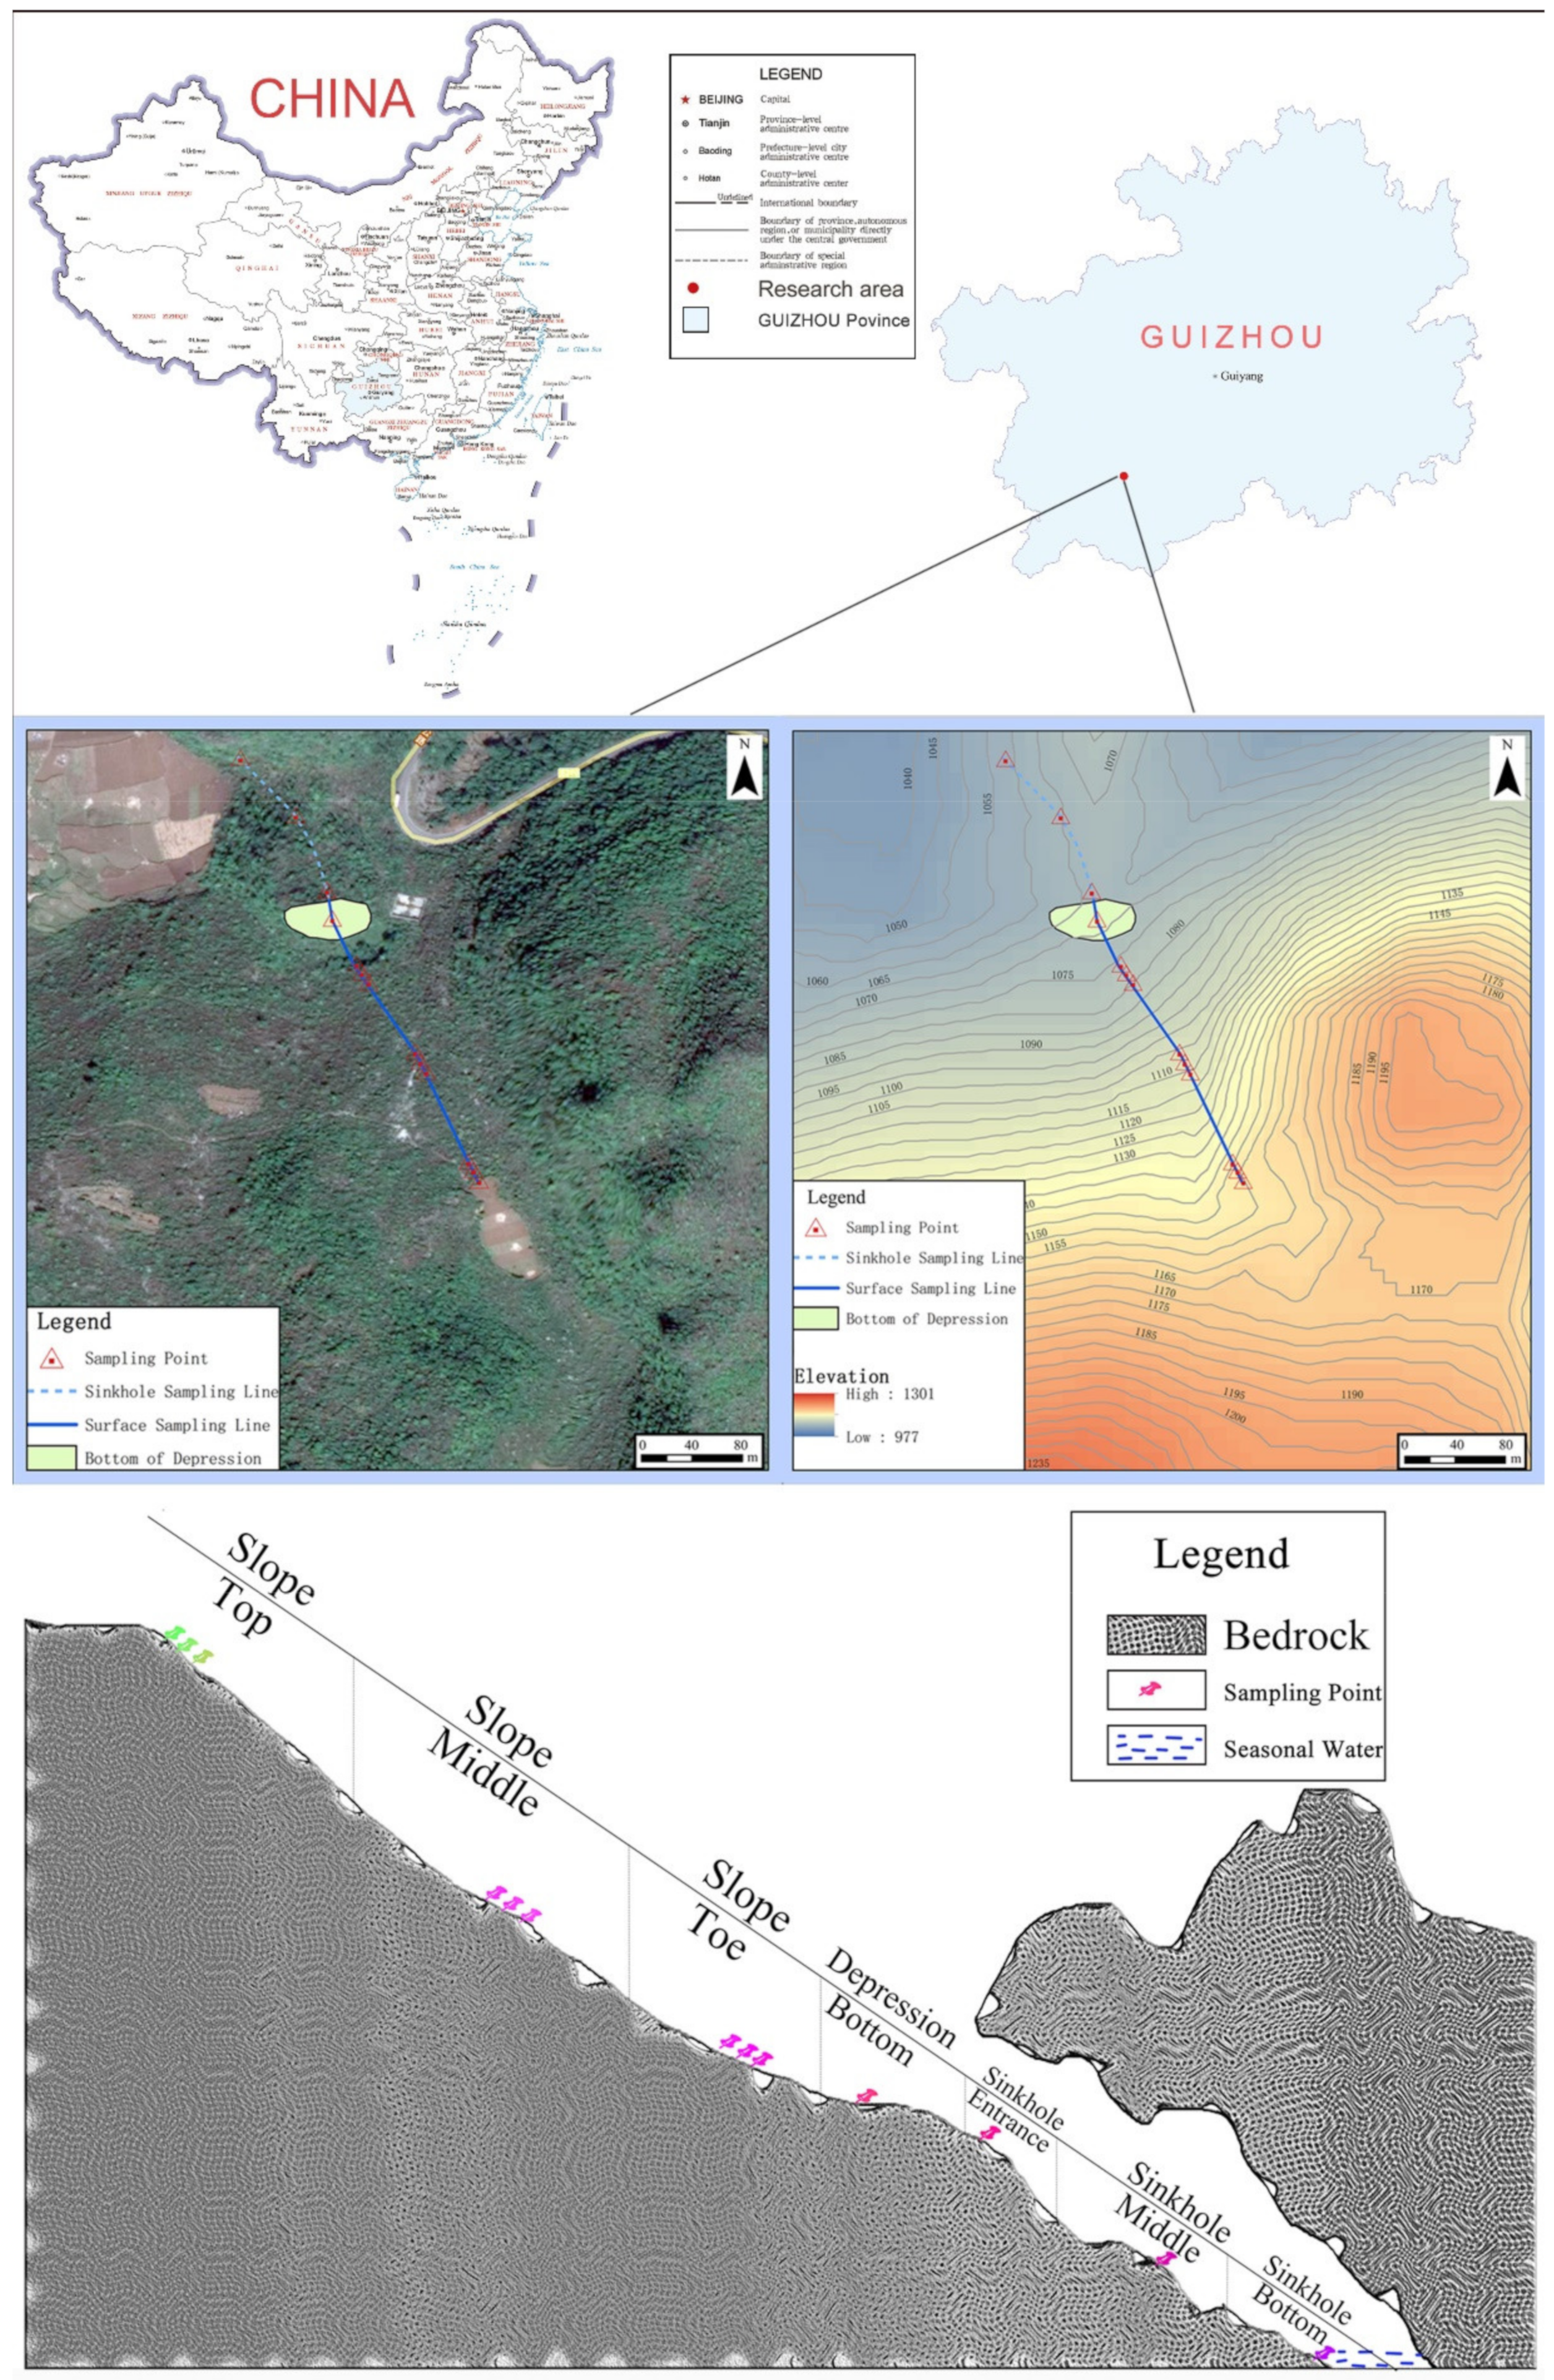
Figure 1. Map of the soil sampling point distribution.
Sustainability 14 09627 g001
Figure 2. Distribution characteristics of Ca, Mg, K, N in experimental data.
Sustainability 14 09627 g002
Figure 3. Distribution characteristics of Ca and Mg in the soil profile on the slope and at the bottom of the depression. (1. (A1A3)—Vertical distribution of Ca and Mg in the soil profile from the top of the slope; 2. (B1B3)—Vertical distribution of Ca and Mg in the soil profile from the middle of the slope; 3. (C1C3)—Vertical distribution of Ca and Mg in the soil profile from the foot of the slope; 4. (D) Vertical distribution of Ca and Mg in the soil profile from the bottom of the depression).
Sustainability 14 09627 g003
Figure 4. Distribution characteristics of Ca and Mg in the soil profile of the sinkhole. (1. (E) Vertical distribution characteristics of Ca and Mg in the soil profile at the cave entrance; 2. (F) Vertical distribution characteristics of Ca and Mg in the soil profile in the middle of the sinkhole. (G) Vertical distribution characteristics of Ca and Mg in the soil profile at the bottom of the sinkhole.).
Sustainability 14 09627 g004
Figure 5. Distribution characteristics of Ca and Mg in the surface soil.
Sustainability 14 09627 g005
Figure 6. Distribution characteristics of K and N in the surface soil.
Sustainability 14 09627 g006
Table 1. Numbering and establishment of sampling points.
Sampling PointDepression SlopeBottom of DepressionSinkhole
TopMiddleBaseEntranceMiddleBottom of Sinkhole
1A13 timesB13 timesC13 timesD3 timesE1 timeF1 timeG1 time
2A23 timesB23 timesC23 times
3A33 timesB33 timesC33 times
Table 2. Correlation analysis of soil Ca and Mg contents and K and N contents.
Soil0–5 cm5–10 cm10–15 cm
ParameterCaMgKNCaMgKNCaMgKN
Ca1 1 1
Mg0.752 **1 0.624 *1 0.622 *1
K0.701 **0.554 *1 0.699 **0.609 *1 0.640 *0.4891
N−0.719 **−0.399−0.625 *1−0.630 *−0.118−0.600 *1−0.508−0.150−0.746 **1
Soil15–20 cm20–25 cm25–30 cm
ParameterCaMgKNCaMgKNCaMgKN
Ca1 1 1
Mg0.731 **1 0.1831 0.2311
K0.553 *0.722 **1 0.4750.2321 0.3910.1421
N−0.477−0.417−0.4331−0.2370.223−0.623 *1−0.0780.300−0.5641
* indicates a significant correlation at the 0.05 level; ** indicates a significant correlation at the 0.01 level.
Publisher’s Note: MDPI stays neutral with regard to jurisdictional claims in published maps and institutional affiliations.