Review

Exploring the Trend of Commodity Prices: A Review and Bibliometric Analysis

1
School of Emergency Management Science and Engineering, University of Chinese Academy of Sciences, Beijing 100190, China
2
School of Economics and Management, University of Chinese Academy of Sciences, Beijing 100190, China
3
Key Laboratory of Big Data Mining and Knowledge Management, Chinese Academy of Sciences, Beijing 100190, China
4
Academy of Mathematics and Systems Science, Chinese Academy of Sciences, Beijing 100190, China
*
Author to whom correspondence should be addressed.
Sustainability 2022, 14(15), 9536; https://doi.org/10.3390/su14159536
Submission received: 12 July 2022 / Revised: 31 July 2022 / Accepted: 1 August 2022 / Published: 3 August 2022
(This article belongs to the Section Economic and Business Aspects of Sustainability)

Abstract

:
As the supply of commodities forms essential lifelines for modern society, commodity price fluctuations can significantly impact the operation and sustainable development of macroeconomics, production activities, and people’s security and well-being. The commodity trading market also plays a pivotal role in the competition of the international industrial chain and the sustainable development of the industry. The method of bibliometrics was used in this study to trace the development of research on commodity prices, and statistical and co-citation analyses were conducted on selected literature samples. It was found that the research hotspots in this field are concentrated on four aspects: factors influencing commodity prices, the impact of price fluctuations on the macroeconomy, forecasts of commodity prices, and the financialization of commodities. A current commodity price research network centered on oil prices has formed. Future directions in this field, which developed out of oil shock research 40 years ago, can further investigate the impact of factors and the responses that can be made to emergencies on commodity prices, as well as continuing to develop better methods of commodity price forecasting.

1. Introduction

Commodities, essential lifelines for modern society, include almost all primary material commodities used for production and consumption, such as energy, minerals, and agricultural products. It is important to understand the driving factors for the fluctuations of commodity prices and the impact of commodity price changes on the macroeconomy [1]. In consumer and producer countries, a large part of income and welfare depends on the prices of these goods [2]. Commodity markets occasionally exhibit widespread mass booms and busts. These events affect the ability of the poor and those countries in the developing world to purchase basic necessities, such as food and energy, creating trade imbalance, and in some cases, political turmoil. The effect of the “boom and bust” of commodity prices resonates with ordinary people because trade imbalances and currency shocks that can then arise affect social welfare [3], the operation of the national economy, and enterprise production in a way that not all price surges do. Therefore, commodities price fluctuation has received attention from all quarters.
In addition, commodity prices are more volatile than others [4]. With the gradually deepening financialization of the commodity market, this greater fluctuation is obvious and is well known to be extremely susceptible to large-scale emergencies, creating rapid fluctuation. Starting from decade lows in the late 1990s, commodity prices continued to rise for the next 10 years, and reached their peak in June 2008. After the financial crisis, it was pushed to a record high by many countries’ economic stimulus. The price until 2011 was twice as much as that in 1988. From the second half of 2006 to the first half of 2008, driven by various factors, the prices of agricultural products on a global scale rose, triggering a round of food crises that seriously impacted the welfare of the poor worldwide. Due to the wide effects of COVID-19, the prices of metal products, such as steel and copper, fell sharply and then increased rapidly in 2020, posing a serious threat to the production and survival of downstream small- and medium-sized enterprises. In the long run, the trend of increasing volatility in commodity prices can be difficult to reverse, creating the necessity to pay more attention to the field of forecasting international commodity prices.
More importantly, the volatility of commodity prices has an important impact on the sustainable development of a country. Take energy as an example. Among the Sustainable Development Goals, SDG7 is the Sustainable Development Goal of Energy, which is to ensure that everyone has access to affordable, reliable, and sustainable modern energy. However, energy prices affect the stability and sustainable development of most countries, especially poor countries, where access to energy is limited; in addition, some populations have no access to energy at all, which goes against the goals of SDG7 [5]. On the other hand, sharp fluctuations in energy prices have had a significant impact, with rapid price declines not conducive to energy exporting countries; however, sharp price increases are unfavorable for energy importing countries, and exporting countries are affected by energy price vulnerability [6]. If the general trend of energy prices cannot be well grasped and a safe energy guarantee mechanism cannot be established, it will bring challenges to the sustainable development of the country [7,8]. Likewise, food sustainability is one of the main concepts for achieving global sustainable development [9]. SDG2 means ending hunger, achieving food security, improving nutrition, and promoting sustainable agriculture. High food prices will limit people’s ability to obtain food [10], which is fundamentally detrimental to the long-term development of the country.
Having a better understanding of the research history and development path of commodity prices, and grasping the current research hotspots and future development trends, are of theoretical and practical significance. In particular, it can help companies to prevent future business risks, help companies to take effective measures to hedge the cost risks caused by drastic price changes, and increase the expectations for future sustainable development. However, current research reviews in this field mainly use qualitative analysis methods, relying on an author’s subjective framework to sort out research themes and content [11], or only focusing on one specified commodity. For example, Chiroma et al. [12] reviewed the application of existing computer intelligence algorithms in crude oil price prediction, and analyzed the advantages and limitations of the research. Ederington et al. [13] reviewed the existing research on the relationship between crude oil prices and petroleum product prices, and summarized the causal and asymmetric relationship between the two. Abdallah et al. [14] used food safety, price fluctuations, and price transmission as keywords to quantitatively analyze literature on food safety and food prices; this revealed the current research hotspots and status quo.
Compared with traditional qualitative literature reviews, bibliometric analysis, using statistical methods, can evaluate and review research progress in a more comprehensive and objective way, and is visualized. Therefore, this paper uses the Citespace software to sort out the development of the field of “commodity prices”, grasp the overall growth trend of the number of documents and citations in this field, figure out the top scientific research institutions, countries and core authors, as well as their cooperation relationships. At the same time, through co-citation analysis, we can understand current research hotspots and dynamic evolution to clarify future research trends.

2. Methods and Data

Bibliometric analysis is powerful for tracing the development path and grasping the research hotspots of a specified research field. Because it integrates mathematics, statistics, and philology to help researchers conduct quantitative analysis and visual research on literature, it can quickly identify the coupling relationship between published articles and the cooperation relationship between authors. The most common analysis methods include core author analysis, co-citation analysis, and co-word analysis [15,16,17].
For this study, research papers on commodity prices were searched for and collected from the “Web of Science Core Collection” database. We first searched the database using keywords, including “commodity price”, “price of commodity”, “food price”, and “oil price”, and limited the searched-for literature types to “Article” and “Review”. We then collected a list that contains 2962 articles from 1900 to 2020 (downloaded on 14 September 2021). Next, based on the title, keywords, and abstract, we excluded papers that are not closely related to the research topic, such as wholesale price of goods in a certain year, and product sales strategies. Finally, 1671 papers remained.

3. Statistical Analysis of Commodity Prices

This section may be divided into subheadings. It should provide a concise and precise description of the experimental results, their interpretation, as well as the experimental conclusions that can be drawn.

3.1. Research on the Overall Growth Trend

The degree of academic attention to a certain field can be reflected in the number of publications and citations. It can be seen from Figure 1 that the literature on commodity prices has gradually increased since 2000, and has shown an explosive growth trend after 2008, reaching 221 in 2019. From 1990 to 2019, the number of documents has doubled a hundredfold in 30 years. This is in line with the actual situation. The 2008 financial crisis caused violent fluctuations in commodity prices and severely impacted economic operations. Since then, more scholars have devoted themselves to research in this field.
Figure 1 also reflects the changing trend of the number of citations in the field of commodity prices in the past 30 years. The number of citations grew from 5 in 1990 to 10,624 in 2020. The most cited article is Kilian’s article published on AER in 2009. This groundbreaking research decomposed the actual price of crude oil into three parts: crude oil supply shocks, shocks to the global industrial commodity demand, and demand shocks specific to the crude oil market; it discussed the reasons for major oil price shocks since 1975. As of 2020, this article has been cited 1409 times, becoming a foundational work in the field of commodity prices.
For the quantitative work, our method was: apply exponential fitting to the number of articles published each year and the number of citations. The R-squares of the curves are 0.967 and 0.988, respectively, indicating that the number of research documents and citations in the field of commodity prices has exponentially increased; this reflects the high degree of concern of the academic community on commodity prices in recent years.

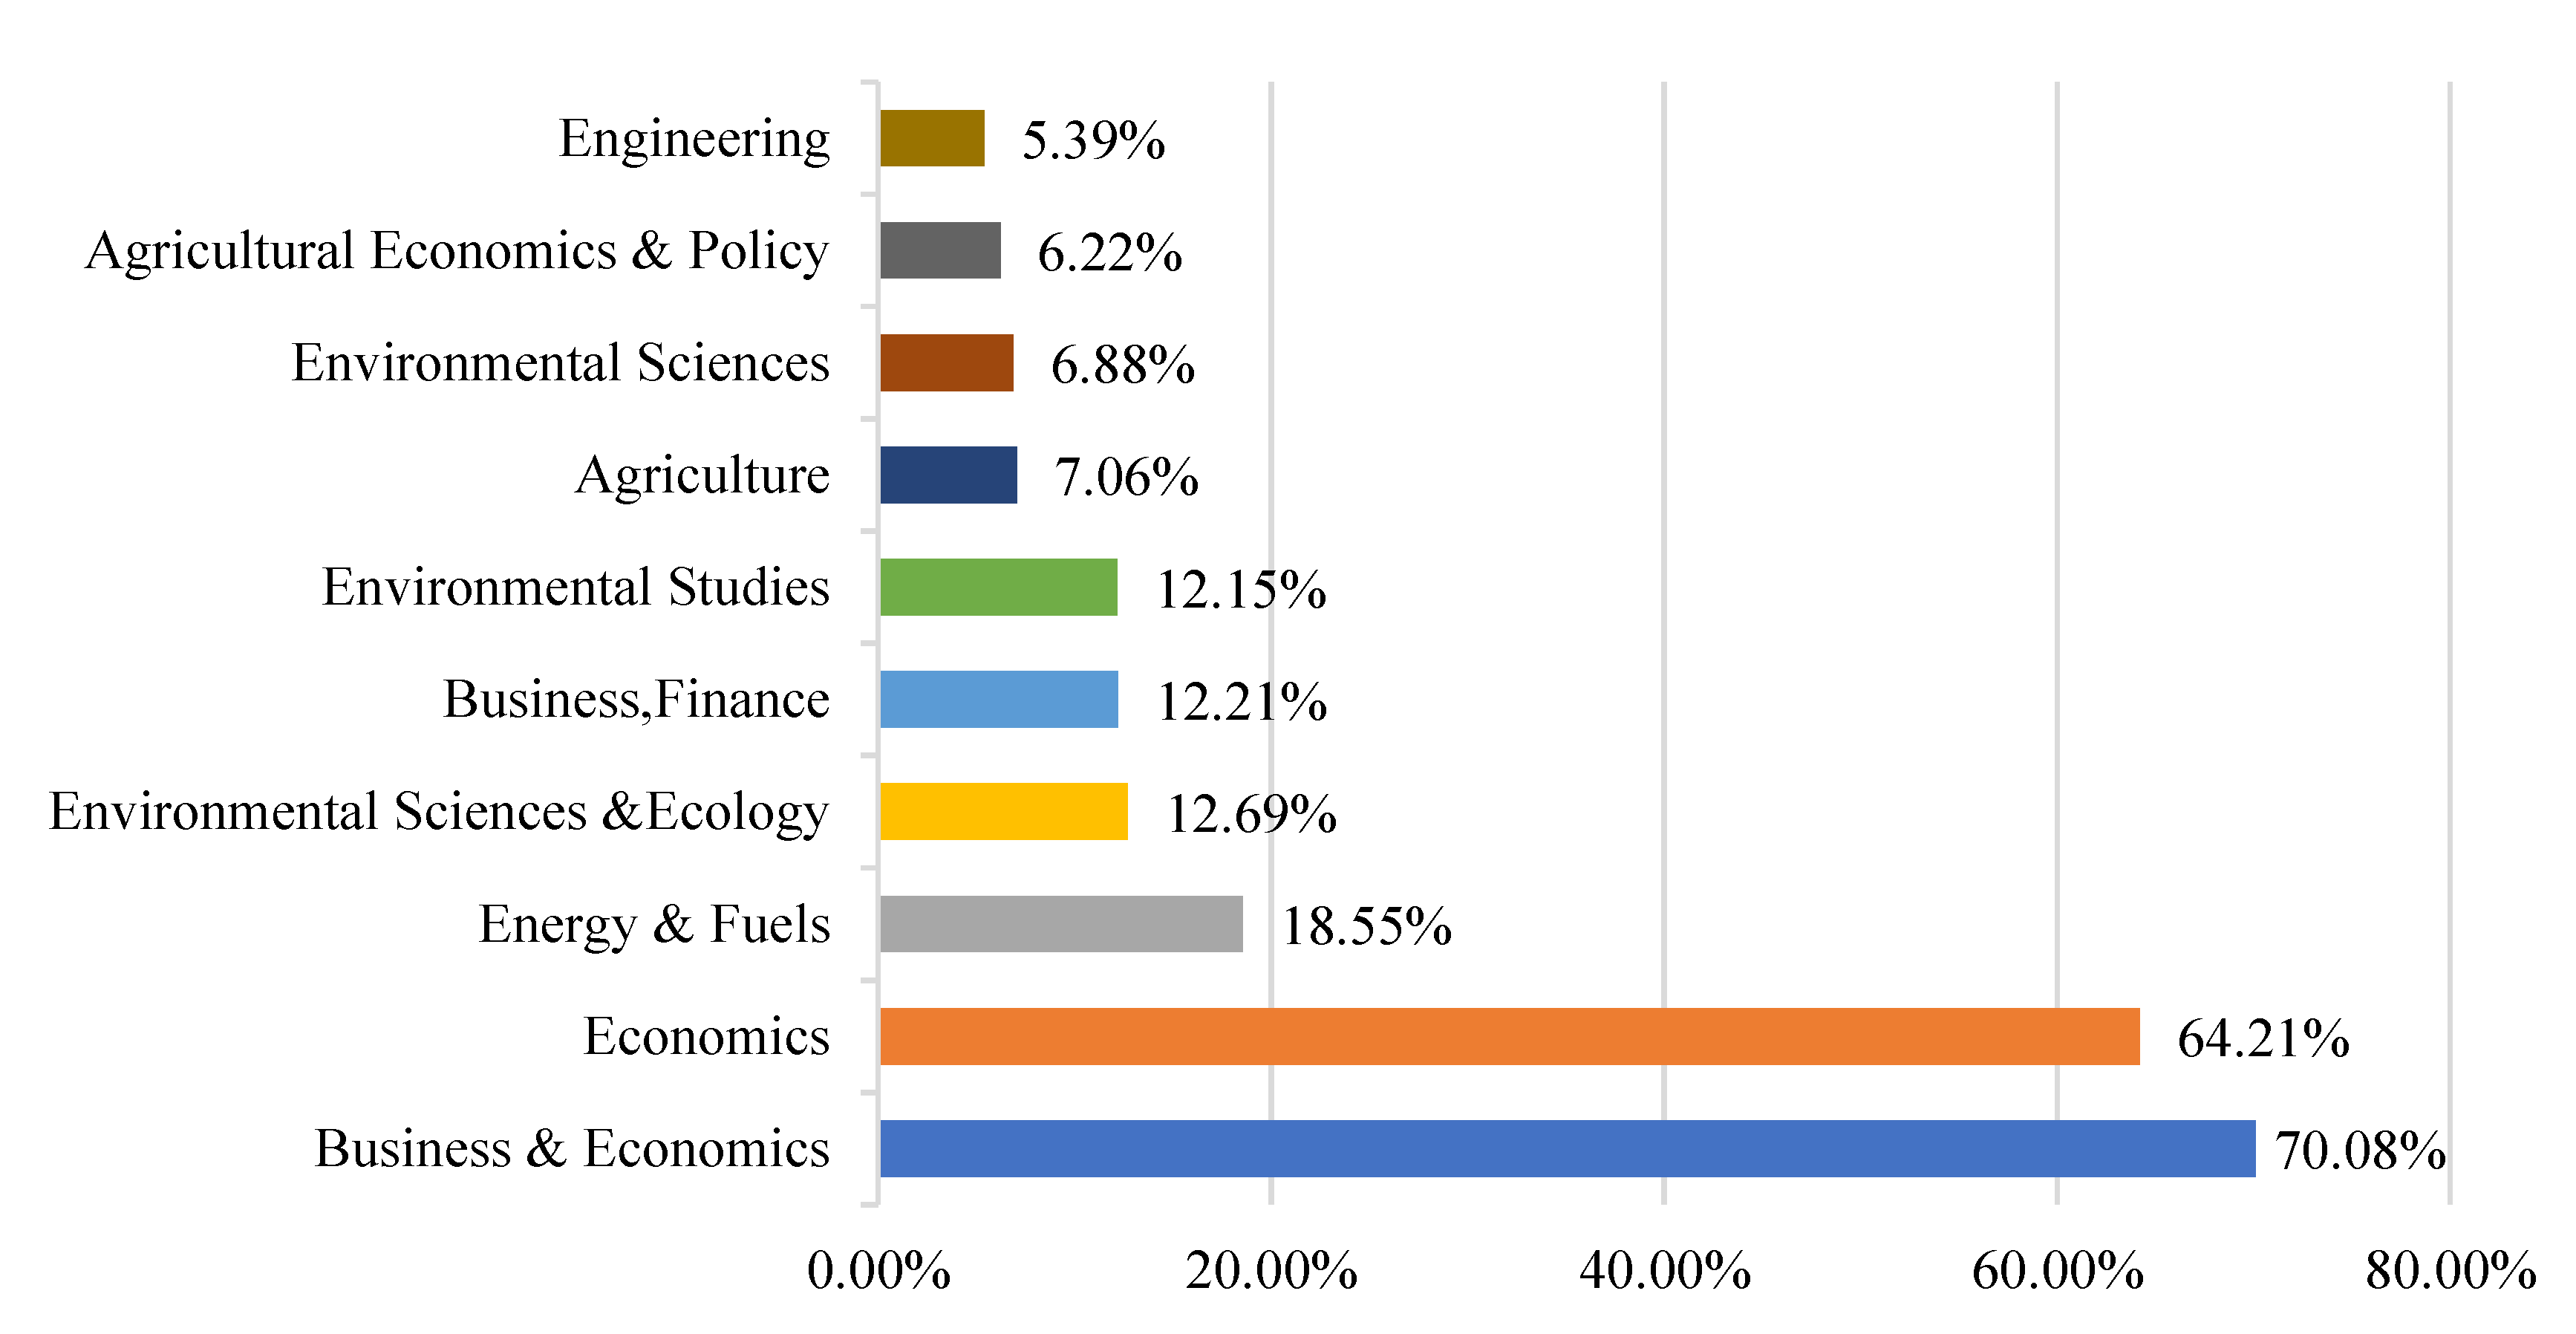
3.2. Publication Sources

Figure 2 shows the main research areas of commodity prices and their proportions. The research direction is given by the Web of Science database. Since the research content of a document may involve multiple fields, the proportions of each field add up to more than 100%. It can be seen that the research is mainly concentrated on economics and energy, with a small proportion of research focusing on finance.
Paying attention to publications of frequently cited literature can clarify the degree of academic attention to the field of commodity prices. Table 1 shows some highly cited journals and their impact factors in the past five years. Among them, Energy Economics, Journal of Econometrics, Econometrica, and American Economic Review are highly cited. They are the top publications in the fields of energy, econometrics, and economics. It shows that in addition to relevant professional knowledge, research on commodity prices also involves using a large number of econometric models. From the perspective of the volume of publications, the literature in this field is mostly concentrated on Energy Economics, Energy Policy, and Energy, and the impact factors of these journals are all above 6; this indicates that there has been a batch of high-quality articles affecting economic operation and resource management in the field of commodity price research.

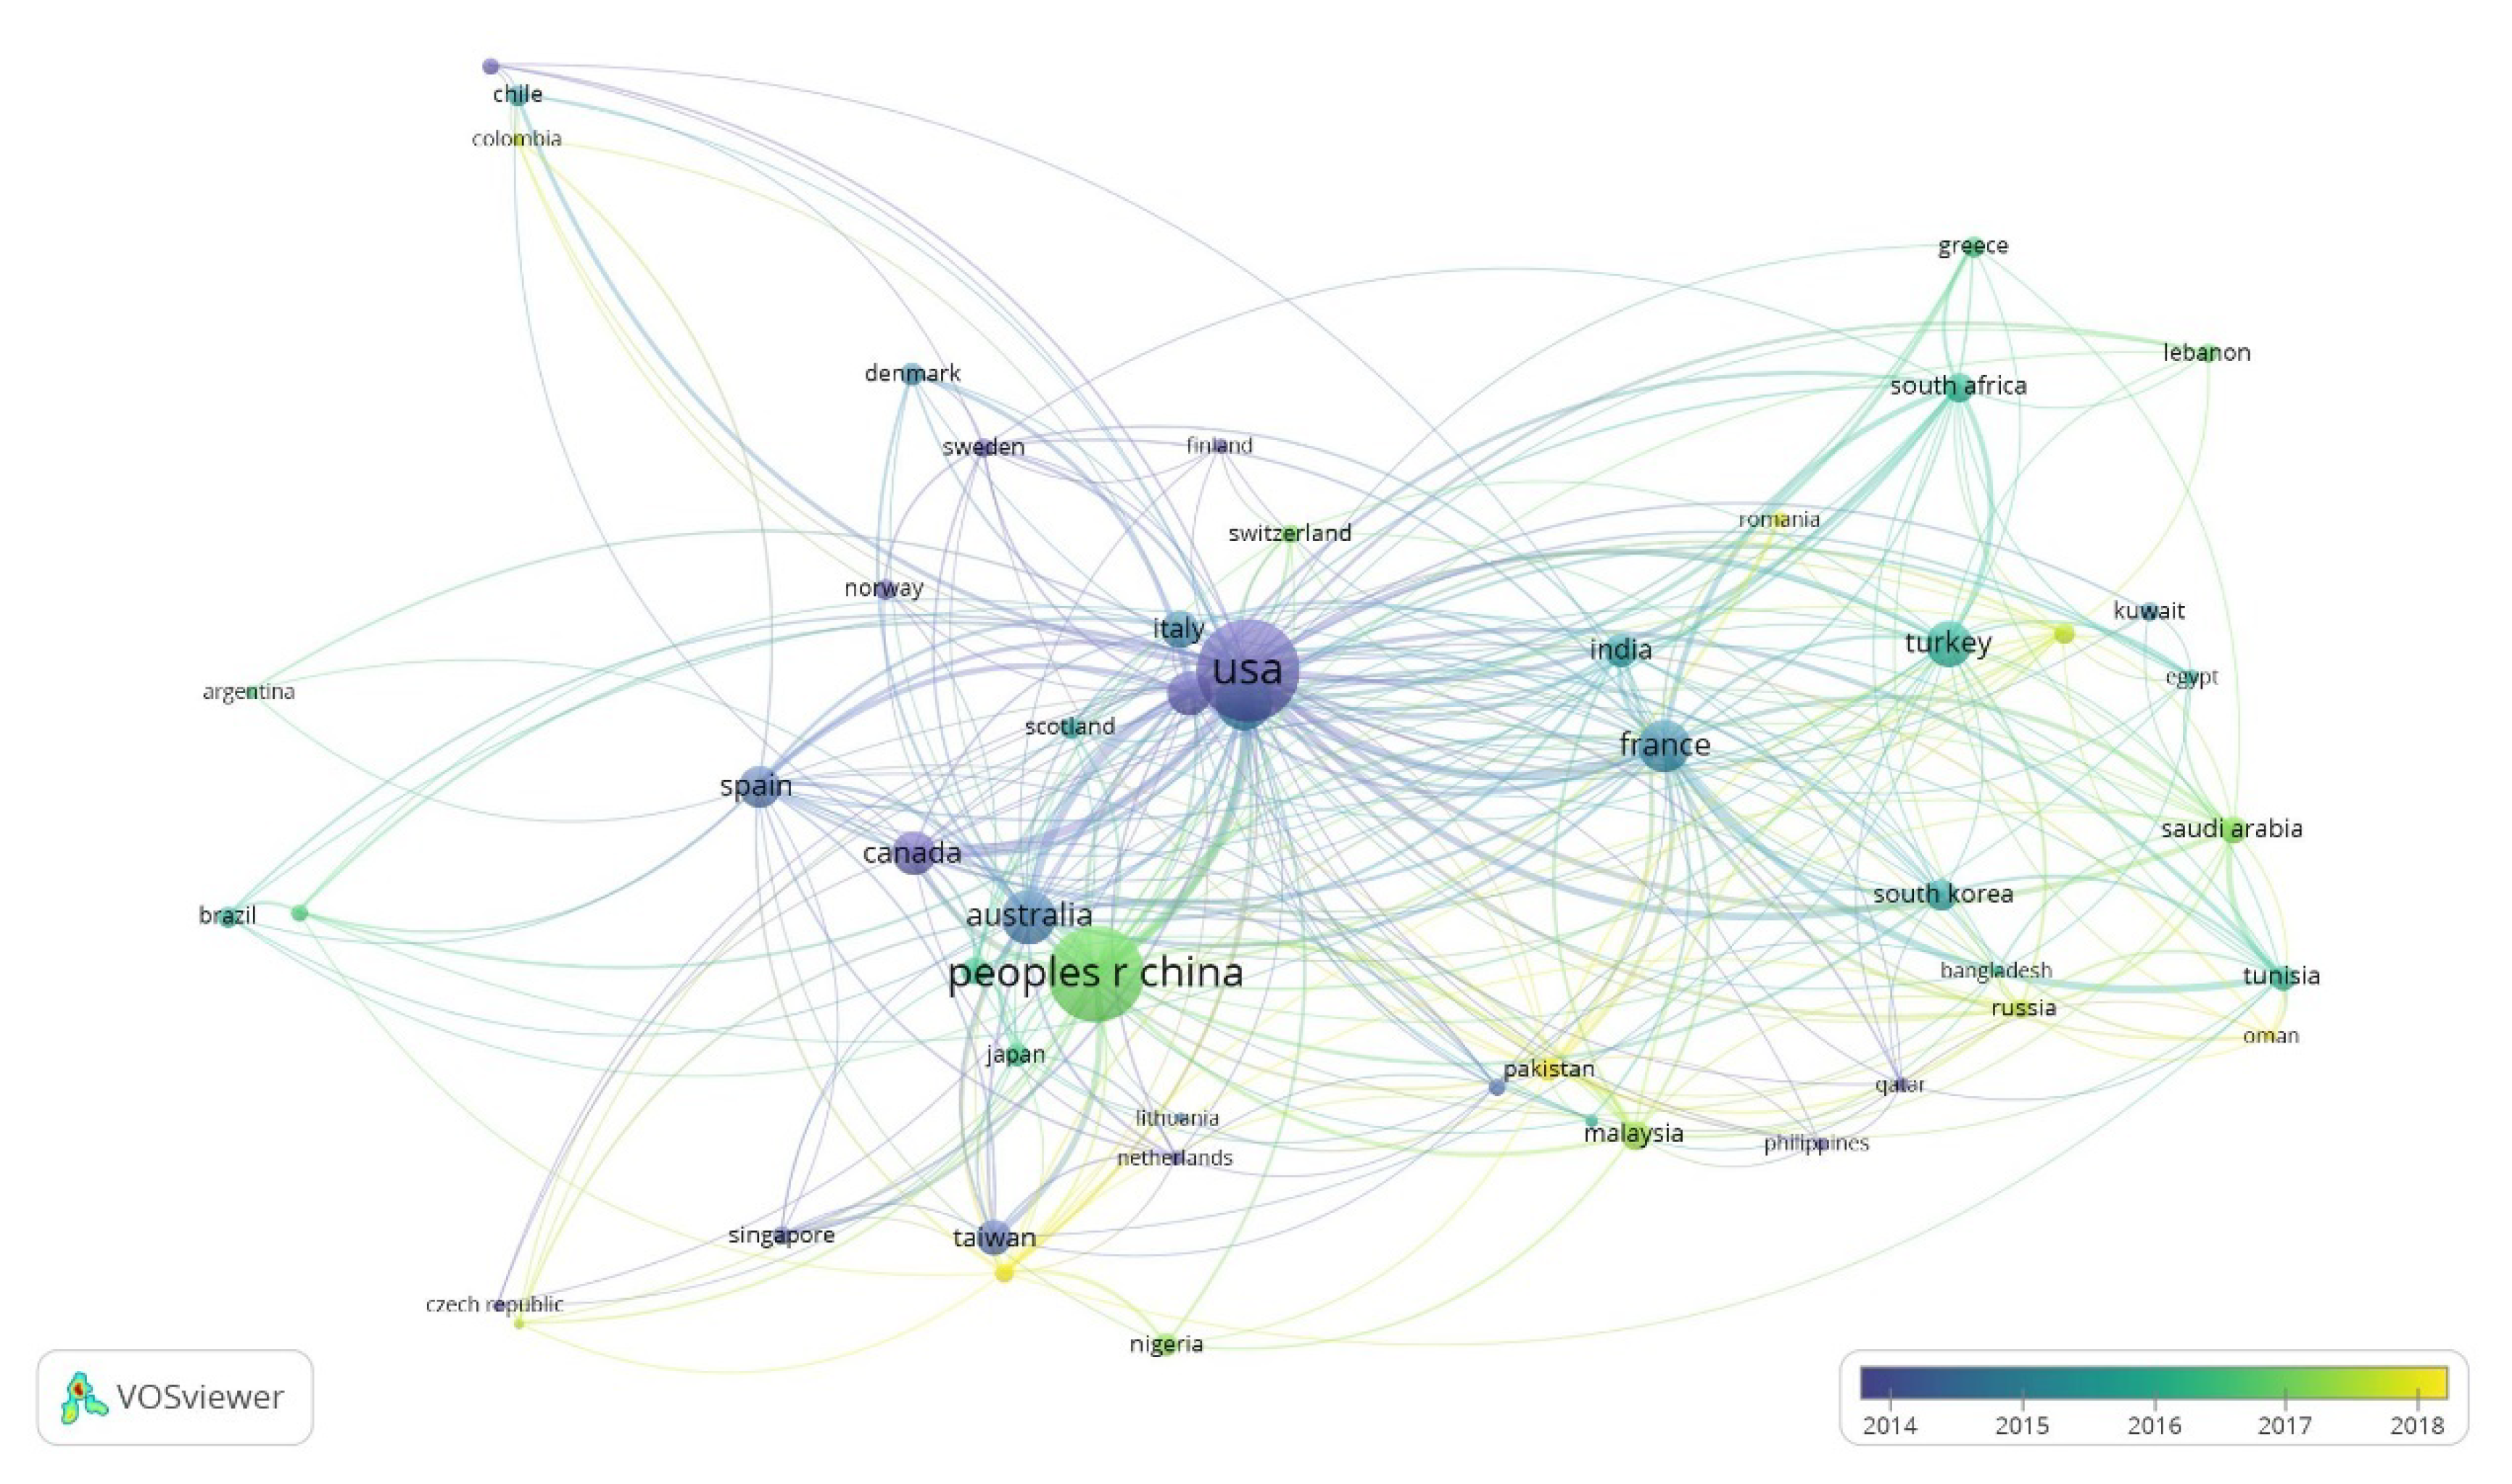
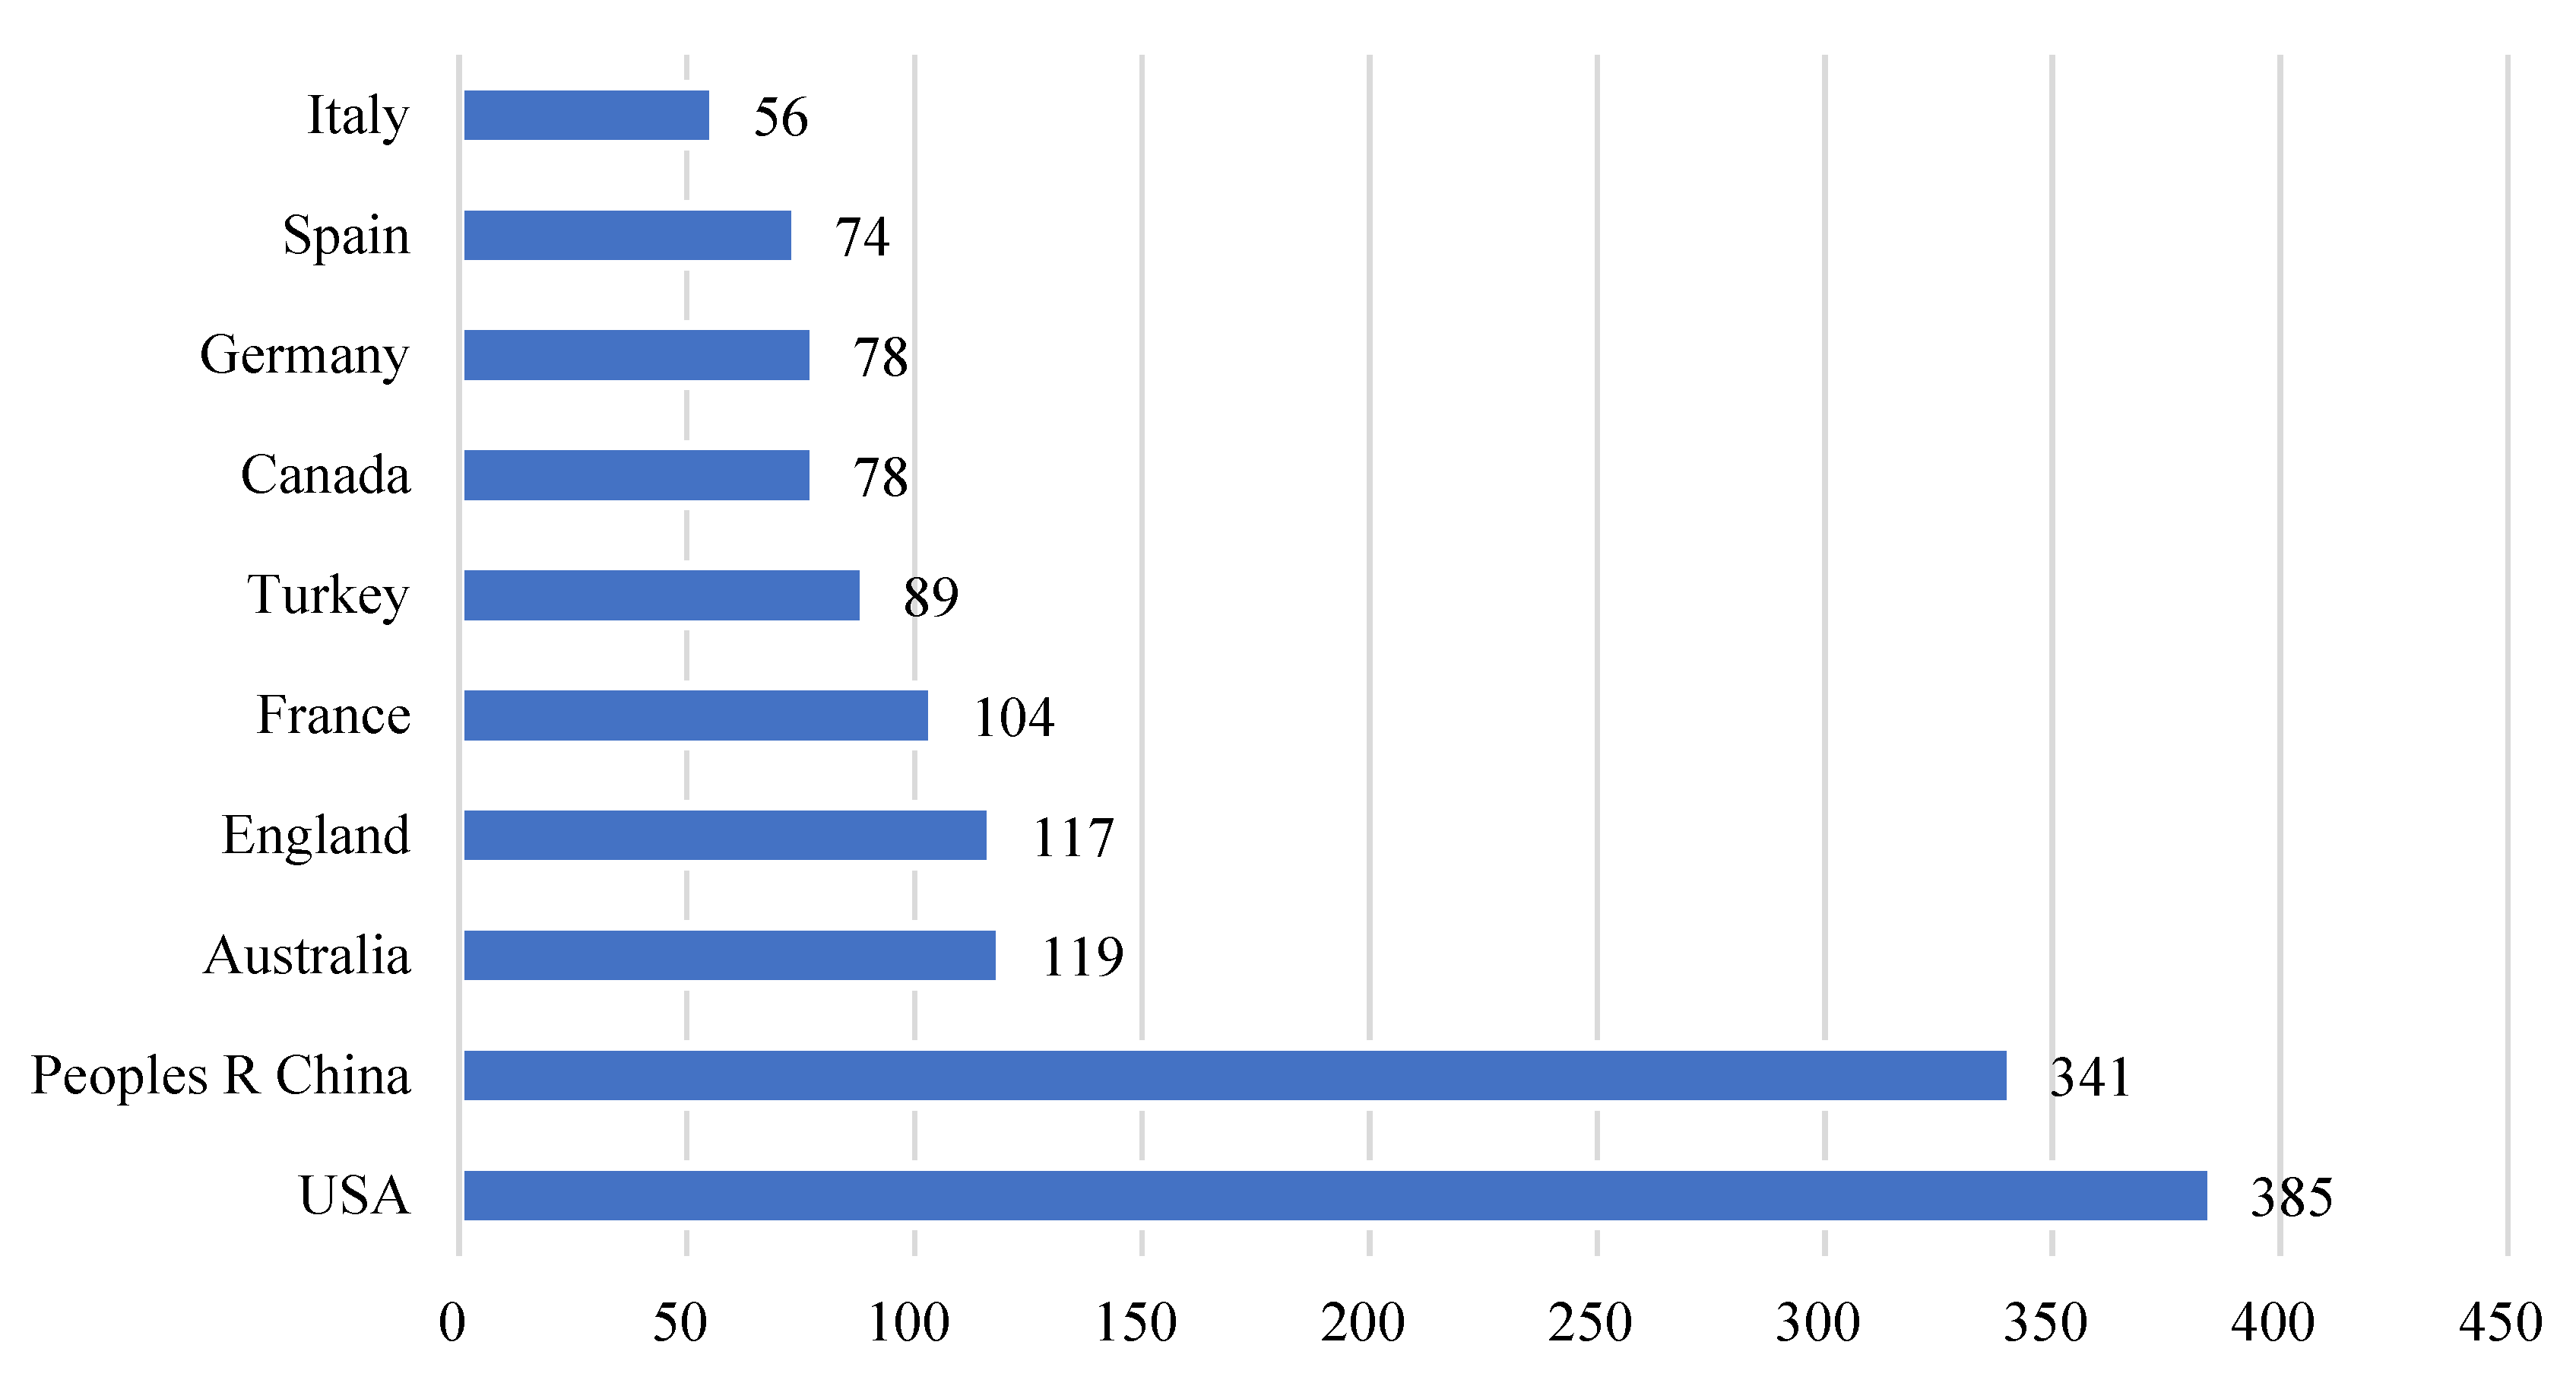
3.3. Research Countries

Figure 3 shows the cooperation network in the country where the first author of the article is located. According to Figure 3, the United States, China, Australia, and France are at the center of the network, forming a relatively close cooperative relationship, and each has cooperation with many other countries. Judging from the average year of publication, the United States, Canada, and other countries started research in this area earlier. While China started late, Chinese authors quickly occupied the sub-center position of this network. Figure 4 summarizes the number of publications in the country of the first author. The United States (385) and China (341) have the largest number of publications. The sum of the number of articles from the two countries accounts for more than one-third of the total publications, followed by Australia (119), England (117), and France (104). The total number of articles by researchers in these five countries accounts for more than one-half of the total.
Next, we focus on the research object of the literature. Extract the names of countries or organizations from the topics, and make statistics in groups of five years to obtain the histogram shown in Figure 5. It can be seen that before the 21st century, scholars paid more attention to the situation in the United States, Gulf Cooperation Council countries, and Britain. After entering the 21st century, scholars’ research enthusiasm for the United States has not diminished. However, they no longer focus on the United Kingdom, but on the overall situation of EU countries. Since 2006, the number of publications in this field has increased sharply (Figure 1); emerging economies such as China and India have entered the research scope of scholars, especially China, which has become the largest research object in this field since 2011. In addition, after 2006, the diversity of research objects has increased, rather than focusing on just a few countries. At the same time, there are also many pieces of literature studying the situation of a group or groups of similar countries, such as oil importing countries, oil exporting countries, emerging economies, etc., or countries in the same region, such as the Middle East, Asia, South Africa, etc.

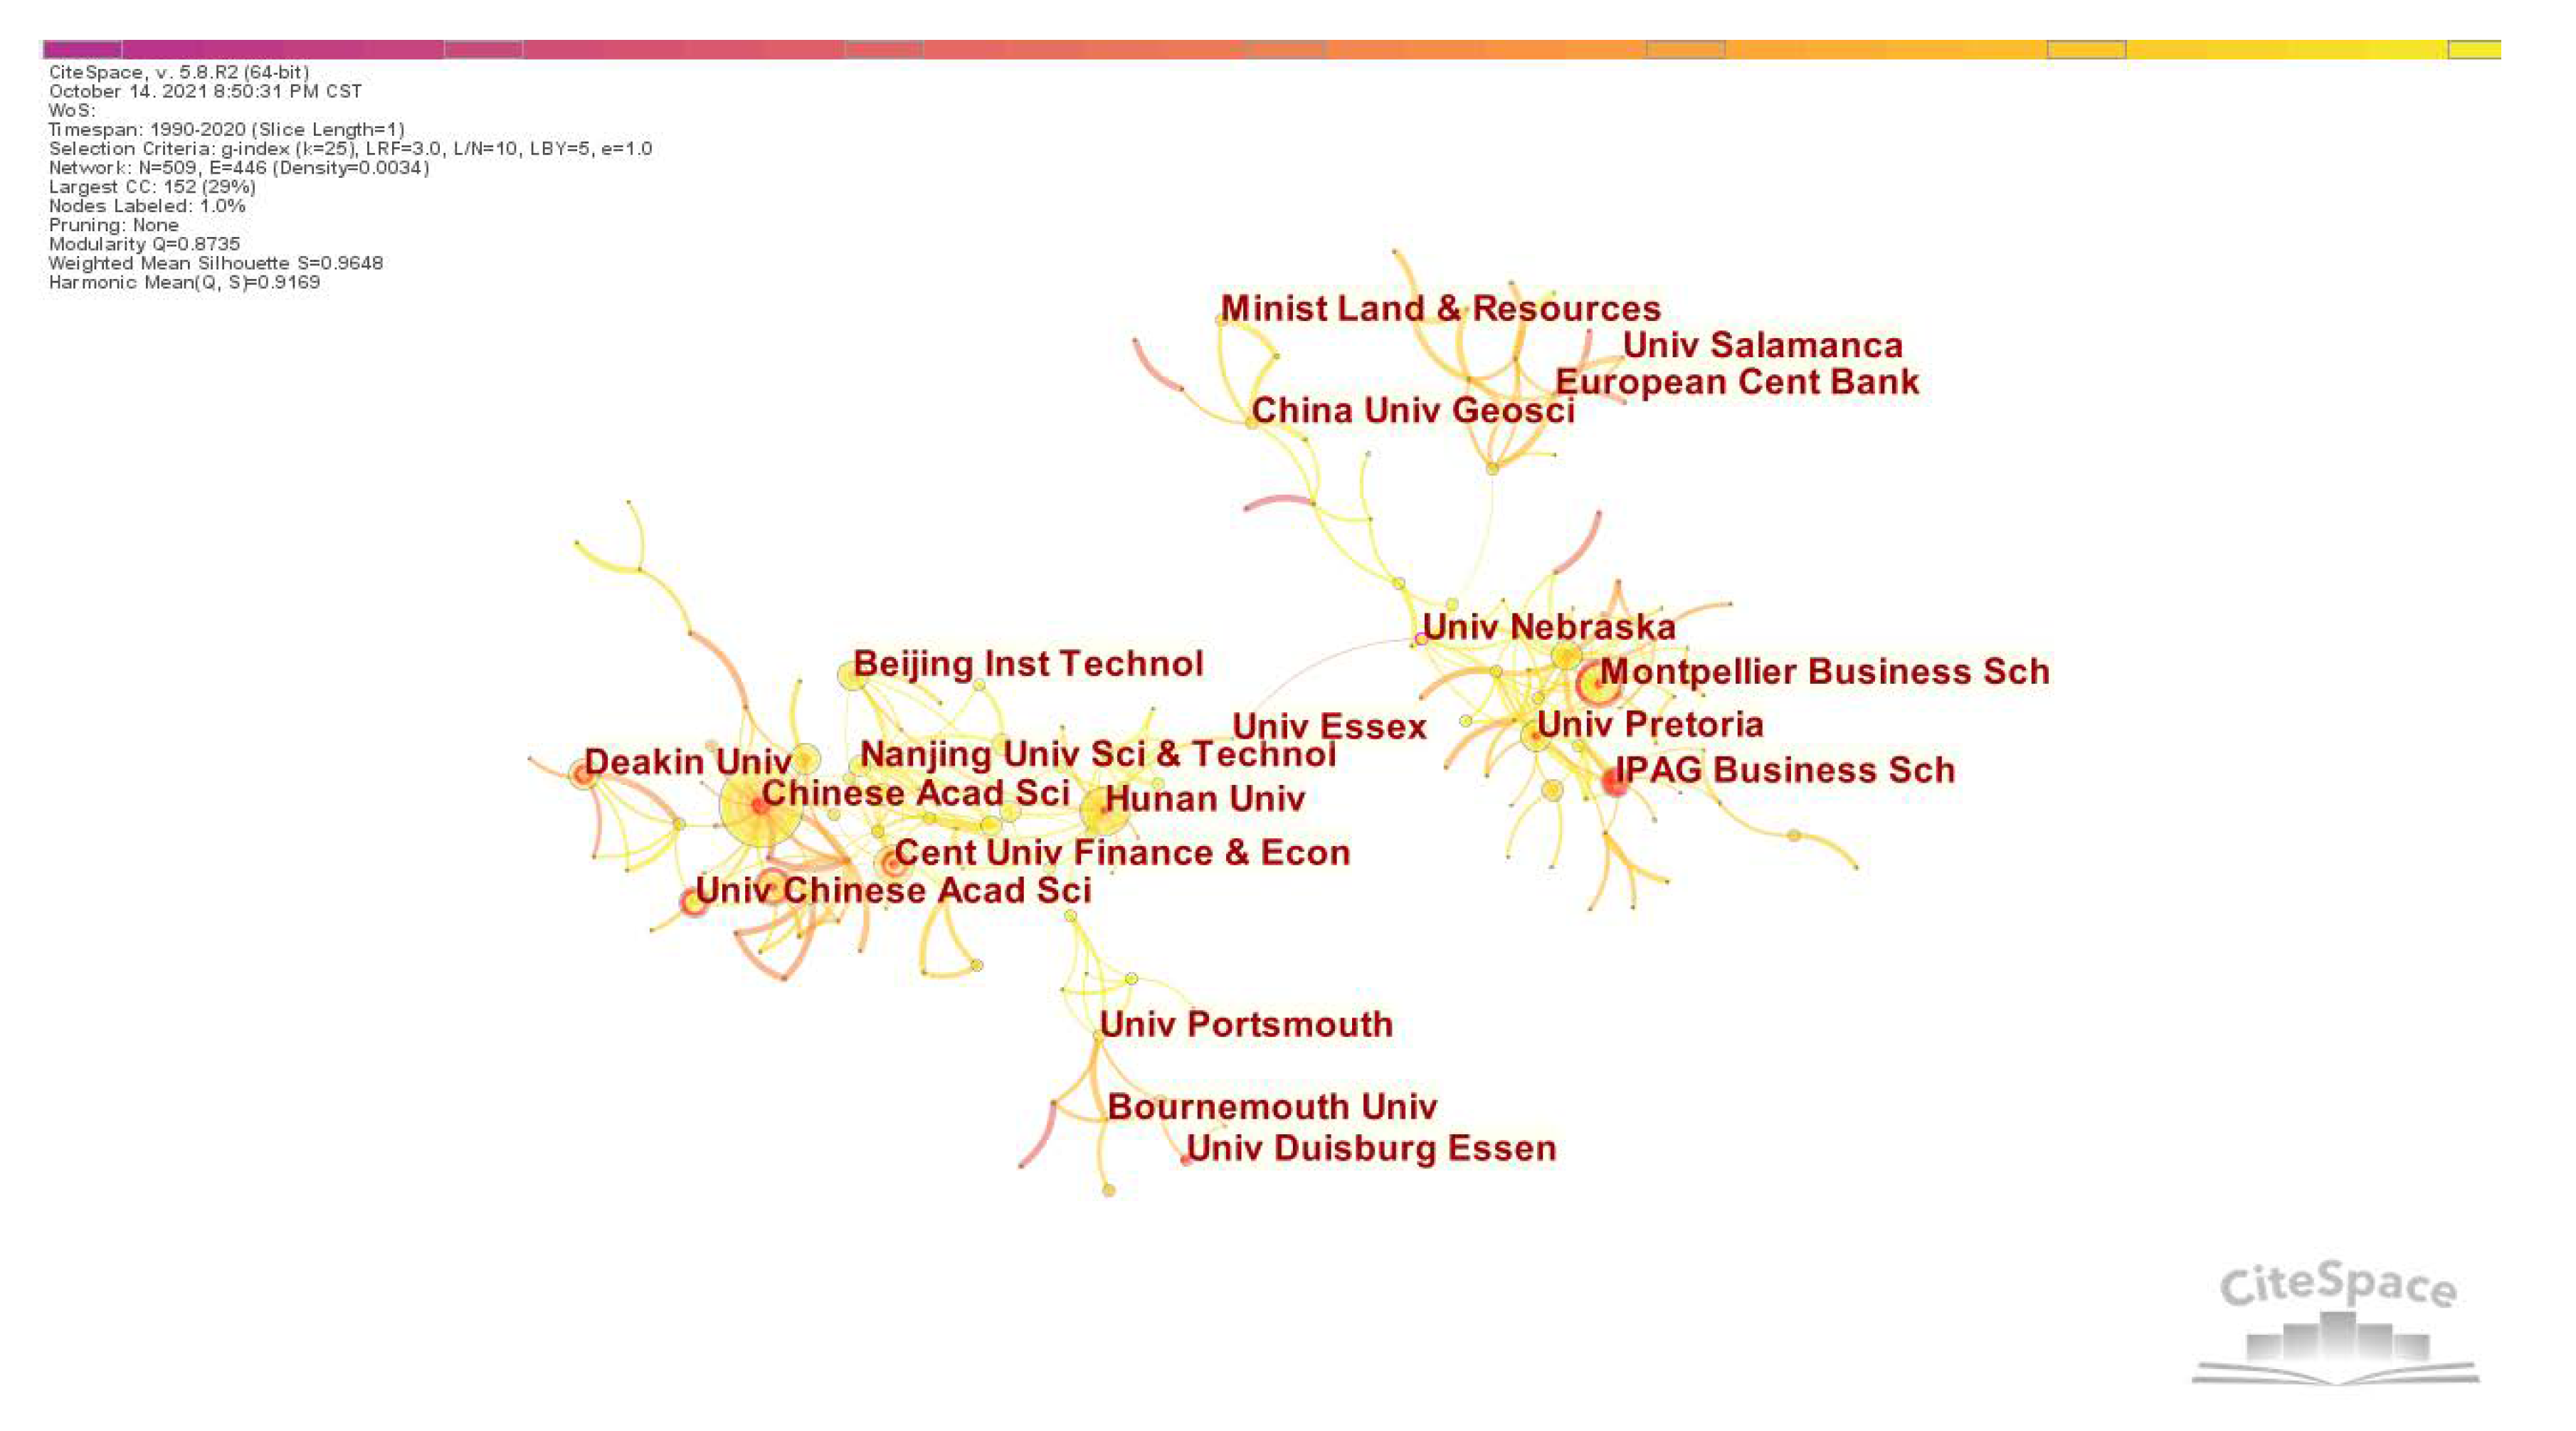
3.4. Analysis of High-Level Scientific Research Institutions

Table 2 shows the top 10 journals based on publications and their main direction in the field of commodity price research. The institution at the forefront is the Chinese Academy of Sciences with 48 articles in total. Hunan University ranks second with 26 publications, followed by Montpellier Business School (21), and the University of Pretoria (20). World Bank, Central University of Finance and Economics, Beijing Institute of Technology, and Drexel University have the same amount of articles (18). In regional distribution, half of the top ten institutions are from China, whose research directions mainly focus on the prediction of crude oil prices, and the linkage between crude oil prices and the stock market. Two institutions are located in France and one institution in South Africa. The World Bank put its research focus on food security and food price crises.
In addition, we can observe the cooperative relationship between institutions (Figure 6). The current research basically forms a cooperative network centered on the Chinese Academy of Sciences, Hunan University, and Montpellier Business School. The Chinese Academy of Sciences has a close cooperative relationship with the University of Chinese Academy of Sciences, as well as with Xiamen University and Beihang University. Hunan University cooperates with the Beijing Institute of Technology and other institutions, and this forms a sub-network. In other regions, the cooperation network centered on Montpellier Business School and on the University of Pretoria has also strengthened. This cooperation network and the cooperation network centered on Hunan University are connected through the University of Nebraska and the University of Essex.

3.5. Analysis of Core Authors

A core author, meaning a researcher with more output and greater influence in a specific research field, can be determined using Price’s law in bibliometrics [18], which is expressed as:
M = 0.749 N m a x
where N m a x is the maximum number of published papers among all the authors, and M is the minimum number of published papers to determine the core author; that is, the number of published papers is M or more than M to determine a core author.
Among the sample documents searched in this study, the scholars who published the largest number of papers have 18 articles; thus, N m a x = 18 , and M is 4 at this time for determining the core authors as being those who have published more than four papers.
Table 3 shows that, in our sample, there are 52 core authors in the field who have published 370 articles in total, accounting for 30.53% of the published articles in the sample. Wang has published the most articles, 18 in all. The article “Forecasting crude oil price with an EMD-based neural network ensemble learning paradigm”, which he collaborated on with Yu, had been cited 387 times by the end of 2020. This article uniquely proposed a neural network integration paradigm based on the empirical mode decomposition (EMD) method for the decomposition and prediction of crude oil prices, which is considered a foundational achievement in the research field of commodity prices.
Regarding the cooperative relationship of the core authors (Figure 7), a cooperative network with Wang as the core, and Tiwari, Hammoudeh, and Gupta as another core, is formed. Wang and Lai have the closest partnership, followed by Yu and Tang. The cooperation network with Tiwari, Hammoudeh, and Gupta as the core is the largest cooperation network in the current research field.
Scholars’ educational and academic backgrounds will affect their research interests to a great extent. Tiwari is an assistant professor of Economics at the Indian Institute of Management Bodh Gaya (IIMBG) in the Department of Economics and Business Environment. Tiwari is good at using wavelet analysis, and his research fields focus on macroeconomics, the oil market, the stock market, etc. Therefore, in the study of commodity prices, he mainly focuses on the relationship between oil prices and other variables, such as the exchange rate, the stock market, etc. Hammoudeh is a professor of Economics and International Business at Drexel University. He is well-known for his oil, gold, and financial market research. Gupta is a professor at the University of Pretoria in the Department of Economics, who has a certain degree of mathematical background and prefers the econometric research of time series. Therefore, in the field of commodity price research, he is mainly data-driven and focuses on crude oil price prediction. The three scholars all pay attention to the research on commodity prices; however, their research focuses and methods have different emphases, forming a complementary and stable cooperation network.
Wang is a distinguished researcher at the Chinese Academy of Sciences, Yu is a Professor at the Beijing University of Chemical Technology, and Tang is a Professor at the Beijing University of Aeronautics and Astronautics. Both Yu and Tang are Wang’s students. Therefore, the three scholars have a closer cooperation relationship and a single research direction compared with the above cooperation network. Wang and Yu first proposed the EMD method to decompose crude oil prices and focused on the prediction of crude oil prices.
Overall, the research on commodity prices has experienced a boom period, attracting interest from many scholars interested in this research field, especially in exploring crude oil price trends. Scholars represented by Wang, Tiwari, Hammoudeh, and Gupta have produced a batch of high-quality documents and have gradually formed a stable network of cooperative relations. Regarding the research content, the overall difference between Eastern and Western scholars is not large, and the key lies in scholars’ academic backgrounds and research interests.

4. Co-Citation Analysis of Commodity Prices

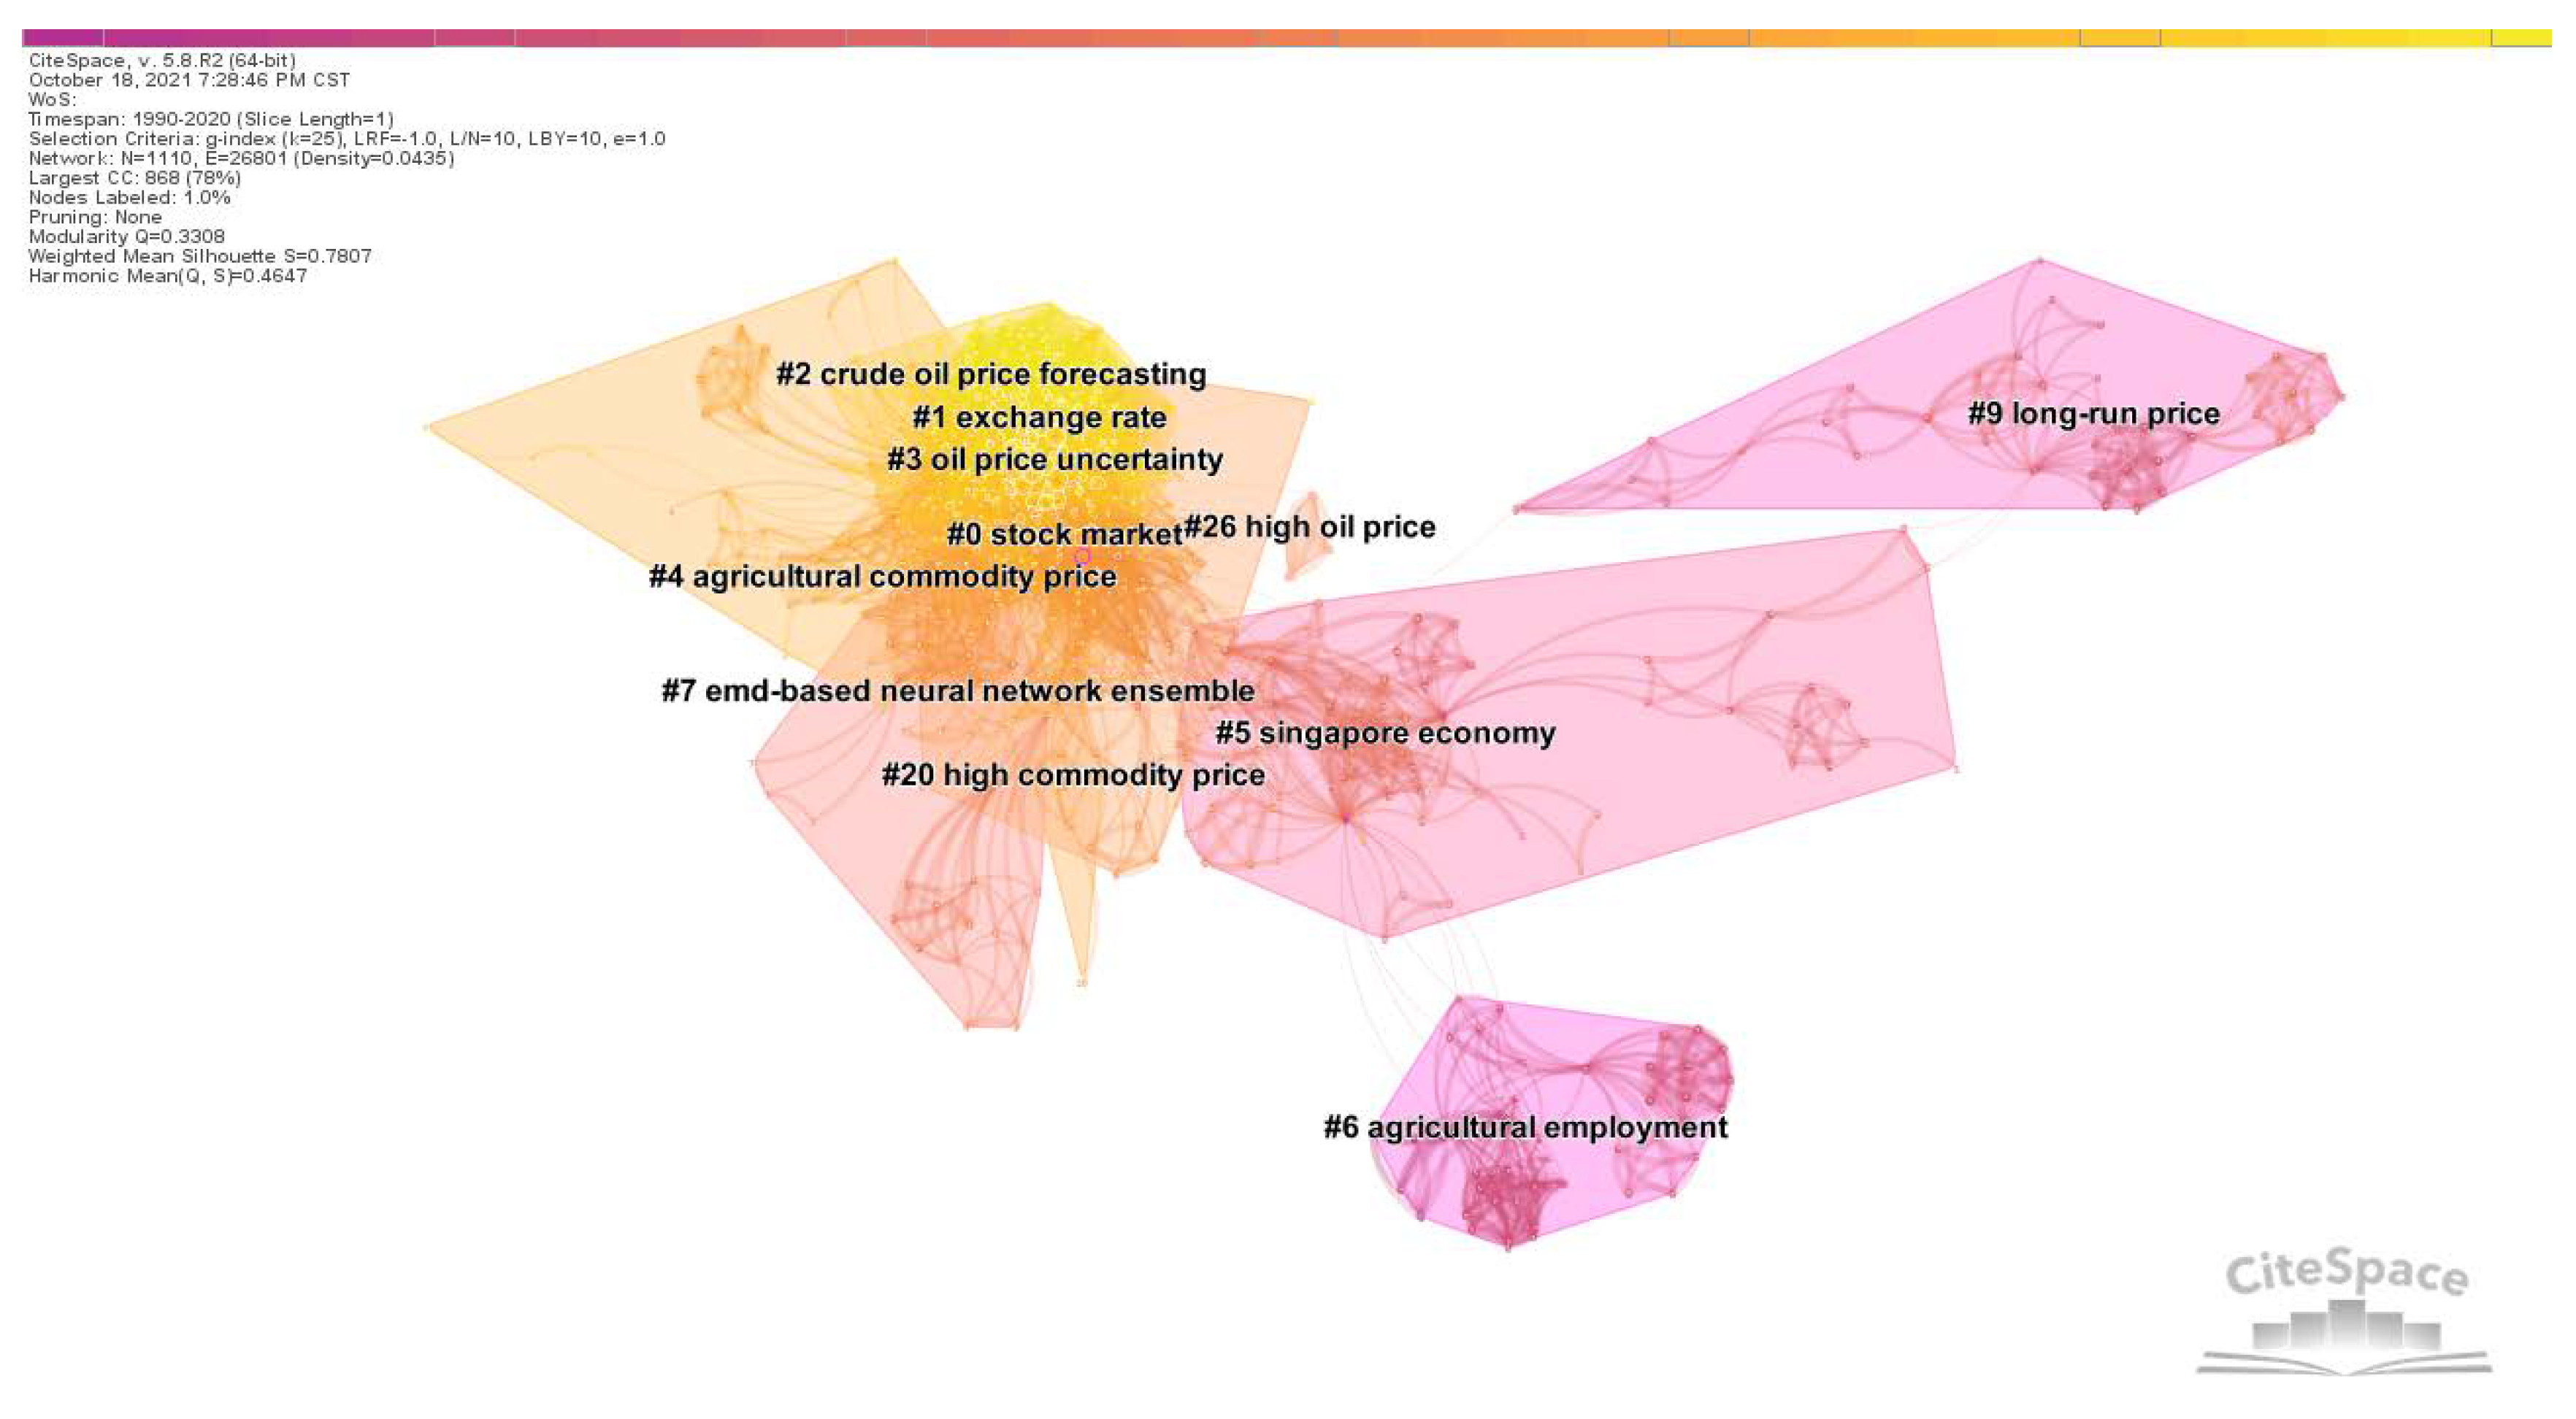
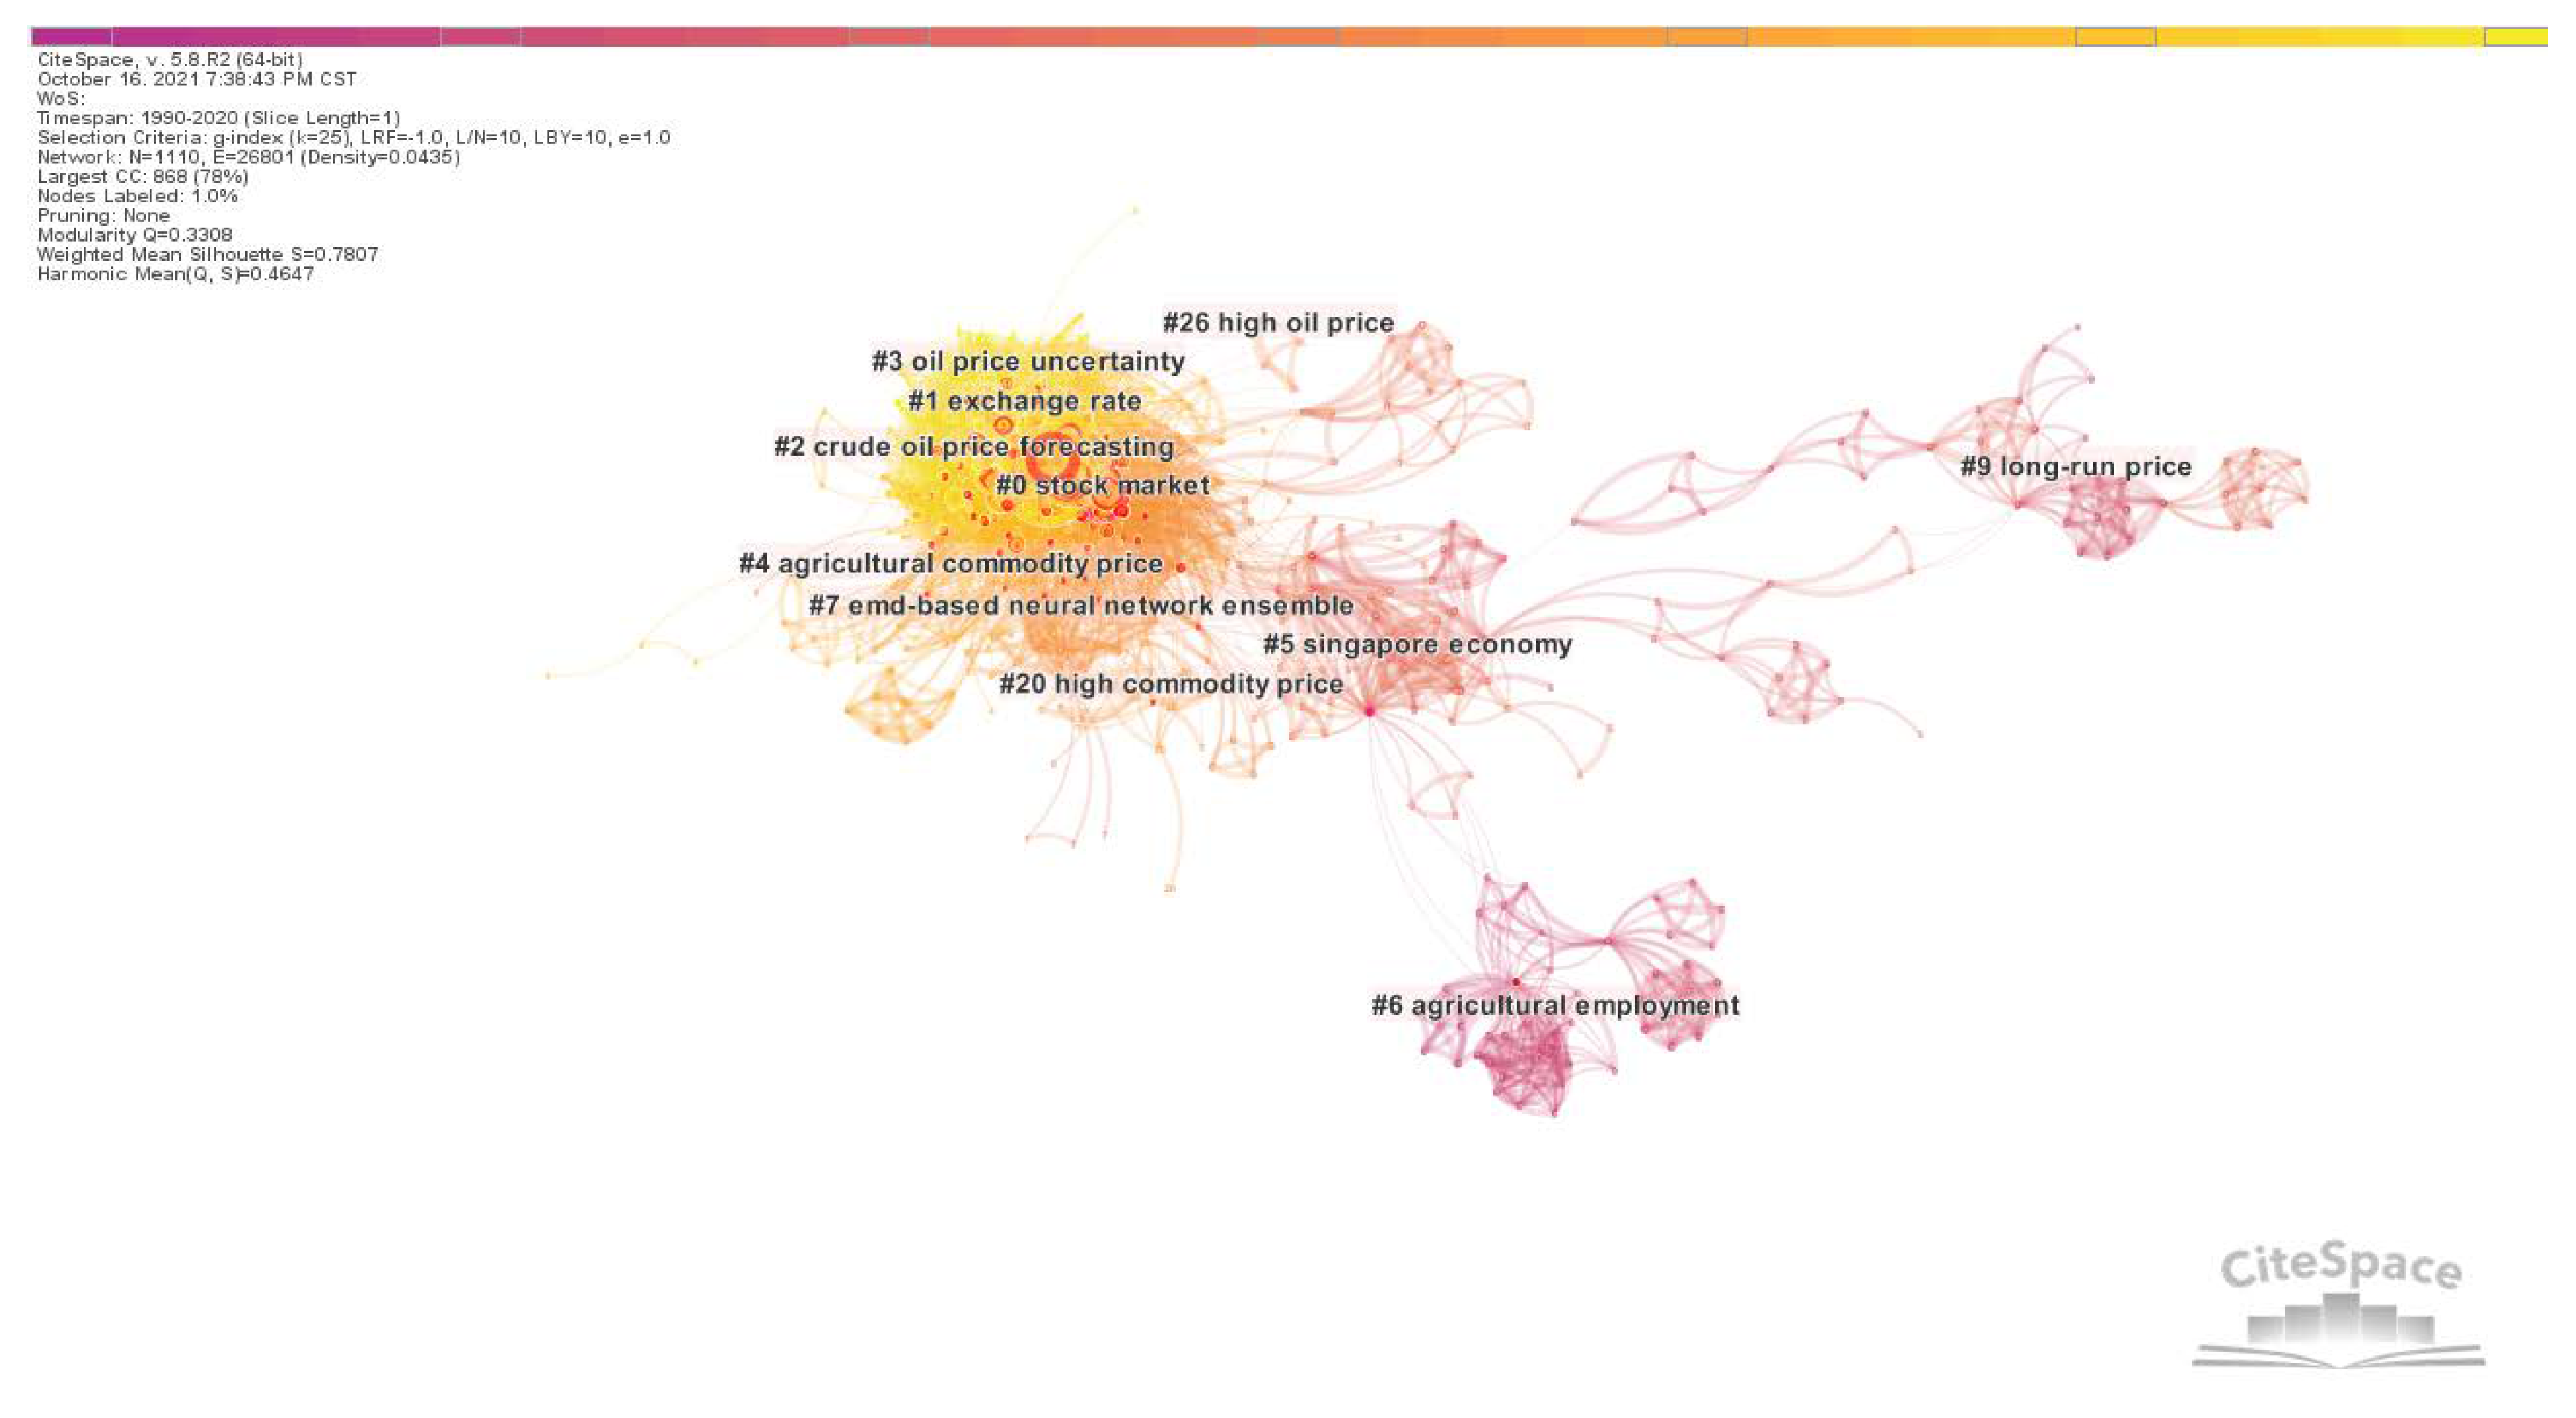
4.1. Cluster Analysis of Co-Cited Articles

If two articles appear together in the reference list of the third citing document, these two references form a co-citation relationship. If the two documents are cited by n documents together, the number of co-citations is n times. According to co-citation analysis, the degree of correlation between documents can be measured, and the collection of documents can be classified according to the degree of correlation, after which a cluster analysis network diagram of professional papers in that discipline can be generated. In Figure 8, showing the co-citation network of sample articles, node size in the graph indicates the frequency of citations. The higher the frequency of citations, the larger the nodes. The connection between two nodes designates these two documents have been cited together. Indicating a change in the research direction, the color of the infographic changed from dark to light over the 1990 to 2020 period, and the research focus expanded from an agricultural commodity price and oil price dynamic to an oil price prediction and financialization.
In Table 4, which depicts a summary of each cluster’s details, cluster size represents the number of articles it includes. Silhouette is a parameter proposed by Kaufman and Rousseeuw in 1990 to evaluate the effect of clustering through network homogeneity [19]. The Silhouette value lies between 0–1, and the closer it is to 1, the higher the homogeneity of the network and the higher the credibility of clustering. The publication year is the average publication time of articles in this cluster. According to Table 4, the largest clusters are Cluster #0, #1, #2, #3, and #4. Their articles focus on the exploration of the correlation between commodity prices and the stock market, the exchange rate, oil price uncertainty, and crude oil price forecasting. In addition, most clusters’ Silhouette values are above 0.7, indicating that these clusters are highly homogeneous and highly reliable.
The citation network and cluster analysis show that the research hotspots of commodity prices focus on influencing factors, impacts on macroeconomy, price forecasts, and commodity financialization; moreover, these hotspots form a research network centered on oil prices. The detailed discussion is shown in Table 5:
(1)
Influencing factors of commodity prices (Cluster #1, #9, #20, #26)
The influencing factors of commodity price fluctuations have been widely focused on by many scholars. The contradiction between supply–demand and inventory change are generally considered the basic factors affecting international commodity price fluctuations. Since the operation of the global economy is fundamental to commodity supply and demand, but financial markets can have a spillover effect into the commodity market, the coordinated change of commodity prices becomes a goalpost for planners. Speculative factors have pushed up the prices of major commodities in the past, making the strong demand from emerging economies another reason for the overall rise in commodity prices. Factors including natural disasters, cyclical changes in production, and policy adjustments also considerably impact commodity prices. Differences in national economic systems also lead to differences in commodity prices between countries. The economic system affects the speed and strength of the transmission of international commodity prices to domestic commodity prices, and ultimately reflects in domestic prices.
A substantial increase or decrease in commodity prices frequently results from a combination of multiple factors. Hamilton [20] studied some factors leading to changes in crude oil prices, including supply and demand, commodity speculation, monopolistic oligarchs, and resource depletion. Mueller et al. [21], analyzing the reasons why food prices doubled in the world from March 2007 to March 2008, found multiple factors, including greater energy and fertilizer costs, increased financial speculation in commodity markets, export restrictions, dollar depreciation, biofuel production increase, poor harvests, reduced world food reserves, increased foreign exchange reserves, and the continuing increase in world population and expectations of affluence.
Academic circles have continuously analyzed the factors affecting commodity price fluctuations. Ranging from the basics of supply and demand to the impact of financial speculation and analysis of interruptive events, and from linear to nonlinear, the research in these directions continues to deepen comprehensively [22,23,24,25,26,27,28,29].
(2)
The impact of commodity price fluctuations on macro economy (Cluster #3, #4, #5, #6)
The impact of commodity price fluctuations on the macroeconomy is another noteworthy research direction that has developed to a great extent.
Building on the foundational work of Hamilton [30] four decades ago, scholars have segued to study the oil price–economic growth relationship [31,32,33,34] or taken up nonlinear perspective considerations [35,36,37]. Important in international trade, the relationship between commodity prices and exchange rates has also received key attention. Chen [38] used monthly panel data from G7 countries to study the long-term relationship between oil prices and real exchange rates, and found that a co-integration relationship between them and oil prices can better predict exchange rate trends. Other literature uses models such as the vector autoregressive model (VAR) and generalized autoregressive conditional heteroskedasticity model (GARCH) to select different countries as research objects to explore the relationship between commodity prices and exchange rates [39,40,41,42,43,44,45,46].
The unemployment rate and consumer price (CPI) are also variables of concern. Papapetrou [47] used the VAR model to explore the relationship between oil prices and several macroeconomic variables in Greece, and found that changes in oil prices affect actual economic activities and employment. Ewing and Thompson [48] used Hodrick–Prescott and Baxter–King filters, and a full-sample asymmetric Christiano–Fitzgerald band-pass filter, to study the cyclical linkage between crude oil prices and production, consumer prices, unemployment, and stock prices. Guerrero-Escobar et al. [49] used 17 highly heterogeneous countries as samples to study responses of industrial activity, inflation, interest rates, and exchange rates to oil price shocks.
The impact of commodity prices on sustainable development has received increasing attention in recent years, mainly energy prices. Borzuei et al. [8] used a threshold model to study the impact of energy prices on Iran’s sustainable development under different economic growth regimes, which is mainly achieved by promoting the use of renewable energy. Similarly, Li and Leung [50], Mukhtarov et al. [51], Karacan et al. [52], and Mukhtarov et al. [53] confirmed the role of energy prices on renewable energy consumption, and further affects the achievement of sustainable development goals. Umar et al. [54] found that effective energy price policies can reduce carbon emissions and achieve SDGs; Ma et al. [55], Sha et al. [56], Lee and Chong [57], Guo et al. [58], Malik et al. [59], and Ike et al. [60] also confirmed the same point.
(3)
Commodity price forecast (Cluster #2, #7)
The drastic fluctuations in commodity prices have attracted many scholars to study commodity price forecasting. When the prices of commodities are relatively stable, forecasting pays more attention to the general trend of prices and the overall price range, that is, the first-order moment of prices. But when commodity prices fluctuate wildly, forecasting needs to focus on the degree of price volatility, that is, the second-order moment of prices.
At present, there are mainly three methods to forecast commodity prices: (1) traditional econometric models, such as the autoregressive moving average model (ARMA), autoregressive integrated moving average model (ARIMA), and generalized autoregressive conditional heteroskedasticity model (GARCH); (2) machine learning methods, such as support vector machines (SVM), artificial neural networks (ANN), and Random Forest (RF); and (3) hybrid models combining the above two methods [61]. Traditional econometric models are based on strict linear assumptions and cannot introduce too many independent variables. Machine learning methods, because they can effectively distinguish random factors and capture hidden nonlinear characteristics that traditional econometric models fail to do, can introduce more independent variables to maximize the control of influencing factors.
For the traditional econometric models, some scholars have proposed improved models for commodity price prediction. Herrera et al. [62] used high-frequency intra-day realized volatility data to evaluate the relative prediction performance of various models, including risk measurement models, the GARCH model, asymmetric GARCH model, split-integral GARCH model, and Markov transformed GARCH model. Gupta and Wohar [63] used a qualitative vector autoregressive to predict monthly returns of oil and stocks. Based on the GARCH-X model, Gavriilidis et al. [64] used oil shocks of unknown sources as exogenous variables to study their impact on the accuracy of spot price predictions.
For machine learning methods, scholars have attempted to decompose the sequence through singular spectrum analysis (SSA) or empirical mode decomposition (EMD), predict the decomposed sequence, and finally synthesize the prediction of the original sequence. Yu and Wang [65] proposed a neural network ensemble learning paradigm based on EMD for the forecast of world crude oil spot prices. Wang and Li [66] proposed SSA-NN, a neural network prediction method based on SSA smoothing, and used four criteria to compare the performance of this model with the basic neural network model. Their results show that the SSA-NN model is superior to the basic neural network model in terms of performance and accuracy to capture trend changes.
More scholars have focused on innovating on basic machine learning methods to improve prediction accuracy. For example, Huang and Wu [61] used deep multi-core learning (DMKL) to predict oil prices, verified that the model was superior to the traditional model through real data, and significantly reduced prediction errors. Zhang and Na [67] proposed an agricultural product price prediction model that combines fuzzy information granulation, a mind evolutionary algorithm (MEA), and a support vector machine (SVM). Their experiments proved that the model has a higher prediction accuracy and faster calculation speed.
In the hybrid model, many models combine the advantages of measurement models and machine learning to improve prediction accuracy. Zhang et al. [68] proposed the EEMD–PSO–LSSVM–GARCH hybrid model to predict oil prices. Kristjanpoller and Minutolo [69] used the ANN-GARCH model to predict oil spot and future prices, and successfully improved that prediction model in terms of volatility and spot prices.
(4)
Financialization of commodities (Cluster #0)
As a foundational study on the relationship between commodity prices and financial markets, Sadorsky [70] adopted the VAR model that incorporated monthly data from January 1947 to April 1996 in the United States. It was found that the shocks of oil prices would significantly affect the actual returns of stocks, and this effect was more pronounced in 1986. Afterward, scholars have chosen various research objects and different time periods to analyze the impact of commodity price changes on stock price changes or stock returns [47,71,72,73,74,75,76,77].
The 2006–2008 food crisis and the 2008 global financial crisis caused violent fluctuations in commodity prices. This led the academic community to conclude that basic supply and demand factors alone could not explain drastic changes in prices in a short period of time, sensing some of the change could be attributed to financial factors, such as the financialization of commodities, that is, significant index investment flows into commodity markets. Morana [78] found that since 2000, financial shocks have played an important role in boosting oil prices, and this effect has become more pronounced after 2008. Tilton [79] studied the impact of investor demand on commodity spot prices and predicted that, if the futures market is strong, a surge in investor demand will increase the price of the futures market and directly affect spot market price. However, when the futures market is relatively weak, investor behavior would have little impact on spot prices. The financialization of commodity markets has also resulted in excessive linkages between commodity prices [80].
It can be seen that the research methods of these hot spots are constantly changing, which is mainly attributed to the arrival of the era of big data, the rapid development of machine learning for big data analysis, and the changes in the operation of the world economy. The volume, velocity, variety, and veracity of big data mean that the research data can be full samples or close to full samples, which makes the obtained information more valuable than traditional information; it also makes timely data analysis and prediction possible. Compared with statistical parameter modeling, machine learning methods do not need to give specific model assumptions or restrictions; rather, they learn and predict by an algorithm according to the objective function, making it more common and flexible [81]. On the other hand, practice affects the direction of theoretical research to a great extent. After the 2008 financial crisis, the degree of financialization of bulk commodities continued to deepen, and they were more vulnerable to emergencies and other market fluctuations. Therefore, scholars began to introduce the research methods of financial markets into the bulk commodity market, and pay attention to the volatility and linkage of bulk commodity prices.
Table 5. Summary of research hotspots.
Research HotspotsRepresentative ArticlesMain Research Content
Influencing factors of commodity pricesHamilton (2009) [20]
Dube and Vargas (2013) [25]
Zhang et al. (2009) [29]
  • Supply and demand
  • Speculative factors
  • Extreme event
The impact of commodity price fluctuations on macroeconomyHamilton (1983) [30]
Jiménez-Rodríguez (2005) [33]
Lardic and Mignon (2006) [34]
Ji et al. (2019) [42]
Wu et al. (2012) [46]
  • Economic Growth
  • Exchange rate
  • Consumer price
  • Unemployment rate
Commodity price forecastYu et al. (2008) [65]
Zhang et al. (2015) [68]
Jammazi and Aloui (2012) [82]
Zhao et al. (2017) [83]
  • Econometric model
  • Machine learning methods
  • Mixed model
Financialization of commoditiesSadorsky (1999) [70]
Kilian and Park (2009) [74]
Filis et al. (2011) [84]
Sim and Zhou (2015) [85]
  • Linkage with the stock market
  • Investor sentiment

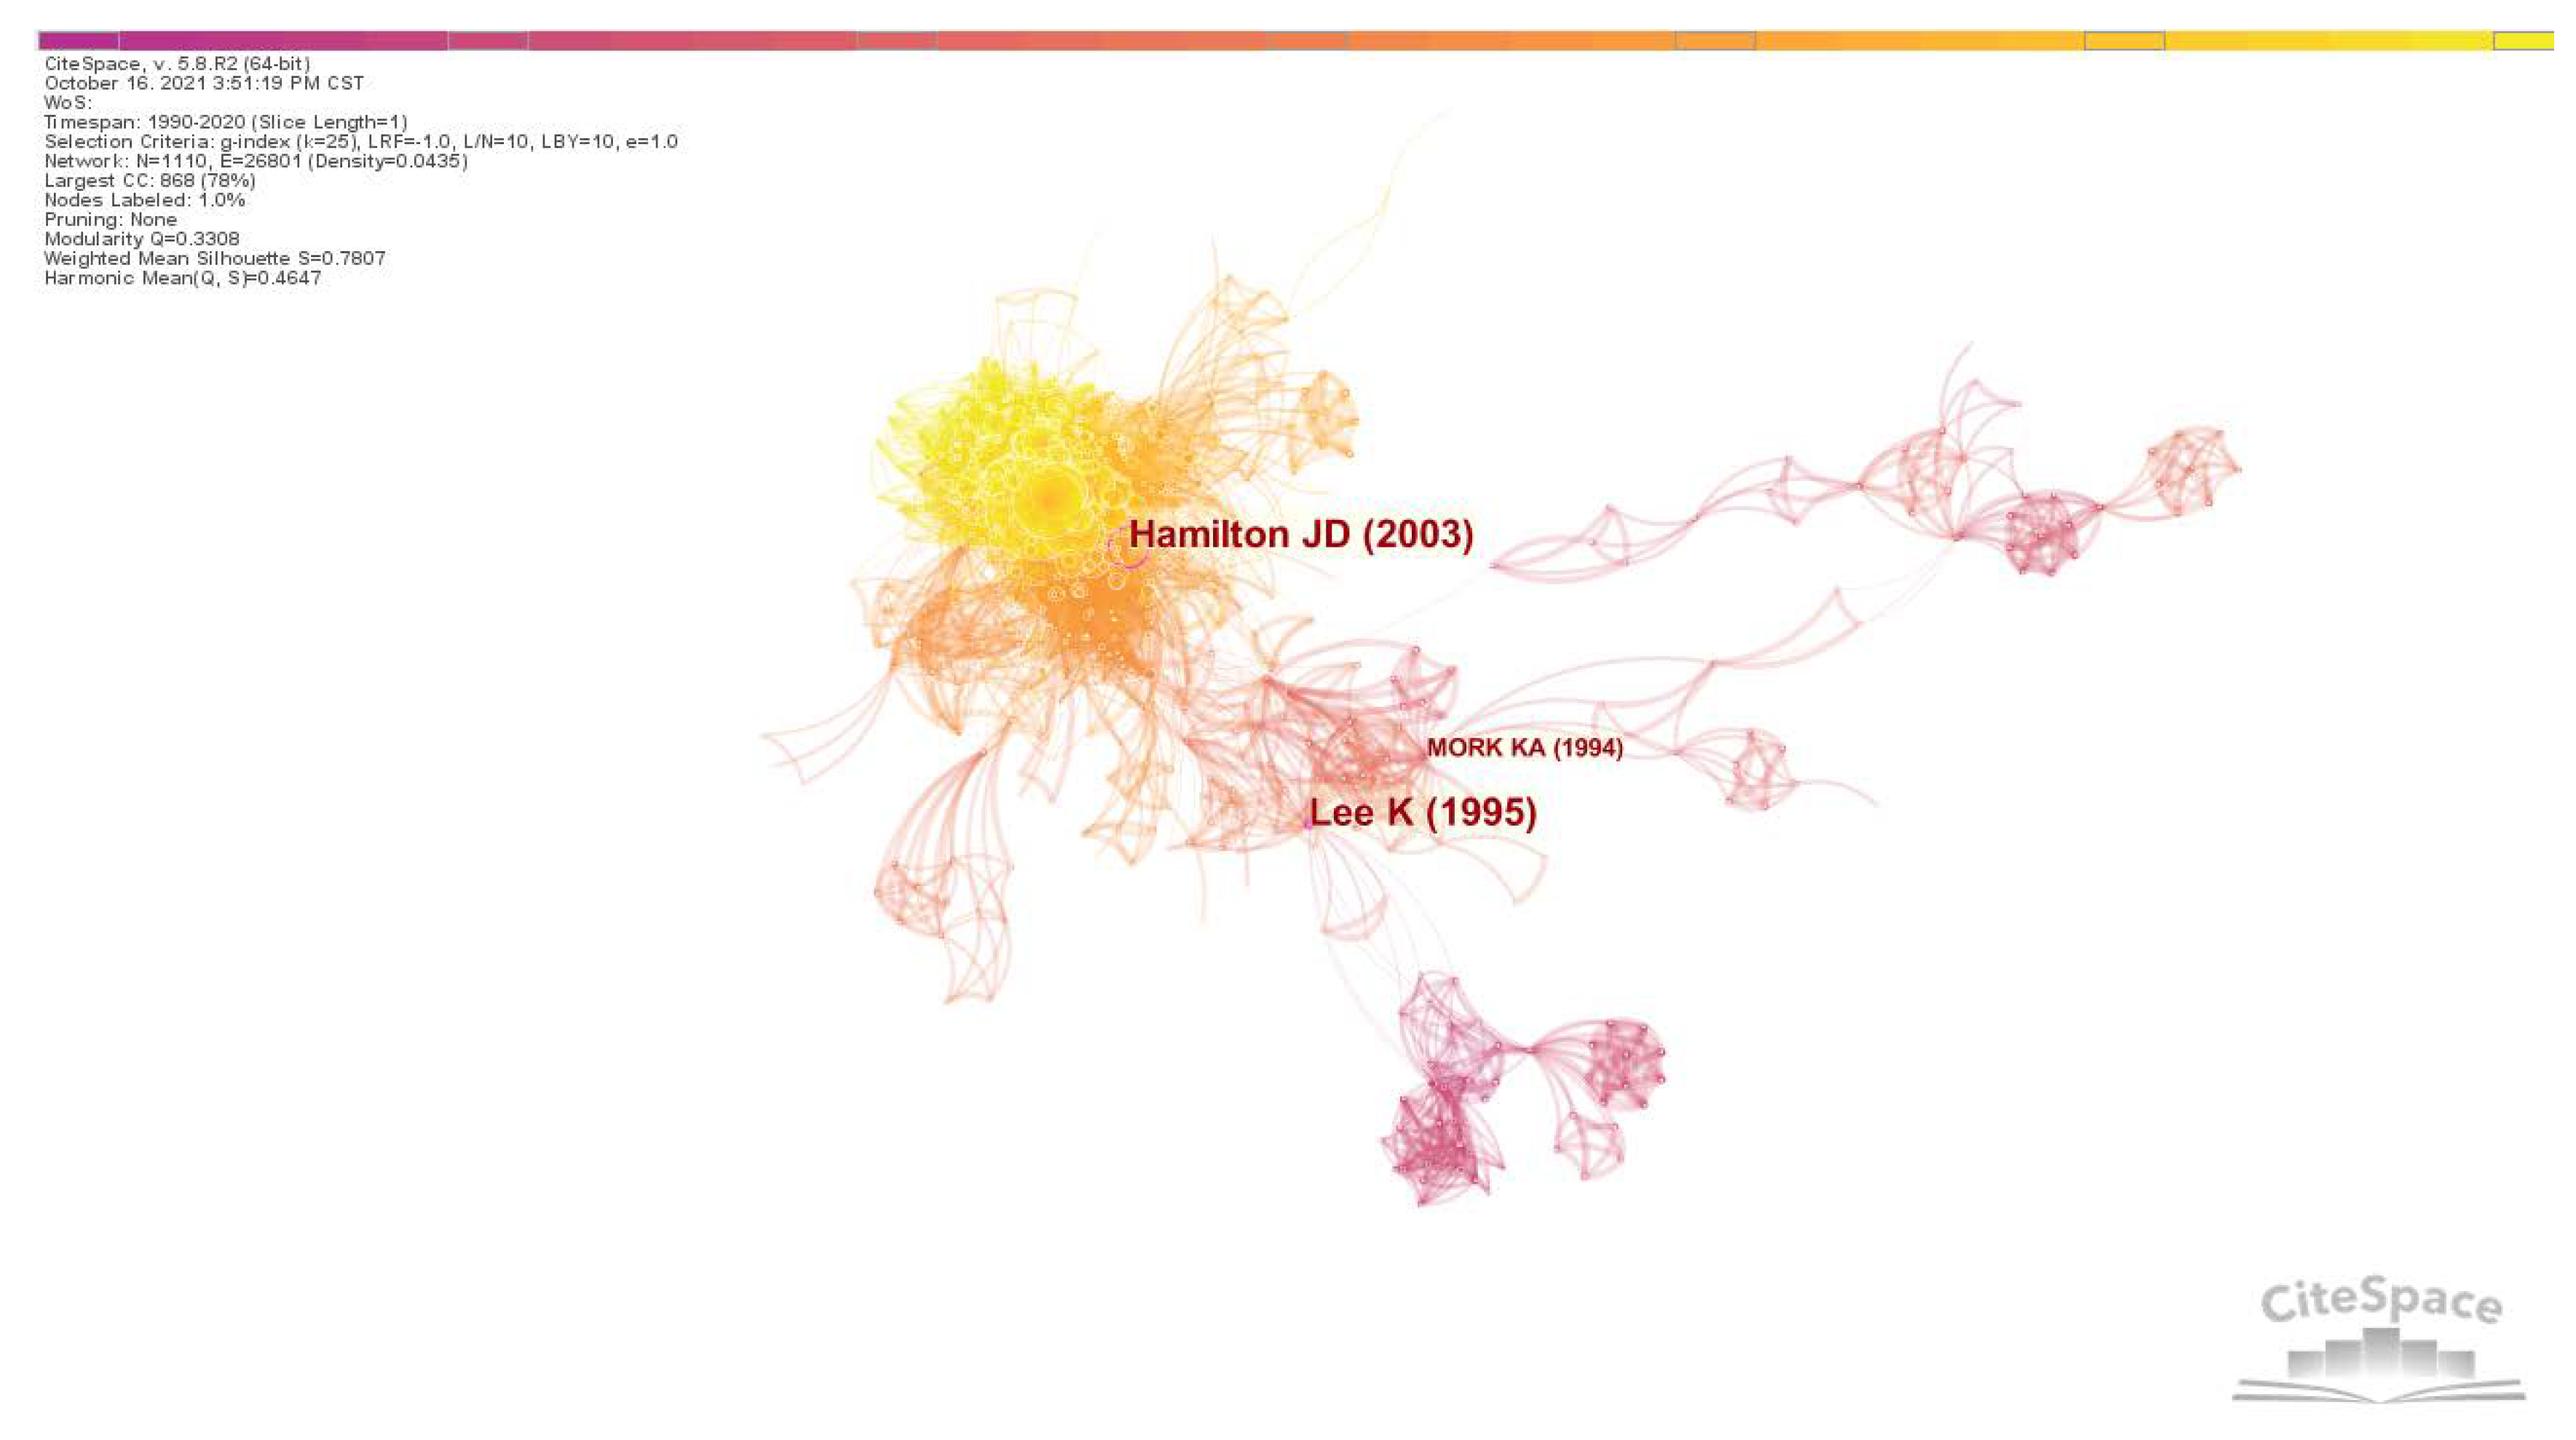
4.2. Analysis of Landmark and Pivot Nodes

The landmark node and pivot node are the key objects in citation network analysis. Identifying landmark points and turning points in the citation network can grasp the evolution path of the discipline and yield important research results. The landmark node is a nodule with a larger radius in the co-citation network and a higher citation frequency, and signals this is a representative article in the development of the discipline. The pivot node is the only connection point between the two clusters, which represents the shift of research focus. The landmark node and pivot node are highlighted with purple circles in the visualization results of the citation network (Figure 9).
The solid arrows in Figure 9 represent the pivot node of the citation network, and the dashed arrow points to the landmark node of the citation network. Table 6 counts the pivot nodes, landmark nodes, and highly cited articles in the citation network.
As shown in Figure 9 and Table 6, Lee et al. [86] and Mork et al. [87] are pivot nodes in the co-citation network. Lee et al. [86] studied the impact of oil price changes on the real GNP. Rather than a simple overall change, this oil price variation is a breakdown of unexpected components beyond predictions and conditional variances in response to time changes. In particular, they found that rising oil prices would affect economic growth, while a decline will not. Mork et al. [87] studied oil price shocks in seven OECD countries and their asymmetric effects on GDP. The conclusions of these two articles are consistent with Hamilton [30]. Similarly, landmark node Hamilton [88] continued his previous research studying the nonlinear relationship between changes in oil prices and economic growth; he found that rising oil prices will affect the economy, but not falling prices. This research series made a groundbreaking contribution.
In highly cited literature, Kilian [74] pioneered the decomposition of oil price shocks to explain the phenomenon of large oil price fluctuations. The linkage between oil prices and the stock market has also been extensively studied [76,89,90,91]. Kilian and Murphy [91] explored the effect of speculative demand on the soaring oil price, and the other three articles mentioned here studied the impact of oil price changes on stock market returns from different perspectives.
Table 6. Citation network landmarks, turning points, and highly cited articles.
AuthorTitleJournalCited
Frequency
Cluster ID
Pivot node
Lee et al.
(1995) [86]
Oil shocks and the macroeconomy: The role of price variabilityThe Energy Journal24#5
Mork et al. (1994) [87]Macroeconomic responses to oil price increases and decreases in seven OECD countriesThe Energy Journal23#5
Landmark node
Hamilton (2003) [88]What is an oil shock?Journal of Econometrics78#0
Highly cited articles
Kilian (2009) [74]Not all oil price shocks are alike: Disentangling demand and supply shocks in the crude oil marketAmerican Economic Review295#0
Kilian and Park (2009) [90]The impact of oil price shocks on the US stock marketInternational Economic Review158#1
Park and Ratti (2008) [76]Oil price shocks and stock markets in the US and 13 European countriesEnergy Economics115#0
Kilian and Murphy (2014) [91]The role of inventories and speculative trading in the global market for crude oilJournal of Applied Econometrics113#2
Basher et al.
(2012) [89]
Oil prices, stock returns and emerging stock marketsEnergy Economics89#1

4.3. Analysis of References with Citation Bursts

Burst monitoring is a powerful tool for exploring hot topics. Finding burst articles can help to quickly identify emerging academic fields and research trends in a discipline such as commodity prices.
In Figure 10, citation bursts identify that the stock market (Clusters #0), exchange rate (Clusters #1), crude oil price forecasting (Clusters #2), oil price uncertainty (Clusters #3), and agricultural commodity price (Clusters #4) are the hottest research sub-fields given the number of references with citation bursts. This is consistent with our previous clustering research findings.
Table 7 presents the top 10 references with the strongest citation bursts. The burst period of each reference is highlighted in red in the timeline from 1990 to 2020. Most of these papers have studied the impact of oil prices on macroeconomic variables, such as sectoral job creation, real GDP growth, and inflation. There are also some studies on the impact of oil price shocks on stock market activities.

5. Conclusions and Future New Research Direction

A large number of scholarly papers on commodity prices have emerged, and the number of publications and citations has increased exponentially in recent years. This study used bibliometrics to study 1671 articles in this field, ascertaining through statistical analysis that articles in the field are mostly published in journals of energy economics, such as Energy Economic and Energy Policy. Based on the number of publications, the United States, China, and Australia ranked top in terms of research in this field. Half of the top ten research institutions represented in the sampled papers are based in China, in educational research institutions such as the Chinese Academy of Sciences and Hunan University. These institutions formed a close collaborative relationship. Through analyzing the core authors, as designated in our study, we found that Wang, Tiwari, Hammoudeh, and Gupta have made leading contributions. Through the citation network and cluster analysis, this study found that commodity price research hotspots emphasize four major aspects, namely, influencing factors, impact on the macroeconomy, price prediction, and commodity financialization. Based on our analyses, we propose two future research directions that are most likely to unfold in the near future:
(1)
Increased attention to the impact of major events
The violent volatility of commodities is often impacted by major events, such as a sharp increase in crude oil prices caused by the two oil crises in the 1970s, the overall decline in commodity prices caused by the financial crisis in 2008, and the decline in commodity prices and subsequent sharp increases in the prices of metal raw materials such as steel and copper in 2019 caused by COVID-19.
Since economic uncertainty caused by the unpredictable onset of major financial, weather-related, health-related, political, and economic events will directly lead to abnormal fluctuations in commodity prices, which will seriously disrupt the supply and demand of commodities [98], affect the operation of the macro-level economy, endanger enterprises, and adversely affect the stability and sustainable development of the country, research on the impact of major events and related countermeasures is an important direction. Going forward, such research in this direction needs to develop methodologies on the basis of existing ones, so as to integrate theory and practice.
(2)
Method innovation and selection of commodity price forecasting
The prediction of commodity prices has long been a hot research topic and will continue to be developed in the future. Forecasting methods have also developed from traditional time series models to machine learning, and then to a combination of the two. Many scholars have improved their forecasting methods and their accuracy based on new theories and models.
In our subsequent research, the data sources will be extended to text, video, and images; however, the most important thing is to carefully select predictor variables and specify the economic significance of the predicted results. Forecasting needs to identifying causality from data, being problem-oriented, starting from reality, rather than purely data-driven, and be able to use the predicted results in practice.
In addition to predicting research trends, the prediction of breakpoints and turning points also deserves scholarly attention. At present, scholars have performed change point analysis and statistical inference, and have carried out a probabilistic simulation of this mutation rule, in order to quickly identify and even predict the mutation point [99]. Successfully predicting the turning point can help stakeholders to identify and prevent risks, and achieve sustainable economic development [100].
The research of the article has certain policy implications. Commodities have always been an important material basis for people’s life and production. In recent years, the drastic fluctuations in commodity prices have caused great trouble to the operation of the macro-economy, the sustainable development of the industry, and the normal production of enterprises. Therefore, we must pay close attention to changes in commodity prices, establish corresponding forecasting and early warning mechanisms, and try to avoid their adverse effects on the economy as much as possible. Taking China as an example, based on the current cooperation network, we can establish commodity research centers with several major research institutions as the core (Chinese Academy of Sciences, University of Chinese Academy of Sciences, Xiamen University, and Beihang University), carry out relevant research, and develop corresponding prediction and early warning systems; thus, this will provide a protective barrier for the macroeconomy.

Author Contributions

Conceptualization, S.W. and J.J.; methodology, Y.H. and S.W.; software, Q.Z.; investigation, Y.H.; resources, Y.H.; data curation, Q.Z.; writing—original draft preparation, Q.Z.; writing—review and editing, Y.H., S.W., and J.J.; visualization, Q.Z.; supervision, S.W. and J.J.; project administration, J.J. All authors have read and agreed to the published version of the manuscript.

Funding

This research was funded by National Natural Science Foundation of China, grant number 72073124.

Institutional Review Board Statement

Not applicable.

Informed Consent Statement

Not applicable.

Data Availability Statement

Not applicable.

Conflicts of Interest

The authors declare no conflict of interest.

References

  1. Jacks, D.S.; Stuermer, M. What drives commodity price booms and busts? Energy Econ. 2020, 85, 104035. [Google Scholar] [CrossRef]
  2. Ghoshray, A. Do international primary commodity prices exhibit asymmetric adjustment? J. Commod. Mark. 2019, 14, 40–50. [Google Scholar] [CrossRef]
  3. Carter, C.A.; Rausser, G.C.; Smith, A. Commodity booms and busts. Annu. Rev. Resour. Econ. 2011, 3, 87–118. [Google Scholar] [CrossRef]
  4. Paolantonio, A. OECD-FAO, Agricultural Outlook 2008–2017; Firenze University Press: Firenze, Italy, 2008; pp. 119–123. Available online: http://digital.casalini.it/10.1400/185067 (accessed on 4 October 2021).
  5. Knez, S.; Šimić, G.; Milovanović, A.; Starikova, S.; Županič, F.Ž. Prices of conventional and renewable energy as determinants of sustainable and secure energy development: Regression model analysis. Energy Sustain. Soc. 2022, 12, 6. [Google Scholar] [CrossRef]
  6. Wang, G.; Sharma, P.; Jain, V.; Shukla, A.; Shahzad Shabbir, M.; Tabash, M.I.; Chawla, C. The relationship among oil prices volatility, inflation rate, and sustainable economic growth: Evidence from top oil importer and exporter countries. Resour. Policy 2022, 77, 102674. [Google Scholar] [CrossRef]
  7. Sajid, M.J.; Yu, Z.; Rehman, S.A. The coal, petroleum, and gas embedded in the sectoral demand-and-supply chain: Evidence from China. Sustainability 2022, 14, 1888. [Google Scholar] [CrossRef]
  8. Borzuei, D.; Moosavian, S.F.; Ahmadi, A. Investigating the dependence of energy prices and economic growth rates with emphasis on the development of renewable energy for sustainable development in Iran. Sustain. Dev. 2022, 1–7. [Google Scholar] [CrossRef]
  9. Gracia, A.; Gómez, M.I. Food sustainability and waste reduction in Spain: Consumer preferences for local, suboptimal, and/or unwashed fresh food products. Sustainability 2020, 12, 4148. [Google Scholar] [CrossRef]
  10. Khan, M.M.; Akram, M.T.; Janke, R.; Qadri, R.W.K.; Al-Sadi, A.M.; Farooque, A.A. Urban horticulture for food secure cities through and beyond COVID-19. Sustainability 2020, 12, 9592. [Google Scholar] [CrossRef]
  11. Yang, M.X.; Chen, W.S.; Zhou, Q.Y.; Yang, B.Y. Visualizing the landscape and trend of Chinese leadership research: 1949–2018. Nankai Bus. Rev. 2019, 22, 80–94. [Google Scholar]
  12. Chiroma, H.; Abdul-kareem, S.; Shukri Mohd Noor, A.; Abubakar, A.I.; Sohrabi Safa, N.; Shuib, L.; Fatihu Hamza, M.; Ya’u Gital, A.; Herawan, T. A review on artificial intelligence methodologies for the forecasting of crude oil price. Intell. Autom. Soft Comput. 2016, 22, 449–462. [Google Scholar] [CrossRef]
  13. Ederington, L.H.; Fernando, C.S.; Hoelscher, S.A.; Lee, T.K.; Linn, S.C. A review of the evidence on the relation between crude oil prices and petroleum product prices. J. Commod. Mark. 2019, 13, 1–15. [Google Scholar] [CrossRef]
  14. Ben Abdallah, M.; Fekete-Farkas, M.; Lakner, Z. Exploring the link between food security and food price dynamics: A bibliometric analysis. Agriculture 2021, 11, 263. [Google Scholar] [CrossRef]
  15. Leung, X.Y.; Sun, J.; Bai, B. Bibliometrics of social media research: A co-citation and co-word analysis. Int. J. Hosp. Manag. 2017, 66, 35–45. [Google Scholar] [CrossRef]
  16. Van Eck, N.J.; Waltman, L. Visualizing Bibliometric Networks; Springer: Cham, Switzerland, 2014; pp. 285–320. [Google Scholar] [CrossRef]
  17. Liu, H.; Li, X.; Wang, S. A bibliometric analysis of 30 years of platform research: Developing the research agenda for platforms, the associated technologies and social impacts. Technol. Forecast. Soc. Chang. 2021, 169, 682–689. [Google Scholar] [CrossRef]
  18. Li, X.R.; Zhang, X.X.; Li, Z.Y. A bibliometric analysis on business models. Syst. Eng. Theory Pract. 2016, 36, 273–287. [Google Scholar]
  19. Li, J.; Chen, C.M. Text Mining and Visualization in Scientific Literature, 2nd ed.; Capital University of Economics and Business Press: Beijing, China, 2017. [Google Scholar]
  20. Hamilton, J.D. Understanding crude oil prices. Energy J. 2009, 30, 179–206. [Google Scholar] [CrossRef] [Green Version]
  21. Mueller, S.A.; Anderson, J.E.; Wallington, T.J. Impact of biofuel production and other supply and demand factors on food price increases in 2008. Biomass Bioenergy 2011, 35, 1623–1632. [Google Scholar] [CrossRef]
  22. Awan, O.A. Price discovery or noise: The role of arbitrage and speculation in explaining crude oil price behaviour. J. Commod. Mark. 2019, 16, 100086. [Google Scholar] [CrossRef]
  23. Baumeister, C.; Kilian, L. Forty years of oil price fluctuations: Why the price of oil may still surprise us. J. Econ. Perspect. 2016, 30, 139–160. [Google Scholar] [CrossRef] [Green Version]
  24. Chen, S.-T.; Kuo, H.-I.; Chen, C.-C. Modeling the relationship between the oil price and global food prices. Appl. Energy 2010, 87, 2517–2525. [Google Scholar] [CrossRef]
  25. Dube, O.; Vargas, J.F. Commodity price shocks and civil conflict: Evidence from Colombia. Rev. Econ. Stud. 2013, 80, 1384–1421. [Google Scholar] [CrossRef]
  26. Gilbert, C.L.; Morgan, C.W. Food price volatility. Philos. Trans. R. Soc. B. Biol. Sci. 2010, 365, 3023–3034. [Google Scholar] [CrossRef] [PubMed]
  27. Ji, Q.; Guo, J.-F. Oil price volatility and oil-related events: An Internet concern study perspective. Appl. Energy 2015, 137, 256–264. [Google Scholar] [CrossRef]
  28. Nazlioglu, S. World oil and agricultural commodity prices: Evidence from nonlinear causality. Energy Policy 2011, 39, 2935–2943. [Google Scholar] [CrossRef]
  29. Zhang, X.; Yu, L.; Wang, S.; Lai, K.K. Estimating the impact of extreme events on crude oil price: An EMD-based event analysis method. Energy Econ. 2009, 31, 768–778. [Google Scholar] [CrossRef]
  30. Hamilton, J.D. Oil and the macroeconomy since World War II. J. Political Econ. 1983, 91, 228–248. [Google Scholar] [CrossRef]
  31. Balcilar, M.; Van Eyden, R.; Uwilingiye, J.; Gupta, R. The impact of oil price on South African GDP growth: A Bayesian Markov switching-VAR analysis. Afr. Dev. Rev. 2017, 29, 319–336. [Google Scholar] [CrossRef] [Green Version]
  32. Benhmad, F. Dynamic cyclical comovements between oil prices and US GDP: A wavelet perspective. Energy Policy 2013, 57, 141–151. [Google Scholar] [CrossRef]
  33. Jiménez-Rodríguez, R.; Sánchez, M. Oil price shocks and real GDP growth: Empirical evidence for some OECD countries. Appl. Econ. 2005, 37, 201–228. [Google Scholar] [CrossRef]
  34. Lardic, S.; Mignon, V. The impact of oil prices on GDP in European countries: An empirical investigation based on asymmetric cointegration. Energy Policy 2006, 34, 3910–3915. [Google Scholar] [CrossRef]
  35. Jiménez-Rodríguez, R. Oil price shocks and real GDP growth: Testing for non-linearity. Energy J. 2009, 30, 1–23. [Google Scholar] [CrossRef]
  36. Khan, M.A.; Husnain, M.I.U.; Abbas, Q.; Shah, S.Z.A. Asymmetric effects of oil price shocks on Asian economies: A nonlinear analysis. Empir. Econ. 2018, 57, 1319–1350. [Google Scholar] [CrossRef]
  37. Kilian, L.; Vigfusson, R.J. Do oil prices help forecast U.S. real GDP? The role of nonlinearities and asymmetries. J. Bus. Econ. Stat. 2013, 31, 78–93. [Google Scholar] [CrossRef]
  38. Chen, S.S.; Chen, H.C. Oil prices and real exchange rates. Energy Econ. 2007, 29, 390–404. [Google Scholar] [CrossRef]
  39. Aloui, R.; Ben Aïssa, M.S.; Nguyen, D.K. Conditional dependence structure between oil prices and exchange rates: A copula-GARCH approach. J. Int. Money Financ. 2013, 32, 719–738. [Google Scholar] [CrossRef]
  40. Ghosh, S. Examining crude oil price—Exchange rate nexus for India during the period of extreme oil price volatility. Appl. Energy 2011, 88, 1886–1889. [Google Scholar] [CrossRef]
  41. Huang, Y.; Guo, F. The role of oil price shocks on China’s real exchange rate. China Econ. Rev. 2007, 18, 403–416. [Google Scholar] [CrossRef]
  42. Ji, Q.; Liu, B.-Y.; Fan, Y. Risk dependence of CoVaR and structural change between oil prices and exchange rates: A time-varying copula model. Energy Econ. 2019, 77, 80–92. [Google Scholar] [CrossRef]
  43. Reboredo, J.C.; Rivera-Castro, M.A. A wavelet decomposition approach to crude oil price and exchange rate dependence. Econ. Model. 2013, 32, 42–57. [Google Scholar] [CrossRef]
  44. Sari, R.; Hammoudeh, S.; Soytas, U. Dynamics of oil price, precious metal prices, and exchange rate. Energy Econ. 2010, 32, 351–362. [Google Scholar] [CrossRef]
  45. Tule, M.K.; Salisu, A.A.; Chiemeke, C.C. Can agricultural commodity prices predict Nigeria’s inflation? J. Commod. Mark. 2019, 16, 100087. [Google Scholar] [CrossRef]
  46. Wu, C.-C.; Chung, H.; Chang, Y.-H. The economic value of co-movement between oil price and exchange rate using copula-based GARCH models. Energy Econ. 2012, 34, 270–282. [Google Scholar] [CrossRef]
  47. Papapetrou, E. Oil price shocks, stock market, economic activity and employment in Greece. Energy Econ. 2001, 23, 511–532. [Google Scholar] [CrossRef]
  48. Ewing, B.T.; Thompson, M.A. Dynamic cyclical comovements of oil prices with industrial production, consumer prices, unemployment, and stock prices. Energy Policy 2007, 35, 5535–5540. [Google Scholar] [CrossRef]
  49. Guerrero-Escobar, S.; Hernandez-del-Valle, G.; Hernandez-Vega, M. Do heterogeneous countries respond differently to oil price shocks? J. Commod. Mark. 2019, 16, 100084. [Google Scholar] [CrossRef] [Green Version]
  50. Li, R.; Leung, G.C.K. The relationship between energy prices, economic growth and renewable energy consumption: Evidence from Europe. Energy Rep. 2021, 7, 1712–1719. [Google Scholar] [CrossRef]
  51. Mukhtarov, S.; Mikayilov, J.I.; Humbatova, S.; Muradov, V. Do high oil prices obstruct the transition to renewable energy consumption? Sustainability 2020, 12, 4689. [Google Scholar] [CrossRef]
  52. Karacan, R.; Mukhtarov, S.; Barış, İ.; İşleyen, A.; Yardımcı, M.E. The impact of oil price on transition toward renewable energy consumption? Evidence from Russia. Energies 2021, 14, 2947. [Google Scholar] [CrossRef]
  53. Mukhtarov, S.; Mikayilov, J.I.; Maharramov, S.; Aliyev, J.; Suleymanov, E. Higher oil prices, are they good or bad for renewable energy consumption: The case of Iran? Renew. Energy 2022, 186, 411–419. [Google Scholar] [CrossRef]
  54. Umar, B.; Alam, M.M.; Al-Amin, A.Q. Exploring the contribution of energy price to carbon emissions in African countries. Environ. Sci. Pollut. Res. Int. 2021, 28, 1973–1982. [Google Scholar] [CrossRef]
  55. Ma, Y.; Zhang, L.; Song, S.; Yu, S. Impacts of energy price on agricultural production, energy consumption, and carbon emission in China: A Price Endogenous Partial Equilibrium Model Analysis. Sustainability 2022, 14, 3002. [Google Scholar] [CrossRef]
  56. Sha, R.; Ge, T.; Li, J. How Energy price distortions affect China’s economic growth and carbon emissions. Sustainability 2022, 14, 7312. [Google Scholar] [CrossRef]
  57. Lee, S.; Chong, W.O. Causal relationships of energy consumption, price, and CO2 emissions in the U.S. building sector. Resour. Conserv. Recycl. 2016, 107, 220–226. [Google Scholar] [CrossRef]
  58. Guo, Z.; Zhang, X.; Wang, D.; Zhao, X. The impacts of an energy price decline associated with a carbon tax on the energy-economy-environment system in China. Emerg. Mark. Financ. Trade 2019, 55, 2689–2702. [Google Scholar] [CrossRef]
  59. Malik, M.Y.; Latif, K.; Khan, Z.; Butt, H.D.; Hussain, M.; Nadeem, M.A. Symmetric and asymmetric impact of oil price, FDI and economic growth on carbon emission in Pakistan: Evidence from ARDL and non-linear ARDL approach. Sci. Total Environ. 2020, 726, 138421. [Google Scholar] [CrossRef] [PubMed]
  60. Ike, G.N.; Usman, O.; Alola, A.A.; Sarkodie, S.A. Environmental quality effects of income, energy prices and trade: The role of renewable energy consumption in G-7 countries. Sci. Total Environ. 2020, 721, 137813. [Google Scholar] [CrossRef]
  61. Huang, S.-C.; Wu, C.-F. Energy commodity price forecasting with deep multiple kernel learning. Energies 2018, 11, 3029. [Google Scholar] [CrossRef] [Green Version]
  62. Herrera, A.M.; Hu, L.; Pastor, D. Forecasting crude oil price volatility. Int. J. Forecast. 2018, 34, 3029. [Google Scholar] [CrossRef]
  63. Gupta, R.; Wohar, M. Forecasting oil and stock returns with a Qual VAR using over 150 years off data. Energy Econ. 2017, 62, 181–186. [Google Scholar] [CrossRef] [Green Version]
  64. Gavriilidis, K.; Kambouroudis, D.S.; Tsakou, K.; Tsouknidis, D.A. Volatility forecasting across tanker freight rates: The role of oil price shocks. Transp. Res. Part E Logist. Transp. Rev. 2018, 118, 376–391. [Google Scholar] [CrossRef] [Green Version]
  65. Yu, L.; Wang, S.; Lai, K.K. Forecasting crude oil price with an EMD-based neural network ensemble learning paradigm. Energy Econ. 2008, 30, 2623–2635. [Google Scholar] [CrossRef]
  66. Wang, J.; Li, X. A combined neural network model for commodity price forecasting with SSA. Soft Comput. 2018, 22, 5323–5333. [Google Scholar] [CrossRef]
  67. Zhang, Y.; Na, S. A Novel agricultural commodity price forecasting model based on fuzzy information granulation and MEA-SVM model. Math. Probl. Eng. 2018, 2018, 2540681. [Google Scholar] [CrossRef]
  68. Zhang, J.-L.; Zhang, Y.-J.; Zhang, L. A novel hybrid method for crude oil price forecasting. Energy Econ. 2015, 49, 649–659. [Google Scholar] [CrossRef]
  69. Kristjanpoller, W.; Minutolo, M.C. Forecasting volatility of oil price using an artificial neural network-GARCH model. Expert Sys. Appl. 2016, 65, 233–241. [Google Scholar] [CrossRef]
  70. Sadorsky, P. Oil price shocks and stock market activity. Energy Econ. 1999, 21, 449–469. [Google Scholar] [CrossRef]
  71. Hedi Arouri, M.E.; Khuong Nguyen, D. Oil prices, stock markets and portfolio investment: Evidence from sector analysis in Europe over the last decade. Energy Policy 2010, 38, 4528–4539. [Google Scholar] [CrossRef] [Green Version]
  72. Hedi Arouri, M.E.; Jouini, J.; Nguyen, D.K. Volatility spillovers between oil prices and stock sector returns: Implications for portfolio management. J. Int. Money Financ. 2011, 30, 1387–1405. [Google Scholar] [CrossRef]
  73. Cong, R.-G.; Wei, Y.-M.; Jiao, J.-L.; Fan, Y. Relationships between oil price shocks and stock market: An empirical analysis from China. Energy Policy 2008, 36, 3544–3553. [Google Scholar] [CrossRef]
  74. Kilian, L. Not all oil price shocks are alike: Disentangling demand and supply shocks in the crude oil market. Am. Econ. Rev. 2009, 99, 1053–1069. [Google Scholar] [CrossRef] [Green Version]
  75. Narayan, P.K.; Narayan, S. Modelling the impact of oil prices on Vietnam’s stock prices. Appl. Energy 2010, 87, 356–361. [Google Scholar] [CrossRef]
  76. Park, J.; Ratti, R.A. Oil price shocks and stock markets in the U.S. and 13 European countries. Energy Econ. 2008, 30, 2587–2608. [Google Scholar] [CrossRef]
  77. Salisu, A.A.; Oloko, T.F. Modeling oil price–US stock nexus: A VARMA–BEKK–AGARCH approach. Energy Econ. 2015, 50, 1–12. [Google Scholar] [CrossRef]
  78. Morana, C. Oil price dynamics, macro-finance interactions and the role of financial speculation. J. Bank. Financ. 2013, 37, 206–226. [Google Scholar] [CrossRef] [Green Version]
  79. Tilton, J.E.; Humphreys, D.; Radetzki, M. Investor demand and spot commodity prices. Resour. Policy 2011, 36, 187–195. [Google Scholar] [CrossRef]
  80. Ohashi, K.; Okimoto, T. Increasing trends in the excess comovement of commodity prices. J. Commod. Mark. 2016, 1, 48–64. [Google Scholar] [CrossRef] [Green Version]
  81. Hong, Y.; Wang, S. Big data, machine learning and statistics: Challenges and opportunities. China J. Econom. 2021, 1, 17–35. [Google Scholar]
  82. Jammazi, R.; Aloui, C. Crude oil price forecasting: Experimental evidence from wavelet decomposition and neural network modeling. Energy Econ. 2012, 34, 828–841. [Google Scholar] [CrossRef]
  83. Zhao, Y.; Li, J.; Yu, L. A deep learning ensemble approach for crude oil price forecasting. Energy Econ. 2017, 66, 9–16. [Google Scholar] [CrossRef]
  84. Filis, G.; Degiannakis, S.; Floros, C. Dynamic correlation between stock market and oil prices: The case of oil-importing and oil-exporting countries. Int. Rev. Financ. Anal. 2011, 20, 152–164. [Google Scholar] [CrossRef]
  85. Sim, N.; Zhou, H. Oil prices, US stock return, and the dependence between their quantiles. J. Bank. Financ. 2015, 55, 1–8. [Google Scholar] [CrossRef]
  86. Lee, K.; Ni, S.; Ratti, R.A. Oil shocks and the macroeconomy: The role of price variability. Energy J. 1995, 16, 39–56. [Google Scholar] [CrossRef] [Green Version]
  87. Mork, K.A.; Olsen, O.; Mysen, H.T. Macroeconomic responses to oil price increases and decreases in seven OECD countries. Energy J. 1994, 15, 19–35. [Google Scholar] [CrossRef] [Green Version]
  88. Hamilton, J.D. What is an oil shock? J. Econom. 2003, 113, 363–398. [Google Scholar] [CrossRef]
  89. Basher, S.A.; Haug, A.A.; Sadorsky, P. Oil prices, stock returns and emerging stock markets. Energy Econ. 2012, 34, 227–240. [Google Scholar] [CrossRef] [Green Version]
  90. Kilian, L.; Park, C. The impact of oil price shocks on the US stock market. Int. Econ. Rev. 2009, 50, 1267–1287. [Google Scholar] [CrossRef]
  91. Kilian, L.; Murphy, D.P. The role of inventories and speculative trading in the global market for crude oil. J. Appl. Econom. 2014, 29, 454–478. [Google Scholar] [CrossRef]
  92. Davis, S.J.; Haltiwanger, J. Sectoral job creation and destruction responses to oil price changes. J. Monet. Econ. 2001, 48, 465–512. [Google Scholar] [CrossRef] [Green Version]
  93. Hooker, M.A. Are oil shocks inflationary? Asymmetric and nonlinear specifications versus changes in regime. J. Money Credit. Bank. 2002, 34, 540–561. Available online: https://www.jstor.org/stable/3270701 (accessed on 6 October 2021). [CrossRef] [Green Version]
  94. Jones, D.W.; Leiby, P.N.; Paik, I.K. Oil price shocks and the macroeconomy: What has been learned since 1996. Energy J. 2004, 25, 1–32. [Google Scholar] [CrossRef]
  95. Barsky, R.B.; Kilian, L. Oil and the macroeconomy since the 1970s. J. Econ. Perspect. 2004, 18, 115–134. [Google Scholar] [CrossRef] [Green Version]
  96. Bernanke, B.; Gertler, M.; Watson, M.W. Oil shocks and aggregate macroeconomic behavior: The role of monetary policy: A Reply. J. Money Credit. Bank. 2004, 36, 287–291. [Google Scholar] [CrossRef]
  97. Cunado, J.; Perez de Gracia, F. Oil prices, economic activity and inflation: Evidence for some Asian countries. Q. Rev. Econ. Financ. 2005, 45, 65–83. [Google Scholar] [CrossRef] [Green Version]
  98. Wang, Q.; Yang, X.; Li, R. The impact of the COVID-19 pandemic on the energy market—A comparative relationship between oil and coal. Energy Strategy Rev. 2022, 39, 100761. [Google Scholar] [CrossRef]
  99. Chai, J.; Lu, Q.; Hu, Y.; Wang, S.; Lai, K.K.; Liu, H. Analysis and Bayes statistical probability inference of crude oil price change point. Technol. Forecast. Soc. Chang. 2018, 126, 271–283. [Google Scholar] [CrossRef]
  100. Zhang, J.; Yuan, X. COVID-19 risk assessment: Contributing to maintaining urban public health security and achieving sustainable urban development. Sustainability 2021, 13, 4208. [Google Scholar] [CrossRef]
Figure 1. The number of published documents in each year (1990–2020).
Sustainability 14 09536 g001
Figure 2. Main research areas and proportions.
Sustainability 14 09536 g002
Figure 3. Cooperation network between countries.
Sustainability 14 09536 g003
Figure 4. Distribution of research regions.
Sustainability 14 09536 g004
Figure 5. Distribution of the research object.
Sustainability 14 09536 g005
Figure 6. Institutional cooperation network.
Sustainability 14 09536 g006
Figure 7. The core authors’ cooperative relationship network.
Sustainability 14 09536 g007
Figure 8. Clusters of co-cited articles.
Sustainability 14 09536 g008
Figure 9. Landmark and pivot nodes of the co-cited articles [86,87,88].
Sustainability 14 09536 g009
Figure 10. Reference with a citation burst.
Sustainability 14 09536 g010
Table 1. Statistics of highly cited articles published in journals.
CitationsNumber of Articles PublishedJournal5 Year Impact Factor
1051269Energy Economics7.571
68779Energy Policy6.581
32454Energy6.845
46644Economic Modelling3.412
43341Energy Journal2.786
33338Applied Economics1.88
22738Resources Policy5.654
29931Applied Energy9.953
11930Applied Economics Letters1.2
20727American Journal of Agricultural Economics4.461
Table 2. Top 10 institutions based on the number of publications in commodity price research.
InstitutionFieldPublicationsRegions
Chinese Academy of SciencesCrude oil price forecasting; factors influencing crude oil prices; crude oil prices and the stock market48China
Hunan UniversityCrude oil prices and the stock market return; crude oil price forecasting26China
Montpellier Business SchoolOil price and precious metal prices;
oil price and economy
21France
University of PretoriaThe impact of oil price fluctuations on macroeconomy20South Africa
World BankCauses and effects of food price crisis; food security; linkage between commodity prices18
Central University of Finance and
Economics
Co-movement of commodity prices; crude oil prices and the stock market return; macroeconomic uncertainty and commodity prices18China
Beijing Institute of TechnologyOil price forecasting; oil price and stock return18China
Drexel UniversityInfluencing factors of commodity prices; the impact of commodity price shocks on other factors18USA
University of Chinese Academy of SciencesCrude oil price forecasting16China
IPAG Business SchoolCommodity prices and their determinant15France
Table 3. Statistics of the core authors.
RankAuthorNumber of PeopleNumber of Articles PublishedProportion of Total/%
1Wang S1181.49%
2Tiwari A K1161.32%
3Hammoudeh S, Gupta R2152.48%
4Kilian L1141.16%
5Ratti R A, An H2111.82%
6Yu L1100.83%
7Narayan P K, Wang Y, Zhang Y J, Yin L, Serletis A, Salisu A A, Nguyen D K795.20%
8Wen F, Balcilar M, Reboredo J C, Tang L482.64%
9Baumeister C, Ji Q, Ghoshray A, Nonejad N, Zhao L572.89%
10Liu L, Yu W, Zhu H, Herrera A M, Soytas U, Jiménez-Rodríguez R, Fan Y763.47%
11Arouri M E H, Shahbaz M, De Gracia F P, Uri N D451.65%
12Castro C, Maghyereh A, Zhang C, Huang X, Lai K K, Wohar M E, Shahzad S J H, Nazlioglu S, Huang S, Karaki M B, Pierdzioch C, Gao X, Wei Y, Tao R, Boyd R, Filis G, Baek J1745.61%
Total5237030.53%
Table 4. Citation clustering network.
Cluster IDCluster LabelCluster SizeSilhouetteYear (Average)
#0stock market2090.6562006
#1exchange rate1410.6982013
#2crude oil price forecasting1260.7292012
#3oil price uncertainty1030.7492014
#4agricultural commodity price760.8542009
#5Singapore economy700.9541996
#6agricultural employment470.9951991
#7EMD-based neural network ensemble470.9692001
#9long-run price3811993
#20high commodity price70.9962008
#26high oil price40.9962003
Table 7. Top 10 references with the strongest citation bursts.
AuthorTitleJournalYearStrengthBeginEndBurst Period: 1990–2020Cluster
Davis and Haltiwanger
[92]
Sectoral job creation and destruction responses to oil price changesJournal of Monetary
Economics
200114.4120032011 Sustainability 14 09536 i001#0
Hamilton [88]What is an oil shock?Journal of Econometrics200337.6420052013 Sustainability 14 09536 i002#0
Sadorsky
[70]
Oil price shocks and stock market activityEnergy Economics199910.3620052009 Sustainability 14 09536 i003#0
Jiménez-Rodríguez
and Sánchez
[33]
Oil price shocks and real GDP growth: empirical evidence for some OECD countriesApplied Economics200517.5320072015 Sustainability 14 09536 i004#0
Hooker [93]Are oil shocks inflationary? Asymmetric and nonlinear specifications versus changes in regimeJournal of Money, Credit, and Banking200212.4420072011 Sustainability 14 09536 i005#0
Jones et al. [94]Oil price shocks and the macroeconomy: what has been learned since 1996The Energy Journal200411.8520072014 Sustainability 14 09536 i006#0
Papapetrou [47]Oil price shocks, stock market, economic activity and employment in GreeceEnergy Economics200111.2520072011 Sustainability 14 09536 i007#0
Barsky and Kilian [95]Oil and the macroeconomy since the 1970sJournal of Economic Perspectives200424.2820082014 Sustainability 14 09536 i008#0
Bernanke et al. [96]Oil shocks and aggregate macroeconomic behavior: The role of monetary policy: A replyJournal of Money, Credit, and Banking200419.1120082014 Sustainability 14 09536 i009#4
Cunado et al. [97]Oil prices, economic activity and inflation: evidence for some Asian countriesThe Quarterly Review of Economics and Finance200514.7320082015 Sustainability 14 09536 i010#0
Publisher’s Note: MDPI stays neutral with regard to jurisdictional claims in published maps and institutional affiliations.

