Article

Agricultural Insurance, Climate Change, and Food Security: Evidence from Chinese Farmers

1
Institute of Big Data, Zhongnan University of Economics and Law, Wuhan 430073, China
2
School of Statistics and Mathematics, Zhongnan University of Economics and Law, Wuhan 430073, China
*
Authors to whom correspondence should be addressed.
Sustainability 2022, 14(15), 9493; https://doi.org/10.3390/su14159493
Submission received: 8 June 2022 / Revised: 29 July 2022 / Accepted: 29 July 2022 / Published: 2 August 2022
(This article belongs to the Special Issue Food Security and Environmentally Sustainable Food Systems)

Abstract

:
As an effective risk management mechanism, agricultural insurance can reduce the risk of uncertainty in agricultural production and guarantee food security. Based on Chinese provincial panel data from 2003 to 2020, this study uses the Entropy Method to measure food security and systematically examines the impact of climate change and agricultural insurance on food security as well as its mechanisms. The present study found that climate change, especially extreme temperatures, has a significant negative impact on food security and food production. The promotion effect of agricultural insurance on food security increases with increased investments in technology, education, and other factors. Furthermore, our findings suggest the presence of geographical variations in the contribution of agricultural insurance to ensuring food security, with greater coverage in major food-producing regions. Additionally, maize yields are better protected by agricultural insurance than wheat and rice yields. To encourage sustainable agricultural development, the Chinese government should set up a diversified subsidy scheme with various planting scales and plant structures.

1. Introduction

Feeding a growing population and ensuring food security are two of the largest problems facing global agriculture today [1,2,3]. Food security plays an important role in ensuring economic development and social stability [4]. Ending hunger, achieving food security, enhancing nutrition, and promoting sustainable agriculture are the objectives of the United Nations Sustainable Development Goal 2 (SDG2) [5]. However, agricultural production is inherently vulnerable, and agriculture is more seriously affected by climate change [3,4,6].
The spatial and temporal distribution patterns of climate resources, such as light, heat, and water, have important effects on grain production [7,8]. Changes in food production under different climatic conditions in different regions likewise show clear regional differences [9,10]. Spatial and temporal variability also exists in the responses of food production to climate resources [11]. In the context of handling climate change and ensuring food security, analyzing the spatial–temporal differentiation evolution of food climate productivity potential is especially significant [12,13,14].
Agricultural insurance is a crucial strategy for managing risks related to global food security [15,16]. This measure can successfully reduce a variety of shocks to agricultural production brought on by unforeseen occurrences, including market fluctuations, natural disasters, and other shocks [17]. Compared to ex post relief, ex ante insurance is by far a more effective risk management instrument [6,18]. Agricultural insurance appears to be the primary method used by governments to ensure food security [15,16]. For example, a 60% subsidy is applied to agricultural insurance premiums in the United States [15], and 30–70% of agricultural insurance premiums in the European Union are subsidized [17,19].
China is the world’s largest agricultural insurance market. In 2021, China’s agricultural insurance premium income was CNY 96.518 billion [20], and China has been the world’s highest earner of agricultural insurance premiums for two consecutive years.
Notably, food security and food production security are not the same concepts. In the food security system, food production is merely one of the most significant indicators [21,22]. Food security includes not just supply and consumption but also nutrition and ecology as cultures advance and economic incomes rise [17,21,22]. This work broadens the notion of food security and creates a food security index to investigate the connection between agricultural insurance, climate change, and food security in conjunction with existing literature [17,18,19,20,21,22,23].
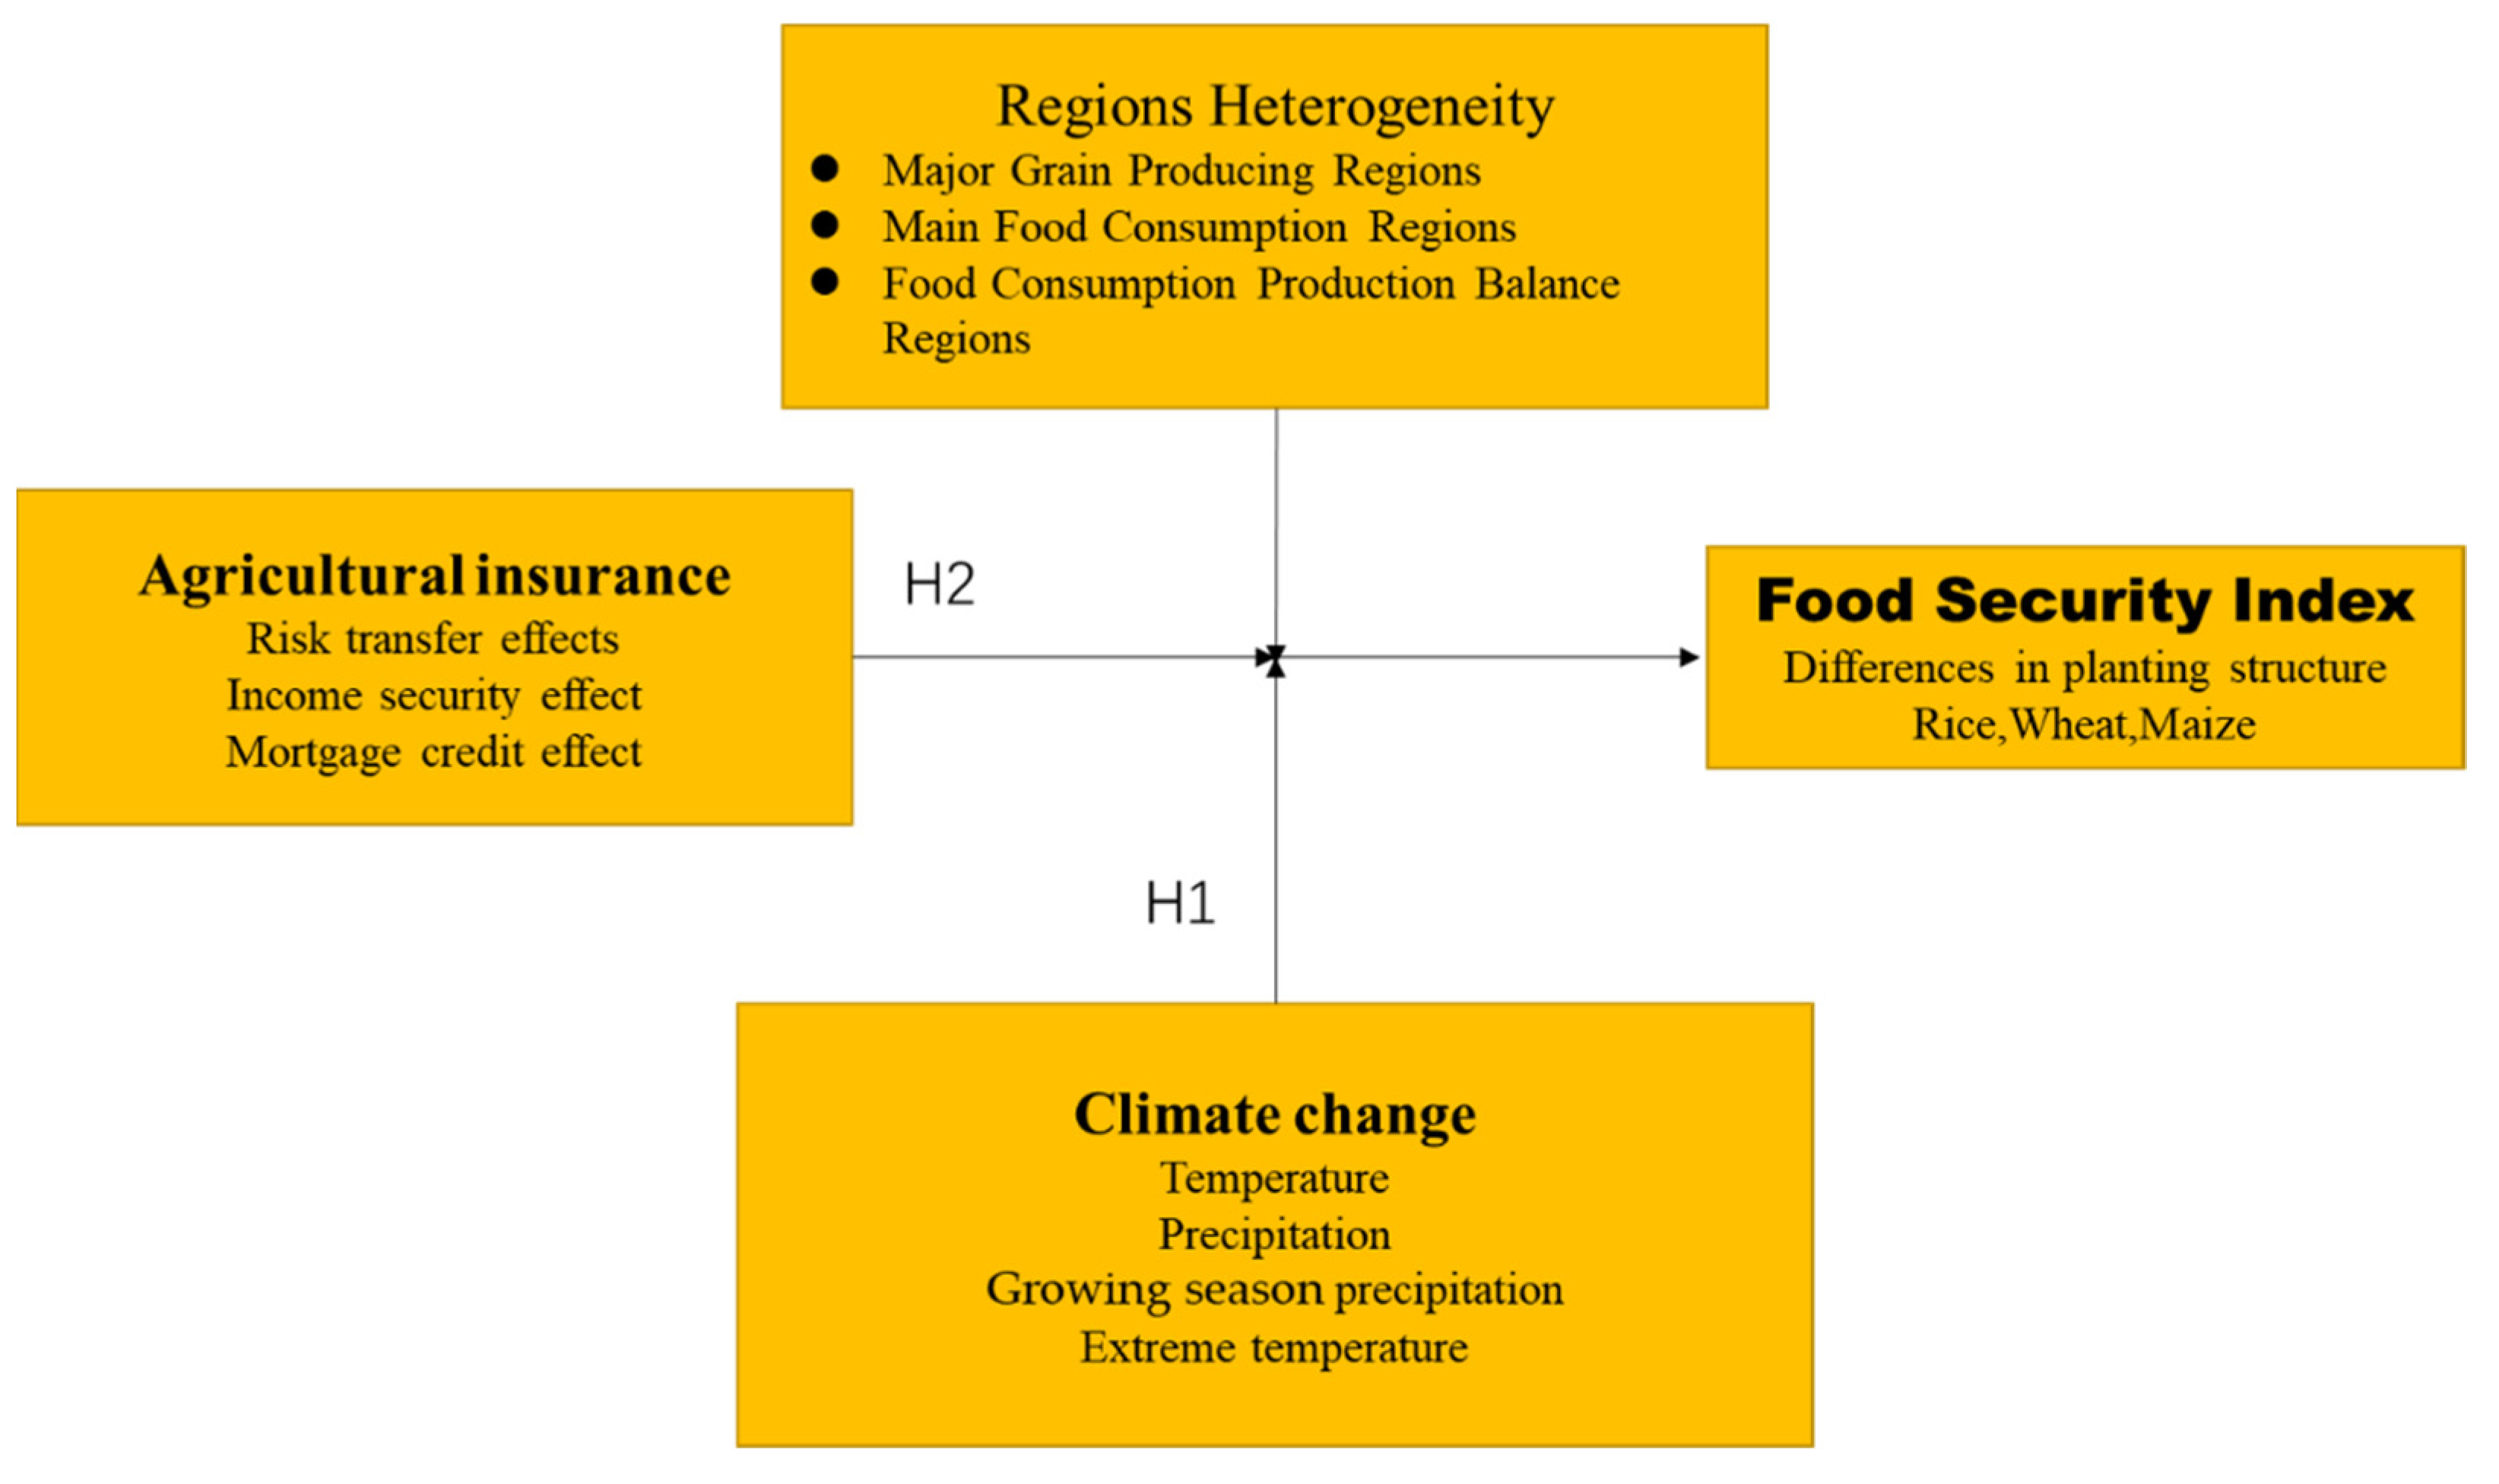
This article aims to investigate whether climate change has a negative impact on food security, whether agricultural insurance improves food security, and whether agricultural insurance can address the impact of climate change on food security. To answer the above questions, a framework was constructed (Figure 1). The findings indicate that climate change has a negative influence on food security, whereas agricultural insurance has a beneficial impact. Additionally, agricultural insurance can mitigate how negatively climate change affects food security.
The remainder of this document is organized as follows. The literature review and research hypotheses are presented in the second section. In Section 3, we provide a summary of the data sources, econometric models, and variables. In Section 4, we explore the empirical findings, which cover tests for robustness, endogeneity, and heterogeneity. Section 5 serves as our final section, where we summarize the results and their implications for policy.

2. Literature Review and Research Hypothesis

In comparison to 1850–1900, the global average temperature climbed by 0.85 °C between 1880 and 2012, while the global surface temperature rose by 1.09 °C between 2011 and 2020 [23]. Climate change provides material and energy for food growth, but it also limits stable food production [24]. Global climate change has resulted in changes to the spatial and temporal distribution of agro-climatic resources related to food production [25,26,27]. Changes in the spatial and temporal patterns of climate resources can affect the layout of agricultural output, cropping arrangements, and, ultimately, global food security [9,10,28]. The impact of climate change on food security is a concern for global climate change research [29,30,31,32,33,34].
By 2030, global maize and wheat production potential will decline by 3.8% and 5.5%, respectively, due to climate change [10,30,31,32]. In China, climate change will reduce maize production and increase wheat production in the 2040s [27]. Warming also has a negative impact on potential winter wheat yields in the eastern Mediterranean and the Middle East [31]. Maize production in northeast China fell by 6.45% due to a warmer climate and reduced precipitation [7,32]. In Africa, maize production has been negatively affected by rising temperatures and falling precipitation [33].
Climate change has a significant impact on crop productivity. However, there is no clear consensus on the largest important meteorological factors affecting food production in a region, with evidence showing that temperature changes affect crop yield more than precipitation changes [7,28,32,33]. There is also no statistically significant link between changes in food crop yield and variations in precipitation [10,34]. Some studies, however, have found the contrary. Precipitation, for example, has been demonstrated to have a larger impact on crop productivity than temperature [35,36]. Other research has found that higher CO2 levels have a stronger impact on crop yield than temperature and precipitation [37,38,39].
Based on SDG2 and the above analysis, we hypothesize the following:
Hypothesis 1 (H1):
Climate change has a negative impact on food security.
Agricultural insurance is an effective risk management instrument for agricultural producers [19]. A growing body of literature focuses on the impact of agricultural insurance [4,17,19,40]. Agricultural insurance can protect farmers’ incomes and reduce production risks [15,40]. Additionally, agricultural insurance could encourage farmers to reorganize their production and factor inputs while facilitating the supply of agricultural financing [21,22]. For instance, the researchers in [41] demonstrated that farmers would improve their cropping structures as a result of insurance participation due to the correlation mechanism between agricultural insurance and credit.
Agricultural insurance provides subsidies for the majority of the world’s crop production [16,17,18,19,21,40]. Global food security and climatic adaptation may be impacted by agricultural insurance [17,21,40,41,42,43,44]. However, farmers are often risk-averse [45,46] and lack the motivation to use new technologies. This factor is detrimental to food output [42]. Agricultural insurance can increase farmers’ incentives to adopt new technologies and help improve food production efficiency [43]. Agricultural insurance also protects farmers’ income [43,44]. When faced with natural disasters, farmers usually scale down production [44,46,47]. Agricultural insurance can protect farmers’ income and stabilize their production expectations, thus contributing to food production [16,19,40,43,44,45,46]. Mortgages are another possible impact channel. Collateralized credit, which is a function of agricultural insurance, lowers the bar for financial support for agriculture [42,43,44,45].
More significantly, agricultural insurance provides subsidies for the majority of the world’s crop production [16,17,18,22]. Global food security and climatic adaptation may also be impacted by agricultural insurance [17,21,40,42,43,44,45,46,47].
Based on the above review, we propose the following hypothesis:
Hypothesis 2 (H2):
Agricultural insurance has a positive impact on food security and can counteract the impacts of climate change on food security.
In general, the majority of current research focuses on how agricultural insurance or climate change may affect food production. However, previous studies have ignored the response of agricultural insurance to climate change. Additionally, little research has examined how cropping structure and geographical variation affect the diverse effects of agricultural insurance on food security. Regarding geography and cultivars, there is a considerable degree of variation in food security. Therefore, this manuscript comprehensively analyzes the impact of agricultural insurance on food security with respect to climate change.

3. Model, Variables, and Data

3.1. Variables

3.1.1. Dependent Variables

There is a growing focus in the literature on the factors influencing food security. Specifically, food self-sufficiency, transportation, agricultural technology, investment, and farmers’ level of education all affect food security [34,35,45,46,47,48,49,50]. Most of the literature develops a comprehensive score of food security in terms of nutritional security, food supply, food output stability, food consumption, and sustainable development of agriculture [48,49].
Based on existing research methods, this paper presents a comprehensive food security index (FSI) system comprising 16 indicators in 6 dimensions (Table 1): nutritional security, stable food supply, consumption sustainability, production sustainability, sustainable agriculture, and financial support [49,50,51,52,53]. Notably, the use of agricultural fertilizers and pesticides not only accelerates soil acidification but also reduces salt base saturation and soil fertility, which is detrimental to sustainable food production [2,5,37]. Therefore, we define pesticide and fertilizer use per hectare as a negative impact on green food production.
Referring to the existing research methods [51,52,53,54,55], we selected the entropy method to calculate FSI (Table 1). The entropy method allows the indicator weights to be measured based on the true value of each indicator’s data in the sample. This process effectively avoids the weighting bias caused by subjective bias [56,57,58]. The specific calculation steps are as follows:
First, make the data dimensionless. Equation (1) is used for positive indicators and Equation (2) for negative indicators.
X i t , j ˜ = X i t , j min X i t , j max X i t , j min X i t , j
X i t , j ˜ = max X i t , j X i t , j max X i t , j min X i t , j
where X i t , j ˜ refers to the dimensionless variable for the jth indicator in the ith province in year t. min X i t , j is the minimum value of an indicator, and max X i t , j is the maximum value of the indicator.
Second, calculate the weight of the jth indicator for the ith province in year t, where n = 31, z = 17 in Equation (3):
Q i t , j = X i t , j ˜ i = 1 n t = 1 z X i t , j ˜
In the third step, calculate the information entropy of the jth indicator and its redundancy with Equation (4):
e j = 1 ln ( n t ) i = 1 n t = 1 t Q i t , j ln ( Q i t , j ) , e j [ 0 , 1 ]
In the fourth step, the weight of the jth indicator is calculated according to Equation (5), where m represents the number of indicators (m = 16):
W j = w j j = 1 m w j
Finally, a multiple linear weighting function is used to obtain the FSI for province i in year t.
F S I n = i = 1 m j = 1 n ( X i t , j ˜ W j )
We divided 31 provinces into 3 main sectors according to the ratio of grain production to consumption: the main grain-producing areas (MGP), the main grain-consuming areas (MGC), and the grain-consuming-production balance areas (GCPB). We calculated the average value of the FSI for each province in these three segments from 2003 to 2020 (Table 2).
The major grain-producing regions (13 provinces) supply more than 75% of the grain in China. The main food consumption regions (7 provinces) are those with a scarcity of arable land resources and large populations. Most food-consumption-production balance zones (11 provinces) are located in the western part of China, where natural conditions for food production are harsh.
The dependent variable chosen for this paper is the Food Security Index (FSI). Given that food supply is a major component of food security, maize yield, rice yield, and wheat yield were also chosen as dependent variables.

3.1.2. Main Independent Variables

Agricultural insurance measured by the amount of actual premiums is the main independent variable in this study. In the robustness analysis, the compensation amount of agricultural insurance was selected as the main independent variable to be assessed. This portion of the data was obtained from the China Insurance Statistical Yearbooks (2002–2020) [20], the Provincial Statistical Yearbooks (2002–2020) [59], and the China Research Data Service Platform (CNRDS) database [60].

3.1.3. Other Independent Variables

Climate change: The impact of climate change on agricultural production can be mainly observed in terms of temperature and precipitation [4,9,10,11,26]. This paper uses the annual mean temperature variable (T) to measure the impact of temperature on food security. Existing research findings suggest that extreme temperatures can lead to reduced food production [10,26,27]. Therefore, here we use days higher than 30 °C (EHD30 °C+) in the plant growth cycle to represent high temperatures and days lower than 0 °C (CTD-0 °C) to represent low temperatures. Annual precipitation was used to analyze the impact of precipitation on food security. Additionally, each year was further divided into four seasons—Spring (March–May), Summer (June–August), Autumn (September–November), and Winter (December–February)—to analyze the impact of rainfall variability on food security during the growing season. The climate data were downloaded from the National Oceanic and Atmospheric Administration (https://www.ncei.noaa.gov/data/global-historical-climatology-network-daily, accessed on 28 June 2022).
Based on previous research [40,43], in the economic model, we controlled for other variables that can affect FSI, such as urbanization (Urban), agricultural research (Research), investment in agricultural infrastructure (Infrastructure), and education (Education).
Previous studies have found that education level is an important factor in sustainable agricultural development and rural economic growth [21,40,43]. The higher the education level is, the more likely that farmers will accept new technologies and promote agricultural production. This paper measures educational attainment in rural areas in terms of years of schooling per rural resident. In China, the average years of education for residents with primary school, junior middle school, senior high school, and university or above are 6, 9, 12, and 16 years, respectively. With reference to existing studies [40], we define the average years of education for rural residents as (Education) = (university × 16 + high × 12 + middle × 9 + primary × 6 + Illiterate × 0.8)/population in rural areas.
Rural infrastructure investment plays an important role in agricultural production. In this paper, agricultural infrastructure investment is included as a control variable. We use the amount of agricultural infrastructure investment averaged over the area of grain sown to measure agricultural infrastructure (Infrastructure). In addition, we use the number of agricultural technicians in each province as a variable to measure the level of agricultural research. We obtained these data from the regional economic research database on the CNRDS Platform [60].
We use urbanization (Urban) as a control variable in the model. On the one hand, urbanization can result in the crowding out of arable land and labor, while on the other hand, it can have an impact on food production technology or provide additional financial support. Thus, urbanization may have a negative or positive impact on food security. Data on urbanization were obtained from the China Statistical Yearbook (2002–2020) [20].
As natural disasters can adversely affect food production, and using direct losses as a control variable can cause pseudo-regression problems [61,62], this study measures natural disasters as a proportion of the area affected in the current year to the total cultivated area at the end of the previous year. Data were obtained from the China Statistical Yearbook (2003–2020) [20].
The definitions of all variables in the model and the descriptive statistical analysis are shown in Table 3.

3.1.4. Econometric Model

To prove the hypotheses proposed above, we chose FSI as the dependent variable, which was measured in terms of wheat yield (WY), rice yield (RY), and maize yield (MY). The main independent variable is agricultural insurance, measured by the amount of agricultural insurance premiums and compensation. Referring to the existing literature [40,43,62], we developed the following econometric model to investigate the impact of agricultural insurance on FSI:
Y p , t = β 0 + β 1 Insurance p , t + β 2 X p , t + γ C p , t + S p + f p ( t ) + ε p , t
where Y p , t refers to dependent variables, which include FSI, WY, RY, and MY. Insurance p , t is the agricultural insurance of area p in year t, C p , t are meteorological factors including average annual temperature (T), precipitation (P), frequency of high temperatures (EHD30 °C+), frequency of low temperatures (CTD-0 °C), and growing season rainfall (Spring, Summer, Autumn, and Winter). X p , t are other factors that affect food security. According to existing research and the framework of this experiment, the other factors include the number of agricultural R&D technicians (Research), urbanization (Urban), average years of education in countryside (Education), proportion of area affected by natural disasters (Hazard), and industrialization investments in agriculture (Industrialization). Additionally, S p is the region fixed effect, f p ( t ) is the time fixed effect, and ε p , t are the random perturbation terms. Table 3 presents the descriptive statistics for all variables.

4. Empirical Analysis

4.1. Climate Change and FSI

The main objective of this paper is to test the effects of climate change and agricultural insurance on food security by using econometric models. The core conclusions of this study are reported in Table 4.
The results of climate change impacts on food security are provided in columns (1) to (4) of Table 4. The regression results of column (1) show that the correlation of temperature (T) with FSI is significant and positive at 10%. The correlation of annual precipitation (P) with FSI is significantly negative at 10%. Both extreme high temperatures (EHD30 °C+) and extreme low temperatures (CTD-0 °C) have a negative impact on food security at 10%.
This study further analyzes the impact of growing season rainfall on food security. Here, the correlation of spring rainfall (Spring) with FSI is significant and positive at 10%. However, the impact of summer and autumn rainfall on food security is not significant, and winter rainfall has a negative impact on food security.
The results of climate change impacts on rice, wheat, and maize yields are presented in columns (2)–(4). The regression results show that the direction of climate change effects on grain yields of different varieties is consistent with the results in column (1).
Temperature and precipitation have a greater impact on maize than on rice and wheat. We further analyzed the impact of growing season rainfall on maize, rice, and wheat yields. The effect of Spring on rice, wheat, and maize yields was found to be significantly positive at 10%. Summer and Autumn have a significant positive effect on rice and maize yields at 10%. This result is consistent with the findings of other studies [3,4,9,11,24,27].
Based on the regression results (Columns (1)–(4)), higher temperatures are less conducive to food security. We further analyzed the relationship between climate change and food production. The impact of climate change varies across food varieties, with maize being the most affected. CTD-0 °C impacted maize more strongly than rice and wheat, and EHD30 °C+ did not have a significant impact on maize. With the exception of winter precipitation, rainfall had a positive impact on both maize and rice yields.
These results verify Hypothesis 1, indicating that climate change significantly affects food security.

4.2. Agricultural Insurance and FSI

The influence of agricultural insurance on FSI after accounting for other factors is shown in Table 5 (columns (5) to (8)). The fixed effect of year and provinces are controlled in the model.
Columns (5) to (8) (Table 5) demonstrate the impact of agricultural insurance on food security when other control variables are added, including Education, Hazard, Research, and Industrialization. The results in column (5) show that the coefficient of agricultural insurance to food security is positive and significant at p = 0.089 < 0.1.
This result indicates that agricultural insurance can somewhat help ensure food security under the impact of climate change. Specific to different food varieties and similar to the findings of other studies [4,8,32,39], agricultural insurance can play a positive role when food production is exposed to uncertain risks.
The effect of Urbanization on FSI is positive and significant. However, the effects on rice yield, wheat yield, and maize yield are negative and significant. Rapid urbanization has resulted in a rapid expansion of China’s urban population, driving rural labor to non-agricultural jobs. Urbanization has also resulted in a decrease in high-quality arable land around towns and cities [22]. As urbanization levels rise, food production capacity deteriorates, and hence, food production suffers.
Increased urbanization and rapid economic development, on the other hand, have altered the dietary structures of both urban and rural Chinese [1,40]. At the same time, urbanization has increased the efficiency of food production [1,22,40]. From this perspective, urbanization promotes food security.
When combined with other literature [40,55,56,57,58,61,62], the results of the present study indicate that urbanization has a considerably good influence on food security but a significant detrimental effect on food production at the provincial level.
The results in columns (5) to (8) show that the effect of agricultural insurance on food security is positive and significant after the inclusion of other control variables. The results in Table 4 and Table 5 show that the effect of agricultural insurance is positive and significant at 10%, regardless of whether control variables are added. In addition, the results demonstrate that agricultural insurance can significantly improve food security under the shock of climate change. This validates Hypothesis 2 by indicating that agricultural insurance can counteract the impact of climate change on food security.

4.3. Robustness Check

We developed our main conclusion by exploring the relationship between climate change, agricultural insurance, and food security. To verify the accuracy of these conclusions, it is necessary to verify their robustness. Based on existing research [40,43,62], we assessed the robustness of the conclusions by replacing the actual premium amount (the main independent variable, Insurance) with the compensation amount. We lagged Precipitation (LnP), Industrialization (LnIndustrialization), Research (LnResearch), and Urbanization (LnUrban) by one period. The results are shown in Table 6.
Columns (1) to (4) present the impact of agricultural insurance compensation on food security, maize yields, rice yields, and wheat yields. The fixed effects of year and region are controlled in the model.
The results show that after replacing the main independent variables, the correlation of agricultural insurance with FSI is positive and significant at a 10% level, which demonstrates that the main conclusion of this paper is robust.
Thus, the sustainable development of agricultural insurance is conducive to ensuring food security. In addition, agricultural insurance can promote a sustainable supply of the three major food production staples.

4.4. Endogeneity Test

There are potential endogeneity issues in our study. Firstly, there may be a reverse causality. The higher the FSI is, the greater the tendency will be to avoid production risk by purchasing agricultural insurance. Under a high FSI, farmers may be exposed to the risk of volatile food prices.
Secondly, some variables may have been omitted. Due to the limited availability of data, other variables that affect both agricultural insurance and food security may have been ignored in this paper.
Thirdly, there may be measurement errors. Due to the limited availability of data provided by the database and/or statistical errors in the acquisition of data, all variables in this model may have measurement errors.
To address the endogeneity issue and ensure the reliability of our conclusions, we applied the instrumental variables approach (IV) and generalized method of moment (GMM) for further estimation.
Here, we use agricultural insurance with one lag period as the core instrumental variable to address the endogeneity problem that arises from mutual causality. In addition, to avoid the problem of heteroskedasticity, an interaction term between Insurance and climate factors was selected to measure the response of agricultural insurance to climate change, which includes Insurance×CTD-0 °C, Insurance*EHD30 °C+, Insurance×lnT, and Insurance×lnP.
Agricultural insurance with one lag period is closely related to the current period but is unaffected by current food security. This occurs because when farmers make insurance decisions, the previous year’s insurance situation is taken into account; however, current food security will not affect the insurance outcomes of the previous year.
Therefore, here we use one-period lagged agricultural insurance as an instrumental variable to address the endogenous problem. The results for IV + GMM are shown in Table 7. The coefficient of agricultural insurance lagging behind one period (Insurance L) on FSI is positive.
Compared to the results in Table 5, the coefficient of the interaction term between agricultural insurance and climate change factors is reduced. Precipitation (Insurance × lnP) and temperature (Insurance × lnT) have a positive impact on food security with the protection of agricultural insurance. In addition, the negative impact of extreme temperatures (Insurance × CTD-0 °C, Insurance × EHD30 °C+) on food security is decreased, which provides further evidence of the robustness of the results in this paper. That is, agricultural insurance plays an important role in promoting food security.

4.5. Heterogeneity Analysis

There is heterogeneity in the impact of agricultural insurance on FSI in different regions. We divided the 31 provinces into 3 main functional regions according to the proportion of food supply and consumption (Table 2). We further analyzed the impact of agricultural insurance on food security in different regions. The results are shown in Table 8.
The coefficient of insurance is significantly positive at a level of 5% in the major food-producing regions (column (1)). The coefficient of insurance is significantly negative in the MGC and GCPB at a level of 10% for the following reasons. The MGC region and GCPB region have relatively small areas under grain cultivation, so agricultural insurance may instead increase the cost of agricultural inputs [36]. Agricultural insurance, therefore, has a negative impact on food security.

5. Discussion and Conclusions

This study used the entropy method to quantify FSI based on panel data for 31 Chinese provinces from 2003 to 2020 and systematically evaluated the effects of agricultural insurance and climate change on FSI. We further explored how agricultural insurance affects the availability of different food types in various geographical areas. The following are the primary conclusions.
  • Food security is significantly impacted by climate change, particularly because of the threat posed by excessive temperatures.
  • The effects of agricultural insurance on the FSI and grain yield of various species are all significant at a 5% to 10% level, suggesting that agricultural insurance contributes to ensuring food security.
  • Agricultural insurance can ensure food security by minimizing the effects of climate change on food production through its loss compensation function.
  • Agricultural insurance has a different effect on food security depending on the location, with the major food-producing regions experiencing greater influence.
  • The impact of agricultural insurance on maize yields was stronger than that for rice yields and wheat yields.
Numerous studies demonstrated that crop production is significantly impacted by climate change, especially at the national and regional levels [7,10].
In many nations and regions of the world, rising temperatures would result in decreased food production. According to existing literature [7,10,11,24,40,43], the effects of climate change on crop output vary. Climate change has led to increased maize and rice production, as well as decreased wheat production. The increase in maximum and minimum temperatures has caused this discrepancy [37,40].
Increased minimum and maximum temperatures have a negative effect on wheat yields [32,40] but a beneficial effect on maize and rice yields (Table 4).
This study only examined the effects of eight variables (such as T, P, Spring, Summer, Autumn, and Winter) on the yields of three major grain crops in China and did not consider the seasonal differences of all climatic factors. Nevertheless, the analysis of the impact of climate change on food production provided useful information for adjusting agricultural production strategies to better adapt to climate change.
Agricultural insurance is a risk-management instrument used to safeguard agricultural production [15,19]. Agricultural insurance has a positive impact on food production in the context of large-scale operations [10]. The larger the operation is, the stronger the agricultural insurance cover will be [5,40,43,62].
A vital component of developing agriculture sustainably is ensuring food security. For the development of agricultural insurance, research on the connections between climate change, agricultural insurance, and food security under the framework of sustainable agricultural growth is instructive. According to this study, agricultural insurance can mitigate the detrimental effects of climate change on food security.
Given the foregoing analysis and recommendations, this article has significant policy implications. First, the results demonstrate how crop insurance might lessen the detrimental effects of climate change on food security. Thus, the Chinese government ought to continue enforcing farm insurance laws and enhancing the subsidy program. This will successfully increase agricultural producers’ demands for insurance and help the market for agricultural insurance flourish.
Second, the results suggest that agricultural insurance contributes more significantly to food security in the major food-producing regions. Therefore, it is essential to enhance management scale policies to promote intensive land management and boost agricultural cultivation specialization.
Third, this study discovered that maize yields are significantly increased by agricultural insurance. Agricultural insurance should include various subsidy systems in various cropping configurations to provide food security and encourage sustainable agricultural development.
This study broadens the research disparities between the factors impacting food security and the variations in research on agricultural insurance on food security under regional heterogeneity by showing the influence of climate change and agricultural insurance on food security. The results provide suggestions for food security and sustainable agricultural growth, adding to the body of knowledge already available on the factors affecting food security.
Nevertheless, this study has certain limitations. Firstly, only data from 2003–2020 were used for the model in this work due to restrictions on data collecting. With the growth of databases, a more thorough empirical analysis could be performed in future studies. Secondly, this work primarily used macro data for empirical analysis rather than exploring a micro perspective. Lastly, this study did not focus on green agriculture production because of sustainable agricultural development.

Author Contributions

Conceptualization, H.W. and D.W.; methodology, H.W.; software, H.W.; validation, H.W., D.W. and H.L.; formal analysis, H.W.; investigation, H.W.; resources, H.W.; data curation, H.W.; writing—original draft preparation, H.W.; writing—review and editing, H.W. and D.W.; visualization, H.W.; supervision, D.W.; project administration, H.W.; funding acquisition, H.L. and H.W. All authors have read and agreed to the published version of the manuscript.

Funding

This research was funded by the National Social Science Foundation, grant number 20&ZD132, and the Central Universities Basic Research Project for Young Teachers Academic Innovation, grant number 2722022BQ059.

Institutional Review Board Statement

Not applicable.

Informed Consent Statement

Not applicable.

Data Availability Statement

The meteorological datasets generated for this study are available from the National Oceanic and Atmospheric Administration. The grain crop growth cycle datasets presented in the study are available from the Ministry of Agriculture and Rural Affairs of the People’s Republic of China. The socio-economic datasets presented in the study are available from the China Statistical Yearbook (2003–2021) and the China Research Data Service Platform (CNRDS) database.

Conflicts of Interest

The authors declare no conflict of interest.

References

  1. Godfray, H.C.J.; Beddington, J.R.; Crute, I.R.; Haddad, L.; Lawrence, D.; Muir, J.F.; Pretty, J.; Robinson, S.; Thomas, S.M.; Toulmin, C. Food security: The challenge of feeding 9 billion people. Science 2010, 327, 812–818. [Google Scholar] [CrossRef] [PubMed] [Green Version]
  2. Tilman, D.; Balzer, C.; Hill, J.; Befort, B.L. Global food demand and the sustainable intensification of agriculture. Proc. Natl. Acad. Sci. USA 2011, 108, 20260–20264. [Google Scholar] [CrossRef] [PubMed] [Green Version]
  3. Lobell, D.B.; Schlenker, W.; Costa-Roberts, J. Climate trends and global crop production since 1980. Science 2011, 333, 616–620. [Google Scholar] [CrossRef] [PubMed] [Green Version]
  4. Holst, R.; Yu, X.; Grün, C. Climate Change, Risk and Grain Yields in China. J. Integr. Agric. 2013, 12, 1279–1291. [Google Scholar] [CrossRef]
  5. United Nations. Sustainable Development Goals, Food-Security-and-Nutrition-and-Sustainable-Agriculture. 2022. Available online: https://sdgs.un.org/goals/goal2 (accessed on 13 July 2022).
  6. Wong, H.L.; Wei, X.; Kahsay, H.B.; Gebreegziabher, Z.; Gardebroek, C.; Osgood, D.E.; Diro, R. Effects of input vouchers and rainfall insurance on agricultural. World Dev. 2020, 135, 105074. [Google Scholar] [CrossRef]
  7. Shi, W.J.; Tao, F.L. Spatio-temporal distributions of climate disasters and the response of wheat yields in China from 1983 to 2008. Nat. Hazards 2014, 74, 569–583. [Google Scholar] [CrossRef]
  8. Lawless, C.; Semenov, M.A. Assessing lead-time for predicting wheat growth using a crop simulation model. Agric. For. Meteorol. 2005, 135, 302–313. [Google Scholar] [CrossRef]
  9. Guo, E.L.; Liu, X.P.; Zhang, J.Q.; Wang, Y.F.; Wang, C.L.; Wang, R.; Li, D.J. Assessing spatiotemporal variation of drought and its impact on maize yield in Northeast China. J. Hydrol. 2017, 553, 231–247. [Google Scholar] [CrossRef]
  10. Lobell David, B.; Burke Marshall, B.; Tebaldi, C.; Mastrandrea Michael, D.; Falcon Walter, P.; Naylor Rosamond, L. Prioritizing Climate Change Adaptation Needs for Food Security in 2030. Science 2008, 319, 607–610. [Google Scholar] [CrossRef]
  11. Asseng, S.; Ewert, F.; Rosenzweig, C.; Jones, J.W.; Hatfield, J.L.; Ruane, A.C.; Wolf, J. Uncertainty in simulating wheat yields under climate change. Nat. Clim. Chang. 2013, 3, 827–832. [Google Scholar] [CrossRef] [Green Version]
  12. Schmidhuber, J.; Tubiello, F.N. Global food security under climate change. Proc. Natl. Acad. Sci. USA 2007, 104, 19703–19708. [Google Scholar] [CrossRef] [Green Version]
  13. Pittelkow, C.M.; Liang, X.Q.; Linquist, B.A.; van Groenigen, K.J.; Lee, J.; Lundy, M.E.; van Kessel, C. Productivity limits and potentials of the principles of conservation agriculture. Nature 2015, 517, 365–368. [Google Scholar] [CrossRef] [PubMed]
  14. Miraglia, M.; Marvin, H.J.P.; Kleter, G.A.; Battilani, P.; Brera, C.; Coni, E.; Vespermann, A. Climate change and food safety: An emerging issue with special focus on Europe. Food Chem. Toxicol. 2009, 47, 1009–1021. [Google Scholar] [CrossRef] [PubMed]
  15. Glauber, J.W. The growth of the federal crop insurance program, 1990–2011. Am. J. Agric. Econ. 2013, 95, 482–488. [Google Scholar] [CrossRef] [Green Version]
  16. Ker, A.P.; Tolhurst, T.N. On the treatment of heteroscedasticity in crop yield data. Am. J. Agric. Econ. 2019, 101, 1247–1261. [Google Scholar] [CrossRef]
  17. Möhring, N.; Dalhaus, T.; Enjolras, G.; Finger, R. Crop insurance and pesticide use in European agriculture. Agric. Syst. 2020, 184, 102902. [Google Scholar] [CrossRef]
  18. King, M.; Singh, A.P. Understanding farmers’ valuation of agricultural insurance: Evidence from Vietnam. Food Pol. 2020, 94, 101861. [Google Scholar] [CrossRef] [Green Version]
  19. Bielza, M.; Stroblmair, J.; Gallego, J.; Conte, C.G.; Dittmann, C. Agricultural risk management in Europe. In Proceedings of the European Association of Agricultural Economists (EAAE), 101st Seminar, Berlin, Germany, 5–6 July 2007; p. 22. [Google Scholar]
  20. China Banking and Insurance Regulatory Commission. China Insurance Statistical Yearbooks. 2022. Available online: http://www.cbirc.gov.cn/cn/view/pages/tongjishuju/tongjishuju.html (accessed on 13 June 2022).
  21. Ayinu, Y.T.; Ayal, D.Y.; Zeleke, T.T.; Beketie, K.T. Impact of climate variability on household food security in Godere District, Gambella Region, Ethiopia. Clim. Serv. 2022, 27, 100307. [Google Scholar] [CrossRef]
  22. Liu, Y.; Zhou, Y. Reflections on China’s food security and land use policy under rapid urbanization. Land Use Pol. 2021, 109, 105699. [Google Scholar] [CrossRef]
  23. IPCC. Climate Change 2022: Mitigation of Climate Change. 2022. Available online: https://www.ipcc.ch/report/ar6/wg3/ (accessed on 13 July 2022).
  24. Asseng, S.; Foster, I.; Turner, N.C. The impact of temperature variability on wheat yields. Glob. Chang. Biol. 2011, 17, 997–1012. [Google Scholar] [CrossRef]
  25. Lobell, D.B.; Field, C.B. Global scale climate–crop yield relationships and the impacts of recent warming. Environ. Res. Lett. 2007, 2, 014002. [Google Scholar] [CrossRef]
  26. Rosenzweig, C.; Elliott, J.; Deryng, D.; Ruane, A.C.; Muller, C.; Arneth, A.; Jones, J.W. Assessing agricultural risks of climate change in the 21st century in a global gridded crop model intercomparison. Proc. Natl. Acad. Sci. USA 2014, 111, 3268–3273. [Google Scholar] [CrossRef] [PubMed] [Green Version]
  27. Xiong, W.; Holman, I.; Conway, D.; Jiang, J.H.; Xu, Y.L.; Li, Y. Climate change, water availability and future cereal production in China. Agric. Ecosyst. Environ. 2010, 135, 58–69. [Google Scholar] [CrossRef]
  28. Brown, M.E.; Funk, C.C. Food Security Under Climate Change. Science 2008, 319, 580–581. [Google Scholar] [CrossRef] [Green Version]
  29. Olesen, J.E.; Bindi, M. Consequences of climate change for European agricultural productivity, land use and policy. EUR J. Agron. 2002, 16, 239–262. [Google Scholar] [CrossRef]
  30. Lake, I.R.; Hooper, L.; Abdelhamid, A.; Bentham, G.; Boxall, A.B.A.; Draper, A.; Fairweather-Tait, S.; Hulme, M.; Hunter, P.R.; Nichols, G.; et al. Climate Change and Food Security: Health Impacts in Developed Countries. Environ. Health Persp. 2012, 120, 1520–1526. [Google Scholar] [CrossRef]
  31. Dubey, S.K.; Sharma, D. Assessment of climate change impact on yield of major crops in the Banas River Basin, India. Sci. Total Environ. 2018, 635, 10–19. [Google Scholar] [CrossRef] [PubMed]
  32. Kamali, B.; Abbaspour, K.C.; Wehrli, B.; Yang, H. Drought vulnerability assessment of maize in Sub-Saharan Africa: Insights from physical and social perspectives. Glob. Planet Chang. 2018, 162, 266–274. [Google Scholar] [CrossRef] [Green Version]
  33. Wang, C.Y.; Linderholm, H.W.; Song, Y.L.; Wang, F.; Liu, Y.J.; Tian, J.F.; Ren, G.Y. Impacts of Drought on Maize and Soybean Production in Northeast China During the Past Five Decades. Int. J. Environ. Res. Pub. Health 2020, 17, 2459. [Google Scholar] [CrossRef] [PubMed] [Green Version]
  34. Constantinidou, K.; Hadjinicolaou, P.; Zittis, G.; Lelieveld, J. Effects of climate change on the yield of winter wheat in the eastern Mediterranean and Middle East. Clim. Res. 2016, 69, 129–141. [Google Scholar] [CrossRef] [Green Version]
  35. Ciais, P.; Reichstein, M.; Viovy, N.; Granier, A.; Ogée, J.; Allard, V.; Aubinet, M.; Buchmann, N.; Bernhofer, C.; Carrara, A.; et al. Europe-wide reduction in primary productivity caused by the heat and drought in 2003. Nature 2005, 437, 529–533. [Google Scholar] [CrossRef] [PubMed]
  36. Nelson Gerald, C.; Valin, H.; Sands Ronald, D. Climate change effects on agriculture: Economic responses to biophysical shocks. Proc. Natl. Acad. Sci. USA 2014, 111, 3274–3279. [Google Scholar] [CrossRef] [PubMed] [Green Version]
  37. Tao, F.; Feng, Z.; Tang, H.; Chen, Y.; Kobayashi, K. Effects of climate change, CO2 and O3 on wheat productivity in Eastern China, singly and in combination. Atmos. Environ. 2017, 153, 182–193. [Google Scholar] [CrossRef] [Green Version]
  38. Wang, J.; Wang, C.; Chen, N.; Xiong, Z.; Wolfe, D.; Zou, J. Response of rice production to elevated [CO2] and its interaction with rising temperature or nitrogen supply: A meta-analysis. Clim. Chang. 2015, 130, 529–543. [Google Scholar] [CrossRef]
  39. Carter, M.R.; Cheng, L.; Sarris, A. Where and how index insurance can boost the adoption of improved agricultural technologies. J. Dev. Econ. 2016, 118, 59–71. [Google Scholar] [CrossRef]
  40. Fang, L.; Hu, R.; Mao, H.; Chen, S. How crop insurance influences agricultural green total factor productivity: Evidence from Chinese farmers. J. Clean. Prod. 2021, 321, 128977. [Google Scholar] [CrossRef]
  41. Glauber, J.W. Crop insurance reconsidered. Am. J. Agric. Econ. 2004, 86, 1179–1195. Available online: https://www.jstor.org/stable/3697927 (accessed on 13 July 2022). [CrossRef]
  42. Chemeris, A.; Liu, Y.; Ker, A.P. Insurance subsidies, climate change, and innovation: Implications for crop yield resiliency. Food Policy 2022, 108, 102232. [Google Scholar] [CrossRef]
  43. Li, H.; Yuan, K.; Cao, A.; Zhao, X.; Guo, L. The role of crop insurance in reducing pesticide use: Evidence from rice farmers in China. J. Environ. Manag. 2022, 306, 114456. [Google Scholar] [CrossRef]
  44. Sinnarong, N.; Kuson, S.; Nunthasen, W.; Puphoung, S.; Souvannasouk, V. The Potential Risks of Climate Change and Weather Index Insurance Scheme for Thailand’s Economic Crop Production. Environ. Chall. 2022, 8, 100575. [Google Scholar] [CrossRef]
  45. Belissa, T.; Bulte, E.; Cecchi, F.; Gangopadhyay, S.; Lensink, R. Liquidity constraints, informal institutions, and the adoption of weather insurance: A randomized controlled Trial in Ethiopia. J. Dev. Econ. 2019, 140, 269–278. [Google Scholar] [CrossRef]
  46. Azzam, A.; Walters, C.; Kaus, T. Does subsidized crop insurance affect farm industry structure? Lessons from the U.S. J. Policy Model. 2021, 43, 1167–1180. [Google Scholar] [CrossRef]
  47. Guo, J.; Tanaka, T. Energy security versus food security: An analysis of fuel ethanol- related markets using the spillover index and partial wavelet coherence approaches. Energy Econ. 2022, 112, 106142. [Google Scholar] [CrossRef]
  48. Cai, J.; Leung, P. Unlocking the potential of aquatic foods in global food security and nutrition: A missing piece under the lens of seafood liking index. Glob. Food Secur. 2022, 33, 100641. [Google Scholar] [CrossRef]
  49. Coghlan, C.; Bhagwat, S. Geographical patterns in food availability from pollinator-dependent crops: Towards a Pollinator Threat Index of food security. Glob. Food Secur. 2022, 32, 100614. [Google Scholar] [CrossRef]
  50. Chen, P.-C.; Yu, M.-M.; Shih, J.-C.; Chang, C.-C.; Hsu, S.-H. A reassessment of the Global Food Security Index by using a hierarchical data envelopment analysis approach. Eur. J. Oper. Res. 2019, 272, 687–698. [Google Scholar] [CrossRef]
  51. Caccavale, O.M.; Giuffrida, V. The Proteus composite index: Towards a better metric for global food security. World Dev. 2020, 126, 104709. [Google Scholar] [CrossRef]
  52. Galeana-Pizaña, J.M.; Couturier, S.; Monsivais-Huertero, A. Assessing food security and environmental protection in Mexico with a GIS-based Food Environmental Efficiency index. Land Use Policy 2018, 76, 442–454. [Google Scholar] [CrossRef]
  53. Sam, A.S.; Abbas, A.; Padmaja, S.S.; Sathyan, A.R.; Vijayan, D.; Kächele, H.; Kumar, R.; Mueller, K. Flood vulnerability and food security in eastern India: A threat to the achievement of the Sustainable Development Goals. Int. J. Disaster Risk Reduct. 2021, 66, 102589. [Google Scholar] [CrossRef]
  54. Singh, R.K.; Joshi, P.K.; Sinha, V.S.P.; Kumar, M. Indicator based assessment of food security in SAARC nations under the influence of climate change scenarios. Future Foods 2022, 5, 100122. [Google Scholar] [CrossRef]
  55. Haile, D.; Seyoum, A.; Azmeraw, A. Food and nutrition security impacts of resilience capacity: Evidence from rural Ethiopia. J. Agric. Food Res. 2022, 8, 100305. [Google Scholar] [CrossRef]
  56. Waha, K.; Accatino, F.; Godde, C.; Rigolot, C.; Bogard, J.; Domingues, J.P.; van Wijk, M. The benefits and trade-offs of agricultural diversity for food security in low- and middle-income countries: A review of existing knowledge and evidence. Glob. Food Secur. 2022, 33, 100645. [Google Scholar] [CrossRef]
  57. Ahmad, A.; Liu, Y.; Ge, Q. Assessing environmental thresholds in relation to plant structure and nutritional value for improved maize calendar ensuring food security. Sci. Total Environ. 2022, 834, 155120. [Google Scholar] [CrossRef]
  58. Khanal, U.; Wilson, C.; Rahman, S.; Lee, B.L.; Hoang, V.N. Smallholder farmers’ adaptation to climate change and its potential contribution to UN’s sustainable development goals of zero hunger and no poverty. J. Clean. Prod. 2021, 281, 124999. [Google Scholar] [CrossRef]
  59. National Bureau of Statistics. Provincial Statistical Yearbooks (2002–2021). 2022. Available online: http://www.stats.gov.cn/english/Statisticaldata/AnnualData (accessed on 13 June 2022).
  60. China Research Data Service Platform. Regional Economic Database. 2022. Available online: https://www.cnrds.com (accessed on 13 June 2022).
  61. Panwar, V.; Sen, S. Economic Impact of Natural Disasters: An Empirical Re-examination. Margin J. Appl. Econ. Res. 2018, 13, 109–139. [Google Scholar] [CrossRef]
  62. Liu, E.M.; Huang, J. Risk preferences and pesticide use by cotton farmers in China. J. Dev. Econ. 2013, 103, 202–215. [Google Scholar] [CrossRef] [Green Version]
  63. National Bureau of Statistics. Interpretation of Statistical Indicators. 2019. Available online: http://www.stats.gov.cn/tjsj/zbjs/ (accessed on 13 July 2022).
Figure 1. Analysis Framework of agricultural insurance, climate change, and food security.
Sustainability 14 09493 g001
Table 1. Food Security Index (FSI) system.
Index CategoryIndex NameEvaluating IndicatorIndicator Attributes
Nutritional SecurityTotal vegetables, meat, poultry and eggs, milk, and fish (million tons)Total production of vegetables, mutton, pork, beef, dairy products, poultry eggs, and aquaculture in 31 provinces, 2003–2020+
Food self-sufficiency rateTotal food production/total food consumption+
Food ownership per capitaTotal food production/resident population+
Grain sown areaActual area sown to grain+
Effective irrigation rateEffective irrigated area/grain sown area+
Total mechanical power per unit of grain sown areaTotal agricultural machinery power/grain sown area+
Consumption SustainabilityDisposable income per rural residentDisposable income per rural resident+
Rural Engel CoefficientFood consumption expenditure of rural residents/total consumption expenditure-
Traffic density(Length of transport by rail + road + water)/area of province-
Production SustainabilityFood price volatility(Current year food price index − previous year food price index)/current year food price index-
Planting structureArea sown to soybeans/area sown to the three main grains-
Percentage of crop damageArea of crop damage/area of grain sown-
Food reserve levels(Total food production − total food consumption)/food production+
Sustainable AgricultureFertilizer useFertilizer application/grain sown area+
Pesticide usePesticide application/area of grain sown-
Financial SupportFinancial expenditure on foodNational financial expenditure on agriculture × (area sown for food/total area sown)+
Table 2. 2003–2020 Average FSI for main grain-producing areas, main grain-consuming areas, and grain-consuming-production balance areas.
MGPFSIMGCFSIGCPBFSI
Jiangsu0.470Beijing0.285Qinghai0.273
Henan0.431Shanghai0.282Hainan0.266
Heilongjiang0.374Fujian0.281Shaanxi0.264
Sichuan0.342Guangdong0.278Xinjiang0.259
Jilin0.334Chongqing0.275Tibet0.255
Jiang xi0.331Zhejiang0.273Shanxi0.253
Hubei0.329Tianjin0.273Yunnan0.236
Anhui0.325 Ningxia0.225
Inner Mongolia0.318 Gansu0.223
Hebei0.317 Guangxi0.216
Liaoning0.299 Guizhou0.180
Shandong0.297
Hunan0.295
Table 3. Variable definitions and descriptive statistical analysis.
VariablesLabelMeanStd. Dev.
Dependent Variables
Food security index (%)FSI29.2248.72
Rice yield (million tons)RY1129.058849.977
Wheat yield (million tons)WY779.407981.60
Maize yield (million tons)MY1199.85976.22
Independent Variables
Regional agricultural insurance premium incomeInsurance8.717.65
Regional agricultural insurance compensation amountCompensation5.595.68
Climate Variables
Extremely cold (Accumulated days)CTD-0 °C33.6519.52
Extremely hot (Accumulated days)EHD30 °C+10.758.29
Precipitation (mm)P917.101530.42
Temperature (°C)T14.4765.074
Spring rainfall (mm)Spring71.73964.055
Summer rainfall (mm)Summer148.74276.395
Autumn rainfall (mm)Autumn68.27352.201
Winter rainfall (mm)Winter26.15228.868
Control Variables
Average years of education in countryside (years)Education8.2280.127
Proportion of area affected (%)Hazard0.760.52
Urbanization (%)Urban0.530.14
Number of agricultural R&D techniciansResearch2067811910
Proportion of investment in agricultural infrastructure (%)Infrastructure0.490.146
Note: Grain yields such as maize, wheat, and rice are forecast based on actual cut-and-measured surveys conducted by China’s National Bureau of Statistics. When estimating yield, it is necessary to calculate the water and miscellaneous conversion factor. Water and miscellaneous conversion factor = (1 − observed water impurity rate)/(1 − national standard rate) × 100%. The moisture standards for maize, wheat, and rice are 14%, 12.5%, and 13.5%, respectively, with a 1% impurity requirement [63].
Table 4. Climate change and food security.
Variables(1)(2)(3)(4)
FSIRice YieldWheat YieldMaize Yield
CTD-0 °C−0.31 *−1.68 *−0.01 *−0.003 *
(0.117)(0.81)(−0.005)(−0.01)
EHD30 °C+−0.06 *−0.012 *−0.013 *18.73
(0.019)(0.0058)(0.006)(9.68)
T0.086 *−0.27 *0.22 *0.658 *
(0.034)(0.0671)(0.104)(0.22)
P−0.005 *−0.035 *0.04 *−0.12 *
(0.002)(0.016)(0.021)(0.006)
Spring0.03 *0.316 *0.063 *0.04 *
(0.015)(0.027)(0.031)(0.005)
Summer−0.010.348 *−0.060.83 *
(0.043)(0.19)(0.004)(0.33)
Autumn−0.0060.38−0.020.62 *
(0.0049)(0.127)(0.009)(0.069)
Winter−0.087−0.212−0.720−0.037 *
(0.0031)(0.0455)(0.23)(0.01)
Year FEControlControlControlControl
Province FEControlControlControlControl
R20.8060.960.970.83
N527527527527
Note: Significance denoted by * p < 0.1. The standard errors in parentheses are adjusted by the clustering of provinces. EHD30 °C+ represent days higher than 30 °C in the plant growth cycle and CTD-0 °C represent days lower than 0 °C.
Table 5. Agricultural insurance, climate change, and food security.
Variables(5)(6)(7)(8)
FDIRice YieldWheat YieldMaize Yield
CTD-0 °C−0.22 *−0.73 *−2.66 *−2.70 *
(0.043)(−0.09)(−0.81)(0.167)
EHD30 °C+−0.096 *0.27−0.1530.456 *
(−0.028)(0.037)(−0.024)(0.031)
T−0.180 *−1.22 *15.160.658 *
(0.036)(0.17)(2.28)(0.04)
P0.001 *−0.028 *−1.62 **−0.112 *
(0.000)(0.64)(0.068)(0.011)
Insurance0.32 *0.015 *0.029 *0.06 ***
(0.017)(0.001)(0.004)(0.014)
Education0.772 *17.059.389.48
(0.28)(0.639)(0.16)(0.944)
Hazard−0.03 *−0.005 *−0.008 *−0.03 *
(0.001)(0.002)(0.003)(0.01)
Research0.23 *−0.0003 *−0.001 *0.018 *
(0.03)(0.0001)(0.0002)(0.0045)
Urban0.004 *−2.78 *−6.088 *−2.465 *
(0.001)(0.059)(0.338)(0.056)
Industrialization−0.00280.0009004 *0.001 *0.0016779 *
(0.0011)(0.00016)(0.0004)(0.000557)
Year FEControlControlControlControl
Province FEControlControlControlControl
N527527527527
R20.950.960.980.93
Note: Significance denoted by *** p < 0.01, ** p < 0.05, and * p < 0.1. The standard errors in parentheses were adjusted by the clustering of provinces. EHD30 °C+ represent days higher than 30 °C in the plant growth cycle and CTD-0 °C represent days lower than 0 °C.
Table 6. Analysis of robustness: Substitution of the primary independent variable.
Variables(1)(2)(3)(4)
FSIRice YieldWheat YieldMaize Yield
Compensation0.001 ***0.012 *0.005 *0.015 *
(0.00012)(0.0018)(0.0028)(0.002)
CTD-0 °C−0.029 *−0.880 *−1.0511.394
(−0.00271)(0.187)(0.063)(0.215)
EHD30 °C+−0.064 *−0.213−0.797 *2.799
(0.032)(−0.036)(0.115)(0.010)
T0.025 *−2.1310.505−2.432
(0.0119)(0.766)(0.173)(0.196)
LnP0.002 *0.014−0.061−0.093
(0.00082)(0.0024)(−0.0096)(0.045)
Hazard0.030 *−0.006 *−4.162−0.022 *
(−0.013)(0.0019)(0.190)(0.0017)
LnIndustrialization0.0011 *0.006 *0.0010.002
(0.000)(0.001)(0.000)(0.000)
LnResearch0.000 ***−0.006 *−4.160.018 *
(0.001)(0.006)(0.002)(0.003)
LnUrban0.012 *−2.419 *0.005 *1.316
(0.001)(0.104)(−0.001)(0.510)
Education0.732 *1.8405.1542.206
(0.300)(0.715)(0.889)(0.881)
Note: Significance denoted by *** p < 0.01, and * p < 0.1. The standard errors in parentheses were adjusted by the clustering of provinces. EHD30 °C+ represent days higher than 30 °C in the plant growth cycle and CTD-0 °C represent days lower than 0 °C.
Table 7. Endogeneity issue: The independent variable lags by one period.
VariablesFSI
IV + GMM
Insurance × CTD0−0.004542 *
(−0.0139)
Insurance × EHD30−0.0832 **
(0.0339)
Insurance × Lnt0.6710 *
(0.317)
Insurance × Lnp0.2256 *
(0.113)
Insurance L0.346 *
(−0.077)
Education0.772 *
(−0.28)
Hazard−0.03 *
(−0.019)
Investment2.57 *
(−0.02)
Research0.23 *
(−0.03)
Urban0.004 *
(−0.00168)
Year FEControl
Province FEControl
N527
R20.5925
AR(1) Test−2.37
(0.018)
AR(2) Test0.11
(0.014)
Note: Significance denoted by ** p < 0.05, and * p < 0.1. The standard errors in parentheses were adjusted by the clustering of provinces.
Table 8. Agricultural insurance and FSI: Heterogeneity analysis.
VariablesMGPMGCGCPB
(1)(2)(3)
Insurance0.0002 **−2.297 *−0.0027
(0.0001)(−0.34)(−0.0001)
Ln Researcher0.0002 **0.0005 *0.0007
(0.0001)(0.0001)(0.0129)
Ln Investment0.0036 ***−0.00020.0001
(0.0001)(0.0001)(0.022)
Ln Hazard−0.488 ***−0.0002 *−0.002
(−0.051)(0.0001)(−0.2)
Ln Urban−0.404−3.9036−0.0184 *
(−0.021)(−0.38)(−0.009)
Ln Education−0.461 *0.8694 *0.1306 **
(0.0541)(0.27)(0.045)
N221119187
R20.50840.45630.5320
Time FeControlControlControl
Provinces FeControlControlControl
Note: Significance denoted by *** p < 0.01, ** p < 0.05, and * p < 0.1. The standard errors in parentheses were adjusted by the clustering of provinces.
Publisher’s Note: MDPI stays neutral with regard to jurisdictional claims in published maps and institutional affiliations.

