Article

Explaining the Differences between the Environmental Impacts of 44 French Artisanal Cheeses

Université Paris-Saclay, INRAE, AgroParisTech, UMR SayFood, 91120 Palaiseau, France
*
Author to whom correspondence should be addressed.
Sustainability 2022, 14(15), 9484; https://doi.org/10.3390/su14159484
Submission received: 21 June 2022 / Revised: 24 July 2022 / Accepted: 25 July 2022 / Published: 2 August 2022
(This article belongs to the Special Issue Sustainable Diets, Food, and Nutrition)

Abstract

:
Cheese production causes significant environmental impacts, which have to be reduced. In France, a lot of different cheeses are available, made from different milks but also from different cheese technologies. The goal of this study was to understand the origin of the environmental impact variation between cheeses made from different technologies and milks and produced using different ripening practices. To do so, the environmental impacts of 44 different types of French artisanal cheese, all produced under protected designation of origin (PDO) labels, were assessed using the life cycle assessment. Cheese technologies were fully described and two ripening scenarios were investigated. Results show that the differences of environmental impacts between cheeses mainly come from: the milk type (cow, goat, or sheep), the milk amount needed to produce one kilogram of cheese, the energetic performance of the ripening room, and the ripening time. Such results could be useful to cheesemakers to identify the origin of the environmental impacts of their products and to implement effective actions to reduce them. According to the results, innovations leading to the reduction in electrical consumption during ripening are interesting to explore in order to increase the environmental performance of a cheese.

1. Introduction

Cheese is an appreciated food product, especially in the European Union, where more than 39% of total whole milk production is used for cheese [1]. In France, cheese plays an integral part in traditional culture and gastronomy; indeed, in [2] it is estimated that in 2020, the average annual cheese consumption per capita in France was 27.4 kg.
However, this consumption is not without its costs, as animal products, such as cheese, are linked with serious environmental impacts. Among the different methods used to assess environmental impacts, the life cycle assessment (LCA) is well regarded because it evaluates the potential environmental impact associated with a product, process, or service over its entire life cycle. It is a multicriteria method of evaluation that is scientifically recognized and standardized under ISO standards 14040 to 14044 [3]. Furthermore, the European Union established a theoretical and practical framework to promote the standardization of LCA practices used for quantifying the environmental performance of products (Product Environmental Footprint Category 2 Rules Guidance, 2018; Suggestions for updating the Product Environmental Footprint (PEF) method, 2019). These standards form a basis for the effective comparison of multiple scenarios with regard to the scope of different evaluations and their underlying assumptions. With these advances, LCA became a method of choice in studies focusing on the agrifood sector [4].
A 2017 review examined 16 published examples of LCAs conducted for different cheeses [5]. The 16 studies were carried out in different countries, but shared largely similar goals: to define the environmental “hotspots” of cheese production (using a mass-based functional unit) in order to either reduce environmental impacts or compare different production plants. When possible, the review compared the LCA results of the different studies with respect to the potential impacts on global warming, acidification, and eutrophication, divided into the following steps: raw milk production, raw milk transportation, milk processing, and cheese packaging. Across all studies, the step with the largest environmental impacts tended to be raw milk production. A similar finding was reported by [6] in his literature review of 31 published LCAs of dairy products, of which 17 were for cheeses (8 of the 17 were also included in the review of [5]). Both of these literature reviews highlighted the fact that the most commonly calculated environmental impact was global warming potential, followed by eutrophication and acidification potential. Impacts of cheeses on other environmental categories were less often examined, with the result that the overall picture in the scientific literature is less clear.
The strong degree of overlap between these two reviews highlights the fact that the number of LCAs performed on cheese is quite low given the extraordinary number and diversity of products in this category. In France alone, there are more than 1200 varieties of cheese [7], which differ from one to another in numerous ways, such as the milk they are made of (cow, sheep, or goat), the cheese technology used, or the ripening time. This diversity is currently not well represented in the literature. Indeed, a recent examination of 25 LCAs of cheese by [8] included the same 17 studies included in the literature review of [6] as well as the 16 studies reviewed by [5] (with 8 studies included in both). Furthermore, the studies carried out to date focused on only one or a small number of cheeses, making it difficult to understand the origin of any possible variations in the environmental impacts of cheese. Moreover, the system boundaries, environmental categories assessed, and allocations used are often different from one study to another, which hampers quantitative comparisons.
For this reason, the aim of this study was to study the hotspots and compare the environmental impacts of a large number of cheeses in order to understand the origin of their differences by investigating possible correlations between cheese characteristics and their environmental impacts. We selected French PDO cheeses as our model system because they encompass a large diversity of milk types and cheese technologies. Protected designation of origin (PDO) is a European label attributed to food products produced in a specific geographical area whose unique characteristics are reflective of time-honoured production techniques and local knowledge. As of the time of this study, 45 cheeses benefit from this quality label in France [9]. On average, PDO cheeses represent 15.8% of the total production of ripened cheeses in France [10]. These cheeses were also suited for this study because their production is highly regulated by strict and detailed specifications that could be consulted for data collection. After the cheesemaking process, cheesemakers can choose to ripen their cheeses at the production site or to ripen them off-site in a dedicated shared ripening room. These two scenarios will be analyzed in the study in order to understand how these two practices can influence the environmental impacts of cheeses.

2. Materials and Methods

For this study, we followed the four steps of life cycle assessment: goal and scope definition, life cycle inventory analysis, life cycle impact assessment (LCIA), and interpretation of results.

2.1. Goal and Scope

The goals of this study were to analyze the environmental impacts of a large sample of cheeses (44 French PDO cheeses), determine the most significant impacts associated with different cheese production processes, and better understand the links between the different characteristics of cheese and its environmental impacts.

2.1.1. Product Selection

The 44 PDO cheeses studied, as well as the technologies and types of milk used for each, are presented in Table 1.
The only PDO cheese not included in this study, Brocciu, was excluded because it is the only PDO cheese produced from whey, and would therefore represent an outlier in the analysis.

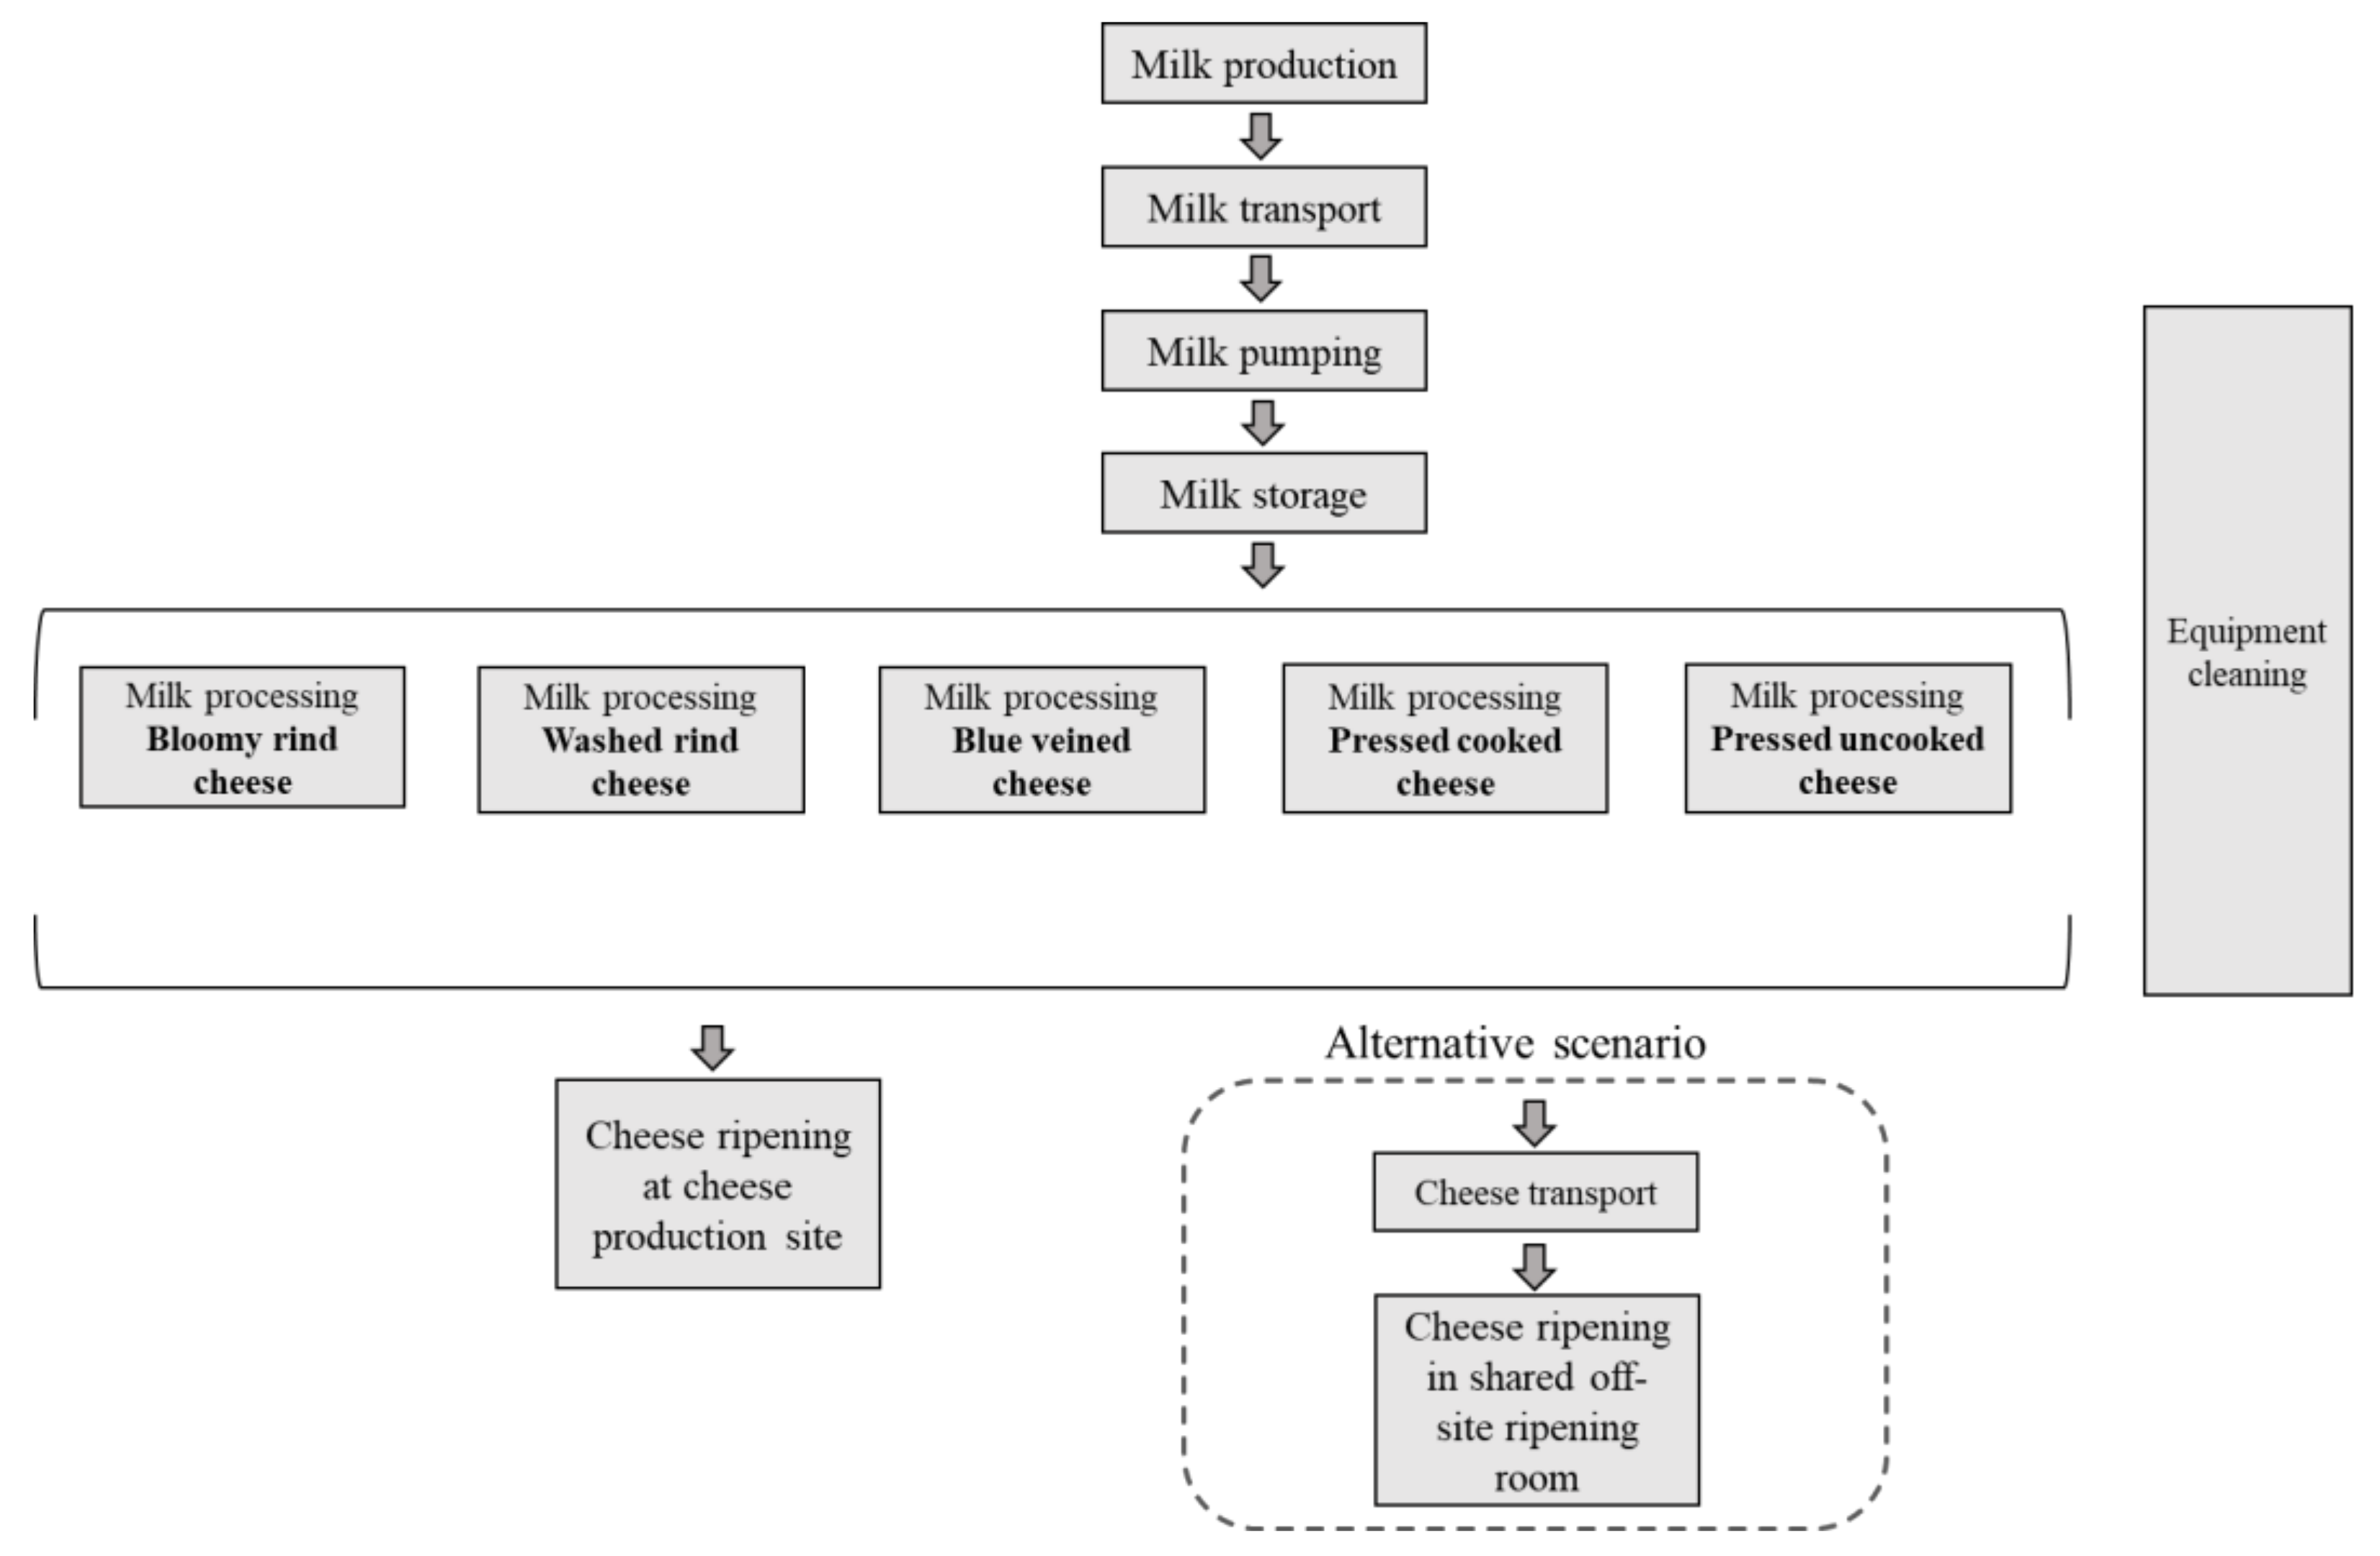
2.1.2. System Boundaries

The steps of cheese production analyzed in this study are presented in Figure 1. Initially, we aimed to model only a base scenario of an on-site cheesemaking process in which cheeses are ripened in a small room close to the production area. However, it became clear from discussions with experts that there are major disparities in the energy usage and efficiency of ripening rooms. For this reason, we also studied an alternative scenario of cheese ripening in which cheeses are transported to a larger, more energy efficient, dedicated ripening room shared with cheeses from other producers. This ripening room is located within the authorized geographical production area of each PDO cheese. This scenario is presented as “Alternative scenario” in Figure 1 and includes the additional transportation step. Outputs of possible co-products (cream and whey) were not included within the system boundaries and therefore allocation factors were used to determine the parts of the process that were attributable to the cheese rather than its co-products.
Although the different cheese technologies generally utilize the same steps, some steps of milk processing are specific to certain technologies, such as pressing, which is used for pressed cheeses (although some other cheeses may also undergo light pressing), or cooking of the curd, which is specific to cooked pressed cheeses. The milk production step includes all the processes needed to produce the milk (animal feed production, breeding, etc.). Milk pumping, storage, and processing include energy consumption, as well as the materials of some equipment. Milk and cheeses are transported in a refrigerated truck. Data related to the milks’ productions were taken from the AGRIBALYSE 3.0 database, and data related to the electricity, the materials, and the transports were taken from the Ecoinvent 3.6 database. More details about the sub-steps of the cheese production process, as well as the data used for the life cycle inventory, are available in the associated data paper [11].

2.1.3. Functional Unit

The functional unit chosen for this study was 1 kg of cheese after the ripening step.

2.2. Inventory Analysis

2.2.1. Data Collection

The main flows considered here were milk, co-products (cream and whey), transport, water, energy consumption, and equipment materials (stainless steel, copper, and wood). PDO specifications were used to identify the type of milk used (highland cow milk, lowland cow milk, sheep milk, goat milk), the minimum ripening duration, the allowed materials for the vat (stainless steel or copper) and for ripening room shelving (wood or stainless steel), the maximum distance allowed for milk and/or cheese transport, and the maximum length of time the milk could be stored before being processed. Technical datasheets and the scientific literature were consulted for estimates of water consumption in the equipment cleaning step, the electricity consumed for cheese processing, and the materials used in the production of 1 kg of cheese (using time and volume allocations). We consulted cheese experts to estimate the amount of milk needed to produce 1 kg of each cheese based on their knowledge, complemented by online data when needed. Two cheese experts provided information on their ripening rooms (power requirements of equipment, size of the room, and number of cheeses ripened at the same time), which was used to estimate the electrical consumption related to cheese ripening in the base scenario. For the alternative scenario, information was obtained from the scientific literature [12]. We made a particular effort to collect detailed data on each sub-step of each cheese processing method; the different sub-steps considered and their related flows are described in the associated data paper [11]. Data from the AGRIBALYSE 3.0 database were used to modelized highland cow milk, lowland cow milk, goat milk, and sheep milk. Data from the Ecoinvent database were used to modelize the electricity consumption as well as the equipment materials. All the data used are presented in the associated data paper [11].

2.2.2. Dry Matter Basis Allocation

As recommended by the PEF [13], allocations were performed on a dry matter basis to calculate the environmental impacts of the cheeses. To do so, the amount of co-products (whey and cream) associated with the production of 1 kg of cheese was estimated for each cheese and used to calculate dry basis allocation factors. These factors were then used to estimate the portion of environmental impacts that were attributable to the cheese only. More details related to the estimation of co-product mass and the calculation of allocation factors for each cheese are available in the associated data paper [11].

2.3. Life Cycle Impact Assessment

LCA was performed for each of the 44 cheeses using the SimaPro 9.1.0.11 software (PRé Sustainability, Amersfoort, The Netherlands). The selected characterization method was “EF 3.0 Method (adapted) V1.00/EF 3.0 normalization and weighting set” [14]. All the midpoint impact categories available in this method were calculated, and all of the results are available in the accompanying data paper [11]. In this article, we will focus only on the following 13 environmental indicators: climate change, ozone depletion, ionizing radiation, photochemical ozone formation, particulate matter, acidification, eutrophication marine, eutrophication freshwater, eutrophication terrestrial, land use, water use, resource use fossils, and resource use minerals and metals. The three remaining indicators were not included in the study since they are poorly modelled [15].

2.4. Interpretation of Results

Environmental data obtained by performing the LCA of the 44 different cheeses were analyzed with a principal component analysis (PCA) using Spearman correlations. PCA evaluates the correlations between all the variables tested and provides a visual, on which, the closer two variables are, the more positively correlated they are. Milk (kg/kg cheese), ripening time, and nutritional values (protein, fat, calcium, and salt content) were added as supplementary variables. The PCA was performed using the XLStat software version 2020, 5.1.1043 (Addinsoft, Paris, France). Data on the nutritional composition of the cheeses were obtained from the CIQUAL database, complemented by nutritional data on cheese packaging (found online) when necessary. When nutritional values could not be found for a cheese, the information from a similar cheese was used instead.

3. Results and Discussion

First, we analyzed variation in environmental impacts among the studied cheeses. Then, we determined the “hotspots” of cheese production (i.e., steps with particularly significant impacts) and established if these differ according to the characteristics of the cheeses. Finally, we examined the links between environmental impacts and cheese characteristics in greater detail.

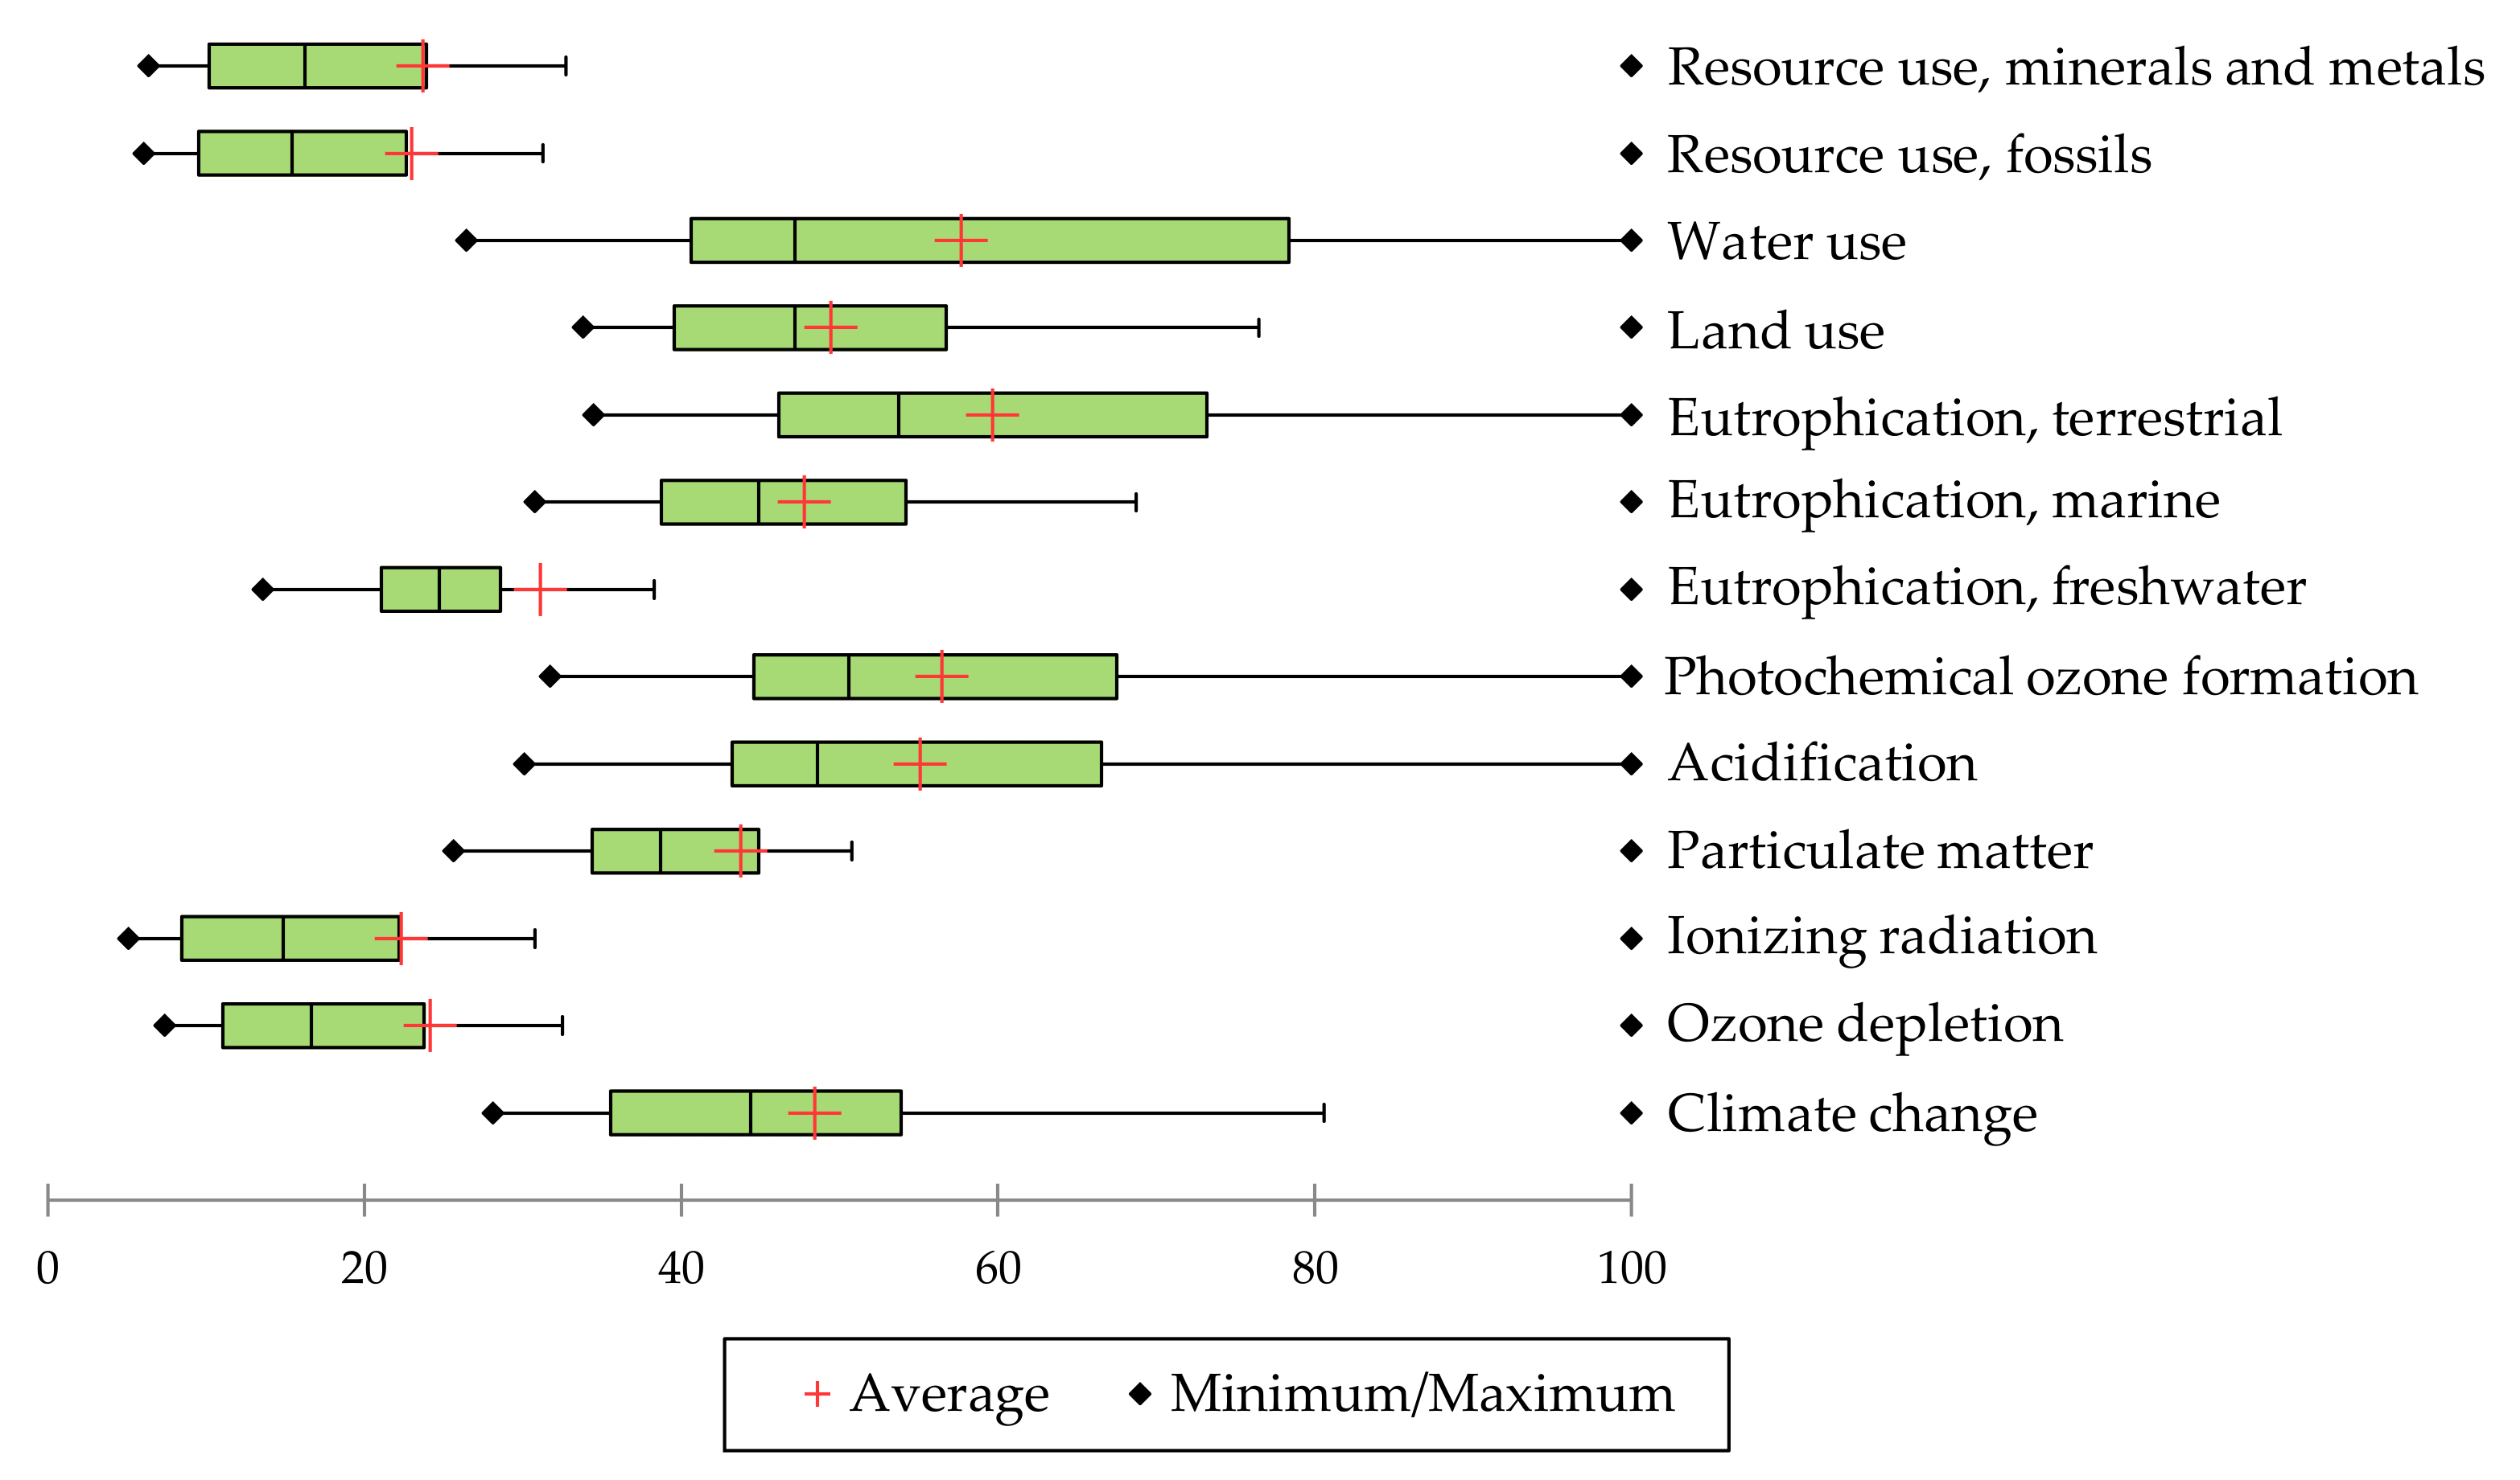
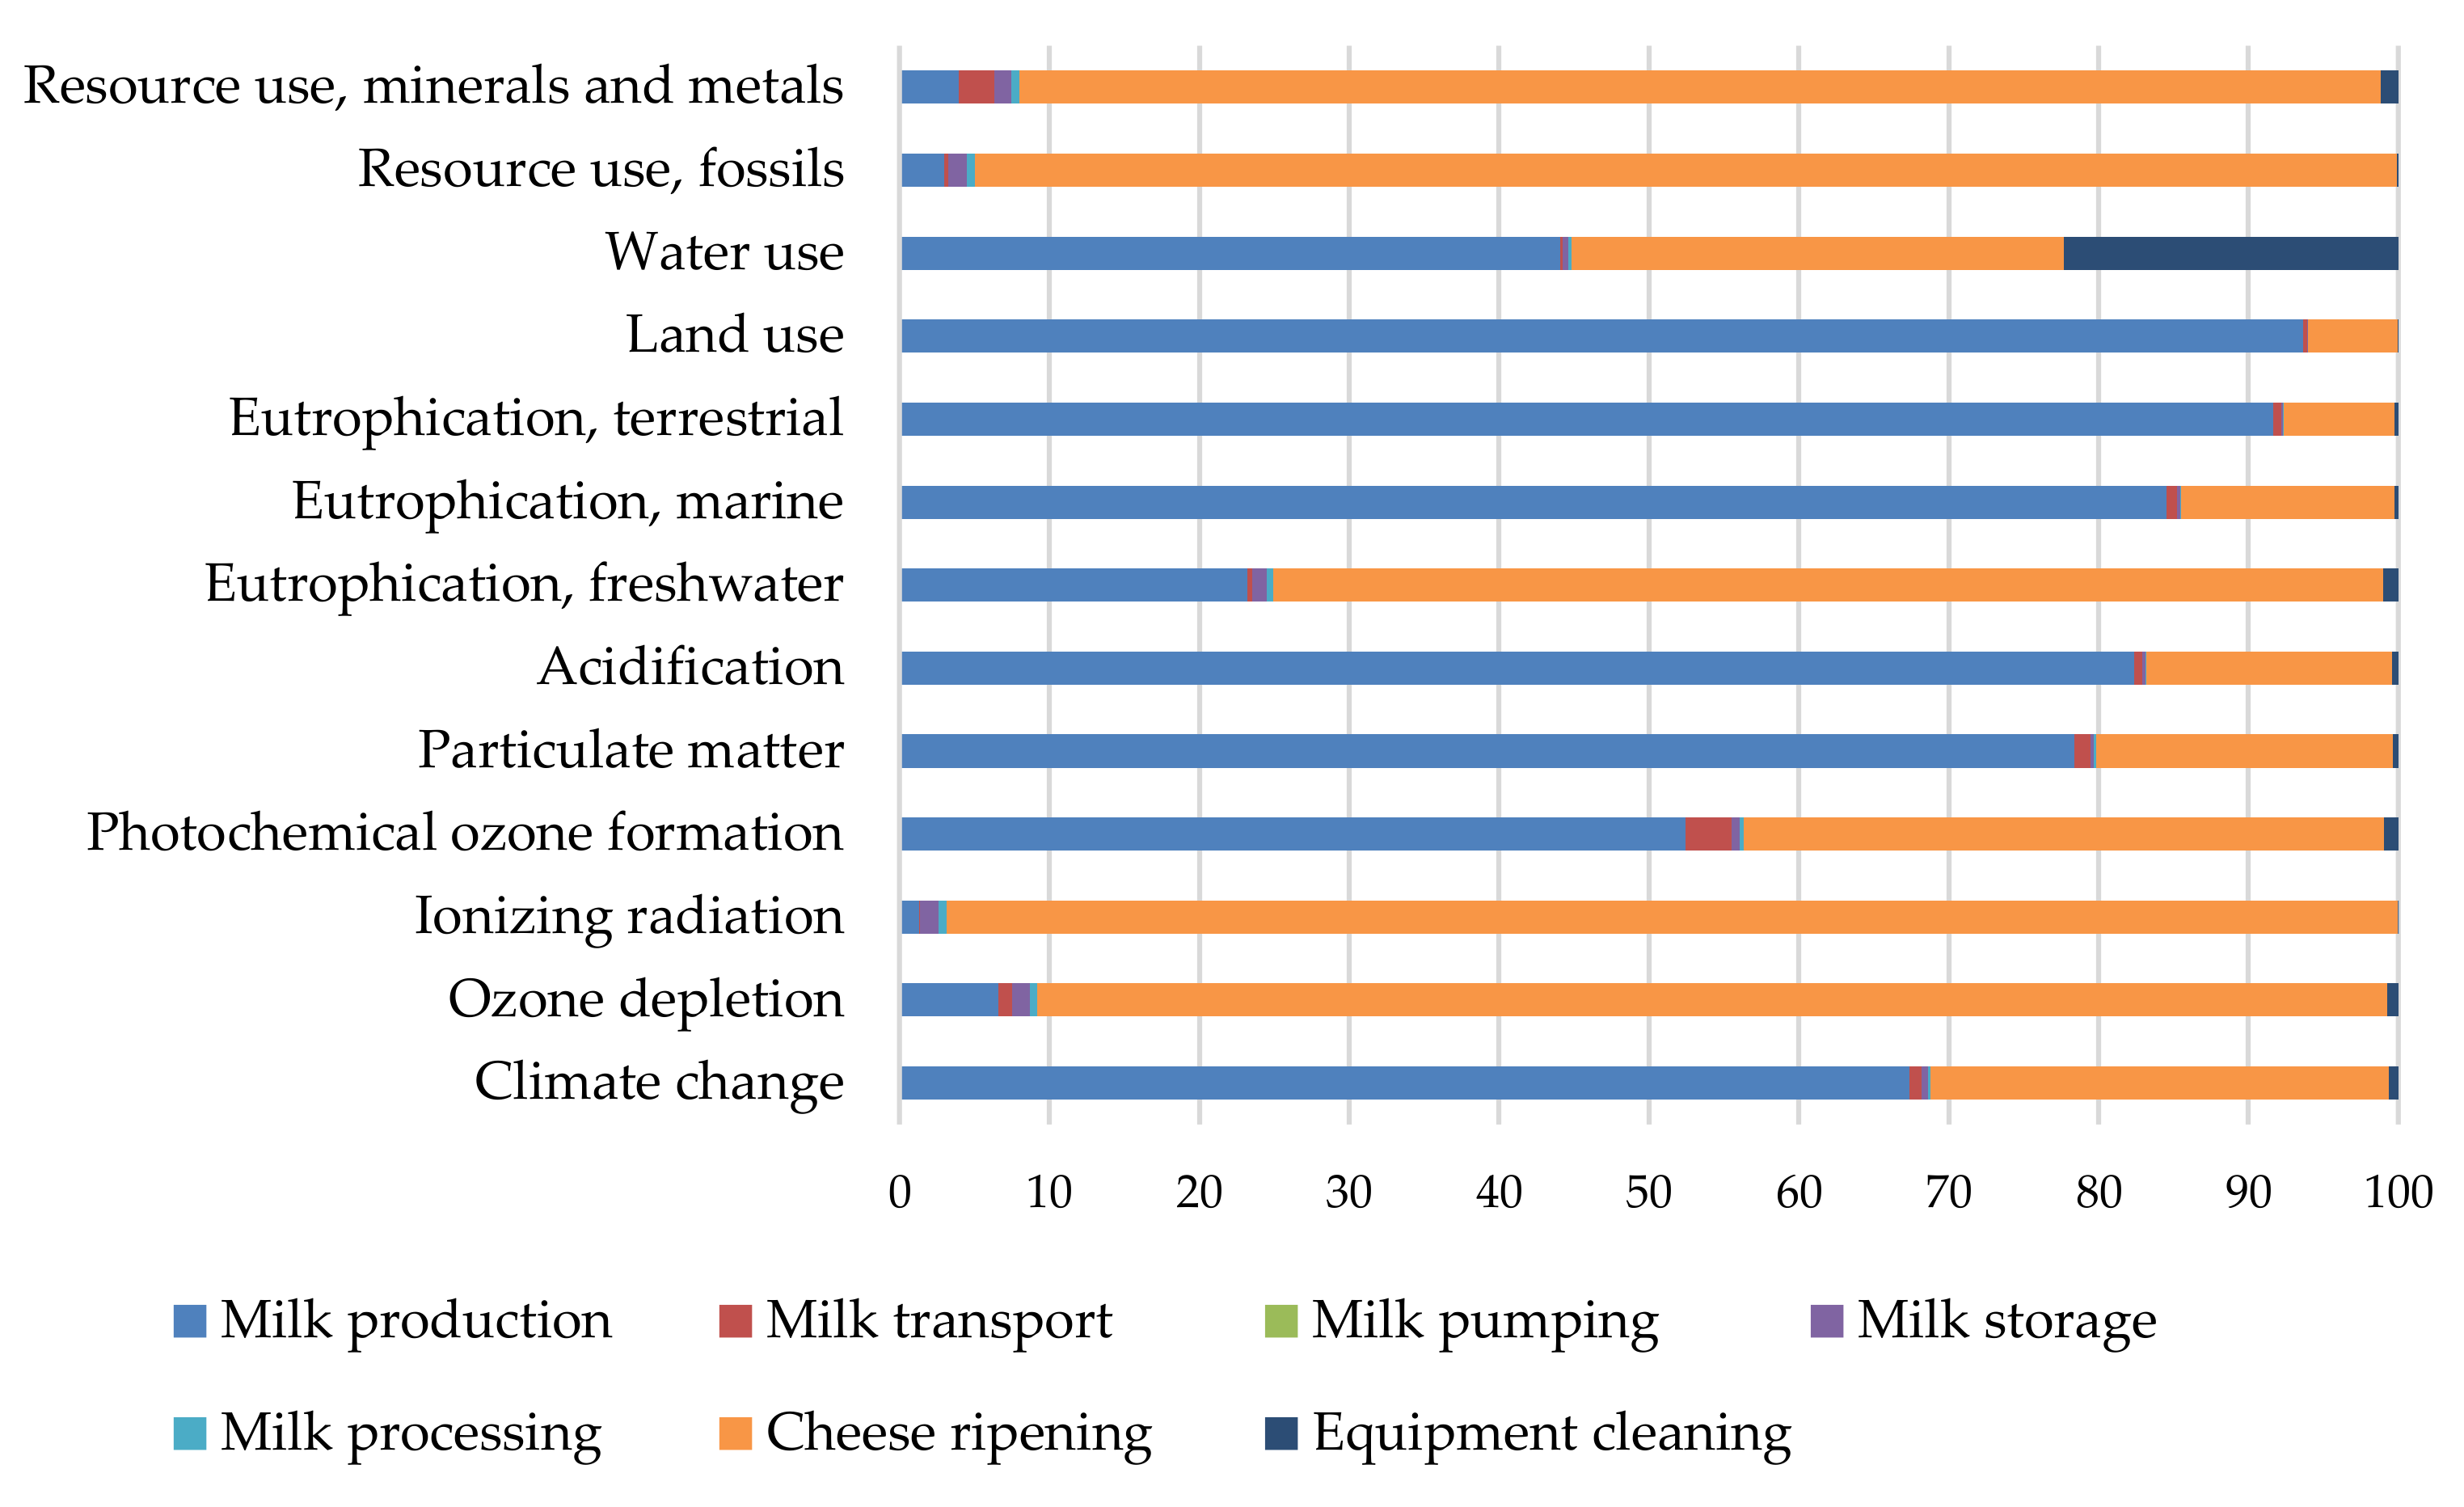
3.1. Base Scenario—Analysis of Environmental Impacts Variability, Identification of Hotspots

Our first task was to study the variability in environmental impacts among the 44 cheeses. For each environmental indicator, the impact of each cheese was calculated as a percentage of the cheese with the strongest impact (which varied depending on the indicator in question). The results are presented as a boxplot in Figure 2. The range of impacts (minimum and maximum) are represented for each indicator, as well as the average, the first and third quartiles, and the median.
As depicted in Figure 2, there is wide variability in environmental impacts among the 44 studied cheeses. Indeed, the difference between the cheese with the highest impact and the cheese with the lowest impact ranges from 65% for terrestrial eutrophication to almost 94% for ionizing radiation. Thus, depending on the indicator in question, the cheese with the strongest impact has at least 3 times, and up to 15 times, the influence as the one with the weakest impact. However, it can be noted that for some indicators, there are extreme high values that are very different from other values, while for other indicators, the values seem to be more clustered. The indicators for which the values seem to be the most dispersed, with some values well above the others, are: ionizing radiation, ozone depletion, resource use minerals and metals, and resource use fossils.
For this reason, it would clearly be incorrect to generalize the environmental impact of one cheese to the group as a whole.
Our next task was to investigate the factors behind the observed variation. To do this, we calculated the environmental impacts of the different production steps for each studied cheese. As an example, Figure 3 shows the contribution of each production step to the overall impact of Brie de Melun for each of the 13 environmental indicators. Therefore, for each environmental indicator, the more a color is represented in the bar, the higher the contribution of the corresponding stage to the indicator. Brie de Melun was selected as an example because its ripening time and milk amount needed to make 1 kg were not the lowest nor the highest of the 44 cheeses.
It can be seen that two steps—milk production and cheese ripening—are responsible for the majority of the contributions in all of the studied environmental impact categories. Most other processing steps have only minor environmental impacts, with the exception of cleaning, which makes a notable contribution to overall impact on water use. However, the relative contributions of milk production and cheese ripening vary among the different cheeses and environmental indicators, as shown in Table 2.
Overall, milk production is the main contributor to the cheeses′ impacts on climate change, photochemical ozone formation, particulate matter, acidification, marine eutrophication, terrestrial eutrophication, land use, and water use (Table 2). Instead, cheese ripening is the main contributor to the impacts on ozone depletion, ionizing radiation, fossil resource use fossils, and resource use minerals and metals. Therefore, it can be said that the extreme high values observed on Figure 2 for these four environmental indicators were those of cheeses ripened a long time. Indeed, most of the studied cheeses are ripened during no longer than 45 days while only five of them are ripened at least 100 days. These differences explain the gap observed on Figure 2 between the extreme values and the rest.
For eutrophication freshwater, the main contributor can be either milk production or cheese ripening depending on the cheese in question; on average, across the 44 cheeses, the contributions of the two steps are equivalent. Unsurprisingly, though, the impact of the ripening step on the eutrophication of freshwater tends to be larger for cheeses with a long ripening time than for those with a short ripening time.
The agricultural sector is the source of significant greenhouse gas emissions, originating from both methane-producing animals and CO2-emitting machinery [16]. It is therefore logical that the milk production step contributes strongly to the overall impact of these cheeses on climate change. Similarly, the spreading of manure and the use of nitrogen fertilizer in cultivating feed for livestock lead to eutrophication in freshwater, marine, and terrestrial environments, which explains the impact of milk production on these indicators [17]. Both livestock production and the production of livestock feed require large amounts of land [17] and significant amounts of water, which may explain why milk production is a major contributor to impacts on the land use and water use indicators. The impact of milk production on acidification can be explained by the use of nitrogen fertilizers or liquid manure to produce livestock feed; these can generate nitrogen oxides and ammonia that may induce acidification in the air or soil. Fuel combustion by farm machinery can also emit sulfur dioxide, inducing acidification [17], and generating fine particles, contributing to particulate matter.
Here, energy consumption was modelled using a French electricity mix, which is based heavily on nuclear power. The nuclear production of electricity can generate ionizing radiation [18], which explains the strong contribution of the cheese ripening step to the effect on ionizing radiation. Moreover, nuclear power production also requires the use of fossil resources [19], as well as metals (notably for the transport of electricity), which explains why the cheese ripening step plays such a large role in the cheeses′ impact on both fossil and mineral/metal resource use.
Our finding that milk production contributes heavily to the environmental impacts of cheese is consistent with the literature; a2019 review reported that raw milk production was the main factor responsible for cheese’s environmental impacts [6]. In particular, the production of raw milk was responsible for, on average, 59% of abiotic resource depletion, 92% of acidification potential, 75% of ecotoxicity, 60% of energy use, 88% of eutrophication potential, 82% of global warming potential, 47% of human toxicity, 98% of land use, 39% of ozone layer depletion, 77% of photochemical ozone formation, and 96% of water depletion associated with cheese [6]. Similarly, the literature review of [5] reported that, in the production of cheese, raw milk production was responsible for between 79% and 95% of the overall impact of cheese on global warming potential, 89–99% of the impact on acidification potential, and 59–99% of the impact on eutrophication potential. As in the present study, though, it was also reported that the step of cheese production (in which the ripening step was included) could make a larger contribution to ozone layer depletion (10–80%) than raw milk production does (7–71%) [6]. On average, those authors concluded that cheese production (including ripening) accounted for 38% of abiotic resource depletion, 7% of acidification potential, 9% of ecotoxicity, 26% of energy use, 10% of eutrophication potential, 12% of global warming potential, 22% of human toxicity, 2% of land use, 38% of ozone layer depletion, 16% of photochemical ozone formation, and 4% of water depletion. In that review, the main factor behind the contribution of cheese manufacturing to each environmental impact was reported to be energy consumption. This is consistent with the results of the current study if we combine the steps of milk processing and cheese ripening, although the contribution of the cheese ripening step is higher in our study for some indicators.
For all environmental indicators, all other production steps make lower, mostly minor, contributions. Indeed, milk transport is responsible for less than 7.5% of the impact of any indicator for any cheese, with the exception of mineral and metal resource use, for which it contributes up to 14% of the impact. Milk storage accounts for less than 8% of any impact, milk processing less than 2%, and milk pumping less than 0.01%. The cleaning step makes a significant contribution to water use (from 10% to 29.5%) but has only a small effect on the other indicators (less than 4.5% for all other indicators and all cheeses). All of the LCIA results are available in the associated data paper [11].

3.2. Alternative Scenario—Analysis of Environmental Impacts Variability, Identification of Hotspots

Because the cheese ripening step makes a major contribution to the environmental impact of cheese, and because the electrical consumption attributable to this step can differ depending on the characteristics of the ripening room, we studied an alternative scenario in which the cheeses are transported off-site to a shared ripening room. This dedicated room is larger and more energy efficient (per kg of cheese) than the room modelled in the base scenario (additional information related to the ripening rooms is available in the data paper [11]). Figure 4 shows a boxplot representing the variability in environmental impacts calculated using the alternative scenario. As in Figure 2, for each environmental indicator the impact of each cheese is represented as a percentage of the cheese with the strongest impact.
By comparing Figure 2 and Figure 4, it is evident that the variability among cheeses in their environmental impacts is lower in the alternative scenario than in the base scenario. With the alternative scenario, the difference between the cheese with the highest impact and the cheese with the lowest impact ranges from 46% to almost 78% depending on the impact category, compared with the range of 65% to 94% calculated for the base scenario. Nevertheless, for each environmental indicator, the cheese with the strongest impact still has at least two times the influence of the cheese with the lowest impact, meaning that there is still significant variability among cheeses in the environmental impacts assessed in the alternative scenario.
Figure 5 shows the contributions of the different production steps for Brie de Melun to the environmental impacts calculated with the alternative scenario.
For all of the studied environmental indicators, milk production is a major contributor to the environmental impact of this cheese. This was true for the majority of cheeses, although there was some notable variation, as shown in Table 3.
Under the alternative ripening scenario, the ripening step makes a much smaller contribution to all environmental indicators, but can still have a non-negligible impact on ozone depletion, ionizing radiation, fossil resource use, and mineral and metal resource use. Because the contributions of each step were calculated as percentages of the total, the reduction in the contribution from ripening necessarily induced an increase in the contributions of other electricity-dependent steps. For example, milk storage has a larger impact on ozone depletion, ionizing radiation, fossil resource use, and mineral and metal resource use in the alternative scenario than the base scenario (a contribution of 0% of the milk storage step represents the case in which the milk is not stored before being processed). Likewise, the contribution of milk transport is also larger, especially for the cheeses’ impact on resource use minerals and metals and ozone depletion. The fact that the milk production is globally the main hotspot for the environmental impacts of cheeses calculated with the alternative scenario is consistent with the results obtained for other European PDO cheeses. Indeed, a study conducted on the San Simon da Costa cheese [20], a Spanish PDO cheese, concluded that 63 to 89% of the environmental impact was due to the production of cow milk, depending on the environmental indicators. Apart from the milk production, the most impactful steps were the smoking of the cheese, the heating processes, and the waste treatment, especially because the whey produced was not valorized. Similarly, a study conducted on Grana Padano cheese [21], an Italian PDO cheese, also concluded that milk production was the main hotspot, representing from 93.5 to 99.6% of the environmental impact, depending on the indicators. Apart from the milk production, electricity consumption and transport were found to have the main contributions. The energy consumption of the ripening rooms was not specified in these two studies; neither were their capacities nor filling rates. However, the global electrical consumption of the first study was quite low, which can indicate that the electrical consumption of the ripening room is low for 1 kg of cheese. Furthermore, the ripening step was reported to be negligible in the second study, but more technical information would be needed to compare their ripening systems to the ones used in the present study. However, these results show that apart from the milk production that seems to be a major environmental hotspot in all cheese LCA related studies, the contribution of the rest of the cheesemaking process can be variable due to variable practices. For example, some cheesemakers ripen their cheeses in natural ripening rooms that do not require electricity for temperature regulation, while some others use artificial ripening rooms that can be more or less energy-consuming. These differences of cheesemaking equipment and practices between cheese production sites would need to be deeper assessed in future research.

3.3. Comparative Analysis of the Base and Alternative Scenarios

To more thoroughly investigate the differences between the two scenarios, we compared the environmental impacts calculated for the base scenario to those assessed for the alternative scenario for two cheeses: one with a short ripening time (Neufchatel, ripened for 10 days) and one with a long ripening time (Comté, ripened for 120 days). Figure 6 presents the impacts of these cheeses (Neufchatel in Figure 6a and Comté in Figure 6b) in both scenarios, with the values obtained from the alternative scenario expressed as a percentage of those assessed with the base scenario.
For all environmental indicators considered, the relative reduction in environmental impacts that was obtained with the alternative scenario was greater in magnitude for Comté than for Neufchatel. This pattern was evident for all studied cheeses: in general, the use of the alternative scenario reduced the environmental impacts of cheese compared to the base scenario, but this effect was much more pronounced for cheeses with a long ripening period than for those with a short ripening period. This was particularly notable for environmental indicators that are sensitive to the use of electricity, such as ozone depletion, ionizing radiation, fossil resource use, and mineral and metal resource use, and less visible in indicators that are more closely tied to the agricultural production of milk, such as climate change or land use. For example, compared to the base scenario, the alternative scenario reduced the impact on climate change by 11% for Neufchatel and 48% for Comté, while the impact on ionizing radiation was reduced by 87% for Neufchatel and 97% for Comté. These results demonstrate how ripening cheeses in a large, shared ripening room can enable a substantial reduction in the environmental impacts of the ripening step, and thus of the final cheese as well. In general, this highlights the importance of optimizing the energy efficiency of cheesemaking equipment and facilities, particularly for cheeses with a long ripening period. For example, the use of sequential air ventilation can lead to a considerable reduction in the daily energy consumption of industrial ripening rooms [12]. It is tempting to interpret these results as suggesting that the larger the scale of production, the less impact an individual product will have on the environment. However, in a comparison of the environmental impacts of artisanal and industrial cheese processing, this is not necessarily the case [22]. Indeed, it wasconcluded that the industrial production of Minas cheese had larger environmental impacts than artisanal production for all impact categories studied; this appeared to be due to the pasteurization step, which is used to produce this cheese in an industrial setting but not in an artisanal one. In any event, our two scenarios represent only examples and do not capture the wide diversity of existing ripening rooms. It is quite possible for a small ripening room to be energy efficient and generate little environmental impacts, such as natural ripening rooms that require little or no energy to operate. Moreover, we should point out that, although the electrical consumption used in the alternative scenario was measured in an industrial ripening room [12], values for the base scenario were estimated based on the power of the equipment in two experimental ripening rooms and on each cheese’s ripening time. This could have led us to overestimate the real electrical consumption of the ripening room used in the base scenario.

3.4. Influence of Cheese Characteristics on Environmental Impacts

Since the results presented in Section 3.1 demonstrate that milk production and cheese ripening are the two main contributors to the environmental impacts of cheese, we decided to further investigate the following characteristics: the amount of milk needed (kg/kg of cheese), milk type, and ripening time. Furthermore, we wanted to examine the influence of cheese technologies on environmental impacts as, to our knowledge, this was never studied. We also assessed possible correlations between the nutritional profiles of cheeses (fat, protein, calcium, and salt content) and their environmental impacts.

3.4.1. Base Scenario—Influence of Qualitative Characteristics of Cheeses on Their Environmental Impacts

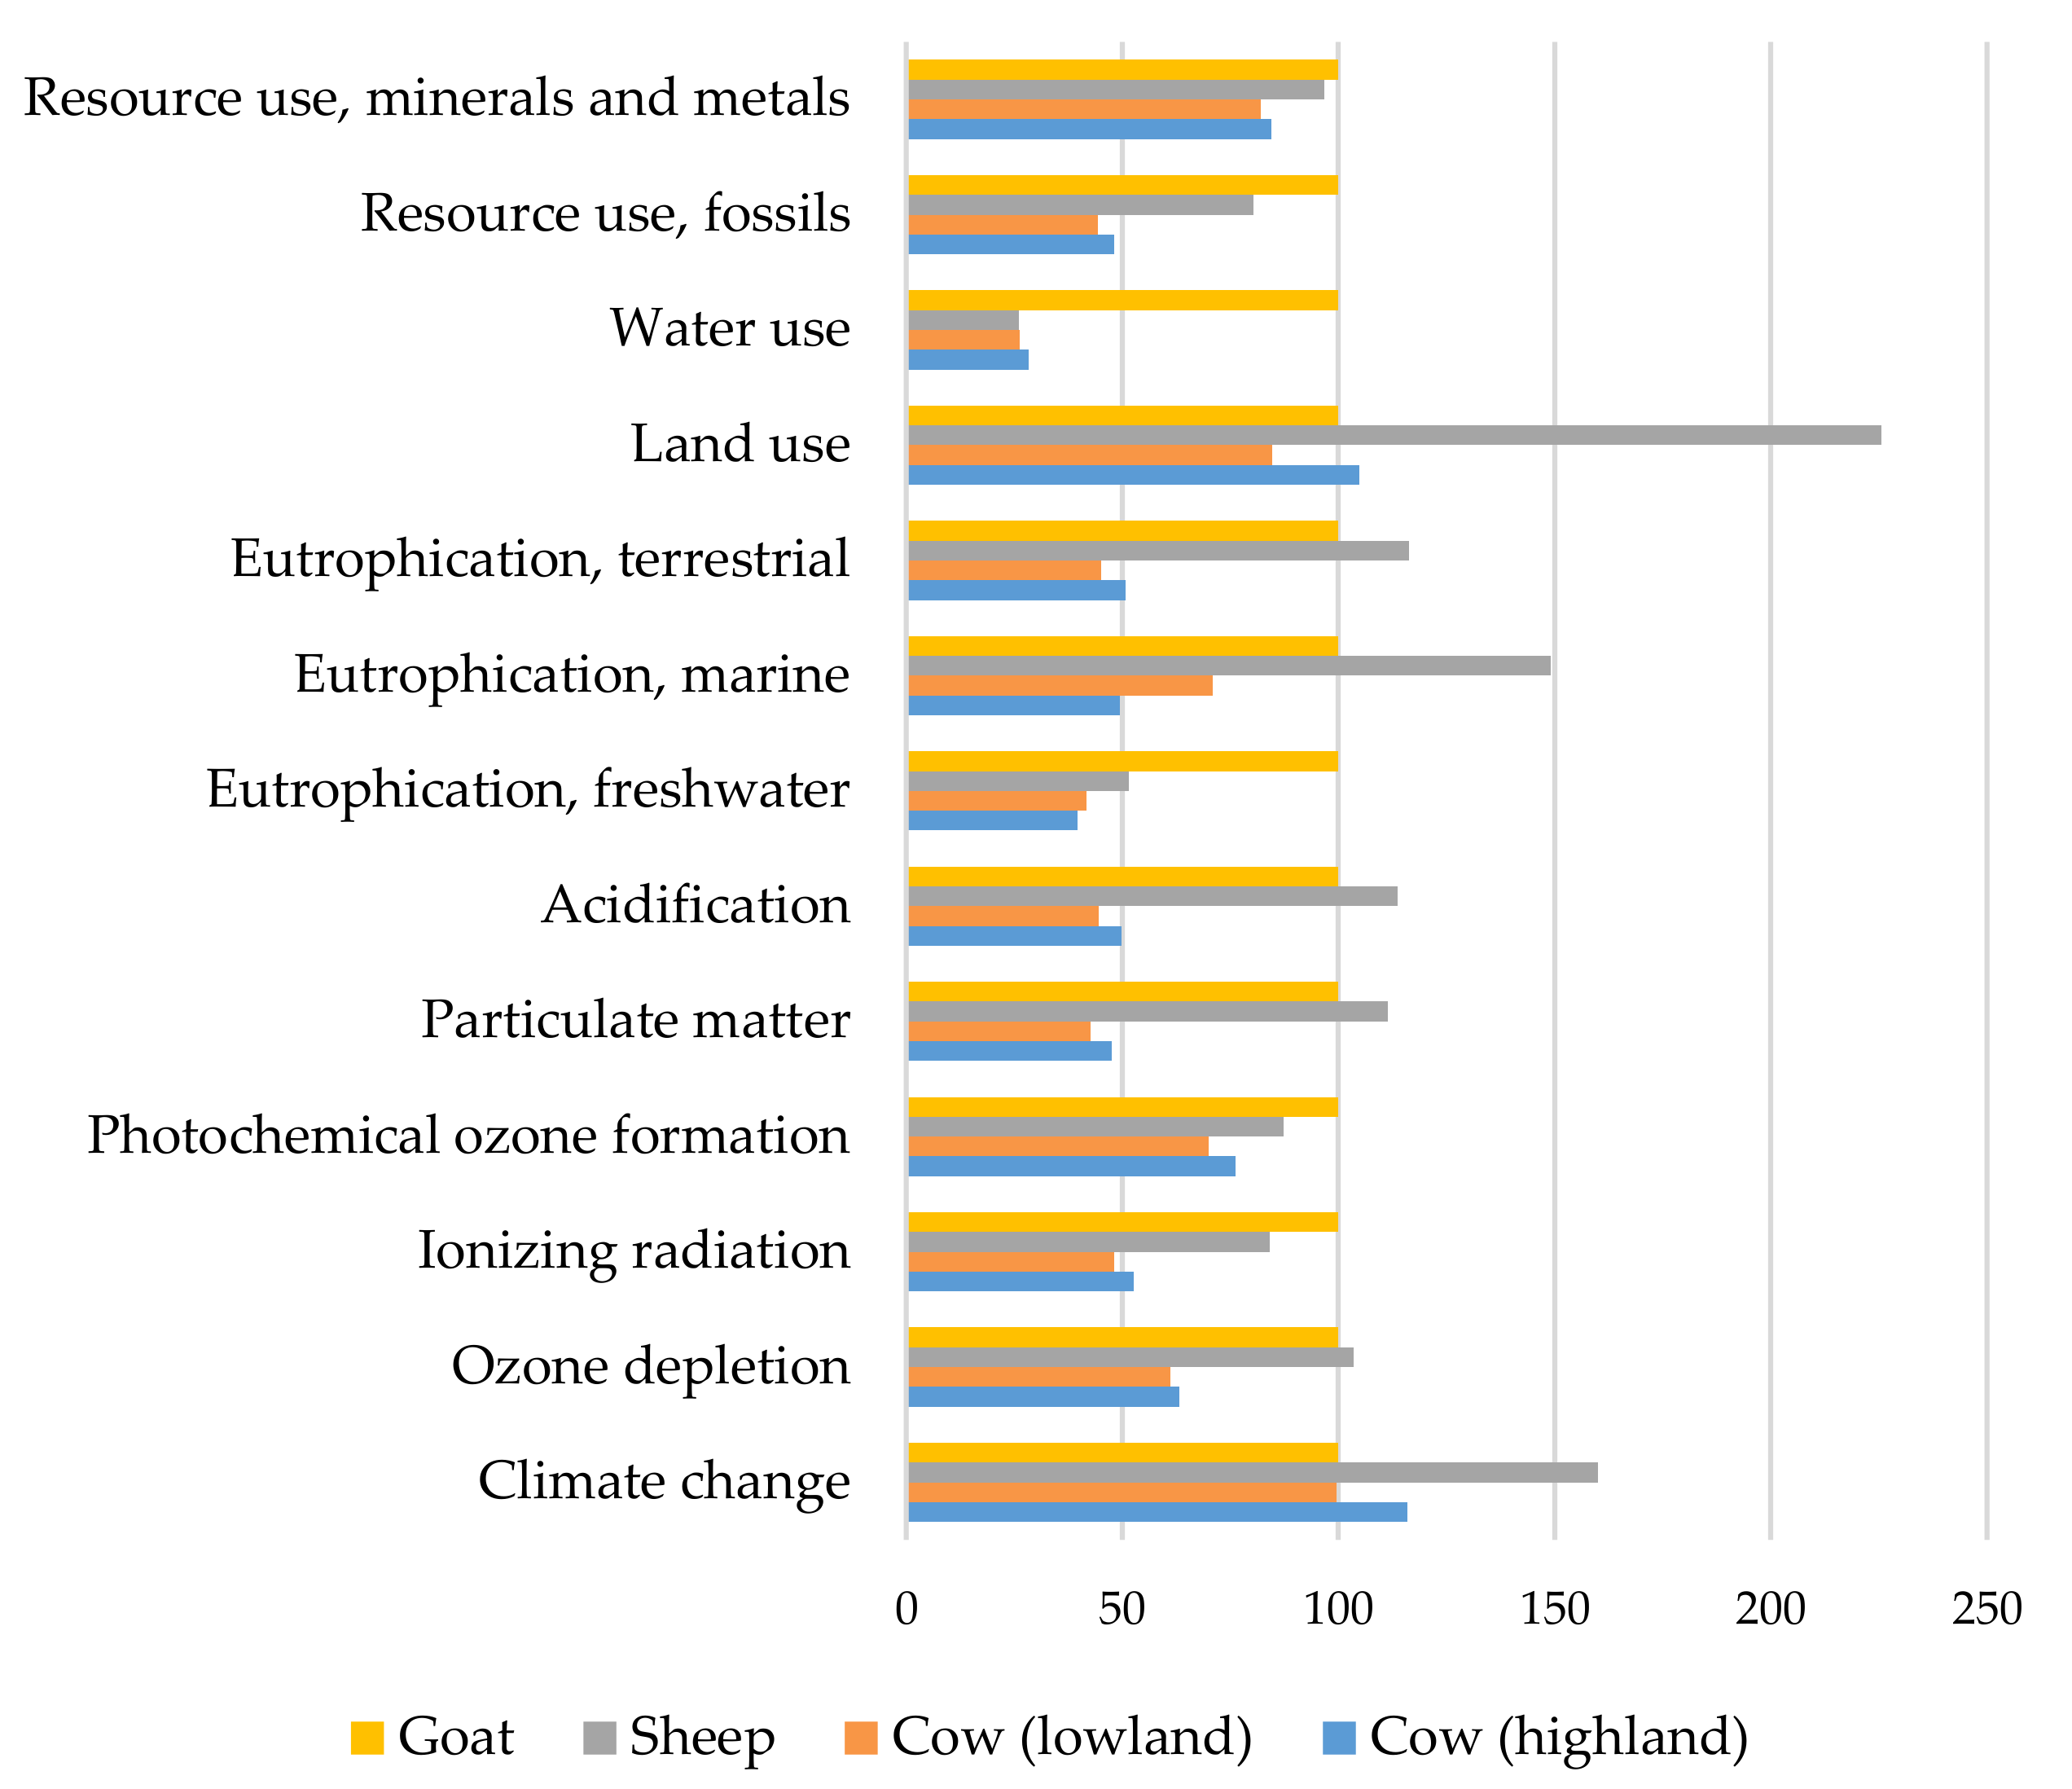
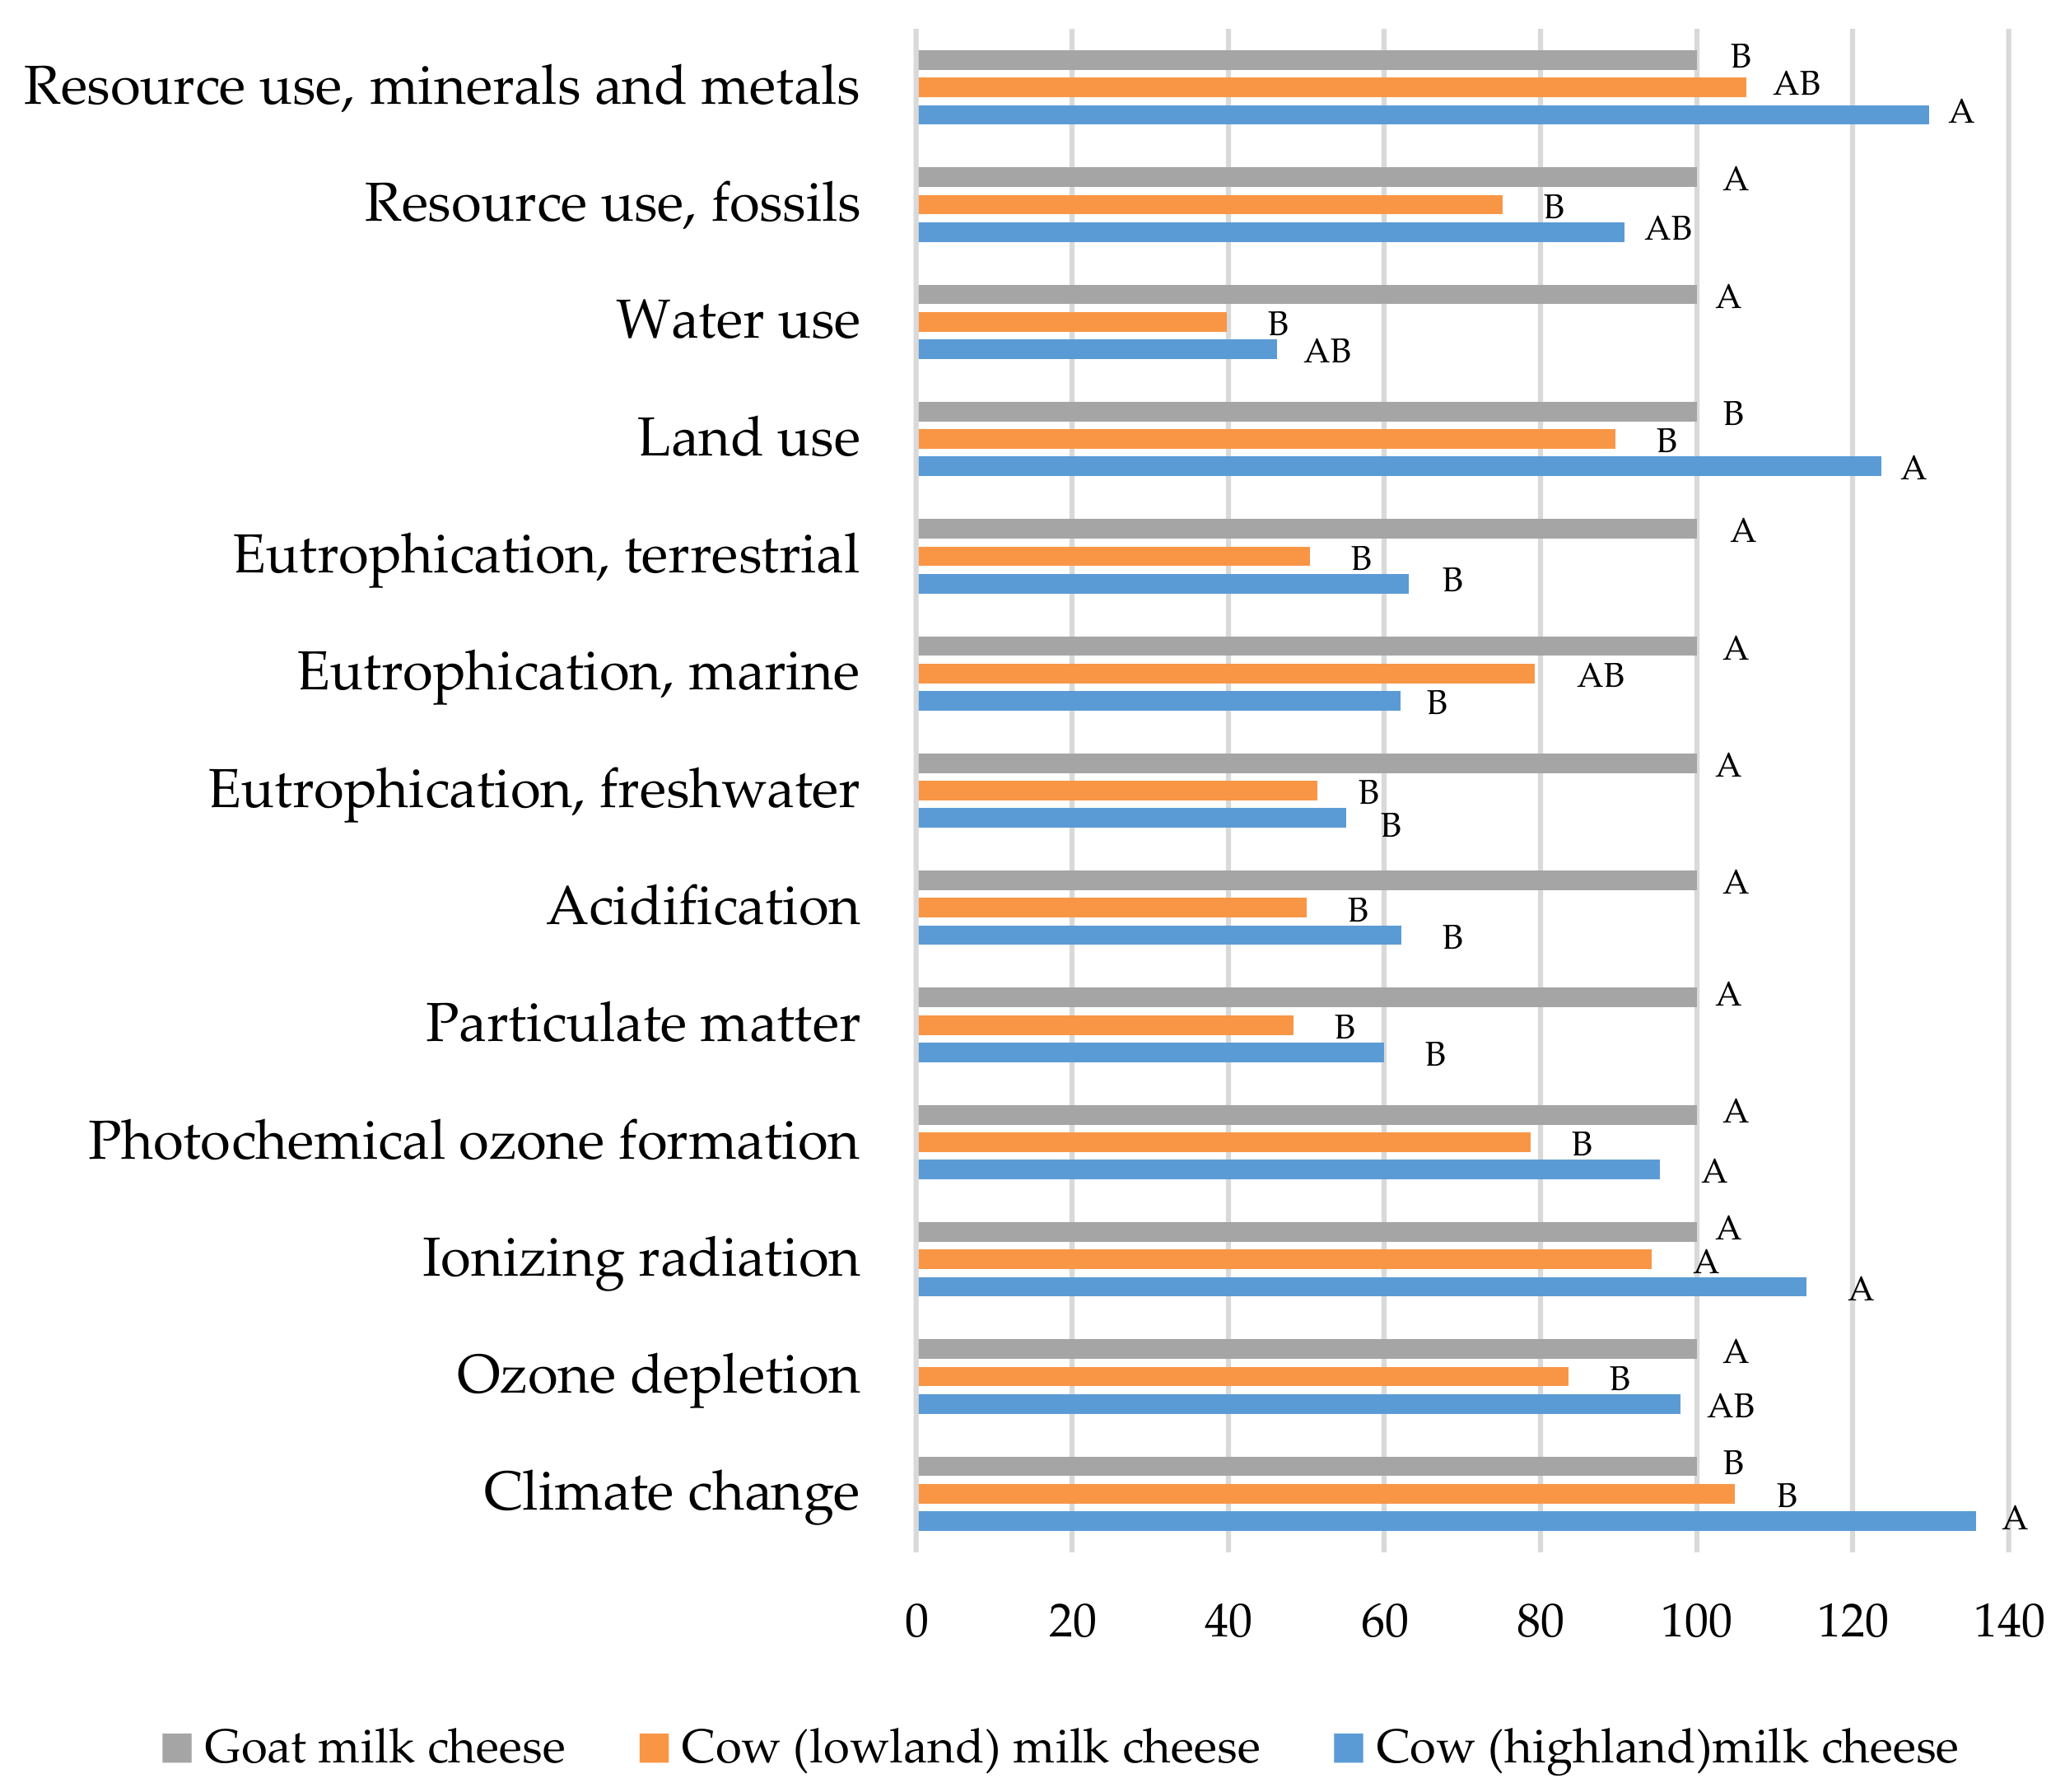
Comparison of the Environmental Impacts of Cheeses Made from Different Types of Milk

First, we calculated the average environmental impacts of cheeses made with cow (highland), cow (lowland), and goat milk, and compared them using Kruskal–Wallis and Dunn tests (Figure 7). Sheep milk cheeses were not included here since there were only two representatives.
For each impact category, different letters indicate a significant difference (p-value < 0.05) according to Kruskal–Wallis and Dunn tests.
We observed that goat milk cheeses have a higher impact than those made from cow milk on four environmental indicators: particulate matter, acidification, terrestrial eutrophication, and water use. To investigate this further, we performed a comparison of the environmental impacts of 1 kg of each type of milk, including sheep milk, which was used for the LCA (data from the AGRIBALYSE 3.0 database) (Figure 8).
According to Figure 8, it could be said that overall, sheep milk and goat milk have higher impacts than cow milk on 11 of the 13 studied environmental indicators. Goat milk also has a much higher impact on water use than other types of milk. Interestingly, even though goat milk cheeses require less milk (kg milk/kg of cheese) and less ripening time than cow (highland) milk cheeses, they still have a higher impact on particulate matter, acidification, freshwater eutrophication, marine eutrophication, terrestrial eutrophication, and water use. It thus appears that the impacts of cheese on these environmental indicators are most strongly influenced by the type of milk used. Instead, the impacts on ozone depletion, ionizing radiation, photochemical ozone formation, fossil resource use, and mineral and metal resource use are higher for cow milk cheeses than for goat milk cheeses, even though goat milk has a higher impact on these indicators than cow milk. For these environmental indicators, then, the type of milk does not seem to be the main factor underlying the impacts of cheese. However, in this study we used the data available in the AGRIBALYSE 3.0. database to modelize the productions of highland cow, lowland cow, goat, and sheep milks. Unfortunately, the number of data available was low and therefore not all the milk production systems used for the 44 PDO cheeses production were available, which is a limitation of the study. Therefore, it would be interesting to conduct studies specific to all the milk production systems used for each PDO French cheese, especially for goat and sheep milk production, for which less data are currently available than for cow milk production. As the agricultural milk production is a major hotspot, it is predictable that the variation in farming practices can have an important influence on the LCA results.

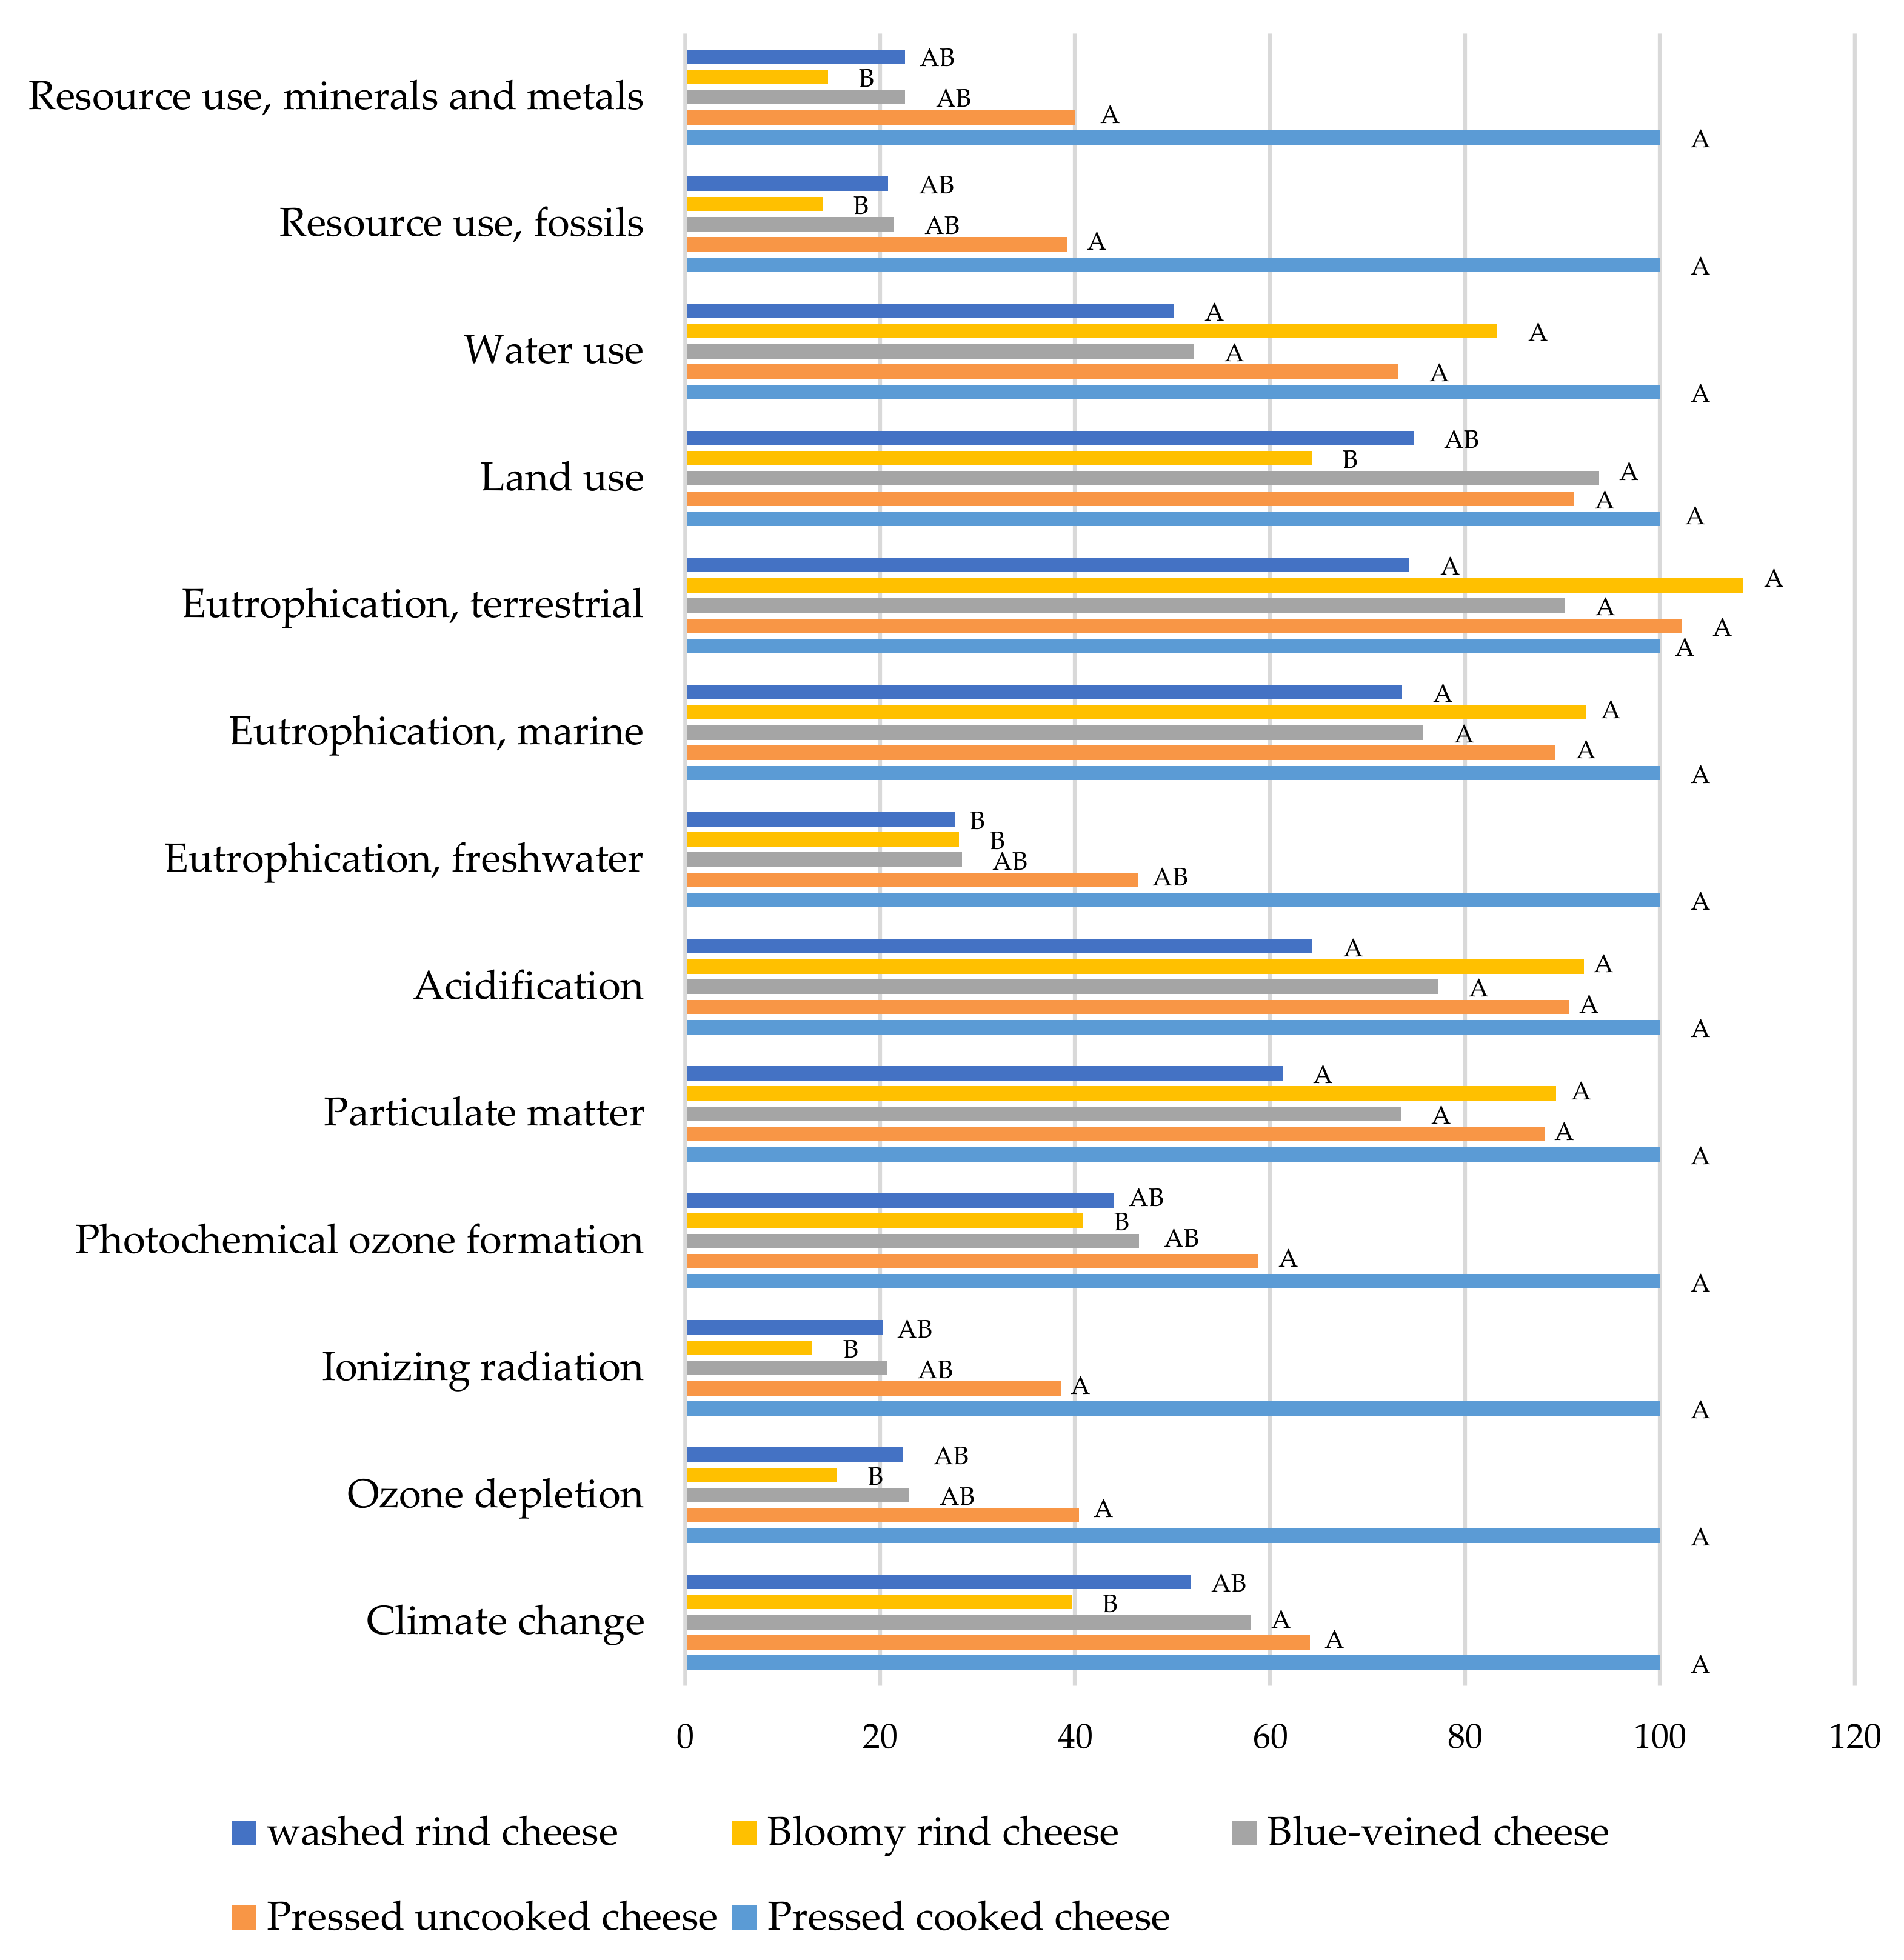
Comparison of the Environmental Impact of Cheeses Made Using Different Cheese Technologies

The average environmental impacts of cheeses made using different technologies were calculated and compared (Figure 9). Pressed cooked cheeses were included in the analysis even though there were only three representatives. The significance of the differences among groups was tested using a Kruskal–Wallis and a Dunn test.
For each impact category, different letters for bars indicate a significant difference (p-value < 0.05) according to Kruskal–Wallis and Dunn tests.
For 6 of the 13 studied environmental indicators, bloomy rind cheeses have significantly lower environmental impacts than pressed cooked and pressed uncooked cheeses. In most other cases, the differences between cheese categories are not significant. Because milk processing makes only a small contribution to the environmental impacts of cheeses according to Figure 3, it is probable that the differences observed on Figure 9 originate from differences in the main contributing factors: milk and/or ripening time.

3.4.2. Base Scenario—Influence of Quantitative Cheese Characteristics on Their Environmental Impacts

To better understand the origin of the variation in environmental impacts among cheeses, we used PCA (Spearman correlation) to study the relationships between the environmental impacts of cheese and certain quantitative characteristics. Environmental impact categories were used as active variables while milk amount (milk (kg/kg of cheese)), ripening time, and protein, fat, calcium, and salt content were added as supplementary variables. Because the type of milk seemed to have an important influence on several environmental categories, two PCAs were performed: one for cow (highland and lowland) milk cheeses (Figure 10a) and one for goat milk cheeses (Figure 10b).
In representations of PCAs, the spatial relationship between variables depicts the correlation between them. Globally, in both scenarios, a cheese′s impact on resource use fossils, resource use minerals and metals, ionizing radiation, and ozone depletion is strongly positively correlated to its ripening time. These results are consistent with our finding that the main contributor to a cheese′s impact on these categories is the ripening step (Section 3.2). Instead, the impacts on land use, terrestrial eutrophication, marine eutrophication, and acidification tend to be more positively correlated to the amount of milk used than to the ripening time. This is in agreement with our observation that milk production is the main contributor to cheeses’ impacts on these environmental indicators. The two most obvious means of reducing the environmental impacts of cheese would therefore be reducing the amount of milk used and shortening the ripening time. Regarding the nutritional content, salt did not appear to be correlated with the environmental impacts of cheese, while, globally, amounts of proteins, fat, and calcium tended to be positively correlated with several environmental indicators (although the correlations were more significant for cow milk cheeses than for goat milk cheeses). In other words, the higher the protein and calcium content of a cheese, the more likely it is to have significant environmental impacts. This is logical since the cheeses with the highest amounts of these nutrients tend to be the ones that use the highest amount of milk and that have the longest ripening times. However, PDO cheeses have mandatory composition values to respect, and therefore the milk amount used to make one kilogram of cheese could not be modified. It can therefore be difficult for cheese consumers to identify the best compromise between interesting amounts of proteins and calcium and reduced environmental impact between the available cheeses of the retail market.

3.4.3. Alternative Scenario—Influence of Cheese Characteristics on Environmental Impacts under the Alternative Scenario

In the alternative scenario, ripening time has less of an influence on the environmental impacts of cheese, and milk type has more. As a result, goat milk cheeses—which under the base scenario had lower environmental impacts than cow (highland) milk cheeses on ozone depletion, ionizing radiation, photochemical ozone formation, and fossil resource use (Figure 6)—now have a stronger impact on these indicators (Figure 11).
For each impact category, different letters indicate a significant difference among bars (p-value < 0.05) according to Kruskal–Wallis and Dunn tests.
The correlations between the environmental impacts of cheeses and their ripening time and milk amount were also tested for each milk type. As expected, the correlations between environmental impacts and milk amount increased in the alternative scenario compared to the base scenario, while those between environmental impacts and ripening time decreased. In the alternative scenario, milk type and milk amount are the two factors with the most influence on the environmental impacts of cheese. This is consistent with the fact that, in the alternative scenario, milk production is the main contributor to all studied environmental indicators (Section 3.2).

4. Conclusions

Our results demonstrate that, although the environmental impacts of cheese differ greatly among the 44 French PDO cheeses studied here, two production steps were consistently highlighted as the main “hotspots”: milk production and cheese ripening. For all of the indicators examined, one of these two steps was responsible for the majority of the environmental impact. However, under an alternative scenario with a reduced daily electrical consumption (per kg of cheese), the contribution of the ripening step was decreased and milk production became the main contributor to the global environmental impacts. Moreover, reducing the daily energy consumption needed for the ripening of one kilogram of cheese reduced the impacts for all 13 environmental indicators, particularly for long-ripened cheeses and for the indicators that are most sensitive to electricity consumption. It is thus clear that optimizing the energy efficiency of ripening rooms could serve as an important means of reducing the environmental impacts of cheese. Another interesting finding was that the type of milk used for a cheese has a strong effect on its environmental impacts, especially under the alternative scenario in which the impact of cheese ripening is reduced. Finally, among cheeses made from the same type of milk, certain environmental impacts were more closely correlated to the amount of milk used, while others—those that were most sensitive to electricity consumption—were strongly correlated to the ripening time; again, though this latter relationship was much weaker in the alternative scenario. Efforts to reduce the environmental impacts of cheese could therefore also target the amount of milk used, as well as the length of the ripening period (particularly if the daily energy consumption of the ripening room is high). These results could be useful to cheesemakers who are searching for ways to reduce the environmental impact of production. However, since PDO cheeses are subject to strict specifications, changes may be difficult to implement. Nevertheless, these results can serve as inspiration for improvements in processes and recipes that are not specified under the PDO scheme. Any changes implemented should also take into account nutritional characteristics to avoid improving the environmental qualities of a cheese at the expense of its nutritional quality. These results can also be of interest to support the fact that the differences of a cheese’s environmental impacts should be represented in environmental labelling of food products. This would allow cheese consumers to make more sustainable choices. However, as discussed in the study, the environmental impacts of cheeses depend on the farming as well as the cheesemaking practices.
The main limitation of this study is a lack of specific data (consumptions and emissions) related to the agricultural and cheesemaking practices for each PDO cheese production. Furthermore, only two ripening scenarios were investigated, which is few compared to the wide diversity of ripening practices and existing equipment.
Therefore, in the future, research that incorporates more of the existing differences in cheesemaking plants and equipment may help to improve the knowledge regarding environmental impact differences between chesses and to identify options for reducing them. According to the results of this study, using a shared ripening room can be an interesting option for reducing the environmental impacts linked to the ripening step. This could be implemented especially when different cheesemakers of the same cheese are located in the same geographical area, which is the case for PDO cheeses. Financial grants from the government can also help cheesemakers to invest in less energy-consuming equipment.
Finally, since the agricultural milk production seems to be the main contributor to the global environmental impacts of the cheeses, a special attention should be paid to the practices of the milk producers. In order to better understand the influence of the different agricultural practices, further research is needed, especially for French goat and sheep milk production. This would allow cheesemakers to make more sustainable choices when choosing their milk supplier.

Author Contributions

Conceptualization, C.P.; methodology, A.C., L.D., G.Y.-L.B., C.P.; formal analysis, A.C., L.D., G.Y.-L.B., C.P.; investigation, A.C., L.D.; writing—original draft preparation, A.C.; writing—review and editing, L.D., G.Y.-L.B., C.P.; supervision, C.P.; project administration, C.P.; funding acquisition, C.P. All authors have read and agreed to the published version of the manuscript.

Funding

This research was funded by the French National Research Agency through the DataSusFood project, grant number ANR-19-DATA-0016.

Data Availability Statement

The data are available in the data paper [11].

Acknowledgments

The authors would like to thank Marie-Noëlle Leclercq-Perlat, Bruno Perret, and Gilles Garric for their help and English services for scientists for professional revision of the English.

Conflicts of Interest

The authors declare no conflict of interest. The funders had no role in the design of the study; in the collection, analyses, or interpretation of data; in the writing of the manuscript; or in the decision to publish the results.

References

  1. Milk and Milk Product Statistics. Available online: https://ec.europa.eu/eurostat/statistics-explained/index.php?title=Milk_and_milk_product_statistics#Milk_products (accessed on 28 July 2021).
  2. L’économie Laitière en Chiffres–Edition 2022. Available online: https://presse.filiere-laitiere.fr/assets/leconomie-laitiere-en-chiffres-edition-2022-f33b-ef05e.html?lang=fr (accessed on 22 July 2022).
  3. EN ISO 14044:2006; Environmental Management. Life Cycle Assessment. Requirements and Guidelines. ISO: Geneva, Switzerland, 2006.
  4. Cucurachi, S.; Scherer, L.; Guinée, J.; Tukker, A. Life Cycle Assessment of Food Systems. One Earth 2019, 1, 292–297. [Google Scholar] [CrossRef] [Green Version]
  5. Finnegan, W.; Yan, M.; Holden, N.M.; Goggins, J. A Review of Environmental Life Cycle Assessment Studies Examining Cheese Production. Int. J. Life Cycle Assess. 2018, 23, 1773–1787. [Google Scholar] [CrossRef]
  6. Üçtuğ, F.G. The Environmental Life Cycle Assessment of Dairy Products. Food Eng. Rev. 2019, 11, 104–121. [Google Scholar] [CrossRef]
  7. La France: Pays des Fromages par Excellence! Available online: https://www.filiere-laitiere.fr/fr/fromages (accessed on 14 November 2021).
  8. Soares, B.B.; Alves, E.C.; de Almeida Neto, J.A.; Rodrigues, L.B. Chapter 8-Environmental Impact of Cheese Production. In Environmental Impact of Agro-Food Industry and Food Consumption; Galanakis, C.M., Ed.; Academic Press: Cambridge, MA, USA, 2021; pp. 169–187. ISBN 978-0-12-821363-6. [Google Scholar]
  9. Appellation D’origine Protégée/Contrôlée (AOP/AOC). Available online: https://www.inao.gouv.fr/Les-signes-officiels-de-la-qualite-et-de-l-origine-SIQO/Appellation-d-origine-protegee-controlee-AOP-AOC (accessed on 28 April 2021).
  10. Chiffres Clés 2020 des Produits Laitiers AOP et IGP. Available online: https://www.inao.gouv.fr/eng/content/download/3919/34426/version/1/file/Cnaol%20Chiffres%20Cles%202020_BD%20%28002%29.pdf (accessed on 14 January 2021).
  11. Cortesi, A.; Dijoux, L.; Yannou-Le Bris, G.; Pénicaud, C. Data related to the Life Cycle Assessment of 44 artisanally produced French Protected Designation of Origin (PDO) cheeses. Data Brief 2022, 43, 108403. [Google Scholar] [CrossRef] [PubMed]
  12. Corrieu, G.; Perret, B.; Kakouri, A.; Pappas, D.; Samelis, J. Positive Effects of Sequential Air Ventilation on Cooked Hard Graviera Cheese Ripening in an Industrial Ripening Room. J. Food Eng. 2018, 222, 162–168. [Google Scholar] [CrossRef]
  13. Product Environmental Footprint Category Rules for Dairy Products. Available online: https://ec.europa.eu/environment/eussd/smgp/pdf/PEFCR-DairyProducts_2018-04-25_V1.pdf (accessed on 26 February 2022).
  14. Fazio, S.; Castellani, V.; Sala, S.; Schau, E.; Secchi, M.; Zampori, L.; Diaconu, E. Supporting Information to the Characterisation Factors of Recommended EF Life Cycle Impact Assessment Method; Ispra: Lombardy, Italy, 2018; p. 42. [Google Scholar]
  15. Sala, S.; Cerutti, A.K.; Pant, R. Development of a Weighting Approach for the Environmental Footprint (No. EUR 28562); Publications Office of the European Unio: Luxembourg, 2018; p. 146. [Google Scholar]
  16. Dollé, J.-B.; Agabriel, J.; Peyraud, J.-L.; Faverdin, P.; Manneville, V.; Raison, C.; Gac, A.; Le Gall, A. Greenhouse Gases in Cattle Breeding: Evaluation and Mitigation Strategies [Les Gaz à Effet de Serre En Élevage Bovin: Évaluation et Leviers d’action]. Prod. Anim. 2011, 24, 415–432. [Google Scholar] [CrossRef] [Green Version]
  17. Le Moal, M.; Gascuel-Odoux, C.; Ménesguen, A.; Souchon, Y.; Étrillard, C.; Levain, A.; Moatar, F.; Pannard, A.; Souchu, P.; Lefebvre, A.; et al. Eutrophication: A New Wine in an Old Bottle? Sci. Total Environ. 2019, 651, 1–11. [Google Scholar] [CrossRef] [PubMed] [Green Version]
  18. Frischknecht, R.; Braunschweig, A.; Hofstetter, P.; Suter, P. Human Health Damages Due to Ionising Radiation in Life Cycle Impact Assessment. Environ. Impact Assess. Rev. 2000, 20, 159–189. [Google Scholar] [CrossRef]
  19. Poinssot, C.; Bourg, S.; Ouvrier, N.; Combernoux, N.; Rostaing, C.; Vargas-Gonzalez, M.; Bruno, J. Assessment of the Environmental Footprint of Nuclear Energy Systems. Comparison between Closed and Open Fuel Cycles. Energy 2014, 69, 199–211. [Google Scholar] [CrossRef] [Green Version]
  20. González-García, S.; Hospido, A.; Moreira, M.T.; Feijoo, G.; Arroja, L. Environmental Life Cycle Assessment of a Galician cheese: San Simon da Costa. J. Clean. Prod. 2013, 52, 253–262. [Google Scholar] [CrossRef]
  21. Bava, L.; Bacenetti, J.; Gislon, G.; Pellegrino, L.; D’Incecco, P.; Sandrucci, A.; Tamburini, A.; Fiala, M.; Zucali, M. Impact assessment of traditional food manufacturing: The case of Grana Padano cheese. Sci. Total Environ. 2018, 626, 1200–1209. [Google Scholar] [CrossRef] [PubMed]
  22. Nigri, E.M.; de Barros, A.C.; Rocha, S.D.F.; Romeiro Filho, E. Assessing Environmental Impacts Using a Comparative LCA of Industrial and Artisanal Production Processes: “Minas Cheese” Case. Food Sci. Technol. 2014, 34, 522–531. [Google Scholar] [CrossRef] [Green Version]
Figure 1. Steps of cheese production considered in the study.
Sustainability 14 09484 g001
Figure 2. Variation in environmental impacts among the 44 cheeses (base scenario).
Sustainability 14 09484 g002
Figure 3. Contribution of each step of Brie de Melun production to several environmental indicators calculated with the EF3.0 method (base scenario).
Sustainability 14 09484 g003
Figure 4. Variation in environmental impacts among the 44 cheeses (alternative scenario).
Sustainability 14 09484 g004
Figure 5. Contribution of each step of Brie de Melun production to several environmental impact categories calculated with the EF3.0 method (alternative scenario).
Sustainability 14 09484 g005
Figure 6. Differences in the environmental impacts calculated for the base and alternative scenarios for two cheeses: Neufchatel (a) and Comté (b).
Sustainability 14 09484 g006
Figure 7. Comparison of the impacts of cow (highland), cow (lowland), and goat milk cheeses for 13 environmental categories. (For each environmental category, different letters indicate a significant difference).
Sustainability 14 09484 g007
Figure 8. Comparison of the impact of cow (highland), cow (lowland) goat, and sheep milk for 13 environmental categories.
Sustainability 14 09484 g008
Figure 9. Comparison of the average environmental impacts of cheese according to the technologies used for production. (For each environmental category, different letters indicate a significant difference).
Sustainability 14 09484 g009
Figure 10. PCA of the environmental impacts of the 44 cheeses on 13 different impact categories (active variables, closed red circles) and cheese characteristics (supplementary variables, open blue squares) for cow milk cheese (a) and goat milk cheese (b).
Sustainability 14 09484 g010
Figure 11. Comparison of the impacts of cow (highland), cow (lowland), and goat milk cheeses on 13 environmental categories. (For each environmental category, two different letters mean significant difference).
Sustainability 14 09484 g011
Table 1. 44 French PDO cheeses studied.
Cheese NameMilk OriginCheese Technology
AbondanceCow (highland)Pressed cooked cheese
BanonGoatBloomy rind cheese
BeaufortCow (highland)Pressed cooked cheese
Bleu d’AuvergneCow (highland)Blue veined cheese
Bleu de Gex Haut-JuraGoatBlue veined cheese
Bleu des CaussesCow (highland)Blue veined cheese
Bleu du Vercors-SassenageCow (highland)Blue veined cheese
Brie de MeauxCow (lowland)Bloomy rind cheese
Bries de MelunCow (lowland)Bloomy rind cheese
Camembert de NormandieCow (lowland)Bloomy rind cheese
CantalCow (highland)Pressed uncooked cheese
Chabichou de PoitouGoatBloomy rind cheese
ChaourceCow (lowland)Bloomy rind cheese
CharolaisGoatBloomy rind cheese
ChavignolGoatBloomy rind cheese
ChevrotinGoatPressed uncooked cheese
ComtéCow (highland)Pressed cooked cheese
EpoissesCow (highland)Washed rind cheese
Fourme d’AmbertCow (highland)Blue veined cheese
Fourme de MontbrissonCow (highland)Blue veined cheese
LaguioleCow (highland)Pressed uncooked cheese
LangresCow (highland)Washed rind cheese
LivarotCow (lowland)Washed rind cheese
MâconnaisGoatBloomy rind cheese
MaroillesCow (lowland)Washed rind cheese
Mont d’OrCow (highland)Washed rind cheese
MorbierCow (highland)Pressed uncooked cheese
MunsterCow (highland)Washed rind cheese
NeufchâtelCow (lowland)Bloomy rind cheese
Ossau IratySheepPressed uncooked cheese
PélardonGoatBloomy rind cheese
PicodonGoatBloomy rind cheese
Pont l’EvêqueCow (lowland)Washed rind cheese
Pouligny Saint-PierreGoatBloomy rind cheese
ReblochonCow (highland)Pressed uncooked cheese
Rigotte de CondrieuGoatBloomy rind cheese
RocamadourGoatBloomy rind cheese
RoquefortSheepBlue veined cheese
Saint-NectaireCow (highland)Pressed uncooked cheese
Sainte-Maure-de-TouraineGoatBloomy rind cheese
SalersCow (highland)Pressed uncooked cheese
Selles sur CherGoatBloomy rind cheese
Tome de BaugesCow (highland)Pressed uncooked cheese
ValençayGoatBloomy rind cheese
Table 2. Maximum, minimum, and average contributions of milk production and cheese ripening steps to different environmental impact categories among the 44 cheeses (rounded to the nearest whole number).
Contribution of Milk Production (%)Contribution of Cheese Ripening (%)
MaximumMinimumAverageMaximumMinimumAverage
Climate change90457853720
Ozone depletion37215965278
Ionizing radiation130.54997891
Photochemical ozone formation86306668828
Particulate matter97598740211
Acidification9865893519
Eutrophication, freshwater78942901854
Eutrophication, marine97578742211
Eutrophication, terrestrial9982951814
Land use9989961113
Water use86266061320
Resource use, fossils2719986486
Resource use, minerals and metals1918976181
Table 3. Average, minimum, and maximum contribution (percentage) of the different steps to cheeses’ impacts on 13 environmental indicators (rounded to the nearest whole number).
Milk ProductionMilk TransportMilk PumpingMilk StorageMilk ProcessingCheese TransportCheese RipeningEquipment Cleaning
Climate change97 (94–98)1 (0–3)00 (0–1)00 (0–1)0 (0–2)1
Ozone depletion63 (47–77)7 (1–22)011 (0–20)4 (0–6)2 (0–6)7 (2–26)6 (4–8)
Ionizing radiation39 (18–62)1 (0–2)031 (0–49)10 (0–17)019 (5–50)1 (0–1)
Photochemical ozone formation91 (96–83)4 (1–11)01 (0–2)0 (0–1)1 (0–3)1 (0–3)1 (1–2)
Particulate matter98 (99–96)1 (0–2)00 (0–1)00 (0–1)0 (0–1)0
Acidification99 (99–97)0 (0–1)00 (0–1)000 (0–1)0 (0–1)
Eutrophication, freshwater87 (95–77)1 (0–5)04 (0–7)1 (0–3)0 (0–1)3 (0–11)3 (2–4)
Eutrophication, marine98 (99–95)1 (0–3)0000 (0–1)0 (0–1)0
Eutrophication, terrestrial99 (100–98)0 (0–1)000000
Land use99 (100–95)0 (0–0)00000 (0–4)0
Water use74 (88–65)0 (0–0)01 (0–1)0 (0–1)00 (0–2)25 (11–34)
Resource use, fossils55 (76–32)4 (0–11)020 (0–34)6 (0–10)1 (0–3)12 (2–39)2 (1–3)
Resource use, minerals and metals40 (53–18)20 (4–52)013 (0–22)4 (0–7)5 (1–14)8 (2–28)10 (5–14)
Publisher’s Note: MDPI stays neutral with regard to jurisdictional claims in published maps and institutional affiliations.

