Article

Effect of Various Aqueous Mediums on the Microstructure of Compacted Bentonite–Sand Mixture Characterized by X-ray CT Investigation

1
School of Earth and Space Sciences, University of Science and Technology of China, Hefei 230026, China
2
Nuclear Wastes and Environmental Safety Laboratory, Southwest University of Science and Technology, Mianyang 621010, China
3
School of Environment and Resources, Southwest University of Science and Technology, Mianyang 621010, China
4
Division of International Applied Technology, Yibin University, Yibin 644000, China
*
Author to whom correspondence should be addressed.
Sustainability 2022, 14(15), 9427; https://doi.org/10.3390/su14159427
Submission received: 5 July 2022 / Revised: 26 July 2022 / Accepted: 28 July 2022 / Published: 1 August 2022

Abstract

:
Compacted bentonite–sand mixture (CBM) is a kind of candidate buffer material of high-level radioactive waste (HLW) disposal in many countries. It is believed that the permeability of CBM is greatly related to its microstructure. The aim of this study was to search the effect of various aqueous mediums on the microstructure and pore characteristics of this buffer material. Permeation experiments and X-ray computerized tomography (X-ray CT) were used to explain the correlation between microstructure and permeability. Representative samples of CBM at a dry density of 1.7 g/cm3 were used. X-ray CT was used to study the CBM under the de-ionized water (DI) and three other aqueous medium conditions. After reconstruction with Dragonfly software, the pore characteristics and permeability of different solution-saturated samples were analyzed using AVIZO software, including pore size distribution (PSD), porosity, and connectivity. The results showed that the permeability coefficient of samples was NaOH > NaCl-Na2SO4 > Simulated Beishan groundwater > DI water, and the maximum swelling pressure of samples was NaOH < NaCl-Na2SO4 < Simulated Beishan groundwater < DI water. The permeability coefficient decreased with the increasing of maximum swelling pressure. Quantitative analysis indicated that the volume of interconnected pores increased owing to the infiltration of NaCl-Na2SO4 and NaOH.

1. Introduction

Currently, nuclear energy is considered as the cleanest, most efficient, and most reliable source of energy in the world. The economics of nuclear power can be compared favorably with any energy alternatives [1]. Nuclear technology provides humans with valuable energy in the modern life, and also produces radioactive waste. All the advantage of nuclear technology comes at the expense of radioactive waste. How to safely dispose of the radioactive waste, especially high-level radioactive waste (HLW), is an important issue of concern to all countries in the world. However, so far there are few places in the world where HLW can be stored “safely”. The proper disposal of HLW is not only one of the topics being explored by countries that have nuclear power, but also the focus of the people, furthermore related to the sustainable development of the nuclear industry. On the other hand, Gaomiaozi (GMZ) bentonite in Inner Mongolia, which has been deemed to buffer material for HLW disposal in China, is now attracting much more attention [2]. The repository of HLW includes the engineering barrier system of bentonite pellet mixtures and the natural barrier system of surrounding geological bodies [3]. In China, the repository concept of HLW is a shaft-tunnel structure, which includes compacted bentonite–sand mixture, gap fill, and dense backfill material, located in granites [4]. Repositories are designed on the foundation of engineered and natural screen between the HLW and the biological circle [5]. During the operation of repository, various aqueous mediums reaching the buffer material will be determined by the coaction between retaining structures and the host rock [6]. In China, Beishan has been fixed on one of the possible disposal sites. It turns out that the total dissolved solids are rich in Na+ and Ca2+ in the groundwater. The major chemical compounds are ClSO4-Na [7]. The chemical background of Beishan groundwater in Gansu Province contains salt and alkaline substances that may be produced in the operation of the repository. Studying the influence of various aqueous mediums on buffer materials for the safety assessment for repositories is of great necessity. To better understand the swelling and permeability characteristics of CBM, especially in terms of permeability coefficients, the study of microstructure appears particularly important.
Previously, pore size distribution was processed by indirect estimation by use of a soil–water retention curve or mercury intrusion porosimetry (MIP) [8]. Two-dimensional analysis of pore morphology was carried out by using computer image analysis [9]. CT has been extensively applied in soil science in recent years. The detailed 3D pore characteristics were determined noninvasively by X-ray CT. Soil porosity features, such as pore shape and size distribution, can be determined exactly with X-ray CT [10]. Many studies presenting the microstructure related to the feature of pore structure by various means (i.e., porosity, surface area, connectivity, and volume) have been conducted with X-ray CT [11,12,13,14,15]. The connectivity and tortuosity of pore scale networks are key parameters of current capacities [16]. Sandin et al. worked over at a voxel size of 120 µm3 and observed distinct relativity between pore network connectivity and permeability property [17]. Liu discussed the influence of image magnification on the quantitative characterization of the pore structure and the prediction of permeability [18]. A variety of surveys of the microstructure of bentonites and coals have been studied by MIP, nuclear magnetic resonance (NMR), and scanning electron microscopy (SEM) tests [19,20,21,22]. The major disadvantages of MIP and SEM are that they require dehydration or freezing, which alters the microstructures of water-saturated samples. The environmental scanning electron microscope (ESEM) can observe saturated samples. However, only the surface information of the specimen is provided. X-ray CT is an effectual nondestructive measure to detect initiation, development, and interconnection of the internal micro pores in bentonite. It uses bulk transfer measured with an X-ray beam to reconstruct the picture of a scanned object. It is possible to create 3D visuals derived from 2D scans by digital image processing. Although the observations of the microstructure of CBM regarding the application of X-ray CT have already been reported in many studies [23,24,25,26], rarely has work been done to discover the influence of various aqueous mediums on the microstructure pore feature of GMZ bentonite–sand mixture using X-ray CT. AVIZO software has the characteristics of 3D visualization and direct output of experimental data. Some researchers have combined CT scanning with AVIZO to study the microstructure of materials [27,28,29].
This study aims to investigate the influence of various aqueous mediums on the permeability of CBM characterized by X-ray CT. The permeation experiments were conducted on CBM with a dry density of 1.7 g/cm3. The de-ionized water (DI), simulated Beishan groundwater, NaCl-Na2SO4, and NaOH solutions were considered for infiltration. Furthermore, we combined X-ray CT with AVIZO to investigate the microstructure characteristics of the CBM after permeability experiments, and the 3D model of pore structure was established. Moreover, the hydraulic conductivity, pore connectivity, and pore size distribution (PSD) of CBM were determined.

2. Specimen Information and Methods

2.1. Specimen Information

The studied materials were densely compacted mixtures of GMZ Na-bentonite and quartz sand with a dry mass ratio (80:20) [30]. The Na-bentonite was from Xinghe country, China. The analysis by XRD shows that it is composed of montmorillonite (75.4%). The main exchangeable cations are Na+ and Ca2+ [30]. The analysis by XRF shows that it is mainly composed of SiO2 (74.08%), Al2O3 (15.36%), and MgO (3.00%). The quartz sand was from Jiulong Mining Company, Hanzhong City, China, with 99.82% SiO2 [30]. In this experiment, Na2SO4, NaCl, CaCl2, MgSO4, NaHCO₃, and KCl were selected to prepare simulated Beishan groundwater. The NaCl-Na2SO4 solution was configured by mixing NaCl and Na2SO4 reagent (2:1).

2.2. Experimental Setup

The setup for the multifunctional swelling permeability test system is shown in Figure 1 [30]. This setup included five parts, GDS standard pressure/volume controller, a water/alkaline converter, temperature control system (±0.5 °C), expansion osmotic pressure chamber (0–4 MPa, ±1kPa), and data acquisition system.

2.3. Swelling Pressure and Permeability Experiment

The test was implemented on the CBM sample confined in a cylindrical pressure chamber. During hydration, the pressure chamber prevented any sample volume changes; this situation is close to that for actual storage in granite. With regard to the specimen preparation, water was added to bentonite–sand in the form of solid ice powder to mix the mixture [30]. First, the mixture was statically compacted in a mold. The specimen’s diameter, height, dry density, and water content are 61.8 mm, 20 mm, 1.70 g/cm3, and 13%, respectively. A total of four samples such as S1, S2, S3, and S4 were prepared by using DI water, simulated Beishan groundwater, NaCl-Na2SO4, and NaOH, respectively (Table 1). A computer-controlled multifunctional swelling permeability apparatus was used to conduct swell and permeability experiments [30]. The sample was considered to be saturated when the swelling pressure was stable, and the hydraulic conductivity test was employed until a steady flow was reached [30]. Darcy’s law can be applied to calculate hydraulic conductivity [30]. The hydraulic conductivity was calculated by Equation (1)
k = Δ Q L A h Δ t
where k : the hydraulic conductivity, Δ Q (cm3): seepage discharge, L (cm): the height of specimen, A (cm2): the cross-sectional area of the specimen, h (cm): the head difference, and Δ t (s): the penetration time.
After the swelling and permeability test, a polyethylene pipe was used for sampling the CBM specimens. The saturated CBM samples were extruded from the stainless-steel pressure chamber and then directly sampled with a polyethylene pipe. In order to minimize sampling disturbance, the polyethylene cylinders were manually driven into the saturated sample and then manually extracted. During the scanning process, polyethylene pipes were used for containing the specimens. The specimen’s diameter and height are 5 mm and 10 mm, respectively. The polyethylene pipes were wrapped with fresh-keeping film to prevent water evaporation from the CBM during the observations.

2.4. X-ray CT Scanning

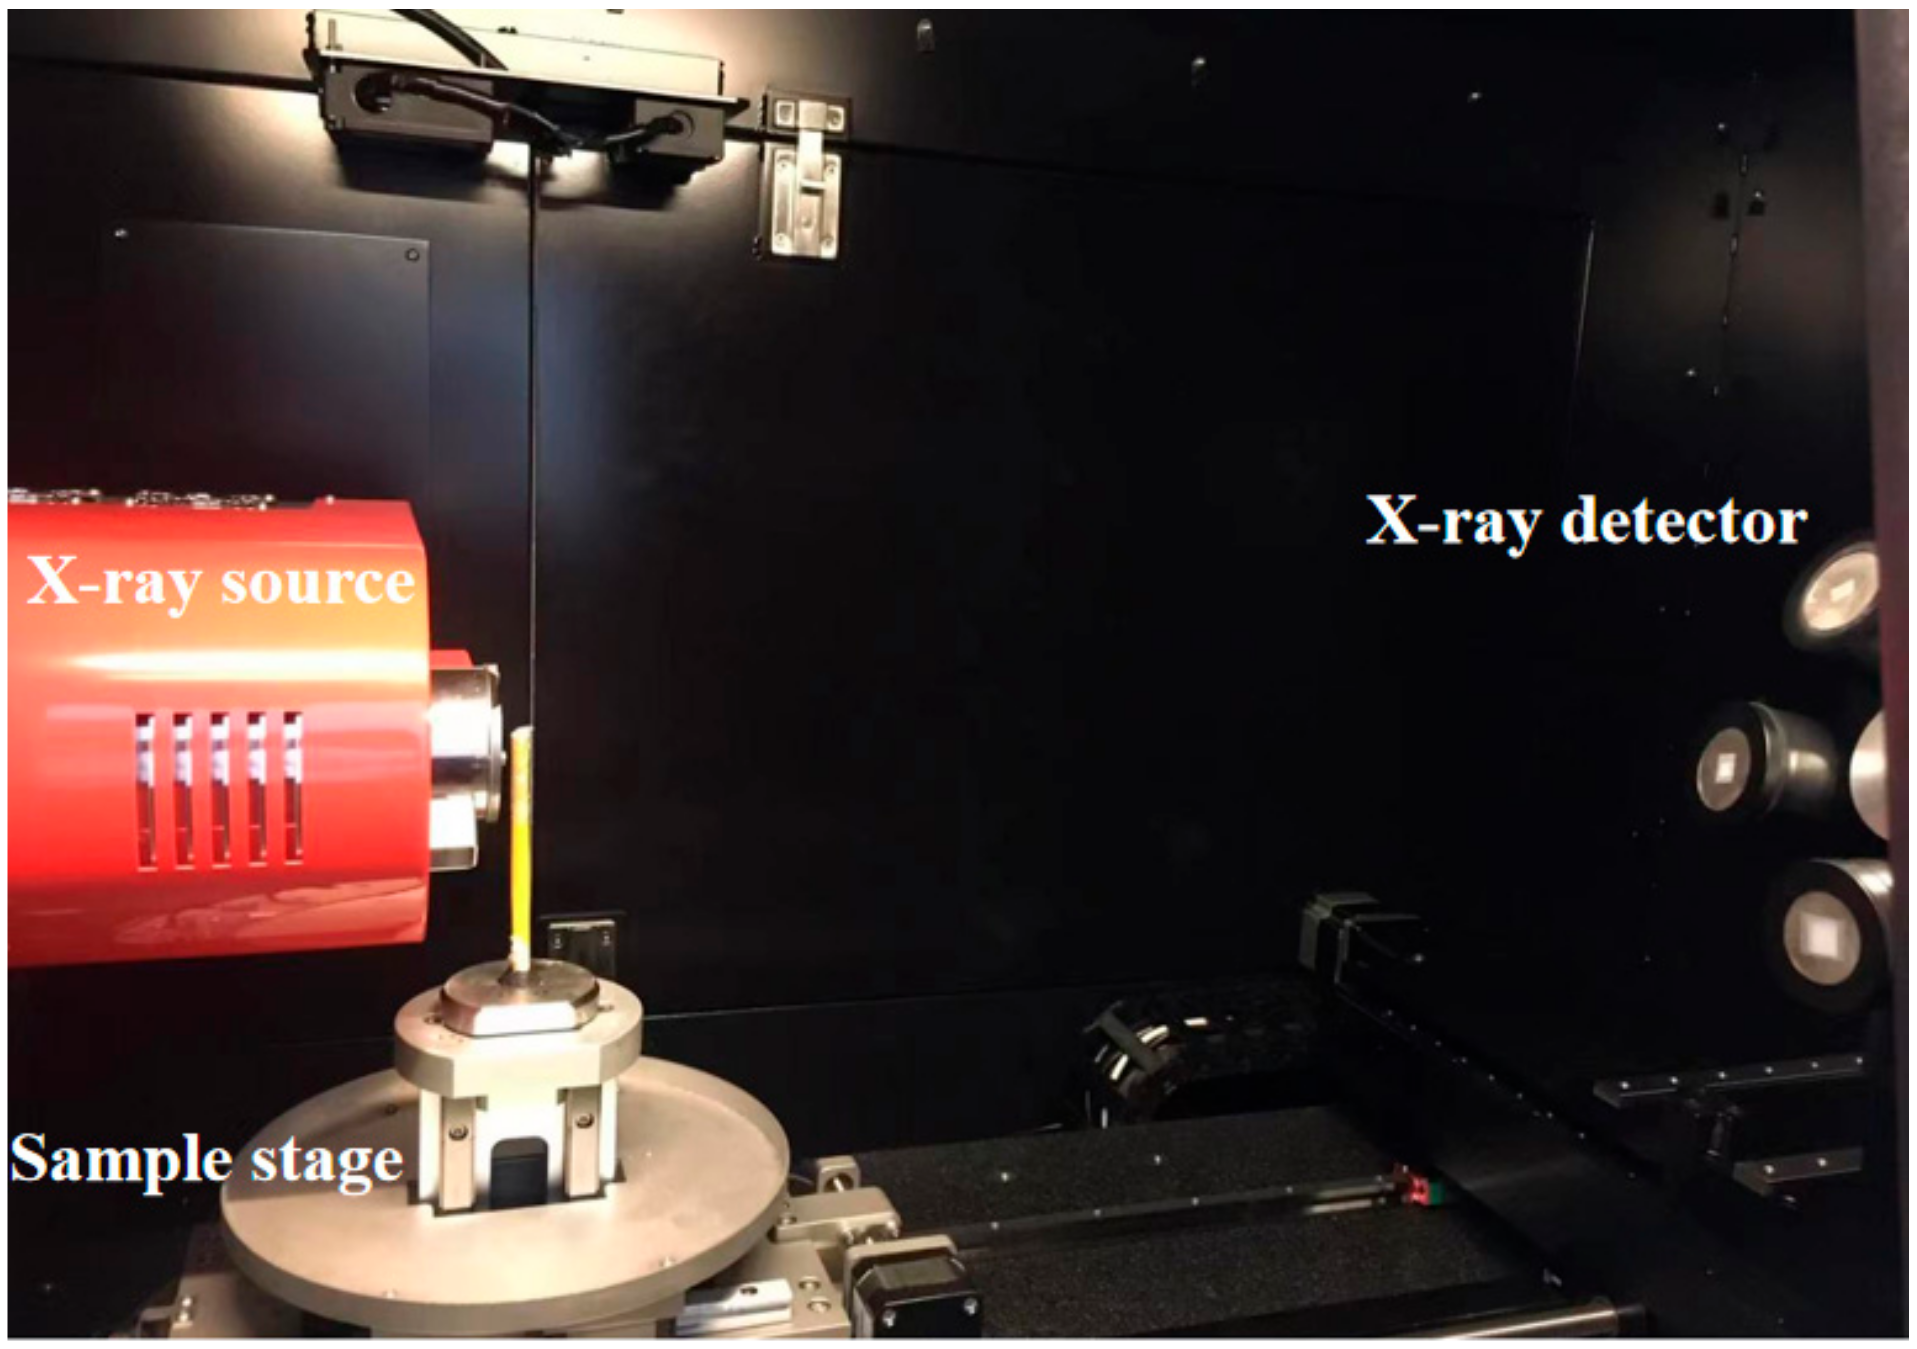
The fundamental principle of CT is the weakening of magnetic waves by absorption and scattering of the X-rays [31]. X-ray CT can visualize the 3D porous structure, distinguish the mineral component of the specimen, differentiate and pick-up the porosity system, and in situ scan to obtain the true microstructure. In this paper, the nano Voxel-2702 Micro Scanner with a spatial resolution of 4 μm (Sanying Precision Instruments Ltd., Tianjin, China) (Figure 2) was used to scan both dry and saturated CBM samples. After setting the specimen on the rotary disk, an energy class of 120 kV and current of 80 mA were used to obtain the digitally reconstructed radiograph during rotation from 0° to 360°. The exposure time is 1.5 s. The resolution of CT is much higher than that of conventional radiography and many other imaging techniques. The space resolution ratio of a CT picture determined by the focal spot size, property of the sensor, and the range between the radioactive source and the sensor from the specimen. Higher resolution images can also be gained by placing the specimen nearer to the X-ray source and far from the detector. After many tests, it is found that pushing the flat panel detector to the farthest end and placing the sample at 2 mm away from the X-ray source can obtain a high-quality image. Tomographic reconstruction was performed with the Dragonfly-reconstruction software developed by ORS company, freely provided by Sanying Ltd. Median filtering was applied to the images to decrease noise. Image artifact correction and hardening correction were used. After reconstructions, the 3D images were cropped to only select the volume within the sampling cylinders. The image analysis and treatment were then carried out using AVIZO, an image-processing program.
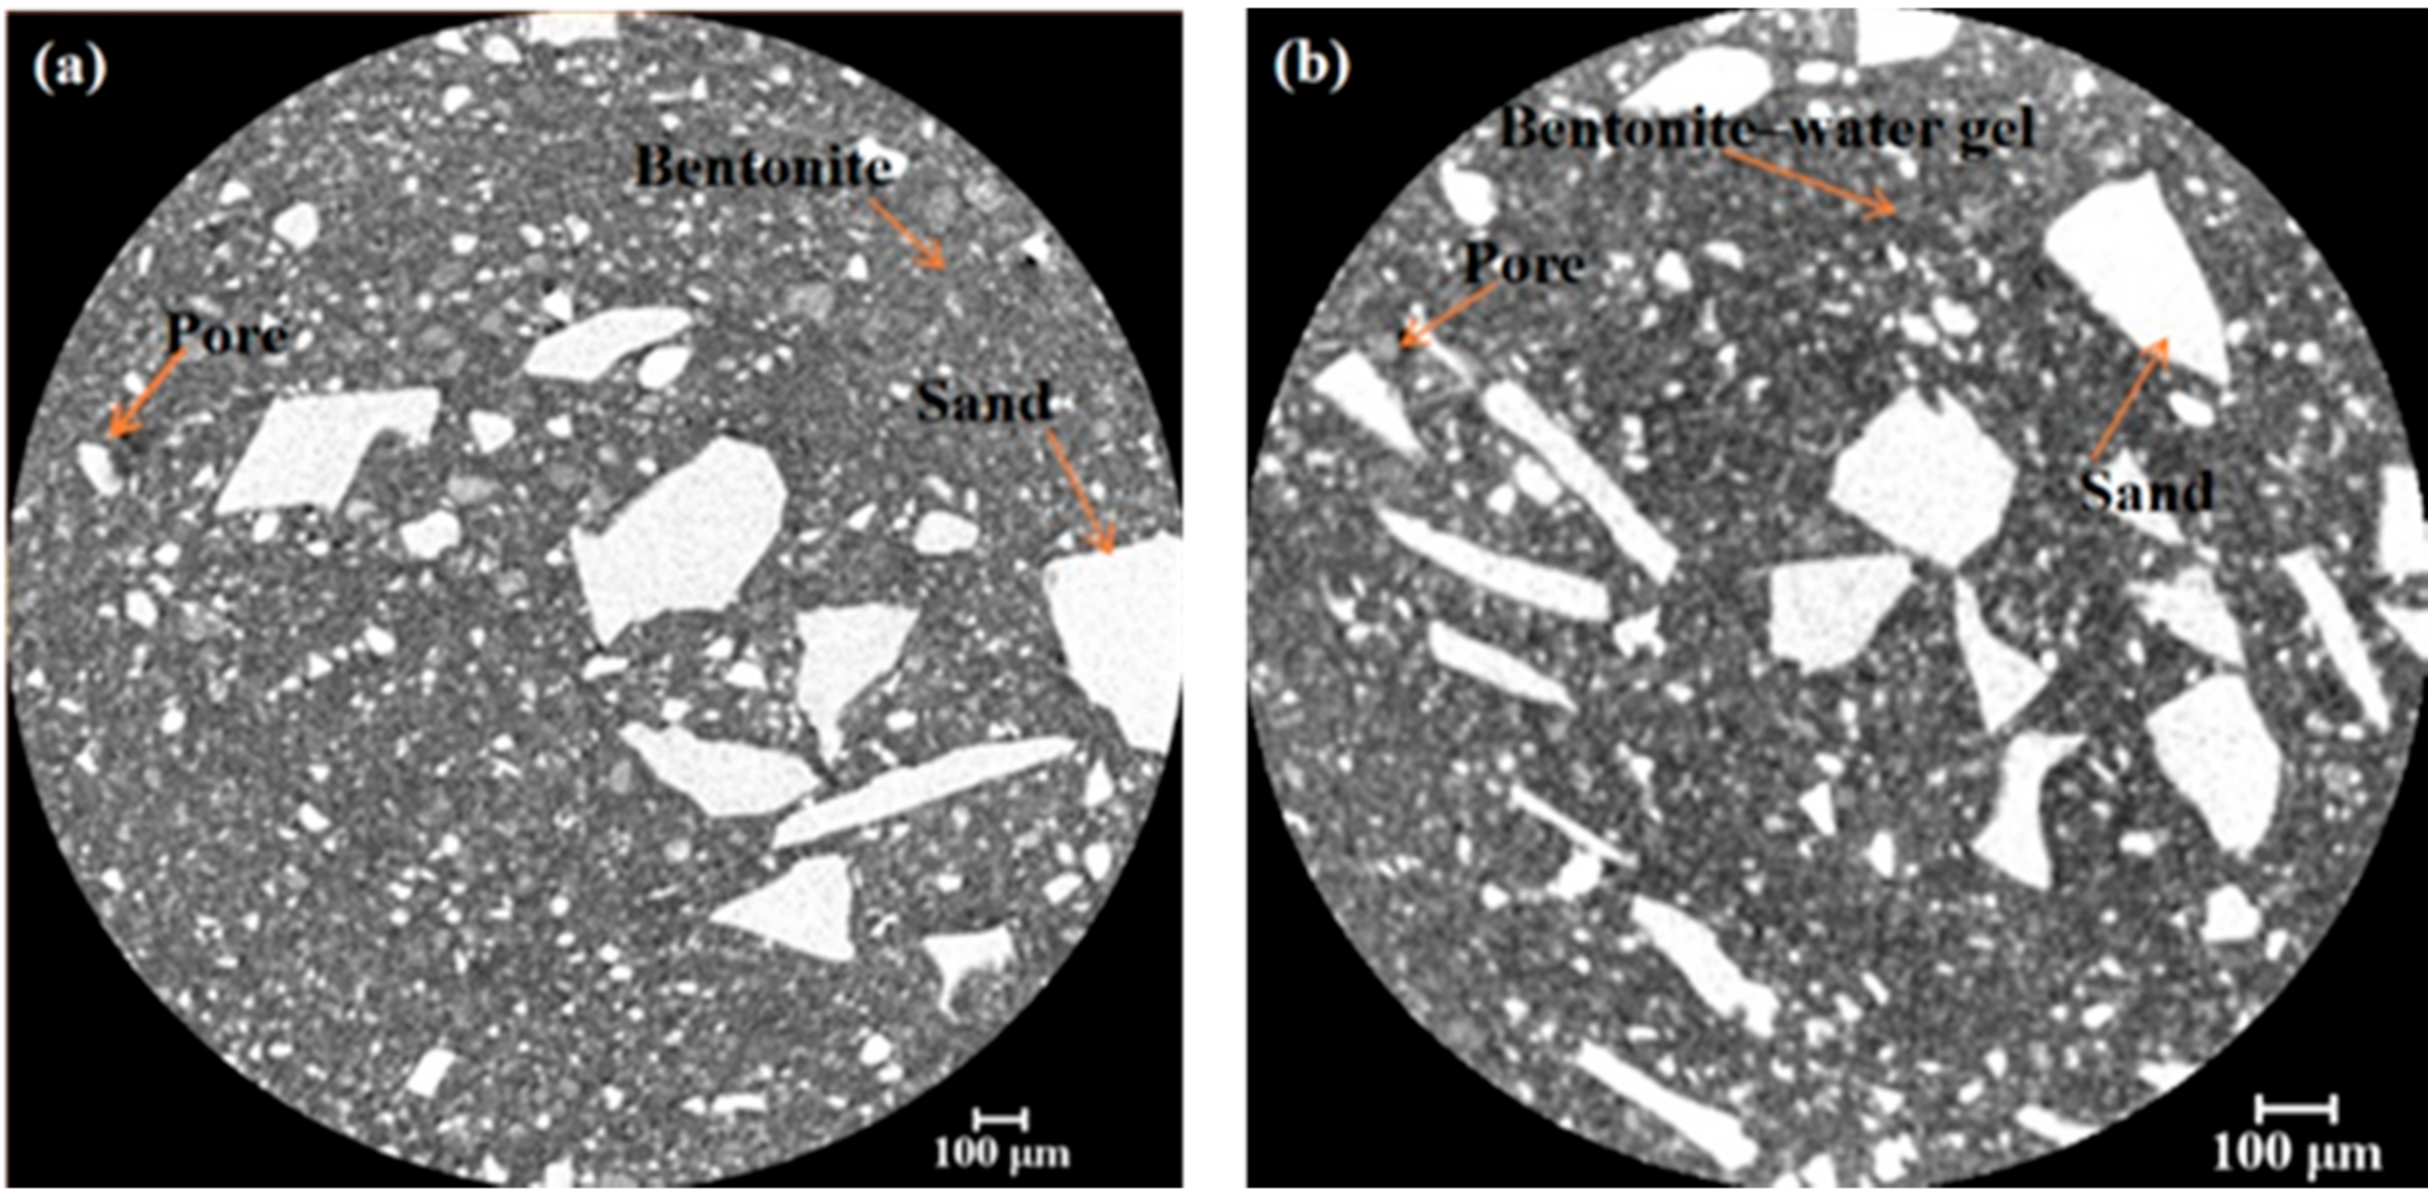
The dry CBM (S0) are scanned in pace with the DI water and other aqueous medium-saturated CBM (S1 to S4). Figure 3 can display the preliminary X-ray CT observations of 2D scanned pictures of S0 and S1 specimens, and the dry density of the specimen is 1.70 g/cm3. The scanned pictures from the S0 exhibit a better quality than the S1 because of the evolution of expansive pressure in the saturated specimen. The component elements of the specimen such as pores, bentonite grains, sand, and bentonite–water gel are legible. The CBM is not really homogeneous. The bentonite grains and sand seem a little isolated. Aggregations of bentonite grains are seen in some locations and sand with intergranular pores in other places. This isolation is perhaps induced by the density variations between bentonite powder and sand. The bright spots became smaller after the dry CBM sample was saturated with DI water in the image. This change was due to the decreases in brightness caused by the increase in X-ray attenuation in the vacancies where DI water replaced air. There are four areas showing different brightness in the 2D image, and in order of increasing brightness they are: pores, bentonite–water gel, bentonite, and sand. The swelling pressure of saturated CBM changes the structure of bentonite particles and forms bentonite–water gel, thus decreasing the fluid flow ability.

3. Preprocessing of Scanned Images

Figure 4 shows the picture preprocessing procedures of dry CBM (S0), DI water-saturated (S1), simulated Beishan water-saturated (S2), NaCl-Na2SO4- (S3), and NaOH (S4) saturated samples, respectively (from left to right). In the center of the specimen, a higher compacted density was observed, and the bentonite particles were compacted more tightly. That was because the gravity and friction effected around the specimen (Figure 4a). Scanned pictures were cut into circular sizes and the light intensity of the pictures was regulated to improve the visualization. The median filter had good effect in filtering the noise. Firstly, the pictures were de-noised using a median filter, which is used to eliminate a large number of low gray noise points and background and obtain candidate targets. Secondly, an interactive threshold command was added for image segmentation (Figure 4b). Threshold segmentation is a kind of image segmentation technology based on region; the basic principle is to divide the image pixels into several categories by using the different gray levels of each pixel of the image. It is especially suitable for images in which the target and background occupy different gray level ranges. The threshold values in the split images are grouped in the light of the attenuation density, in which the densest part is represented by bright voxels and the least dense part is represented by darker voxels. The saturated CBM samples are composed of bentonite, water, void, and sand. Thirdly, the separate objects command was added to split the connected samples. After segmentation, the pore networks were reconstructed and visualized using AVIZO. The resulting 3D information concerning pores connected by pores throats included pore sizes, tortuosity, total surface area, porosity, and PSD.

4. Results and Discussion

4.1. Maximum Expansion Pressure and Hydraulic Conductivity

The maximum expansion pressures and hydraulic conductivity of the CBM at various aqueous mediums are presented in Table 1. It is shown that the expansion pressure was largest under the infiltration of DI water and smallest under the NaOH solution. Compared to the DI water-saturated sample, the expansion pressure of the specimens prepared with the NaCl-Na2SO4 and NaOH solutions diminished. According to observation, the change of expansion pressure was more obvious to S4 in contrast with S3. For instance, sample S4 displayed that the reduction in expansion pressure was approximately 54% that of S1. Nevertheless, sample S3 displayed a reduction in expansion pressure that was 27% of S1. The maximum expansion pressure of samples was NaOH < NaCl-Na2SO4 < Simulated Beishan groundwater < DI water. When the CBM were penetrated with NaOH solution, the main cause for the decrease of expansion pressure was that the disintegration of montmorillonite (Al2 [Si4O10] (OH)2) and sorosilicate. The OH anions reacts with its hydrolysate, namely
Al 2 Si 4 O 10 OH 2 + 10 H 2 O = 2 Al OH 3 + 4 Si OH 4
Al 2 Si 4 O 10 OH 2 + 2 Na + + 2 OH + 4 Si OH 4 = 2 NaAlSi 3 O 8 + 6 H 2 O
5 Al 2 Si 4 O 10 OH 2 + 12 Na + + 12 OH + 2 Al OH 3 + 10 H 2 O = 4 Na 3 Al 3 Si 5 O 16 6 H 2
Al 2 Si 4 O 10 OH 2 + 2 Na + + 2 OH = 2 NaAlSi 2 O 6 6 H 2 O
The expansion pressures in this study display a similar tendency as that discovered in Karnland et al. [32]. They found that 1.0 M NaOH solution resulted in an obvious lessening of expansion pressure, and no considerable mineralogical variations were detected in the tests. For specimen of 1.7 g/cm3 dry density, the permeability coefficient changed from 6.87 × 10⁻¹³ m/s (with DI water) to 6.84 × 10⁻¹³ m/s (with Beishan groundwater) to 11.93 × 10⁻¹³ m/s (with NaCl -Na2SO4 solutions) and 15.51 × 10⁻¹³ m/s (with NaOH solutions), respectively. The permeability coefficient of samples was NaOH > NaCl -Na2SO4 > Simulated Beishan groundwater > DI water. The permeability coefficient decreased with the increasing of maximum expansion pressure. NaCl-Na2SO4 and NaOH solutions increased the pore sizes and number of interconnected pores of CBM, making the mixtures more permeable compared to DI water-saturated ones. The hydro-mechanical behavior between the various aqueous medium and the CBM present in the HLW repository may raise the links among the aperture gap, bringing about a higher penetration rate. The high salt concentration in pore water caused the soft part of the clay gel and microstructural particle network to coagulate, thus widening the voids and leading to the increase in average volumetric hydraulic conductivity. This observation is consistent with the conclusions reported by Mishra et al. [33].

4.2. Pore Connectivity

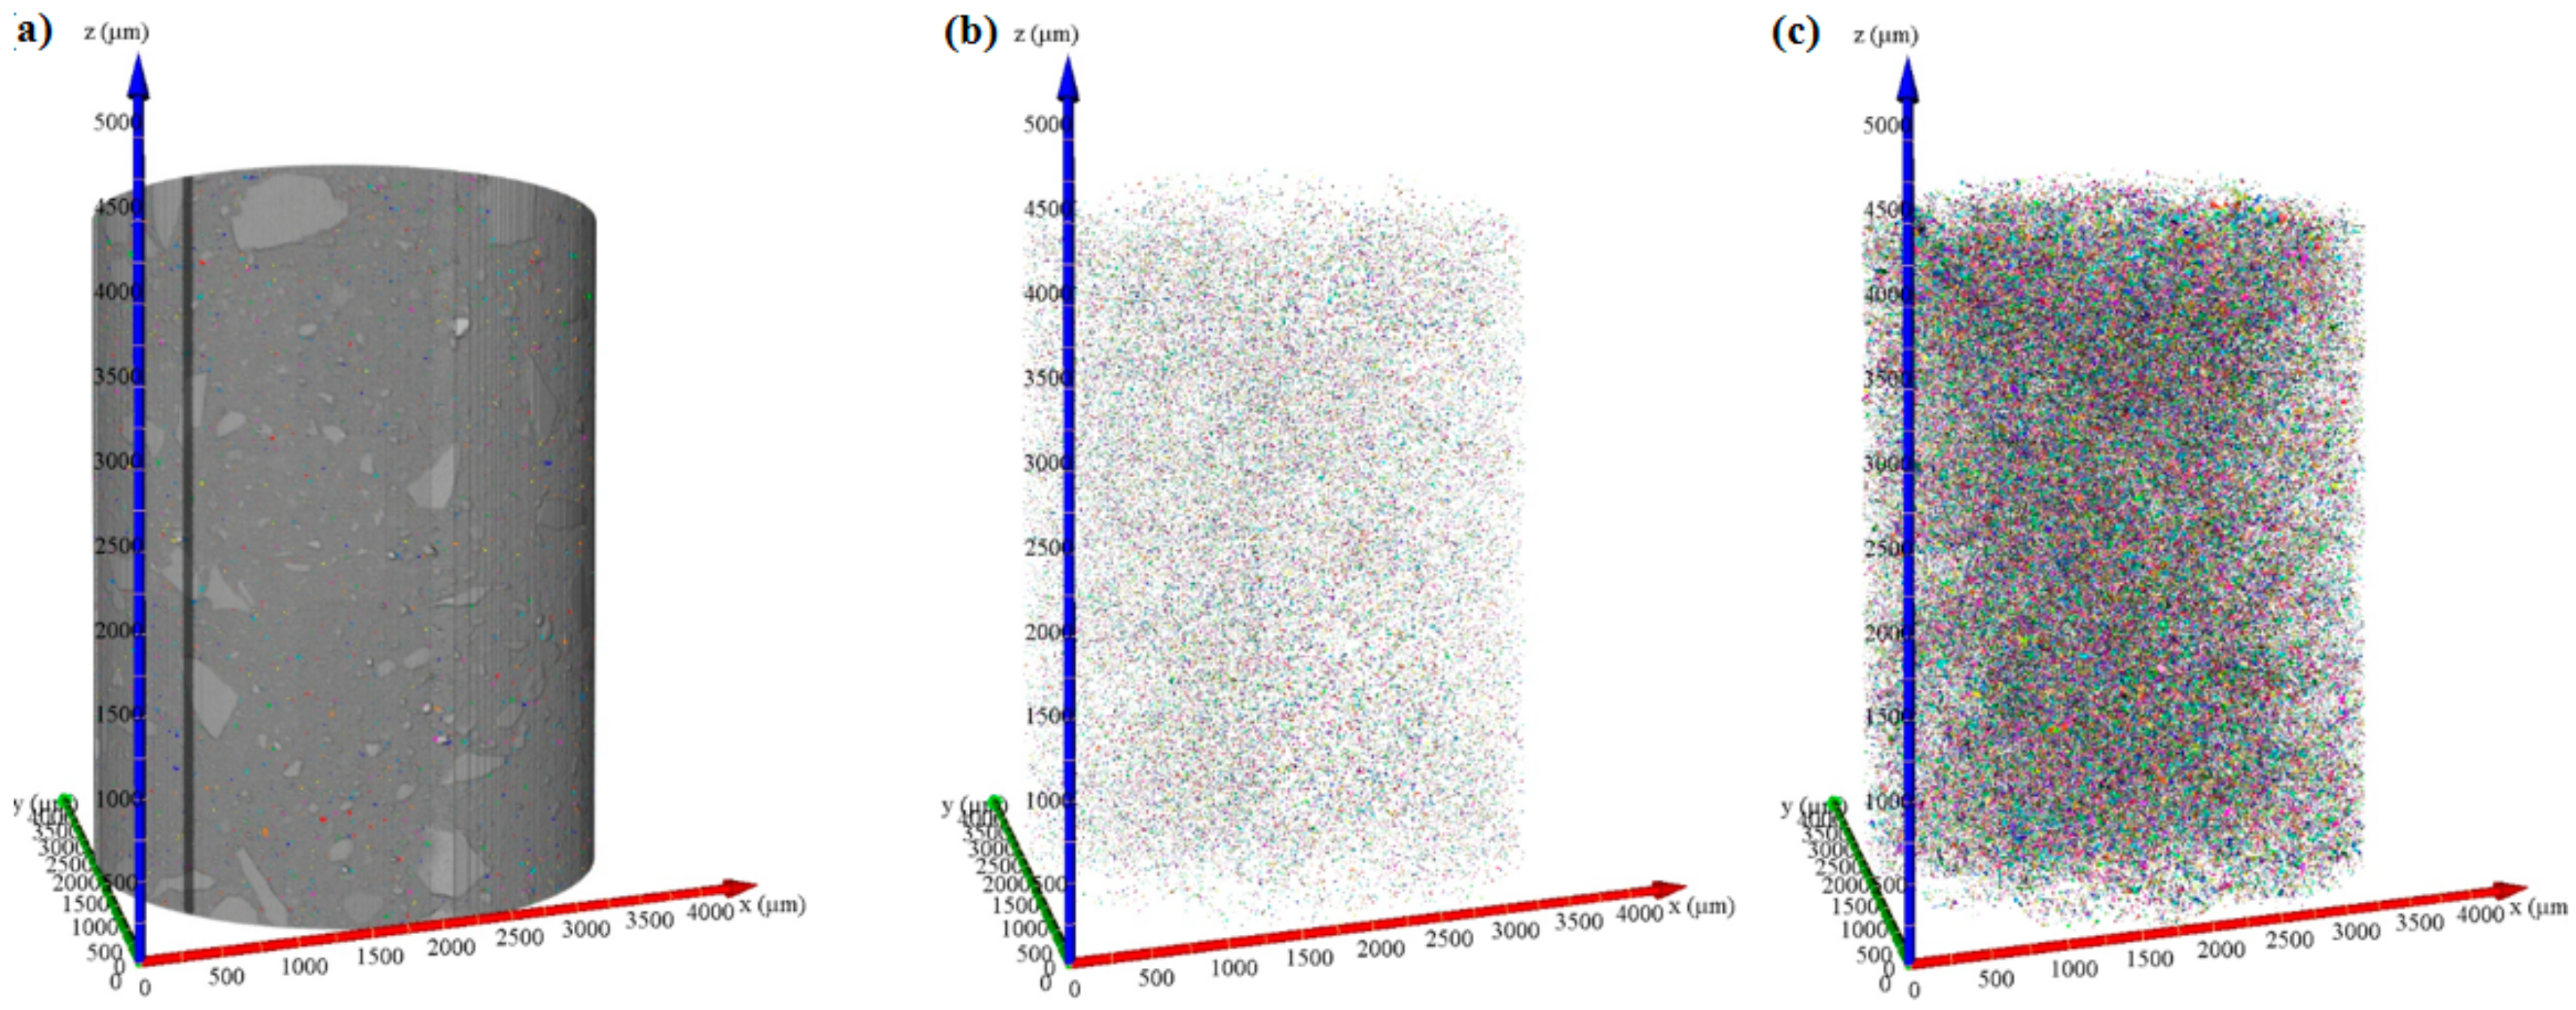
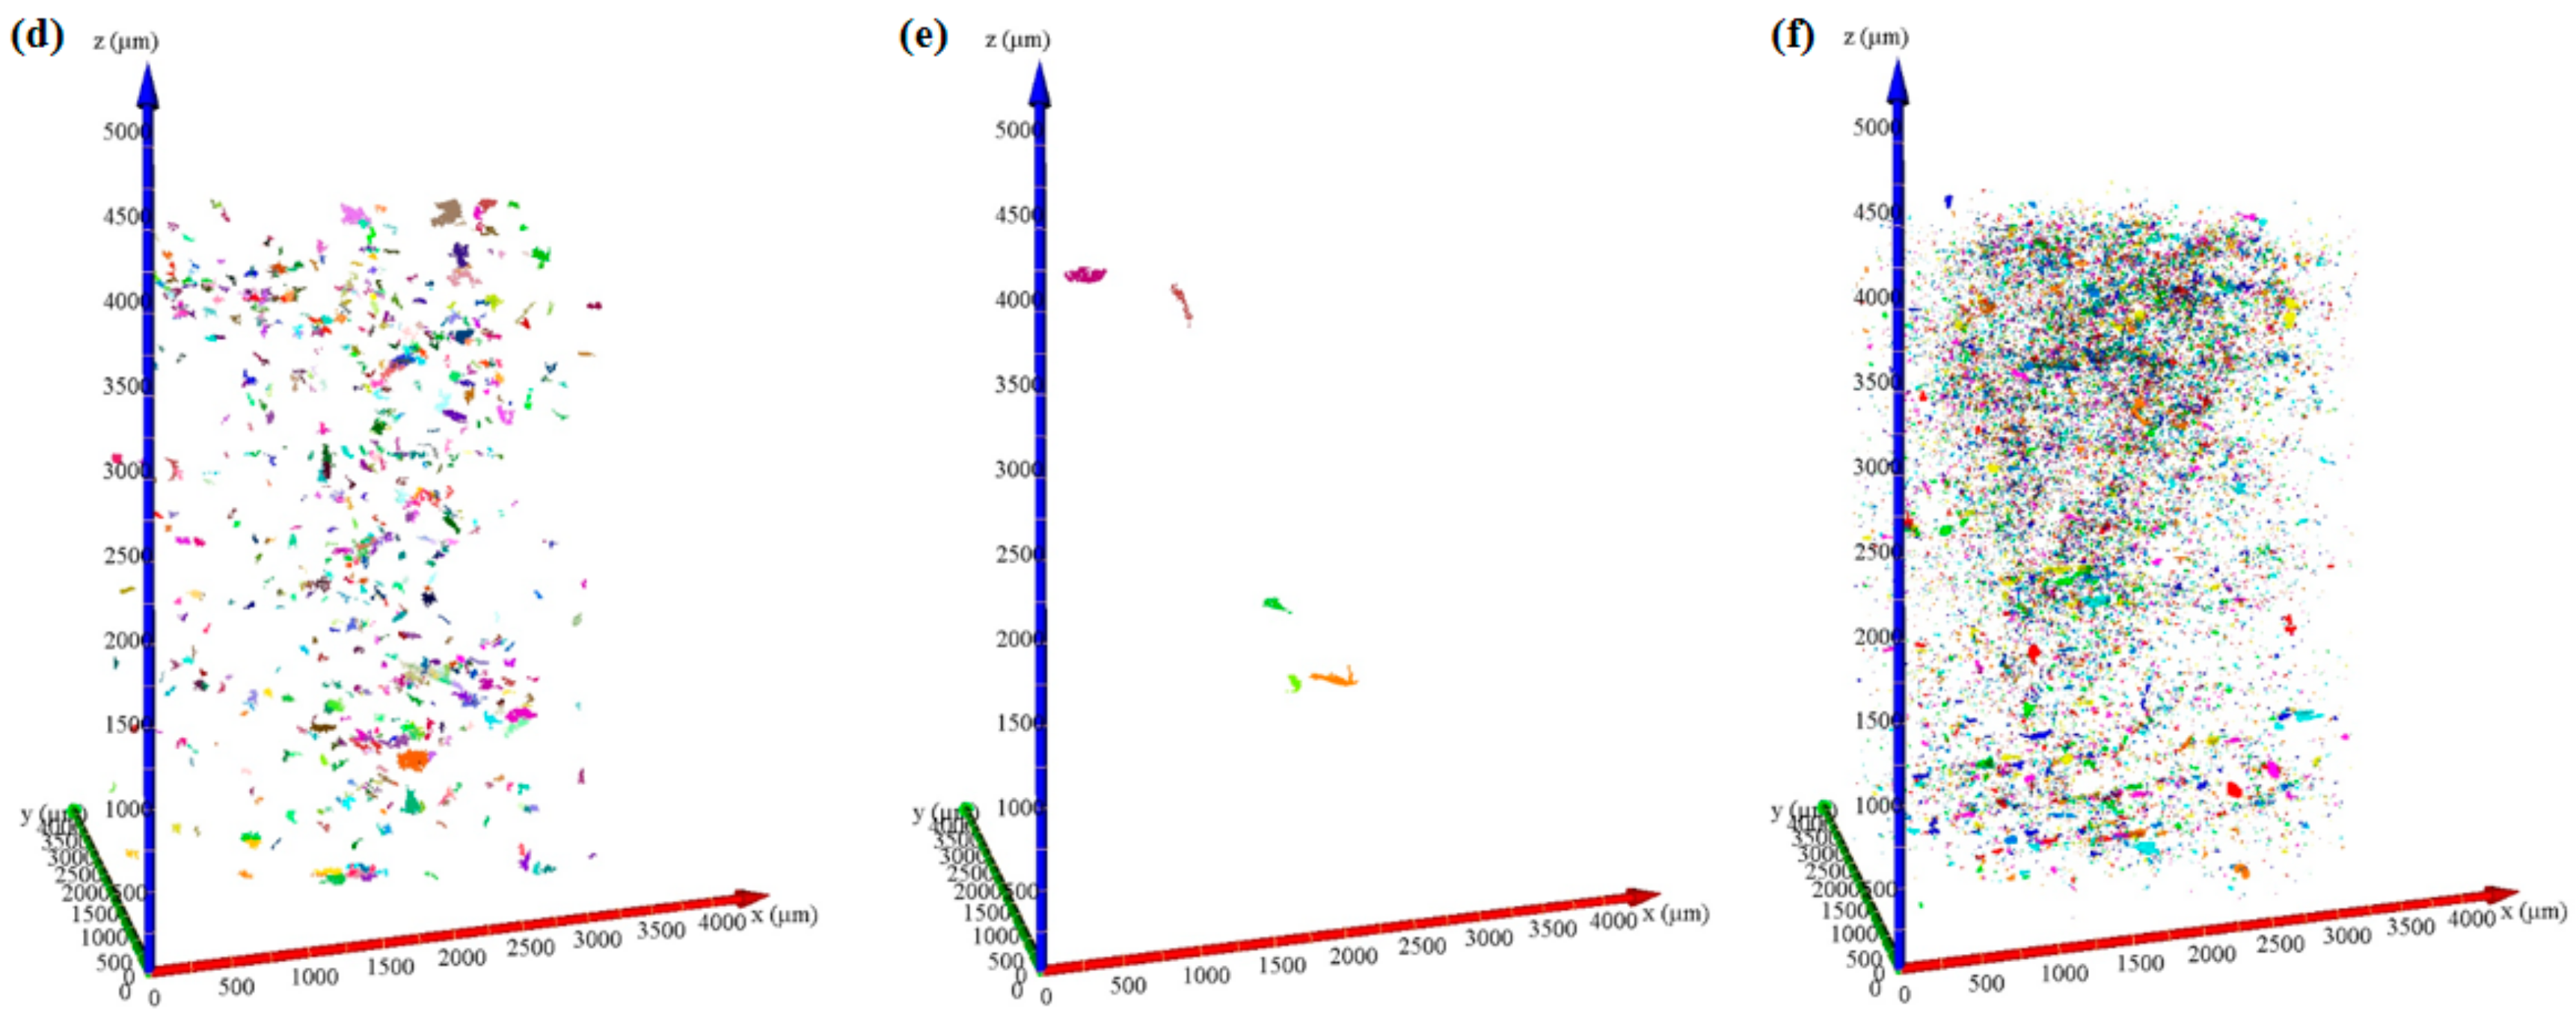
Connectivity is a measure of the number of independent ways between two points within the pore space [34]. Two factors need to be considered in order to quantify connectivity: the pore size and amount of pore throats. In this study, the connected porosity was calculated by using AVIZO software. According to the different aperture, the connected porosity sizes were classified into the four groups: 0–10 μm, 10–100 μm, 100–400 μm, and >400 μm. The percentile of connected components in every size extent was determined to study the capability of specimens to carry aqueous mediums. The capacity of aqueous mediums transfer is raised with the adding percentile of larger interconnected pores. The analysis results of connecting components of sample S4 showed that the total volume was 4.38 × 108 μm3 (Figure 5a). The number of connected pores were on a scale of 0 to 10 μm and contributed to 9.12% of the gross porosity (Figure 5b); the porosity (82.7% of the gross resolved porosity) was governed by the connected pores, which had a size on a scale of 10 to 100 μm (Figure 5c). On a scale of 100 to 400 μm, connected pores were rarely found in Figure 5d. Few pores were discovered having a size greater than 400 μm, which contributed only 0.51 % of total resolved porosity (Figure 5e). Figure 5f reveals interconnected pore space showing different sizes.
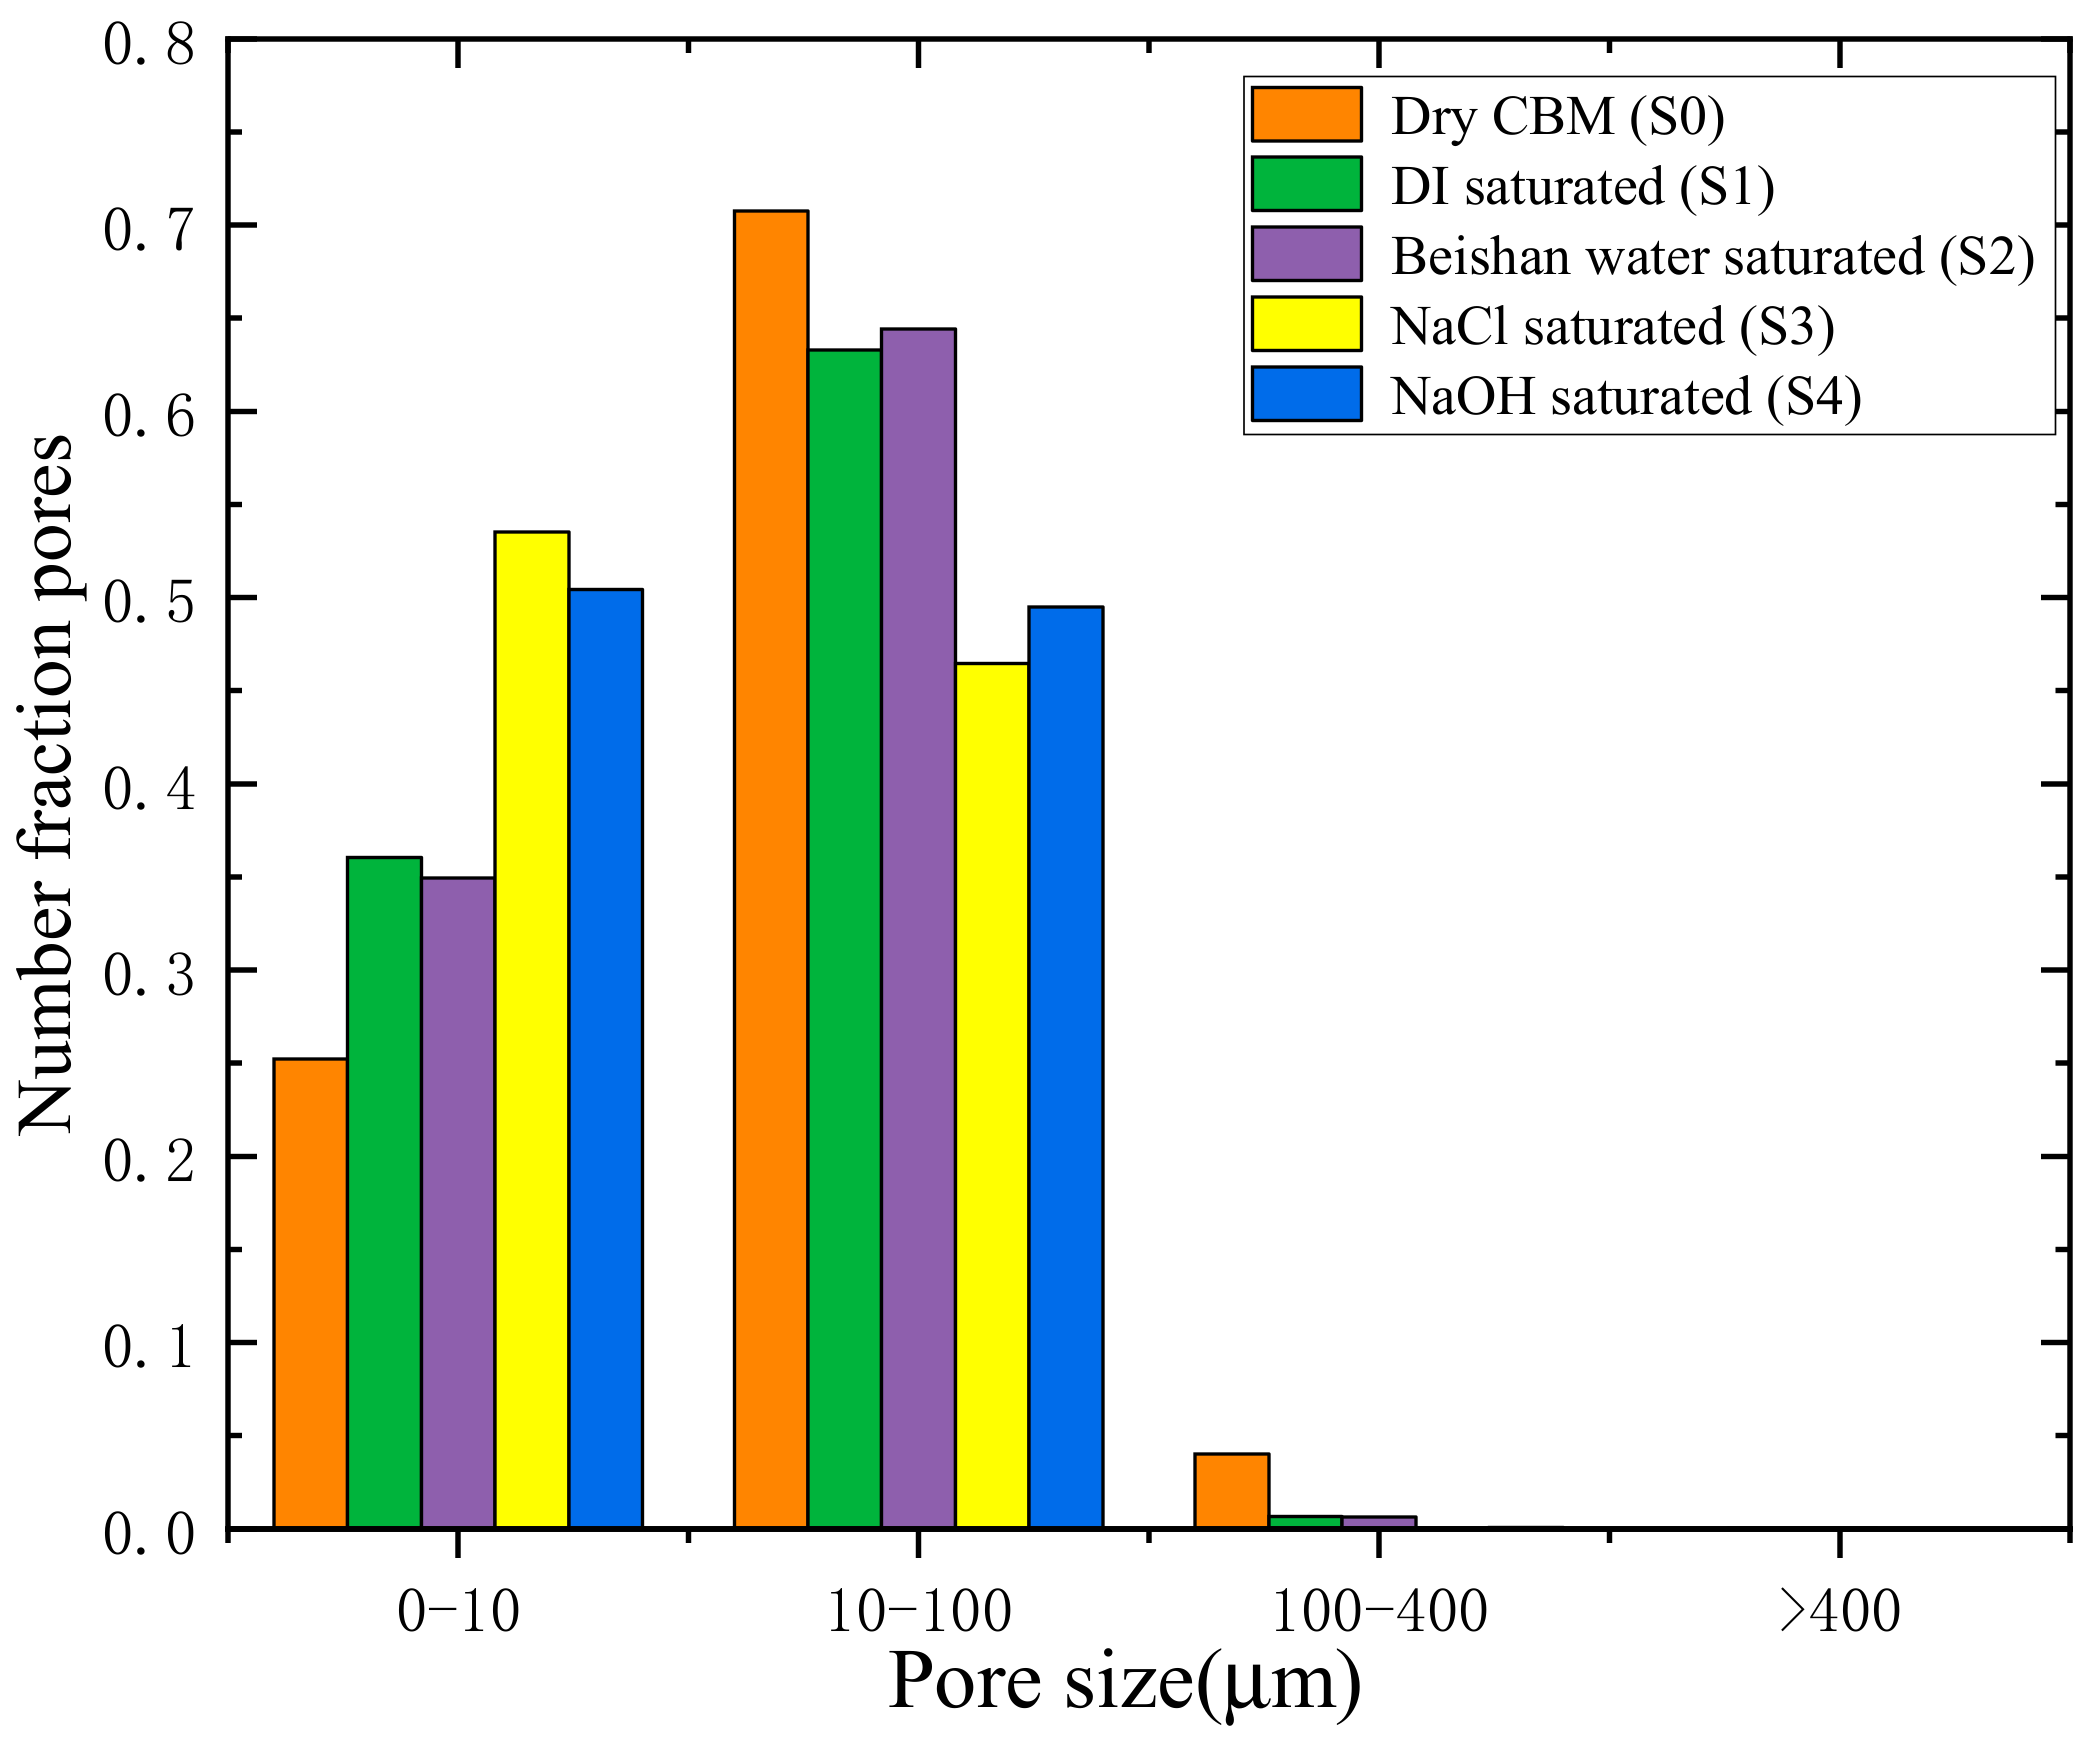
The effect of various aqueous mediums on the interconnected pore size according to number fraction and percentile of gross porosity is shown in Figure 6. Most of the pore size of CBM samples were lower than 100 μm. In the range of 10 to 100 μm, sample S0 contained the maximum quantity of pore fractions. Sample S3 included the maximum amount of pore fractions on a scale of 0 to 10 μm. The number of pore fractions were rarely found in the range of 100 to 400 μm except sample S0, and few pores were discovered having a size greater than 400 μm. Under the permeation of NaCl-Na2SO4 and NaOH solution, the number of pore fractions was almost equal in different pore size ranges.
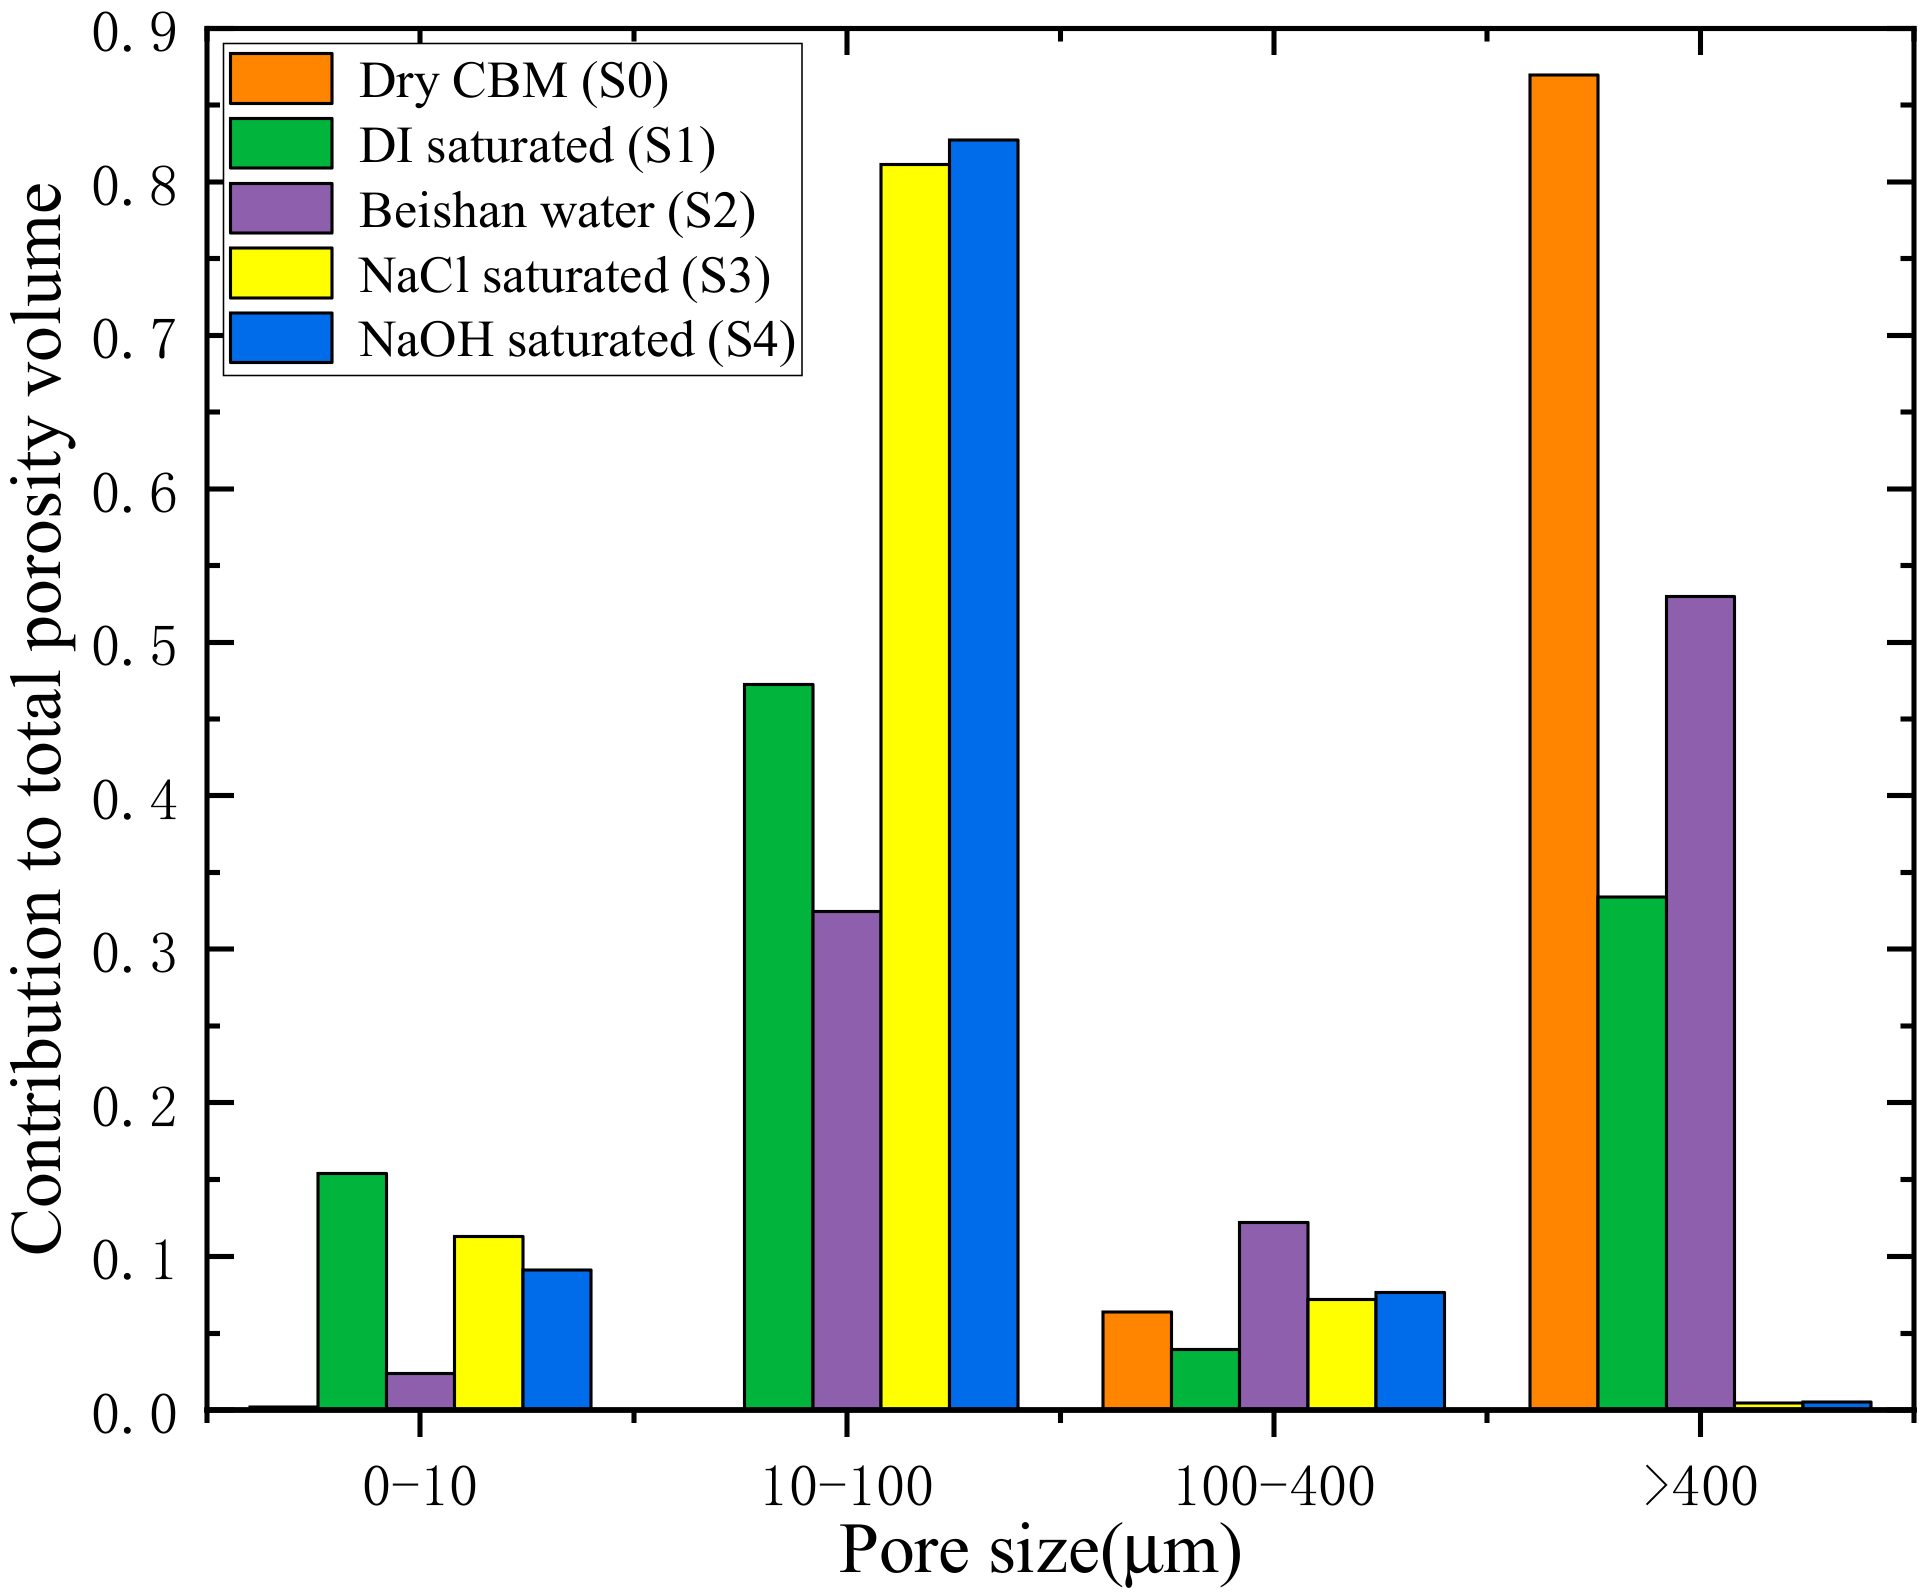
The influence of various aqueous mediums on the connected pore size according to contribution to total porosity volume is shown in Figure 7. In case of NaCl-Na2SO4 and NaOH solution penetration, the gross porosity contributions of connected pores of the CBM were changed. The percentage contribution of sample S3 to the gross porosity was discovered on a scale of 10 to 100 μm. For the pore size ranging from 10 to 100 μm, the percentage contribution of samples S1, S3, and S4 to the total porosity reached the peak, but the samples of S0 and S2 displayed the crest value on a scale of greater than 400 μm. Compared with the specimen S1, it was found that under the corrosion of NaCl-Na2SO4 and NaOH solution, the pores of samples increased, and the increase in the size from 10 to 100 μm was more obvious, which widened the infiltration path of the solution and improved the permeability coefficient of CBM.

4.3. PSD and Porosity

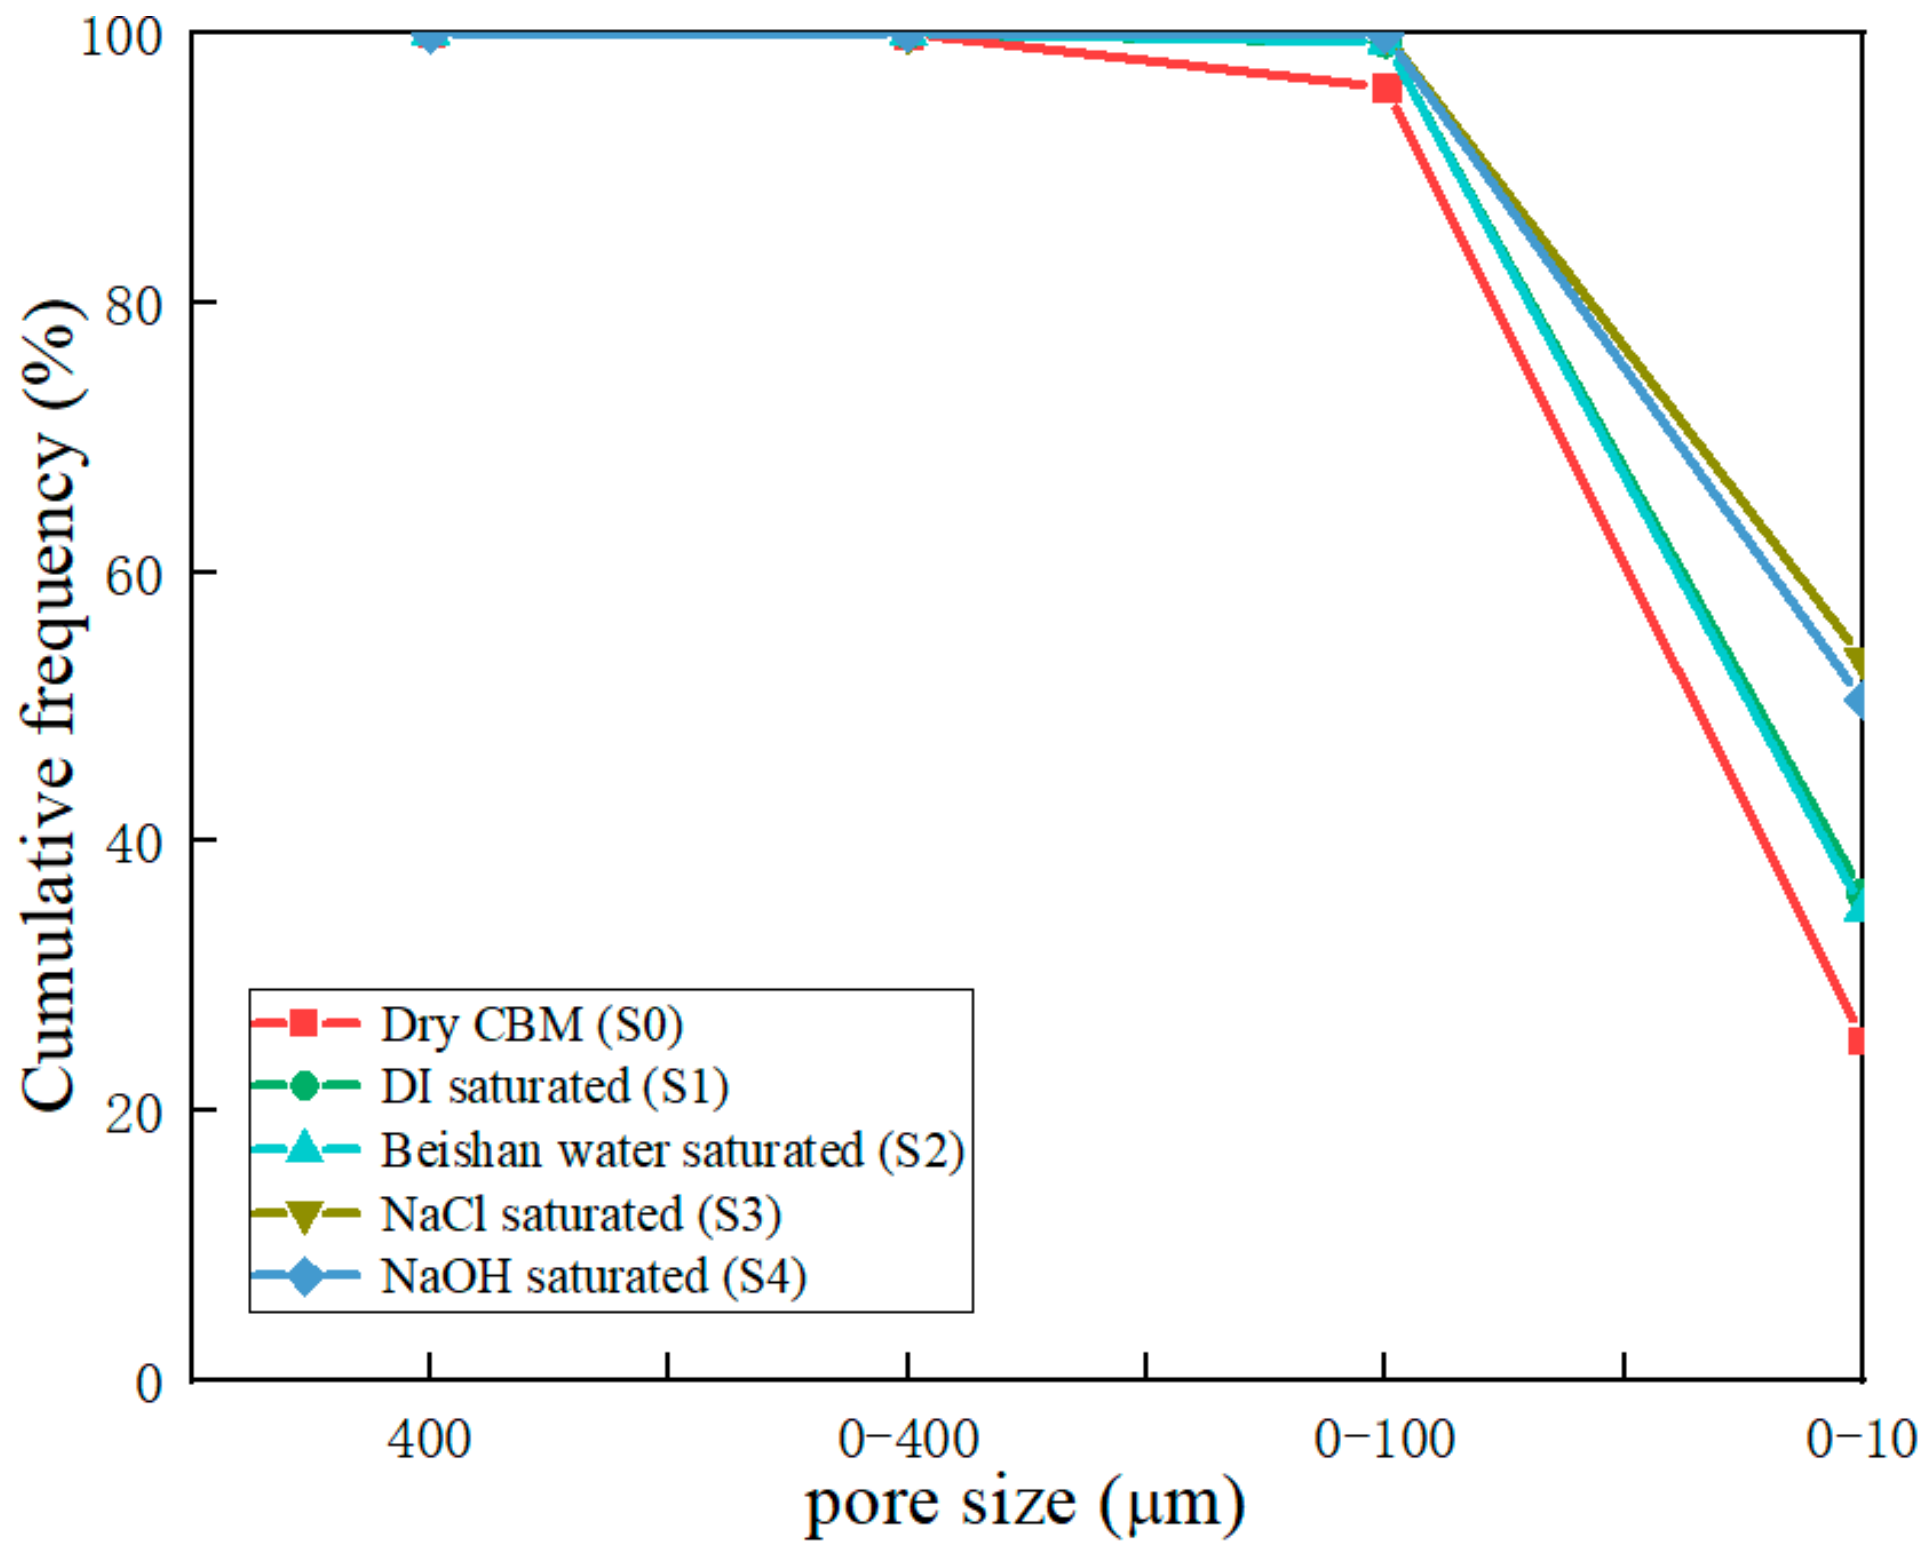
PSD refers to the percentage of all levels of pore size in the material calculated by quantity or volume. Figure 8 depicts the cumulative PSD of dry CBM, DI water-saturated, simulated Beishan groundwater-saturated, NaCl-Na2SO4- and NaOH-saturated samples. It was observed that during the hydrating process, the macropores present within the CBM at a dry state have disappeared. The bentonite has been transformed into a mixture of bentonite grains, gel, and pores. In addition, within the range of 1 to 10 μm, there were about 25% pores of the sample S0, about 35% pores of the S1 and S2, and approximately 50% pores of the samples S3 and S4. The PSD of samples S1, S2, S3, and S4 had approximately 97% of the gross pores on a scale of 0–100 μm and had 99.9% of the total pores on a scale of 0–400 μm. The PSD of sample S0 had approximately 90% of the gross pores on a scale of 0–100 μm and had 99.7% of the total pores on a scale of 0–400 μm. Recently, Liu et al. [18] used the discrete PSD (DPSD) and continuous PSD (CPSD) algorithms to estimate PSD and permeability. Their results showed that the permeability estimated by the DPSD was 2–3 magnitude greater than that estimated by CPSD, and the permeability calculated by the CPSD algorithm was a little lower than that gained in the science room.
The porosities of both the DI water and different solutions saturated CBM samples were listed in Table 1. The porosity computed from the CT examination was effective porosity, which displayed a better dependence and lower permeability of samples. For the simulated Beishan groundwater-penetrated the samples, the porosity of the samples was almost unaffected. When the NaOH solution was infiltrated, the porosity of the specimens was greatly changed. Due to the dissolution and erosion of montmorillonite aggregates, the pores of samples increased and the increase in macropores was more obvious, which widened the infiltration path of the solution and improved the porosity of CBM. The porosities from the CT analysis had a disposition to increase with the penetration of NaCl-Na2SO4 and NaOH solution. These findings are consistent with the conclusions reported by Ref. [31]. In Ref. [31], Sarkar et al. calculated the porosities of both the NaCl solution and DI water-saturated bentonite–sand mixture through the consolidation experiments and CT picture analysis. It was noted that the porosity found in the consolidation experiments displayed marked higher values in contrasted with porosity that was obtained from the CT result.

5. Conclusions

Underground water in Beishan district maybe achieves a high pH value because of its chemical element background during the operation of the repository. The majority of previous research carried out on compacted bentonites and CBM in laboratories has been obtained from the combined use of MIP and SEM on freeze-dried samples. Compared to MIP and SEM, X-ray CT provided more detailed information and was representative on the bigger scale structure, including pore connectivity and PSD through the sample.
(1)
The expansion and hydraulic test results showed that the expansion pressure was largest under the infiltration of DI water and smallest under the NaOH solution. The permeability coefficient of samples was NaOH > NaCl-Na2SO4 > Simulated Beishan groundwater > DI water, and the maximum expansion pressure of samples was NaOH < NaCl-Na2SO4 < Simulated Beishan groundwater < DI water. The permeability coefficient decreased with the increasing of maximum expansion pressure. In the HLW repository, the hydro-mechanical behavior between the various aqueous medium and the CBM present may raise the links among the aperture gap bringing about a higher penetration rate, emphasizing the significance of this study for designing safe HLW processing technologies.
(2)
Polyethylene pipes were used for containing the samples to prevent water evaporation from the CBM during the scanning. Pushing the flat panel detector to the farthest end and placing the sample at 2 mm away from the X-ray source can obtain high-quality images. The rebuild pictures were de-noised and segmented in order to segregate the pores and particles present in the mixture. The observations of CBMs confirmed that CT has been capable of sufficiently differentiating the bentonite from the sand in reality. The ‘pores’ and ‘bentonite–water gel’ of the mixtures after water infiltration were distinguishable in CT pictures.
(3)
Three-dimensional models were restructured with AVIZO software using an interactive threshold segmentation method, and porous structures were quantified and characterized. Research showed that large pore content will decrease while its small pores will increase rapidly. Contrasting with specimen S1, the pores increased under the corrosion of the NaCl-Na2SO4 and NaOH solution, and the increase in the pore size from 10 to 100 μm was more obvious, which widened the infiltration path of the solution and improved the permeability of CBM. In this study, a 3D model with real pore texture features was established using the combination of CT scanning and AVIZO. The combination of X-ray CT and AVIZO software analysis can enable high-resolution assessment of the 3D microstructures of the CBM samples.

Author Contributions

Z.W. and Y.W. designed the overall framework and conceived the idea for this paper; F.Y. provided some suggestions on the structure of the paper. All authors have read and agreed to the published version of the manuscript.

Funding

This study was financially supported by the National Key Research and Development Program of China (Nos. 2019YFC1803500, 2019YFC1803504), the National Natural Science Foundation of China (No. 41402248), Nuclear Facility Decommissioning and radioactive waste treatment research project of the State Administration of science, technology and industry of national defense (No. 1521 (2018)) of the second division of science and Technology), the key research and development projects of Sichuan science and technology department (No. 2018SZ0298), the Scientific re-search project of Sichuan education department (No. 16ZB0150) and the Longshan academic re-search talent support program of Southwest University of Science and Technology (Nos. 17LZX308, 17LZX613, 18LZX638 and 18LZXT03).

Institutional Review Board Statement

Not applicable.

Informed Consent Statement

Not applicable.

Data Availability Statement

Data sharing not applicable.

Acknowledgments

The authors would like to thank Zhiqiang Zeng for their assistance in revising the manuscript.

Conflicts of Interest

The authors declare conflict of interest.

References

  1. Sharif, A.D.; Hossam, A.G.; Vahid, D.; Mohammed, A.; Isaac, H. A comprehensive review on radioactive waste cycle from generation to disposal. J. Radioanal. Nucl. Chem. 2021, 329, 15–31. [Google Scholar]
  2. Wang, J. Progress of geological disposal of high-level radioactive waste in China in the 21st century. Atom. Energ. Sci. Technol. 2019, 53, 2072–2082. (In Chinese) [Google Scholar]
  3. Jia, L.Y.; Chen, Y.G.; Ye, W.M.; Cui, Y.J. Effects of a simulated gap on anisotropic swelling pressure of compacted GMZ bentonite. J. Eng. Geol. 2019, 248, 155–163. [Google Scholar] [CrossRef]
  4. CAEA (China Atomic Energy Authority); Ministry of Environment Protection & Ministry of Science and Technology. Guidelines for the R&D for Geological Disposal of High-Level Radioactive Waste in China; Atomic Energy Press: Beijing, China, 2006. (In Chinese)
  5. Liu, Y.; Ma, L.; Ke, D.; Cao, S.; Xie, J.; Zhao, X.; Cheng, L.; Zhang, P. Design and validation of the THMC China-Mock-Up test on buffer material for HLW disposal. J. Rock Mech. Geotech. 2014, 6, 119–125. [Google Scholar] [CrossRef] [Green Version]
  6. Castellanos, E.; Villar, M.V.; Romero, E.; Lloret, A.; Gens, A. Chemical impact on the hydro-mechanical behavior of high density FEBEX bentonite. Phys. Chem. Earth 2008, 33, 516–526. [Google Scholar] [CrossRef]
  7. Guo, Y.H.; Yang, T.X.; Liu, S.F. Hydrogeological characteristics of Beishan preselected area, Gansu province for China’s high-level radioactive waste repository. Uranium Geol. 2001, 17, 184–189. (In Chinese) [Google Scholar]
  8. Chen, L.; Peng, H.; Yang, D. The microstructure and water distribution of partially saturated hard clay. Geotech. Test. J. 2018, 41, 830–835. [Google Scholar] [CrossRef]
  9. Alves, H.; Lima, I.; Assis, J.T.; Geraldes, M.; Lopes, R.T. Comparison of pore space features by thin sections and X-ray microtomography. Appl. Radiat. Isotopes. 2014, 94, 182–190. [Google Scholar] [CrossRef] [Green Version]
  10. Rab, M.A.; Haling, R.E.; Aarons, S.R.; Hannah, M.; Young, I.M.; Gibson, D. Evaluation of X-ray computed tomography for quantifying macroporosity of loamy pasture soils. Geoderma 2014, 213, 460–470. [Google Scholar] [CrossRef]
  11. Wang, J.; Qin, Q.; Guo, L.; Feng, Y. Multi-fractal characteristics of three-dimensional distribution of reconstructed soil pores at opencast coal-mine dump based on high-precision CT scanning. Soil Till. Res. 2018, 182, 144–152. [Google Scholar] [CrossRef]
  12. Larsbo, M.; Koestel, J.; Jarvis, N. Relations between macropore network characteristics and the degree of preferential solute transport. Hydrol. Earth Syst. Sci. 2014, 18, 5255–5269. [Google Scholar] [CrossRef] [Green Version]
  13. Shah, S.M.; Gray, F.; Crawshaw, J.P.; Boek, E.S. Micro-computed tomography pore-scale study of flow in porous media: Effect of voxel resolution. Adv. Water Res. 2016, 95, 276–287. [Google Scholar] [CrossRef] [Green Version]
  14. Katuwal, S.; Norgaard, T.; Moldrup, P.; Lamandé, M.; Wildenschild, D.; Jonge, L.W. Linking air and water transport in intact soils to macropore characteristics inferred from X-ray computed tomography. Geoderma 2015, 238, 9–20. [Google Scholar] [CrossRef]
  15. Liang, L.X.; Xiong, J.; Liu, X.J. Mineralogical microstructural and physiochemical characteristics of organic-rich shales in the Sichuan Basin, China. J. Nat. Gas Sci. Eng. 2015, 26, 1200–1212. [Google Scholar] [CrossRef]
  16. Vogel, H.J. A numerical experiment on pore size, pore connectivity, water retention, permeability, and solute transport using network models. Eur. J. Soil Sci. 2000, 51, 99–105. [Google Scholar] [CrossRef]
  17. Sandin, M.; Koestel, J.; Jarvis, N.; Larsbo, M. Post-tillage evolution of structural pore space and saturated and near-saturated hydraulic conductivity in a clay loam soil. Soil Til. Res. 2017, 165, 161–168. [Google Scholar] [CrossRef]
  18. Liu, J.F.; Ma, S.; Ni, H.Y.; Pu, H.; Li, X.Z.; Chen, S.J. Quantitative two/three-dimensional spatial characterization and fluid transport prediction of macro/micropores in Gaomiaozi bentonite. J. Rock Mech. Geotech. 2022, in press. [CrossRef]
  19. Liu, J.F.; Song, S.B.; Cao, X.L.; Meng, Q.B.; Pu, H.; Wang, Y.J. Determination of full-scale pore size distribution of Gaomiaozi bentonite and its permeability prediction. J. Rock Mech. Geotech. 2020, 12, 403–413. [Google Scholar] [CrossRef]
  20. Song, S.B.; Liu, J.F.; Yang, D.S.; Ni, H.Y.; Huang, B.X.; Zhang, K.; Mao, X.B. Pore structure characterization and permeability prediction of coal samples based on SEM images. J. Nat. Gas Sci. Eng. 2019, 67, 160–171. [Google Scholar] [CrossRef]
  21. Yao, K.; Wang, W.; Li, N.; Zhang, C.; Wang, L. Investigation on strength and microstructure characteristics of nano-MgO admixed with cemented soft soil. Constr. Build. Mater. 2019, 206, 160–168. [Google Scholar] [CrossRef]
  22. Li, X.C.; Kang, Y.L.; Haghighi, M. Investigation of pore size distributions of coals with different structures by nuclear magnetic resonance (NMR) and mercury intrusion porosimetry (MIP). Measurement 2018, 116, 122–128. [Google Scholar] [CrossRef]
  23. Ando, E.; Viggiani, G.; Hall, S.; Desrues, J. Experimental micro-mechanics of granular media studies by X-ray to mography: Recent results and challenges. Geotech. Lett. 2013, 3, 142–146. [Google Scholar] [CrossRef]
  24. Saba, S.; Barnichon, J.D.; Cui, Y.J.; Tang, A.M.; Delage, P. Microstructure and anisotropic swelling behaviour of compacted bentonite/sand mixture. J. Rock Mech. Geotech. Eng. 2014, 6, 126–132. [Google Scholar] [CrossRef] [Green Version]
  25. Chen, L.F.; Kang, L.; Yang, D.S. Experimental investigation on drying and wetting of GMZ bentonite using X-Ray tomography and volumetric digital image correlation technique. Adv. Civ. Eng. 2020, 5, 1–8. [Google Scholar] [CrossRef]
  26. Gebrenegus, T.; Ghezzehei, T.A.; Tuller, M. Physicochemical controls on initiation and evolution of desiccation cracks in sand-bentonite mixtures: X-ray CT imaging and stochastic modeling. J. Contam. Hydrol. 2011, 126, 100–112. [Google Scholar] [CrossRef] [PubMed]
  27. Galkin, S.V.; Efimov, A.A.; Krivoshchekov, S.N.; Savitskiy, Y.V.; Cherepanov, S.S. X-ray tomography in petrophysical studies of core samples from oil and gas fields. Russ. Geol. Geophys. 2015, 56, 782–792. [Google Scholar] [CrossRef]
  28. Peng, D.P.; Huang, T.; He, Y.L. Application of XDMT in three-dimensional visualization of arsenic aggregates in porous media. Environ. Chem. 2012, 31, 1089–1093. [Google Scholar]
  29. Liu, X.J.; Zhu, H.L.; Liang, L.X. Digital rock physics of sand stone based on micro-CT technology. Chin. J. Geophys. 2014, 57, 1133–1140. [Google Scholar]
  30. Wang, Y.P.; Wang, Z.; Zhao, Y.; Yi, F.C.; Zhu, B.L. Swelling properties and permeability of GMZ bentonite-sand mixtures during different solutions infiltration. Sustainability 2021, 13, 1622. [Google Scholar] [CrossRef]
  31. Sarkar, G.; Siddiqua, S. Effect of fluid chemistry on the microstructure of light backfill: An X-ray CT investigation. Eng. Geol. 2016, 202, 153–162. [Google Scholar] [CrossRef]
  32. Karnland, O.; Olsson, S.; Nilsson, U.; Sellin, P. Experimentally determined swelling pressures and geochemical interactions of compacted Wyoming bentonite with highly alkaline solutions. Phys. Chem. Earth 2007, 32, 275–286. [Google Scholar] [CrossRef]
  33. Mishra, A.K.; Ohtsubo, M.; Li, L.Y.; Higashi, T.; Park, J. Effect of salt of various concentrations on liquid limit and hydraulic conductivity of different soil-bentonite mixtures. Environ. Geol. 2009, 57, 1145–1153. [Google Scholar] [CrossRef]
  34. Perret, J.; Prasher, S.O.; Kantzas, A.; Langford, C. Three-dimensional quantification of macropore networks in undisturbed soil cores. Soil Sci. Soc. Am. J. 1999, 63, 1530–1543. [Google Scholar] [CrossRef]
Figure 1. Multifunctional swelling permeability test system.
Sustainability 14 09427 g001
Figure 2. Photo of the NanoVoxel-2702 scanner.
Sustainability 14 09427 g002
Figure 3. Two-dimensional pictures of CT; (a) Dry CBM, (b) DI water-saturated sample after permeability test.
Sustainability 14 09427 g003
Figure 4. Image preprocessing for the S0, S1, S2, S3, and S4 samples. (a) Scanned images; (b) Images after threshold segmentation.
Sustainability 14 09427 g004
Figure 5. The connected pore of S4: (a) 3D Microstructure, (b) a size range 0–10 μm, (c) a size range 10–100 μm, (d) a size range 100–400 μm, (e) a size > 400 μm, (f) different size ranges.
Sustainability 14 09427 g005aSustainability 14 09427 g005b
Figure 6. The effect of various aqueous mediums on the number fractions of connected pores.
Sustainability 14 09427 g006
Figure 7. The effect of various aqueous mediums on the total porosity volume contributions.
Sustainability 14 09427 g007
Figure 8. Cumulative PSD of S0, S1, S2, S3, and S4 samples.
Sustainability 14 09427 g008
Table 1. Permeability coefficient and porosity of CBM specimens.
Specimen NoChemistry SolutionsDry Density(g/cm3)Maximum Swelling Pressure (kPa)Permeability Coefficient (m/s)Porosity (%) (CT)
S0Dry bentonite–sand1.70__11.77
S1DI water1.7016806.87 × 10−130.27
S2Simulated Beishan groundwater1.7015696.84 × 10−130.29
S3NaCl-Na2SO41.70121011.93 × 10−130.43
S4NaOH1.7076915.51 × 10−130.69
Publisher’s Note: MDPI stays neutral with regard to jurisdictional claims in published maps and institutional affiliations.