Investigating the Effect of Network Traffic Signal Timing Strategy with Dynamic Variable Guidance Lanes
Abstract
1. Introduction
2. Literature Review
2.1. Network Signal Control and Optimization Methods
2.2. Variable Guidance Lane and Its Development
2.3. Conclusions from the Literature Review
3. Methodology
3.1. General Framework
3.2. The Two-Step Approach
3.2.1. Vehicle Delay of Road Network
3.2.2. Signal Control Optimization of Road Network
- Minimum green time of coordinated phase at critical intersection
- Minimum green time of non-coordinated phases at non-critical intersection
- Effective green time of the coordinated phases at non-critical intersections
4. Numerical Case
Case Description
5. Result and Discussion
5.1. Effect of Variable Guidance Lanes
| Time Period | Total Vehicle Delay (s) | ||
|---|---|---|---|
| Before Optimization | After Optimization | Vehicle Delay Reduced | |
| 0:00–6:00 | 92.43 | 75.38 | 18.45% |
| 6:00–9:00 | 88.88 | 74.11 | 16.61% |
| 9:00–16:00 | 88.38 | 70.71 | 19.99% |
| 16:00–19:00 | 82.47 | 67.08 | 18.66% |
| 19:00–0:00 | 87.18 | 76.41 | 12.35% |
| Average | 17.14% | ||
5.2. Effect of Network Coordinated Signal Control with Variable Guidance Lane
| Intersection No. | Time Period | Phase 1 (s) | Phase 2 (s) | Phase 3 (s) | Phase 4 (s) | Cycle (s) | Off-Set (s) |
|---|---|---|---|---|---|---|---|
 |  |  |  | —— | —— | ||
| 1 | 0:00–6:00 | 19 | 25 | 22 | 27 | 93 | - |
| 6:00–9:00 | 32 | 40 | 24 | 31 | 127 | - | |
| 9:00–16:00 | 36 | 29 | 24 | 25 | 114 | - | |
| 16:00–19:00 | 22 | 34 | 27 | 28 | 111 | - | |
| 19:00–0:00 | 30 | 25 | 19 | 22 | 96 | - | |
| 2 | 0:00–6:00 | 21 | 26 | 24 | 22 | 93 | 33 |
| 6:00–9:00 | 25 | 36 | 24 | 42 | 127 | 42 | |
| 9:00–16:00 | 30 | 32 | 28 | 24 | 114 | 33 | |
| 16:00–19:00 | 26 | 34 | 28 | 23 | 111 | 43 | |
| 19:00–0:00 | 20 | 28 | 25 | 23 | 96 | 32 | |
| 3 | 0:00–6:00 | 18 | 24 | 28 | 23 | 93 | 36 |
| 6:00–9:00 | 36 | 40 | 28 | 23 | 127 | 46 | |
| 9:00–16:00 | 30 | 30 | 25 | 29 | 114 | 38 | |
| 16:00–19:00 | 23 | 27 | 29 | 32 | 111 | 48 | |
| 19:00–0:00 | 20 | 25 | 28 | 23 | 96 | 33 | |
| 4 | 0:00–6:00 | 19 | 26 | 28 | 20 | 93 | 35 |
| 6:00–9:00 | 25 | 35 | 37 | 30 | 127 | 46 | |
| 9:00–16:00 | 25 | 30 | 32 | 27 | 114 | 34 | |
| 16:00–19:00 | 23 | 33 | 27 | 28 | 111 | 45 | |
| 19:00–0:00 | 19 | 28 | 26 | 23 | 96 | 33 |
- -
- The study time length is 15 min;
- -
- The simulation interval length is 3600 s;
- -
- The free speed is 30 km/h;
- -
- Speed limit is 60 km/h;
- -
- The lost time for each phase of all intersections is 2 s;
- -
- Yellow time is 3 s.
| Time Period | Vehicle per Delay (s) | ||
|---|---|---|---|
| Before Optimization | After Optimization | Vehicle Delay Reduced | |
| 0:00–6:00 | 84.25 | 61.34 | 27.19% |
| 6:00–9:00 | 79.28 | 57.72 | 27.19% |
| 9:00–16:00 | 78.91 | 61.82 | 21.66% |
| 16:00–19:00 | 78.86 | 59.70 | 24.30% |
| 19:00–0:00 | 79.00 | 58.89 | 25.46% |
| Average | 25.06% | ||
5.3. Results for Each Intersection
| Time Period | Intersection No. | Vehicle per Delay (s) | |||||
|---|---|---|---|---|---|---|---|
| Effect of Variable Guidance Lane | Effects of Network Coordinated Signal Control | ||||||
| Before Optimization | After Optimization | Delay Reduced | Before Optimization | After Optimization | Delay Reduced | ||
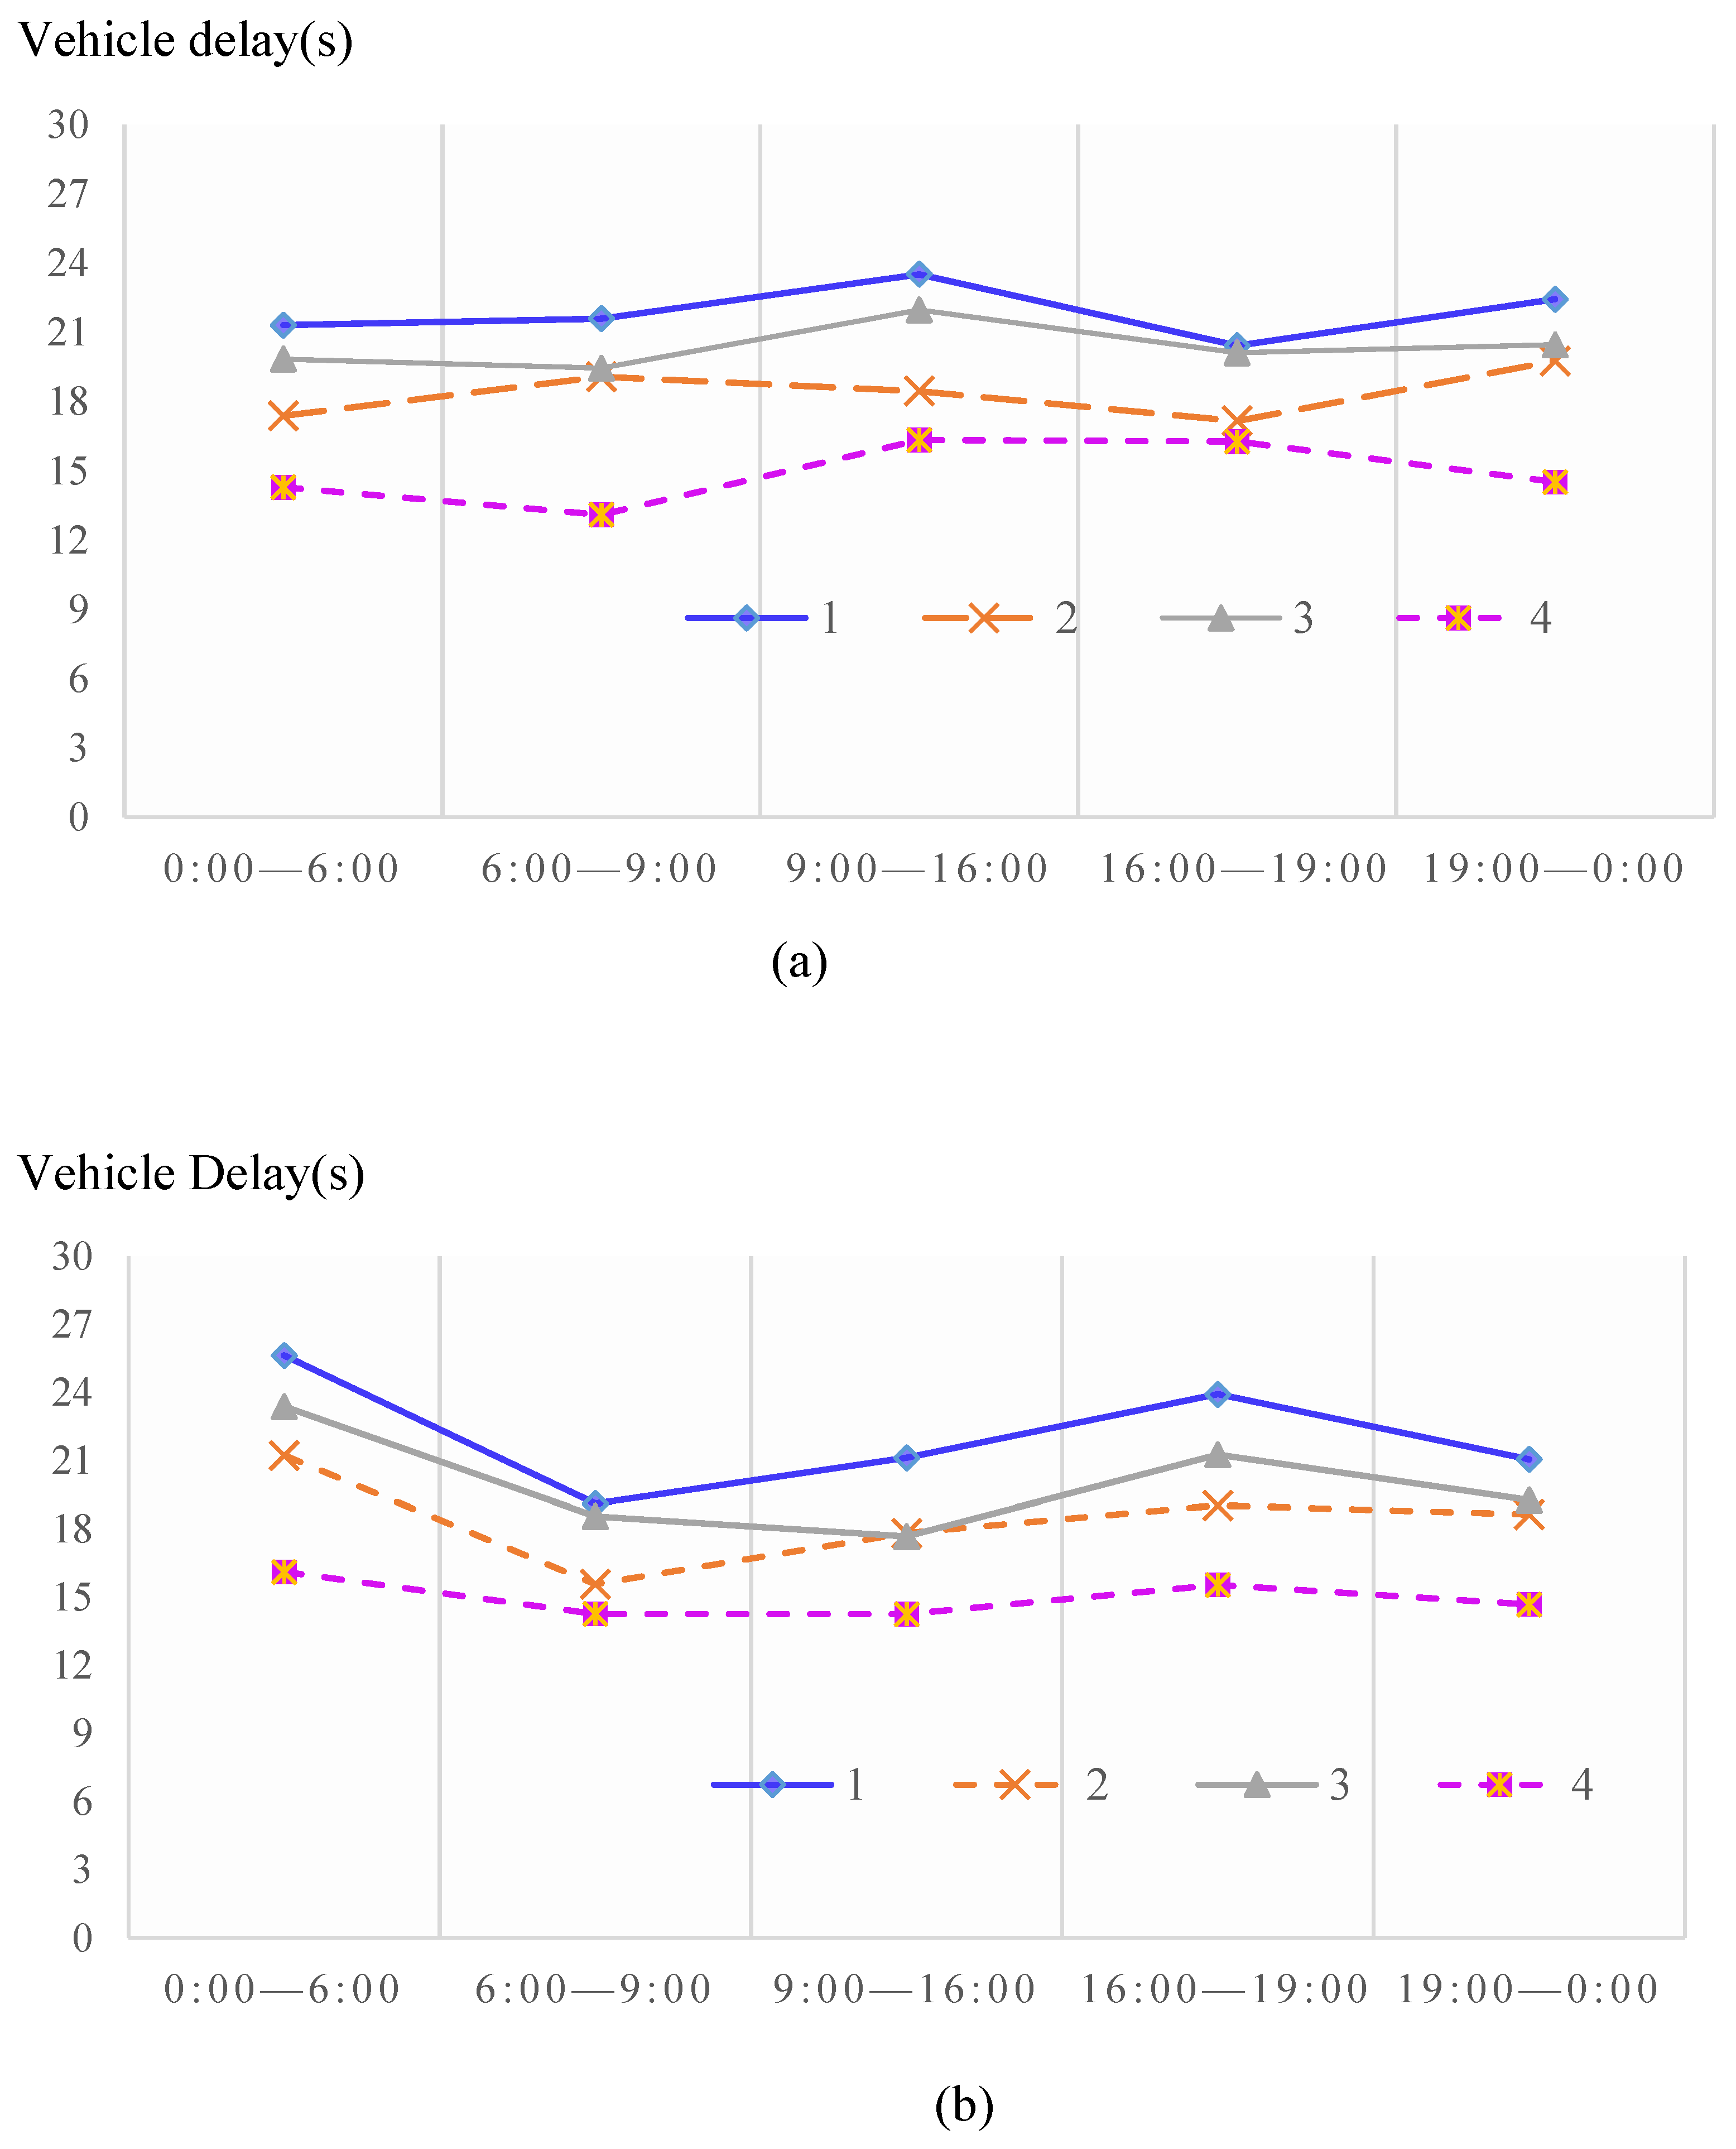
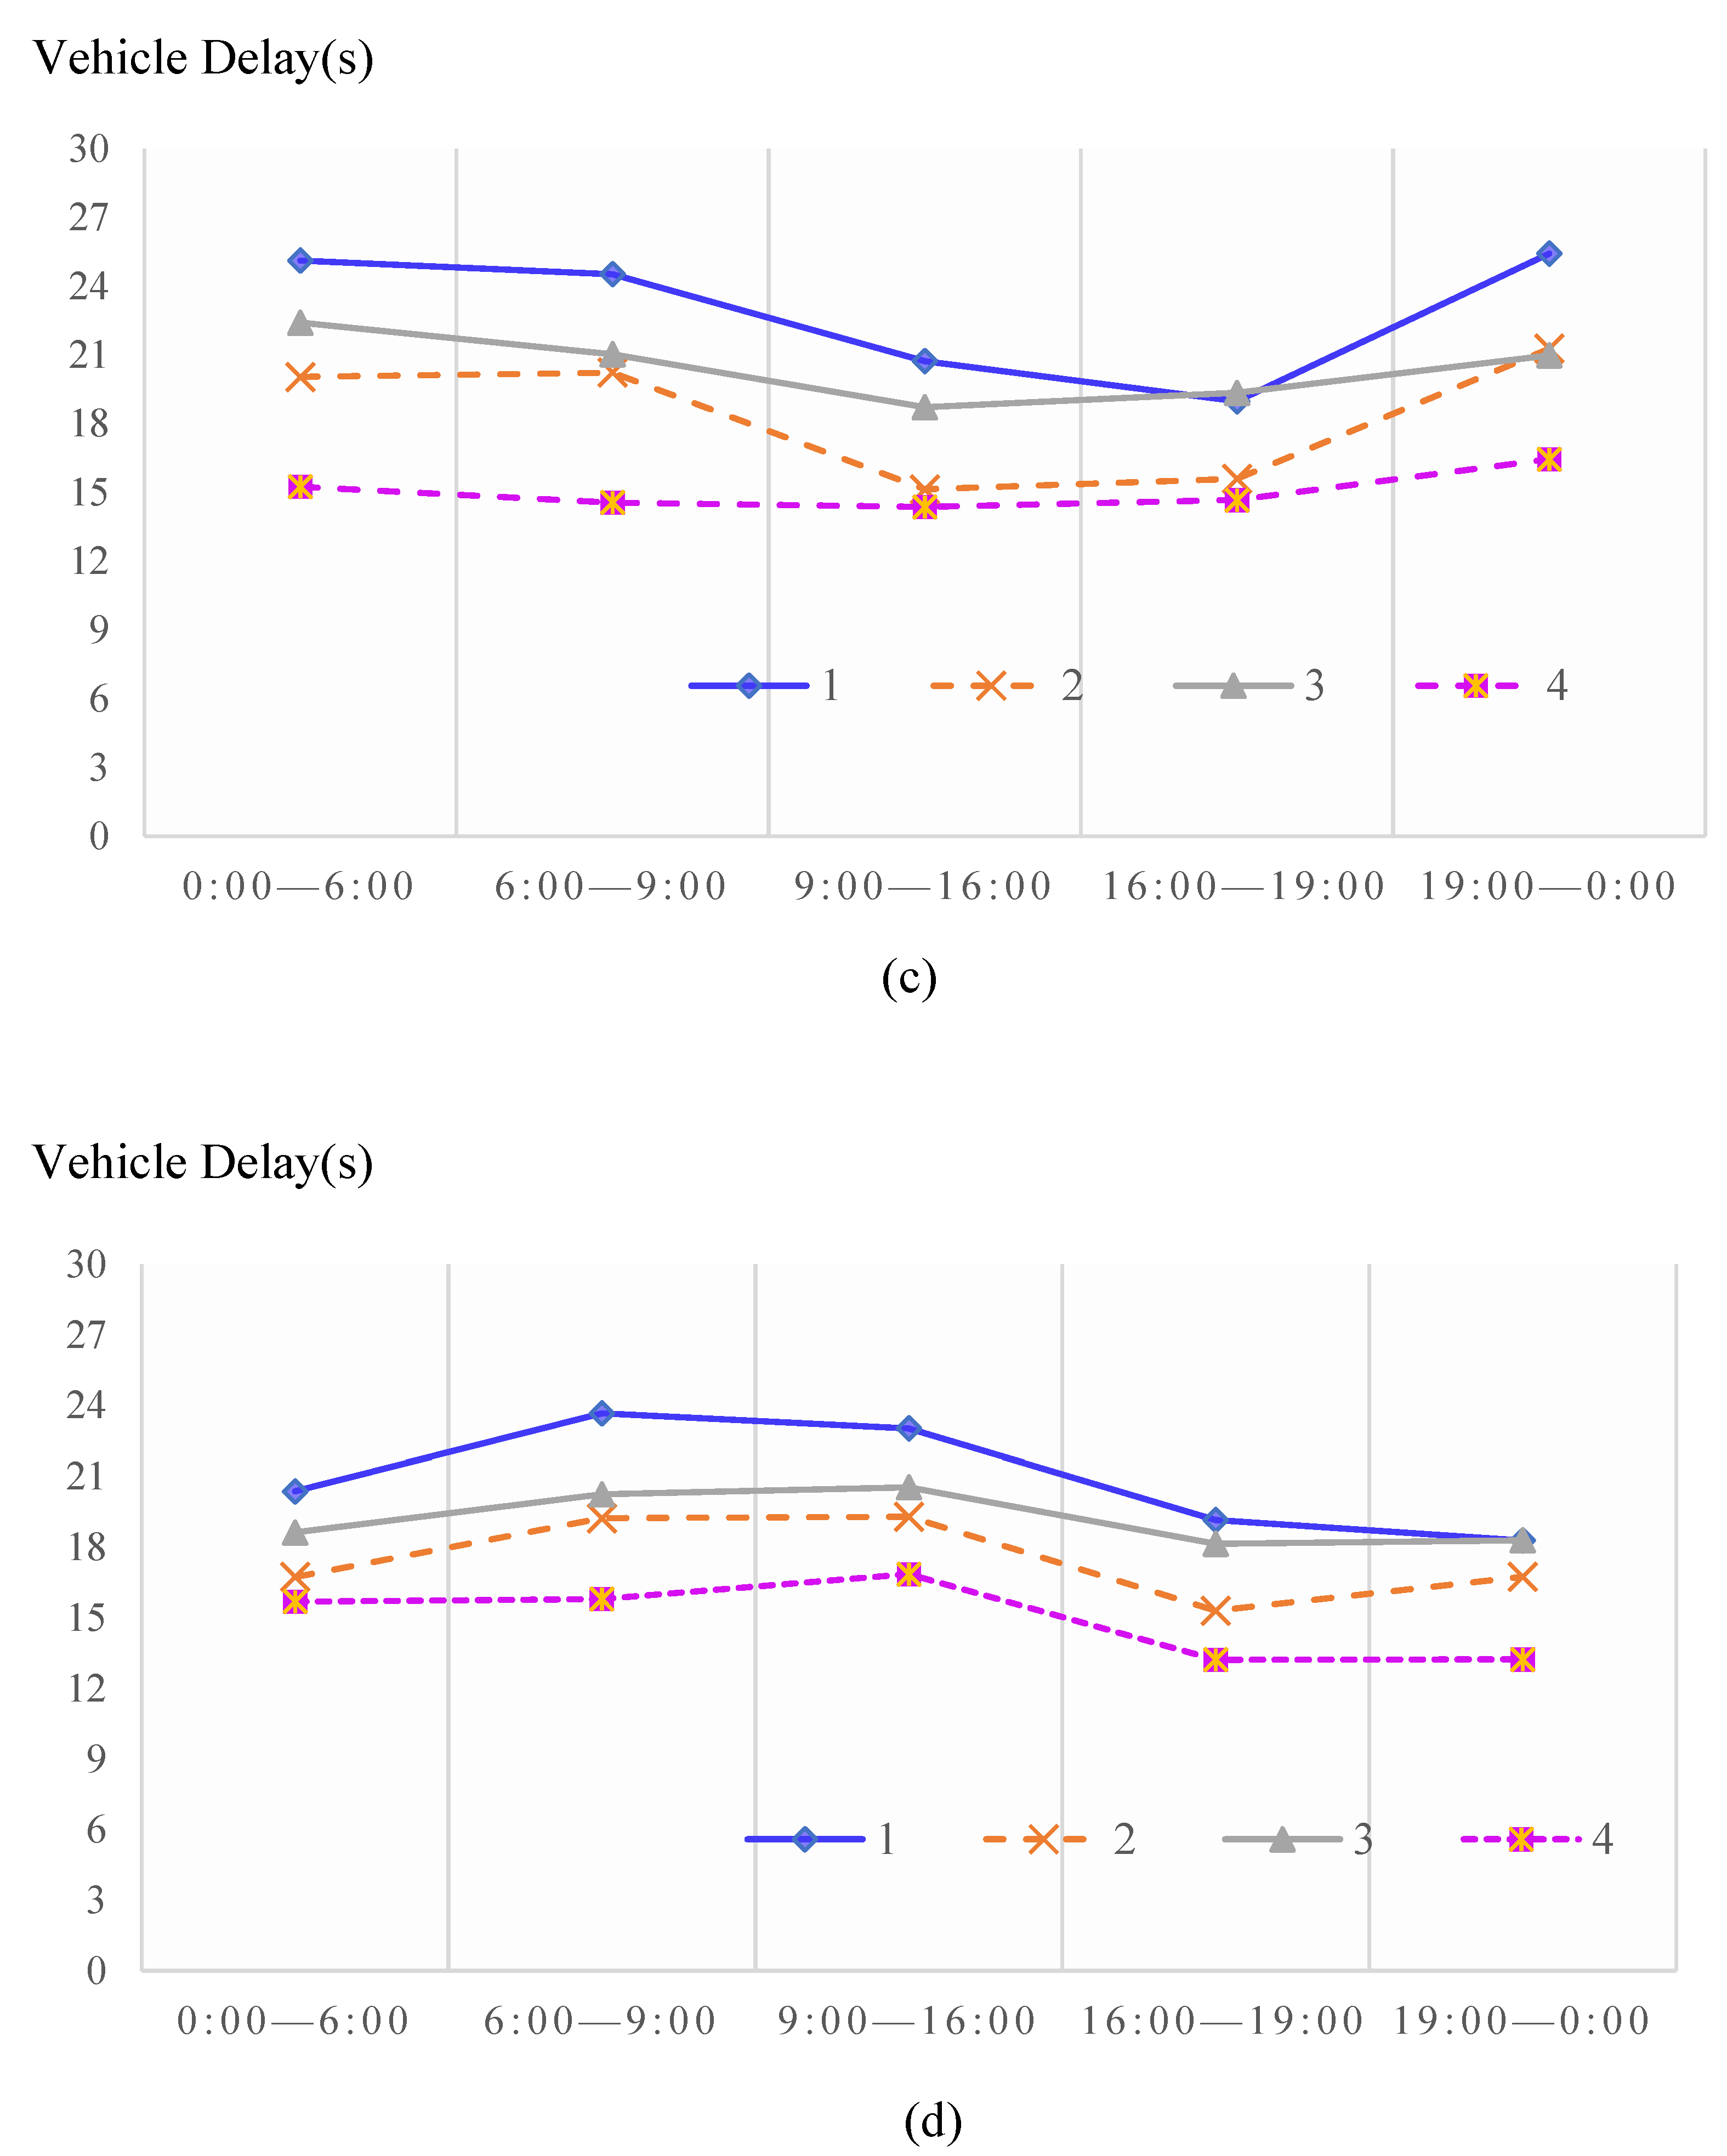
| 0:00–6:00 | 1 | 21.31 | 17.38 | 18.44% | 19.84 | 14.29 | 27.97% |
| 2 | 25.63 | 21.23 | 17.17% | 23.38 | 16.12 | 31.05% | |
| 3 | 25.12 | 20.04 | 20.22% | 22.41 | 15.25 | 31.95% | |
| 4 | 20.37 | 16.73 | 17.87% | 18.62 | 15.68 | 15.79% | |
| 6:00–9:00 | 1 | 21.59 | 19.07 | 11.67% | 19.45 | 13.1 | 32.65% |
| 2 | 19.11 | 15.58 | 18.47% | 18.56 | 14.27 | 23.11% | |
| 3 | 24.52 | 20.23 | 17.50% | 21.03 | 14.56 | 30.77% | |
| 4 | 23.66 | 19.23 | 18.72% | 20.24 | 15.79 | 21.99% | |
| 9:00–16:00 | 1 | 23.51 | 18.45 | 21.52% | 21.97 | 16.34 | 25.63% |
| 2 | 21.12 | 17.83 | 15.58% | 17.68 | 14.26 | 19.34% | |
| 3 | 20.73 | 15.14 | 26.97% | 18.72 | 14.37 | 23.24% | |
| 4 | 23.02 | 19.29 | 16.20% | 20.54 | 16.85 | 17.96% | |
| 16:00–19:00 | 1 | 20.42 | 17.16 | 15.96% | 20.11 | 16.27 | 19.09% |
| 2 | 23.92 | 19.03 | 20.44% | 21.26 | 15.55 | 26.86% | |
| 3 | 18.98 | 15.59 | 17.86% | 19.35 | 14.67 | 24.19% | |
| 4 | 19.15 | 15.3 | 20.10% | 18.14 | 13.21 | 27.18% | |
| 19:00–0:00 | 1 | 22.43 | 19.76 | 11.90% | 20.46 | 14.52 | 29.03% |
| 2 | 21.05 | 18.64 | 11.45% | 19.27 | 14.69 | 23.77% | |
| 3 | 25.42 | 21.27 | 16.33% | 20.98 | 16.45 | 21.59% | |
| 4 | 18.28 | 16.74 | 8.42% | 18.29 | 13.23 | 27.67% | |
| Average | 17.14% | 25.06% | |||||
6. Sensitive Analysis
7. Conclusions, Limitation and Future Work
Author Contributions
Funding
Data Availability Statement
Conflicts of Interest
Appendix A
References
- Shabanpour, R.; Golshani, N.; Tayarani, M.; Auld, J.; Mohammadian, A.K. Analysis of telecommuting behavior and impacts on travel demand and the environment. Transp. Res. Part D Transp. Environ. 2018, 62, 563–576. [Google Scholar] [CrossRef]
- Anas, A. The cost of congestion and the benefits of congestion pricing: A general equilibrium analysis. Transp. Res. Part B Methodol. 2020, 136, 110–137. [Google Scholar] [CrossRef]
- Van Ommeren, J.; Rietveld, P.; Nijkamp, P. Job Moving, Residential Moving, and Commuting: A Search Perspective. J. Urban Econ. 1999, 46, 230–253. [Google Scholar] [CrossRef]
- Guo, J.; Feng, T.; Timmermans, H.J.P. Modeling co-dependent choice of workplace, residence and commuting mode using an error component mixed logit model. Transportation 2020, 47, 911–933. [Google Scholar] [CrossRef]
- Essa, M.; Sayed, T. Self-learning adaptive traffic signal control for real-time safety optimization. Accid. Anal. Prev. 2020, 146, 105713. [Google Scholar] [CrossRef]
- Al Islam, S.B.; Hajbabaie, A.; Aziz, H.A. A real-time network-level traffic signal control methodology with partial connected vehicle information. Transp. Res. Part C Emerg. Technol. 2020, 121, 102830. [Google Scholar] [CrossRef]
- Hunt, P.B.; Robertson, D.I.; Bretherton, R.D.; Winton, R.I. SCOOT—A Traffic Responsive Method of Coordinating Signals; RRL Report LR 1041; Road Research Laboratory: London, UK, 1981. [Google Scholar]
- Luk, J.Y.K. Two traffic-responsive area traffic control methods: SCAT and SCOOT. Traffic Eng. Control 1984, 25, 14–22. [Google Scholar]
- Stevanovic, A.; Kergaye, C.; Martin, P.T. Field Evaluation of SCATS Traffic Control in Park City, UT. In Proceedings of the 15th World Congress on ITS, New York, NY, USA, 16–20 November 2008. [Google Scholar]
- Stevanovic, A.; Kergaye, C.; Martin, P.T. SCOOT and SCATS: A closer look into their operations, 09-1672. In Proceedings of the 88th Annual Meeting of the Transportation Research Board, Washington, DC, USA, 11–15 January 2009. [Google Scholar]
- Wongc, K.; Heydeckerb, G. Optimal allocation of turns to lanes at an isolated signal-controlled junction. Transp. Res. Part B Methodol. 2011, 45, 667–681. [Google Scholar] [CrossRef]
- Arthur, H.; Darcy, B. Implementation of a distributed control system for dynamic lane assignment. In Proceedings of the IEEE Southeastern Symposium on System Theory, Baton Rouge, LA, USA, 31 March–2 April 1996; pp. 524–528. [Google Scholar]
- Zhou, W.W.; Livolsi, P.; Miska, E. IEEE VNIS\”93-Vehicle Navigation and Information Systems Conference-Ottawa, Ont. Canada. In Proceedings of the VNIS\”93-Vehicle Navigation and Information Systems Conference—An Intelligent Traffic Responsive Contraflow Lane Controls, Ottawa, ON, Canada, 12–15 October 1993; pp. 174–181. [Google Scholar]
- Ruimin, L. Development Analysis of Urban Traffic Signal Control System. Integr. Transp. 2015, 37, 104–108, 122. [Google Scholar]
- Bretherton, R.D. Scoot Urban Traffic Control System—Control, Computers, Communications in Transportation: Selected Papers from the IFAC/IFIP/IFORS Symposium; Elsevier: Paris, France, 1989. [Google Scholar] [CrossRef]
- Robertson, D.I.; Bretherton, R.D. Optimizing networks of traffic signals in real time-the SCOOT method. IEEE Trans. Veh. Technol. 1991, 40, 11–15. [Google Scholar] [CrossRef]
- Lowrie, P.R. The Sydney coordinated adaptive traffic (SCAT) system-principles, methodology, algorithm. In Proceedings of the International Conference on Road Traffic Signaling, London, UK, 30 March–1 April 1982; pp. 67–70. Available online: http://pascal-francis.inist.fr/vibad/index.php?action=getRecordDetail&idt=PASCAL82X0330853 (accessed on 30 May 2022).
- Lowrie, P.R. Scats, Sydney coordinated adaptive traffic system: A traffic responsive method of controlling urban traffic. 1990. Available online: https://trid.trb.org/view/488852 (accessed on 30 May 2022).
- Zhang, C.; Xie, Y.; Gartner, N.H.; Stamatiadis, C.; Arsava, T. AM-Band: An Asymmetrical Multi-Band model for arterial traffic signal coordination. Transp. Res. Part C Emerg. Technol. 2015, 58, 515–531. [Google Scholar] [CrossRef]
- Zhang, L.; Song, Z.; Tang, X.; Wang, D. Signal coordination models for long arterials and grid networks. Transp. Res. Part C Emerg. Technol. 2016, 71, 215–230. [Google Scholar] [CrossRef]
- Hu, H. Optimal control of regional traffic signals based on off-set coordination mechanism. Nanjing Univ. Posts Telecommun. 2018. [Google Scholar] [CrossRef]
- de Luca, S.; Di Pace, R.; Memoli, S.; Storani, F. A hybrid traffic control framework for urban network management. In Proceedings of the 2019 IEEE International Conference on Environment and Electrical Engineering and 2019 IEEE Industrial and Commercial Power Systems Europe (EEEIC/I&CPS Europe), Genova, Italy, 11–14 June 2019. [Google Scholar]
- Wang, Y.; Tian, Z. Efficient Original-Destination Bandwidth: A Novel Model for Arterial Traffic Signal Coordination. J. Eur. Des Systèmes Autom. 2020, 53, 609–616. [Google Scholar] [CrossRef]
- Wada, K.; Usui, K.; Takigawa, T.; Kuwahara, M. An optimization modeling of coordinated traffic signal control based on the variational theory and its stochastic extension. Transp. Res. Procedia 2017, 23, 624–644. [Google Scholar] [CrossRef]
- Li, X.; Sun, J.Q. Multi-objective optimal predictive control of signals in urban traffic network. J. Intell. Transp. Syst. 2019, 23, 370–388. [Google Scholar] [CrossRef]
- Yu, H.; Meiling, L.; Ziang, Z. Coordinated control of traffic signals at single intersection based on Q-learning. Comput. Mod. 2020. [Google Scholar] [CrossRef]
- Jalili, S.; Nallaperuma, S.; Keedwell, E.; Dawn, A.; Oakes-Ash, L. Application of metaheuristics for signal optimization in transportation networks: A comprehensive survey. Swarm Evol. Comput. 2021, 63, 100865. [Google Scholar] [CrossRef]
- Li, X.; Sun, J.-Q. Signal Multiobjective Optimization for Urban Traffic Network. IEEE Trans. Intell. Transp. Syst. 2018, 19, 3529–3537. [Google Scholar] [CrossRef]
- Urbina, E.; Wolshon, B. National review of hurricane evacuation plans and policies: A comparison and contrast of state practices. Transp. Res. Part A 2003, 37, 257–275. [Google Scholar] [CrossRef]
- Nassiri, H.; Edrissi, A.; Alibabai, H. Estimation of the logit model for the online contra flow problem. Transport 2010, 25, 433–441. [Google Scholar] [CrossRef][Green Version]
- Hausknecht, M.; Au, T.S.; Stone, P. Dynamic Lane Reversal in Traffic Management. In Proceedings of the 14th International IEEE Conference on Intelligent Transportation Systems, Washington, DC, USA, 5–7 October 2011; pp. 1929–1934. [Google Scholar]
- Peng, Z.; Chen, D. Research and Realization of Guidance Decision Algorithm for Intelligent Variable Lane. J. Wuhan Univ. Technol. 2012, 34, 82–86. [Google Scholar]
- Ying, Z. Research on the coordination of dynamic lane function and signal control at intersections. J. Tongji Univ. (Nat. Sci.) 2009, 903–908. [Google Scholar] [CrossRef]
- Zhao, X.; Li, C.; Chen, S. Research on emergency vehicle traffic strategy based on variable steerable lanes. J. Wuhan Univ. Technol. Transp. Sci. Eng. 2017, 41, 6–11. [Google Scholar]
- Song, R.; Li, B. Surrounding Vehicles’ Lane Change Maneuver Prediction and Detection for Intelligent Vehicles: A Comprehensive Review. IEEE Trans. Intell. Transp. Syst. 2021, 23, 6046–6062. [Google Scholar] [CrossRef]
- Webster, F.V. Traffic Signal Settings; Road Research Laboratory: London, UK, 1958. [Google Scholar]
- Cantarella, G.E.; De Luca, S.; Di Pace, R.; Memoli, S. Network Signal Setting Design: Meta-heuristic optimization methods. Transp. Res. Part C Emerg. 2015, 55, 24–45. [Google Scholar] [CrossRef]

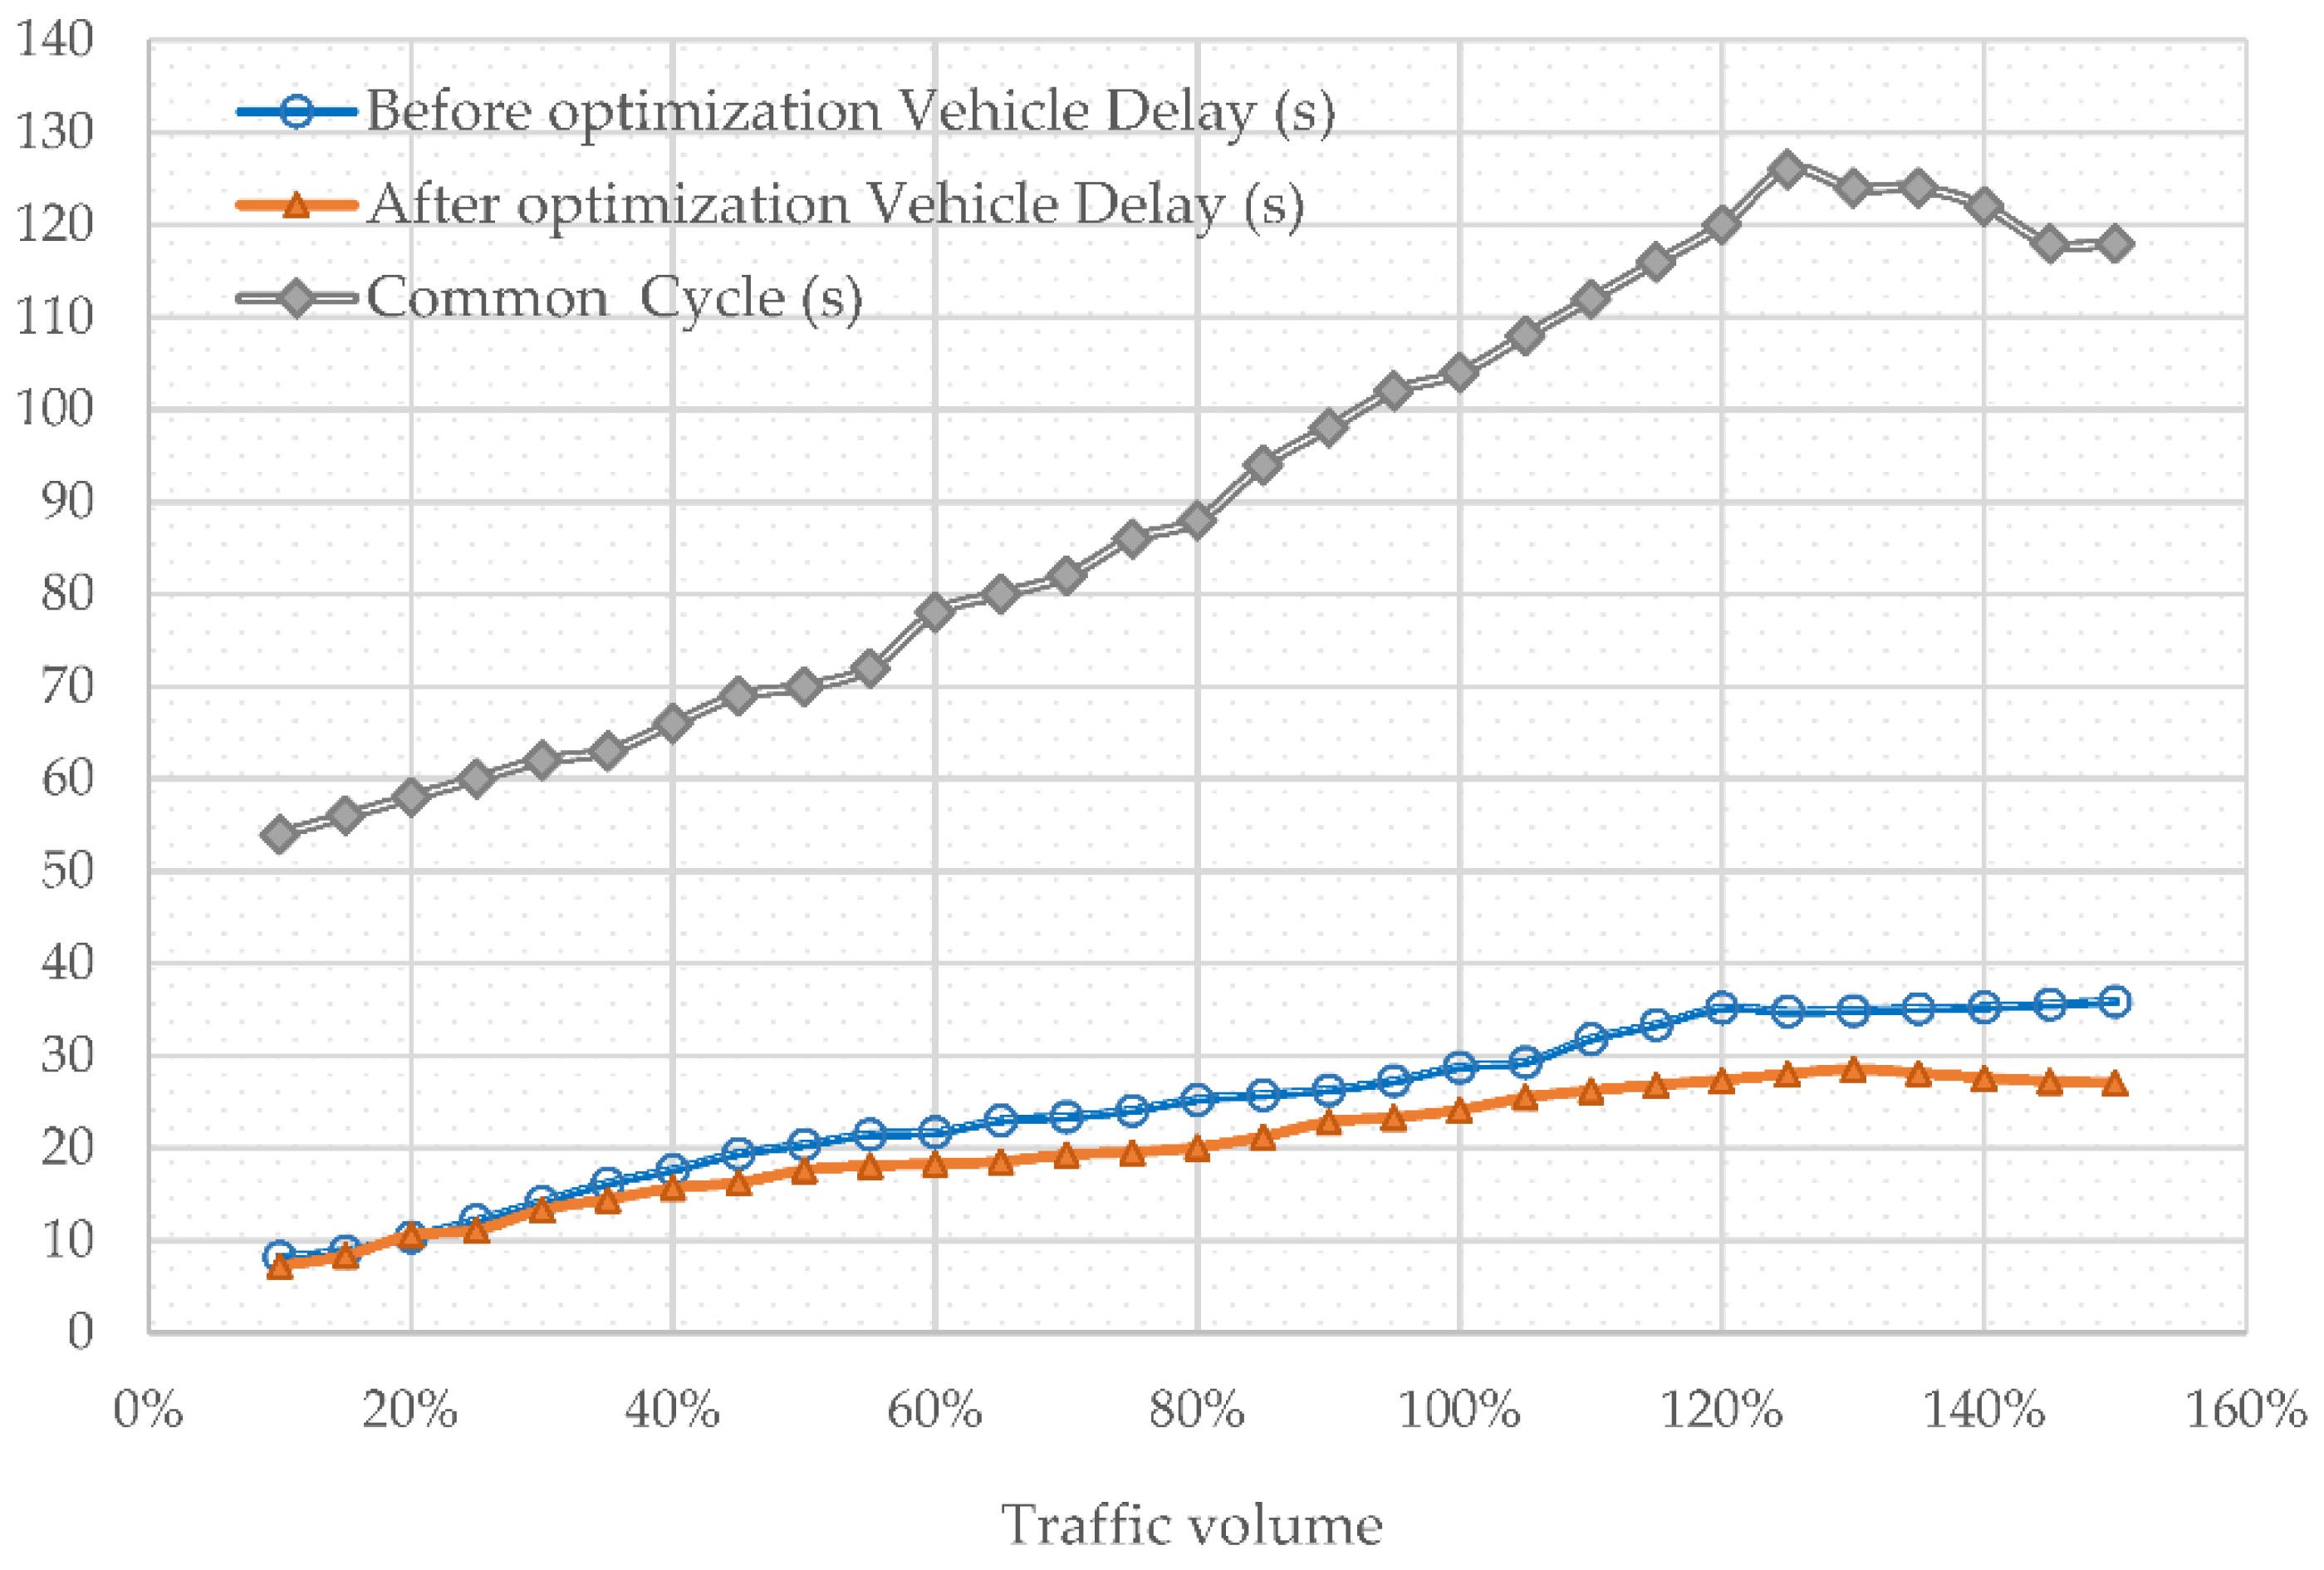
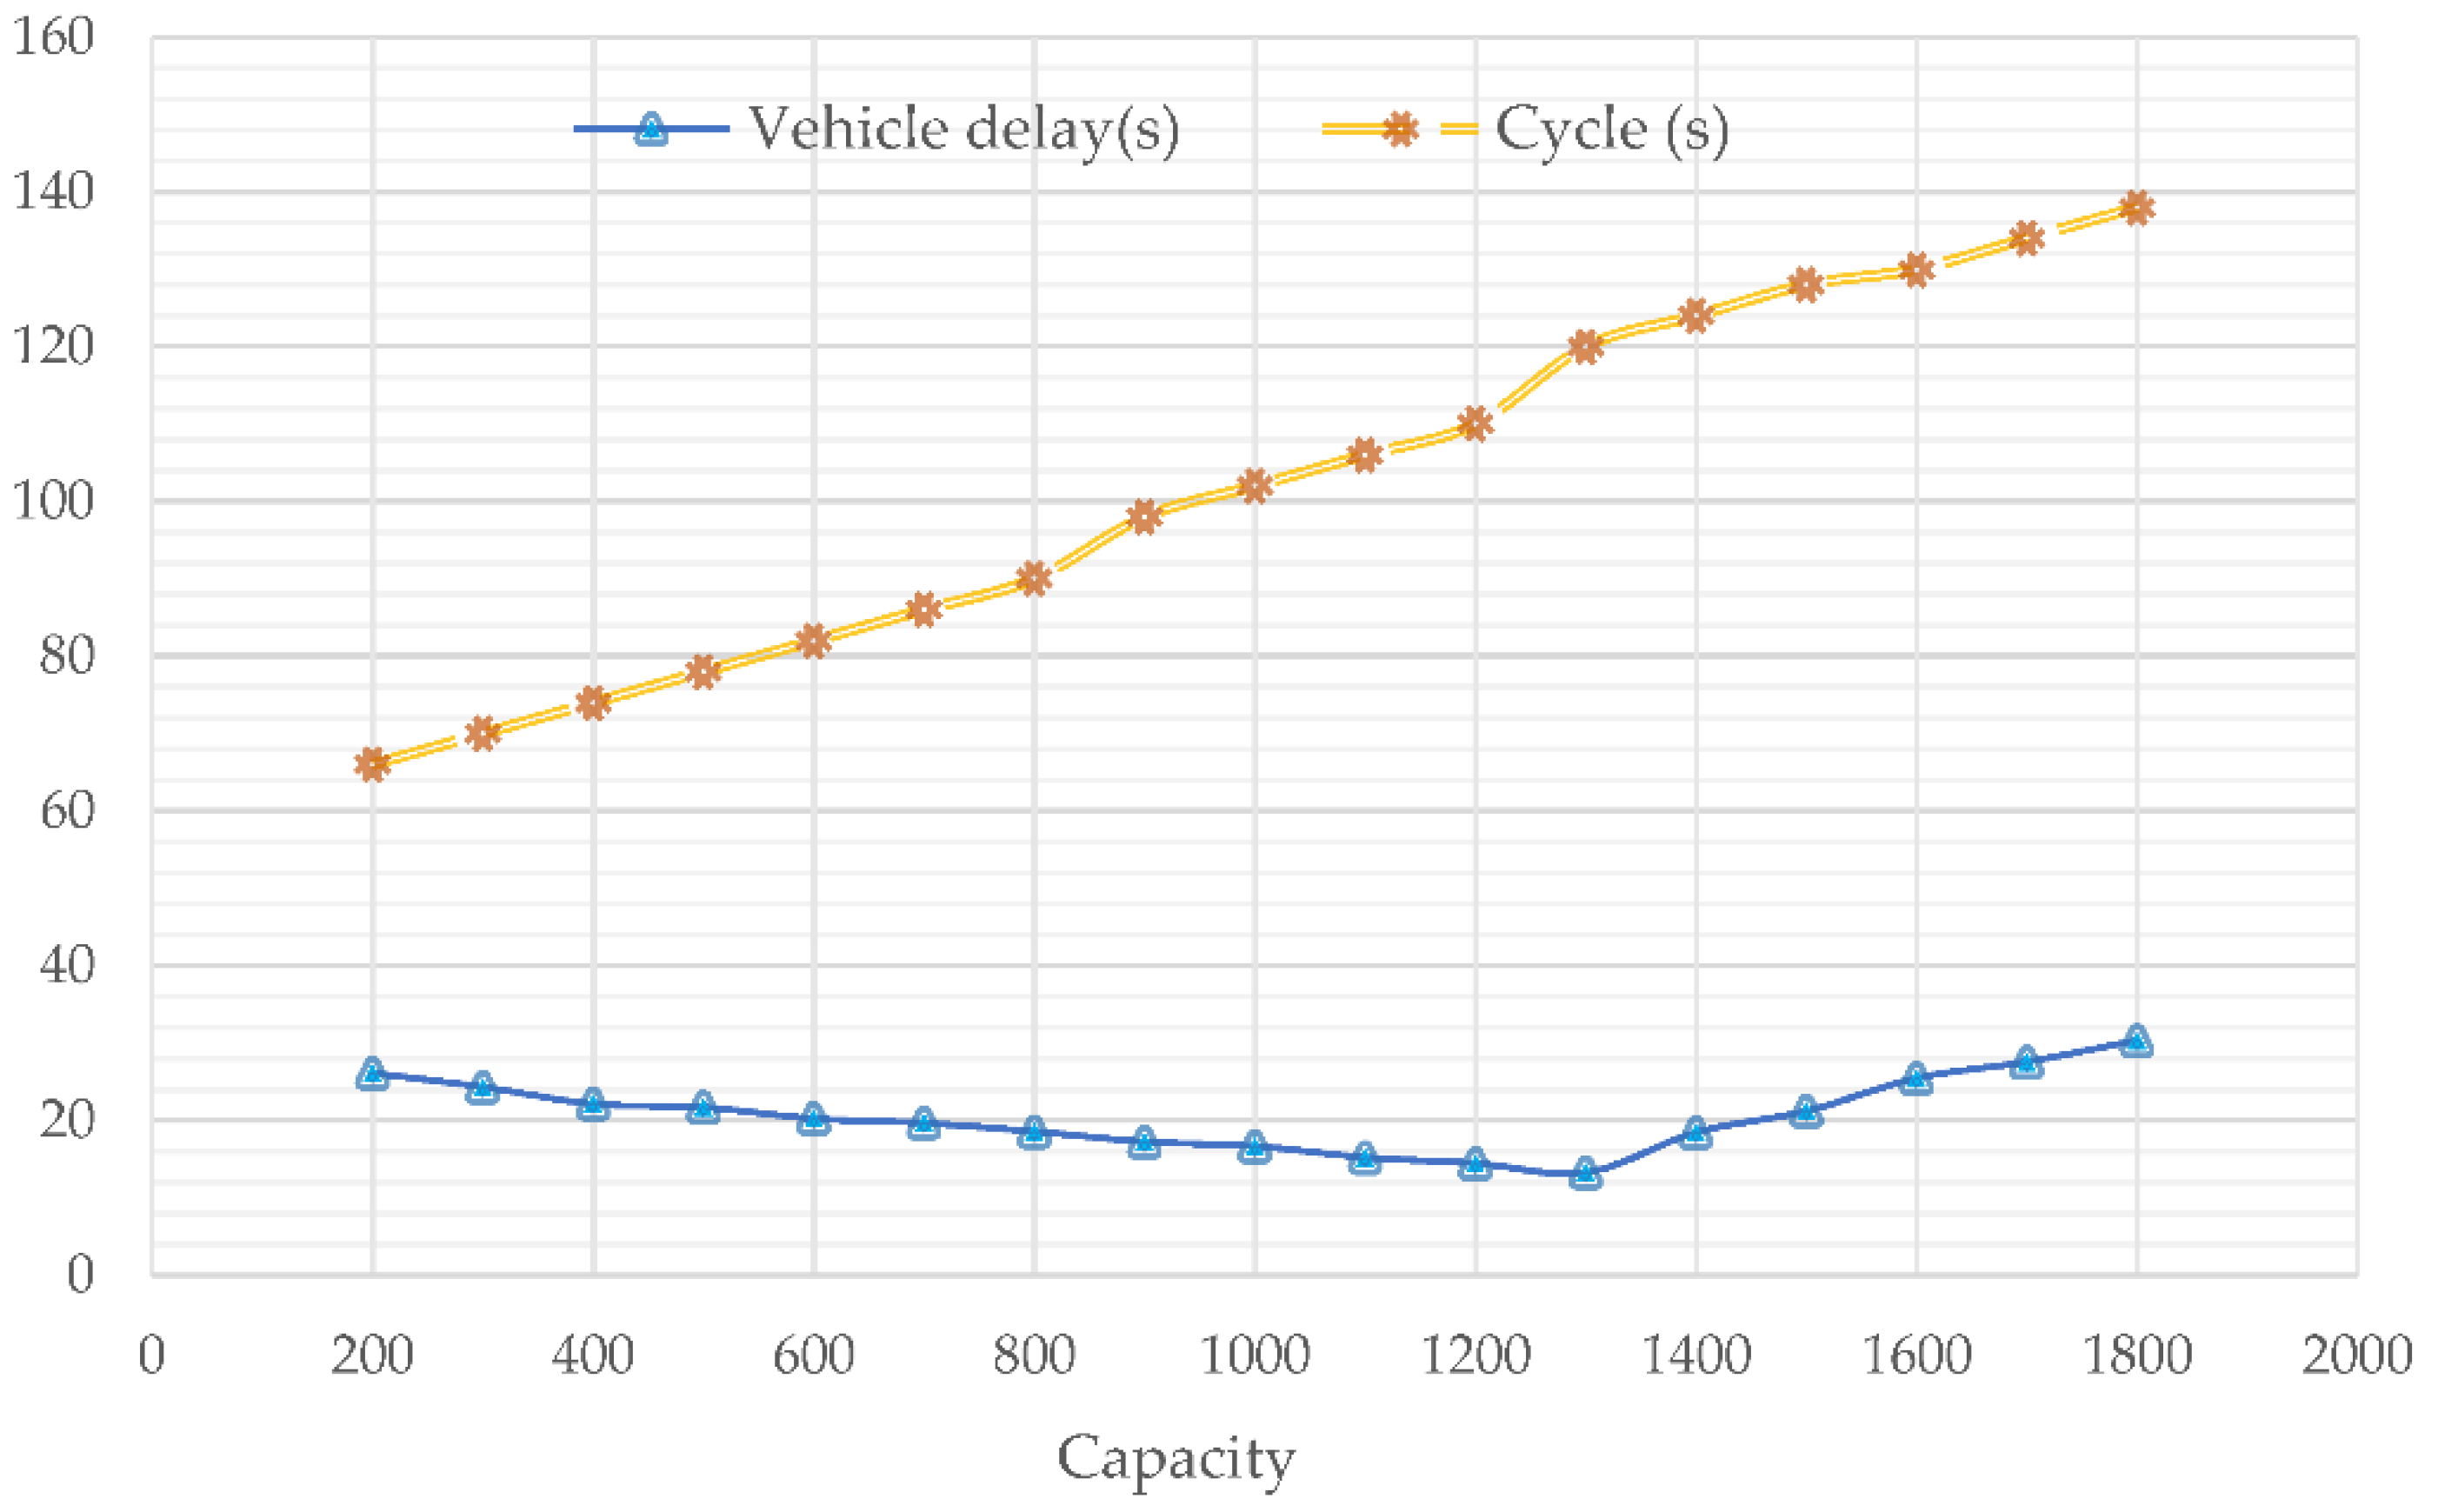
| Intersection No. | Time Periods | South (pcu/h) | North (pcu/h) | West (pcu/h) | East (pcu/h) | ||||||||
|---|---|---|---|---|---|---|---|---|---|---|---|---|---|
| LT | TH | RT | LT | TH | RT | LT | TH | RT | LT | TH | RT | ||
| 1 | 0:00–6:00 | 74 | 63 | 28 | 39 | 27 | 12 | 34 | 68 | 10 | 48 | 12 | 7 |
| 6:00–9:00 | 392 | 296 | 132 | 384 | 98 | 25 | 352 | 290 | 37 | 255 | 71 | 19 | |
| 9:00–16:00 | 572 | 218 | 79 | 645 | 171 | 29 | 455 | 364 | 85 | 417 | 121 | 54 | |
| 16:00–19:00 | 310 | 107 | 46 | 289 | 99 | 24 | 208 | 164 | 63 | 261 | 62 | 49 | |
| 19:00–0:00 | 149 | 76 | 23 | 174 | 71 | 13 | 97 | 116 | 21 | 149 | 35 | 12 | |
| 2 | 0:00–6:00 | 84 | 135 | 45 | 63 | 36 | 9 | 30 | 69 | 16 | 54 | 84 | 16 |
| 6:00–9:00 | 330 | 468 | 80 | 231 | 193 | 36 | 297 | 378 | 72 | 360 | 468 | 105 | |
| 9:00–16:00 | 492 | 540 | 95 | 531 | 356 | 84 | 495 | 582 | 124 | 594 | 693 | 89 | |
| 16:00–19:00 | 198 | 273 | 60 | 228 | 186 | 49 | 192 | 294 | 65 | 300 | 384 | 126 | |
| 19:00–0:00 | 120 | 183 | 37 | 156 | 105 | 17 | 96 | 165 | 40 | 48 | 147 | 31 | |
| 3 | 0:00–6:00 | 30 | 69 | 14 | 63 | 81 | 12 | 45 | 72 | 13 | 93 | 114 | 20 |
| 6:00–9:00 | 363 | 402 | 51 | 222 | 294 | 33 | 195 | 279 | 28 | 231 | 312 | 67 | |
| 9:00–16:00 | 540 | 522 | 102 | 483 | 513 | 105 | 288 | 384 | 63 | 408 | 510 | 138 | |
| 16:00–19:00 | 289 | 245 | 67 | 252 | 297 | 46 | 126 | 135 | 85 | 177 | 204 | 92 | |
| 19:00–0:00 | 90 | 165 | 34 | 156 | 213 | 69 | 99 | 120 | 26 | 147 | 183 | 26 | |
| 4 | 0:00–6:00 | 48 | 75 | 17 | 42 | 60 | 14 | 51 | 78 | 10 | 33 | 54 | 15 |
| 6:00–9:00 | 339 | 453 | 94 | 303 | 540 | 76 | 180 | 246 | 85 | 345 | 444 | 134 | |
| 9:00–16:00 | 438 | 504 | 125 | 486 | 609 | 111 | 318 | 405 | 70 | 360 | 507 | 91 | |
| 16:00–19:00 | 147 | 228 | 87 | 264 | 291 | 63 | 81 | 120 | 56 | 123 | 210 | 72 | |
| 19:00–0:00 | 81 | 129 | 23 | 159 | 225 | 58 | 99 | 144 | 48 | 96 | 162 | 51 | |
| Intersection No. | Time Period | Phase 1 (s) | Phase 2 (s) | Phase 3 (s) | Phase 4 (s) | Cycle (s) |
|---|---|---|---|---|---|---|
 |  |  |  | —— | ||
| 1 | 0:00–6:00 | 16 | 20 | 25 | 28 | 89 |
| 6:00–9:00 | 20 | 25 | 29 | 32 | 106 | |
| 9:00–16:00 | 24 | 27 | 26 | 25 | 102 | |
| 16:00–19:00 | 32 | 28 | 30 | 24 | 114 | |
| 19:00–0:00 | 22 | 25 | 20 | 24 | 91 | |
| 2 | 0:00–6:00 | 25 | 28 | 22 | 25 | 100 |
| 6:00–9:00 | 30 | 25 | 26 | 32 | 113 | |
| 9:00–16:00 | 25 | 28 | 24 | 26 | 103 | |
| 16:00–19:00 | 25 | 30 | 35 | 25 | 115 | |
| 19:00–0:00 | 20 | 24 | 28 | 22 | 94 | |
| 3 | 0:00–6:00 | 18 | 22 | 20 | 24 | 84 |
| 6:00–9:00 | 26 | 30 | 28 | 25 | 109 | |
| 9:00–16:00 | 24 | 28 | 25 | 20 | 97 | |
| 16:00–19:00 | 28 | 30 | 34 | 26 | 118 | |
| 19:00–0:00 | 20 | 20 | 22 | 24 | 86 | |
| 4 | 0:00–6:00 | 20 | 24 | 24 | 20 | 88 |
| 6:00–9:00 | 26 | 35 | 28 | 30 | 119 | |
| 9:00–16:00 | 25 | 28 | 32 | 24 | 109 | |
| 16:00–19:00 | 25 | 35 | 30 | 28 | 118 | |
| 19:00–0:00 | 20 | 18 | 22 | 25 | 85 |
| Intersection No. | Time Period | South | North | West | East | Cycle(s) | Delay(s) |
|---|---|---|---|---|---|---|---|
| d1 | d2 | d3 | d4 | C | D | ||
| 1 | 0:00–6:00 | 0 | 0 | 0 | 0 | 92 | 15.38 |
| 6:00–9:00 | 1 | 1 | 0 | 1 | 127 | 21.23 | |
| 9:00–16:00 | 1 | 0 | 0 | 0 | 114 | 19.04 | |
| 16:00–19:00 | 0 | 1 | 0 | 1 | 100 | 16.73 | |
| 19:00–0:00 | 0 | 0 | 0 | 0 | 96 | 16.07 | |
| 2 | 0:00–6:00 | 0 | 0 | 0 | 0 | 93 | 15.58 |
| 6:00–9:00 | 0 | 1 | 0 | 1 | 121 | 20.23 | |
| 9:00–16:00 | 0 | 1 | 0 | 0 | 105 | 17.23 | |
| 16:00–19:00 | 1 | 0 | 0 | 0 | 111 | 18.45 | |
| 19:00–0:00 | 0 | 0 | 0 | 0 | 95 | 15.83 | |
| 3 | 0:00–6:00 | 0 | 0 | 0 | 0 | 91 | 15.14 |
| 6:00–9:00 | 1 | 1 | 0 | 0 | 116 | 19.29 | |
| 9:00–16:00 | 0 | 0 | 0 | 1 | 103 | 17.16 | |
| 16:00–19:00 | 0 | 0 | 1 | 1 | 108 | 18.03 | |
| 19:00–0:00 | 0 | 0 | 0 | 0 | 88 | 14.59 | |
| 4 | 0:00–6:00 | 0 | 0 | 0 | 0 | 92 | 15.30 |
| 6:00–9:00 | 0 | 0 | 1 | 0 | 113 | 18.76 | |
| 9:00–16:00 | 0 | 0 | 0 | 0 | 100 | 16.64 | |
| 16:00–19:00 | 0 | 1 | 0 | 1 | 104 | 17.27 | |
| 19:00–0:00 | 0 | 0 | 0 | 0 | 94 | 15.74 |
Publisher’s Note: MDPI stays neutral with regard to jurisdictional claims in published maps and institutional affiliations. |
© 2022 by the authors. Licensee MDPI, Basel, Switzerland. This article is an open access article distributed under the terms and conditions of the Creative Commons Attribution (CC BY) license (https://creativecommons.org/licenses/by/4.0/).
Share and Cite
Zhao, F.; Fu, L.; Pan, X.; Kwon, T.J.; Zhong, M. Investigating the Effect of Network Traffic Signal Timing Strategy with Dynamic Variable Guidance Lanes. Sustainability 2022, 14, 9394. https://doi.org/10.3390/su14159394
Zhao F, Fu L, Pan X, Kwon TJ, Zhong M. Investigating the Effect of Network Traffic Signal Timing Strategy with Dynamic Variable Guidance Lanes. Sustainability. 2022; 14(15):9394. https://doi.org/10.3390/su14159394
Chicago/Turabian StyleZhao, Fei, Liping Fu, Xiaofeng Pan, Tae J. Kwon, and Ming Zhong. 2022. "Investigating the Effect of Network Traffic Signal Timing Strategy with Dynamic Variable Guidance Lanes" Sustainability 14, no. 15: 9394. https://doi.org/10.3390/su14159394
APA StyleZhao, F., Fu, L., Pan, X., Kwon, T. J., & Zhong, M. (2022). Investigating the Effect of Network Traffic Signal Timing Strategy with Dynamic Variable Guidance Lanes. Sustainability, 14(15), 9394. https://doi.org/10.3390/su14159394


